
Submitted:
20 March 2025
Posted:
21 March 2025
You are already at the latest version
Abstract
This paper aims to explore the impact of targeted viticultural and enological interventions on reducing the astringency of wines made solely by Mandilaria grape variety. Mandilaria is characterized by its high berry density, high tannin content, in-tense color and full body profile, all of which contribute to the distinctive enological characteristics of the wines while also pretending challenges for producers during vi-nification. This research aims to apply specific practices in the vineyard and the win-ery to reduce the astringency of the variety and adapt the wine produced to the re-quirements of the present consumers demands. In the vineyards of Paros Island, dif-ferent intensities of leaf removal and modifications to pruning load were applied. Three distinct post-harvest grape dehydration techniques and two varying levels of seed removal during alcoholic fermentation were evaluated for their effectiveness in reducing astringency. The results demonstrate that post-harvest dehydration tech-niques, particularly air and sun dehydration, significantly influence the quality indi-cators of Mandilaria wines, enhancing phenolic content, tannin levels, and antioxidant activity, while also improving phenolic ripeness and reducing the harsh tannic profile. Furthermore, seed removal effectively diminished astringency without affecting the wine’s structure. These findings suggest that the integration of these viticultural and enological techniques can significantly enhance the sensory attributes of Mandilaria wines, making them more appealing to modern consumers.
Keywords:
leaf removal
; dehydration
; phenolics
; anthocyanins
; mDp
; tannin reduction
1. Introduction
Greek viticulture and enology have a rich history, showcasing a diverse array of genetically distinct Vitis vinifera grape varieties that have shaped unique wine styles from antiquity to the present. With over 300 indigenous grape varieties, Greece has maintained a strong winemaking tradition, cultivating a genetically rich population [1,2,3]. However, the globalization of the wine market led to a significant reduction in biodiversity, as many local varieties were replaced by a few international cultivars prized for their phenolic and aromatic properties critical to vinification [4,5]. Recently, there has been renewed global and local interest in native grape varieties to preserve rare native stocks at risk of extinction and to diversify the wine market, which has become homogenized by the dominance of a few cultivars. Minor grape varieties and newly identified genotypes are increasingly valued for their potential to offer vibrant, aromatic wines and to meet consumer demand while preserving genetic diversity and cultural heritage [4,6,7,8,9].
Wine polyphenols, a diverse group of secondary metabolites primarily derived from grape berries, are essential to wine’s sensory, antioxidant and nutraceutical properties [10,11]. These compounds have a crucial role in wine quality by contributing to color, taste and oxidative stability, as well as playing a significant role in plant metabolism. Their composition is shaped by genetic factors, environmental conditions and viticultural practices. Among polyphenols, anthocyanins are responsible for the red and purple hues in wine and undergo reactions during fermentation and aging that affect long-term color stability [1,3]. Flavanols, another vital polyphenol subgroup, are particularly significant as they polymerize to form tannins, or proanthocyanidins, which are extracted from grape skins, seeds, and stems during winemaking [10,11,12]. These condensed tannins contribute to astringency by precipitating proteins, influence bitterness, and stabilize red wine color through interactions with anthocyanins. The contribution of tannins to astringency is determined by their molecular size and subunit composition, both of which are influenced by winemaking practices such as fermentation and pressing. Additionally, extended maceration can modulate their content by either stabilizing or reducing it [13,14]. Polyphenols form the foundation of wine’s sensory and structural qualities while being integral to its appealing and health-related attributes [4,11].
Astringency in wine, often described as a “tannic” sensation, is a tactile experience characterized by dryness, roughness and shrinking in the mouth, primarily caused by tannins-polymeric pigments formed from flavan-3-ol subunits like catechin and epicatechin [6,15]. These tannins interact with salivary proteins, forming complexes that reduce lubrication, leading to the distinct perception of astringency. While tannins are the primary contributors, other factors such as anthocyanins, acidity, ethanol concentration, and polysaccharides also play a role, and imbalances can lead to an overly astringent wine, described as “harsh” or “unripe” [16,17]. The perception of astringency is influenced by the wine’s tannin content, pH, polyphenolic composition and alcohol level, with extensive research linking reduced astringency to adjustments in these elements. Winemakers can manage astringency by carefully balancing tannin extraction, enhancing polysaccharide content, and optimizing production processes. Although newer methods to mitigate undesirable phenolic astringency are emerging, comprehensive evaluations of their effectiveness are still needed [18,19,20].
Several viticultural practices are essential for modifying the grapevine microclimate to enhance fruit quality and address environmental challenges, with various strategies employed during grape cultivation or winemaking to influence the phenolic composition of red wines [21,22,23]. Adjusting the canopy, through techniques like leaf removal and different pruning systems, regulates light exposure to grape clusters, affecting their microclimate and altering their chemical composition [22,24]. Building on these approaches, further adaptation strategies are necessary to address climate change impacts in warm regions [25,26]. These include exploring new winemaking processes or the use of natural products to mitigate ripening imbalances, which take advantage of high radiation and temperatures. Techniques like postharvest withering, involving the partial dehydration of grapes, induce metabolic changes that enhance their physical and chemical properties [27,28]. Thereby, over-ripening grapes through sunlight techniques naturally alters their composition and facilitates the creation of new styles of wines [29].
In the light of the above, the aim of this study was the reduction of the astringency of wines made exclusively from Mandilaria grapes, an indigenous variety cultivated on the Aegean islands, particularly under the environmental conditions of Paros Island. Mandilaria is known for its high tannic content, full-bodied profile, and dense grape clusters, which often suffer from rot and present challenges for winemakers due to their pronounced bitterness and astringency. To achieve this goal, viticultural practices, improving phenolic ripening through grape exposure to sunlight and reducing cluster density, were employed. Additionally, dehydration techniques and tannin reduction methods were used.
2. Materials and Methods
2.1. Chemicals and Reagents
Methanol, ethanol, acetonitrile, ethyl acetate, water, acetone (HPLC grade), phloroglucinol, and sodium metabisulfite were purchased from Merck (Zedelgem, Belgium). Methanol (HPLC-Ultra LC-MS grade) was also obtained from HiPerSolv CHROMANORM, (VWR Chemicals BDH, The Netherlands) to produce standard solutions. L-ascorbic acid, formic acid (99%) and hydrochloric acid (37%) for analysis were purchased from Carlo Erba (Chaussée du Vexin, France), and trifluoroacetic acid for LC-MS was obtained from Fluka (Buchs, Switzerland). Sodium hydroxide, folin-Ciocalteu phenol reagent, 2,2-diphenyl-picryl-hydrazyl radical (DPPH·), methylcellulose (MCP), and bovine serum albumin (BSA, fraction V) were obtained from Sigma Aldrich (Darmstadt, Germany). The analytical standards of delphinidin-3-O-glucoside chloride (99.5%), cyanidin-3-O-glucoside chloride (96.2%), petunidin-3-O-glucoside chloride (97.5%), peonidin-3-O glucoside chloride (96.6%), and malvidin-3-O-glucoside chloride (96.7%) were obtained from Extrasynthese (Genay Cedex, France). The anthocyanin standards were diluted separately in methanol LC-MS with 0.1%HCl. Catechin (98%), epicatechin (97%), epigallocatechin (99.5%), epicatechin gallate (98%), gallocatechin (98%), epigallocatechin gallate (95%), procyanidin B1 (90%), and procyanidin B2 (90%) were acquired from Sigma-Aldrich (Darmstadt, Germany).
2.2. Experimental Design
In Paros Island (Greece), the experiments were conducted on linear vineyards to facilitate the application of treatments. Mandilaria grapes were harvested in 2023 when the soluble solids content was 18.8 ± 1°Brix. Initially, viticultural practices were made to increase grape exposure to light, reducing cluster density and berry size through complete (T-RIF) and partial defoliation (E-RIF), carried out in late May. Additionally, the distribution of the pruning load was modified to influence the phenolic content of Mandilaria grapes. To achieve this goal, long pruning (Guyot system) was applied, retaining one cane with 10 buds (CANE).
Furthermore, three different dehydration techniques were used: sun-drying (D-SUN), dehydration in a closed room with shaded air circulation (D-AIR), which is comparable to the Amarone procedure, and pedicel crushing for extended ripening on the vine (D-VIN). The dehydration process was closely observed, measuring the sugar content and fruit weight every day.
Simultaneously, two interventions were tried consecutively during the winery phase: mechanically removing 20% (SE20) and 30% (SE30) of the seeds on the 8th day of maceration. The seeds were removed to reduce the extraction of seed-bound phenolics, which are mostly responsible for astringency.
2.3. Grape and Wine Analysis
Following the OIV standard procedures for wine analysis, samples were collected for each treatment’s grape maturity analysis [30]. In particular, the measurements of pH, total soluble solids (Brix), and total titratable acidity (TA) were performed for samples of about 50 grapes. All analyses were performed in triplicate. Another sub-sample of 50 berries was weighed, and skins and seeds were manually separated to measure the average berry mass and analyze the distribution of berry mass components. The percentage of skin and seed per berry weight ratio was assessed across the different treatments.
2.4. Chemical Analysis
The seeds and skins from 50 berries per replicate were manually separated, freeze-dried, and ground into powder. The extraction of phenolics from skins and seeds was carried out followed previously established protocols [31,32] with slight modifications. Briefly, 0.3 g of powdered material was first extracted with 2.5 mL of acetone/water (80:20, v/v) for 3 hours, followed by a second extraction using 2.5 mL of methanol/water (60:40, v/v) for 2.5 hours. The resulting supernatants were combined, and organic solvents were removed by evaporation under pressure at 30°C. Finally, the residue was dissolved in water and lyophilized, yielding a crude phenolic extract. In the case of grapes, only total anthocyanins and extractability were measured in whole berries, while all other grape analyses were conducted on freeze-dried tissue. The phenolic compounds in grapes and wines were analyzed utilizing the methods described in the following assays.
2.4.1. Color and Polyphenol Analysis
The color characteristics of wine samples were assessed following the Glories method [33] characterizing color intensity and hue, with absorbance recorded at 420, 520, and 620 nm using a UV-VIS spectrophotometer equipped with 1 mm quartz cells.
For the analysis of the total polyphenolic index (TPI), wine samples were first filtered and then diluted with distilled water at a 1:100 ratio before measuring absorbance at 280 nm. All absorbance measurements were performed on a Hitachi U-2000 spectrophotometer (Jasco, Victoria, BC, Canada).
2.4.2. Total Phenols and Antioxidant Activity
The total polyphenol concentration in grapes and wines was determined using the Folin–Ciocalteu assay, following a previously established microscale protocol with slight modifications [34,35]. Absorbance was recorded at 750 nm using a spectrophotometer, and polyphenol levels were expressed as gallic acid equivalents (GAE) in mg/L for wines and mg/g for grapes.
The antioxidant activity of wine samples and grape extracts was assessed using the DPPH radical scavenging method. The reaction was monitored at 515 nm over 30 minutes, while absorbance measurements were recorded using a UV/VIS spectrophotometer. Antioxidant capacity was expressed as Trolox equivalent antioxidant capacity (TEAC) in mmol Trolox, determined through interpolation in a Trolox standard curve.
2.4.3. Analysis of Anthocyanins
The total anthocyanin content of grape berries was assessed by spectrophotometry using the Iland method [36], while extractable anthocyanins were quantified following Glories’ method [33]. To further characterize monomeric anthocyanins in grapes and wines, high-performance liquid chromatography (HPLC) was used, following previously established methods [37,38]. Identification and quantification of individual anthocyanins were achieved by comparing retention times with those of authentic standards. Chromatographic analysis was performed using a SpectraSYSTEM HPLC system (Thermo Separation Products, Austin, TX, USA), which included a P2000 secondary solvent pump, an AS3000 autosampler with a 100-μL injection loop, and a UV6000LP diode array detector. Chromatographic separation was performed on a Nucleosil 100-5 C18, 250 4.6 mm, 5-m, reversed-phase (RP) column (Macherey–Nagel, Düren, Germany).
2.4.4. Analysis of Tannins
The tannin content in grape and wine samples was evaluated using protein precipitation assays with bovine serum albumin (BSA), following established methodology [39]. Absorbance at 510 nm was recorded using a UV/VIS spectrophotometer. Additionally, tannins were measured with an alternative method developed by Sarneckis et al. [40] estimated tannin levels by comparing a control sample with a methylcellulose-precipitated sample, with absorbance measured at 280 nm. In both methods tannin concentration was determined based on a catechin standard curve, with results expressed in mg catechin equivalents per liter.
Mean degree of polymerization (mDP), percentage of galloylation (%G) and prodelphinidin (%P) of tannins were determined using acid-catalyzed cleavage in the presence of excess phloroglucinol. No fractionation was performed to differentiate oligomeric and polymeric proanthocyanidins, and the total tannin extracts were dissolved in methanol and reacted with phloroglucinol reagent, followed by quenching with aqueous sodium acetate, according to modifications on previously described methods [31,41,42]. The reaction products were analyzed by LC/MS on a Shimadzu 2010A (Shimatzu Corporation, Tokyo, Japan) coupled to a single quadrupole mass spectrometer equipped with an electrospray ion source according to the method described by Kyraleou et al. [23]. The monomers (+)-catechin, (−)-epicatechin, (−)-epicatechin-3-O-gallate and (-)-epigallocatechin were identified by comparing their retention times with those of the pure compounds. Separation was achieved on a reversed-phase Waters XTerra RR C18 (100 x 4.6 mm, 3.5 μm) column, with elution performed under previously established conditions [23,43,44].
2.5. Vinification Protocol
Experimental winemaking was carried out using 70 kg of harvested grapes for each treatment. Grapes were crushed, destemmed, and supplemented with potassium metabisulfite (SO₂) at 50 mg/L. Pectolytic enzymes at 40 mg/L (previously hydrated in water 15 min, 38 °C) and nutrients at 30 g/tn were also added. In vineyard and seed removal experimental trials, spontaneous alcoholic fermentation was carried out, whereas in vinification of dehydrated grapes, due to the high initial density, a commercial strain of S. cerevisiae Collezione Primavera ‘56 (Laffort, Bordeaux, France) at 300 mg/L was used to ensure the complete conversion of sugars into alcohol. Fermentation was monitored through twice daily punch-downs to enhance the extraction of phenolic compounds, with the frequency reduced as the days passed. On the end of maceration, the juice was separated from the pomace and allowed to complete fermentation over the following six days, during which all fermentations were finalized. Wines were racked, supplemented with 40 mg/L SO₂, and bottled after filtration or stabilization. No malolactic fermentation was performed. After the completion of alcoholic fermentation, the wines were stored at 18 ± 2 °C in the dark until the analysis.
2.6. Sensory Analysis
Fifteen healthy participants from the Laboratory of Oenology of the Agricultural University of Athens took part in this study. All participants were skilled wine assessors who had undergone prior training in evaluating astringency. The experiment was conducted over three weeks, comprising six sessions (three replications). The assessments took place between 11:00 AM and 1:00 PM in individual booths.
A balanced block design was implemented to counteract the progressive accumulation of astringency perception and to equalize the impact of presentation order. The panelists were given 10 mL samples at room temperature and instructed to assess astringency intensity on a scale from 0 to 7. To prevent any lingering effects from previous samples, a five-minute break was observed between tastings, during which panelists rinsed their mouths with water. This ensured the restoration of normal oral lubrication and minimized any carryover effects.
2.7. Statistical Analysis
Statistical analysis was conducted to evaluate differences at a 95% confidence level (p < 0.05). The analysis included one-way ANOVA performed using Microsoft Excel (Microsoft, WA, USA) with the Data Analysis tool, followed by Tukey’s HSD test for mean comparison when significant differences were observed. All analyses were conducted in triplicate to ensure reliability.
3. Results and Discussion
3.1. Berry Features
3.1.1. Vineyard Treatments
Berry size is an important factor influencing yield and grape quality, particularly in Mandilaria, a variety known for its dense clusters and high tannin content. The impacts of both vineyard interventions on grape morphology measurements are notable. Specifically, a significant increase in bunch length was observed in the case of the long pruning (CANE) (21.3 cm) and total defoliation (T-RIF) (19.1 cm), while width changed only with total defoliation (12.7 cm). Additionally, the long pruning greatly increased the peduncle length (3.1 cm), which is a well-known issue for the Mandilaria variety, while it also negatively affected berry size (Table 1). Concerning the distribution of weights after the cultivation interventions, an increase in skin weight was observed in all cases, while the percentage of seeds increased only in the case of long pruning (5.9%).
The results of the classical chemical analysis of grapes from the two cultivation practices—long pruning and defoliation—were compared to those obtained for the control (short pruning without defoliation) sample. Data showed that long pruning had no impact on sugar levels but led to an increase in acidity (6.4 g tartaric acid/L). In contrast, both defoliation methods (eastern and total) raised sugar levels (19.0 and 19.4, respectively) while reducing acidity (3.5 and 4.0, respectively). No significant difference was observed between eastern defoliation (E-RIF) and total defoliation (T-RIF). These findings are summarized in Table 2.
3.1.2. Dehydration treatments
Variations in the physical and chemical properties of berries subjected to different dehydration methods demonstrate differences in moisture removal time. Grapes dried under direct sunlight (D-SUN) reached the highest sugar concentration (27.6 °Brix) and had an elevated pH (3.71). In contrast, shade and air dehydration (D-AIR) resulted in a moderate increase in sugar (23.5 °Brix), a lower pH (3.25), and the highest observed titratable acidity (7.8 g tartaric acid/L). Grapes left to ripen further on the vine (D-VIN) exhibited intermediate values for both °Brix and acidity (Table 3).
Different dehydration techniques were applied to modulate grape density and enhance quality characteristics. All methods led to a significant reduction in berry weight, even though the distribution of grape components (skins, seeds, and flesh) varied across treatments. Sun-dried grapes (D-SUN) showed a notable increase in skin weight, whereas the proportion of seeds remained relatively stable across all methods. The skin-to-flesh ratio plays a key role in defining wine quality and sensory attributes, as skins are rich in phenolic and volatile compounds, which are extracted during vinification [4]. Among the dehydration techniques, D-SUN grapes exhibited the highest skin-to-flesh ratio (0.270), while D-VIN (0.081) and D-AIR (0.129) resulted in lower ratios.
The dehydration time varied depending on the method used, influencing the final berry characteristics. Weight and sugar content were recorded at two-day intervals to monitor the dehydration process. With a higher determination coefficient (R² = 0.9404) for the D-SUN method, the weight loss and Brix curves exhibited a linear decline in relation to dehydration time (Figure 1a). Meanwhile, the D-VIN approach demonstrated the most consistent linear decrease in weight loss (Figure 1b), showing a strong correlation (R² = 0.924).
3.2. Phenolic Composition in Grapes and Wines
3.2.1. Total Phenolics and Antioxidant Activity
Table 4 illustrates the effects of several vineyard and winery practices on the phenolic index (TPI), total phenolics (TP), and antioxidant activity (TEAC) in grape skins, seeds, and wine. Significant patterns and variations among treatments are revealed by the data.
The findings indicate that vineyard and winery practices have a greater influence on the phenolic content and antioxidant activity (TEAC) of the final wines than on the grapes (skins and seeds) from which they were produced. While vineyard treatments (pruning and defoliation) and dehydration methods led to changes in the phenolic profiles of grape components, these alterations were relatively minor compared to the significant transformations observed in the wine.
The control sample (CTRL-V) exhibited the highest total phenolics and antioxidant activity values in grape skins, indicating that viticultural interventions do not directly influence these compounds. TEAC and TP levels were higher in the T-RIF and CANE samples compared to E-RIF, implying that more intensive canopy management may have a modest yet positive effect on phenolic retention in skins. However, these variations in vineyard treatments were less pronounced than those observed in dehydration methods, where significant reductions in antioxidant activity and total phenolics were recorded—particularly in the D-SUN treatment (1.62 mM and 282.27 mg GAE/L, respectively).
Values of antioxidant activity in grape seeds showed minimal variation across vineyard treatments, suggesting that seeds are less affected by defoliation or pruning. Unlike grape skins, seeds subjected to dehydration techniques maintained relatively stable antioxidant activity, indicating their ability to preserve phenolic content during post-harvest processing. These findings emphasize the protective nature of seeds, which may act as reservoirs of phenolic comounds under processing and stress conditions. The influence of vineyard treatments on wine samples became increasingly evident throughout the winemaking process. Defoliation effectively enhanced phenolic extraction, as wines made from grapes undergoing this treatment displayed higher antioxidant activity and phenolic content than those from the long pruning treatment. However, the impact of dehydration techniques was even more pronounced. Wines produced from dehydrated grapes, particularly those subjected to D-SUN and D-AIR treatments, displayed the highest levels of antioxidant activity and total phenols which are key factors contributing to the wine’s body and aging potential. This suggests that, beyond concentrating phenolic compounds, dehydration techniques also enhance their extraction during maceration. Conversely, seed removal treatments (SE20 and SE30) led to a decline in phenolic content and antioxidant activity, demonstrating the essential role of seeds in determining the wine’s overall phenolic profile.
3.2.2. Color Parameters
Vineyard and winery treatments significantly influenced the intensity (E) and hue (A) values of the resulting wines compared to their respective controls (Figure 2). Among the vineyard interventions, T-RIF resulted in wines with the most vibrant and intense red color, with the highest intensity (2.07 AU) and the lowest hue (0.50) values. Partial defoliation followed closely, yielding wines with color intensity of 1.95 (AU) and a similarly low hue (0.53), suggesting that both defoliation techniques enhance pigment concentration in grape skins. Additionally, long pruning resulted in slightly higher intensity (1.79 AU) and similar hue (0.53) values compared to the vineyard control (1.63 AU intensity, 0.54 hue). These findings indicate that defoliation, particularly when applied fully, enhances wine color intensity and vibrancy by promoting the synthesis of anthocyanins and other pigments.
No significant differences were observed in color parameters of the wines produced by the seed removal treatments and the control sample. This reflects the reduced contribution of phenolic compounds from seed removal, leading to lighter and less intense wines. In contrast, dehydration treatments had a pronounced effect. D-VIN and D-SUN significantly enhanced color intensity compared to control sample (1.85 and 1.79 AU respectively), with D-VIN maintaining a moderate hue (0.61), indicative of a more attractive red color. Meanwhile, samples derived from D-SUN treatment exhibited the highest hue (0.84) value, suggesting a shift towards browner tones due to oxidative changes during sun-drying. D-AIR samples on the other hand, displayed moderate color intensity (1.42 AU) and hue (0.69) values, indicating a more balanced color development.
3.2.3. Anthocyanins in Grapes and Wines
- Vineyard interventions
Grapes subjected to long pruning exhibited the highest extractability value (53.04%), suggesting that this vineyard treatment enhances the release of anthocyanins from grape skins. In contrast, leaf removal treatments showed significantly lower extractability, values indicating a negative impact on anthocyanin release (Table 5). Regarding total anthocyanin content per berry, total leaf removal resulted in the highest content (1.47 mg/berry), suggesting that this practice may contribute to wines with a more intense color.
The liquid chromatography analysis of total anthocyanin content in grape skins further confirms that total defoliation yields the most favorable results. This is followed by long pruning (26.57 mg/g fresh weight of skins) follows, which contrasts with the spectrophotometric data, that clearly show the benefits of the two defoliation techniques. Similarly, the anthocyanin content of wines follows this trend with T-RIF exhibiting the highest contents, (375.39 mg/L), followed by E-RIF wines, (341.55 mg/L). These findings indicate that defoliation treatments enhance the anthocyanin content of wines, potentially contributing to higher phenolic content and a more intense coloration.
As shown in Figure 3a, the anthocyanin composition in grapes changed following vineyard treatments. Defoliation resulted in higher concentrations of Pet and Dlp, while Mlv, the most stable anthocyanin [3,45], was the most abudant in the grapes of the long pruned vines. Additionally, Peo emerged as the most prevalent anthocyanin in T-RIF grape skins, alongwith Mlv coum, suggesting that vineyard treatments significantly influence anthocyanin profile. Similar trends were observed in the corersponding experimental wines (Figure 4a), where Mlv remained the dominant anthocyanin, particularly in long-pruned vines. Meanwhile, wines produced from grapes subjected to defoliation treatments retained higher contents of Dlp and Pet, consistent with the grape composition. Another significant finding regarding defoliation treatments was the higher amounts of Mlv acet found in wines in comparison with the control.
- Winery interventions
Anthocyanin extractability was significantly low across all drying treatments, with sun dehydration exhibiting the most pronounced reduction. This finding supports previous research indicating that dehydration techniques significantly decrease anthocyanin extractability [28]. Moreover, dehydration considerably affected the overall anthocyanin concentration in grapes, with D-SUN grapes showing the lowest levels (0.61 mg/berry), followed by D-AIR with a slightly higher concentration (0.69 mg/berry).
Similarly, HPLC analysis revealed that sun-dehydrated grapes had a considerably low anthocyanin concentration (3.10 mg/g fresh weight of skins), while D-AIR and D-VIN exhibited slightly higher contents (10.60 mg/g and 9.70 mg/g, respectively).Regarding wines, D-VIN treatment resultsed in the highest anthocyanin content (101.80 mg/L), while D-AIR showed considerably lower levels (41.24 mg/L). The most pronounced reduction was observed in wines produced by D-SUN grapes, where anthocyanin concentration was nearly negligible (2.07 mg/L), suggesting that this drying process severely degraded anthocyanins. These findings align with existing literature, as increased light exposure and elevated temperatures intensify grape skin rupture, leading to enhanced oxidative anthocyanin degradation [46,47].
HPLC analysis of individual anthocyanins in dehydrated grapes (Figure 3b) revealed no significant differences between the air dehydration and vine over-ripening treatments. Mlv remained largely stable, particularly in D-AIR and D-VIN grapes, while Peo exhibited a significant reduction in grapes subjected to both dehydration methods. Mlv coum contributed substantially across all dehydration treatments. The impact of dehydration treatments was more pronounced in wines (Figure 4b). Dlp and Pet were completely absent in D-SUN and D-AIR wines, while in D-VIN they were present in low amounts. Across all treatments, Mlv was the predominant anthocyanin, with D-SUN intervention resulting in the highest concentration. Another noteworthy finding was the absence of the acetyl ester of malvidin in sun-dried grapes while its coumaroylated ester was significantly more abundant in the corresponding wines. Furthermore, consistent with previous research [48], no significant alterations in the anthocyanin profile were observed in wines where seeds were removed during the winemaking process. The SE20 wine showed a slight but non-significant decrease in total anthocyanin content. Overall, polyphenol extraction from seeds and skins occurred idependently under the same maceration conditions, and removing seeds did not affect anthocyanin extraction from the skins.
3.2.4. Total Tannins in Grapes and Wines
The findings from both viticultural and winemaking practices clearly demonstrate their significant influence on the tannin content and, consequently, the astringency of the final wines. Tannin content in grapes and wines as measured by the MCP and BSA methods, directly correlates with perceived astringency. As shown in Table 6, practices such as defoliation and long pruning result in moderate tannin contents in grape skins and seeds. These canopy management techniques enhance light exposure and air circulation, promoting maturation of phenolic compounds.
In contrast, winery management strategies involving overripening tend to reduce skin tannin contributions while enhancing the extraction of seed tannins during winemaking. Treatments such as off-vine dehydration (specifically D-AIR and D-SUN) resulted in the highest tannin concentrations. Notably, D-AIR consistently exhibited the highest tannin levels across both assays, suggesting that air dehydration significantly enhances tannin extraction. Interestingly, although the D-VIN treatment resulted in lower overall tannin content, the wines were still perceived as highly astringent. This is likely due to a relatively higher proportion of seed tannins [49], which are known to contribute more intense astringency compared to skin tannins [10].
Additionally, seed removal during maceration was found to reduce overall tannin concentrations, resulting in wines with lower astringency, as expected. However, this reduction is not consistently observed across all studies [46], highlighting the complex interactions between vineyard practices and winemaking techniques in determining the final tannin structure.
Sensory evaluation further classifies the intensity of astringency as high (> 4.5) in the dehydrated treatments, low (< 2.5) in the seed removal treatments, and intermediate in vineyard treatments. Figure 5 illustrates the correlation between astringency and tannin content measured by MCP and BSA methods. The data obtained from the BSA (R² = 0.750) and MCP (R² = 0.740) methods demonstrated a strong correlation with astringency.
The data presented in Figure 6 highlight the effects of various viticultural and enological practices on grape and wine characteristics, with a focus on the structural properties of proanthocyanidins. Among the vineyard treatments, no significant changes were observed regarding the mean degree of polymerization (mDp) of tannins, as well as in the percentages of prodelphinidins (%P) and the percentage of gallic esters (%G). Dehydration treatments, particularly D-SUN, significantly decreased mDp values, suggesting that overripening methods may induce polymer degradation or structural rearrangement of polyphenolic compounds. Dehydrated grapes also exhibited higher prodelphinidin content, though the control treatment consistently showed the highest levels. The results of this study suggest that seed removal during fermentation leads to tannins with a higher mDp, as the remaining tannins, predominantly derived from the skins, exhibit a higher degree of polymerization. Conversely, the mDp values observed in dehydrated treatments were lower than in the control, indicating potential tannin breakdown or inhibition of polymerization during dehydration. Furthermore, partial seed removal did not significantly alter the overall proportion of galloylated tannins despite their higher abundance in grape seeds. However, dehydration appeared to slightly increase galloylation levels, likely due to compound concentration effects during the dehydration process. Similarly, seed removal treatments maintained relatively stable %P levels, as prodelphinidins are primarily associated with skin tannins. In contrast, dehydrated treatments exhibited a slight decline in prodelphinidin levels, likely due to oxidation, enhanced polymerization, cellular breakdown, and enzymatic degradation [50,51].
Overall, these observations highlight the significant impact of both viticultural and winemaking practices on the tannin content and profile of grapes and, consequently, on the sensory character of the final wine. By optimizing these practices, wine makers can effectively modulate the chemical composition and the sensory attributes of grapes and wines to achieve desired quality and organoleptic characteristics.
4. Conclusions
Implementing various post-harvest dehydration methods is very important in enhancing the phenolic and antioxidant properties of Mandilaria grapes during vinification, thereby producing wines with superior quality characteristics. Recognizing the critical association between viticultural practices and the organoleptic qualities of wines is essential when evaluating the impact of these practices on the final wine quality.
However, understanding the importance of the association between viticultural practices and the organoleptic quality of wines, demonstrates the significance of considering the overall production process when evaluating the impact of viticultural and winemaking practices on the final quality of the wines produced.
In conclusion, while variations in pruning load and defoliation intensity exerted minimal effects on the phenolic content and antioxidant properties of the grapes and resultant wines, the implementation of diverse post-harvest grape dehydration techniques resulted in significant enhancements in phenolic extraction and antioxidant activity. This observation indicates the significant role of these dehydration methods in elevating wine quality. Moreover, the interaction between vineyard practices and enological techniques is crucial; integrating optimal leaf removal, pruning strategies, and post-harvest dehydration can synergistically augment the retention and extraction of phenolic compounds. These findings highlight the importance of a holistic approach, combining vineyard management and winemaking practices, to achieve desired wine attributes.
This study demonstrates that total defoliation (T-RIF) during flowering (early May) and post-harvest dehydration techniques, particularly air (D-AIR) and pedicel crushing for extended ripening on the vine (D-VIN), significantly influence the quality indicators of Mandilaria wines, enhancing phenolic content, tannin levels, and antioxidant activity. In addition, these practices improved phenolic ripeness and reduced the harsh tannic profile typically associated with this native Greek variety. Air dehydration proved to be a promising technique, while early seed removal reduced astringency without affecting the wine’s structure.
This work highlighted the efficacy of integrating dehydration techniques and winery interventions in the improvement of the sensory appeal and consumer acceptance of Mandilaria wines, supporting the preservation of Greece’s viticultural heritage. Future studies should focus on identifying the most effective viticultural and winemaking parameters tested, aiming to enhance the handling and showcase the unique qualities of the Mandilaria variety.
Author Contributions
Conceptualization, S.K. and S.K.; methodology, C.K., T.G., E.L., L.R. and N.T.; investigation, C.K., T.G., E.L., L.R. and N.T.; data curation, C.K., T.G., E.L. and S.K.; software, C.K., T.G. and S.K.; visualization, C.K., T.G. and S.K.; formal analysis, C.K., T.G., N.T., S.K. and S.K.; writing—original draft preparation, C.K., T.G. and S.K.; writing—review and editing, S.K. and S.K.; supervision, S.K. and S.K.; resources, S.K. and S.K.; funding acquisition, S.K and S.K.; project administration, S.K and S.K.; All authors have read and agreed to the published version of the manuscript
Funding
Financial support was provided by the project entitled “Innovative innervations for improving the quality of PDO red wine of Paros” (MEASURE 16 COOPERATION, SUB – MEASURE 16.1 – 16.2 “ESTABLISHMENT AND OPERATION OF OPERATIONAL GROUPS OF THE EUROPEAN INNOVATION PARTNERSHIP FOR AGRICULTURAL PRODUCTIVITY AND SUSTAINABILITY”)
Data Availability Statement
The data presented in this study are available on request from the corresponding author (pending privacy and ethical considerations).
Acknowledgments
The authors would like to thank the Pesticide Science Laboratory, School of Agriculture, Faculty of Agriculture Forestry and Natural Environment, Aristotle University of Thessaloniki, for providing access to the facilities of the unit.
Conflicts of Interest
The authors declare no conflicts of interest.
References
- Kalogiouri, N.P.; Karadimou, C.; Avgidou, M.S.; Petsa, E.; Papadakis, E.N.; Theocharis, S.; Mourtzinos, I.; Menkissoglu-Spiroudi, U.; Koundouras, S. An Optimized HPLC-DAD Methodology for the Determination of Anthocyanins in Grape Skins of Red Greek Winegrape Cultivars (Vitis Vinifera L.). Molecules 2022, 27. [Google Scholar] [CrossRef]
- Koufos, G.C.; Mavromatis, T.; Koundouras, S.; Jones, G.V. Adaptive Capacity of Winegrape Varieties Cultivated in Greece to Climate Change: Current Trends and Future Projections. Oeno One 2020, 54, 1201–1219. [Google Scholar] [CrossRef]
- Kyraleou, M.; Kallithraka, S.; Gkanidi, E.; Koundouras, S.; Mannion, D.T.; Kilcawley, K.N. Discrimination of Five Greek Red Grape Varieties According to the Anthocyanin and Proanthocyanidin Profiles of Their Skins and Seeds. J. Food Compos. Anal. 2020, 92, 103547. [Google Scholar] [CrossRef]
- Kyraleou, M.; Gkanidi, E.; Koundouras, S.; Kallithraka, S. Tannin Content and Antioxidant Capacity of Five Greek Red Grape Varieties. Vitis - J. Grapevine Res. 2019, 58, 69–75. [Google Scholar] [CrossRef]
- Tello, J.; Galán, Á.; Rodríguez-Torres, I.; Martínez-Zapater, J.M.; Rubio Casanova, A.; Ibáñez, J. Genetic Fingerprinting Reveals How Traditional Farming Practices Aided to Preserve Ancient Table Grape Varieties in Almería (Southeastern Spain). Plants People Planet 2024, 1453–1468. [Google Scholar] [CrossRef]
- Kallithraka, S.; Kim, D.; Tsakiris, A.; Paraskevopoulos, I.; Soleas, G. Sensory Assessment and Chemical Measurement of Astringency of Greek Wines: Correlations with Analytical Polyphenolic Composition. Food Chem. 2011, 126, 1953–1958. [Google Scholar] [CrossRef]
- Miliordos, D.E.; Merkouropoulos, G.; Kogkou, C.; Arseniou, S.; Alatzas, A.; Proxenia, N.; Hatzopoulos, P.; Kotseridis, Y. Explore the Rare—Molecular Identification and Wine Evaluation of Two Autochthonous Greek Varieties: “Karnachalades” and “Bogialamades. ” Plants 2021, 10. [Google Scholar] [CrossRef] [PubMed]
- Stamatina, K.; Yorgos, K.; Maria, K.; Niki, P.; Argirios, T.; Garifalia, K. Analytical Phenolic Composition and Sensory Assessment of Selected Rare Greek Cultivars after Extended Bottle Ageing. J. Sci. Food Agric. 2015, 95, 1638–1647. [Google Scholar] [CrossRef]
- Pérez-Navarro, J.; Izquierdo-Cañas, P.M.; Mena-Morales, A.; Martínez-Gascueña, J.; Chacón-Vozmediano, J.L.; García-Romero, E.; Gómez-Alonso, S.; Hermosín-Gutiérrez, I. First Chemical and Sensory Characterization of Moribel and Tinto Fragoso Wines Using HPLC-DAD-ESI-MS/MS, GC-MS, and Napping®® Techniques: Comparison with Tempranillo. J. Sci. Food Agric. 2019, 99, 2108–2123. [Google Scholar] [CrossRef]
- Pavez, C.; González-Muñoz, B.; O’Brien, J.A.; Laurie, V.F.; Osorio, F.; Núñez, E.; Vega, R.E.; Bordeu, E.; Brossard, N. Red Wine Astringency: Correlations between Chemical and Sensory Features. Lwt 2022, 154. [Google Scholar] [CrossRef]
- Flamini, R.; Mattivi, F.; De Rosso, M.; Arapitsas, P.; Bavaresco, L. Advanced Knowledge of Three Important Classes of Grape Phenolics: Anthocyanins, Stilbenes and Flavonols. Int. J. Mol. Sci. 2013, 14, 19651–19669. [Google Scholar] [CrossRef]
- Monagas, M.; Gómez-Cordovés, C.; Bartolomé, B.; Laureano, O.; Ricardo Da Silva, J.M. Monomeric, Oligomeric, and Polymeric Flavan-3-Ol Composition of Wines and Grapes from Vitis Vinifera L. Cv. Graciano, Tempranillo, and Cabernet Sauvignon. J. Agric. Food Chem. 2003, 51, 6475–6481. [Google Scholar] [CrossRef] [PubMed]
- Lorrain, B.; Ky, I.; Pechamat, L.; Teissedre, P.L. Evolution of Analysis of Polyhenols from Grapes, Wines, and Extracts. Molecules 2013, 18, 1076–1100. [Google Scholar] [CrossRef] [PubMed]
- Yacco, R.S.; Watrelot, A.A.; Kennedy, J.A. Red Wine Tannin Structure-Activity Relationships during Fermentation and Maceration. J. Agric. Food Chem. 2016, 64, 860–869. [Google Scholar] [CrossRef] [PubMed]
- Schwarz, B.; Hofmann, T. Is There a Direct Relationship between Oral Astringency and Human Salivary Protein Binding? Eur. Food Res. Technol. 2008, 227, 1693–1698. [Google Scholar] [CrossRef]
- Kennedy, J.A. Grape and Wine Phenolics: Observations and Recent Findings. Cienc. e Investig. Agrar. 2008, 35, 77–90. [Google Scholar] [CrossRef]
- McRae, J.M.; Kennedy, J.A. Wine and Grape Tannin Interactions with Salivary Proteins and Their Impact on Astringency: A Review of Current Research. Molecules 2011, 16, 2348–2364. [Google Scholar] [CrossRef]
- González-Muñoz, B.; Garrido-Vargas, F.; Pavez, C.; Osorio, F.; Chen, J.; Bordeu, E.; O’Brien, J.A.; Brossard, N. Wine Astringency: More than Just Tannin–Protein Interactions. J. Sci. Food Agric. 2022, 102, 1771–1781. [Google Scholar] [CrossRef]
- Nel, A.P. Tannins and Anthocyanins: From Their Origin to Wine Analysis - A Review. South African J. Enol. Vitic. 2018, 39, 1–20. [Google Scholar] [CrossRef]
- Huang, R.; Xu, C. An Overview of the Perception and Mitigation of Astringency Associated with Phenolic Compounds. Compr. Rev. Food Sci. Food Saf. 2021, 20, 1036–1074. [Google Scholar] [CrossRef]
- Alatzas, A.; Theocharis, S.; Miliordos, D.E.; Kotseridis, Y.; Koundouras, S.; Hatzopoulos, P. Leaf Removal and Deficit Irrigation Have Diverse Outcomes on Composition and Gene Expression during Berry Development of Vitis Vinifera L. Cultivar Xinomavro. Oeno One 2023, 57, 289–305. [Google Scholar] [CrossRef]
- Koundouras, S. Environmental and Viticultural Effects on Grape Composition and Wine Sensory Properties. Elements 2018, 14, 173–178. [Google Scholar] [CrossRef]
- Kyraleou, M.; Kallithraka, S.; Koundouras, S.; Chira, K.; Haroutounian, S.; Spinthiropoulou, H.; Kotseridis, Y. Effect of Vine Training System on the Phenolic Composition of Red Grapes (Vitis Vinifera L. Cv. Xinomavro). J. Int. des Sci. la Vigne du Vin 2015, 49, 71–84. [Google Scholar] [CrossRef]
- Martin, D.; Grose, C.; Fedrizzi, B.; Stuart, L.; Albright, A.; McLachlan, A. Grape Cluster Microclimate Influences the Aroma Composition of Sauvignon Blanc Wine. Food Chem. 2016, 210, 640–647. [Google Scholar] [CrossRef]
- Amores-Arrocha, A.; Sancho-Galán, P.; Jiménez-Cantizano, A.; Palacios, V. Bee Pollen as Oenological Tool to Carry out Red Winemaking in Warm Climate Conditions. Agronomy 2020, 10, 14–20. [Google Scholar] [CrossRef]
- Sancho-Galán, P.; Amores-Arrocha, A.; Palacios, V.; Jiménez-Cantizano, A. Effect of Grape Over-Ripening and Its Skin Presence on White Wine Alcoholic Fermentation in a Warm Climate Zone. Foods 2021, 10. [Google Scholar] [CrossRef]
- Panceri, C.P.; De Gois, J.S.; Borges, D.L.G.; Bordignon-Luiz, M.T. Effect of Grape Dehydration under Controlled Conditions on Chemical Composition and Sensory Characteristics of Cabernet Sauvignon and Merlot Wines. Lwt 2015, 63, 228–235. [Google Scholar] [CrossRef]
- Scalzini, G.; Vernhet, A.; Carillo, S.; Roi, S.; Véran, F.; Jørgensen, B.; Hansen, J.; Giacosa, S.; Segade, S.R.; Paissoni, M.A.; et al. Cell Wall Polysaccharides, Phenolic Extractability and Mechanical Properties of Aleatico Winegrapes Dehydrated under Sun or in Controlled Conditions. Food Hydrocoll. 2024, 149. [Google Scholar] [CrossRef]
- Figueiredo-González, M.; Cancho-Grande, B.; Simal-Gándara, J. Effects on Colour and Phenolic Composition of Sugar Concentration Processes in Dried-on- or Dried-off-Vine Grapes and Their Aged or Not Natural Sweet Wines. Trends Food Sci. Technol. 2013, 31, 36–54. [Google Scholar] [CrossRef]
- OIV Compendium of International Methods of Wine and Must Analysis International Organisation of Vine and Wine; 2021; ISBN 9782850380334.
- Lorrain, B.; Chira, K.; Teissedre, P.L. Phenolic Composition of Merlot and Cabernet-Sauvignon Grapes from Bordeaux Vineyard for the 2009-Vintage: Comparison to 2006, 2007 and 2008 Vintages. Food Chem. 2011, 126, 1991–1999. [Google Scholar] [CrossRef]
- Chira, K.; Pacella, N.; Jourdes, M.; Teissedre, P.L. Chemical and Sensory Evaluation of Bordeaux Wines (Cabernet-Sauvignon and Merlot) and Correlation with Wine Age. Food Chem. 2011, 126, 1971–1977. [Google Scholar] [CrossRef]
- Y. Glories Il Colore Del Vino Rosso I Parte. Connaiss. Vigne Vin 1984, 195–217. [Google Scholar]
- Arnous, A.; Makris, D.P.; Kefalas, P. Effect of Principal Polyphenolic Components in Relation to Antioxidant Characteristics of Aged Red Wines. J. Agric. Food Chem. 2001, 49, 5736–5742. [Google Scholar] [CrossRef]
- Singleton, V.L.; Orthofer, R.; Lamuela-Raventos, R.M. Analysis of Total Phenols and Other Oxidation Substrates and Antioxidants by Means of Folin–Ciocalteu Reagent. Methods Enzymol. 1999, 299, 152–178. [Google Scholar]
- Iland, P.G.; Cynkar, W.; Francis, I.L.; Williams, P.J.; Coombe, B.C. Optimisation of Methods for the Determination of Total and Red-Free Glycosyl Glucose in Black Grape Berries of Vitis Vinifera. Aust. J. Grape Wine Res. 1996, 2, 171–178. [Google Scholar] [CrossRef]
- Karadimou, C.; Petsa, E.; Ouroumi, N.A.; Papadakis, E.N.; Kontoudakis, N.; Theocharis, S.; Mourtzinos, I.; Menkissoglu-Spiroudi, U.; Kalogiouri, N.P.; Koundouras, S. Exploration of the Anthocyanin and Proanthocyanidin Profile of Greek Red Grape Skins Belonging to Vradiano, Limnio, and Kotsifali Cultivars, Analyzed by a Novel LC-QTOF-MS/MS Method. Phytochem. Anal. 2024, 1–13. [Google Scholar] [CrossRef]
- Kallithraka, S.; Tsoutsouras, E.; Tzourou, E.; Lanaridis, P. Principal Phenolic Compounds in Greek Red Wines. Food Chem. 2006, 99, 784–793. [Google Scholar] [CrossRef]
- Harbertson, J.F. , Picciotto, E.A., & Adams, D.O. Measurement of Polymeric Pigments in Grape Berry Extract Sand Wines Using a Protein Precipitation Assay Combined with Bisulfite Bleaching. Am. J. Enol. Vitic. 2003, 54, 301–306. [Google Scholar]
- Sarneckis, C.J.; Dambergs, R.G.; Jones, P.; Mercurio, M.; Herderich, M.J.; Smith, P.A. Quantification of Condensed Tannins by Precipitation with Methyl Cellulose: Development and Validation of an Optimised Tool for Grape and Wine Analysis. Aust. J. Grape Wine Res. 2006, 12, 39–49. [Google Scholar] [CrossRef]
- Kennedy, J.A.; Jones, G.P. Analysis of Proanthocyanidin Cleavage Products Following Acid-Catalysis in the Presence of Excess Phloroglucinol. J. Agric. Food Chem. 2001, 49, 1740–1746. [Google Scholar] [CrossRef]
- Chira, K.; Schmauch, G.; Saucier, C.; Fabre, S.; Teissedre, P.L. Grape Variety Effect on Proanthocyanidin Composition and Sensory Perception of Skin and Seed Tannin Extracts from Bordeaux Wine Grapes (Cabernet Sauvignon and Merlot) for Two Consecutive Vintages (2006 and 2007). J. Agric. Food Chem. 2009, 57, 545–553. [Google Scholar] [CrossRef] [PubMed]
- Pappas, C.; Kyraleou, M.; Voskidi, E.; Kotseridis, Y.; Taranilis, P.A.; Kallithraka, S. Direct and Simultaneous Quantification of Tannin Mean Degree of Polymerization and Percentage of Galloylation in Grape Seeds Using Diffuse Reflectance Fourier Transform-Infrared Spectroscopy. J. Food Sci. 2015, 80, C298–C306. [Google Scholar] [CrossRef]
- Petropoulos, S.; Kanellopoulou, A.; Paraskevopoulos, I.; Kotseridis, Y.; Kallithraka, S. Characterization of Grape and Wine Proanthocyanidins of Agiorgitiko (Vitis Vinifera L. Cv.) Cultivar Grown in Different Regions of Nemea. J. Food Compos. Anal. 2017, 63, 98–110. [Google Scholar] [CrossRef]
- Castellarin, S.D.; Di Gaspero, G. Transcriptional Control of Anthocyanin Biosynthetic Genes in Extreme Phenotypes for Berry Pigmentation of Naturally Occurring Grapevines. BMC Plant Biol. 2007, 7, 1–10. [Google Scholar] [CrossRef]
- Rodríguez, K.; Ah-Hen, K.; Vega-Gálvez, A.; López, J.; Quispe-Fuentes, I.; Lemus-Mondaca, R.; Gálvez-Ranilla, L. Changes in Bioactive Compounds and Antioxidant Activity during Convective Drying of Murta (Ugni Molinae T.) Berries. Int. J. Food Sci. Technol. 2014, 49, 990–1000. [Google Scholar] [CrossRef]
- Zheng, W.; Alim, A.; Bai, Y.; Feng, Z.; Zhang, J.; Xia, N.; Ding, Z. Effect of Postharvest Dehydration on the Microstructure and Anthocyanin Content of Grapes. Hortic. Environ. Biotechnol. 2021, 62, 423–434. [Google Scholar] [CrossRef]
- Guaita, M.; Petrozziello, M.; Panero, L.; Tsolakis, C.; Motta, S.; Bosso, A. Influence of Early Seeds Removal on the Physicochemical, Polyphenolic, Aromatic and Sensory Characteristics of Red Wines from Gaglioppo Cv. Eur. Food Res. Technol. 2017, 243, 1311–1322. [Google Scholar] [CrossRef]
- Fernández, K.; Agosin, E. Quantitative Analysis of Red Wine Tannins Using Fourier-Transform Mid-Infrared Spectrometry. J. Agric. Food Chem. 2007, 55, 7294–7300. [Google Scholar] [CrossRef]
- Basalekou, M.; Kyraleou, M.; Pappas, C.; Tarantilis, P.; Kotseridis, Y.; Kallithraka, S. Proanthocyanidin Content as an Astringency Estimation Tool and Maturation Index in Red and White Winemaking Technology. Food Chem. 2019, 299, 125135. [Google Scholar] [CrossRef]
- Kyraleou, M.; Kotseridis, Y.; Koundouras, S.; Chira, K.; Teissedre, P.L.; Kallithraka, S. Effect of Irrigation Regime on Perceived Astringency and Proanthocyanidin Composition of Skins and Seeds of Vitis Vinifera L. Cv. Syrah Grapes under Semiarid Conditions. Food Chem. 2016, 203, 292–300. [Google Scholar] [CrossRef]
Figure 1.
Sugar (a) and weight evolution (b) during the dehydration experiment.
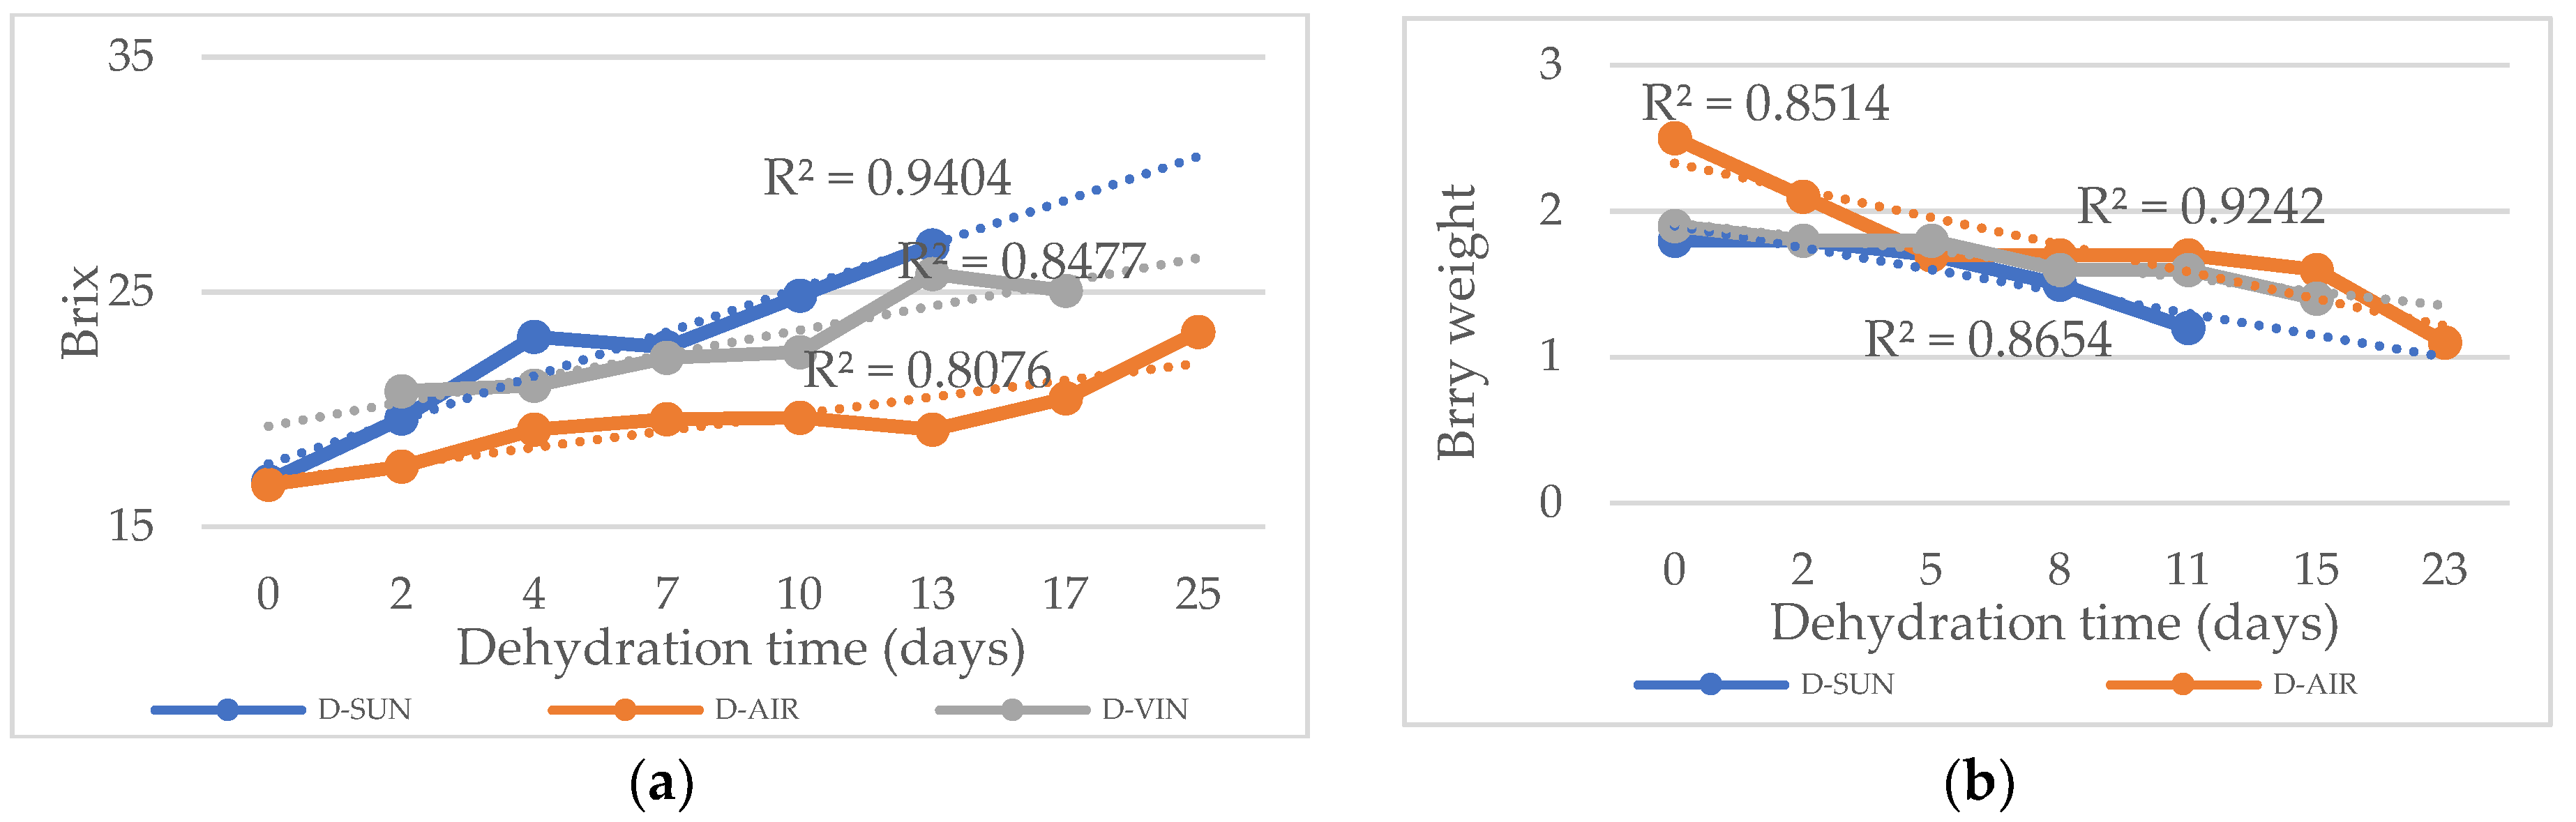
Figure 2.
Color parameters of wines: Intenstity (AU) and Hue.
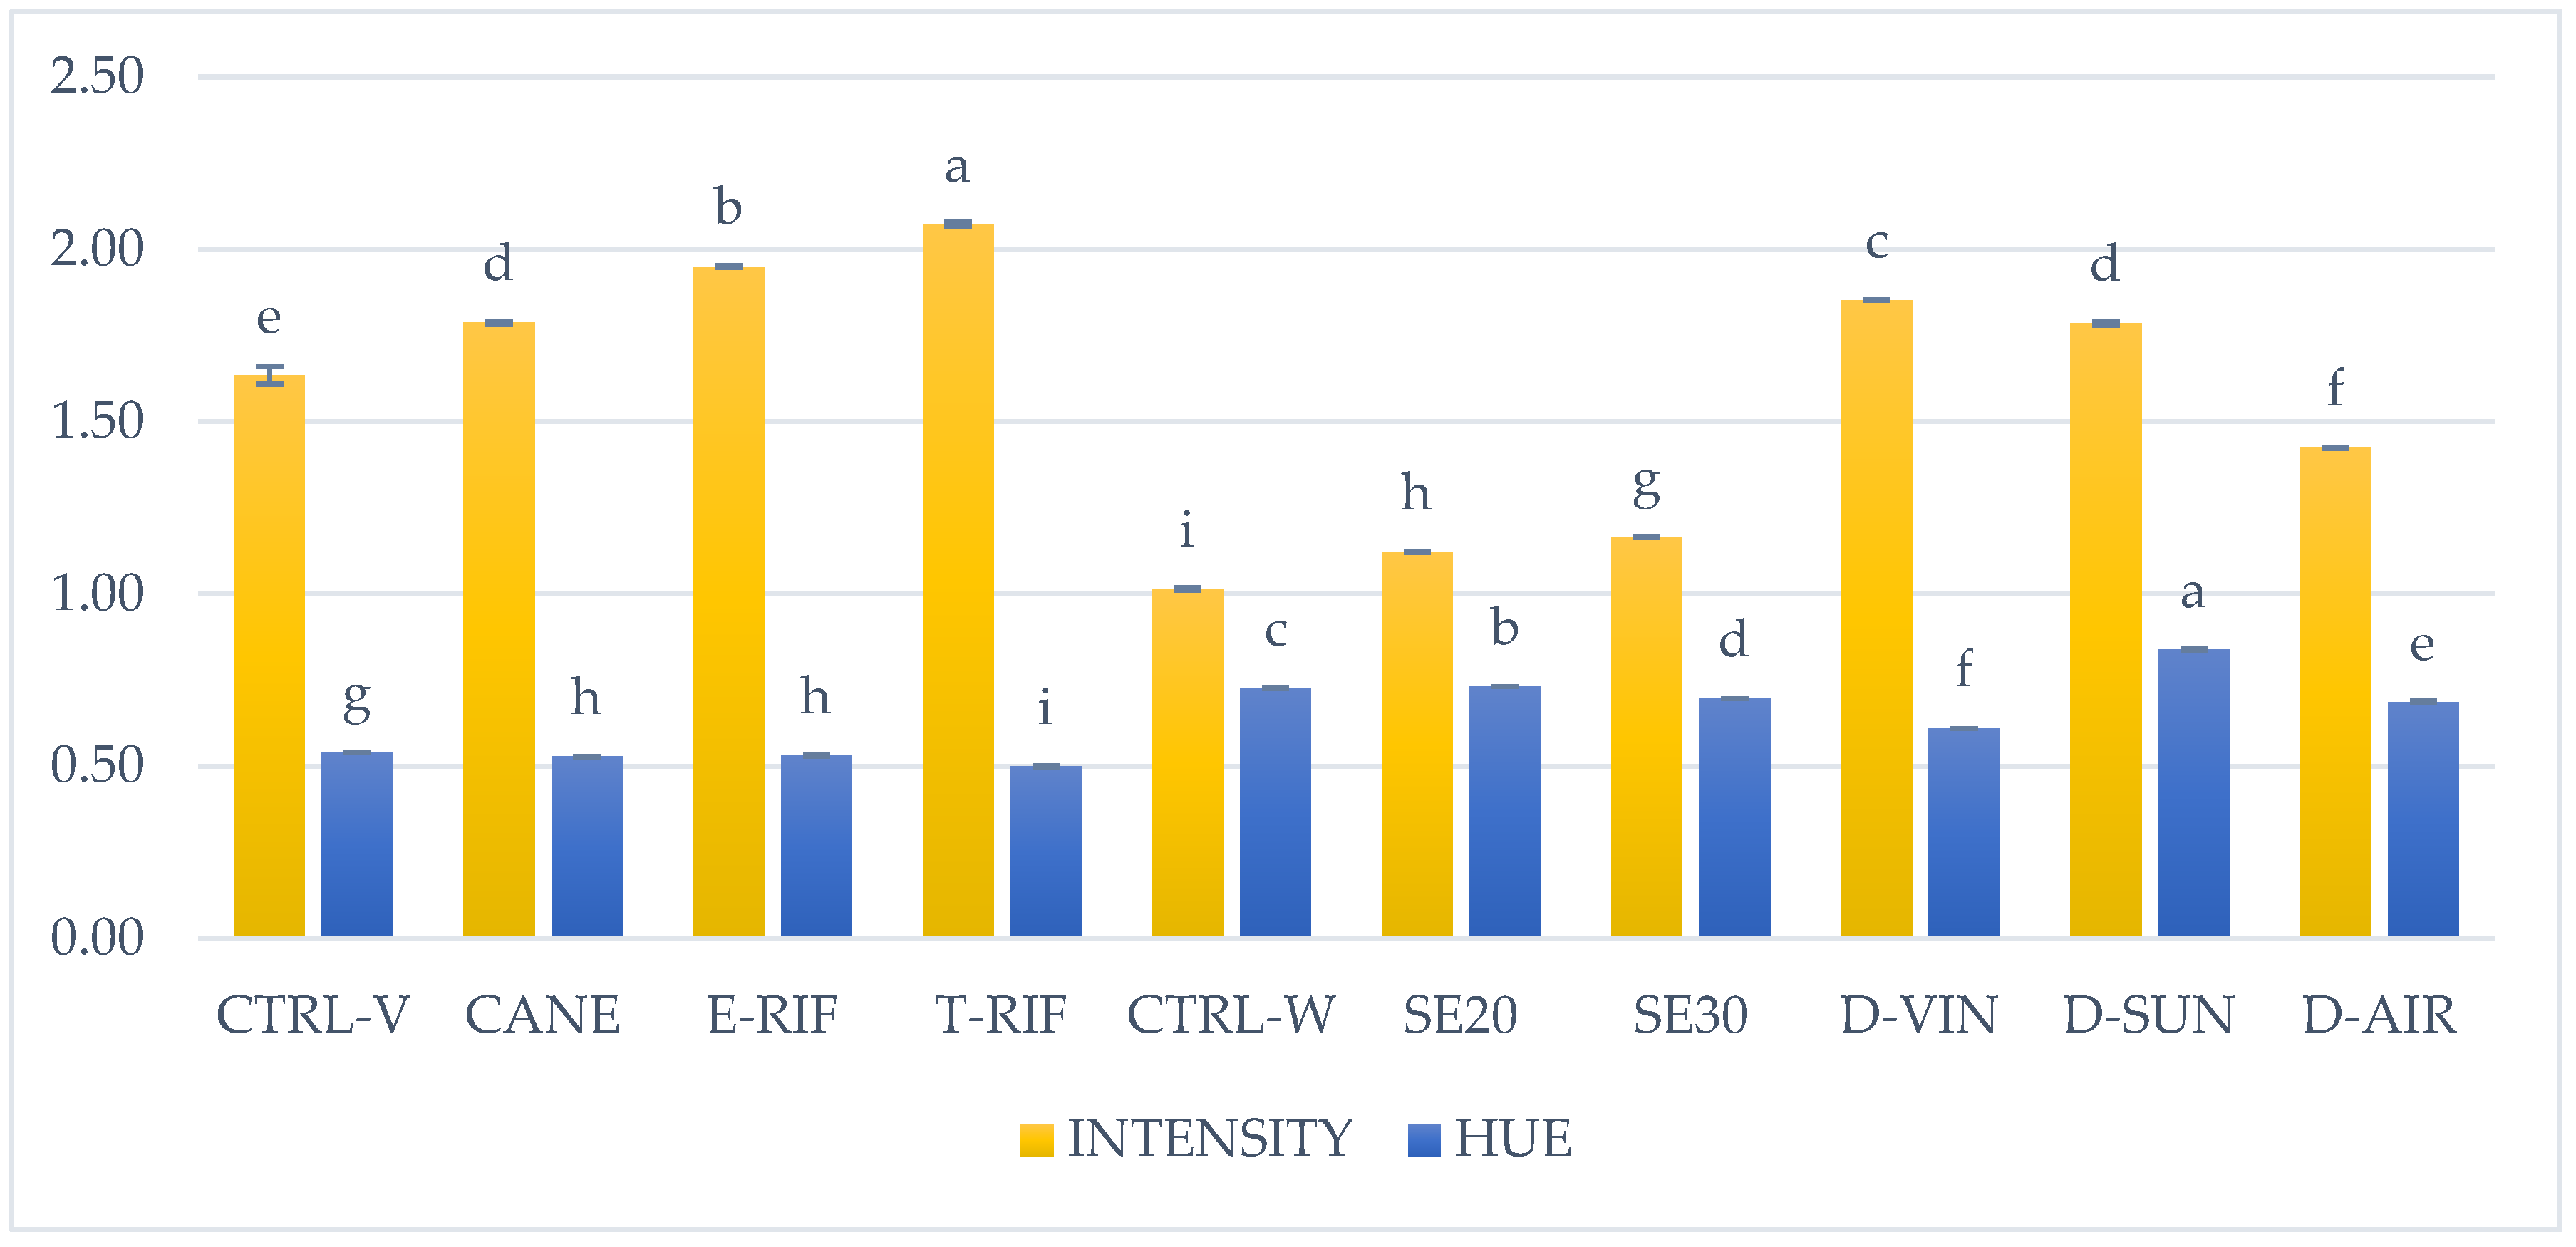
Figure 3.
Anthocyanin profile in Mandilaria grapes under vineyard (a) and winery (b) treatments. *Dlp: delphinidin-3-O-glucoside, Cyn: cyanidin-3-O- glucoside, Peo: peonidin-3-O-glucoside; Pet: petunidin-3-O-glucoside, Mlv: malvidin-3-O-glucoside, Mlv acet: malvidin-3-O-(6-acetyl)glucoside, Mlv coum: malvidin 3-O-(6-p-coumaroyl) glucoside.
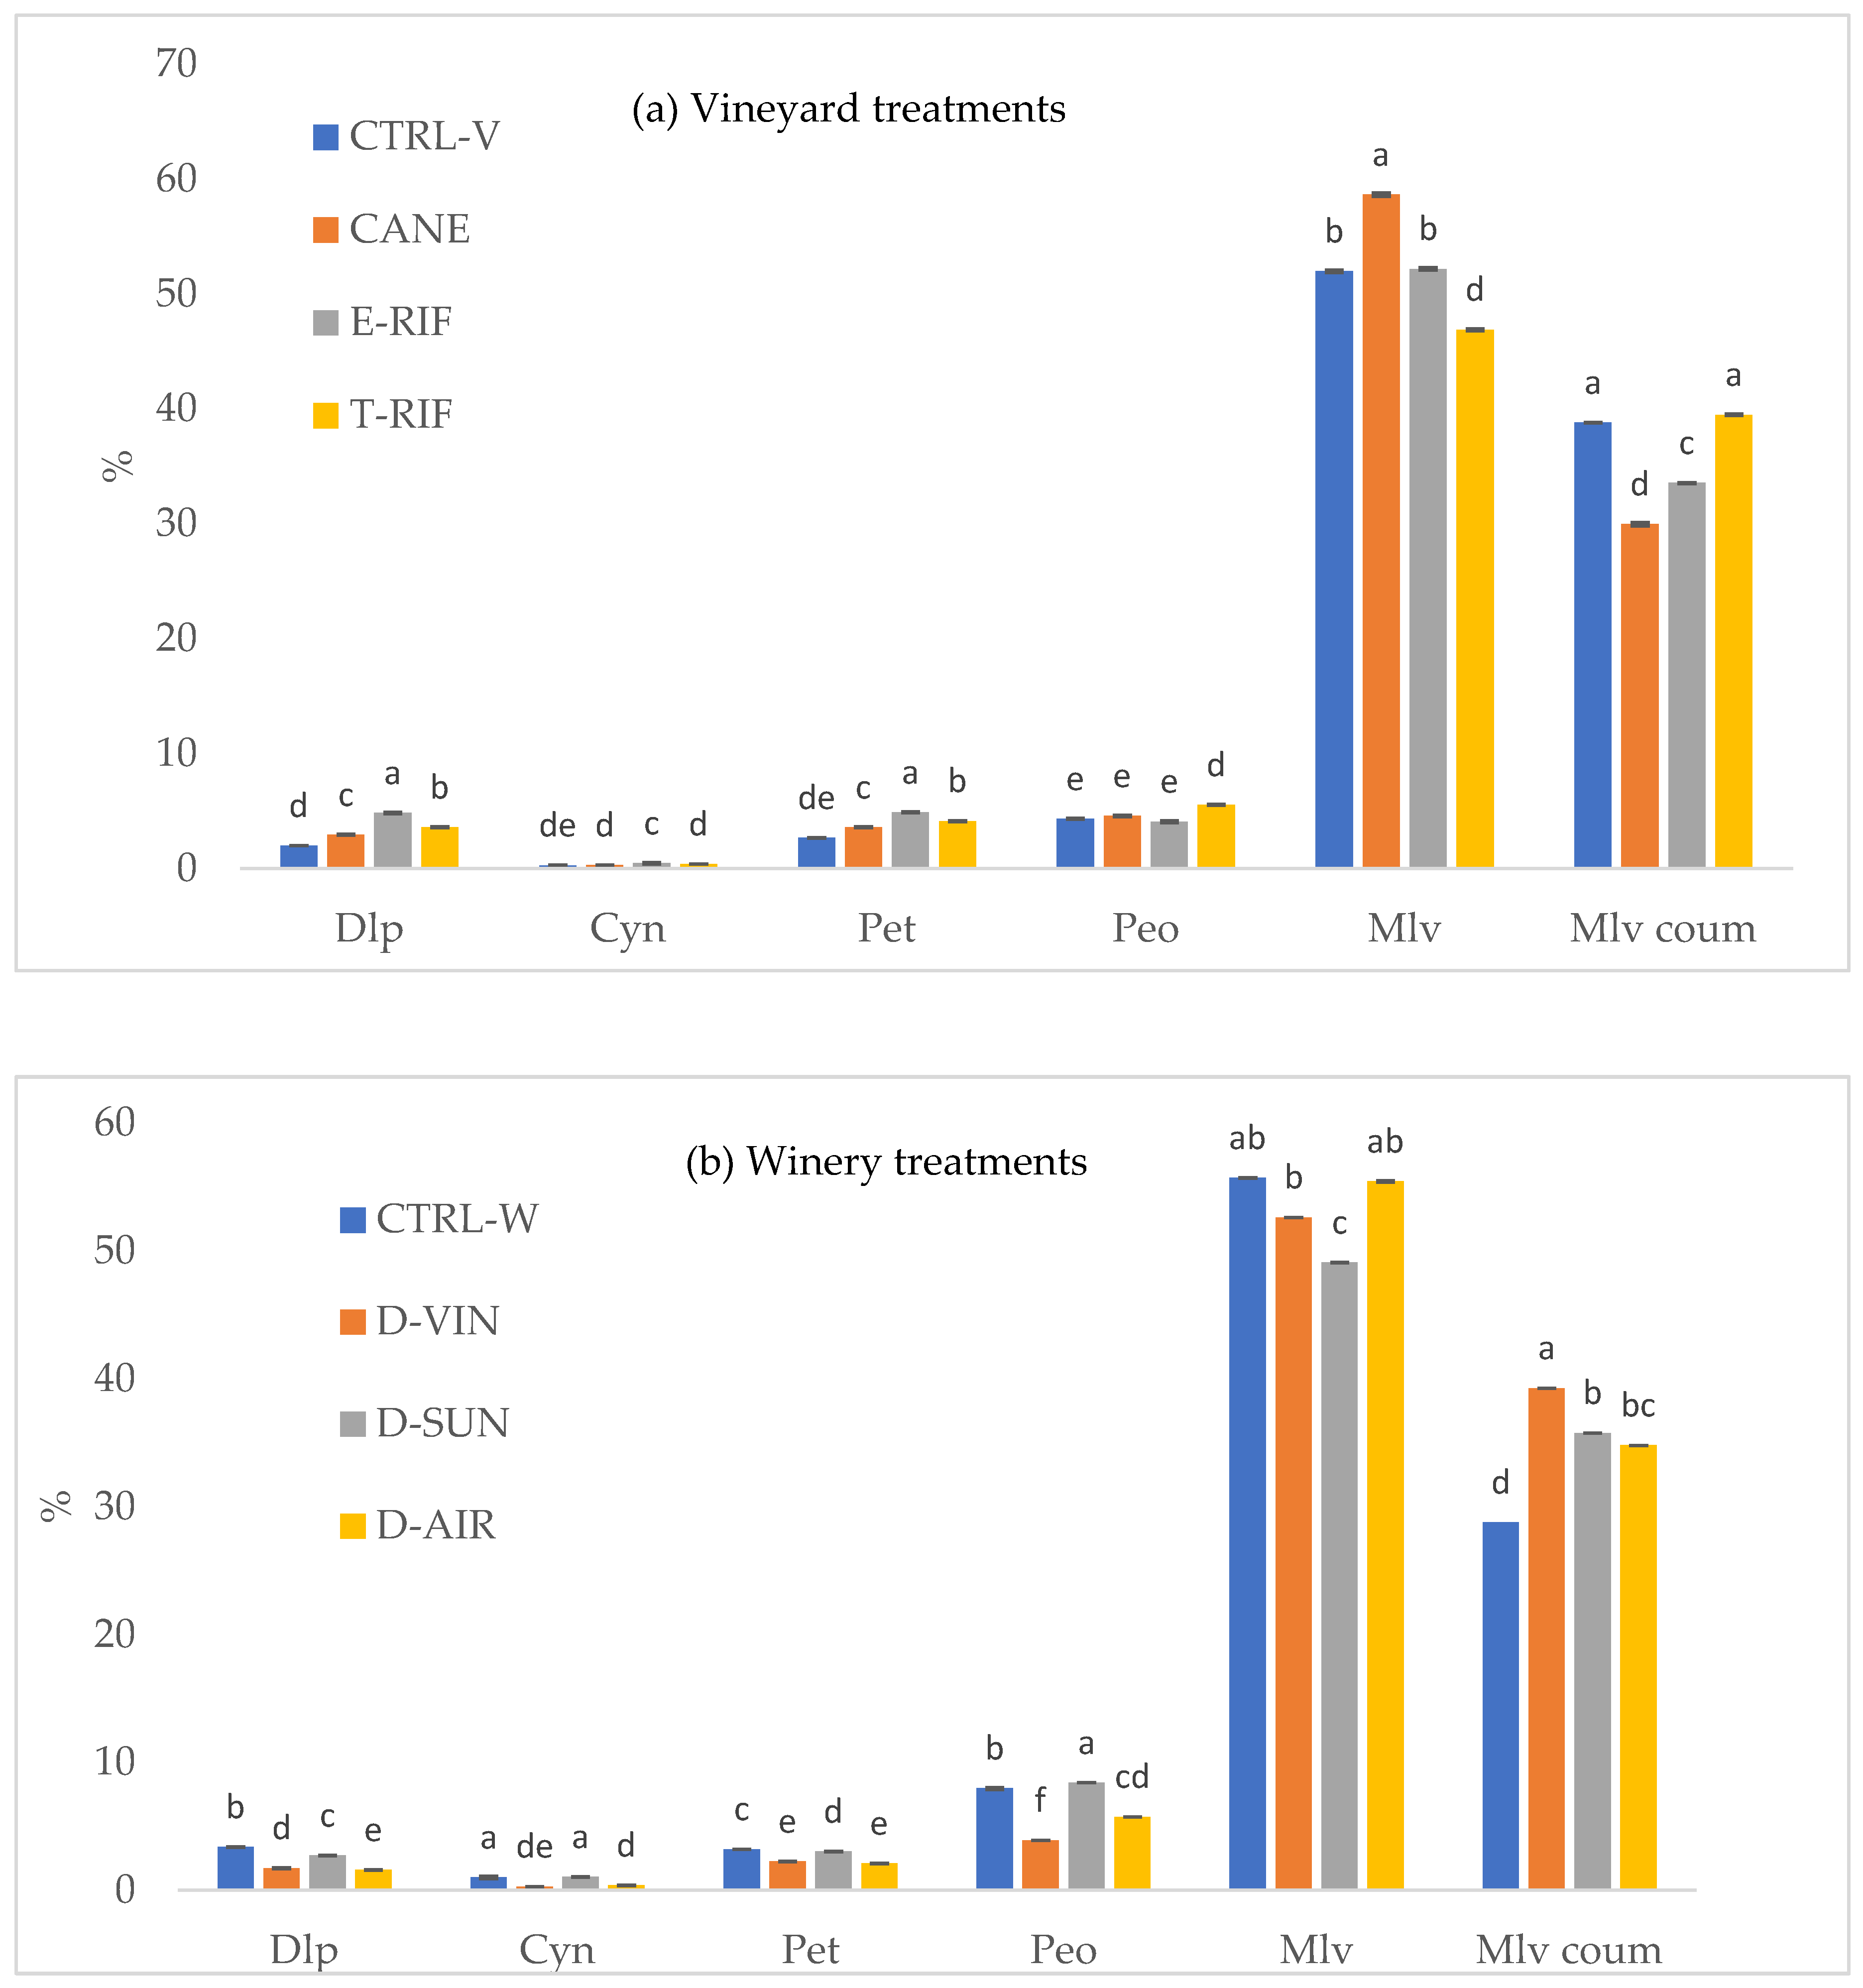
Figure 4.
Anthocyanin profile in Mandilaria wines under vineyard (a) and winery (b) treatments.
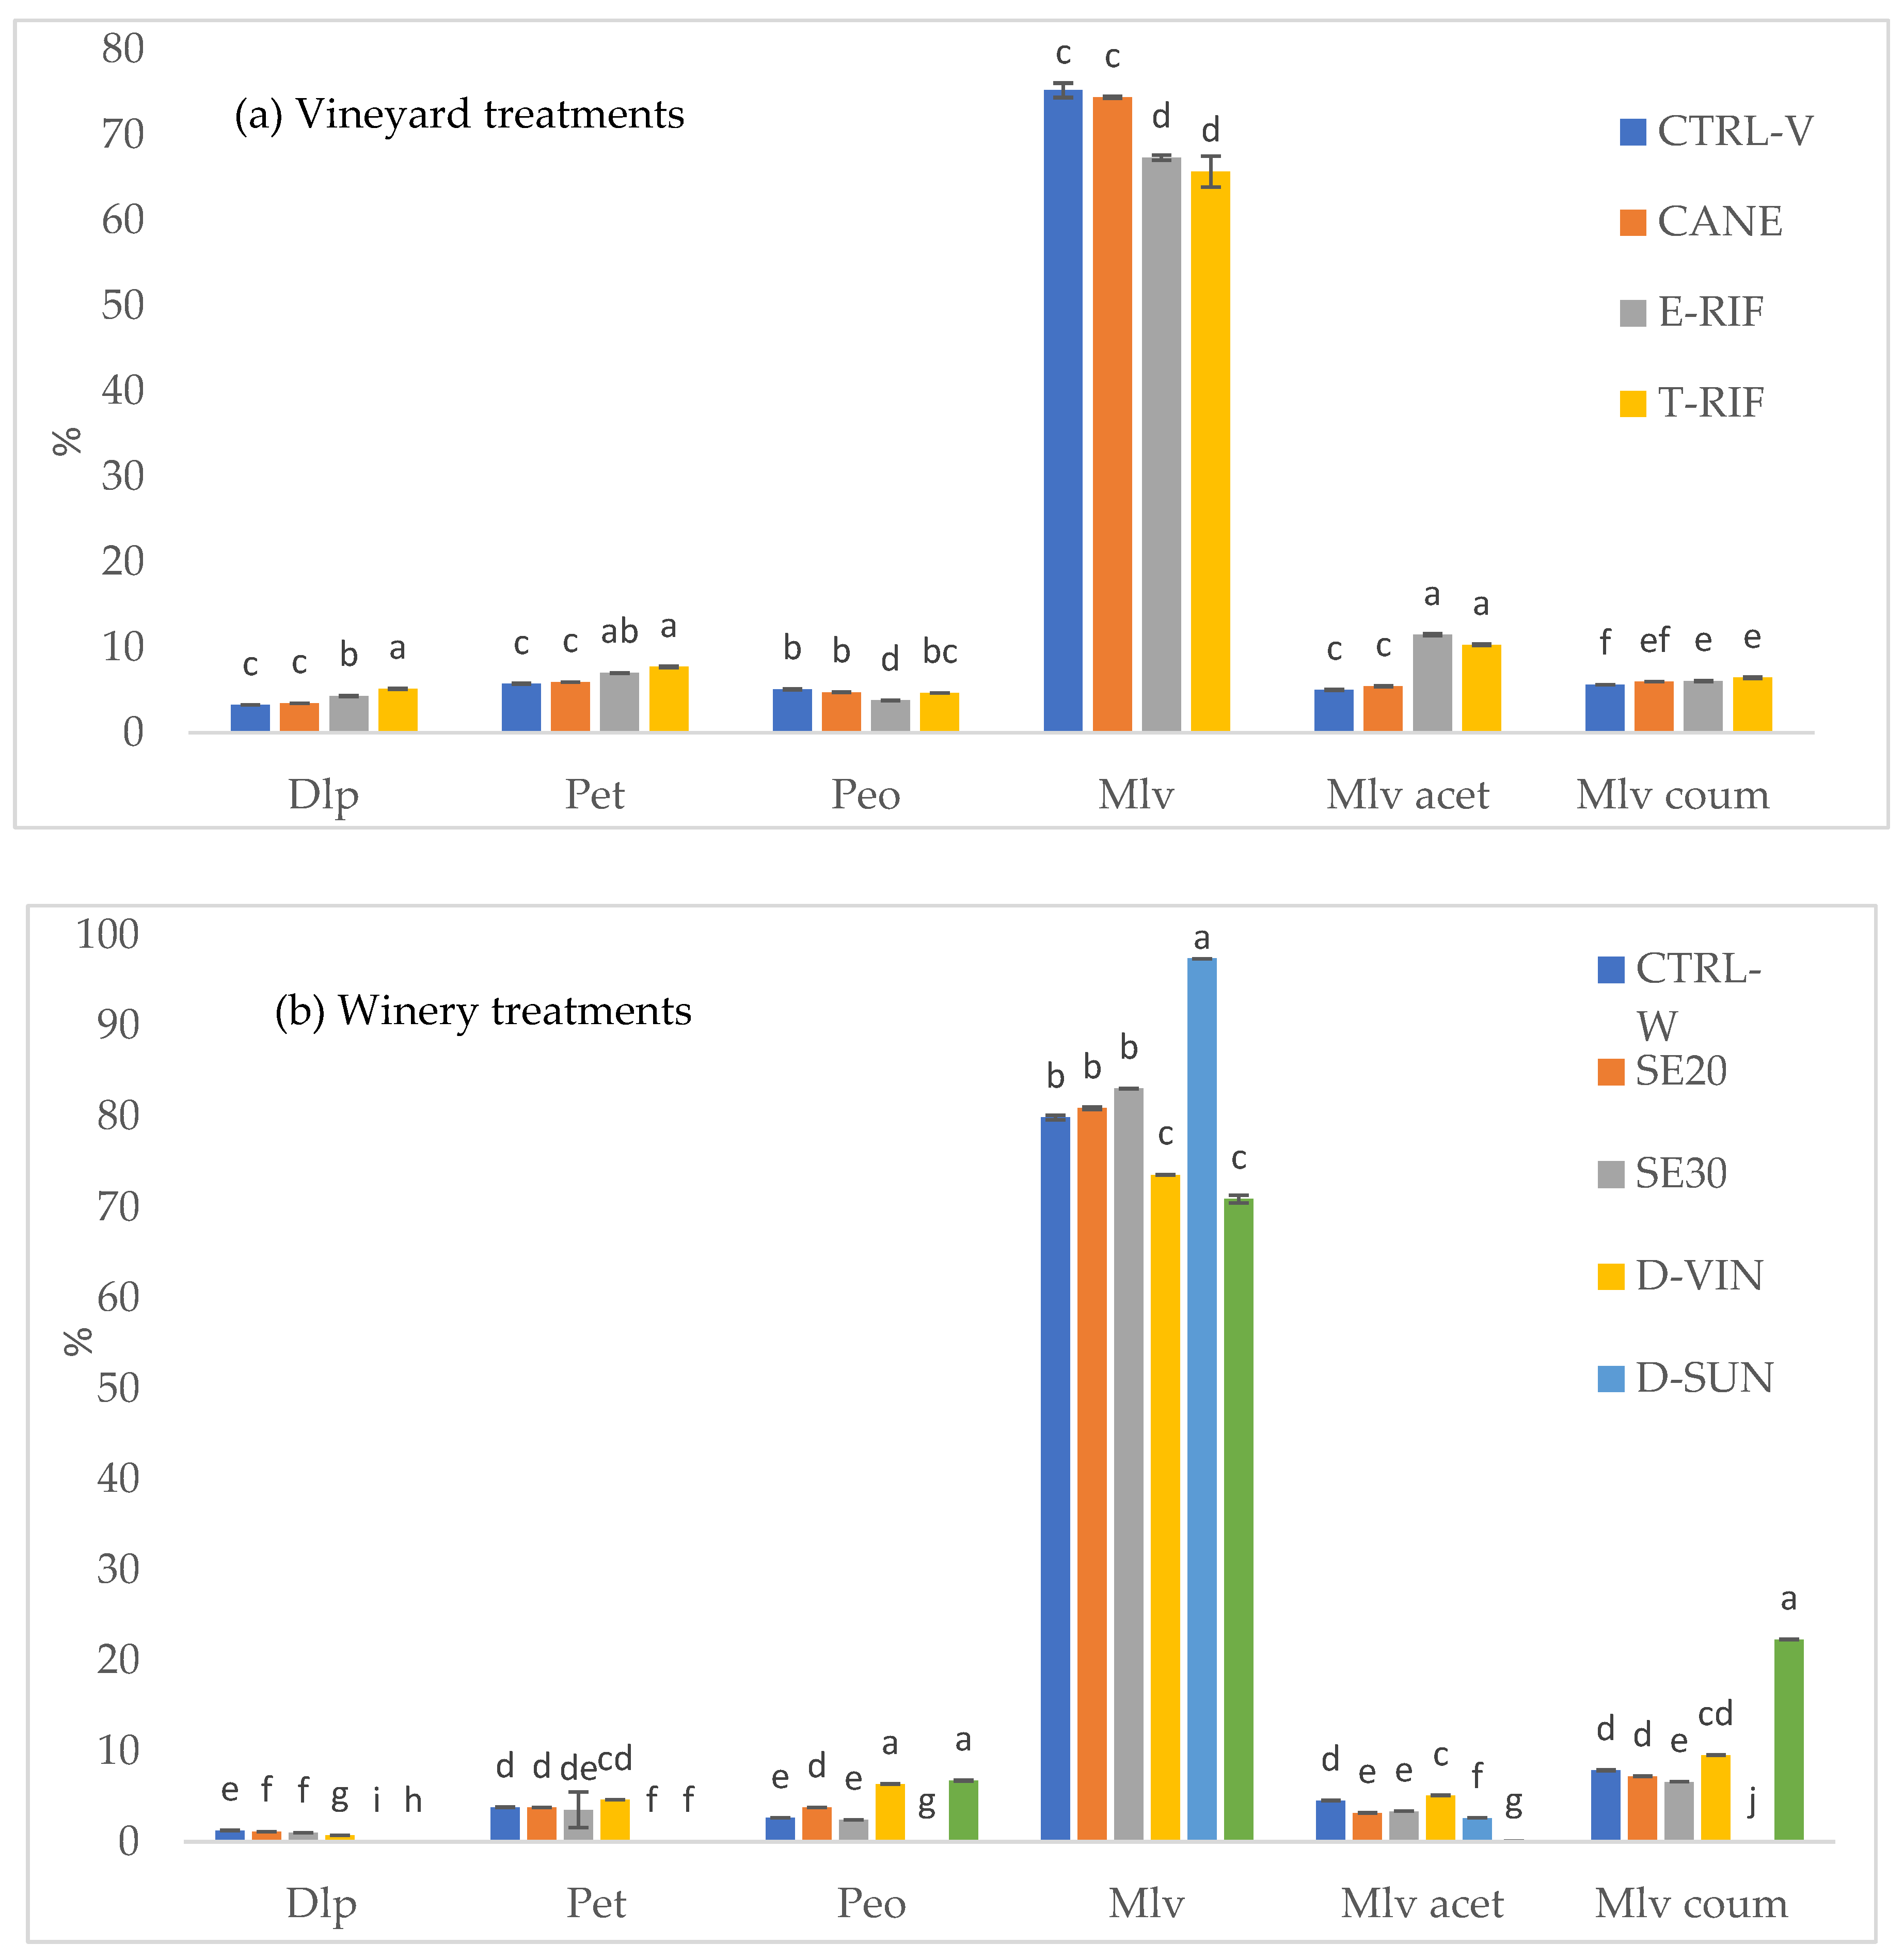
Figure 5.
Correlation between astringency and tannin content calculated using both MCP and BSA methods.
Figure 5.
Correlation between astringency and tannin content calculated using both MCP and BSA methods.
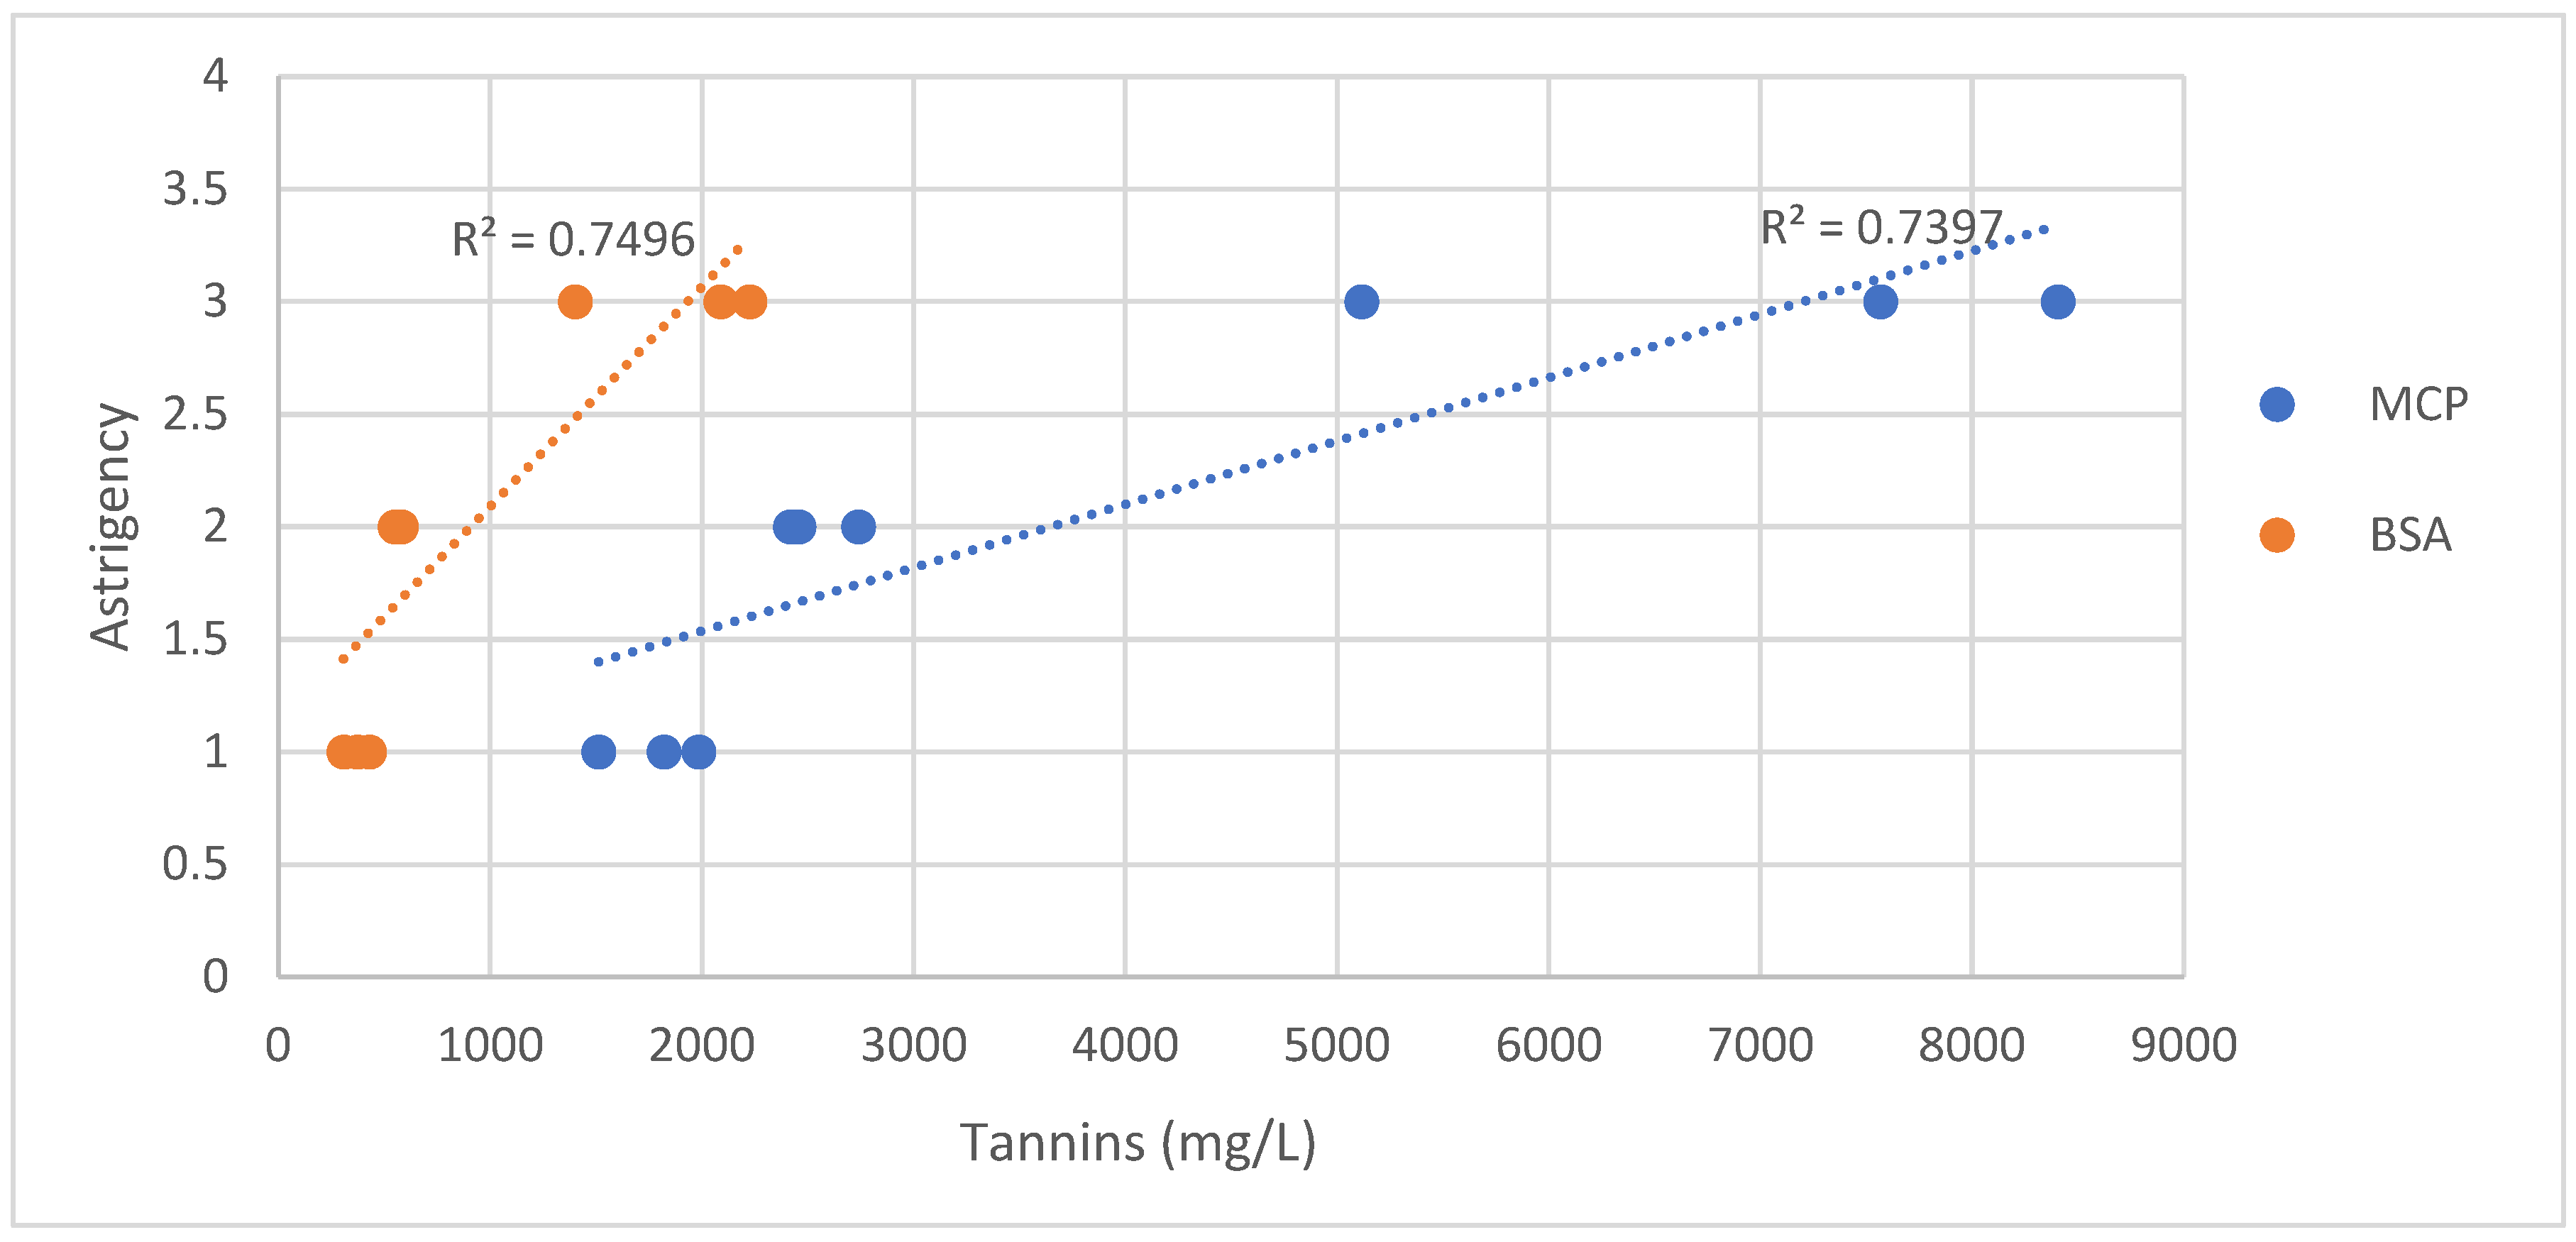
Figure 6.
Mean degree of polymerization (mDp), percentage of prodelphinidins (%P) and galloylation (%G) in Mandilaria grapes (a) and wines (b) under vineyard and winery treatments.
Figure 6.
Mean degree of polymerization (mDp), percentage of prodelphinidins (%P) and galloylation (%G) in Mandilaria grapes (a) and wines (b) under vineyard and winery treatments.
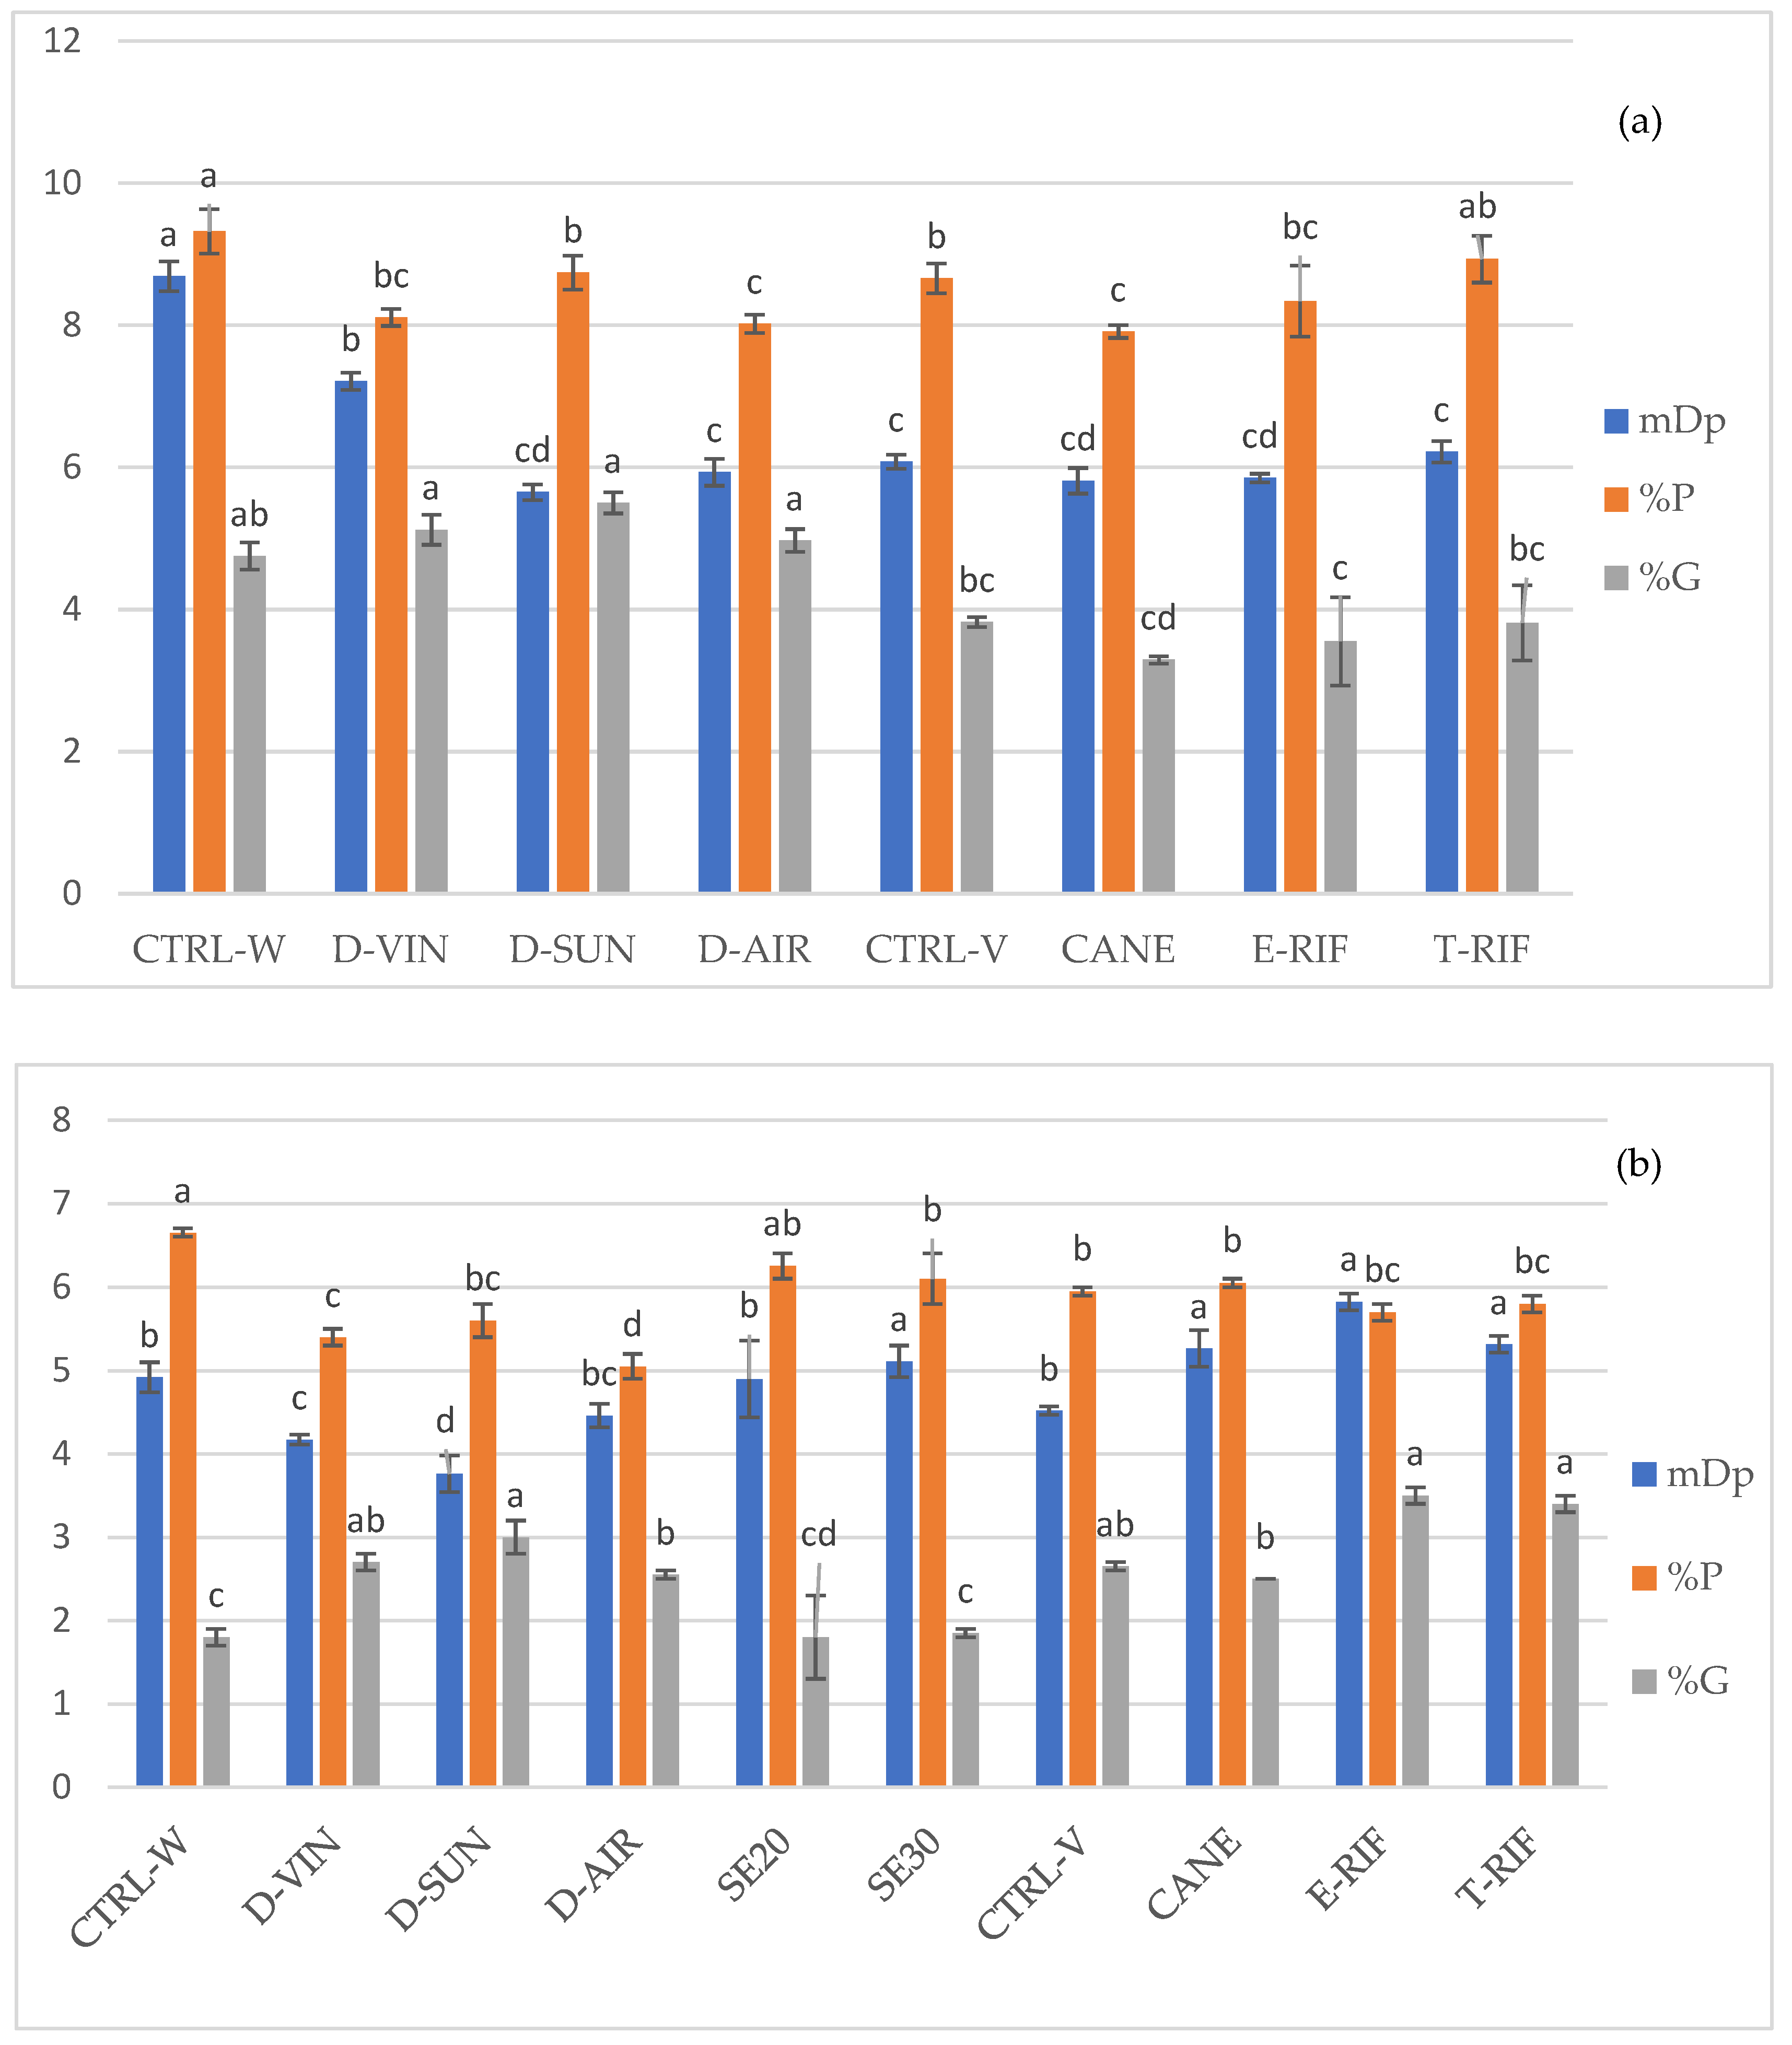

Table 1.
Grape parameters affected by the viticulture practices.
| * | Bunch length (cm) | Bunch width (cm) | Peduncle length (cm) | Weight of 50 grapes (g) | % skins/berry | % seeds/berry | % flesh/berry | skin/flesh | Harvest day |
| CTRL-V | 16.8 ± 0.2 c | 10.4 ± 0.3 b | 1.4 ± 0.0 c | 109.8 ± 0.7 b | 4.6 ± 0.1 c | 4.1 ± 0.2 b | 91.2 ± 0.8 a | 0.051 ± 0.0 c | 16/9/23 |
| CANE | 21.3 ± 0.6 a | 10.2 ± 0.2 b | 3.1 ± 0.2 a | 75.7 ± 0.3 c | 5.9 ± 0.4 b | 5.9 ± 0.4 a | 88.3 ± 0.6 b | 0.066 ± 0.0 b | 16/9/23 |
| E-RIF | 16.5 ± 0.5 c | 9.3 ± 0.2 b | 2.7 ± 0.3 b | 127.7 ± 0.6 a | 7.1 ± 0.5 a | 4.3 ± 0.4 b | 88.6 ± 0.6 b | 0.080 ± 0.1 a | 16/9/23 |
| T-RIF | 19.1 ± 0.3 b | 12.7 ± 0.5 a | 2.1 ± 0.4 b | 114.3 ± 0.5 b | 6.9 ± 0.3 a | 4.4 ± 0.5 b | 88.7 ± 0.5 b | 0.077 ± 0.1 a | 16/9/23 |
*CTRL-V: control of vineyard treatments, CANE: long pruning, E-RIF: partial defoliation and T-RIF: complete defoliation.
Table 2.
Chemical composition of grapes under different viticultural practices.
| °Brix | pH | Total Acidity (g tartaric acid/L) | |
| CTRL-V | 17.8 ± 0.4 b | 3.32 ± 0.1 b | 5.0 ± 0.6 b |
| CANE | 17.4 ± 0.5 b | 3.21 ± 0.3 b | 6.4 ± 0.4 a |
| E-RIF | 19.0 ± 0.5 a | 3.50 ± 0.3 a | 3.5 ± 0.3 c |
| T-RIF | 19.4 ± 0.2 a | 3.47 ± 0.2 a | 4.0 ± 0.3 c |
Table 3.
Grape parameters of dehydrated grapes.
| °Brix | pH | Total Acidity (g tartaric acid/L) | Weight of 50 grapes (g) | % skins/berry | % seeds/berry | % flesh/berry | skin/flesh | Harvest day | |
| CTRL-W | 18.8 ± 0.3 d | 3.86 ± 0.0 c | 2.6 ± 0.2 cd | 114.2 ± 0.4 c | 7.6 ± 0.2 de | 3.7 ± 0.2 d | 88.7 ± 0.7 c | 0.085 ± 0.1 e | 22/9/23 |
| D-VIN | 24.4 ± 0.5 c | 3.53 ± 0.0 e | 4.9 ± 0.3 b | 65.8 ± 0.5 d | 7.1 ± 0.5 de | 5.3 ± 0.2 c | 87.6 ± 0.4 c | 0.081 ± 0.0 e | 9/10/23 |
| D-SUN | 27.6 ± 0.6 a | 3.71 ± 0.1 d | 5.7 ± 0.2 a | 43.5 ± 0.4 e | 19.6 ± 0.3 a | 7.8 ± 0.6 a | 72.6 ± 0.2 e | 0.270 ± 0.1 b | 5/10/23 |
| D-AIR | 23.5 ± 0.5 c | 3.25 ± 0.0 f | 7.8 ± 0.4 a | 48.8 ± 0.3 e | 10.7 ± 0.7 c | 6.3 ± 0.4 b | 83.0 ± 0.5 d | 0.129 ± 0.3 d | 17/10/23 |
*CTRL-W: control of winery treatments, D-VIN: extended ripening on the vine, D-SUN: sun-drying and D-AIR: dehydration in a closed room with shaded air circulation.
Table 4.
Total phenols and antioxidant activity of grapes and wines.
| Grape - skins | Grape - seeds | Wine | |||||
| * | DPPH | TP | DPPH | TP | DPPH | TPI | TP |
| CTRL-V | 6.43 ± 0.40 a | 1488.6 ± 47.17 a | 5.41 ± 0.12 c | 1039.77 ± 16.16 bc | 10.54 ± 0.15 e | 71.08 ± 0.18 i | 3531.8 ± 263.64 cd |
| CANE | 5.85 ± 0.24 b | 1275.0 ± 31.60 b | 5.40 ± 0.15 c | 1010.22 ± 245.74 c | 13.30 ± 0.04 d | 88.37± 0.07 f | 3977.3 ± 454.54 cd |
| E-RIF | 5.55 ± 0.22 bc | 1171.6 ± 83.50 c | 5.76 ± 0.22 b | 1135.23 ± 31.04 a | 15.26 ± 1.08 c | 96.96 ± 0.00 d | 4186.4 ± 218.18 c |
| T-RIF | 6.08 ± 0.16 ab | 1312.5 ± 36.73 b | 6.02 ± 0.10 a | 1106.81 ± 58.26 ab | 15.20 ± 0.32 c | 96.86 ± 0.29 d | 3886.4 ± 72.72 cd |
| CTRL-W | 4.89 ± 0.23 c | 1075.0 ± 189.19 d | 5.36 ± 0.09 c | 995.45 ± 20.62 cd | 16.09 ± 0.73 c | 90.15 ± 0.03 e | 3790.91 ± 240.91 cd |
| SE20 | - | - | - | - | 12.86 ± 0.62 d | 84.53 ± 0.13 g | 3531.82 ± 9.09 cd |
| SE30 | - | - | - | - | 12.70 ± 0.08 d | 77.92 ± 0.05 h | 3372.73 ± 40.91 d |
| D-VIN | 3.51 ± 0.06 d | 783.63 ± 8.13 f | 5.81 ± 0.21 ab | 1081.81 ± 36.34 b | 25.63 ± 0.95 b | 155.7 ± 0.30 c | 6518.18 ± 109.09 b |
| D-SUN | 1.62 ± 0.11 f | 282.27 ± 37.40 g | 5.55 ± 0.12 ab | 1020.45 ± 71.45 bc | 28.61 ± 0.05 a | 187.6 ± 0.60 b | 9018.18 ± 336.36 a |
| D-AIR | 3.27 ± 0.05 d | 747.05 ± 12.04 f | 5.71 ± 0.06 b | 1010.23 ± 53.21 c | 29.64 ± 0.62 a | 236.2 ± 0.00 a | 9281.82 ± 345.45 a |
* Antioxidant activity measured with DPPH as TEAC (mM) and total phenolics as (mg GAE/L).
Table 5.
Extractability and total anthocyanin content of grape skin extracts and wines from Mandilaria variety.
Table 5.
Extractability and total anthocyanin content of grape skin extracts and wines from Mandilaria variety.
| Grape | Wine | |||
| * | Extractability (AE%) | Anthocyanins (mg/berry) | Anthocyanins (mg/g fresh weight of skins) | Anthocyanins (mg Mlv/L) |
| CTRL-V | 54.48 ± 1.32 a | 0.99 ± 0.08 cd | 16.69 ± 0.06 d | 286.26 ± 0.97 ab |
| CANE | 53.04 ± 1.87 a | 1.04 ± 0.10 c | 26.57 ± 0.14 bc | 260.56 ± 0.20 b |
| E-RIF | 19.59 ± 2.16 e | 1.19 ± 0.04 b | 23.47 ± 0.17 c | 341.55 ± 0.57 a |
| T-RIF | 14.03 ± 0.84 f | 1.47 ± 0.02 a | 33.43 ± 0.21 a | 375.39 ± 2.11 a |
| CTRL-W | 45.26 ± 2.17 cd | 1.41 ± 0.04 a | 12.20 ± 0.20 d | 189.74 ± 0.61 c |
| SE20 | - | - | - | 167.31 ± 0.37 c |
| SE30 | - | - | - | 189.14 ± 0.19 c |
| D-VIN | 17.31 ± 1.43 e | 1.07 ± 0.05 c | 9.70 ± 0.40 e | 101.80 ± 1.95 de |
| D-SUN | 14.20 ± 1.25 f | 0.61 ± 0.07 e | 3.10 ± 0.10 g | 2.07 ± 0.00 j |
| D-AIR | 18.58 ± 2.00 e | 0.69 ± 0.05 e | 10.60 ± 0.30 e | 41.24 ± 0.00 h |
Table 6.
Tannin content in grapes and wines.
| Grape – skins | Grape - seeds | Wine | ||||
| * | MCP | BSA | MCP | BSA | MCP | BSA |
| CTRL-V | 1149 ± 55.52 b | 347.49 ± 90.73 ab | 1538.51 ± 97.90 c | 476.21 ± 8.89 a | 1820.0 ± 52 ef | 306.70 ± 25.0 g |
| CANE | 690 ± 379.27 d | 370.77 ± 11.33 a | 1699.73 ± 253.57 b | 447.70 ± 17.45 b | 2440.0 ± 64 de | 566.81 ± 2.13 d |
| E-RIF | 1318 ± 168.20 a | 335.23 ± 14.16 b | 1509.87 ± 140.73 c | 482.81 ± 4.27 a | 2456.0 ± 72 de | 560.43 ± 22.34 d |
| T-RIF | 948 ± 120.33 c | 335.66 ± 10.35 b | 1824.53 ± 137.15 a | 478.34 ± 37.76 a | 2740.0 ± 12 d | 549.79 ± 15.96 d |
| CTRL-W | 928 ± 142.97 c | 255.55 ± 7.12 c | 1114.67 ± 147.60 e | 489.40 ± 41.38 a | 2416.0± 304 de | 580.11 ± 10.11 d |
| SE20 | - | - | - | - | 1984.0 ± 8 ef | 427.98 ± 9.04 e |
| SE30 | - | - | - | - | 1512.0 ± 304 f | 370.00 ± 0.00 f |
| D-VIN | 422 ± 140.40 f | 158.67 ± 18.69 d | 1630.93 ± 334.74 b | 496.21 ± 23.42 a | 5114.7 ± 341.79 c | 1400.64 ± 24.47 c |
| D-SUN | 234 ± 32.42 g | 56.55 ± 10.21 g | 1377.6 ± 123.56 d | 431.11 ± 28.27 b | 7568.0 ± 57.69 b | 2086.38 ± 36.17 b |
| D-AIR | 549 ± 38.21 e | 100.85 ± 29.43 e | 1489.07 ± 40.92 cd | 473.66 ± 17.47 a | 8405.3 ± 473.10 a | 2224.68 ± 0.00 a |
* Tannins measured with MCP and BSA methods are expressed as (mg/L catechin equivalents).
Disclaimer/Publisher’s Note: The statements, opinions and data contained in all publications are solely those of the individual author(s) and contributor(s) and not of MDPI and/or the editor(s). MDPI and/or the editor(s) disclaim responsibility for any injury to people or property resulting from any ideas, methods, instructions or products referred to in the content. |
© 2025 by the authors. Licensee MDPI, Basel, Switzerland. This article is an open access article distributed under the terms and conditions of the Creative Commons Attribution (CC BY) license (http://creativecommons.org/licenses/by/4.0/).
Copyright: This open access article is published under a Creative Commons CC BY 4.0 license, which permit the free download, distribution, and reuse, provided that the author and preprint are cited in any reuse.


