
Submitted:
20 March 2025
Posted:
21 March 2025
You are already at the latest version
Abstract
Maize is an important food and feed crop for smallholder farmers in Vietnam and is affected by changing growing and crop management conditions under ongoing climate change posing potential production risks in the future. This study analyses future maize growing conditions in Northern Vietnam based on seven main agrometeorological indicators by applying the agrometeorological indicator software (AGRICLIM) on climate projections based on one global circulation model with an embedded regional climate model for two emission pathways (RCP4.5 and RCP8.5) from 1951 towards 2100. The results were analyzed for four time slices in annual, seasonal, and monthly scales and reveal that the future agrometeorological conditions for three local main maize growing seasons (winter, spring, and forage maize season) in general become more extreme compared to current conditions. In particular, the calculated increase in heat stress days, heavy precipitation events, and drought stress days for maize show different trends for the specific maize growing seasons. For example, drought and heat stress conditions may occur more frequently during the spring and forage maize season while the risk for soil erosions and N-leaching may rise in the winter and forage maize season. These findings will support the development of adaptation options under more adverse weather conditions for maize growing systems in Northern Vietnam.
Keywords:
maize
; climate change
; agrometeorological conditions
; drought stress
; heat stress
; heavy precipitation
; Northern Vietnam
1. Introduction
Temperature and precipitation are the two most threatened impact factors on crop production systems [1,5,15,19,23,24,34]. They have a complex interaction with the growth response of maize [13,40,47]. It was proved that high air temperatures (around > 35°C) harm fertility during the days of anthesis as well as during grain filling period of maize in various tropical regions [25,31,43] and during beard production and flowering period in temperate regions [10]. Particularly, maize showed a rapidly reduced shoot growth and shortened internodes when soil temperatures within the main rooting zone exceeded 37°C.
Maize yield was generally projected to decline in many studies worldwide from -8% to -38% under future climatic conditions [6]. In the United States, for example, a 2°C warming is projected to reduce maize yield in the range from -14% to -16% [17]. In Sub-Saharan Africa, maize yield was affected by more adverse conditions under future climate scenarios by a yield loss of up to -19% [7]. In Nigeria, approximately 80% of the maize cropping area suffered drought stress, where up to 90% of maize production was lost due to drought stress during the flowering and grain-filling period [3]. In Asian countries, maize production, with around 60% of the total acreage of cereal crops [18], suffered various challenges due to climate variability and change also in more humid regions with expressed dry seasons (such as in Asian monsoon climates), especially due to drought or extreme heat [4,27,38]. In Northeast China, maize yield was negatively affected mostly by the low temperature, drought stress, and heavy rainstorms. As a result, it was expected to decrease more severely than assessed in prior studies by -46.7% [49]. By contrast, an elevated mean temperature combined with rising precipitation showed a positive impact on the yield of maize varieties grown under the conditions in Ghana [39].
Maize is an important staple crop in Vietnam. For example, in 2023, approximately 4.42 million metric tons of maize were produced in the country [41]. Especially it became popular in Northern Vietnam over the past decades [29], often grown steep slopes with a high risk of soil erosion. Due to the ongoing climate warming effect, increasing adverse weather conditions could seriously threaten maize production in the future [26,31,38,43]. For example, in Thai Binh Province (Northeast of Vietnam), maize was predicted to decrease gradually in the future by -25.8% to -30.8% in 2040 [11,12]. Meanwhile, in Da Nang Province, the average annual maize yield for the period (2020-2100) was predicted to decrease only slightly by -0.6% in comparison with the yield in 2012 [37]. Similarly, a decrease in maize yield was found by a crop modelling study in Thai Nguyen Province in the spring maize season (January-March). It ranged from -30.3% to -33.9% in case of a 60% decrease in precipitation under the future climate scenarios RCP4.5 and RCP8.5, respectively [46]. However, under the same scenarios, an expected increase in winter maize yield was observed, ranging from 33.3% to 31.9% due to the increased precipitation during the winter maize season (August-October) [46].
As an innovative complementary approach to mechanistic (process-oriented) crop models for determining cropping and crop growing conditions and related production risks indicator models are applied [14,16]. As these have not been applied to the climatic and agronomic conditions in Northern Vietnam for maize yet, we expect additional supporting information for the development of adaption options. Therefore, this study aims to determine how weather-related maize cropping conditions and risks may change in a representative region of Northern Vietnam, Thai Nguyen Province, described by selected indicators for three selected maize growing seasons under two different climate emission scenarios (RCP4.5 and RCP8.5) for two future climate periods (2031-2060 and 2071-2100). Furthermore, it will contribute to the development of adaptation options, such as new crop management and cropping strategies under future climate change conditions for Vietnamese stakeholders.
2. Materials and Methods
The agrometeorological indicator software AGRICLIM [47] is based on four sub-models (a basic feature of the grass reference evapotranspiration model, a crop-specific phenological model, the FAO crop-soil water balance model [2], and a set of algorithms for agroclimatic indicators and was utilized to calculate for all considered agrometeorological indicators standard statistics such as the mean, median, standard deviation (StdDiv), maximum (Max), minimum (Min), 25% percentile (Perc25), and 75% percentile (Perc75). The required input data includes daily data on solar radiation, maximum temperature, minimum temperature, evapotranspiration, air humidity, and precipitation.
2.1. Study Site and Data Sources
The study was conducted in a representative agricultural region of Northern Vietnam, Thai Nguyen Province. It is located in the Northeast of Vietnam and covers an area of 3523 km² (Figure 1).
The soils of the region are characterized by the two most commonly agricultural soil types of Northern Vietnam (Acrisols and Ferralsols) with a low pH level, low organic matter, and an effective cation exchange capacity [22,46]. Its climatic conditions are typical of a humid, warm, and moist environment, characterized according to Koeppen-Geiger Climate Classification (reference period 1951-2000; [30]) as “Cwb” (warm temperate, winter dry, warm summer) dominating in the Northern regions of south-east Asia (besides some smaller regions in Ethiopia and South Africa). However, a shift to the new classification “Aw” (equatorial, winter dry) is expected due to climate warming over the next decades [37]. Particularly in the summer monsoon season from May to October, while the dry season lasts from October to May [21,46]. The total duration of sunshine in the year ranges from 1300 to 1750 hours. The average annual temperature of Thai Nguyen Province during 1991-2015 was 24.4°C, with the highest and lowest temperatures ever recorded were 41.5°C and 3°C, respectively. The average annual rainfall of the period 1991-2015 at the representative weather station Thai Nguyen City was 1808 mm (with an annual variation between 1250 to 2450 mm), with the highest rainfall amounts in August and the lowest in January.
The observed climatic conditions were collected from two weather stations in Thai Nguyen Province, namely Thai Nguyen (TN) station and Dinh Hoa (DH) station. The TN station is near the center of the Province with more flat topography, representing regional lowland conditions. The other site is located in the hilly region. Both weather stations recorded main weather variables, including maximum and minimum temperature (°C), solar radiation (hours), rainfall (mm), and relative air humidity (%).
To assess the future agrometeorological conditions, we applied climate scenario data for the period 1951-2100 at TN station from CORDEX (Coordinated Regional Climate Downscaling Experiment; http:esg-dn1.nsc.liu.se/search/cordex/); Global Circulation Model (GCM) ICHEC-EC-EARTH and the embedded regional climate model (RCM) DMI-HIRHAM5 [8,9] of the two Representative Concentration Pathways (RCP4.5 and RCP8.5), respectively. The observed meteorological data from the TN station (1991-2015) were used for bias correction of the climate projection on the annual base for temperature and precipitation.
The maize growth data were collected from maize fields in Thai Nguyen Province from 2019 to 2023. However, maize growing seasons depend on the regional crop calendars with different regional shares, depending on the applied production system and crop rotations [21]. Therefore, we mainly focused on the analysis of three maize growing seasons in Thai Nguyen Province: spring maize (SM) season, forage maize (FM) season, and winter maize (WM) season, with main growing periods of January-March, April-June, and August-October, respectively, following main crop rotations at the study site [44,45]. However, beyond the classification used in our study, it should be kept in mind that these different maize growing seasons over Northern Vietnam are variable, depending on local practices (e.g. crop rotations) and environmental conditions (e.g. sea level related temperatures).
2.2. Agrometeorological Condition Analysis
The analysis was carried out for four selected climate periods of the climate projections (1951-1980, 1991-2020, 2031-2061, 2071-2100 (RCP4.5 and RCP8.5, respectively)), meaning in total four “warming levels”, which catch a wide range of existing variability in climate model projections. Additionally, a sensitivity scenario with a decrease of annual precipitation by 30% and 60%, respectively, was analyzed for the period 2071-2100 to meet updated precipitation scenarios from the literature. For example, Nguyen-Ngoc-Bich et al. [33] reported an underestimation in CORDEX (CHMIP5) based RCM projections of temperatures and an overestimation of precipitation over the different regions in Vietnam, leading to a decrease in precipitation of 10-30% among various scenarios and a related more pronounced increase in drought duration, severity and intensity in the North of Vietnam. Tran et al. [46] applied scenarios of extreme annual precipitation decrease of up to about 60% for maize yield simulation in Thai Nguyen Province. The indicators calculated by AGRICLIM were analyzed in our study for winter (WMS), summer (SMS), and forage (FMS) maize seasons are described in Table 1.
3. Results
Table 2 shows that the average temperatures have an increasing trend over the past to the future; meanwhile, the average precipitation shows a decreasing trend in the future compared to current conditions. A similar finding is reported by Pham et al. [35] as well. The lowest average annual temperature was about 24.1°C in the period from 1951 to 1980. It increased slightly by 0.4°C in the next period of 1991-2020 to 24.5°C. It is expected to climb up by 3.3°C under the RCP 8.5 emission scenario during the period 2001-2100 reaching 27.8 °C (Table 2).
Meanwhile, the annual mean precipitation showed a drop up to -159mm and -232mm in the period 2031-2060 under the RCP4.5 and RCP8.5, respectively, compared to the reference base (1991-2020). The strongest decrease in precipitation is during the summer (monsoon) period from May to July under the RCP8.5 scenario (Figure 2), while only small changes are predicted in the rest of the year, similarly as reported by Nguyen-Ngoc-Bich et al. [33]. The average annual precipitation slightly decreases up to -15% under the future period (2001-2100) compared to the observed period (1991-2020), which is less than in the study of Nguyen-Ngoc-Bich et al. [33], which was reported to decline by up to -30%.
Table 2 indicates that the projected period of 1951-1980 was not only cooler but significantly more wet than the reference period of 1981-2020. The observed monthly precipitation of 1991-2015 shows a different seasonal precipitation pattern during summer than the projected period of the comparable 1991-2020 period, where the projection underestimated precipitation from May-July and overestimated from August-September. However, the differences in monthly precipitation are mostly much smaller between the projected two future periods than between the reference period (1991-2020) and the projected period of 2031-2060, indicating that major shifts of precipitation could occur already in the next few decades (however, a higher uncertainty in projections of precipitation should be considered).
Regarding rainfall patterns, Figure 3a-d shows the distribution of precipitation classes under the observed period (1991-2015) and the reference period (1991-2020), as well as the two future projected periods, 2031-2060 and 2071-2100, respectively. It can be seen that the total number of projected heavy rain events are decreasing under our future climate projections in comparison to the projected reference (1990-2020). However, it shows also that the number of events > 150mm may rise compared to the observed reference (1990-2015), which poses a very high soil erosion risk, even when these events are rare.
The predicted trends in temperature and precipitation are also reflected in the other calculated agrometeorological indicators on the annual, seasonal, or monthly scale based on the future scenarios, performed by the number of heat days above 35°C daily maximum temperatures (HeatD), the number of heat wave days (HeadWD), and the effective growing temperatures (EfTemp) in combination with the crop drought stress indicator as well as the water balance indicators of the three maize growing periods, respectively.
The decrease and seasonal shift in precipitation and precipitation pattern lead to a change in the seasonal number of dry days under the future climate projections (Figure 4 shown for RCP8.5), where in all months an increase is seen compared to the 1991-2020 reference period, except October and November. Especially from January till July (during SM and FM seasons) the observed period of 1991-2015 shows the lowest number of dry days, in agreement with the higher monthly precipitations. In general, the relative share of dry days per month in the seasonal cycle is the lowest during July and August (50-60%) and the highest during November-February (90-98%) in the projections of both emission scenarios.
The total annual effective solar radiation (EfRad) and the annual effective temperatures (EfTemp) showed an increased trend under the RCP4.5, relative to the reference projection of 1991-2020 (Figure 5a). In contrast, they presented a slightly decreased trend under the RCP8.5 emission scenario, due to increased drought stress conditions (see Table 1), especially during the FM season according to the increasing number of dry days in May and June.
The number of days with optimum harvest conditions (Fig. 5b) shows an increasing trend for all three maize seasons compared to the observed reference (1991-2015) but a slight decrease under the future projections compared to the projected reference period of 1991-2020. Just the FM season shows an increase (2 days) in the number of optimum harvest days under the RCP8.5 emission scenario for 2031-2060. On the other hand, the overall pattern of the number of days is unchanged with the lowest optimum harvest conditions still during the FM season under all projections, where WM and SM seasons show more than double of number of these days.
The results of the water balance indicator (WatBal) show naturally a significant difference between the summer (monsoon period) and winter (dry season) periods in general (Figure 6). The water balance of the WM season stays positive under all scenarios in the range of 150-300mm, the FM season is slightly negative only in the reference period 1991-2020 with a range over all scenarios from -50mm to 200mm and the SM season shows in all cases a negative water balance in a range of 100-250mm (see Table 2). There is a significant difference between the observed period (1991-2015) compared to the projection of a similar period (1991-2020), where the observed data show more positive water balances for the various periods. The reason is related to the mostly higher monthly precipitation during the observed period (Figure 2). Under future conditions, it is shown that an overall improvement in the water balance in comparison with the reference period projection (1991-2020) was calculated, especially strong for the summer period. Related to the maize growing seasons the WM season shows the biggest improvement under RCP4.5 and the FM season shows the biggest improvement under RCP8.5, whereas the SM season stays almost unchanged compared to the 1991-2020 projection.
The number of drought stress days (DryD) during the maize growing period is calculated from a full soil-crop water balance approach, considering actual evapotranspiration (Figure 7). Here we found the lowest number of drought stress days during the WM season and the highest (6-8-fold) number during the SM season, which is in accordance with the climatic water balance indicator (Figure 5). The projected reference period (1991-2020) shows a higher number of drought stress days in comparison with the observed period 1991-2015, which is supported by partly significantly higher monthly precipitation sums during the summer months of the observed period (Figure 2). Moreover, a slightly increasing number of drought stress days is figured out for the WM season. However, the number of drought stress days will increase significantly in the case of an additional precipitation decrease as demonstrated in the sensitivity analysis, which is shown in Figure 6 under the RCP8.5 emission scenario of the period 2031-2060 (-30%) and the period 2071-2100 (-60%). Here, under the -30% scenario, the number of drought stress days will surpass the relatively dry conditions of the 1991-2020 reference projection for SM and FM seasons, and it will strongly increase for all three maize seasons under the -60% scenario (by about 15-20 days, which is an increase of around 15-20% compared to the 1990-2020 reference). In respect to related maize yield response for the SM season, for example, up to 30% maize yield depletion was simulated for the same scenario case of a 60% precipitation decrease by Tran et al. [46].
Maize yield can be negatively affected by too high temperatures, particularly during the flowering or grain filling period [48], which can be indicated by the applied heat indicators (Figure 8, Table 2). It is shown that the number of days surpassing critical temperatures (> 35°C), (HeatD), for sensitive phenological phases, is gradually increasing towards 2100, reaching the maximum under the RCP8.5 emission scenarios. This number can rise significantly from 18 to 58 (3-fold) days on average under the worst scenario of RCP8.5 during 2071-2100. A high interannual variation of such extremes, which is between 18-81 heat stress days during the winter and spring seasons, high interannual variation of negative impacts in maize production can be expected during the summer half-year.
The number of extremely hot days is not only increasing towards 2100 but also the number of heat waves and respective heat wave days (HeatWD) shown by the daily maximum temperatures above 30°C (Figure 7). Further, high temperatures during the night lead to a higher respiration loss for many crops, resulting in lower productivity and decreasing potential yields.
4. Discussion
Our results indicate significant changes in temperature and precipitation patterns under the applied future climate scenarios, which will directly impact agricultural productivity in Thai Nguyen Province. The increasing temperature and its linked potential evaporation trend aligns with global climate change projections, with more frequent and intense heat waves and droughts expected globally [24] as well as already observed [42] and predicted under climate scenarios of the next decades for Northern Vietnam [33]. The rising number of heat stress days (HeatD) and heat wave days (HeatWD) under RCP8.5 suggest potential risks to crop yields, particularly for the heat-sensitive growth stages of maize, e.g. during anthesis and grain filling. With respect to the regional main maize growing seasons, we assess the potential changes and consequences in agrometeorological conditions and risks for maize by the indicators applied in our study (Table 3).
The projected decrease in precipitation, especially during the critical growing months for forage maize (FM) (May to July), highlights the potential for increased drought stress. The shifting precipitation patterns, with wetter conditions from July to August, suggest possible adjustments in cropping calendars to optimize water availability. However, the uncertainty in precipitation pattern projections [33,35], leads to the conclusion that adaptive water management strategies are necessary to mitigate risks caused by changing rainfall patterns.
The predicted increase in drought stress days (DryD), supported also by e.g. [33] suggests that future cropping systems will need to incorporate drought-resistant varieties and improved irrigation practices, especially for the SM season. The decrease in water balance (WatBal) especially during the spring maize (SM) season compared to the observed weather reinforces the need for efficient water resource management to counteract increasing evapotranspiration rates under warmer conditions.
The projected increase in very heavy rainfall events (> 150mm d-1) compared to the observed reference in our study is in line with other recent studies of increasing extreme heavy precipitation events. Such as Raghavan et al. [36] who show an increase in 90th percentile precipitation over the Northern Provinces of Vietnam of 15-25% for the period 2061-2090 under the A1B scenario ensemble. Another actual study [28] shows a consistent increase in East Asian Summer Monsoon (June-August) rainfall under CMIP6, in particular in the southeast region of China, neighboring our study region. It suggests that especially the hilly regions of the Thai Nguyen and neighboring Provinces may experience significant increasing risk of soil erosions and land slide in the future. However, Ngo-Duc [32] reported a decrease in heavy precipitation events in Northern Vietnam stations over the past decades but an increase in rainfall intensity particularly in the dry season, which could be related to the impact of tropical storm patterns over past decades [35].
On the other hand, the increasing number of drought stress days in part of the year, which is supported by other studies as well [35,36] for large parts of Northern Vietnam, will lead to more water shortages in critical maize growth periods. The seasonal shift in precipitation, with more dry periods in early summer and wetter conditions later, will require adjustments in planting schedules and soil moisture conservation techniques. Further, an increasing risk for N-leaching can be expected under the wetter conditions for the WM season, requiring adaptations in fertilization schemes. The findings on heat stress indicators (HeatD and HeatWD) highlight the vulnerability of maize and many other crops to prolonged high temperatures. The increase in extreme heat events especially during the FM season (part of the warmest period of the year), particularly during the anthesis of maize, led to the reduced number of grains as well as afterward to reduced grain filling, yield reduction, and accelerated senescence under high temperatures.
Feasible adaptation measures need to be developed and implemented in view of these potential impacts on maize and crop production in Northern Vietnam [43]. Such are the development of more heat-tolerant cultivars, altered planting dates and growing periods, and improved soil moisture retention techniques. Measures against soil erosion, for example by the establishment of Agroforestry Systems, will be essential to sustain maize productivity in Northern Vietnam under these scenarios.
Overall, the study underscores the importance of adaptive agricultural strategies in response to climate change. Farmers and policymakers should focus on resilient cropping systems, efficient water use, and sustainable land management practices to mitigate the negative impacts of changing climate conditions.
5. Conclusions
Under the applied future climate scenarios, a consistent warming trend is shown in combination with a decrease in annual precipitation of about 15% (compared to current conditions) towards the end of the century, particularly under the RCP8.5 emission scenario. In combination with increased potential evapotranspiration, this would lead to an increase in drought stress days for maize and affect especially the SM growing season towards the end of the century under our scenarios. Further, a shift in projected seasonal precipitation patterns is also projected and reflected in changing agrometeorological conditions such as the decreasing effective solar radiation and an increasing number of drought stress days also in the FM season.
Meanwhile, the projected increase of very heavy rain events will heighten the risk of landslide, soil erosion, and nutrient leaching compared to current and past periods. Furthermore, the gradually and significantly increasing number of extremely hot days will likely lead to greater interannual yield fluctuations for maize (and other crops), causing fertility disturbances or direct yield reductions due to reduced biomass accumulation.
Potential regional adaptation measures for crop production include the development of adapted crop rotation schemes, implementation of soil protection measures, exploring crop selection and breeding options, the establishment of Agroforest Systems, and other strategies.
The limitations and uncertainties of our study should be considered for further assessments. These are mainly related to a low number of available in-situ data on weather, soil, and crop conditions as well as the availability of only one regionalized climate model run. Future research should therefore address especially the use of a higher number of scenarios (ensembles) to better assess the range of uncertainties. Moreover, there is a need for an extension of related analysis to larger areas but with a high spatial resolution to address representative local farming conditions in the complex terrain such as in Northern Vietnam.
6. Patents
This section is not mandatory but may be added if there are patents resulting from the work reported in this manuscript.
Supplementary Materials
The following supporting information can be downloaded at the website of this paper posted on Preprints.org, Table S1: Drought stress days (DryD - Number of days within the given periods); Table S2: Water balance (WatBal - in mm within the given periods); Table S3: Optimum harvest days (OHarvD - number of days in given month); Table S4: Effective growing temperature (EfTemp - mean annual temperature sums in °C); Table S5: Effective solar radiation (EfRad - mean annual sum in MJ/m²); Table S6: Heat stress days (HeatD - mean annual number of days >35°C); Table S7: Heat wave days (HeatWD - mean annual number of consecutive days >30°C).
Author Contributions
Conceptualization, methodology, Thi Mai Anh Tran and Josef Eitzinger; data curation, Thi Mai Anh Tran; writing—original draft preparation, Thi Mai Anh Tran; writing—review and editing, Josef Eitzinger, Quynh Giang Van, Anh Quan Duong and Hung Tien Luong; project administration,Thi Mai Anh Tran. All authors have read and agreed to the published version of the manuscript.
Funding
This research received no external funding.
Data Availability Statement
Bias corrected data sets of the applied climate scenarios are available on request.
Acknowledgments
The author appreciates the Faculty of Agriculture, University of Novi Sad (Serbia) as well as Mendel University Brno, Czech Republic (providing AGRICLIM model) for technical support. The Institute of Meteorology, University of Natural Resources and Applied Sciences, Vienna, Austria, is also thanked for providing climate change scenarios data and technical support. Besides, facilities in research from Thai Nguyen University of Agriculture and Forestry (Vietnam) are greatly acknowledged.
Conflicts of Interest
The authors declare no conflicts of interest.
References
- Alexandrov, V.A.; Hoogenboom, G. The impact of climate variability and change on crop yield in Bulgaria. Meteorology 2000, 104, 315-327. [CrossRef]
- Allan, G. R.; Pereira, S. L.; Raes, D.; Smith, M. Crop Evapotranspiration – Guidelines for Computing Crop Water Requirements - FAO Irrigation and drainage paper 56. 1998. Fao, Rome 300, D05109, ISBN 92-5-104219-5.
- Ammani, A.A.; Ja’afaru, A.K.; Aliyu, J.A.; Arab, A.I. Climate change and maize production: Empirical Evidence from Kaduna State, Nigeria. J. Agric. Ext. 2012, 16, 1-8. [CrossRef]
- Arora, V.K.; Gajri, P.R. Assessment of a crop growth-water balance model for predicting maize growth and yield in a subtropical environment. Agric. Water Manag. 2000, 46, 157-166. [CrossRef]
- Bacsi, Z.; Thorton, P.K.; Dent, J. B. Impacts of future climate change on Hungarian crop production: an application of crop growth simulation models. Agric. Syst. 1991, 37, 435-450. [CrossRef]
- Benjamin, K. K.; Lakit, K.; Richard, K.; Philip, L. Modeling impacts of climate change on maize (Zea mays L.) growth and productivity: A review of models, outputs, and limitations. J. Geosci. Environ. Prot. 2019, 7, 76-95. [CrossRef]
- Blanc, E. The Impact of Climate Change on Crop Yields in Sub-Saharan Africa. Am. J. Clim. Change 2012, 1, 1-13. [CrossRef]
- Christensen, O.B.; Drews, M.; Hesselbjerg Christensen, J.; Dethloff, K.; Ketelsen, K.; Hebestadt, I.; Rinke, A. The HIRHAM Regional Climate Model. Version 5 (beta); Danish Meteorological Institute: Copenhagen, Denmark, 2007; Technical Report No. 06-17. Available online: http://www.dmi.dk/dmi/tr06-17 (accessed March 14, 2025).
- Christensen, O.B.; Gutowski, W.J.; Nikulin, G.; Legutke, S. CORDEX Archive Design, version 3.0. Link: https://cordex.org/data-access (accessed March 14, 2025).
- Dana, S.; Kyu-Jong, L.; Byun-Who, L. Response of phenology and yield-related traits of maize to elevated temperature in a temperate region. Crop J. 2020, 5, 305-316. [CrossRef]
- Dang, A.M.; Pham, Q.H. Đánh giá ảnh hưởng của biến đổi khí hậu đến sản xuất lúa, ngô tỉnh Thái Bình. Viet. J. Agric. Sci. Technol. 2018, 6, 22-27. Available online: http://tapchi.hunre.edu.vn/index.php/tapchikhtnmt/article/view/293 (accessed March 14, 2025).
- Dang, T.H.; Tran, D.T.; Nguyen, T.K.; Mai, X.T.; Roberta, V.G.; Prabhu, L.P. Maize in Vietnam: Production Systems, Constraints, and Research Priorities; CIMMYT: Mexico, 2004.
- Doug, G. A.; Keith, L. B. Maize seedling response to the soil environment at varying distances from a mulched soil-bare soil boundary. Soil Tillage Res. 1990, 15, 205-216. [CrossRef]
- Eitzinger, J.; Daneu, V.; Kubu. G.; Thaler, S.; Trnka, M.; Schaumberger, A.; Schneider. S.; Tran, T.M.A. Grid based monitoring and forecasting system of cropping conditions and risks by agrometeorological indicators in Austria – Agricultural Risk Information System ARIS. Clim. Serv. 2024, 34, 100478. [CrossRef]
- Eitzinger, J.; Thaler, S.; Schmid, E.; Strauss, F.; Ferrise, R.; Moriondo, M., Çaylak, O. Sensitivities of crop models to extreme weather conditions during flowering period demonstrated for maize and winter wheat in Austria. J. Agric. Sci. 2013, 151, 813-835. http://doi.org/10.1017/S0021859612000779.
- Eitzinger, J.; Trnka, M.; Hösch, J.; Žalud, Z.; Dubrovský, M. Comparison of CERES, WOFOST, and SWAP models in simulating soil water content during growing season under different soil conditions. Ecol. Model. 2004, 171, 223–246. http://doi.org/10.1016/j.ecolmodel.2003.08.012.
- Ethan, E.B.; Peter, H. Adaptation of US maize to temperature variation. Nat. Clim. Change 2012, 3, 68-72. [CrossRef]
- FAO. FAO Statistical Pocketbook 2015: World food and agriculture. FAO: Rome, Italy, 2015. Available online: http://doi.org/978-92-5-108802-9.
- Ferreya, R. A.; Guillermo, P. P.; Carlos, D. M.; David, L.; Julio. D.; Edgardo, G.; Santiago, M. A linked-modeling framework to estimate maize production risk associated with ENSO-related climate variability in Argentina. Agric. For. Meteorol. 2001, 107, 177-192. [CrossRef]
- General Statistics Office. Agriculture, Forestry and Fishery 2024. Available online: https://www.gso.gov.vn/en/statistic-book/.
- Ho, T.M.H; Phan, T.V.; Le, N.Q.; Nguyen, Q.T. Extreme climatic events over Vietnam from observational data and RegCM3 projections. Clim. Res. 2011, 49, 87-100. https://www.int-res.com/articles/cr2012/49/c049p087.pdf.
- Hoang, H.C.; Maho, T.; Dang. V.M.; Yumei. K.; Kozo, I.; Sota, T. Soil physicochemical properties in a high-quality tea production area of Thai Nguyen Province in the northern region of Vietnam. Soil Sci. Plant Nutr. 2018, 65, 78-81. [CrossRef]
- IPCC. Climate Change 2013: The Physical Science Basis; Cambridge University Press: Cambridge, UK, and New York, NY, USA, 2013, 1535 pp. Available online: https://www.ipcc.ch/report/ar5/wg1/.
- IPCC. Summary for Policymakers. In: Climate Change 2023: Synthesis Report; IPCC: Geneva, Switzerland, 2023, 1–34. Available online: . [CrossRef]
- Ishfaq, A.; Munhanmad, H. R.; Shakeel, A.; Jamshad, H.; Asmat, U.; Jasmeet, J. Assessing the impact of climate variability on maize using simulation modelling under semi-arid environment of Punjab, Pakistan. Environ. Sci. Pollut. Res. 2018, 25, 28413-28430. https://link.springer.com/article/10.1007/s11356-018-2884-3.
- ISPONRE. Vietnam Assessment Report on Climate Change (VARCC); ISPONRE: Vietnam, 2009. Available online: https://wedocs.unep.org/20.500.11822/7940.
- Jones, G. P.; Thornton, K. P. The potential impacts of climate change on maize production in Africa and Latin America in 2055. Glob. Environ. Change 2003, 13, 51-59. [CrossRef]
- Katzenberger, A.; Levermann, A. Consistent increase in East Asian Summer Monsoon rainfall and its variability under climate change over China in CMIP6, Earth Syst. Dynam. 2024, 15, 1137–1151. [CrossRef]
- Keil, A.; Saint-Macary, C.; Zeller, M. Maize Boom in the Uplands of Northern Vietnam: Economic Importance and Environmental Implications; Research in Agricultural & Applied Economics, Discussion Paper No. 4/2008; University of Hohenheim: Germany, 2008.
- Kottek, M.; Grieser, J.; Beck C.; Rudolf B. Rubel F. World Map of the Köppen-Geiger climate classification updated. Meteorol. Z. 2006, 15, 259-263. DOI: 10.1127/0941-2948/2006/0130.
- Lizaso, J. I.; Ruiz-Ramos, M.; Rodríguez, L.; Gabaldon-Leal, C.; Oliveira, J. A.; Lorite, I. J.; Rodríguez, A. Impact of high temperatures in maize: Phenology and yield components. Field Crops Res. 2018, 216, 129–140. http://doi.org/. [CrossRef]
- Ngo-Duc, T. Rainfall extremes in Northern Vietnam: a comprehensive analysis of patterns and trends. Vietnam J. Earth Sci. 2023, 45, 183–198. [CrossRef]
- Nguyen-Ngoc-Bich, P.; Phan-Van, T.; Ngo-Duc, T.; Vu-Minh, T.; Trinh-Tuan, L.; Tangang, F. T.; Juneng, L.; Cruz, F.; Santisirisomboon, J.; Narisma, G.; Aldrian, E. Projected evolution of drought characteristics in Vietnam based on CORDEX-SEA downscaled CMIP5 data. Int. J. Climatol. 2021, 41, 5733-5751. [CrossRef]
- Oludare, S.D; Khaldoon, A. M. Modeling maize yield and water requirements under different climate change scenarios. Climate 2020, 8, 1-27. [CrossRef]
- Pham, T.H.; Ngo, D.T.; Matsumoto, J.; Phan, V.T.; Vo. V.H. Rainfall trends in Vietnam and their associations with tropical cyclones during 1979–2019. Sci. Online Lett. Atmos. 2020, 16, 169–174. [CrossRef]
- Raghavan, S. V.; Vu, M. T.; Liong, S. Y. Ensemble climate projections of mean and extreme rainfall over Vietnam. Glob. Planet. Change 2017, 148, 96-104. [CrossRef]
- Rubel, F.; Kottek, M. Observed and projected climate shifts 1901-2100 depicted by world maps of the Köppen-Geiger climate classification. Meteorol. Z. 2010, 19, 135-141. DOI: 10.1127/0941-2948/2010/0430.
- Rutten, M.; Dijk, M.V.; Rooij, V.W.; Hilderink, H. Land Use Dynamics, Climate Change, and Food Security in Vietnam: A Global-to-local Modeling Approach. World Dev. 2014, 59, 29-46. [CrossRef]
- Samuel, A.G.; Clement, A.; Desmond, M.; Bernice, A.; Florence, A.K. Exploring the optimal climate conditions for maximum maize production in Ghana: Implications for food security. Smart Agric. Technol. 2023, 6, 100370. [CrossRef]
- Shim, D.; Lee, K. J.; Lee, B. W. Response of phenology- and yield-related traits of maize to elevated temperature in a temperate region. Crop J. 2017, 5, 305–316. http://doi.org/10.1016/j.cj.2017.01.004.
- Statista, 2025, Link: https://www.statista.com/statistics/671353/production-of-maize-in-vietnam (accessed March 14, 2025).
- Stojanovic, M.; Liberato, M.L.R.; Sorí, R.; Vázquez, M.; Phan-Van, T.; Duongvan, H.; Hoang Cong, T.; Nguyen, P.N.B.; Nieto, R.; Gimeno, L. Trends and Extremes of Drought Episodes in Vietnam Sub-Regions during 1980–2017 at Different Timescales. Water 2020, 12, 813. [CrossRef]
- Tran, C.U.; Limnirankul, B.; Chaovanapoonphol. Y. Factors impact on Farmers’ Adaptation to Drought in Maize Production in Highland Area of Central Vietnam. Agric. Agric. Sci. Procedia 2015, 5, 75-82. [CrossRef]
- Tran, D. H.; Tran, H. T. Đánh giá tác động của biến đổi khí hậu đến năng suất và thời gian sinh trưởng của một số cây trồng nông nghiệp ở Đà Nẵng. J. Hydrometeorol. Viet. 2014, 645, 41-45. http://tapchikttv.vn/article/415.
- Tran, T.K.; Hoang, M.C.; Luu. T.X.; Nguyen, T.Q.; Nguyen, T.M.T. Kết quả khảo nghiệm một số giống ngô lai tại tỉnh Hà Giang. Thai Nguyen Univ. J. Sci. Technol. 2012, 197, 101-106. Available at: https://jst.tnu.edu.vn/jst/article/view/956/pdf.
- Tran, T.M.A.; Eitzinger, J.; Manschadi, A.M. Response of maize yield under changing climate and production conditions in Vietnam. Ital. J. Agrometeorol. 2020, 25, 73-84. [CrossRef]
- Trnka, M.; Olesen, J.E.; Kersebaum, K.C.; Skjelvag, A.O.; Eitzinger, J.; Seguin, B.; Peltonen-Sainio, P.; Orlandini, S.; Dubrovsky, M.; Hlavinka, P.; Balek, J.; Eckersten, H.; Cloppet, E.; Calanca, P.; Rotter, R.; Gobin, A.; Vucetic, V.; Nejedlik, P.; Kumar, S.; Lalic, B.; Mestre, A.; Rossi, F.; Alexandrov, V.; Kozyra, J.; Olesen, E.J.; Kersebaum. C.K.; Skjelvag, D.A. Agroclimatic conditions in Europe under climate change. Glob. Change Biol. 2011, 17, 2298-2318. [CrossRef]
- Velde, V.D.M.; Wriedt. G.; Bouraoui, F. Estimating irrigation use and effects on maize yield during the 2003 heatwave in France. Agric. Ecosyst. Environ. 2010, 135, 90–97. [CrossRef]
- Yanling, S.; Hans, W.L.; Yi, L.; Jinxia, X.; Guangsheng, Z. Climatic causes of maize production loss under global warming in Northeast China. Sustainability 2020, 12, 1-13. https://doi.org /10.3390/su12187829.
Figure 1.
The target region of our study, Thai Nguyen Province, Vietnam.
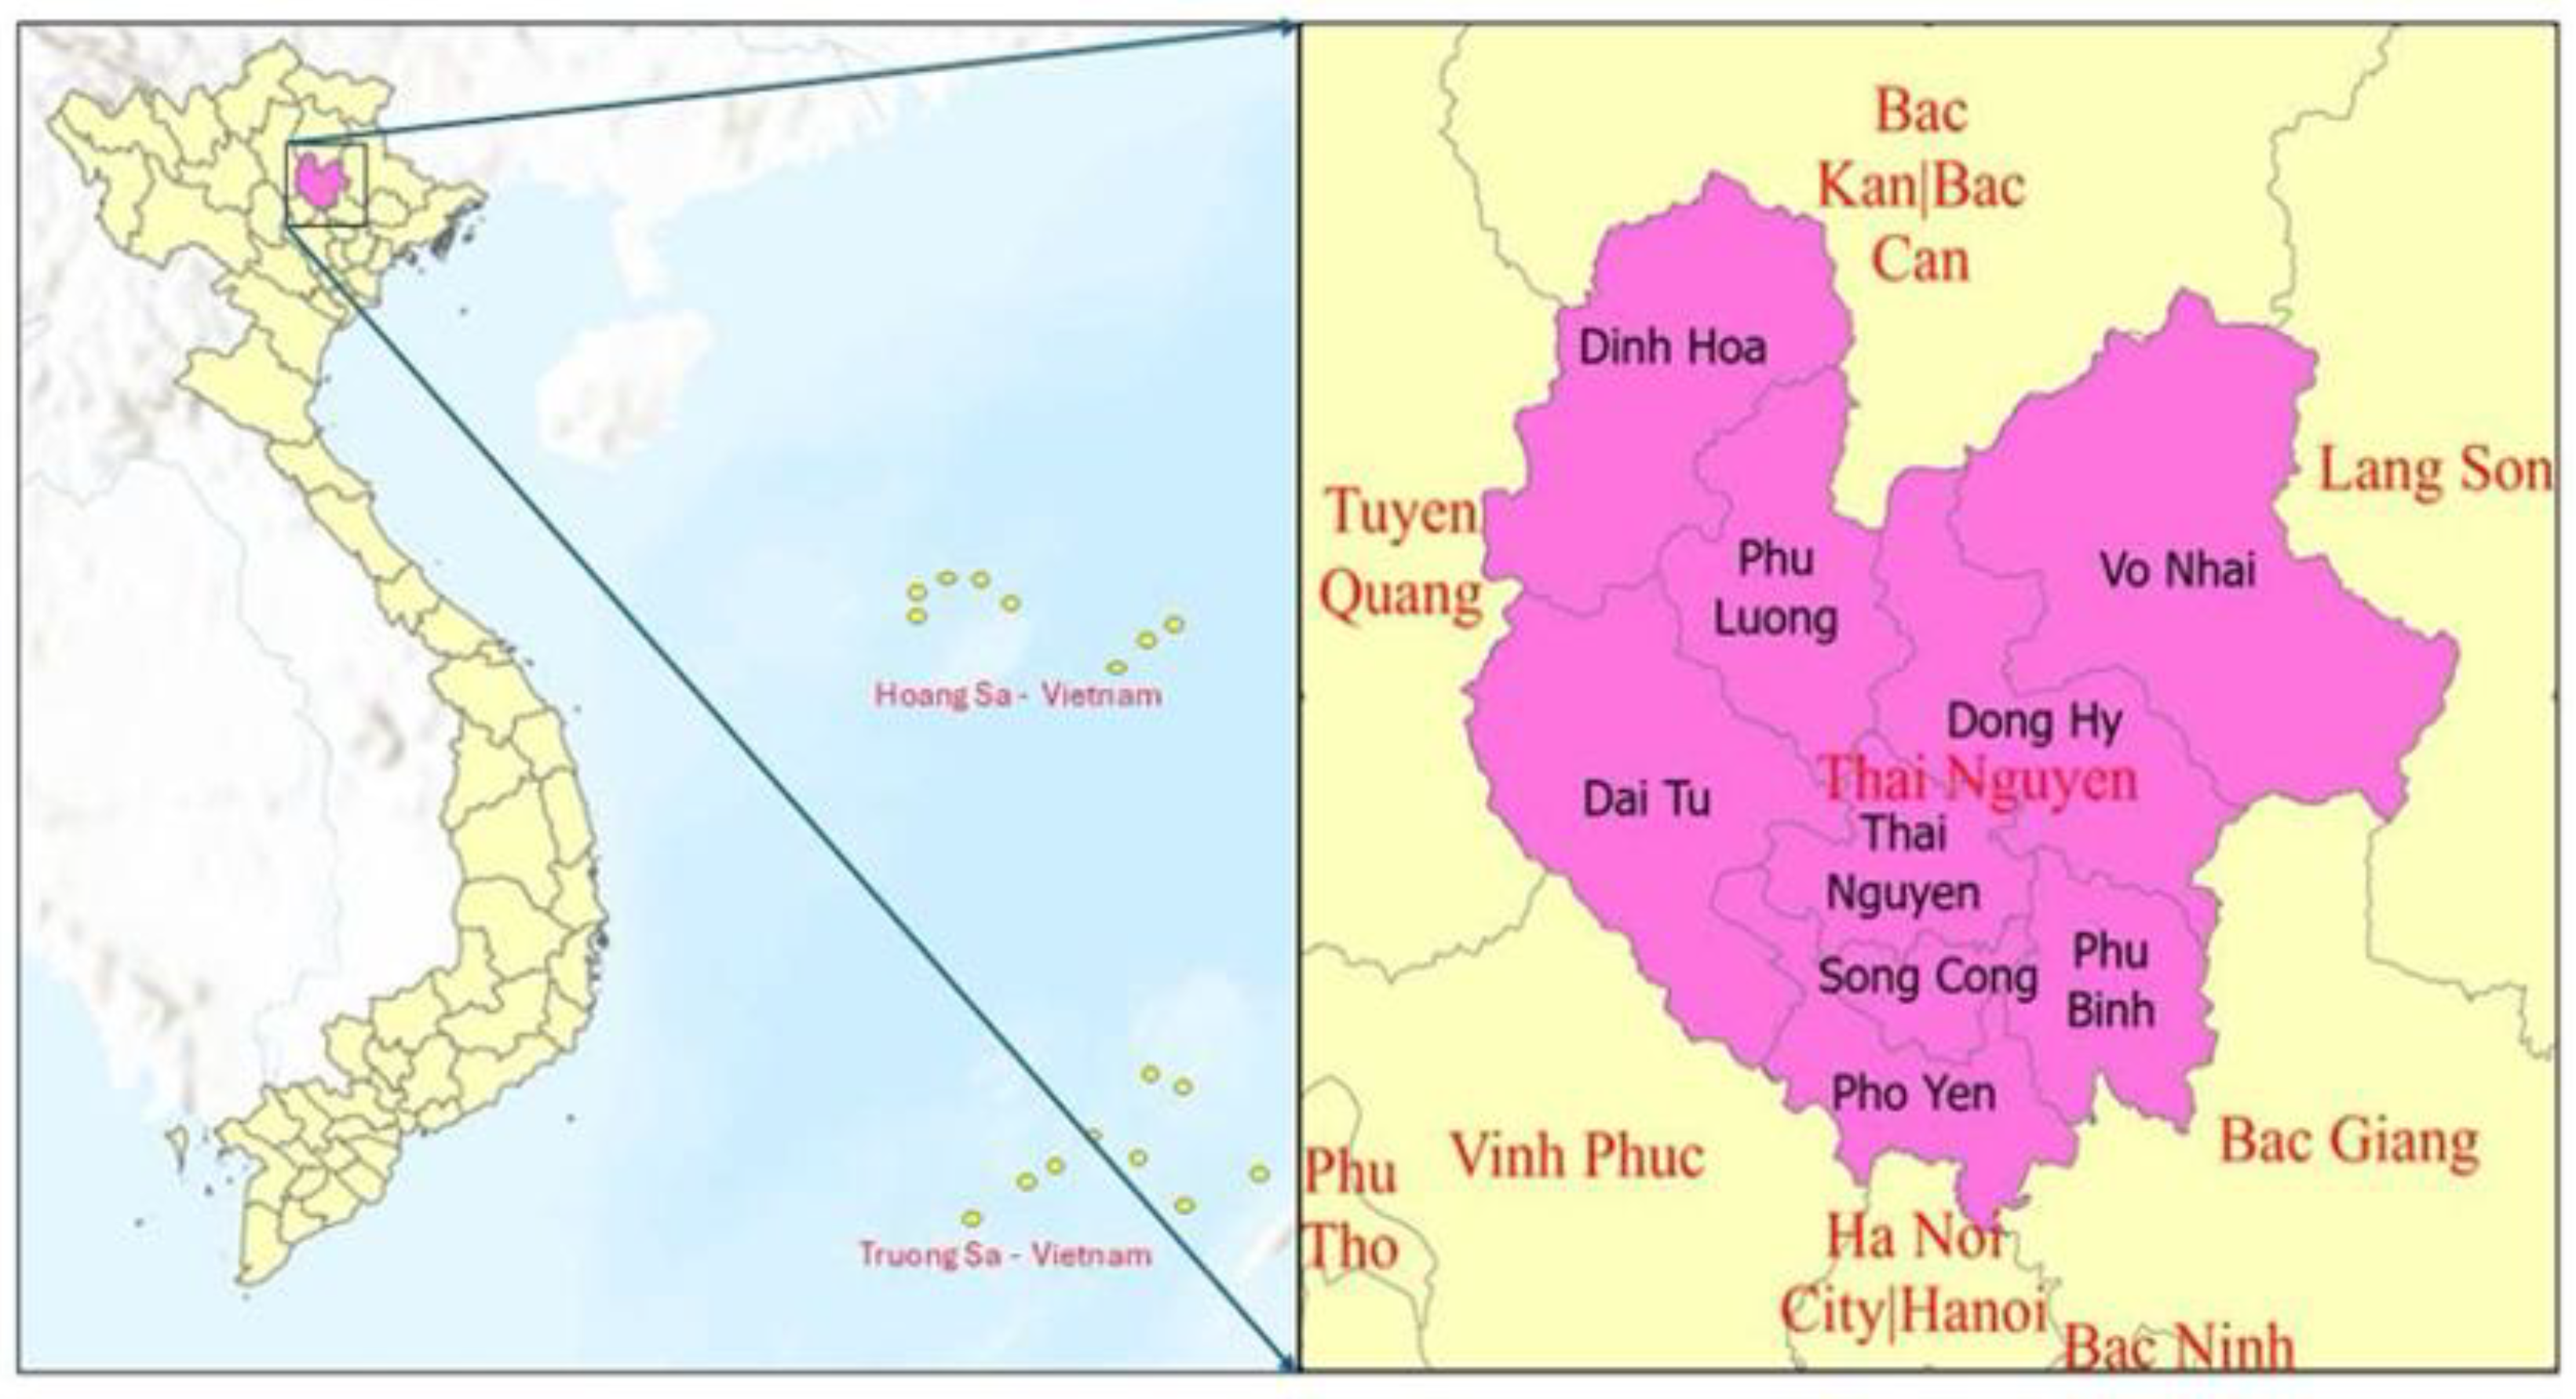
Figure 2.
The average monthly precipitation under different climatic conditions in Thai Nguyen Province, Vietnam.
Figure 2.
The average monthly precipitation under different climatic conditions in Thai Nguyen Province, Vietnam.
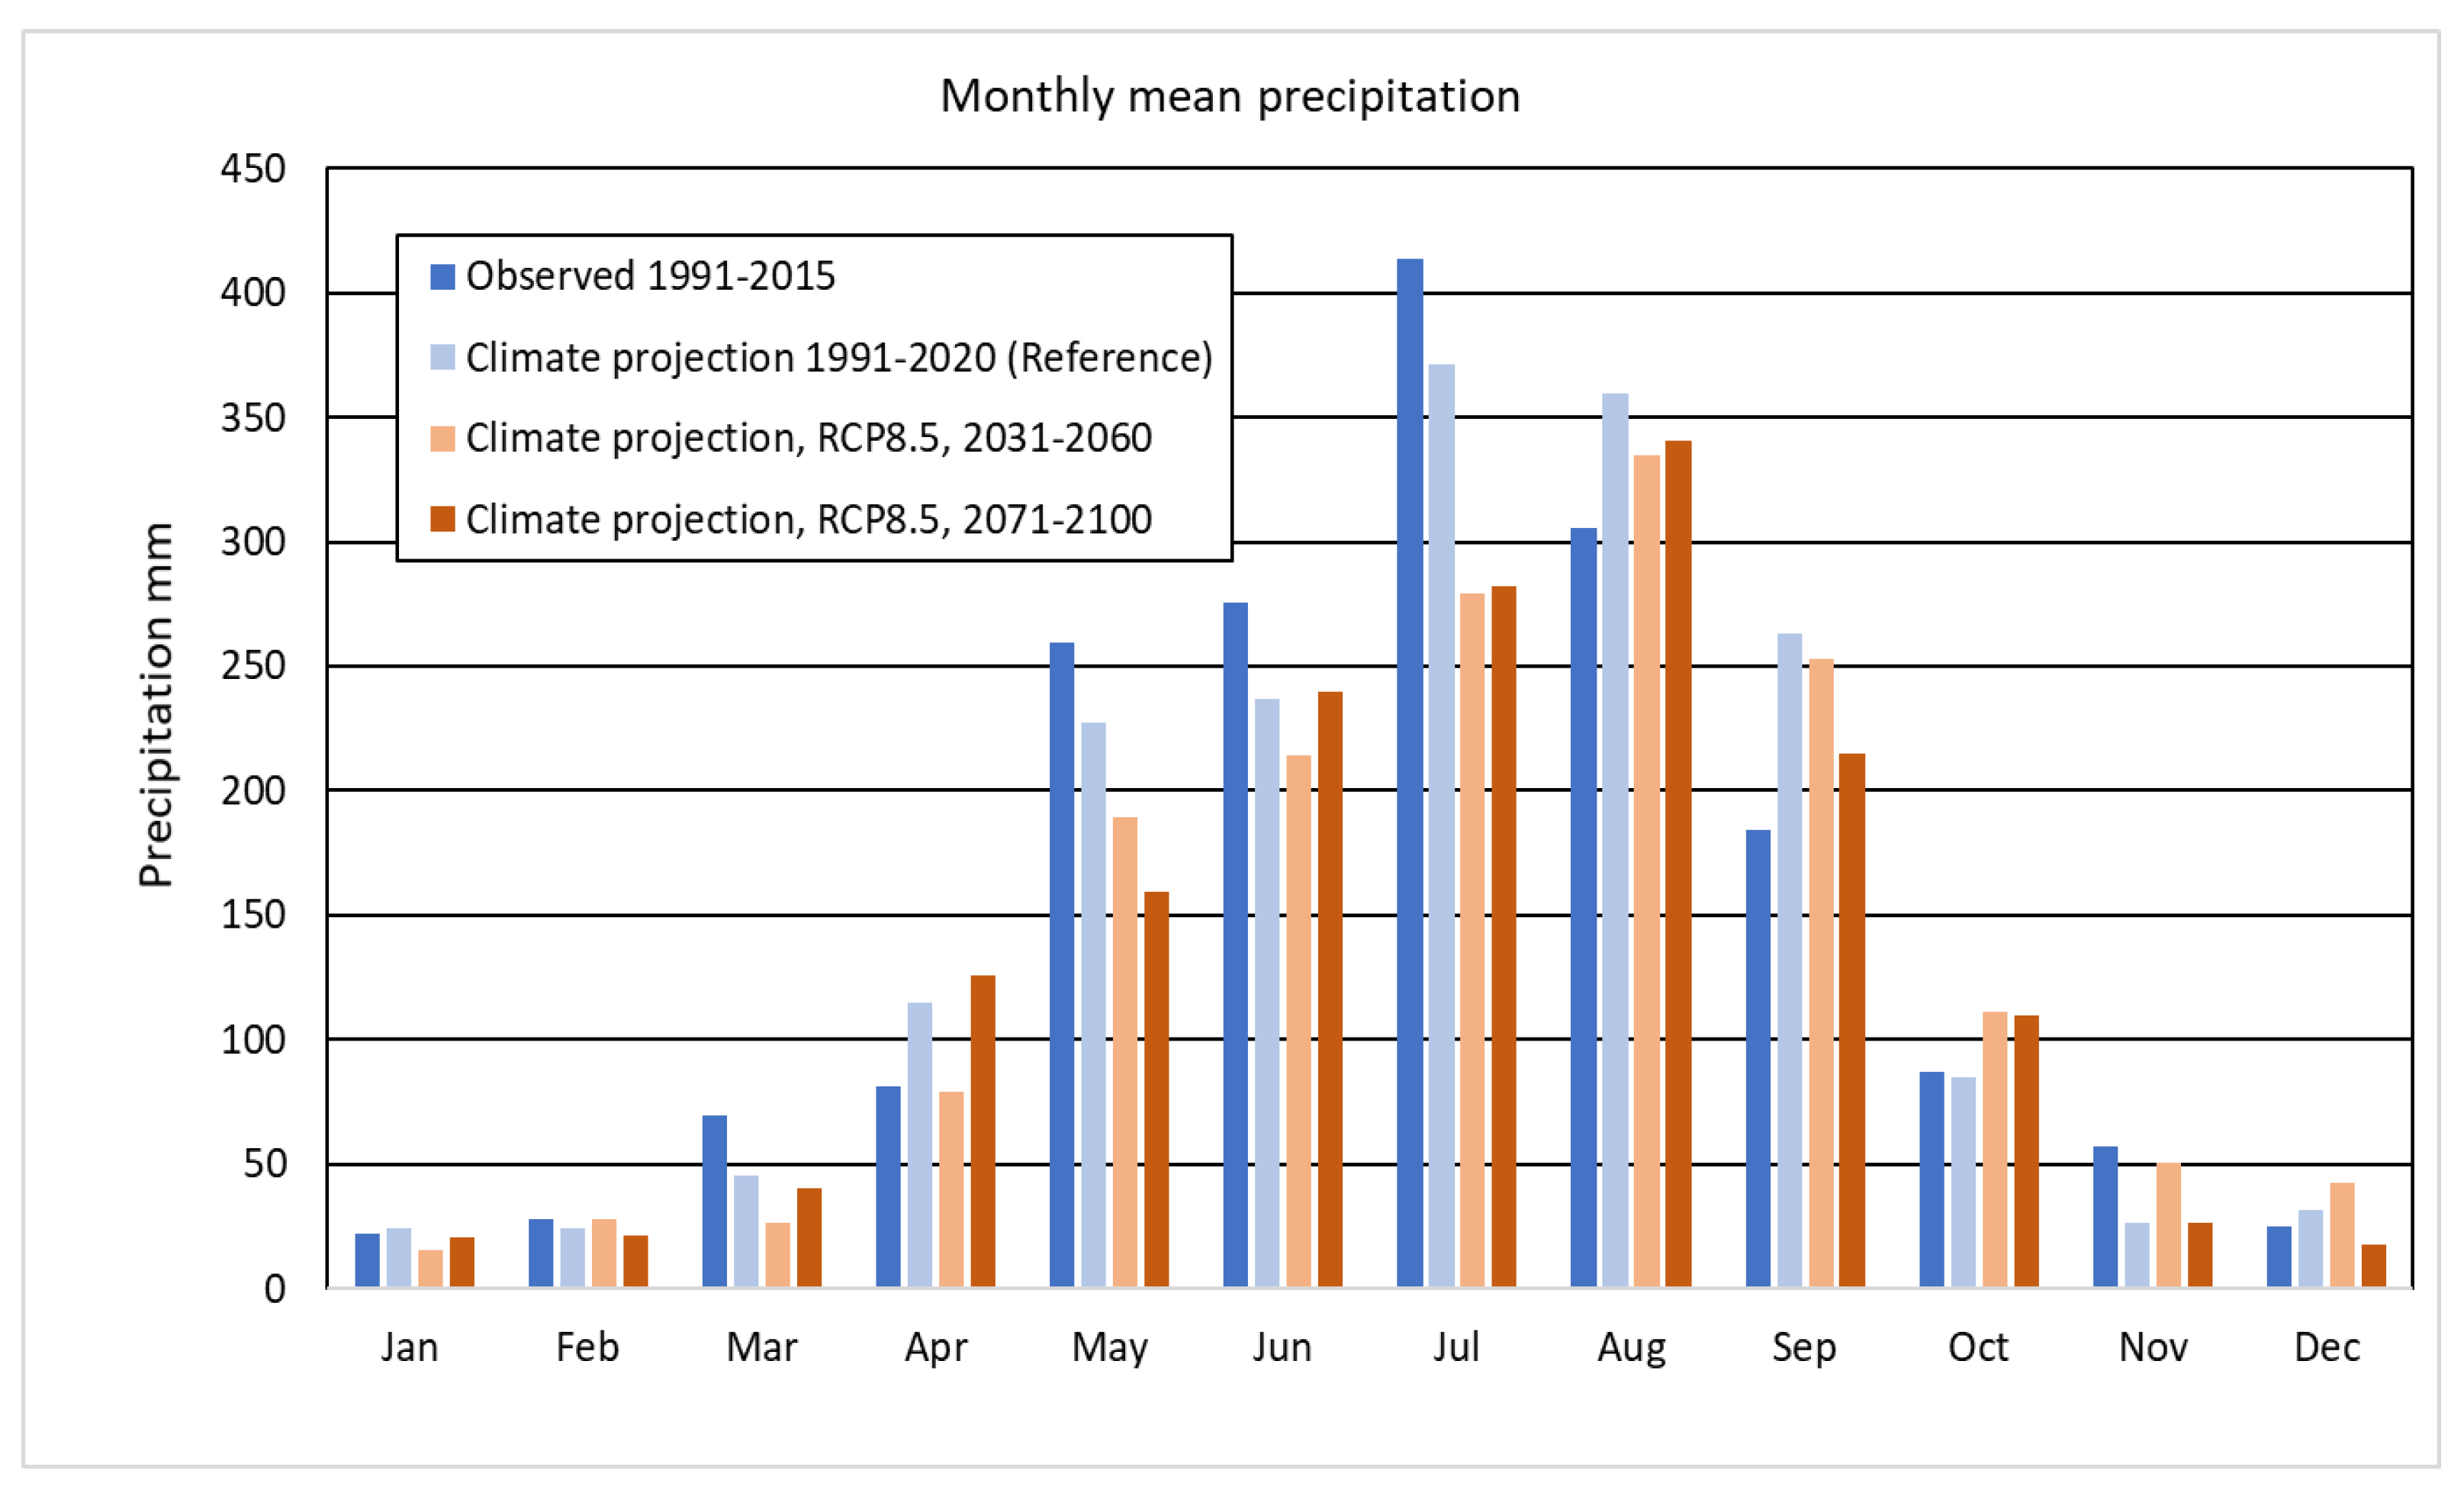
Figure 3.
a-d. The number of daily rainfall events, their classification, and probabilities (percentiles) under (a) observed (1991-2015), (b) projected reference (1991-2020), and (c-d) future projected climate periods (2031-2060 and 2071-2100) under the RCP8.5 scenario.
Figure 3.
a-d. The number of daily rainfall events, their classification, and probabilities (percentiles) under (a) observed (1991-2015), (b) projected reference (1991-2020), and (c-d) future projected climate periods (2031-2060 and 2071-2100) under the RCP8.5 scenario.
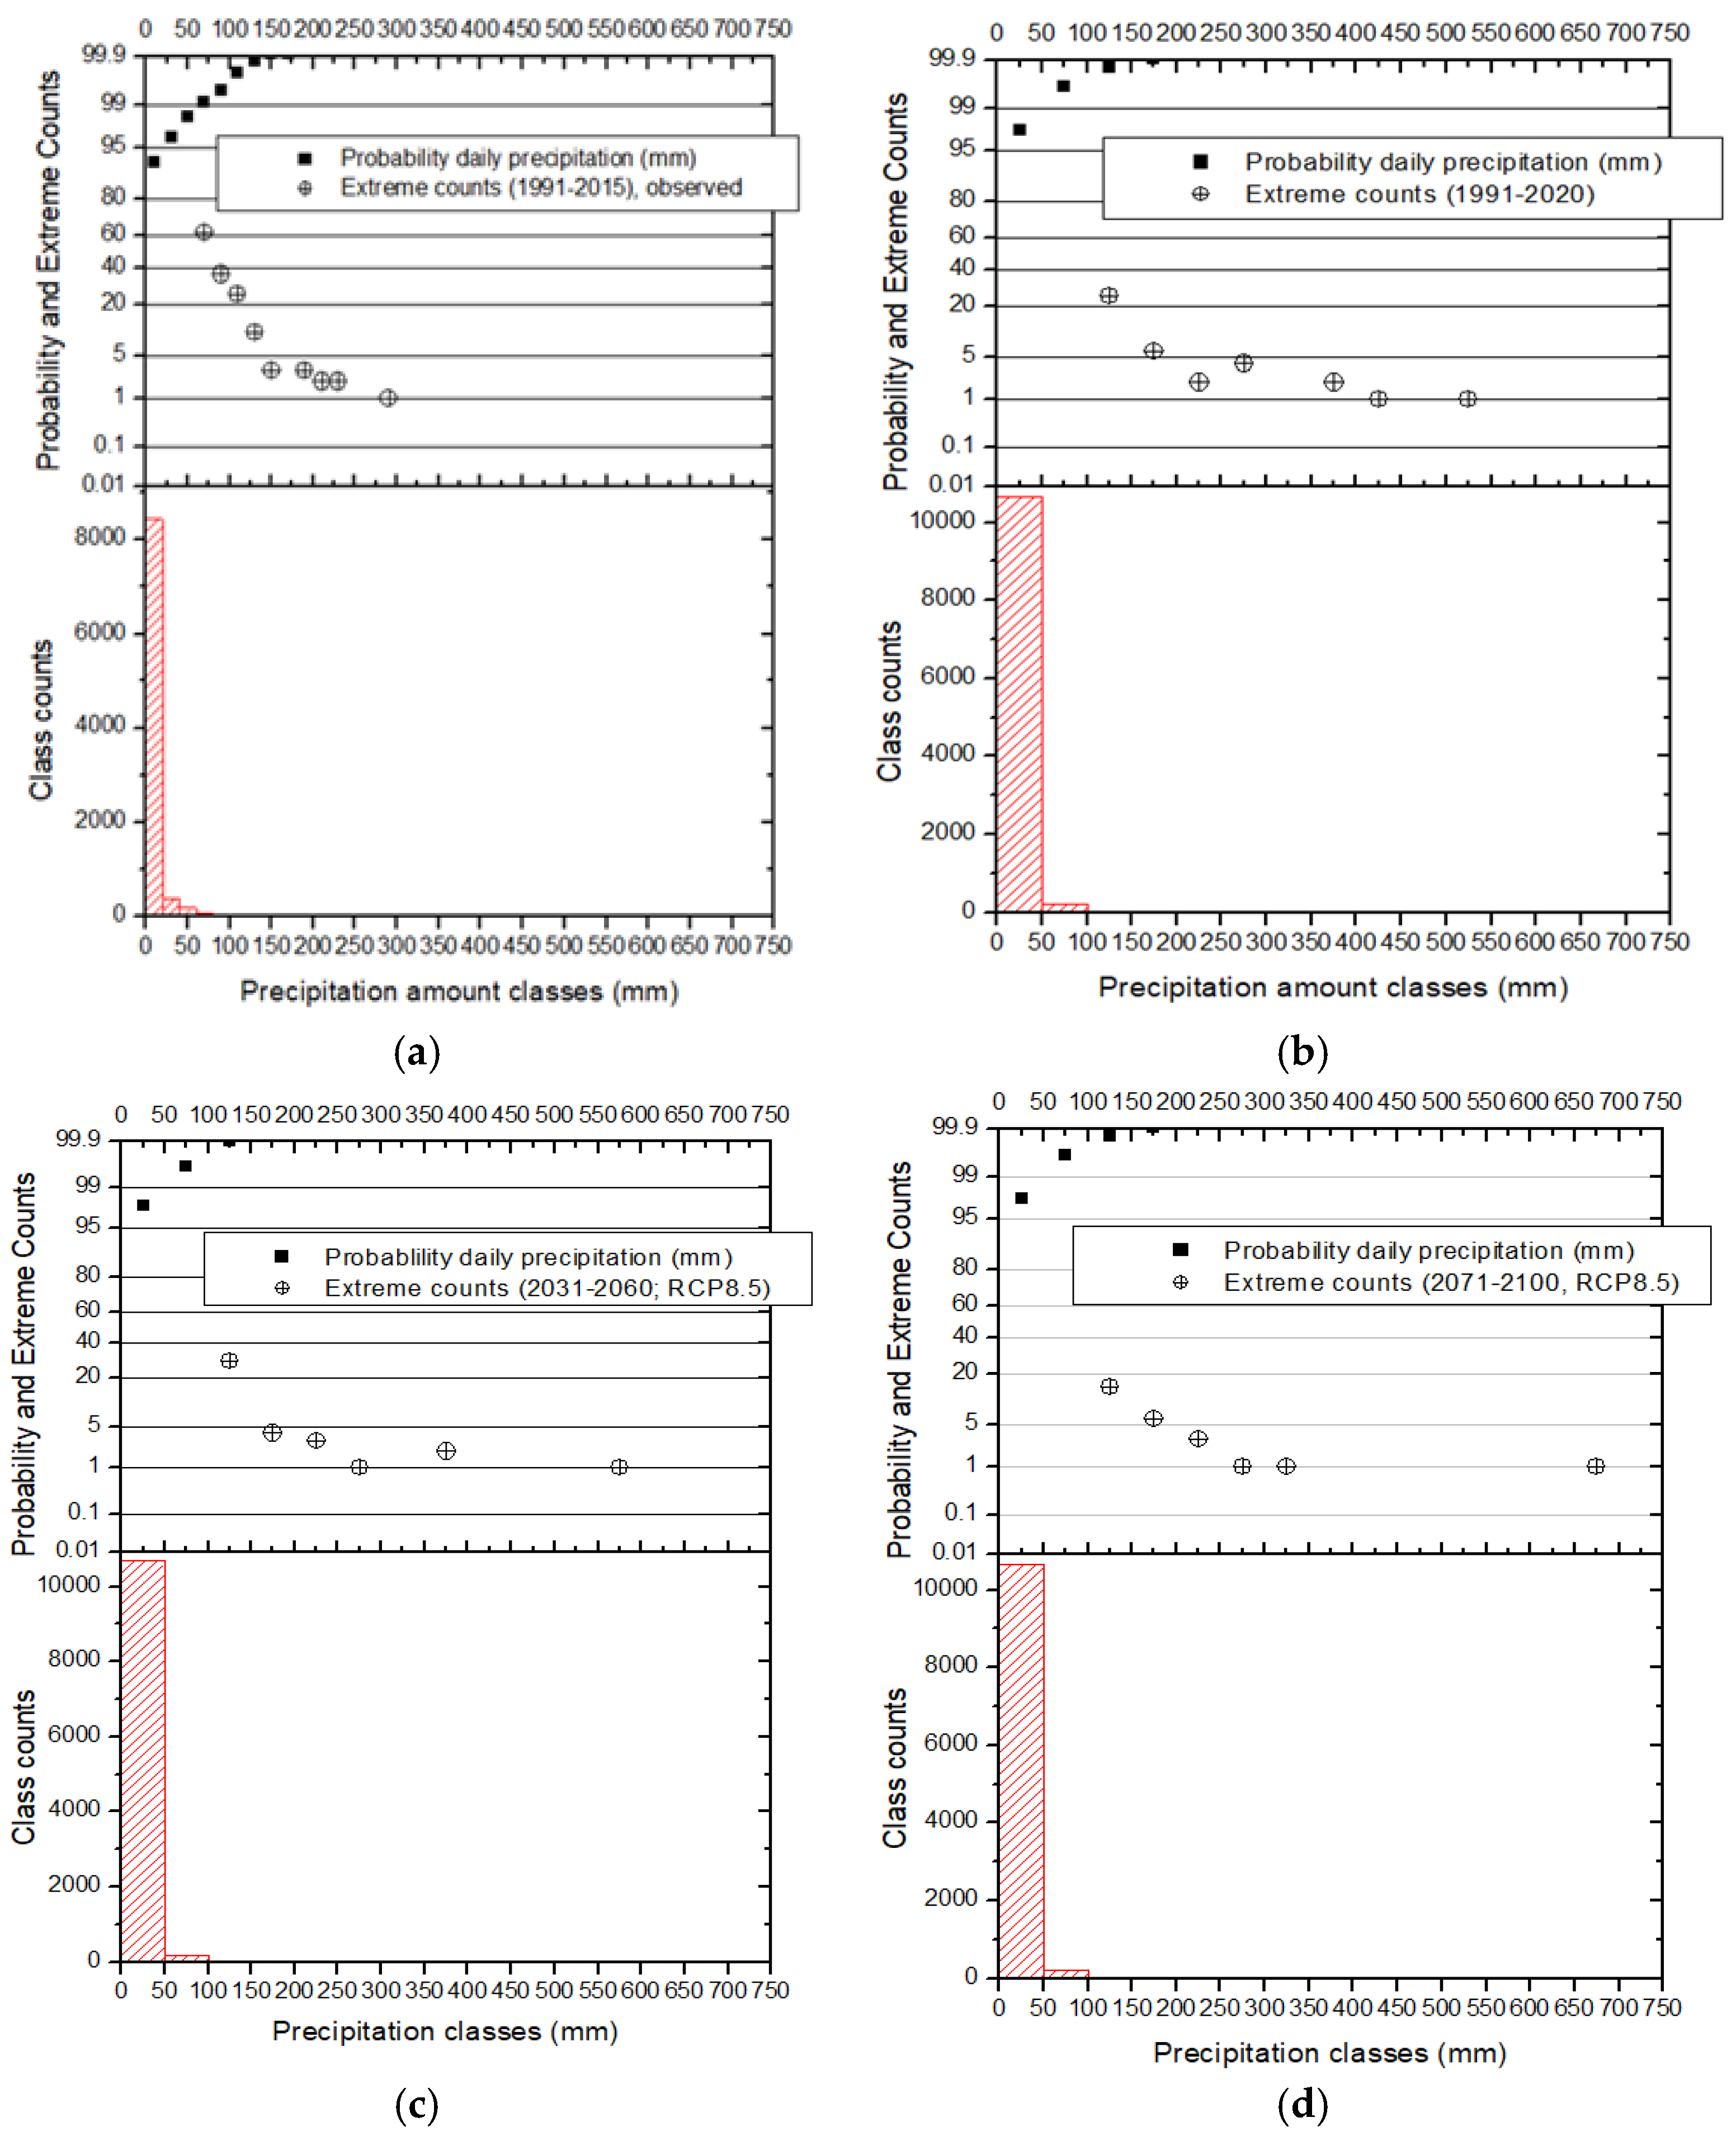
Figure 4.
The relative share of dry days (days without precipitation) per month in Thai Nguyen Province, Vietnam for the RCP8.5 emission scenarios vs. observed and reference period (see Table S1 - Supplement for RCP4.5 results).
Figure 4.
The relative share of dry days (days without precipitation) per month in Thai Nguyen Province, Vietnam for the RCP8.5 emission scenarios vs. observed and reference period (see Table S1 - Supplement for RCP4.5 results).
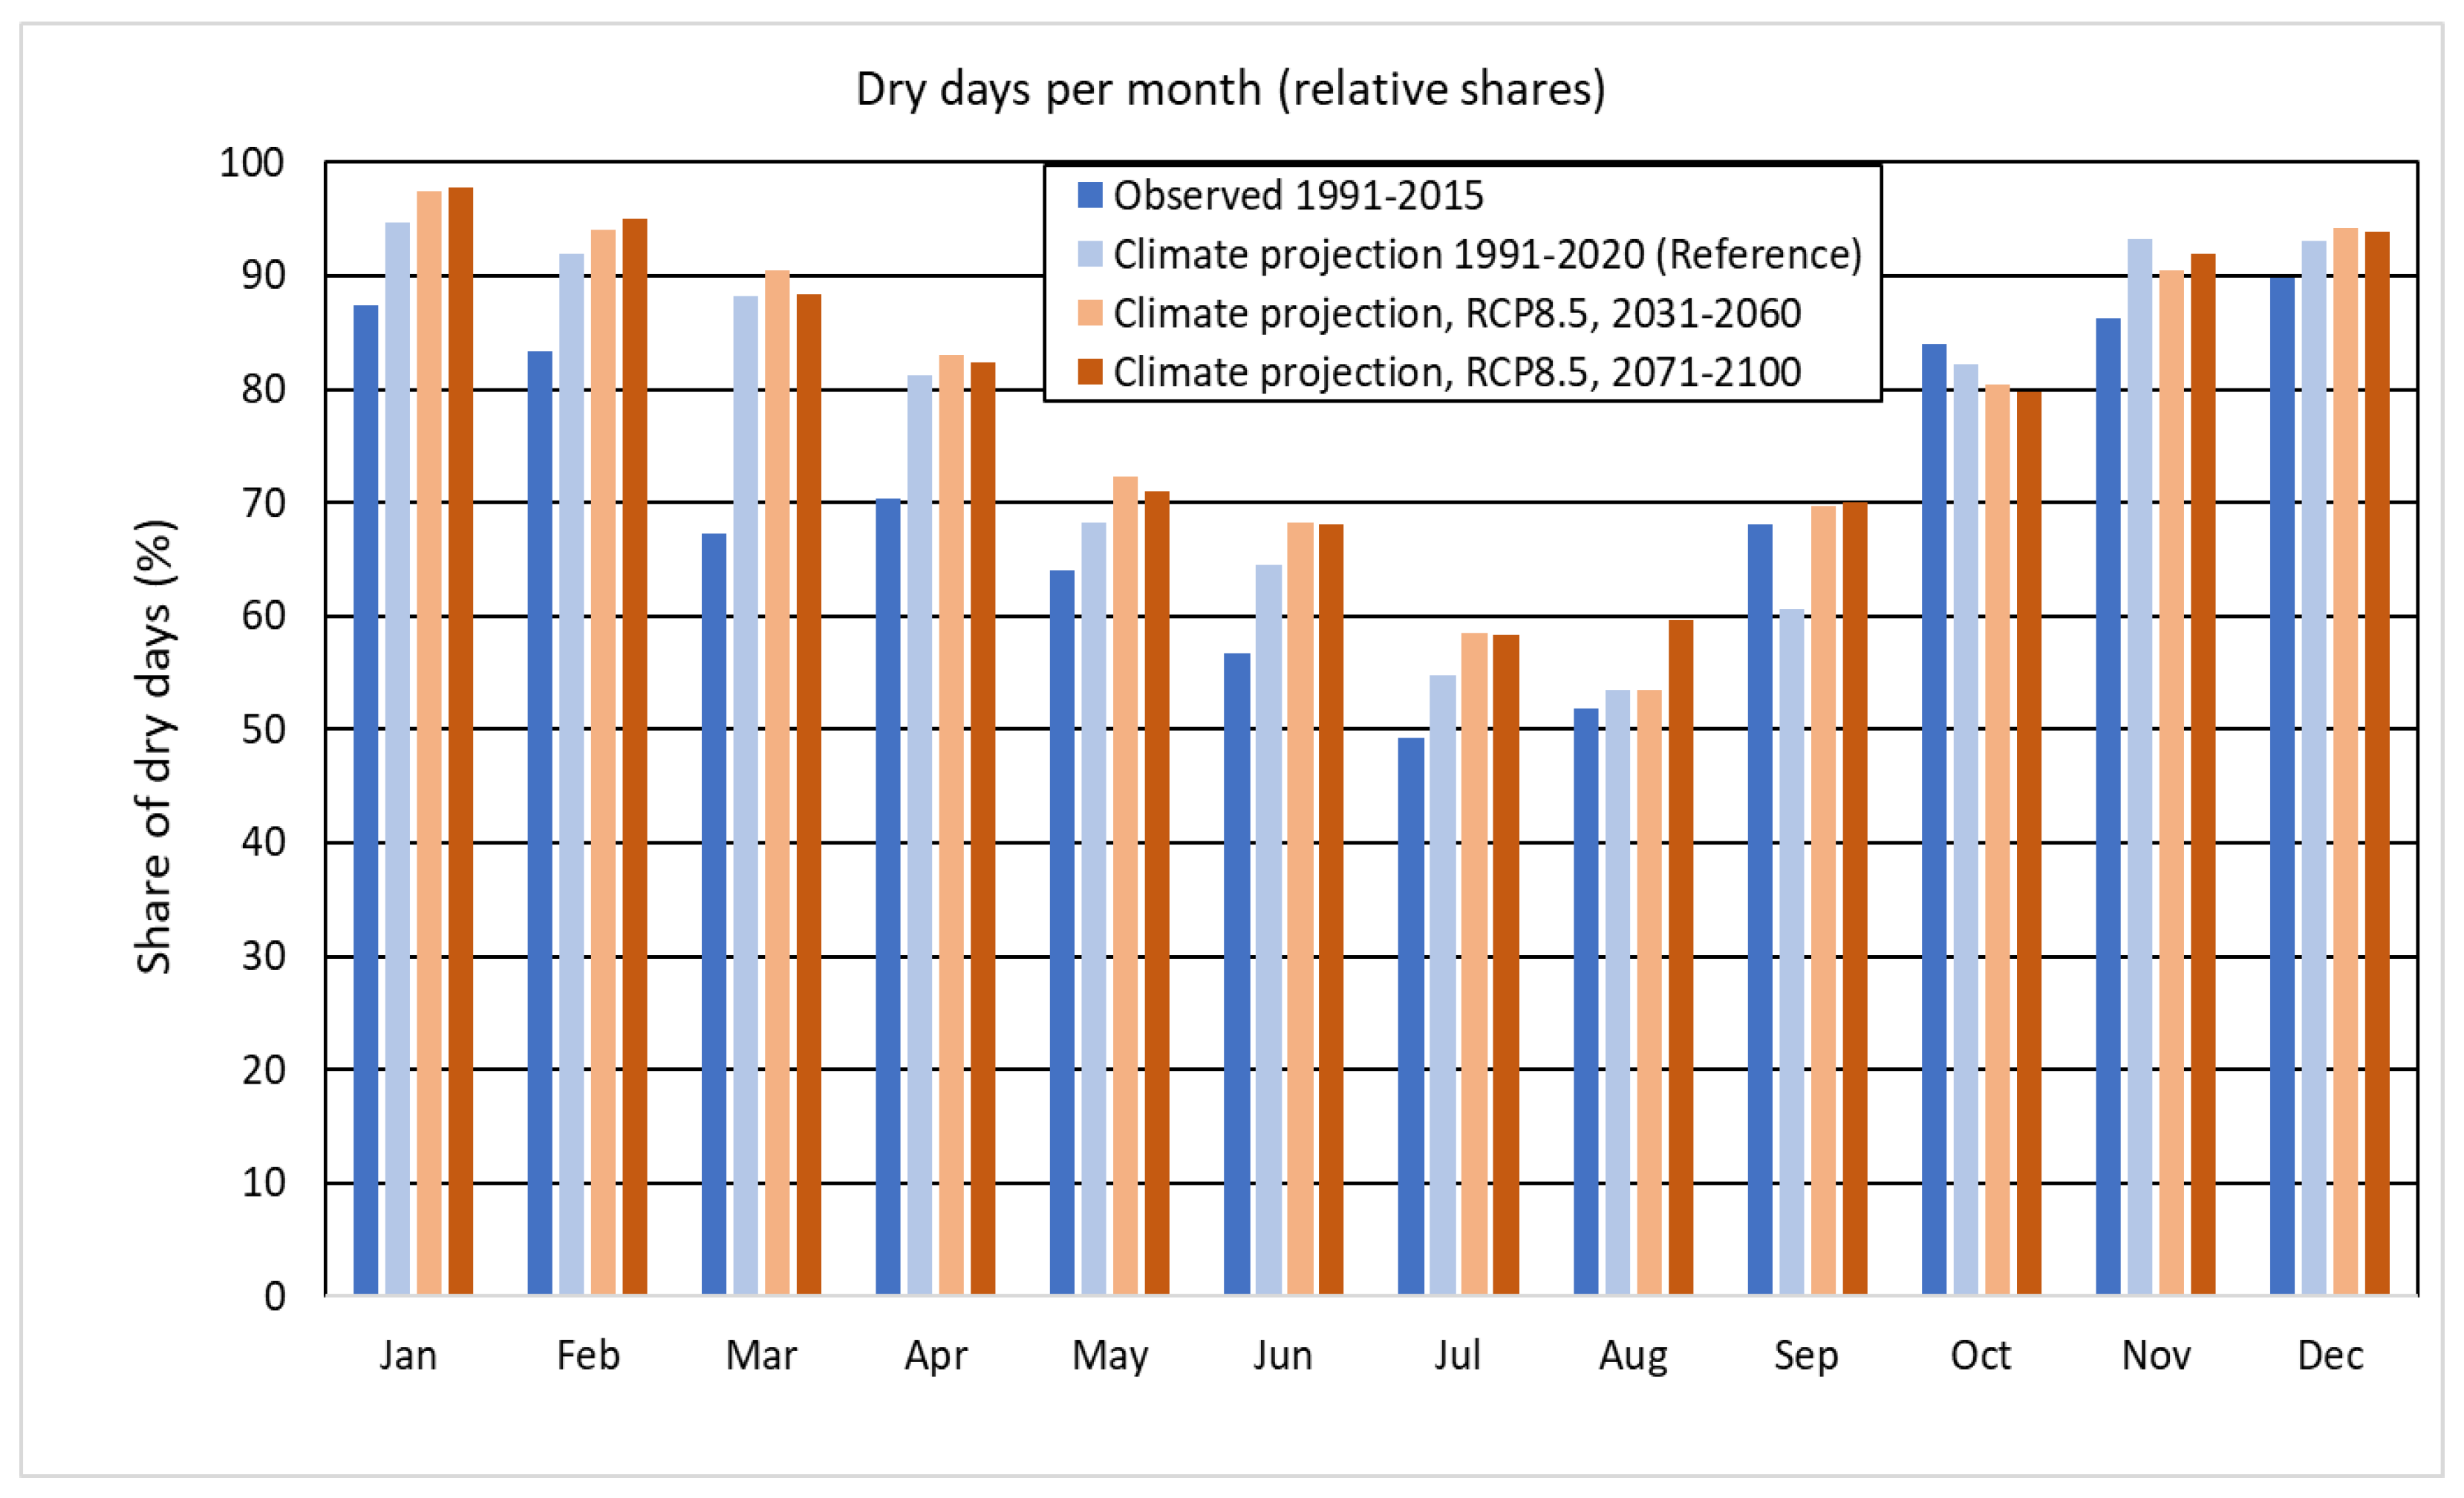
Figure 5.
a-b. Indicators for optimum growing and harvest conditions, (a) effective solar radiation (EfRad) and effective temperatures (EfTemp) of the future projections, relative to the projection of the 1991-2020 period and (b) the number of optimum harvest days for seasonal maize harvest months in Thai Nguyen Province, Vietnam.
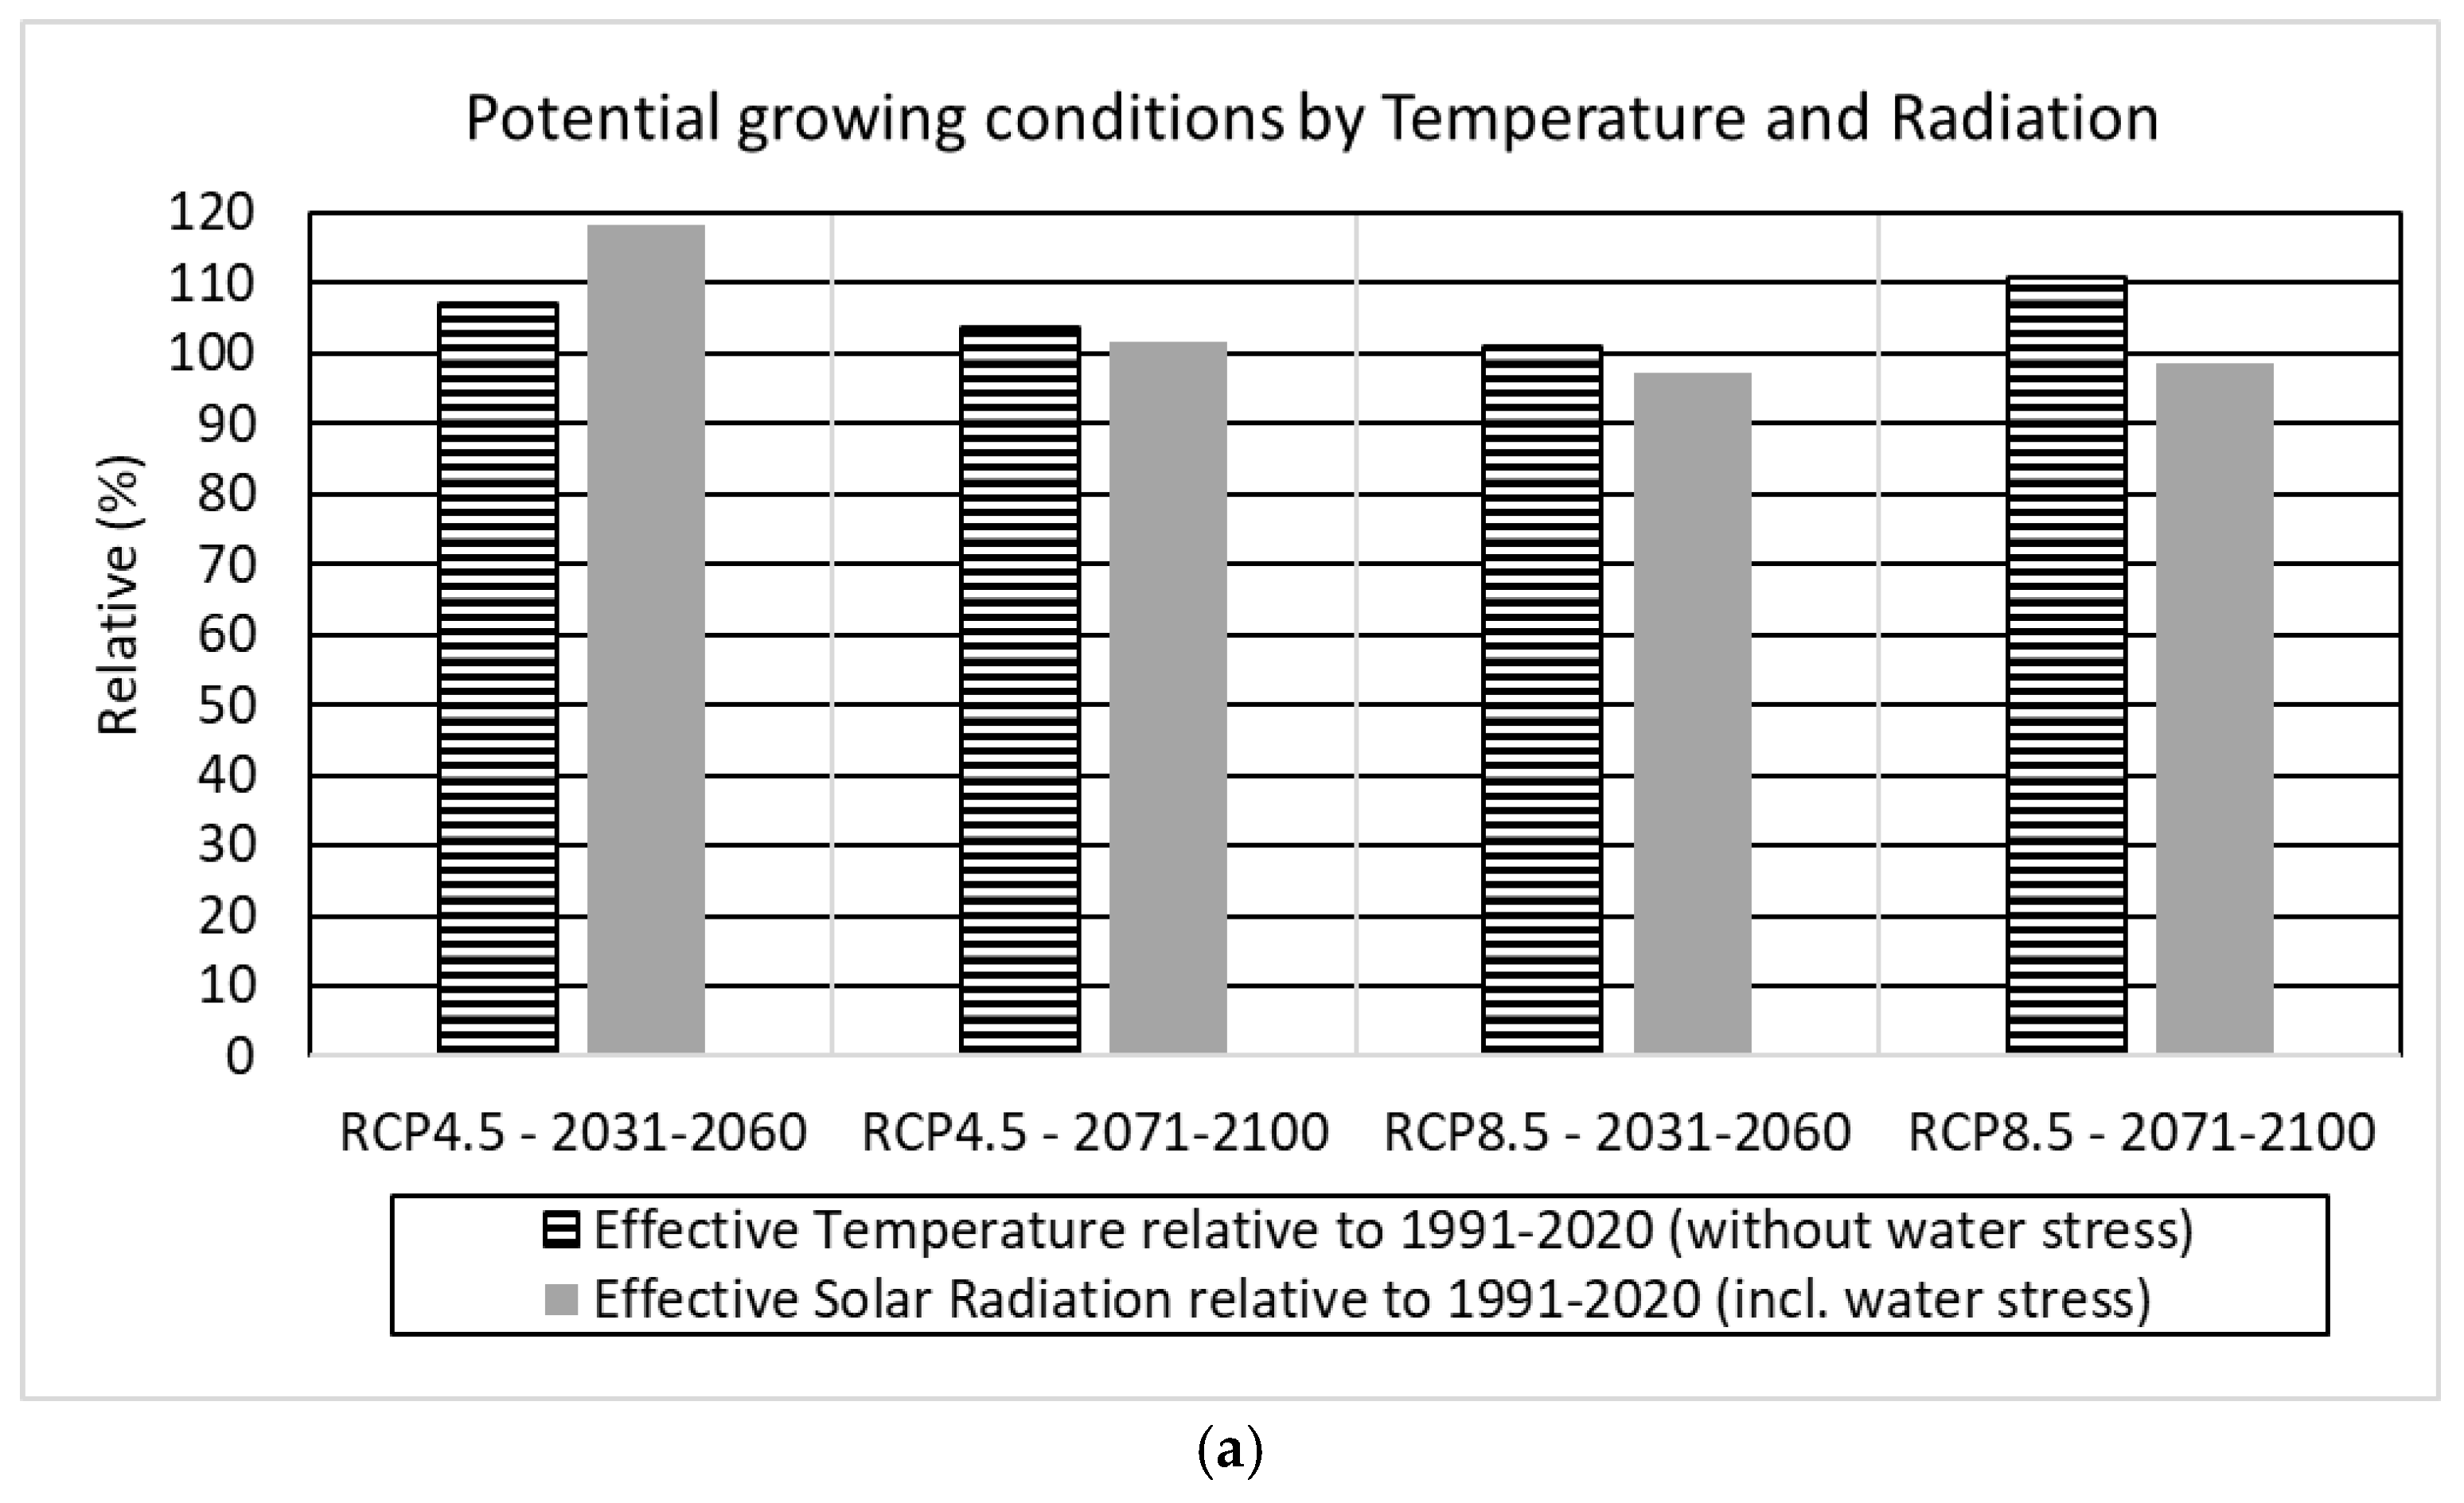
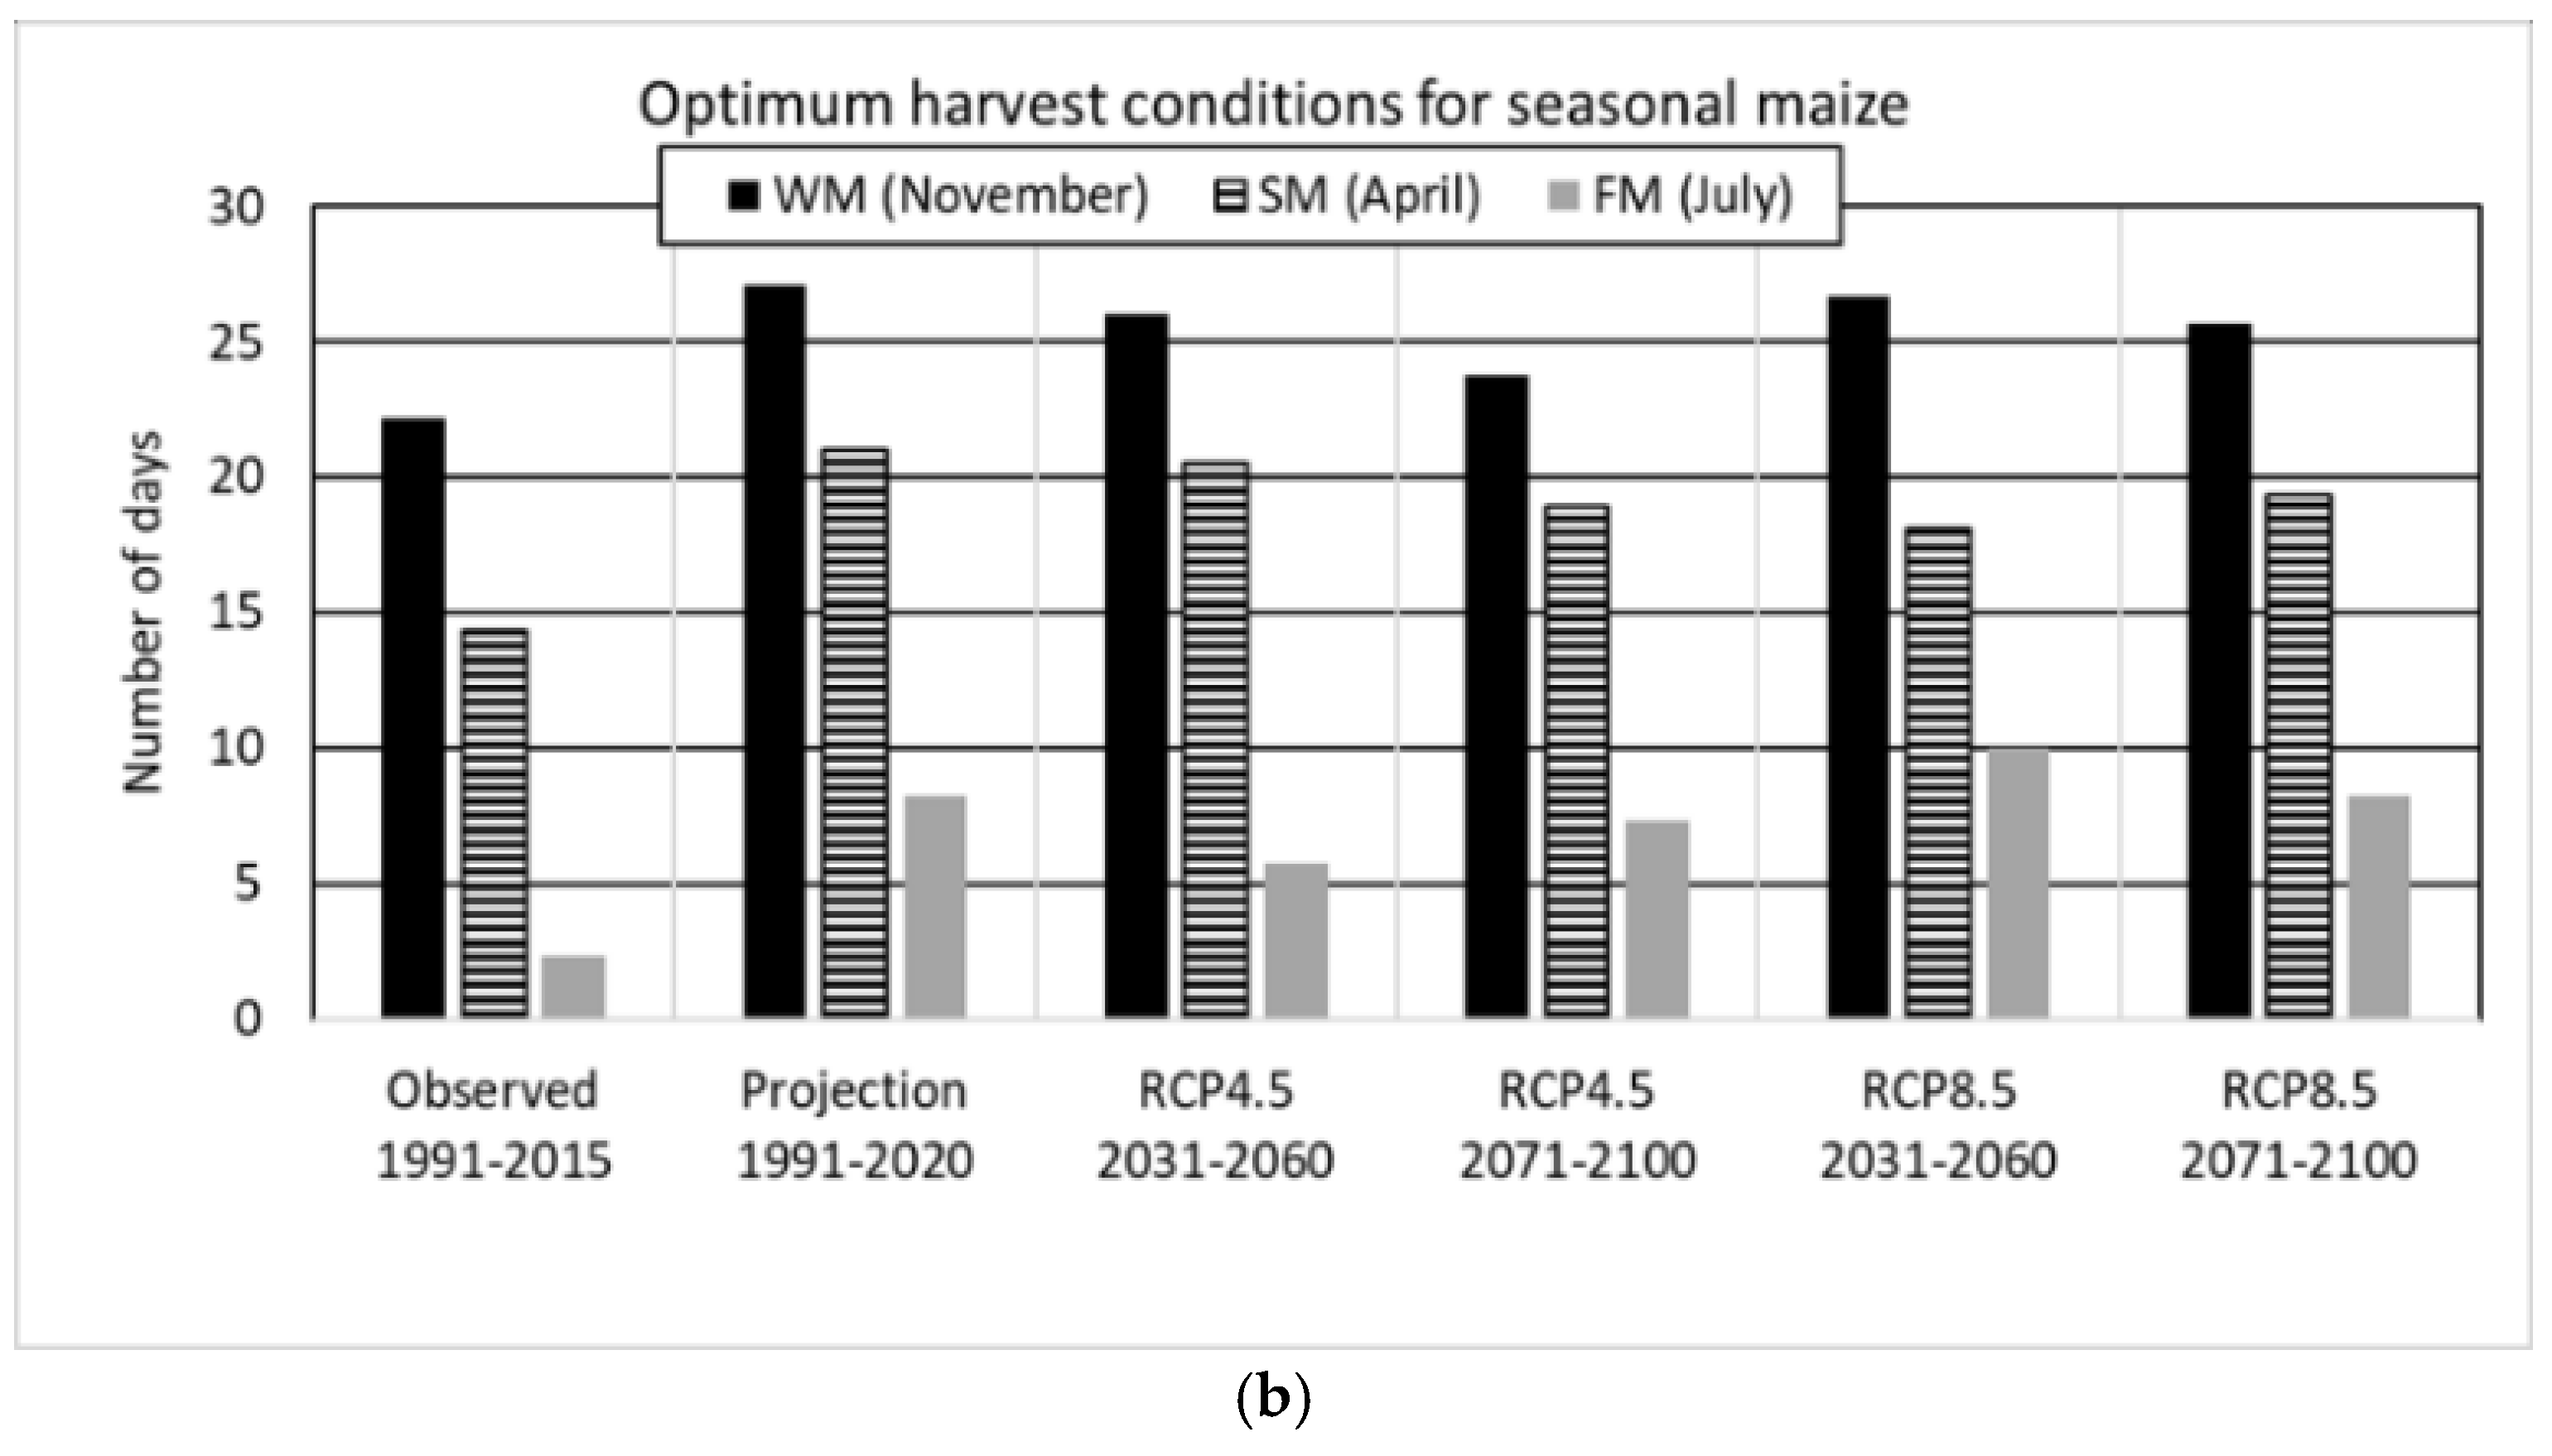
Figure 6.
Climatic water balance indicator (WatBal) for the three different maize growing seasons under different climate conditions in Thai Nguyen Province, Vietnam.
Figure 6.
Climatic water balance indicator (WatBal) for the three different maize growing seasons under different climate conditions in Thai Nguyen Province, Vietnam.
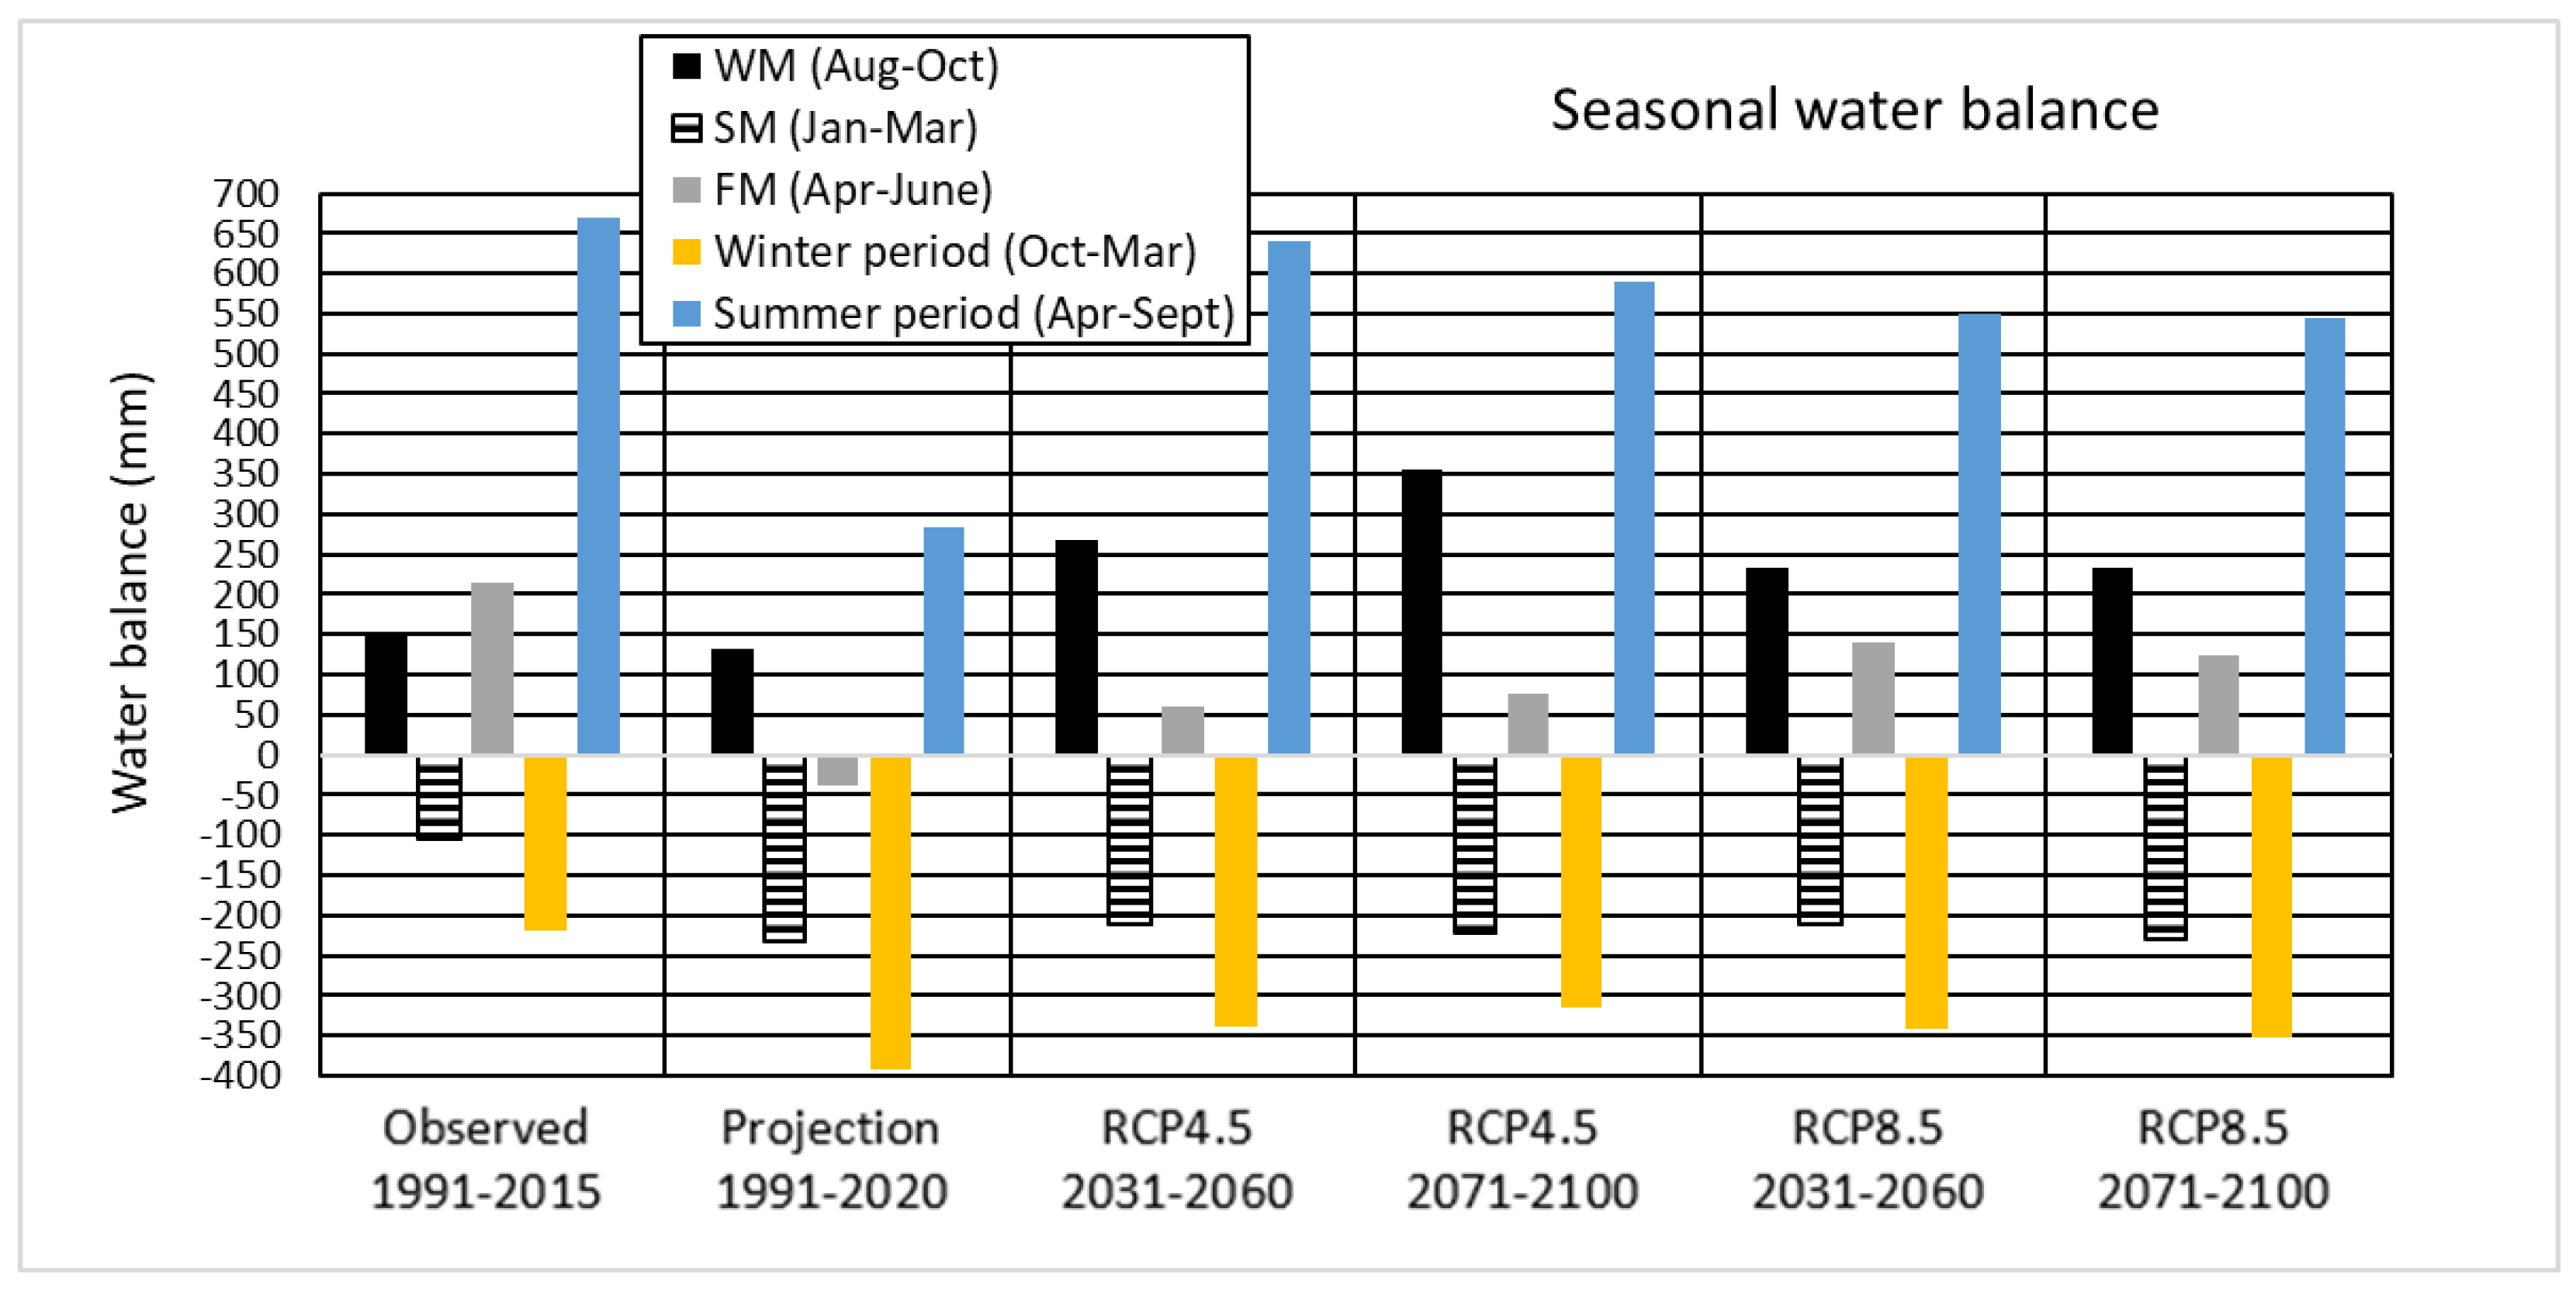
Figure 7.
The number of drought stress days (DryD) under different climatic conditions in Thai Nguyen Province, Vietnam.
Figure 7.
The number of drought stress days (DryD) under different climatic conditions in Thai Nguyen Province, Vietnam.
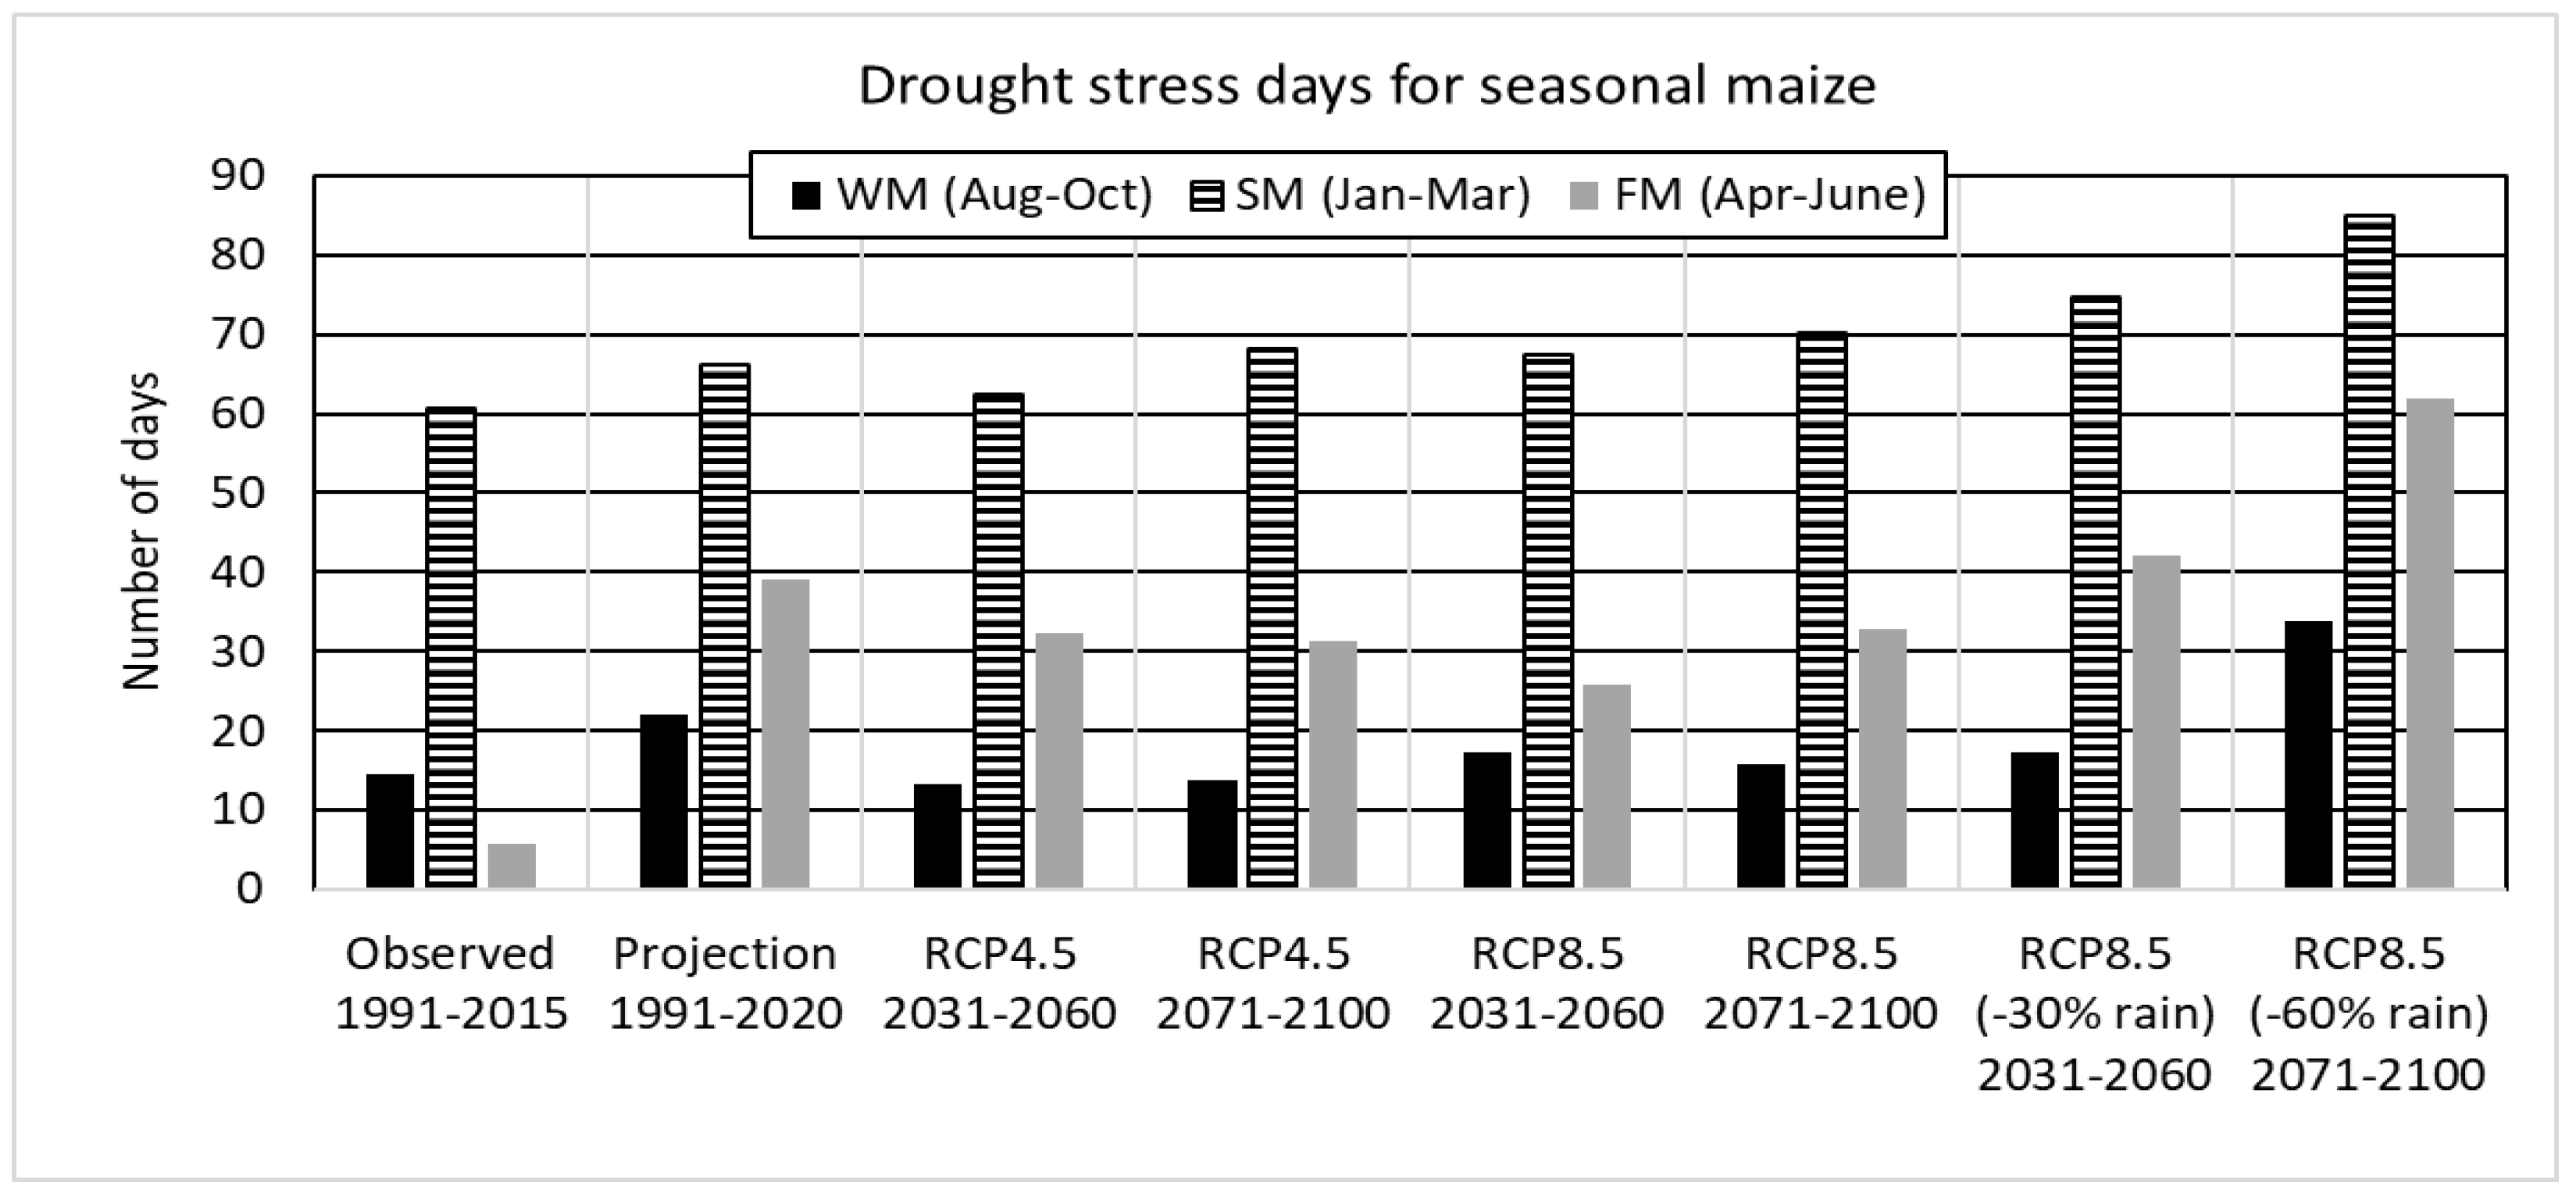
Figure 8.
Heat stress days (HeadD) and heat wave days (HeatWD) on the annual base as well as for the first and second half year for the observed period and the current and future climate projections applied for Thai Nguyen region, Vietnam.
Figure 8.
Heat stress days (HeadD) and heat wave days (HeatWD) on the annual base as well as for the first and second half year for the observed period and the current and future climate projections applied for Thai Nguyen region, Vietnam.
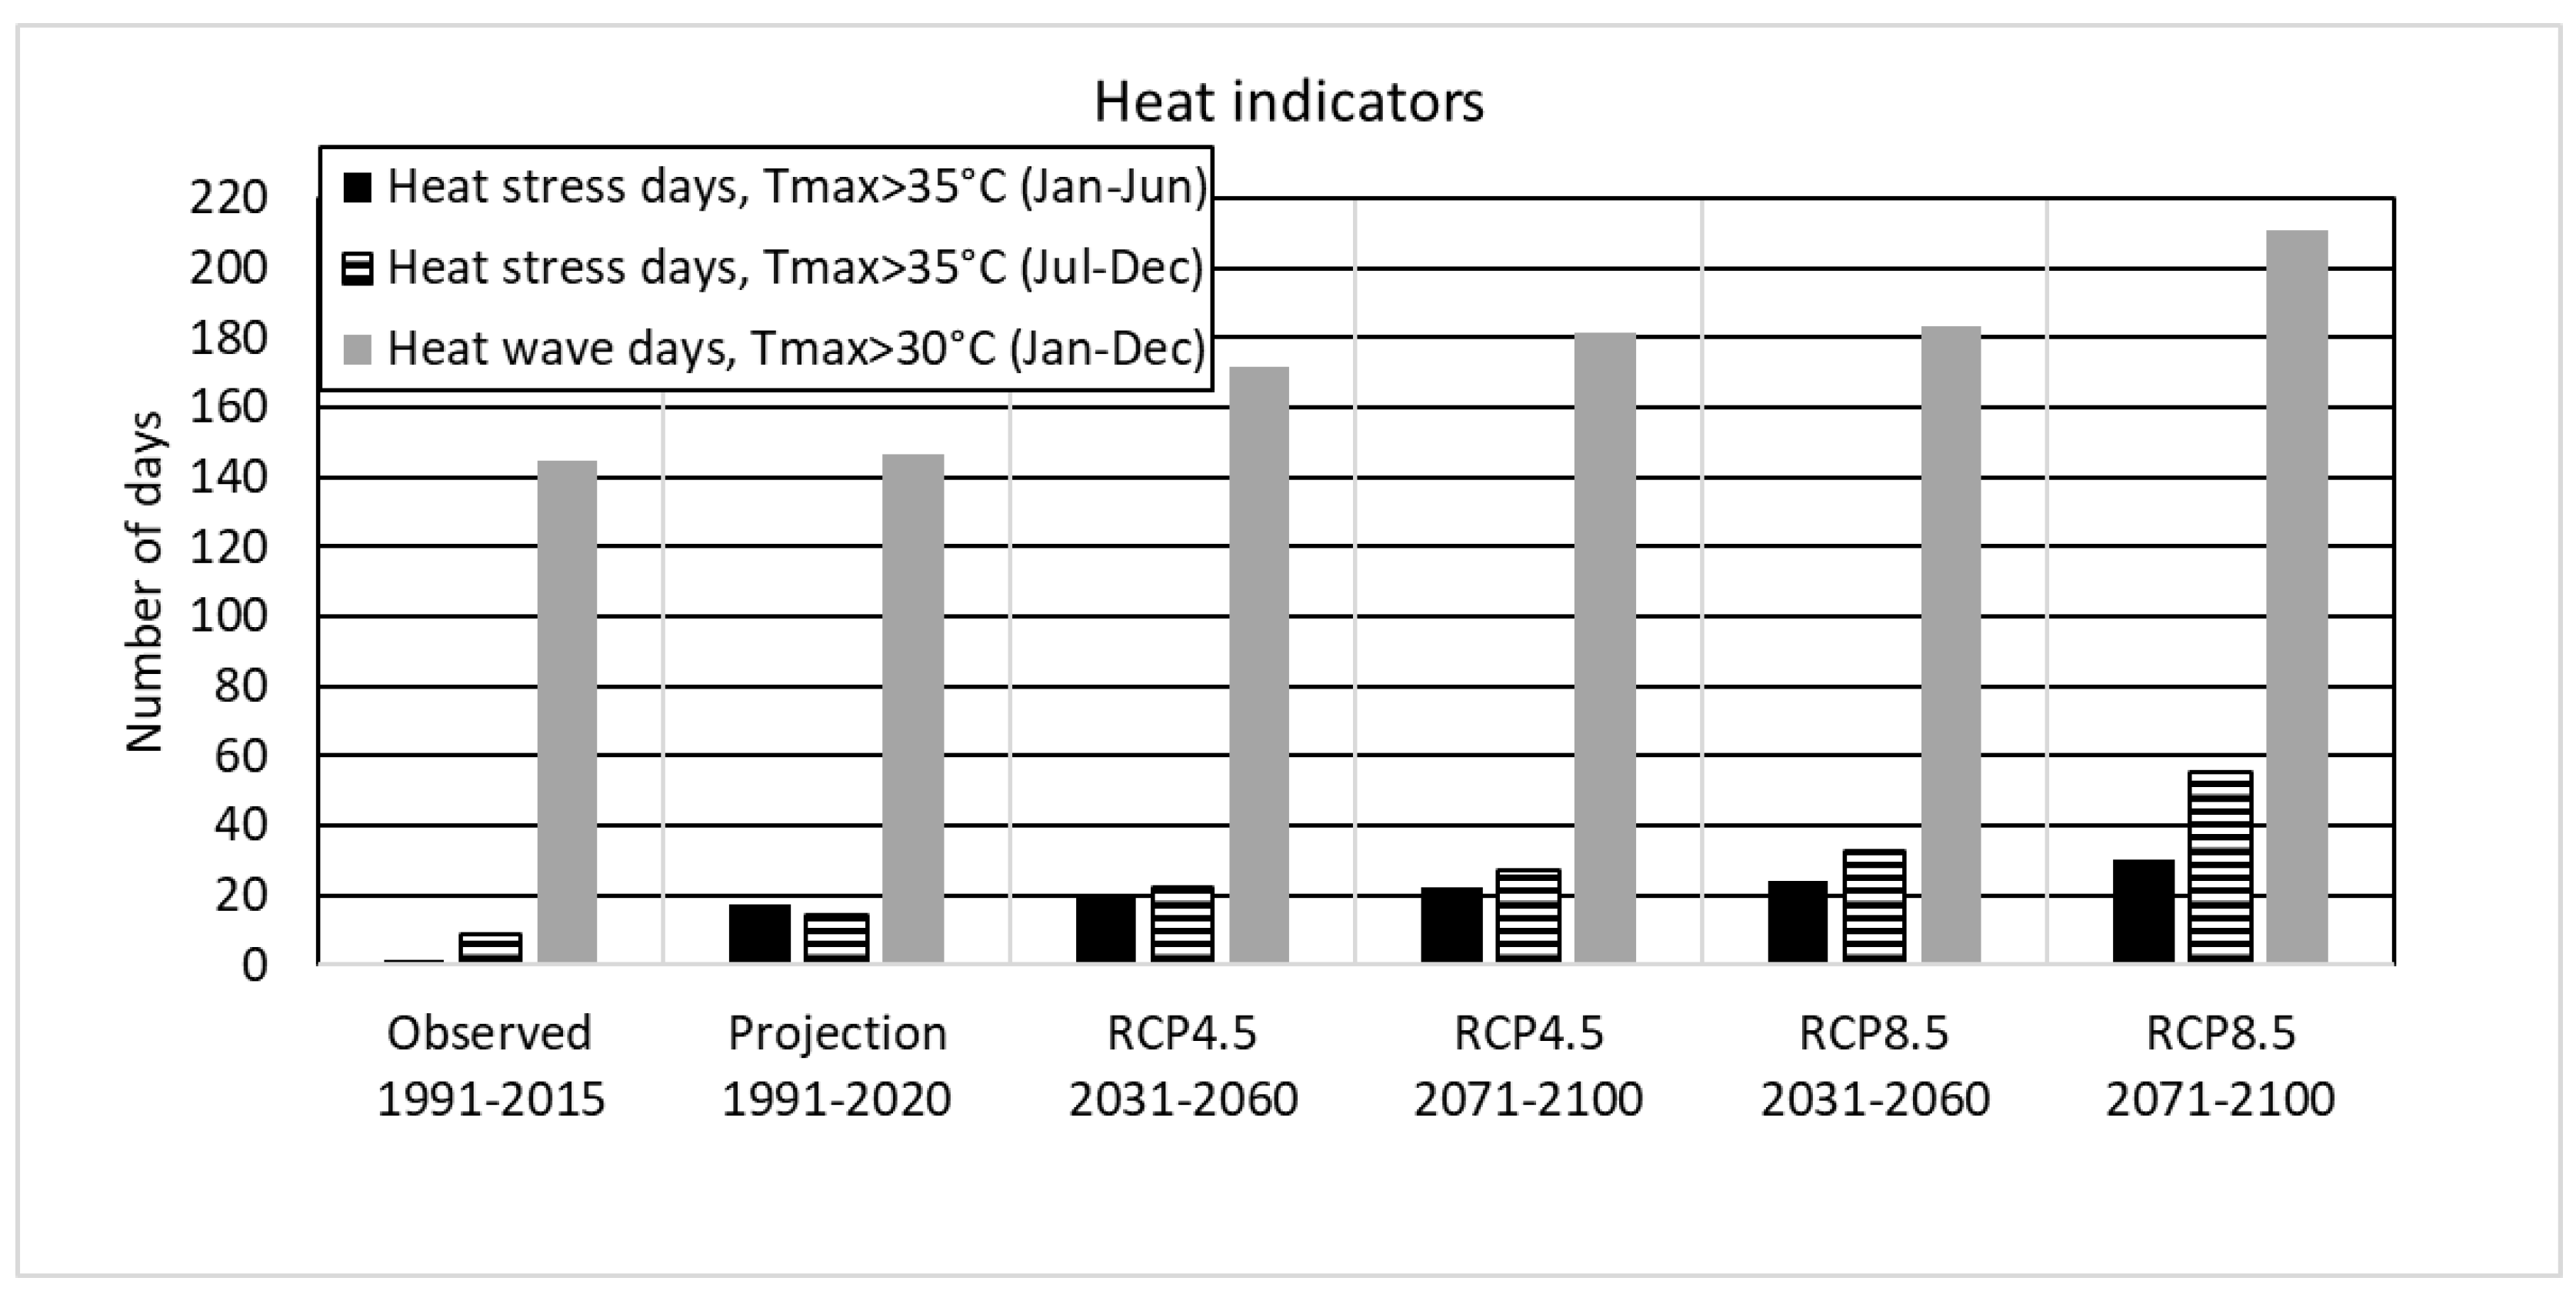

Table 1.
Agrometeorological indicators applied in our study. The three local main maize growing periods considered are August-October (winter maize season, WM), January-March (spring maize season, SM), and April-June (forage maize season, FM).
Table 1.
Agrometeorological indicators applied in our study. The three local main maize growing periods considered are August-October (winter maize season, WM), January-March (spring maize season, SM), and April-June (forage maize season, FM).
| Indices | Description | Unit |
| Effective solar radiation (EfRad) | The mean annual sum of daily global radiation of days with Tmean > 5°C and actual vs. grass reference evapotranspiration (ETa/ETr) above 0.4. Calculation of actual (maize) and grass reference evapotranspiration according to Allan et al. [2]. | MJ m-2 |
| Number of drought stress days (DryD) for maize | The number of dry days with intensive crop specific (maize) water deficit, (ETa/ETr < 0.4)) during WMS, SMS, and FMS seasons as well as April-September and October-March. Calculation of crop-specific (maize) soil-water balance according to Allan et al. (1998) for soil depth 0-130 cm and crop available water capacity of 17 %vol. | Days |
| Water balance (WatBal) | Climatic water balance calculated as precipitation minus grass reference evapotranspiration (ETr) during WMS, SMS, and FMS seasons as well as from April-September and October-March. | mm |
| Optimum maize harvest conditions (OHarvD) for March, June, and October | The optimum harvest condition is defined as the day (n) of the month with daily precipitation (in mm) of approximately n < 0.5mm; total rainfall on day n-1 < 5mm, total daily rainfall on day n-2 < 10mm, and total daily rainfall on day n-3 < 20mm combined with soil water content in the top 20cm between 0-70% of total water holding capacity of the land. The last month was separately considered as harvest month. | Days |
| Heat stress days (HeatD) | Mean annual number of days with heat stress conditions for maize (Daily maximum temperature > 35°C) from January-June and July-December. | Days |
| Heat wave days (HeatWD) | Mean annual number of days within episodes when daily maximum temperature is continuously above 30°C and daily minimum temperature above 20°C for at least 3 days. | Days |
| Effective growing temperatures (annual) (EfTemp) | Mean annual temperature sum, where daily mean temperature is above 10°C and daily minimum temperature is above 0°C. | °C |
Table 2.
Agrometeorological indicators (mean values) under different climatic conditions in Thai Nguyen Province, Vietnam (SM season: Jan-Mar; FM season: Apr-Jun; WM season: Aug-Oct). For detailed statistics, see Tables S1-S7.
Table 2.
Agrometeorological indicators (mean values) under different climatic conditions in Thai Nguyen Province, Vietnam (SM season: Jan-Mar; FM season: Apr-Jun; WM season: Aug-Oct). For detailed statistics, see Tables S1-S7.
| Indicator | Unit | Observed | Projected climatic conditions | ||||||
| Reference periods | RCP 4.5 | RCP 8.5 | |||||||
|
1991 – 2015 |
1951 – 1980 |
1991 – 2020 (Ref) |
2031 – 2060 |
2071 – 2100 |
2031 – 2060 |
2071 – 2100 |
|||
| Air temperature | °C |
24.4 (-0.1) |
24.1 (-0.4) |
24.5 (0) |
25.5 (+1) |
25.9 (+1.4) |
26.2 (+1.7) |
27.8 (+3.3) |
|
| Precipitation | mm |
1808 (+43) |
1446 (-338) |
1784 (0) |
1625 (-159) |
1634 (-150) |
1552 (-232) |
1593 (-191) |
|
| EfRad | MJ/m2/d | 3816 | 1639 | 2804 | 3265 | 3251 | 3267 | 3221 | |
| DryD (WM) | d | 15 | 39 | 22 | 13 | 14 | 17 | 16 | |
| DryD (SM) | d | 61 | 83 | 66 | 62 | 68 | 67 | 70 | |
| DryD (FM) | d | 6 | 65 | 39 | 32 | 31 | 26 | 33 | |
| DryD (Apr-Sept) | d | 10 | 93 | 52 | 39 | 47 | 39 | 45 | |
| DryD (Oct-Mar) | d | 111 | 127 | 99 | 88 | 84 | 90 | 85 | |
| WatBal (WM) | mm | 147 | -131 | 133 | 267 | 355 | 232 | 247 | |
| WatBal (SM) | mm | -106 | -282 | -232 | -210 | -223 | -211 | -231 | |
| WatBal (FM) | mm | 215 | -201 | -39 | 59 | 77 | 147 | 124 | |
| Watbal (Apr-Sept) | mm | 669 | -273 | 285 | 639 | 591 | 551 | 545 | |
| Watbal (Oct-Mar) | mm | 9 | -508 | -393 | -339 | -316 | -343 | -352 | |
| OHarvD (Mar) | d | 15 | 27 | 25 | 25 | 24 | 24 | 24 | |
| OHarvD (Jun) | d | 4 | 15 | 11 | 10 | 11 | 9 | 11 | |
| OHarvD (Oct) | d | 18 | 23 | 20 | 17 | 16 | 17 | 16 | |
| HeatD (Jan-Jun) | d | 1 | 15 | 17 | 20 | 22 | 24 | 30 | |
| HeatD (Jul-Dec) | d | 9 | 12 | 14 | 23 | 27 | 33 | 55 | |
| HeatWD | d | 144 | 139 | 147 | 172 | 182 | 183 | 211 | |
| EfTemp | °C | 5200 | 5075 | 5195 | 5559 | 5774 | 5843 | 6463 | |
Table 3.
Assessment of future seasonal maize growing conditions and risks in Northern Vietnam (WM, SM, FM periods). Trends with respect to observed past conditions 1991-2015 (negative trend (-), unchanged (0), positive trend (+); 3 levels of strengths) based on our study results.
Table 3.
Assessment of future seasonal maize growing conditions and risks in Northern Vietnam (WM, SM, FM periods). Trends with respect to observed past conditions 1991-2015 (negative trend (-), unchanged (0), positive trend (+); 3 levels of strengths) based on our study results.
| Trends with respect to | |||||||
| RCP 4.5 | RCP 8.5 | ||||||
| Indicator | Unit |
Comments on Potential Impacts |
2031 – 2060 |
2071 – 2100 |
2031 – 2060 |
2071 – 2100 |
|
| Annual air temperature | °C | Shortening of growing period without cultivar adaptation – yield decrease | + | ++ | ++ | +++ | |
| Annual precipitation | mm | Seasonal shift from early summer to late summer | - | - | - | - | |
| Heavy precipitation | mm | Increasing risk for extreme soil erosion events | + | + | + | + | |
| EfRad | MJ/m2/d-1 | Overall yield potential reduction | - | - | - | - | |
| DryD (WM) | d | Unchanged yield potential | 0 | 0 | 0 | 0 | |
| DryD (SM) | d | More drought in dry season – significant yield decrease | + | + | + | + | |
| DryD (FM) | d | More drought in wet period – moderate yield decrease | ++ | ++ | ++ | ++ | |
| WatBal (WM) | mm | More soil wetness – reduced soil workability and higher N-leaching risks | + | ++ | + | + | |
| WatBal (SM) | mm | Significant yield decrease | - | - | - | - | |
| WatBal (FM) | mm | Moderate yield decrease | -- | -- | - | - | |
| OHarvD (WM) | d | - | 0 | 0 | 0 | 0 | |
| OHarvD (SM) | d | Lower soil compaction risks | + | + | + | + | |
| OHarvD (FM) | d | Improvement during wet month (June) – lower soil damage risk | + | + | + | + | |
| HeatD (FM) | d | Increasing fertility risk – yield failure for grain maize | ++ | ++ | ++ | +++ | |
| EfTemp | °C | Overall positive yield impact only by cultivar adaptation to higher GDD levels | + | + | + | ++ | |
Disclaimer/Publisher’s Note: The statements, opinions and data contained in all publications are solely those of the individual author(s) and contributor(s) and not of MDPI and/or the editor(s). MDPI and/or the editor(s) disclaim responsibility for any injury to people or property resulting from any ideas, methods, instructions or products referred to in the content. |
© 2025 by the authors. Licensee MDPI, Basel, Switzerland. This article is an open access article distributed under the terms and conditions of the Creative Commons Attribution (CC BY) license (http://creativecommons.org/licenses/by/4.0/).
Copyright: This open access article is published under a Creative Commons CC BY 4.0 license, which permit the free download, distribution, and reuse, provided that the author and preprint are cited in any reuse.


