
Submitted:
20 March 2025
Posted:
21 March 2025
You are already at the latest version
Abstract
Azvudine (FNC) is a novel cytidine analogue widely used in the treatment of AIDS and COVID-19 infectious disease. Previous studies have demonstrated its anticancer activity in various cancer cell lines, including non-Hodgkin’s lymphomas and lung adenocarcinoma cell lines. However, its effects on hepatocellular carcinoma (HCC) and the underlying mechanisms remain unclear. This study aimed to investigate the anti-epithelial-mesenchymal transition (anti-EMT) activity of FNC and evaluate its potential application in HCC treatment. We found that FNC significantly inhibits the migration of the liver cancer cell line Huh7 by downregulating key EMT markers, such as matrix metalloproteinases (MMPs) and E-cadherin, at both transcriptional and protein expression levels. Notably, we found that FNC inhibits HEY proteins, particularly HEY1, a transcriptional regulator of the Notch signalling pathway that is overexpressed in approximately 50% of HCC patients. To identify the primary target of FNC, microscale thermophoresis (MST) and molecular dynamics (MD) simulations were performed, revealing that FNC directly binds to Jagged1. This study provides valuable insights into the therapeutic potential of FNC in HCC treatment and elucidates its underlying mechanisms.
Keywords:
Notch signalling pathway
; HEY proteins
; EMT
; FNC
; HCC treatment
1. Introduction
Hepatocellular carcinoma (HCC) is one of the deadliest cancers worldwide. Its incidence has increased over the last few decades, making it the third leading cause of cancer-related death [1]. The pathogenesis of HCC involves multi-step molecular changes at both the somatic genomic and epigenetic levels. Knowledge of its molecular mechanisms has expanded rapidly, driven by the development of novel high-throughput technologies such as the next generation sequencing over the past decade [1,2,3,4,5]. However, most prevalent mutational drivers in HCC remain undruggable [2,4]. Furthermore, the application of molecular pathogenesis knowledge to guide precision diagnosis and systemic therapies for patients is still under investigation [2]. As a result, HCC patients still have a very poor prognosis. To date, only two first-line drugs, sorafenib and lenvatinib, have been approved by the FDA for HCC treatment [4]. Although advanced therapies are being developed rapidly, there is a pressing need for more effective therapeutic strategies to address this unmet clinical challenge.
Epithelial-mesenchymal transition (EMT) is a reversible cellular process in which epithelial cells lose their characteristics and acquire mesenchymal traits. During EMT, cells activate families of EMT-associated transcription factors, such as Snail/Slug family and matrix metalloproteinases (MMPs), which enable increased cellular migration [6,7]. Cells can transiently or stably acquire various intermediate states between epithelial and mesenchymal phenotypes (partial EMTs) or undergo a complete EMT, depending on cell type and context. EMT is an evolutionary conserved process involved in both normal development and pathological conditions, including tumour cell migration and invasion [6,8]. It is considered the initial step in the metastatic cascade of cancer, which can be triggered by inflammation, carcinogens or specific features of the local microenvironment in primary tumour [7,9]. Recent studies have shown that loss of the epithelial phenotype through EMT promotes the acquisition of stem-like traits and resistance to anticancer drugs in carcinoma cells [10]. As such, targeting EMT has emerged as an attractive therapeutic approach, offering potential new avenues for cancer treatment.
The EMT process involves the activation of multiple signalling pathways, including the Notch pathway. The Notch signalling pathway is highly conserved in metazoan species. Both ligands (Jagged1, Jagged2, DLL1 and DLL4) and receptors (Notch1-4) are single-pass transmembrane proteins, and activation occurs through interactions between neighbouring cells. Upon ligand binding, Notch receptors are cleaved by ADAM family metalloproteases and γ-secretase subsequently, releasing the Notch intracellular domain (NICD) [11]. The NICD translocates to the nucleus, where it recruits coactivators to regulate the expression of transcriptional regulators such as Hes Family BHLH Transcription Factor (HES) and Hes-Related Family BHLH Transcription Factor with YRPW Motif (HEY) families. The HEY family consists of three members (HEY1, HEY2 and HEYL) in humans, which play critical roles in many developmental processes and the EMT pathway [12]. Overexpression of HEY factors has been associated with advanced tumour progression and poor overall survival, and this has been mostly linked to EMT [13]. HEY transcription factors are highly expressed in malignant carcinomas, such as osteosarcoma [14]. Specially, HEY1 has been reported to be upregulated in 42.6% of HCC tumours in a cohort of 58 samples [15] and in 72.4% of cases in an expanded in-house cohort of 87 HCC patients [13]. HEY1 has also been implicated in regulating EMT in various cell types, making it a promising therapeutic target [12,14]. Inhibiting HEY1 has thus been proposed as a novel therapeutic strategy for cancer treatment.
Azvudine (FNC), also known as 2’-deoxy-2’-β-fluoro-4’-azidocytidine, is a novel cytidine analogue initially developed for treating Hepatitis C virus [16,17]. It has been clinically applied in the treatment of HIV and SARS-CoV-2 infectious due to its antiviral activity [18,19,20,21]. Recent studies have demonstrated that FNC exhibits antitumour activity in various cell lines and xenograft animal models [17,22,23,24]. In various cancer cell lines, such as B-cell non-Hodgkin’s lymphomas and lung adenocarcinoma, FNC has shown significant effects in suppressing cell proliferation and tumour growth [22,23,25]. Additionally, FNC demonstrated an inhibition activity in adhesion, migration and invasion of non-Hodgkin lymphoma and non-small lung cancer cell lines [22,24]. Recently, FNC has been found to induce reactive oxygen species (ROS) production in Dalton’s lymphoma cells [26,27].
Nucleoside analogues have been clinically utilized for over 50 years and remain a cornerstone of cancer treatment [28,29,30]. In HCC studies, nucleoside analogues showed significant efficacy in treating patients with chronic HBV infections[30,31,32,33,34]. In this study, we aimed to investigate the role of FNC in HCC and elucidate its molecular mechanisms in inhibiting the EMT process in liver cancer cells. This could provide critical insights into its potential application in HCC treatment, particularly in inhibiting of tumour metastasis, which may offer significant implications of FNC such as concomitant therapy.
2. Results
2.1. FNC Inhibits Migration and Invasion of Huh7 Cells
To assess the effects of FNC on HCC cell invasion, we conducted invasion assays using transwell chambers on various HCC cell lines, including Huh7, HepG2 and PLC/PRF/5 under a 10 μM FNC concentration in the culture medium. The Huh7 cell line showed a significant reduction in the number of migrated cells after 48 hours of FNC treatment (Figure 1). This effect was not observed in HepG2 or PLC/PRF/5 cell lines at a 10 μM FNC concentration (Figure 1). Cell viability in the HCC cell lines was evaluated using the MTT assay after exposure to varying concentrations of FNC for 48 hours. The data revealed that FNC exhibited low cytotoxicity in Huh7, HepG2 and PLC/PRF/5 cells, with an IC50 > 5 mM (Figure 2A-C). These data suggests that FNC may affect Huh7 cell migration behaviour without significant cytotoxicity at a concentration of 10 μM. Fluorescent microscopy was used to assess the morphology of Huh7 cells, which were stained for nucleus and actin distribution using DAPI and phalloidin respectively. The data suggested that FNC-treated Huh7 cells appeared large, rounded and flat while cells in the control group displayed a smaller and hexagonal shape (Figure 2E). Since the molecular mechanisms underlying the anticancer effects of FNC on HCC cell lines, particularly from the perspective of EMT, remain unexplored, we aimed to investigate the potential of FNC as an antimetastatic agent in HCC.
To verify that FNC inhibits Huh7 cell invasion and migration, we next performed dose-response wound-healing and invasion assays on Huh7 cells for 24 and 48 hours (Figure 2F and G). A scratch wound-healing assay showed that FNC significantly decreased the migration of Huh7 cells in a dose-dependent manner at both 24 and 48 hours (Figure 2F). Similar results were obtained using the transwell chamber-based cell invasion assay (Figure 2G). Altogether, these results demonstrated that FNC inhibits the migration and invasion of Huh7 cells in a concentration-dependent manner. Therefore, we hypothesized that FNC might regulate the EMT process in HCC.
2.2. FNC Modulates a Subset of EMT Markers in Huh7 Cells
The observed inhibitory effect of FNC on Huh7 cell invasion and migration prompted us to investigate its impact on the transcription and expression of EMT markers. To examine to which EMT markers are regulated by FNC treatment, Huh7 cells were cultured in medium containing FNC at concentration of 2.5, 5, 10, 20 and 40 μM for 48 hours, with DMSO-treated cells serving as the control group. Transcript level analysis revealed that FNC significantly increased the mRNA expression of the E-cadherin (CDH1) that is an epithelial marker and cell adhesion molecule, while decreasing the mRNA expression of N-cadherin (CDH2) that is a mesenchymal marker associated with the acquisition of an aggressive tumour phenotype (Figure 3B). However, only N-cadherin showed changes in protein levels compare to the control (Figure 3A). MMP2, which is involved in extracellular matrix (ECM) degradation and cell motility regulation, was dramatically reduced at both transcriptional and translational levels relative to control group (Figure 3A, B). Notably, protein-level changes of MMP2 exhibited a dose-dependent trend (Figure 3A). Moreover, MMP1 and 9 showed decreased transcriptional levels after 48 hours of FNC treatment (Figure 3B). However, no significant changes were observed in the transcriptional or translational levels of the mesenchymal marker Vimentin (VIM) or the EMT-related transcriptional repressor Snail (SNAIL) (Figure 3A, B). Altogether, these data suggest that FNC partially inhibits EMT process in Huh7 cells.
2.3. RNA-Seq Reveals FNC May Attenuate Liver Diseases and Function
To examine the transcriptional effects of FNC on Huh7 cells, RNA-Seq was performed on samples treated with 2.5, 20 and 40 μM FNC, as well as on a control group (Huh7 cells treated with DMSO only). Hierarchical clustering of the RNA-Seq data revealed significant differences in the expression patterns between FNC-treated cells and the control group (Figure 4C). Principle component analysis (PCA) two-dimensional score plots for the control, low, medium, and high groups are displayed in Figure S1. The FNC-treated groups were distinctly separated from the control group, suggesting transcription disturbances in Huh7 cells following FNC treatment.
Differentially expressed genes and overlapping gene numbers among the four groups are shown in Figure 4A. The Venn diagram revealed that 80% of genes were shared transcripts across all four groups. A total of 449 genes, accounting for 3% of detected genes, were expressed exclusively in all drug-treated groups but not in the control group. The low, medium and high groups uniquely expressed 178 (1.0%), 326 (2.0%) and 188 (1.0%) genes respectively. Given the anti-EMT effects observed in FNC-treated Huh7 cells in vitro, we conducted gene set enrichment analysis to determine whether FNC affects liver disease-associated gene expression. Notably, liver disease and liver failure gene sets were significantly enriched in the control group compared to the 40 μM FNC-treated group (Figure 4B). Additionally, the liver cirrhosis and alcoholic fatty liver gene sets, which are common features of HCC [1], were significantly downregulated in FNC-treated cells (Figure 4B). These findings suggest that FNC may uniquely inhibit genes associated with liver diseases.
2.4. HEY Family Members Were Downregulated in FNC-Treated Huh7 Cells
RNA-Seq data suggest that the expression and processing of the Notch signalling pathway are significantly altered in FNC-treated Huh7 cells (Figure 5A). To investigate this further, we first analysed downstream regulators of the Notch signalling pathway. Strikingly, real-time PCR results revealed that the transcription HEY family members, including HEY1, HEY2 and HEYL, were dramatically decreased in FNC-treated Huh7 cells compared to the cells treated with DMSO alone (Figure 5B). Western bolt results showed protein levels of HEY1 and HEYL were dramatically decreased in all FNC-treated samples (Figure 5C). However, no significant changes were observed in the mRNA levels of HES1 after 48 hours FNC treatment, but higher HES1 protein levels were detected in all FNC-treated groups compared to the control group after the same duration of treatment (Figure 5B, S2).
HEY1 has been identified as a critical regulator of HCC and EMT in both clinical and fundamental studies [12,13,35]. To confirm HEY1 a target gene of FNC in Huh7 cells, we transiently over-expressed HEY1 with a C-terminal Myc tag using pcDNA3.1(+) vector. Following transfection for 4 hours, the cells were treated with 2.5, 10, 40 μM FNC. Consistent with our hypothesis, Myc-tagged HEY1 overexpression was significantly inhibited in all FNC-treated groups compared to the overexpression sample without FNC treatment (Figure 5D). These findings suggest HEY1 is a target of FNC and may play a vital role in the EMT inhibition process in Huh7 cells.
To investigate the possible cause of the differing EMT responses of HCC cell lines to FNC, we analysed HEY1 expression levels in Huh7, HepG2 and PLC/PRF/5 cells. Immunoblot data revealed that HEY1 expression in Huh7 cells was significantly higher than in HepG2 and PLC/PRF/5 cells (Figure 5E).
2.5. Molecular Docking, MST and MD Simulations Suggest Jagged1 Is a Potential Direct Target of FNC
To explore the mechanism underlying HEY1 downregulation, we examined the transcriptional and expression levels of Notch ligands and receptors. Western blotting and q-PCR data did not reveal significant decreases in the expression levels of any Notch ligands or receptors (Figure 6D and Figure 7). Interestingly, the transcriptional and expression levels of Jagged1 and DLL4 were increased in FNC-treated Huh7 cells compared to the control group (Figure 6D and Figure 7).
Since no significant decreases were observed in Notch ligands or receptors, we investigated whether FNC directly binds to Notch ligands and influences the Notch activation process. To predict the binding potential of FNC to Notch ligands, we utilized the AutoDock software to dock FNC to Jagged1, Jagged2, DLL1 and DLL4 (Table 1). Given that the core binding regions in Notch ligands range from the C2 domain to EGF3, molecular docking was performed using structures of this region. Binding energy, binding modes and binding residues were calculated to evaluate the interactions. Docking results revealed Jagged family ligands exhibited higher affinity for FNC compared to DLL family ligands, with Jagged1 has the lowest binding energy (-6.592 kcal/mol) (Table 1). The potential binding position of FNC on Jagged1 is shown in Figure 6A.
Building on the molecular docking results and prior studies indicating a strong correlation between Jagged1 and HEY1 expression, we next tested FNC’s binding affinity for Jagged1 using microscale thermophoresis (MST) [12,36,37]. Label-free MST assays were performed with recombinant human Jagged1 utilizing its natural autofluorescence. The interaction of FNC with Jagged1 resulted in a dissociation constant (KD) of 28.4 ± 6.6 μM (Figure 6B).
To validate the molecular docking and MST results, molecular dynamics (MD) simulations of FNC binding to Jagged1 (C2 to EGF3, PDB:4CC1) were performed. A 1000 ns MD simulation was conducted, generating a trajectory FNC’s distance from Jagged1 (Figure 6C). Various binding modes were identified, and the stability of these complexes was evaluated by monitoring distance fluctuations throughout the simulation. MD simulation results indicated that FNC binding to Jagged1 is a dynamic process. Two relative stable binding confirmations were identified: confirmation 1 (around 250 ns) and 2 (around 600 ns). Confirmation 1 suggests that FNC could bind to the DSL domain of Jagged1. Confirmation 2 indicates that FNC preferentially binds to Jagged1 in its polymeric form, interacting with loop 1-2 of the C2 domain and EGF3 simultaneously. Furthermore, cleaved Notch1 levels were found to decrease in a dose-dependent manner following FNC treatment, which illustrates the activation of Notch1 was decreased in a dose-dependent manner following FNC treatment (Figure 6D). Interestingly, cleaved Notch1 levels increased in the 2.5 μM FNC-treated group compared to the DMSO only group, potentially due to increased Jagged1 expression after FNC treatment (Figure 6D and Figure 7). These findings, consistent with the MST results, suggest that FNC binding to Jagged1 may contribute to the downregulation of cleaved Notch1 and HEY1, which provide a potential mechanism for FNC-mediated inhibition of the Notch signalling pathway.
3. Discussion
FNC is a novel nucleotide analogue with antiviral and antitumour activities, which has been approved for the treatment of AIDS and COVID-19 [17]. In previous studies, FNC have been associated with the invasion of lymphoma cell lines [24] and the proliferation of various cancer cell lines [23].
Extensive evidence has shown that EMT plays a vital role in tumour metastasis, particularly in relation to tumour cell migration and invasion [9]. Previous studies have highlighted the plasticity between epithelial and mesenchymal states, where cancer cells are observed to be in the intermediate states along this spectrum [38]. In this study, we examined various types of cancer cell lines and identified, for the first time, identified that FNC inhibits Huh7 cell migration and invasion in a dose-dependent manner (Figure 2F, G). We further investigated the effects of FNC on EMT-related biomarkers and demonstrated that the transcriptional and translational levels of MMP2 and N-cadherin were decreased, accompanied by an upregulation of E-cadherin at the transcriptional level, but not of the Vimentin and Snail (Figure 3A, B). Decreased transcriptional levels of MMP1 and MMP9 were also observed in Huh7 cells after FNC treatment. The changes in MMPs may contribute to extracellular matrix remodelling, which could lead to the observed changes in cell shape (Figure 2E). These findings suggest a partial inhibition of EMT in Huh7 cells upon FNC treatment. Thus, FNC shows potential as a therapeutic agent for HCC by inhibiting the EMT process.
In RNA-seq experiments, we observed that FNC inhibits liver disease, liver failure, liver cirrhosis and fatty liver (alcoholic) gene sets by GSEA analysis (Figure 4B). Additionally, RNA-seq identified differential expression of genes related to the Notch signalling pathway, with q-PCR and Western Blotting confirming for a subset, suggesting HEY factors, including HEY1, HEY2 and HEYL, were inhibited by FNC (Figure 5B, C). These results suggest that HEY factors may play important roles in the EMT inhibition process. The inhibitory effect of FNC was further validated through HEY1 overexpression experiments (Figure 5D).
Previous studies have shown that HEY1 is an essential mediator of the TGF-β-induced EMT process in various cell types [12]. Clinical studies have also reported high expression of HEY factors in various cancers, highlighting their roles in tumour metastasis, angiogenesis as well as proliferation [37]. Furthermore, strong and growing evidence from clinical and basic research underscores the importance of HEY1 in liver cancer development [13,35,37]. Therefore, HEY1 could potentially be an interesting clinical target for liver cancer treatment. In our study, we tested the effects of FNC on three different HCC cell lines and observed that it exhibited anti-EMT activity in Huh7 cells. This may be due to the different expression profiles of various HCC cell lines [39,40,41,42]. Given that HEY factors appear to be important targets of FNC in Huh7 cells, we further investigated whether different responses to FNC were related to varying HEY factor expression levels. Our results, supported by data from the Human Protein Atlas database, indicate that Huh7 have higher HEY1 expression levels compared to other tested cell lines, which may explain the observed anti-EMT effect of FNC on Huh7 cells (Figure 5E) [43,44].
No significant changes were observed in expression levels of Notch ligands and receptors (Figure 6D and Figure 7). To explore the mechanism underlying HEY factors downregulation, molecular docking experiments were conducted to assess whether FNC binds to Notch ligands, potentially affecting ligand-dependent Notch activation. Notch ligands and receptors have large ectodomains, many of which have been widely studied due to their critical role for Notch activation [45,46,47,48,49]. In addition to direct ligand-receptor interactions, some regions regulate Notch activation indirectly, such as the C2 domain of Notch ligands modulate Notch signalling through their lipid-binding properties [50,51]. Previous studies suggested that conformational changes in ligands and receptors during binding are crucial for Notch activation [48,49]. Our MST and MD simulations data indicated that FNC can directly interact with Jagged1 (Figure 6B, C). Molecular docking suggested that FNC might bind to the C2 domain of Jagged1, a critical domain for Notch activation due to its roles in Notch binding and lipid binding (Figure 6A). Binding of FNC to Jagged1 may induce conformational changes that alter the binding affinity of Jagged1 to Notch receptors and lipids, subsequently reducing Notch receptor activation and HEY1 expression. This hypothesis was further supported by detecting cleaved Notch1 which reflects the level of Notch1 activation level in FNC-treated Huh7 cells (Figure 6D). An increase in cleaved Notch1 was observed in Huh7 cells treated with 2.5 μM FNC compared to the DMSO only group, likely due to increased Notch ligand expression in FNC-treated samples (Figure 6D and Figure 7).
Although small molecule-protein interaction identification approaches offer novel ways to identify potential drug targets, they also have many limitations [52]. MST is an in vitro assay using purified recombinant Jagged1-Fc protein constructs, although binding measurements were performed in solution mimicking natural conditions, we cannot determine the binding behaviour of FNC to Jagged1 on liver cell surfaces or within the human body. Additionally, while molecular docking and MD simulations identified potential binding sites for FNC on Jagged1, the complexity of the cell surface and tumour microenvironment, coupled with the partial use of Jagged1’s extracellular domain in analyses, limits our ability to determine the exact binding site in vivo.
Overall, our study provides novel insights into the potential of FNC for drug repurposing in hepatocellular carcinoma. We elucidated the mechanisms underlying FNC’s anti-EMT activity in HCC cell lines. Given its previously identified antiviral activities, including against Hepatitis B virus (HBV) and Hepatitis C virus (HCV), FNC could be a valuable drug for HCC patients infected by HBV and HCV. Additionally, we demonstrated that FNC exerts its anti-EMT activity by inhibiting HEY1. Considering high expression of HEY1 in significant amount of HCC patients, FNC may be a useful drug for these patients. While our findings suggest that FNC binding to Jagged1 may explain the decrease in HEY1, further studies are needed to clarify the mechanisms underlying HEY1 downregulation at lower FNC concentrations. In conclusion, our data indicate that FNC reduces the invasive and migratory capabilities of hepatocellular carcinoma cells by regulating Notch signalling and could have potential for therapeutic applications to treat hepatocellular carcinoma as well as Notch-associated disorders.
4. Materials and Methods
4.1. Cell Lines and Reagents
The hepatocellular carcinoma cell line Huh7 was obtained from the American Type Culture Collection (ATCC, Manassas, VA, USA). Huh7 cells were cultured in Roswell Park Memorial Institute (RPMI) 1640 medium supplemented with 10% fetal bovine serum (FBS), 100 U/mL penicillin, and 100 μg/mL streptomycin. HepG2 and PLC/PRF/5 were cultured in DMEM with 10% FBS, 100 U/mL penicillin, and 100 μg/mL streptomycin. Cells were starved in a medium containing 0.1% FBS for 24 hours prior to FNC treatment.
4.2. Cytotoxicity Assay
Inoculate 100 µL of Huh7 cell suspension with a density of 5 × 10⁴ cells/mL into a 96-well plate for overnight pre-culture. Replace the culture medium with one containing different concentrations of FNC. After 48 hours, add 10 µL of CCK-8 solution (MedChemExpress, China) to each well. Incubate for 1-4 hours, then measure the absorbance of at 450nm wavelength using the plate reader (PerkinElmer 2030 multilabel Reader, VICTORTM X4).
Calculation formula:
Cell survival rate=[(As-Ab)/(Ac-Ab)] × 100%,
(As = absorbance of the experimental well; Ac = absorbance of the control well; Ab = absorbance of the blank well)
4.3. Wound-Healing Assay
Confluent, serum-deprived monolayer cultures of Huh7 cells were seeded into 6-well plates at a density of 1.2 × 10⁵ cells/mL. The cells were subjected to "wounding" by scratching the monolayer with a 10 µL plastic pipette tip. DMSO or varying concentrations of FNC were added to each well. After 24 and 48 hours, cell migration was evaluated by measuring the open wound areas. Images were captured using the ZEISS Axio observer A1 inverted phase contrast microscope and analysed with Image J software.
4.4. Invasion Assay
Invasive activity was measured using BD Matrigel (BD Biosciences, Franklin Lakes, NJ, USA) in a 24-well plate, following the manufacturer’s protocol. A total of 200 µL Huh7 cells in 0.1% FBS medium were seeded at a density of 0.8 × 10⁴ cells/mL into the upper chamber. The bottom wells of the system were filled with 400 µL of 10% FBS culture medium. After incubation for 24 or 48 hours, the cells in the upper chamber were removed, and the cells on the bottom membrane were fixed and stained. The invading cells were counted in five random fields of the membrane. The invasion efficiency of the control cells was set as 100%.
4.5. RNA Sequencing
Huh7 cells were treated with 2.5 µM (low), 20 µM (medium) and 40 µM (high) FNC or DMSO only (control) for 48 hours, with three biological replicates prepared for each sample group. Cells were lysed using TRIzol reagent (Invitrogen) and sent to Novogene Services (USA) for RNA library construction and sequencing. RNA integrity was assessed using the RNA Nano 6000 Assay Kit of the Bioanalyzer 2100 system (Agilent Technologies, CA, USA). All samples demonstrated a high RNA integrity number (RIN) index > 5, qualifying them for further analysis. The library preparations were sequenced on an Illumina NovaSeq platform, generating 150 bp paired-end reads.
Differential expression analysis was performed using the DESeq2 R package (1.20.0). Genes with an adjusted P-value < 0.05 were classified as differentially expressed. Gene Set Enrichment Analysis (GSEA) was conducted using DisGeNET datasets. Genes were ranked by the degree of differential expression between the two samples, and predefined gene sets were tested for enrichment at the top or bottom of the ranked list. Enrichment results with P < 0.05 were considered statistically significant.
4.6. Western Blotting
Cells were washed with PBS before lysis in ice-cold lysis buffer (P0013C, Beyotime). Protein concentrations were measured using the PierceTM BCA Protein Assay Kit (Thermo Fisher Scientific) after sample lysis. The lysates were then subjected to SDS-PAGE, followed by immunoblotting. The following antibodies were used: anti-β-actin (13E5, Cell Signaling Technology), anti-MMP2 (D4M2N, Cell Signaling Technology), anti-MMP9 (D6O3H, Cell Signaling Technology), anti-N-Cadherin (D4R1H, Cell Signaling Technology), anti-E-Cadherin (24E10, Cell Signaling Technology), anti-HEY1 (ab154077, Abcam), anti-HES1 (D6P2U, Cell Signaling Technology), anti-Vimentin (D21H3, Cell Signaling Technology), anti-Snail (C15D3, Cell Signaling Technology). Detection was performed using a chemiluminescence detection system (Bio-Rad ChemiDocTM).
4.7. Real-Time PCR
Total RNA from the Huh7 cell line was isolated using an RNA isolation kit (TransGen Biotech). Reverse transcription was performed with the High-Capacity cDNA Reverse Transcription Kit (Applied BiosystemsTM). Reactions were run using a standard SYBR Green Master Mix (Vazyme) in 96-well plates (Applied BiosystemsTM) on an Analytik Jena qTOWER3 RT-PCR system. The comparative Ct (ΔΔCt) method was applied to determine the fold-change in mRNA expression with Glyceraldehyde-3-Phosphate Dehydrogenase (GAPDH) used as a reference. Each sample was run in triplicate. All primers used in this study are listed in Supplementary Table S1.
4.8. Immunofluorescence Microscopy
Cells were grown in 6-well plates containing coverslips for 24 hours before being treated with 40 µM FNC or DMSO for 48 hours. After treatment, the cells were fixed with 4% paraformaldehyde for 30 minutes at room temperature and permeabilized with 0.1% TritonX-100 in PBS for 10 minutes on ice. The cells were then rinsed three times with PBS and blocked with 5% BCA for 1 hour at room temperature. Cells were incubated with the indicated antibodies diluted in PBS overnight at 4 °C. After washing with PBS, the cells were incubated with Alexa Fluor 488-conjugated anti-rabbit antibodies for 1 hour at room temperature. Finally, the coverslips were placed onto slides using SlowFadeTM Diamond Antifade Mountant with DAPI (InvitrogenTM). Samples were imaged using a Nikon Ti2U fluorescence microscope. The following antibodies were used: Phalloidin iFluorTM 488 (YEASEN).
4.9. MST
MST traces were generated using a Monolith NT.LabelFree instrument (Nano Temper Technologies) with the MO. Control v2.0.4 software. A full-length extracellular domain (C2 to EGF16, 1277-JG-050, R&D Systems) tagged with an Fc-tag (Jagged1-Fc), was expressed in Chinese hamster ovary (CHO) cells. Jagged1-Fc was dissolved in HEPES buffer (20 mM Hepes, pH 7.4, 150 mM NaCl and 2 mM CaCl2) to a concentration of 1 μM. FNC was serially diluted in HEPES buffer to a concentration ranging from 0.015 to 500 μM. Jagged1-Fc was then mexed 1:1 (v/v) with FNC. The mixtures were incubated for 15 minutes at room temperature. Samples were then transferred into LabelFree Premium Capillaries (NanoTemper Technologies) and analysed at 12% excitation power on the Monolith NT.LabelFree instrument at a constant temperature of 25 °C. The dissociation constant (KD) was determined as the average of three biological replicate values obtained using the MO.Control software.
4.10. Molecular Docking
Protein receptor structures were sourced from the RCSB Protein data bank (PDB). Protein macromolecules and the 3D structure of FNC were imported into AutoDock Tools 1.5.6. Water molecules were removed, hydrogens were added, and the structures were converted into PDBQT format. The grid box was configured to encompass the entire receptor region. Semi-flexible docking was performed using AutoDock Vina to evaluate the interaction forces between FNC and the protein receptors. The 3D conformation of the ligand-receptor complex was visualized using PyMOL 3.0.
4.11. MD Simulations
The three-dimensional structure of Jagged1 (PDB: 4CC1) was obtained from the Protein Data Bank. MD simulations were performed using GROMACS 2020.6 software [53,54,55], applying the AMBER99SB-ILDN force field [56]. The small molecule was prepared using Sobtop [57] to generate a GAFF force field, with force parameters for the azide structure calculated using the Hessian matrix. A cubic simulation cell, 0.8 nm larger than the FNC-Jagged1 complexes in all dimensions, was employed. Water molecules were modeled using the TIP3P model at a density of 1 kg/L, and the system was neutralized with Na+ and Cl- ions. The system’s temperature was gradually increased to 298.15 K over 500 ps. Free dynamic simulations were then conducted using the Verlet algorithm with a 0.002 ps integration time step. The simulations were performed in an isothermal-isobaric (NPT) ensemble at 298.15 K and 1 bar pressure, with temperature and pressure controlled using the V-rescale and Parrinello–Rahman methods, respectively. Periodic boundary conditions were applied throughout the simulations, and the duration was extended as needed.
Root mean squared deviation (RMSD) values were calculated to assess the Jagged1–FNC interactions. MD trajectories were visualized using VMD software version 1.9.4. The binding free energy of the Jagged1–FNC complex was calculated using the gmx_MMPBSA package, employing the molecular mechanics/Poisson–Boltzmann surface area (MM/PBSA) method.
4.12. Statistical Analysis
Statistical analyses were performed using Prism 10 (GraphPad, San Diego, CA, USA). Experiments were performed at least three times, and data are presented as the mean ± standard deviation (SD), unless otherwise stated. P-values were calculated using ordinary one-way ANOVA followed by Dunnett’s post hoc test to analyse differences between each pair of groups. A P-value of less than 0.05 was considered statistically significant. For RNA-seq analysis, the resulting P-values were adjusted using the Benjamini-Hochberg method to control the false discovery rate.
Supplementary Materials
The following supporting information can be downloaded at the website of this paper posted on Preprints.org.
Author Contributions
Conceptualization, Y.M., P.S., Xinyi Y., Z.Z. and Xuefu Y.; data curation, Y.M., P.S., Y.R., X.L. and L.D.; resources, Z.Z., G.L., C.X. and H.L.; formal analysis, Y.M. and P.S.; writing—original draft preparation, Y.M., P.S. and Xinyi Y.; writing—review and editing, Xinyi Y., Xuefu Y. and Z.Z. All authors have read and agreed to the published version of the manuscript.
Funding
This research was funded by the National Natural Science Foundation of China (82304596, 81973383), the CAMS Innovation Fund for Medical Sciences (2023-I2M-2-006, 2022-I2M-1-016), and the National Science and Technology Infrastructure of China (National Pathogen Resource Center-NPRC-32).
Data Availability Statement
The data presented in this study are available on request from the corresponding author.
Acknowledgments
We thank Shandong Xinhua Pharmaceutical Co., Ltd. (Z.Z.) for providing the Azvdine reagents used in this study.
Conflicts of Interest
The authors declare no conflicts of interest.
Abbreviations
The following abbreviations are used in this manuscript:
| H-Bond | Hydrogen Bond |
| Pi-A | Pi-Alkyl |
| Pi-Cat | Pi-Cation |
| Hal | Halogen |
| C-H Bond | Carbon Hydrogen Bond |
| Pi-Pi | Pi-Pi Stacked |
| Pi-S | Pi-Sulfur |
| Attr-Chg | Attractive Charge |
| HIS | Histidine |
| TYR | Tyrosine |
| SER | Serine |
| VAL | Valine |
| ARG | Arginine |
| CYS | Cysteine |
| ASP | Aspartic acid |
| GLY | Glycine |
| GLN | Glutamine |
| PRO | Proline |
References
- J.M. Llovet, R.K. Kelley, A. Villanueva, A.G. Singal, E. Pikarsky, S. Roayaie, R. Lencioni, K. Koike, J. Zucman-Rossi, R.S. Finn, Hepatocellular carcinoma, Nat Rev Dis Primers (2021).
- J. Zucman-Rossi, A. Villanueva, J.C. Nault, J.M. Llovet, Genetic Landscape and Biomarkers of Hepatocellular Carcinoma, Gastroenterology (2015) 1226-1239.e4.
- D.W.H. Ho, R.C.L. Lo, L.K. Chan, I.O.L. Ng, Molecular pathogenesis of hepatocellular carcinoma, Liver Cancer (2016) 290–302.
- J.M. Llovet, R. Pinyol, R.K. Kelley, A. El-Khoueiry, H.L. Reeves, X.W. Wang, G.J. Gores, A. Villanueva, Molecular pathogenesis and systemic therapies for hepatocellular carcinoma, Nat Cancer (2022) 386–401.
- N. Badwei, Hepatocellular Carcinoma Gene Expression: The New Era, Where It goes?, ILIVER (2023) 36–40.
- K.K. Youssef, M.A. Nieto, Epithelial–mesenchymal transition in tissue repair and degeneration, Nat Rev Mol Cell Biol (2024) 720–739.
- Dongre, R.A. Weinberg, New insights into the mechanisms of epithelial–mesenchymal transition and implications for cancer, Nat Rev Mol Cell Biol (2019) 69–84.
- D. Hanahan, R.A. Weinberg, Hallmarks of cancer: The next generation, Cell (2011) 646–674.
- E.D. Williams, D. Gao, A. Redfern, E.W. Thompson, Controversies around epithelial–mesenchymal plasticity in cancer metastasis, Nat Rev Cancer (2019) 716–732.
- S. Terry, P. Savagner, S. Ortiz-Cuaran, L. Mahjoubi, P. Saintigny, J.P. Thiery, S. Chouaib, New insights into the role of EMT in tumor immune escape, Mol Oncol (2017) 824–846.
- Y. Meng, Z. Bo, X. Feng, X. Yang, P.A. Handford, The Notch Signaling Pathway: Mechanistic Insights in Health and Disease, Engineering (2024) 212–232.
- J. Zavadil, L. Cermak, N. Soto-Nieves, E.P. Böttinger, Integration of TGF-β/Smad and Jagged1/Notch signalling in epithelial-to-mesenchymal transition, EMBO Journal (2004) 1155–1165.
- D. Kung-Chun Chiu, A. Pui-Wah Tse, C.T. Law, I. Ming-Jing Xu, D. Lee, M. Chen, R. Kit-Ho Lai, V. Wai-Hin Yuen, J. Wing-Sum Cheu, D. Wai-Hung Ho, C.M. Wong, H. Zhang, I. Oi-Lin Ng, C. Chak-Lui Wong, Hypoxia regulates the mitochondrial activity of hepatocellular carcinoma cells through HIF/HEY1/PINK1 pathway, Cell Death Dis (2019).
- A. Tsuru, T. Setoguchi, Y. Matsunoshita, H. Nagao-Kitamoto, S. Nagano, M. Yokouchi, S. Maeda, Y. Ishidou, T. Yamamoto, S. Komiya, Hairy/enhancer-of-split related with YRPW motif protein 1 promotes osteosarcoma metastasis via matrix metallopeptidase 9 expression, Br J Cancer (2015) 1232–1240.
- D. Jia, L. Wei, W. Guo, R. Zha, M. Bao, Z. Chen, Y. Zhao, C. Ge, F. Zhao, T. Chen, M. Yao, J. Li, H. Wang, J. Gu, X. He, Genome-wide copy number analyses identified novel cancer genes in hepatocellular carcinoma, Hepatology (2011) 1227–1236.
- D.B. Smith, G. Kalayanov, C. Sund, A. Winqvist, P. Pinho, T. Maltseva, V. Morisson, V. Leveque, S. Rajyaguru, S. Le Pogam, I. Najera, K. Benkestock, X.X. Zhou, H. Maag, N. Cammack, J.A. Martin, S. Swallow, N.G. Johansson, K. Klumpp, M. Smith, The design, synthesis, and antiviral activity of 4′-azidocytidine analogues against hepatitis C virus replication: The discovery of 4′-azidoarabinocytidine, J Med Chem (2009) 219–223.
- D. Fayzullina, R.K. Kharwar, A. Acharya, A. Buzdin, N. Borisov, P. Timashev, I. Ulasov, B. Kapomba, FNC: An Advanced Anticancer Therapeutic or Just an Underdog?, Front Oncol (2022) 1–8.
- J.L. Zhang, Y.H. Li, L.L. Wang, H.Q. Liu, S.Y. Lu, Y. Liu, K. Li, B. Liu, S.Y. Li, F.M. Shao, K. Wang, N. Sheng, R. Li, J.J. Cui, P.C. Sun, C.X. Ma, B. Zhu, Z. Wang, Y.H. Wan, S.S. Yu, Y. Che, C.Y. Wang, C. Wang, Q. Zhang, L.M. Zhao, X.Z. Peng, Z. Cheng, J.B. Chang, J.D. Jiang, Azvudine is a thymus-homing anti-SARS-CoV-2 drug effective in treating COVID-19 patients, Signal Transduct Target Ther (2021).
- Z. Ren, H. Luo, Z. Yu, J. Song, L. Liang, L. Wang, H. Wang, G. Cui, Y. Liu, J. Wang, Q. Li, Z. Zeng, S. Yang, G. Pei, Y. Zhu, W. Song, W. Yu, C. Song, L. Dong, C. Hu, J. Du, J. Chang, A Randomized, Open-Label, Controlled Clinical Trial of Azvudine Tablets in the Treatment of Mild and Common COVID-19, a Pilot Study, Advanced Science (2020).
- S.B. de Souza, P.G.A. Cabral, R.M. da Silva, R.F. Arruda, S.P. de F. Cabral, A.L.E.M. de Assis, A.B. Viana Junior, W.M.S. Degrave, A. dos S. Moreira, C.G. Silva, J. Chang, P. Lei, Phase III, randomized, double-blind, placebo-controlled clinical study: a study on the safety and clinical efficacy of AZVUDINE in moderate COVID-19 patients, Front Med (Lausanne) 10 (2023).
- L. Sun, Y. Peng, W. Yu, Y. Zhang, L. Liang, C. Song, J. Hou, Y. Qiao, Q. Wang, J. Chen, M. Wu, D. Zhang, E. Li, Z. Han, Q. Zhao, X. Jin, B. Zhang, Z. Huang, J. Chai, J.H. Wang, J. Chang, Mechanistic Insight into Antiretroviral Potency of 2′-Deoxy-2′-β-fluoro-4′-Azidocytidine (FNC) with a Long-Lasting Effect on HIV-1 Prevention, J Med Chem (2020) 8554–8566.
- X. Jing, S. Niu, Y. Liang, H. Chen, N. Wang, Y. Peng, F. Ma, W. Yue, Q. Wang, J. Chang, Y. Zhang, Y. Zhang, FNC inhibits non-small cell lung cancer by activating the mitochondrial apoptosis pathway, Genes Genomics (2022) 123–131.
- Q. Wang, X. Liu, Q. Wang, Y. Zhang, J. Jiang, X. Guo, Q. Fan, L. Zheng, X. Yu, N. Wang, Z. Pan, C. Song, W. Qi, J. Chang, FNC, a novel nucleoside analogue inhibits cell proliferation and tumor growth in a variety of human cancer cells, Biochem Pharmacol (2011) 848–855.
- Y. Zhang, C.P. Wang, X.X. Ding, N. Wang, F. Ma, J.H. Jiang, Q.D. Wang, J.B. Chang, FNC, a novel nucleoside analogue, blocks invasion of aggressive non-Hodgkin lymphoma cell lines via inhibition of the Wnt/beta;-catenin signaling pathway, Asian Pacific Journal of Cancer Prevention (2014) 6829–6835.
- Y. Zhang, R. Zhang, X. Ding, B. Peng, N. Wang, F. Ma, Y. Peng, Q. Wang, J. Chang, FNC efficiently inhibits mantle cell lymphoma growth, PLoS One (2017).
- N. Kumar, V. Delu, I. Ulasov, S. Kumar, R.K. Singh, S. Kumar, A. Shukla, A.K. Patel, L. Yadav, R. Tiwari, K. Rachana, S.P. Mohanta, V. Singh, A. Yadav, K. Kaushalendra, A. Acharya, Pharmacological Insights: Mitochondrial ROS Generation by FNC (Azvudine) in Dalton’s Lymphoma Cells Revealed by Super Resolution Imaging, Cell Biochem Biophys (2024) 873–883.
- N. Kumar, A. Shukla, S. Kumar, I. Ulasov, R.K. Singh, S. Kumar, A. Patel, L. Yadav, R. Tiwari, R. Paswan, S.P. Mohanta, Kaushalendra, J. Antil, A. Acharya, FNC (4′-azido-2′-deoxy-2′-fluoro(arbino)cytidine) as an Effective Therapeutic Agent for NHL: ROS Generation, Cell Cycle Arrest, and Mitochondrial-Mediated Apoptosis, Cell Biochem Biophys (2024) 623–639.
- C.M. Galmarini, J.R. Mackey, C. Dumontet, Nucleoside analogues and nucleobases targets involving DNA repair rather than replication and direct or indirect effects on mitochondria, 2002.
- L.P. Jordheim, D. Durantel, F. Zoulim, C. Dumontet, Advances in the development of nucleoside and nucleotide analogues for cancer and viral diseases, Nat Rev Drug Discov (2013) 447–464.
- Y.H. Yeo, M. Abdelmalek, S. Khan, C.A. Moylan, L. Rodriquez, A. Villanueva, J.D. Yang, Current and emerging strategies for the prevention of hepatocellular carcinoma, Nat Rev Gastroenterol Hepatol (2024).
- C.Y. Wu, J.T. Lin, H.J. Ho, C.W. Su, T.Y. Lee, S.Y. Wang, C. Wu, J.C. Wu, Association of nucleos(T)ide analogue therapy with reduced risk of hepatocellular carcinoma in patients with chronic hepatitis B - A nationwide cohort study, Gastroenterology (2014).
- T. Hosaka, F. Suzuki, M. Kobayashi, Y. Seko, Y. Kawamura, H. Sezaki, N. Akuta, Y. Suzuki, S. Saitoh, Y. Arase, K. Ikeda, M. Kobayashi, H. Kumada, Long-term entecavir treatment reduces hepatocellular carcinoma incidence in patients with hepatitis B virus infection, Hepatology (2013) 98–107.
- P. Marcellin, E. Gane, M. Buti, N. Afdhal, W. Sievert, I.M. Jacobson, M.K. Washington, G. Germanidis, J.F. Flaherty, R.A. Schall, J.D. Bornstein, K.M. Kitrinos, G.M. Subramanian, J.G. McHutchison, E.J. Heathcote, Regression of cirrhosis during treatment with tenofovir disoproxil fumarate for chronic hepatitis B: A 5-year open-label follow-up study, The Lancet (2013) 468–475.
- F. Li, Y. Zhang, C. Liu, J. Li, D. Zhang, Y. Gao, Clinical outcomes of cessation of nucleoside/nucleotide analogues in Chinese patients with HBeAg-negative chronic hepatitis B, ILIVER (2024).
- M. Morikawa, D. Koinuma, K. Miyazono, C.-H. Heldin, Genome-wide mechanisms of Smad binding, Oncogene (2013).
- Y. Muguruma, T. Yahata, T. Warita, K. Hozumi, Y. Nakamura, R. Suzuki, M. Ito, K. Ando, Jagged1-induced Notch activation contributes to the acquisition of bortezomib resistance in myeloma cells, Blood Cancer J (2017).
- Z. Liu, A.J. Sanders, G. Liang, E. Song, W.G. Jiang, C. Gong, Hey factors at the crossroad of tumorigenesis and clinical therapeutic modulation of hey for anticancer treatment, Mol Cancer Ther (2017) 775–786.
- T. Brabletz, R. Kalluri, M.A. Nieto, R.A. Weinberg, EMT in cancer, Nat Rev Cancer (2018) 128–134.
- H. Nakabayashi, K. Taketa, K. Miyano, T. Yamane, J. Sato1, Growth of Human Hepatoma Cell Lines with Differentiated Functions in Chemically Defined Medium, n.d.
- D.P. Aden, A. Fogel, S. Plotkin, I. Damjanov, B.B. Knowles, Controlled synthesis of HBsAg in a differentiated human liver carcinoma-derived cell line, 1979.
- K. Fukuyama, M. Asagiri, M. Sugimoto, H. Tsushima, S. Seo, K. Taura, S. Uemoto, K. Iwaisako, Gene expression profiles of liver cancer cell lines reveal two hepatocyte-like and fibroblast-like clusters, PLoS One (2021).
- M. Wang, S. Weng, C. Li, Y. Jiang, X. Qian, P. Xu, W. Ying, Proteomic overview of hepatocellular carcinoma cell lines and generation of the spectral library, Sci Data (2022).
- M. Uhlén, E. Björling, C. Agaton, C.A.K. Szigyarto, B. Amini, E. Andersen, A.C. Andersson, P. Angelidou, A. Asplund, C. Asplund, L. Berglund, K. Bergström, H. Brumer, D. Cerjan, M. Ekström, A. Elobeid, C. Eriksson, L. Fagerberg, R. Falk, J. Fall, M. Forsberg, M.G. Björklund, K. Gumbel, A. Halimi, I. Hallin, C. Hamsten, M. Hansson, M. Hedhammar, G. Hercules, C. Kampf, K. Larsson, M. Lindskog, W. Lodewyckx, J. Lund, J. Lundeberg, K. Magnusson, E. Malm, P. Nilsson, J. Ödling, P. Oksvold, I. Olsson, E. Öster, J. Ottosson, L. Paavilainen, A. Persson, R. Rimini, J. Rockberg, M. Runeson, Å. Sivertsson, A. Sköllermo, J. Steen, M. Stenvall, F. Sterky, S. Strömberg, M. Sundberg, H. Tegel, S. Tourle, E. Wahlund, A. Waldén, J. Wan, H. Wernérus, J. Westberg, K. Wester, U. Wrethagen, L.L. Xu, S. Hober, F. Pontén, A human protein atlas for normal and cancer tissues based on antibody proteomics, Molecular and Cellular Proteomics (2005) 1920–1932.
- F. Pontén, K. Jirström, M. Uhlen, The Human Protein Atlas - A tool for pathology, Journal of Pathology (2008) 387–393.
- Y. Meng, S. Sanlidag, S.A. Jensen, S.A. Burnap, W.B. Struwe, A.H. Larsen, X. Feng, S. Mittal, M.S.P. Sansom, C. Sahlgren, P.A. Handford, An N-glycan on the C2 domain of JAGGED1 is important for Notch activation, Sci Signal (2022).
- M.R. Zeronian, O. Klykov, J. Portell I de Montserrat, M.J. Konijnenberg, A. Gaur, R.A. Scheltema, B.J.C. Janssen, Notch-Jagged signaling complex defined by an interaction mosaic., Proc Natl Acad Sci U S A (2021).
- P. Taylor, H. Takeuchi, D. Sheppard, C. Chillakuri, S.M. Lea, R.S. Haltiwanger, P.A. Handford, Fringe-mediated extension of O-linked fucose in the ligand-binding region of Notch1 increases binding to mammalian Notch ligands., Proc Natl Acad Sci (2014) 7290–5.
- V.C. Luca, K.M. Jude, N.W. Pierce, M. V. Nachury, S. Fischer, K.C. Garcia, Structural basis for Notch1 engagement of Delta-like 4, Science (1979) 347 (2015) 847–853.
- V.C. Luca, B.C. Kim, C. Ge, S. Kakuda, D. Wu, M. Roein-Peikar, R.S. Haltiwanger, C. Zhu, T. Ha, K.C. Garcia, Notch-Jagged complex structure implicates a catch bond in tuning ligand sensitivity, Science (1979) 355 (2017) 1320–1324.
- C.R. Chillakuri, D. Sheppard, M. Xenia, G. Ilagan, L.R. Holt, F. Abbott, S. Liang, R. Kopan, P.A. Handford, S.M. Lea, Structural Analysis Uncovers Lipid-Binding Properties of Notch Ligands, CellReports (2013) 861–867.
- R.J. Suckling, B. Korona, P. Whiteman, C. Chillakuri, L. Holt, P.A. Handford, S.M. Lea, Structural and functional dissection of the interplay between lipid and Notch binding by human Notch ligands, EMBO J (2017) 2204–2215.
- C.J. Wienken, P. Baaske, U. Rothbauer, D. Braun, S. Duhr, Protein-binding assays in biological liquids using microscale thermophoresis, Nat Commun (2010).
- H.J.C. Berendsen, D. van der Spoel, R. van Drunen, GROMACS: A message-passing parallel molecular dynamics implementation, Comput Phys Commun (1995) 43–56.
- M.J. Abraham, T. Murtola, R. Schulz, S. Páll, J.C. Smith, B. Hess, E. Lindah, Gromacs: High performance molecular simulations through multi-level parallelism from laptops to supercomputers, SoftwareX 1–2 (2015) 19–25.
- D. Van Der Spoel, E. Lindahl, B. Hess, G. Groenhof, A.E. Mark, H.J.C. Berendsen, GROMACS: Fast, flexible, and free, J Comput Chem (2005) 1701–1718.
- K. Lindorff-Larsen, S. Piana, K. Palmo, P. Maragakis, J.L. Klepeis, R.O. Dror, D.E. Shaw, Improved side-chain torsion potentials for the Amber ff99SB protein force field, Proteins: Structure, Function and Bioinformatics (2010) 1950–1958.
- Tian Lu, Sobtop, Version [1.0(dev5)], (n.d.). http://sobereva.com/soft/Sobtop (accessed December 2, 2024).
Figure 1.
Impacts of FNC on cell invasion of various HCC cell lines. Three independent experiments were conducted, and representative images captured at 24 hours are presented. 10 μM FNC significantly inhibited cell invasion in Huh7 cells, but not in HepG2 or PLC/PRF/5 cells. Comparisons between two groups were performed using a two-tailed unpaired t-test. ns, no significant difference; ****P ≤ 0.0001. Scale bar, 20 μm.
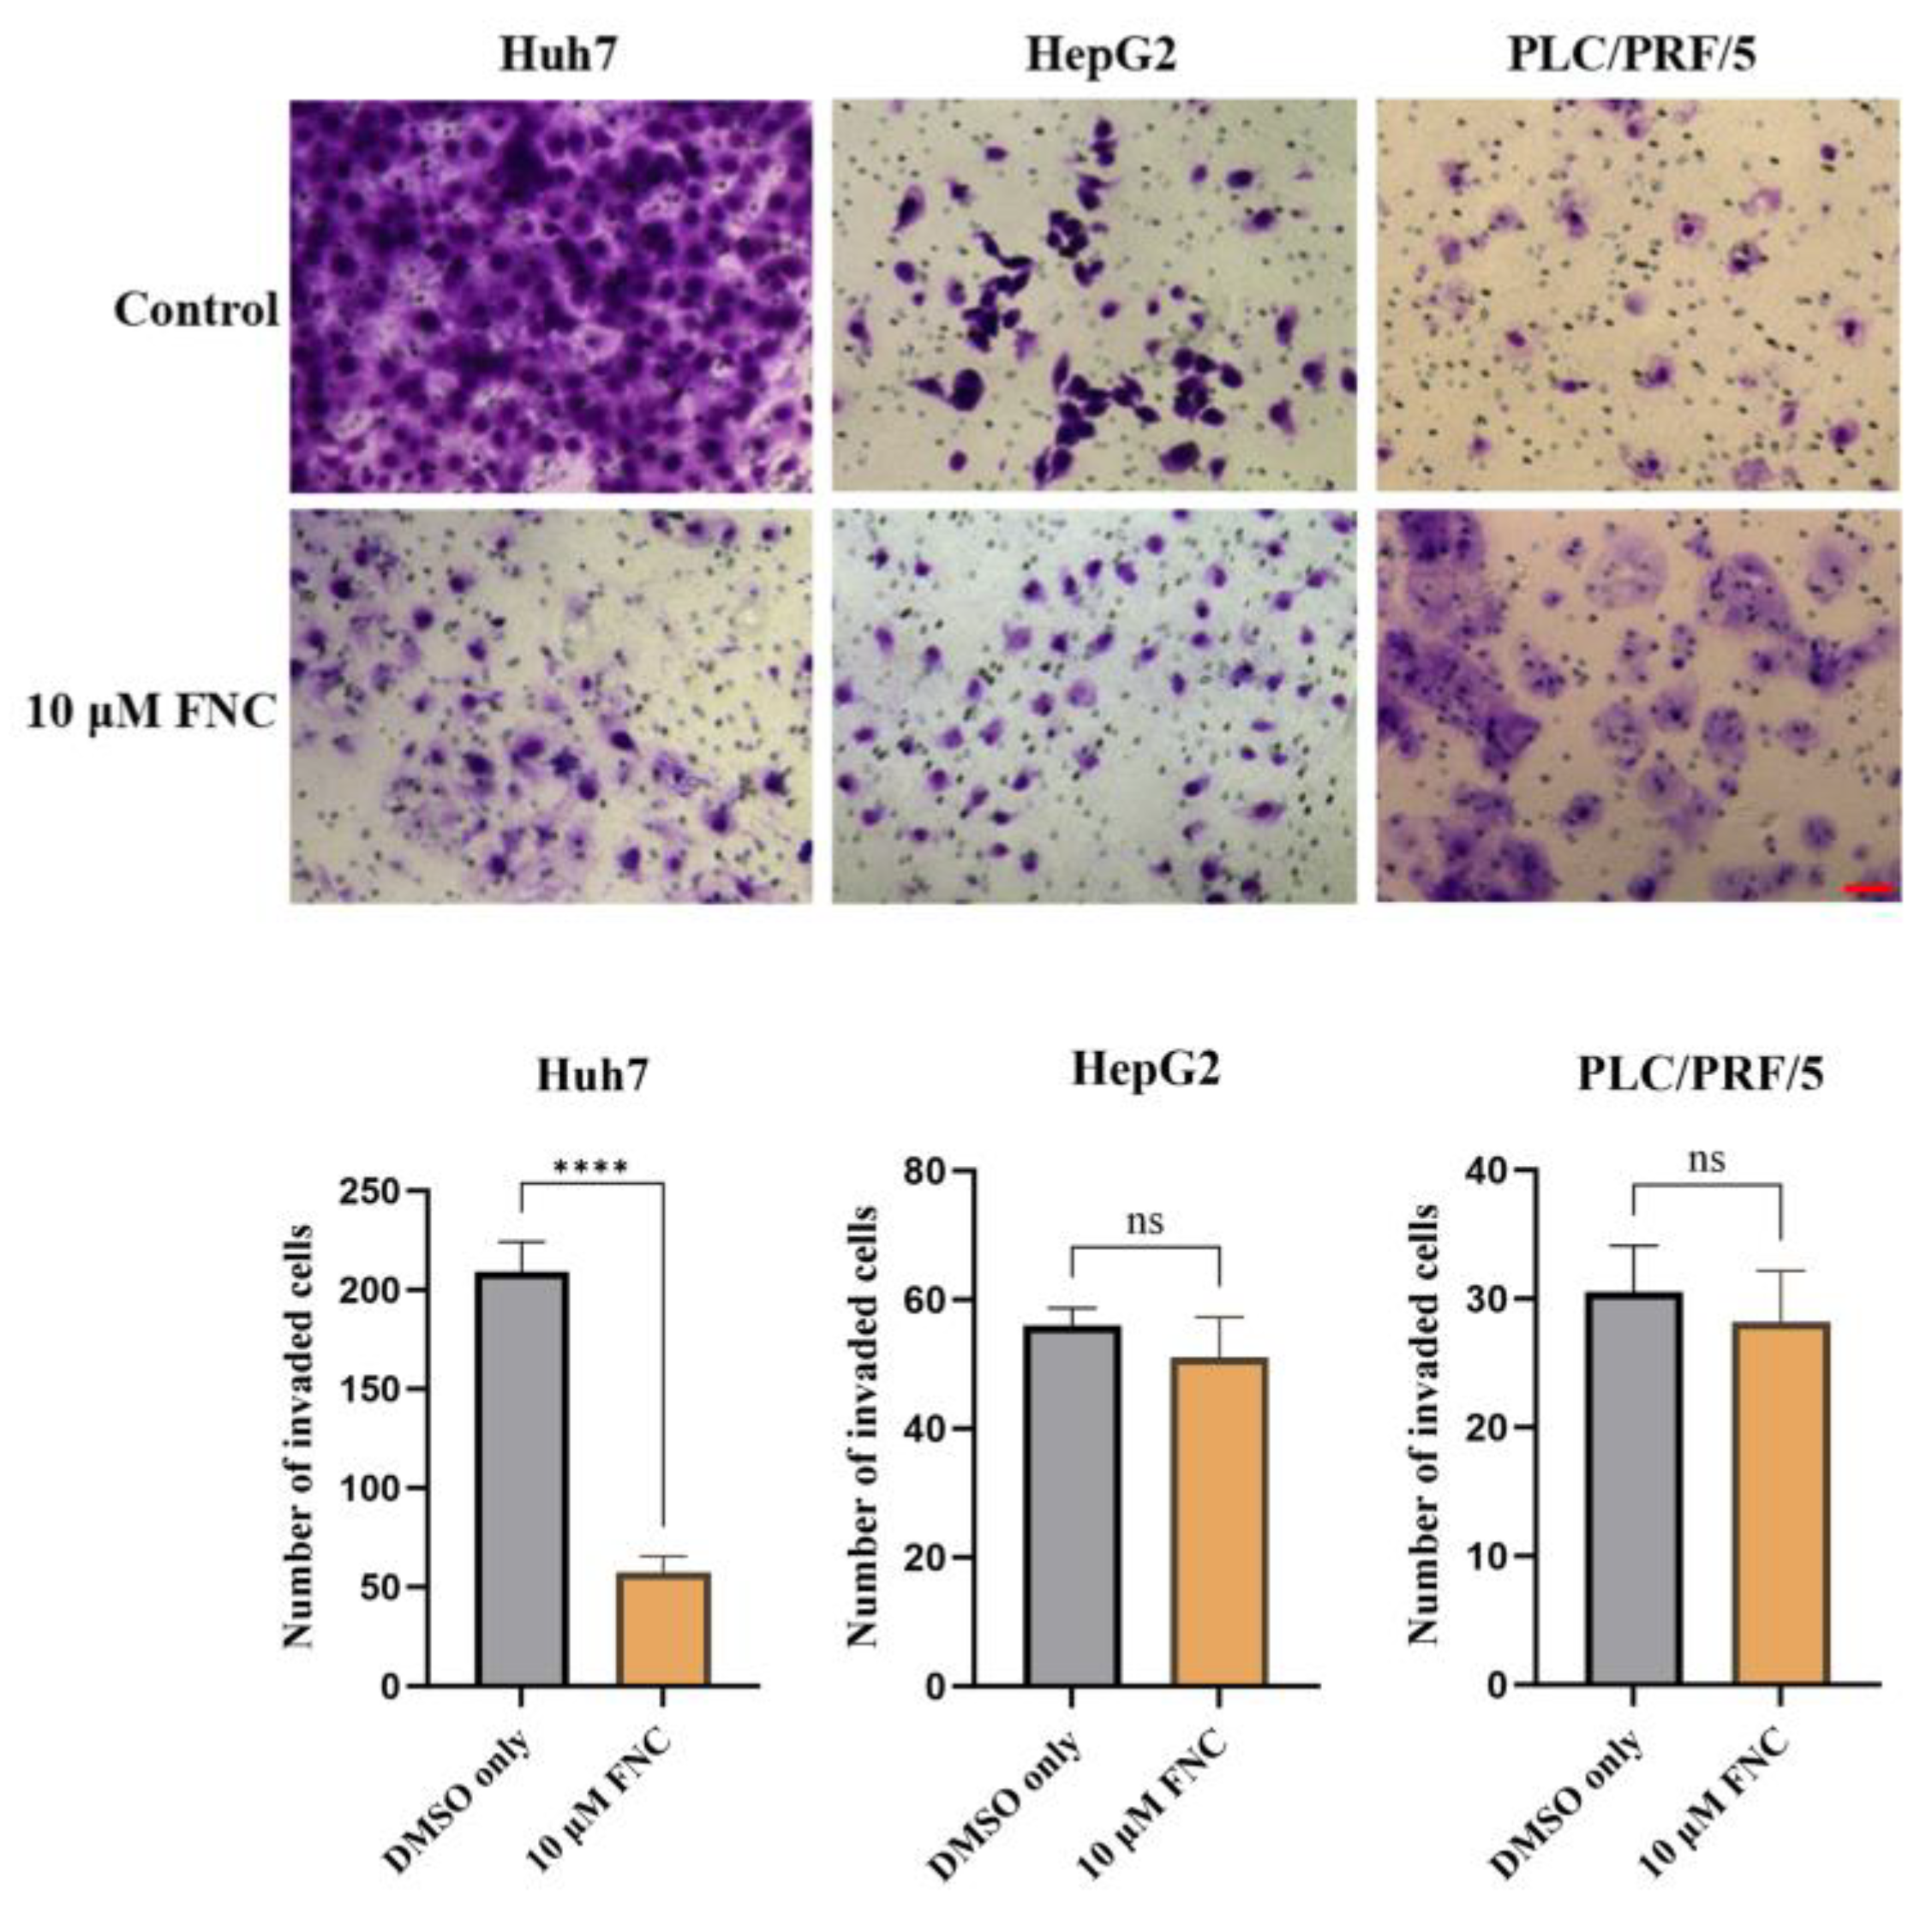
Figure 2.
The cytotoxicity, anti-migration and anti-invasion effects of FNC. (A-C) Cytotoxicity assay results demonstrating the effects of FNC on Huh7 (A), HepG2 (B) and PLC/PRF/5 (C) cells. HCC cells were treated with varying concentrations of FNC or DMSO for 48 hours, and cell viability was analysed using a CCK-8 colorimetric assay. The orange dotted line indicates the IC50 (the concentration at which 50% inhibition occurs). Data are presented as the mean ± SEM of three independent experiments. (D) The chemical structure of FNC. (E) Immunofluorescence microscopy images of Huh7 cells treated with DMSO (control) or 40 μM FNC. Cells were stained with DAPI (blue) to visualize nuclei and Phalloidin (green) to stain actin filaments. Images are representative of three independent experiments. Scale bar: 100 µm. (F) Effect of FNC on the mobility of Huh7 cells. Representative images of the wound healing assay at 0, 24 and 48 hours are shown. Values are presented as mean ± SEM from three independent experiments. Scale bar, 20 μm. (G) Inhibitory effect of FNC on Huh7 cell invasion. Three independent experiments were performed, and representative images at 24 and 48 hours are shown. Results are presented as mean ± SEM. Scale bar, 20 μm.
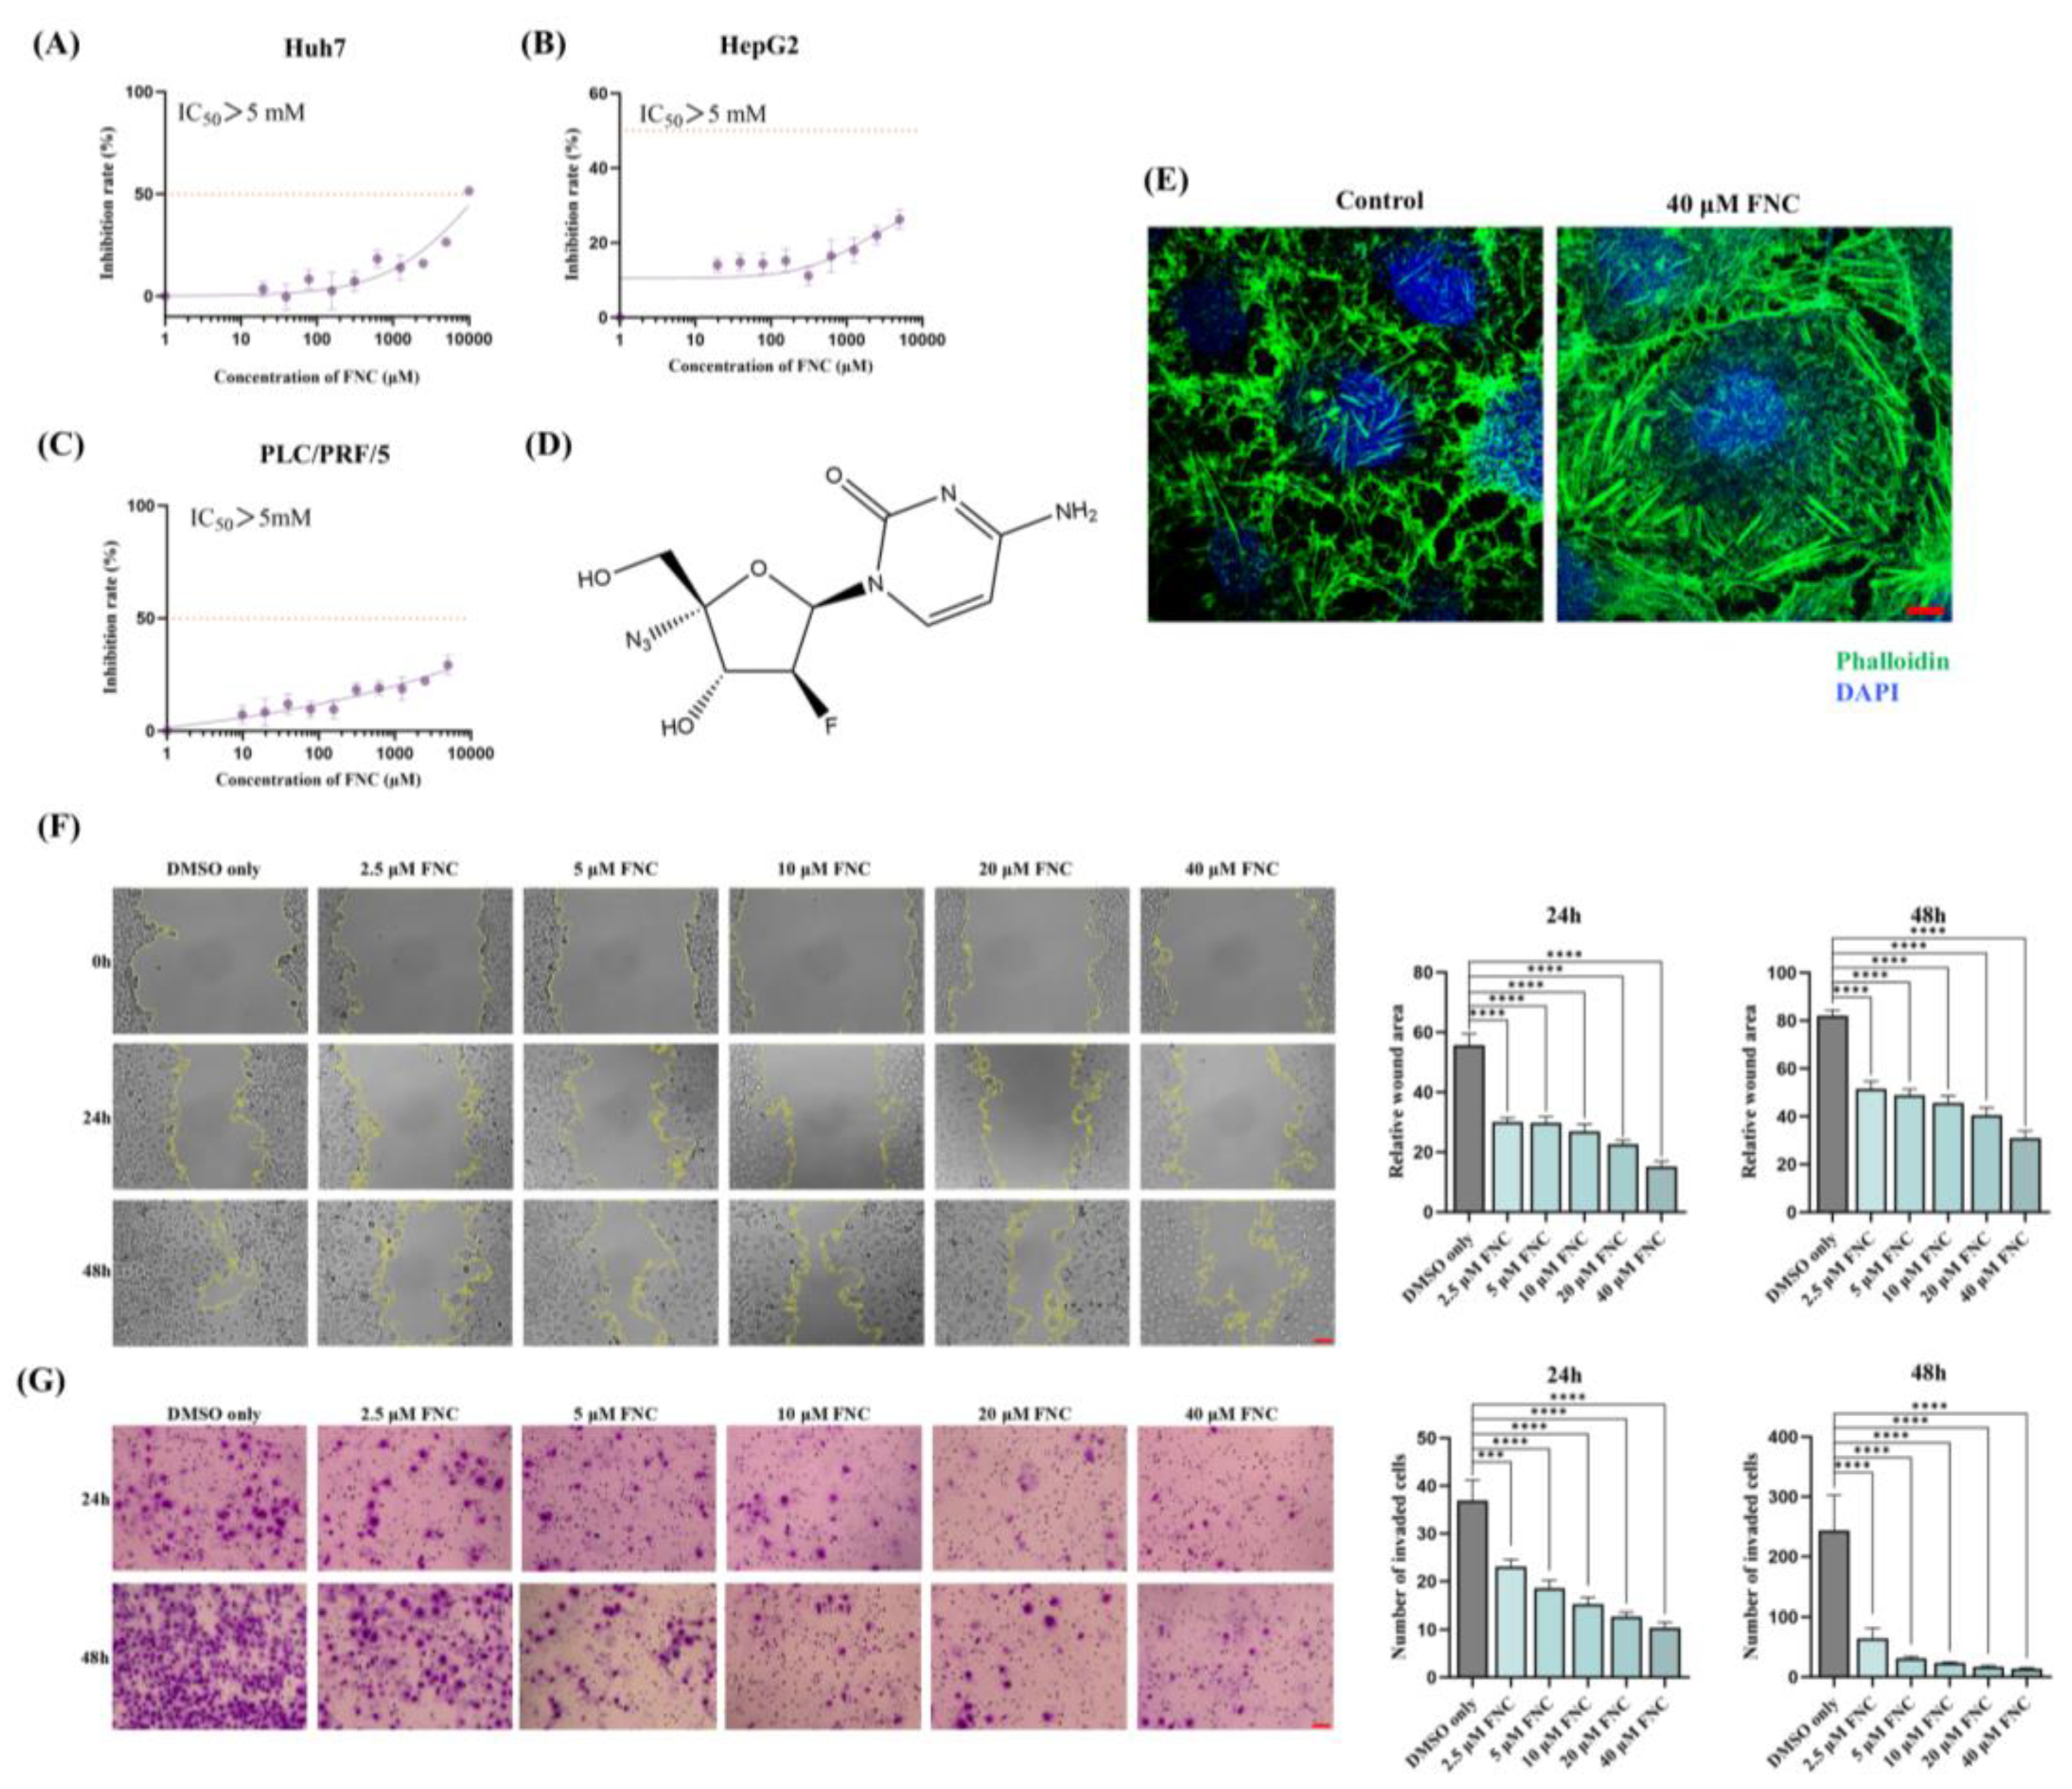
Figure 3.
FNC alters a subset of EMT markers in Huh7 cells. (A) Immunoblot analysis showing the expression levels of EMT markers, including N-Cadherin, E-Cadherin, MMP2, Snail and Vimentin, in Huh7 cells after 48 hours of FNC treatment. Only DMSO was used to treat the control group. β-actin was used as a loading control. A representative blot from three independent experiments is shown. Protein expression levels were analysed using ImageJ and are presented as the mean ± SD. ns, no significant difference; *P ≤ 0.05; **P ≤ 0.01; ****P ≤ 0.0001. (B) Expression levels of EMT marker genes relative to GAPDH in Huh7 cells, analyse by real-time PCR. Values are presented together with the mean ± SD. ns, no significant difference; ****P ≤ 0.0001.
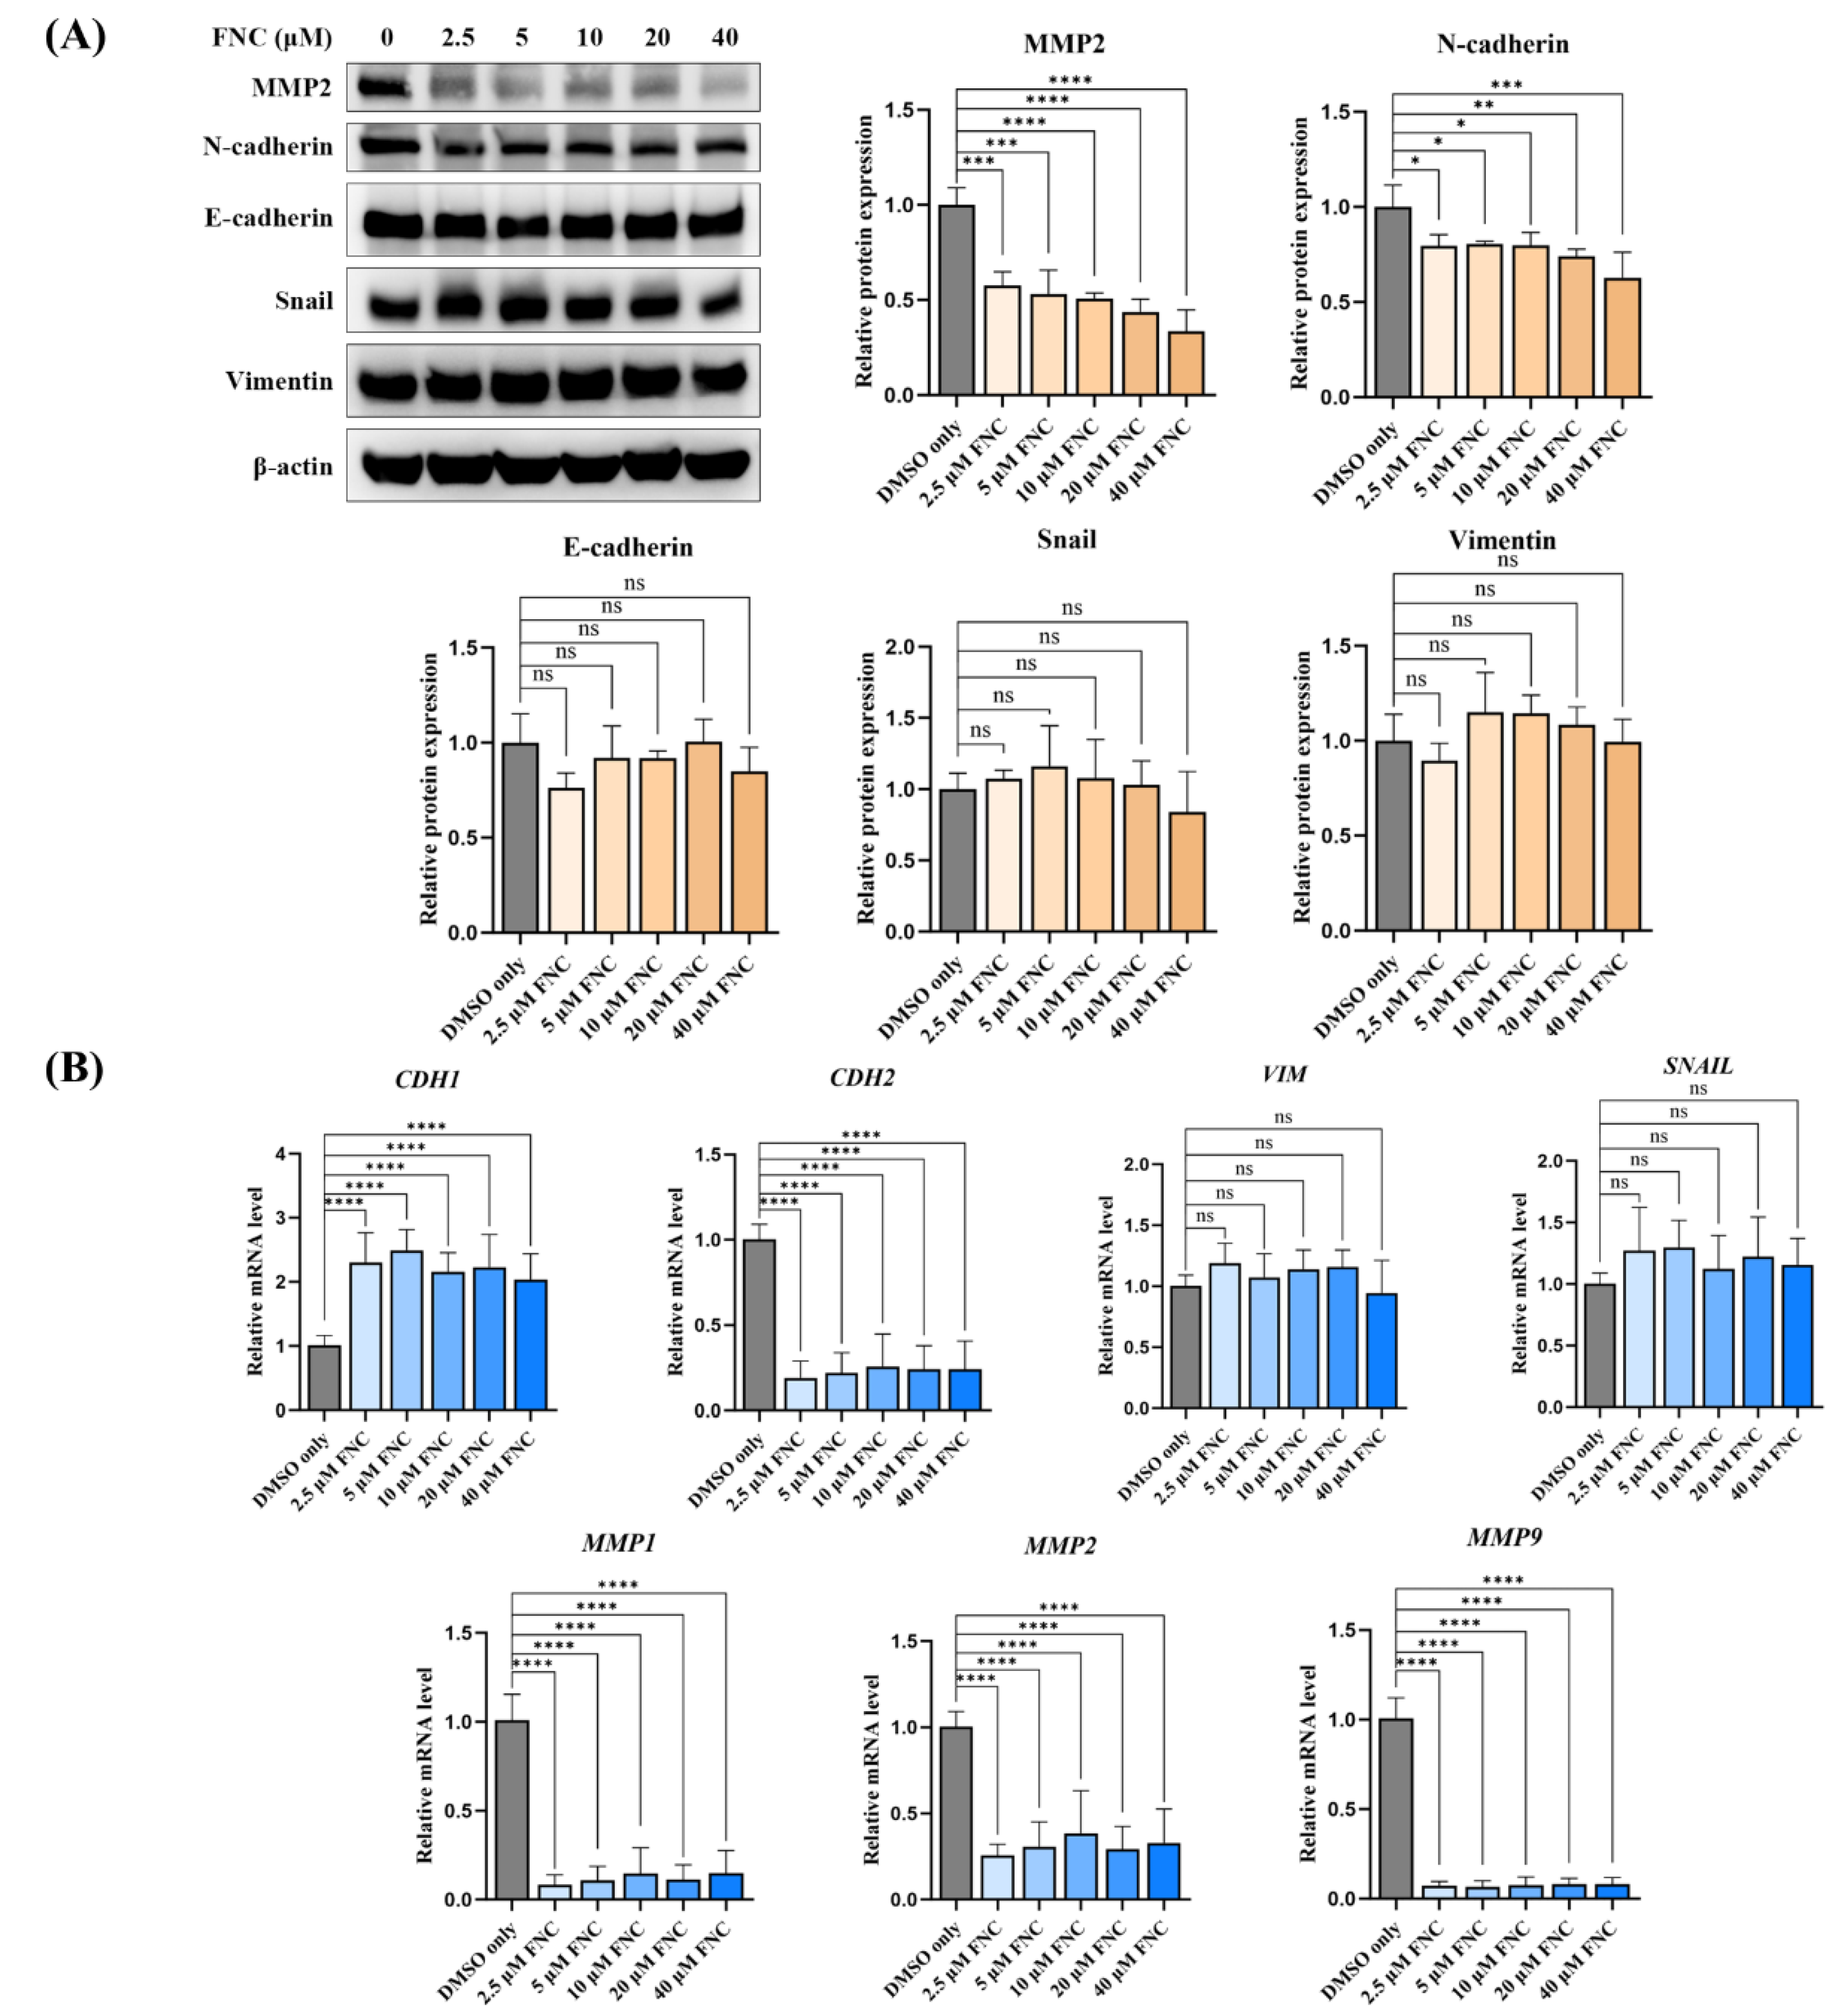
Figure 4.
FNC significantly altered the transcriptional profile of Huh7 cells. (A) Venn diagram showing the number of genes identified across different sets of RNA-Seq data comparisons. The green area represents genes from the control group (Huh7 cells treated with DMSO for 48 hours). The blue, yellow and pink areas represent genes from Huh7 cells treated with 2.5 μM (low), 20 μM (medium), 40 μM (high) FNC, respectively. Numbers in the overlapping regions indicate gene numbers shared between multiple groups. (B) Gene set enrichment analysis (GSEA) showing significant enrichment of liver disease and liver failure gene sets in the control group compared to Huh7 cells treated with 40 μM FNC. The GSEA enrichment plots illustrate the distribution of the enrichment score (green line) across genes associated with the respective disease (vertical black lines), ranked by their anti-disease activity (left to right). Liver failure (p value = 0.0; NES = -1.769), liver disease (p value = 0.0; NES = -1.508), liver cirrhosis (p value = 0.0; NES = -1.516) and fatty liver (alcoholic) (p value = 0.0; NES = -1.779) were identified as significantly enriched targets. (C) Hierarchical clustering of differentially expressed genes in the control, low, medium and high groups of Huh7 cells. The heatmap uses a color scale relative to each gene (each row) with blue representing the lowest expression and red indicating the highest expression.
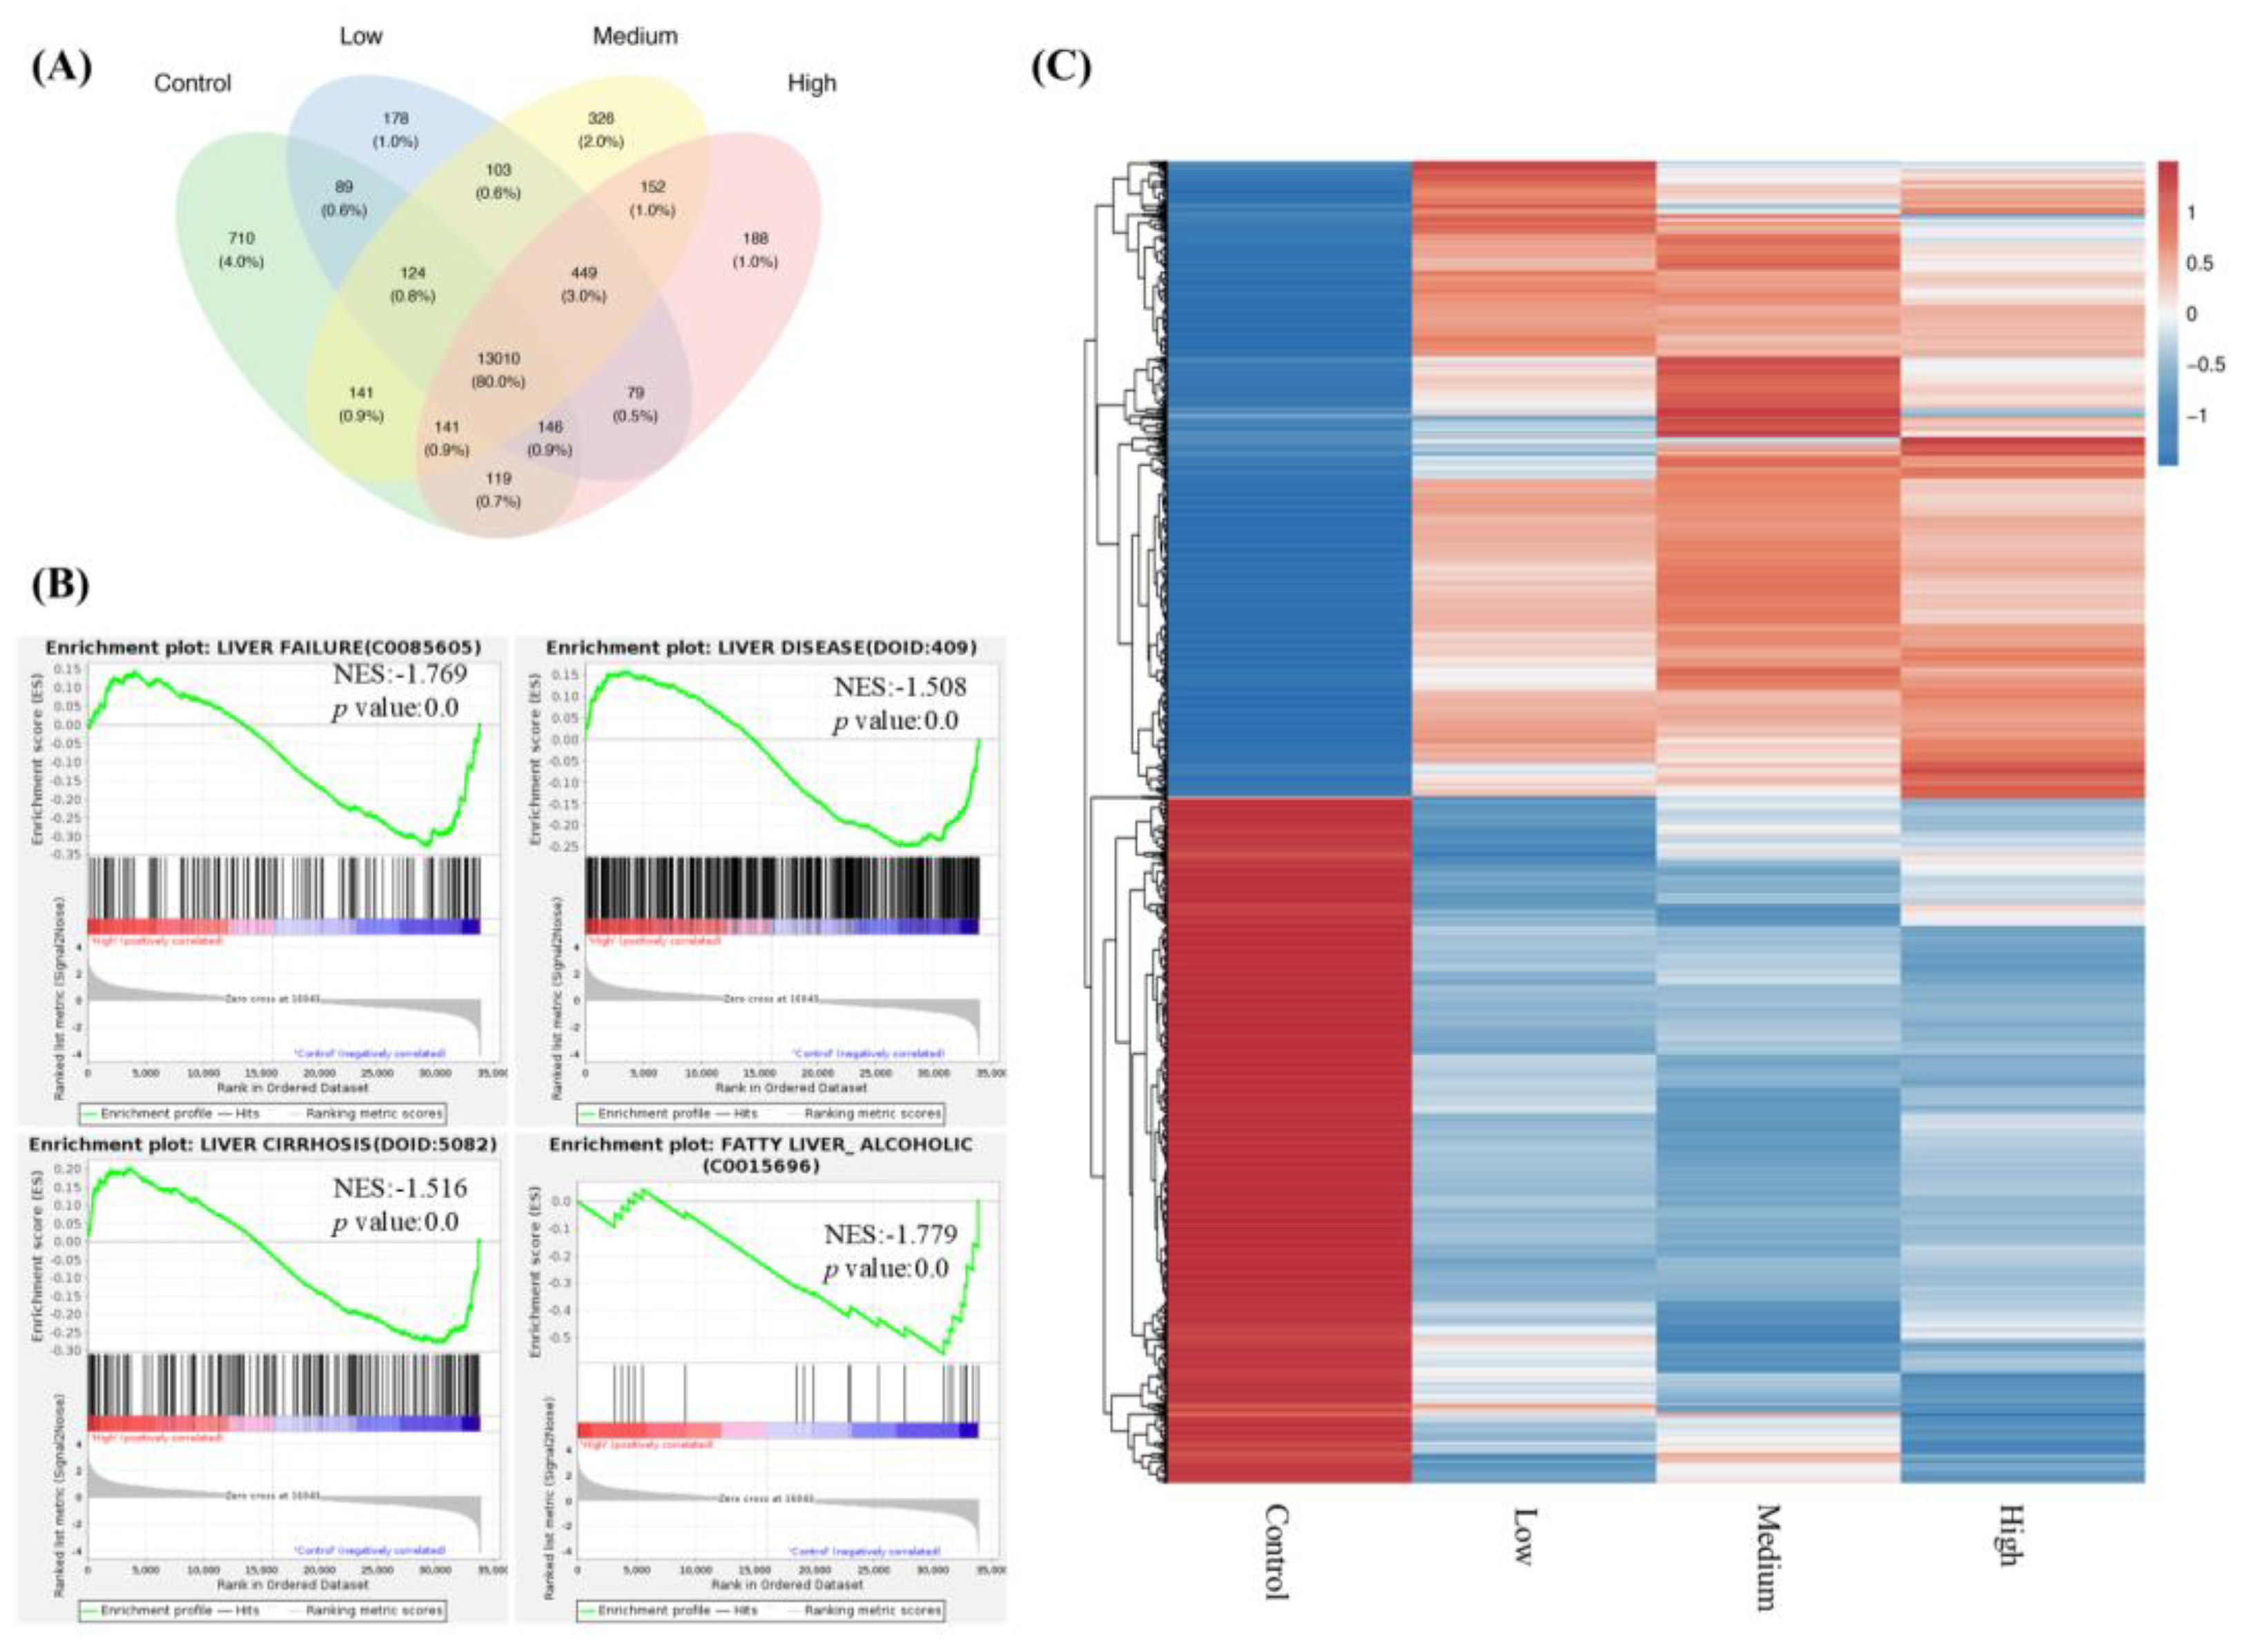
Figure 5.
FNC inhibits the expression of HEY factors in Huh7 cell lines. (A) Enrichment plots showing changes in the Notch expression and processing gene set after FNC treatment in Huh7 cells. (B) Total RNA was collected from Huh7 cells and analysed using real-time PCR after 48 hours of FNC treatment. The control group was treated with DMSO only. A comparative Ct (ΔΔCt) analysis was performed to calculate fold changes in mRNA expression relative to GAPDH. The experiment was independently performed in triplicate. (C) Protein expression levels of HEY1 and HEYL were analysed by western blot after 48 hours of FNC treatment at the indicated concentrations. β-actin was used as a loading control. Three independent experiments were performed, and a representative blot is shown. ****P ≤ 0.0001. (D) HEY1 with a C-terminal Myc tag was overexpressed in Huh7 cells, followed by treating with 2.5, 10 or 40 μM FNC. Three independent experiments were performed, and data are presented as mean ± SD. (E) HEY1 expression levels in Huh7, HepG2 and PLC/PRF/5 cells were detected by Western Blotting. Three independent experiments were performed. Data are presented as mean ± SD.
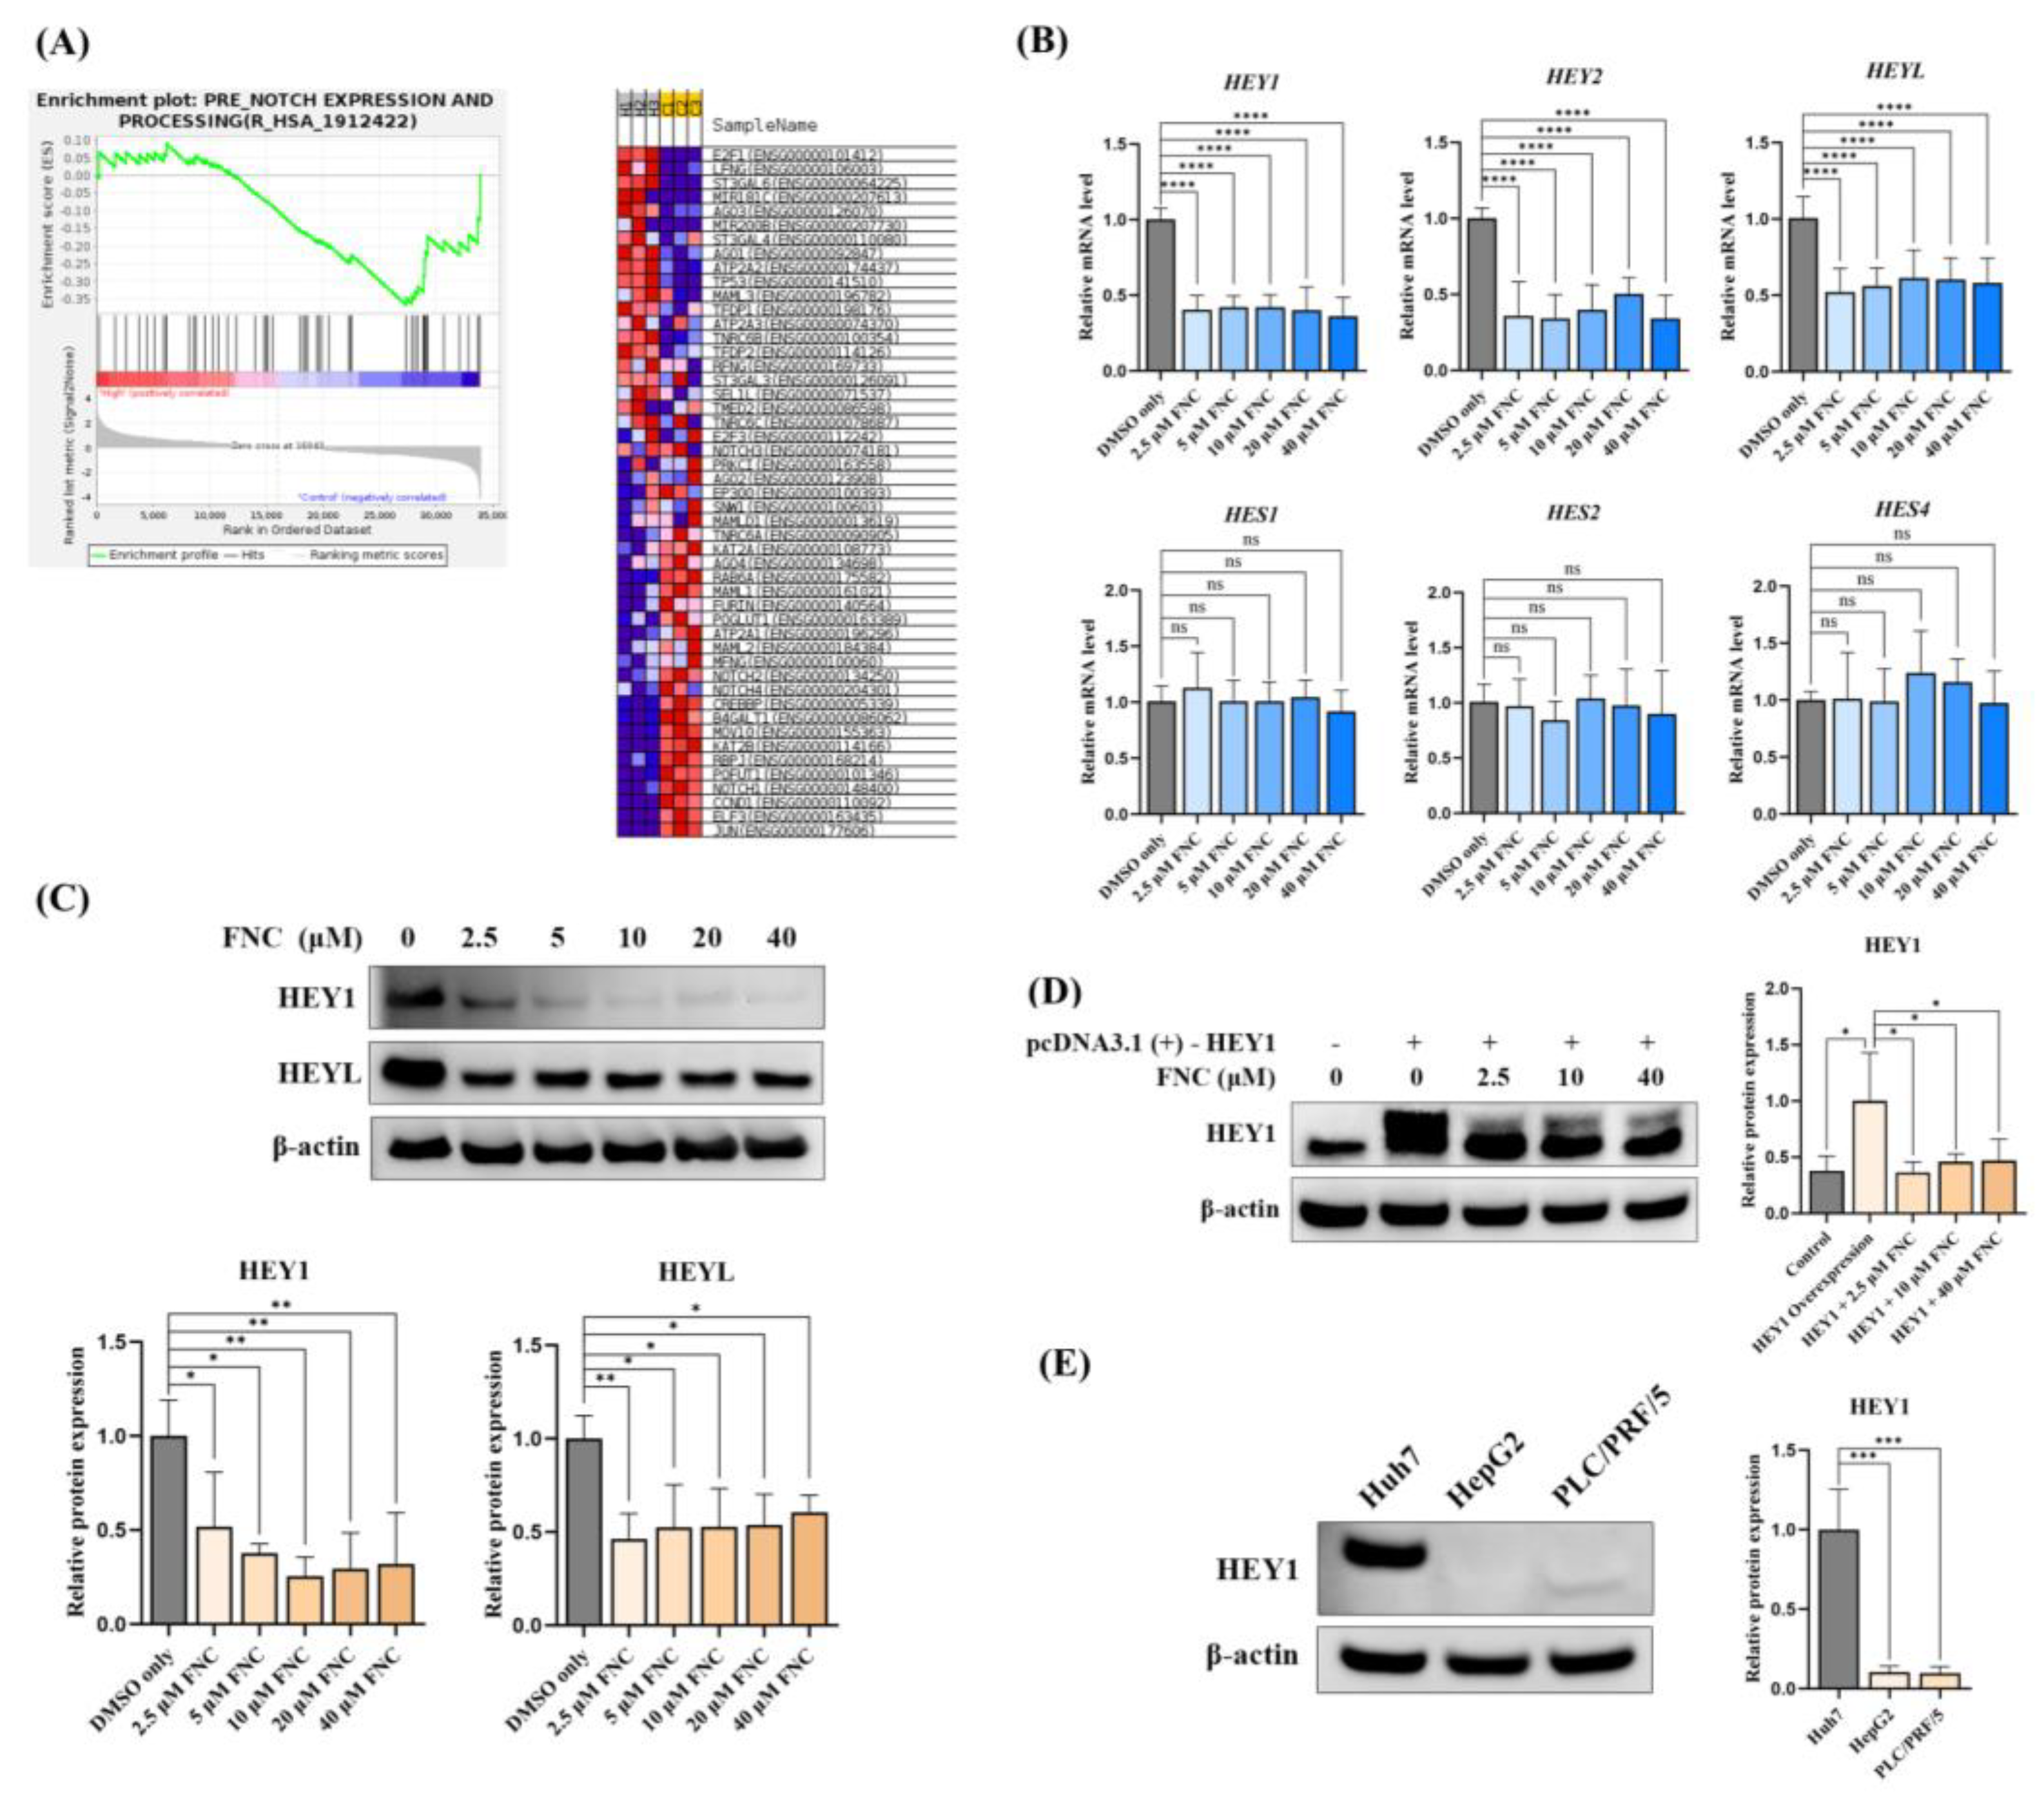
Figure 6.
FNC interacts with Jagged1. (A) The interaction between FNC and Jagged1 (teal) as proposed by molecular docking. Notch1 (grey) was modelled onto the Jagged1 structure based on the Jagged1-Notch1 complex structure (PDB: 5UK5). Hydrogen bond interactions with residues on the C2 domain are shown. (B) Binding of FNC to Jagged1-Fc is quantified in HEPES buffer. FNC was titrated at concentrations ranging from 0.015 to 500 μM, while the concentration of Jagged1-Fc was kept constant at 1 μM. A representative MST binding curve is shown. The KD value is the average of triplicate measurements. (C) MD simulation of the Jagged1-FNC complex over a 1000 ns simulation. The MD trajectories show the protein-to-drug center-of-mass distance. The green trajectories represent relatively stable confirmations, indicating relatively consistent interactions between Jagged1 and FNC. (D) Jagged1, DLL4, Notch1 and cleaved Notch1 was detected by immunoblotting. Three independent experiments were performed, and data were assessed using ordinary one-way ANOVA with comparisons to the mean of the 2.5 μM FNC-treated sample. ns, no significant difference; *P ≤ 0.05; ** P ≤ 0.01; ***P ≤ 0.001.
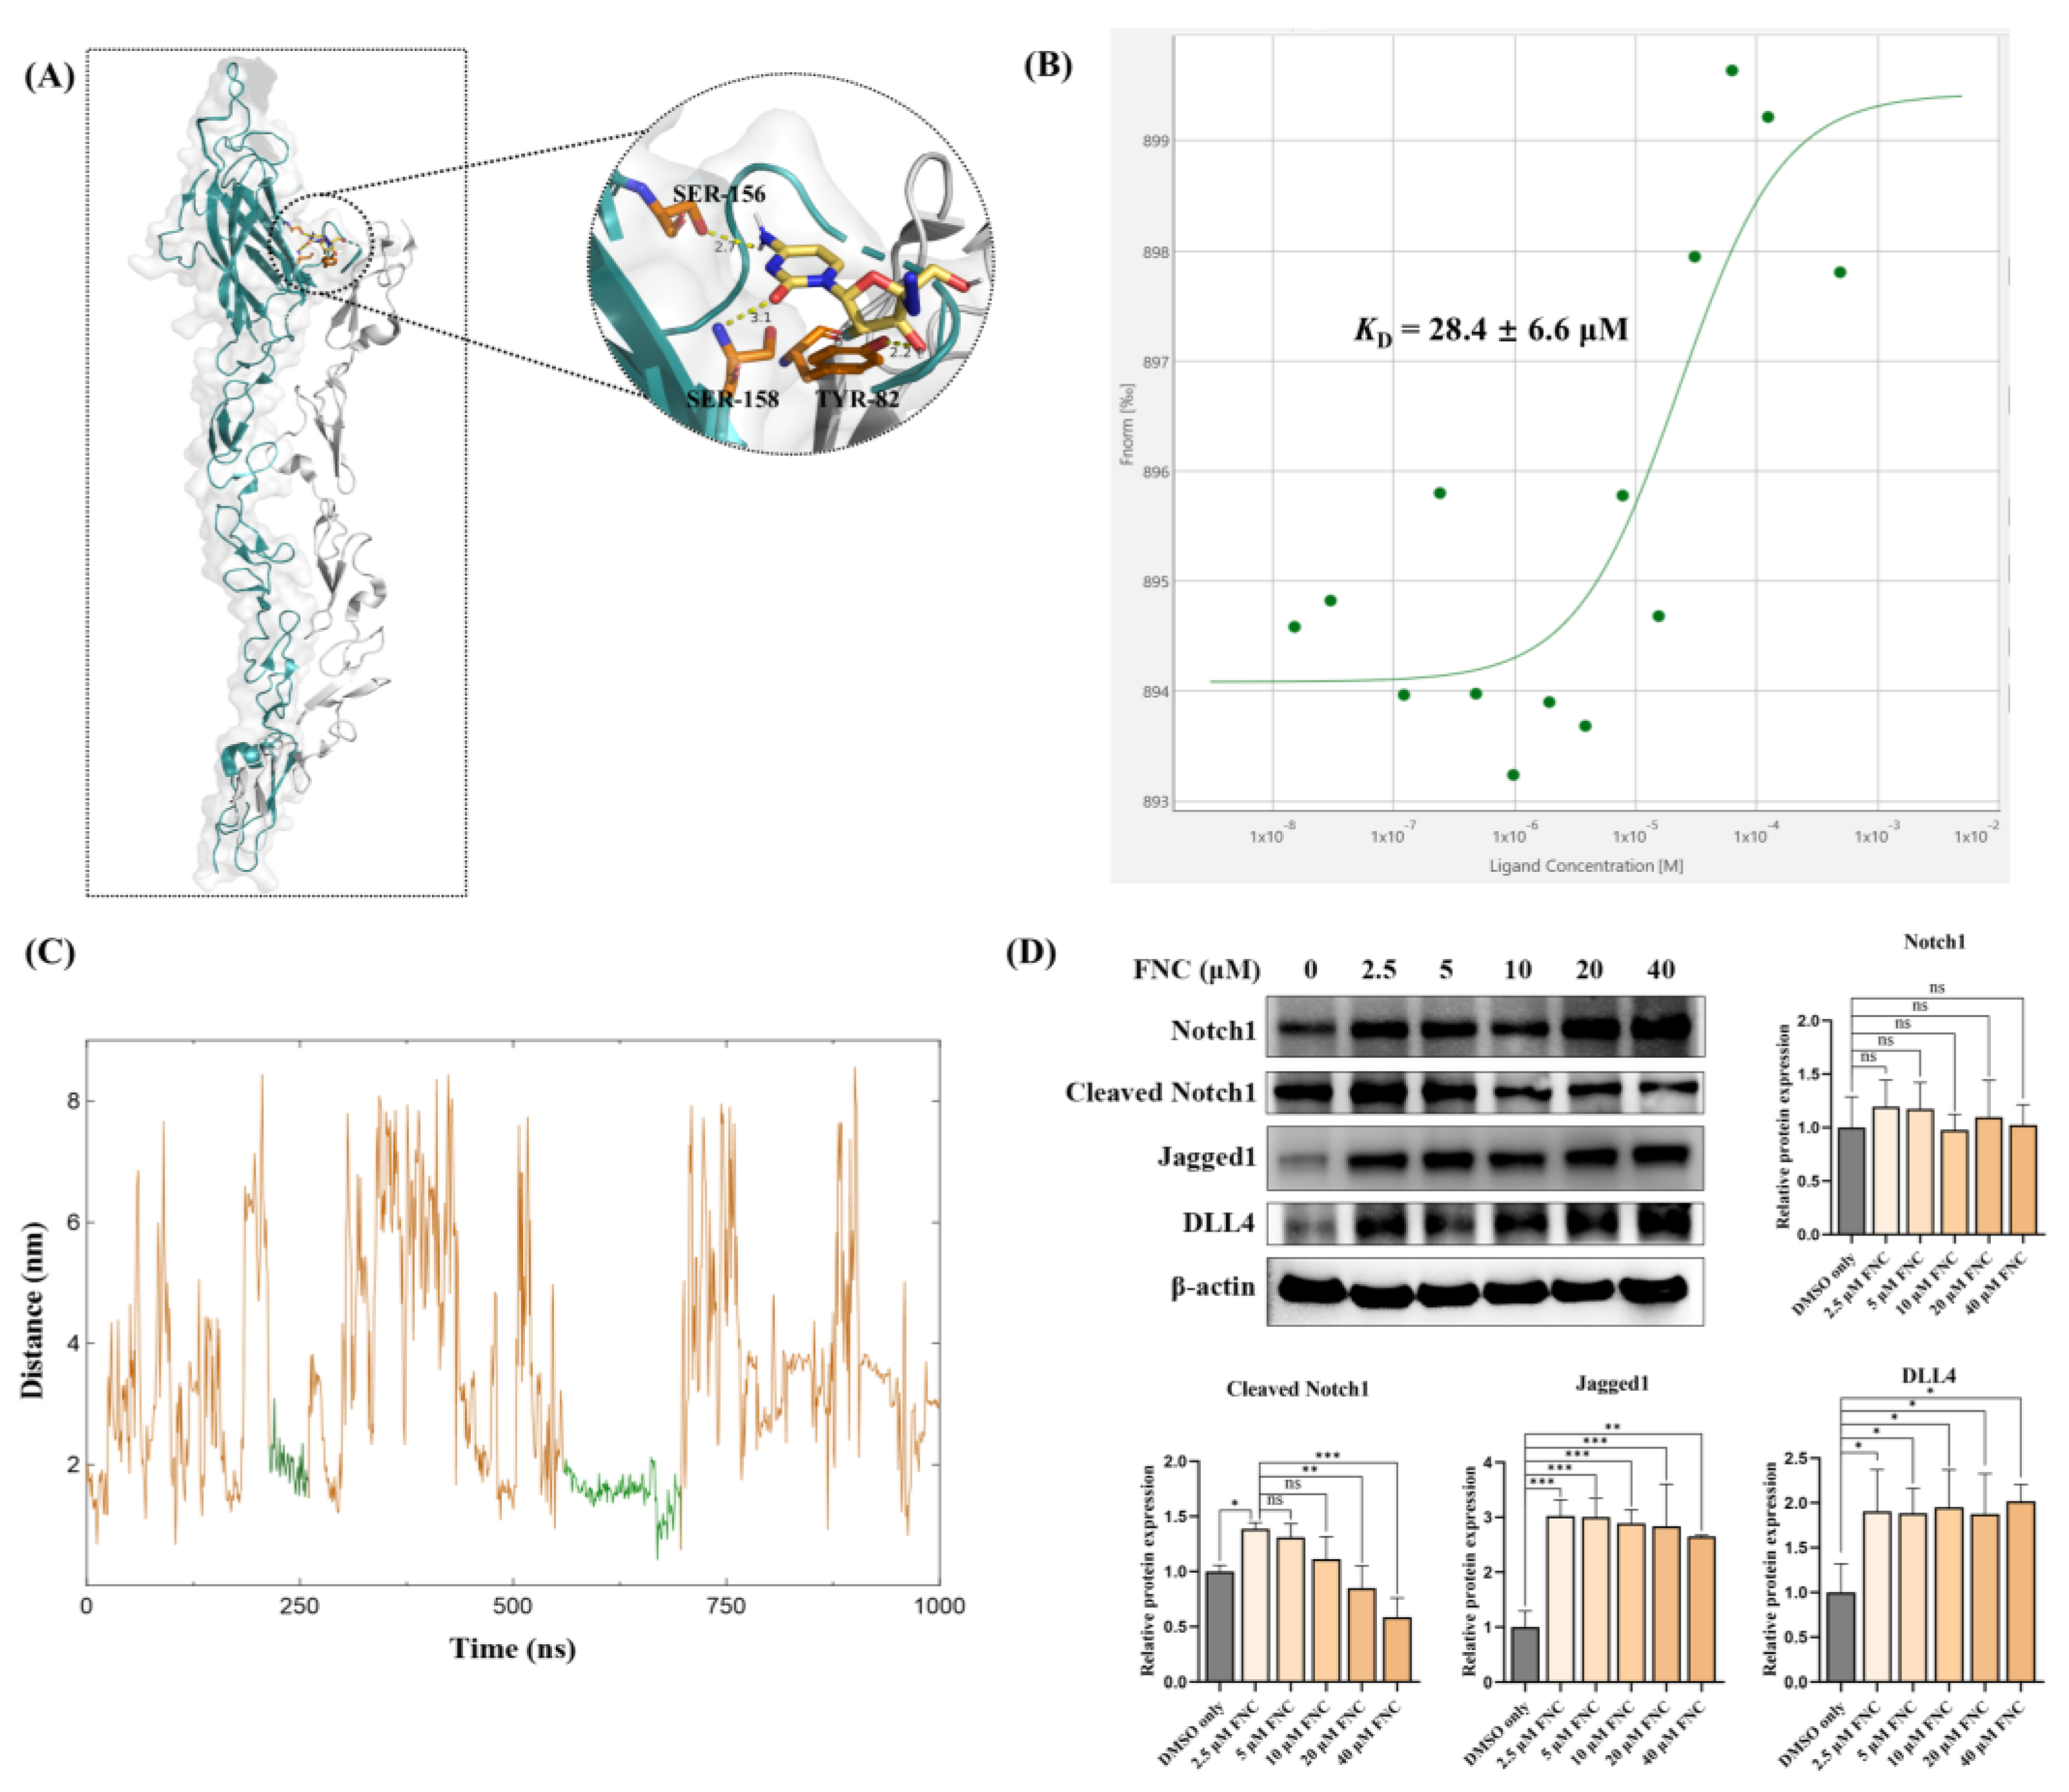
Figure 7.
Effects of FNC on transcription levels of Notch ligands and receptors. Q-PCR analysis was performed to evaluate the transcription levels of Jagged1, Jagged2, DLL4, Notch1, Notch3 and Notch4 in Huh7 cells treated with 2.5, 5, 10, 20, 40 μM FNC. Significant upregulation of Jagged1 and DLL4 mRNA levels were observed. Data represent the mean ± SD from three independent experiments.
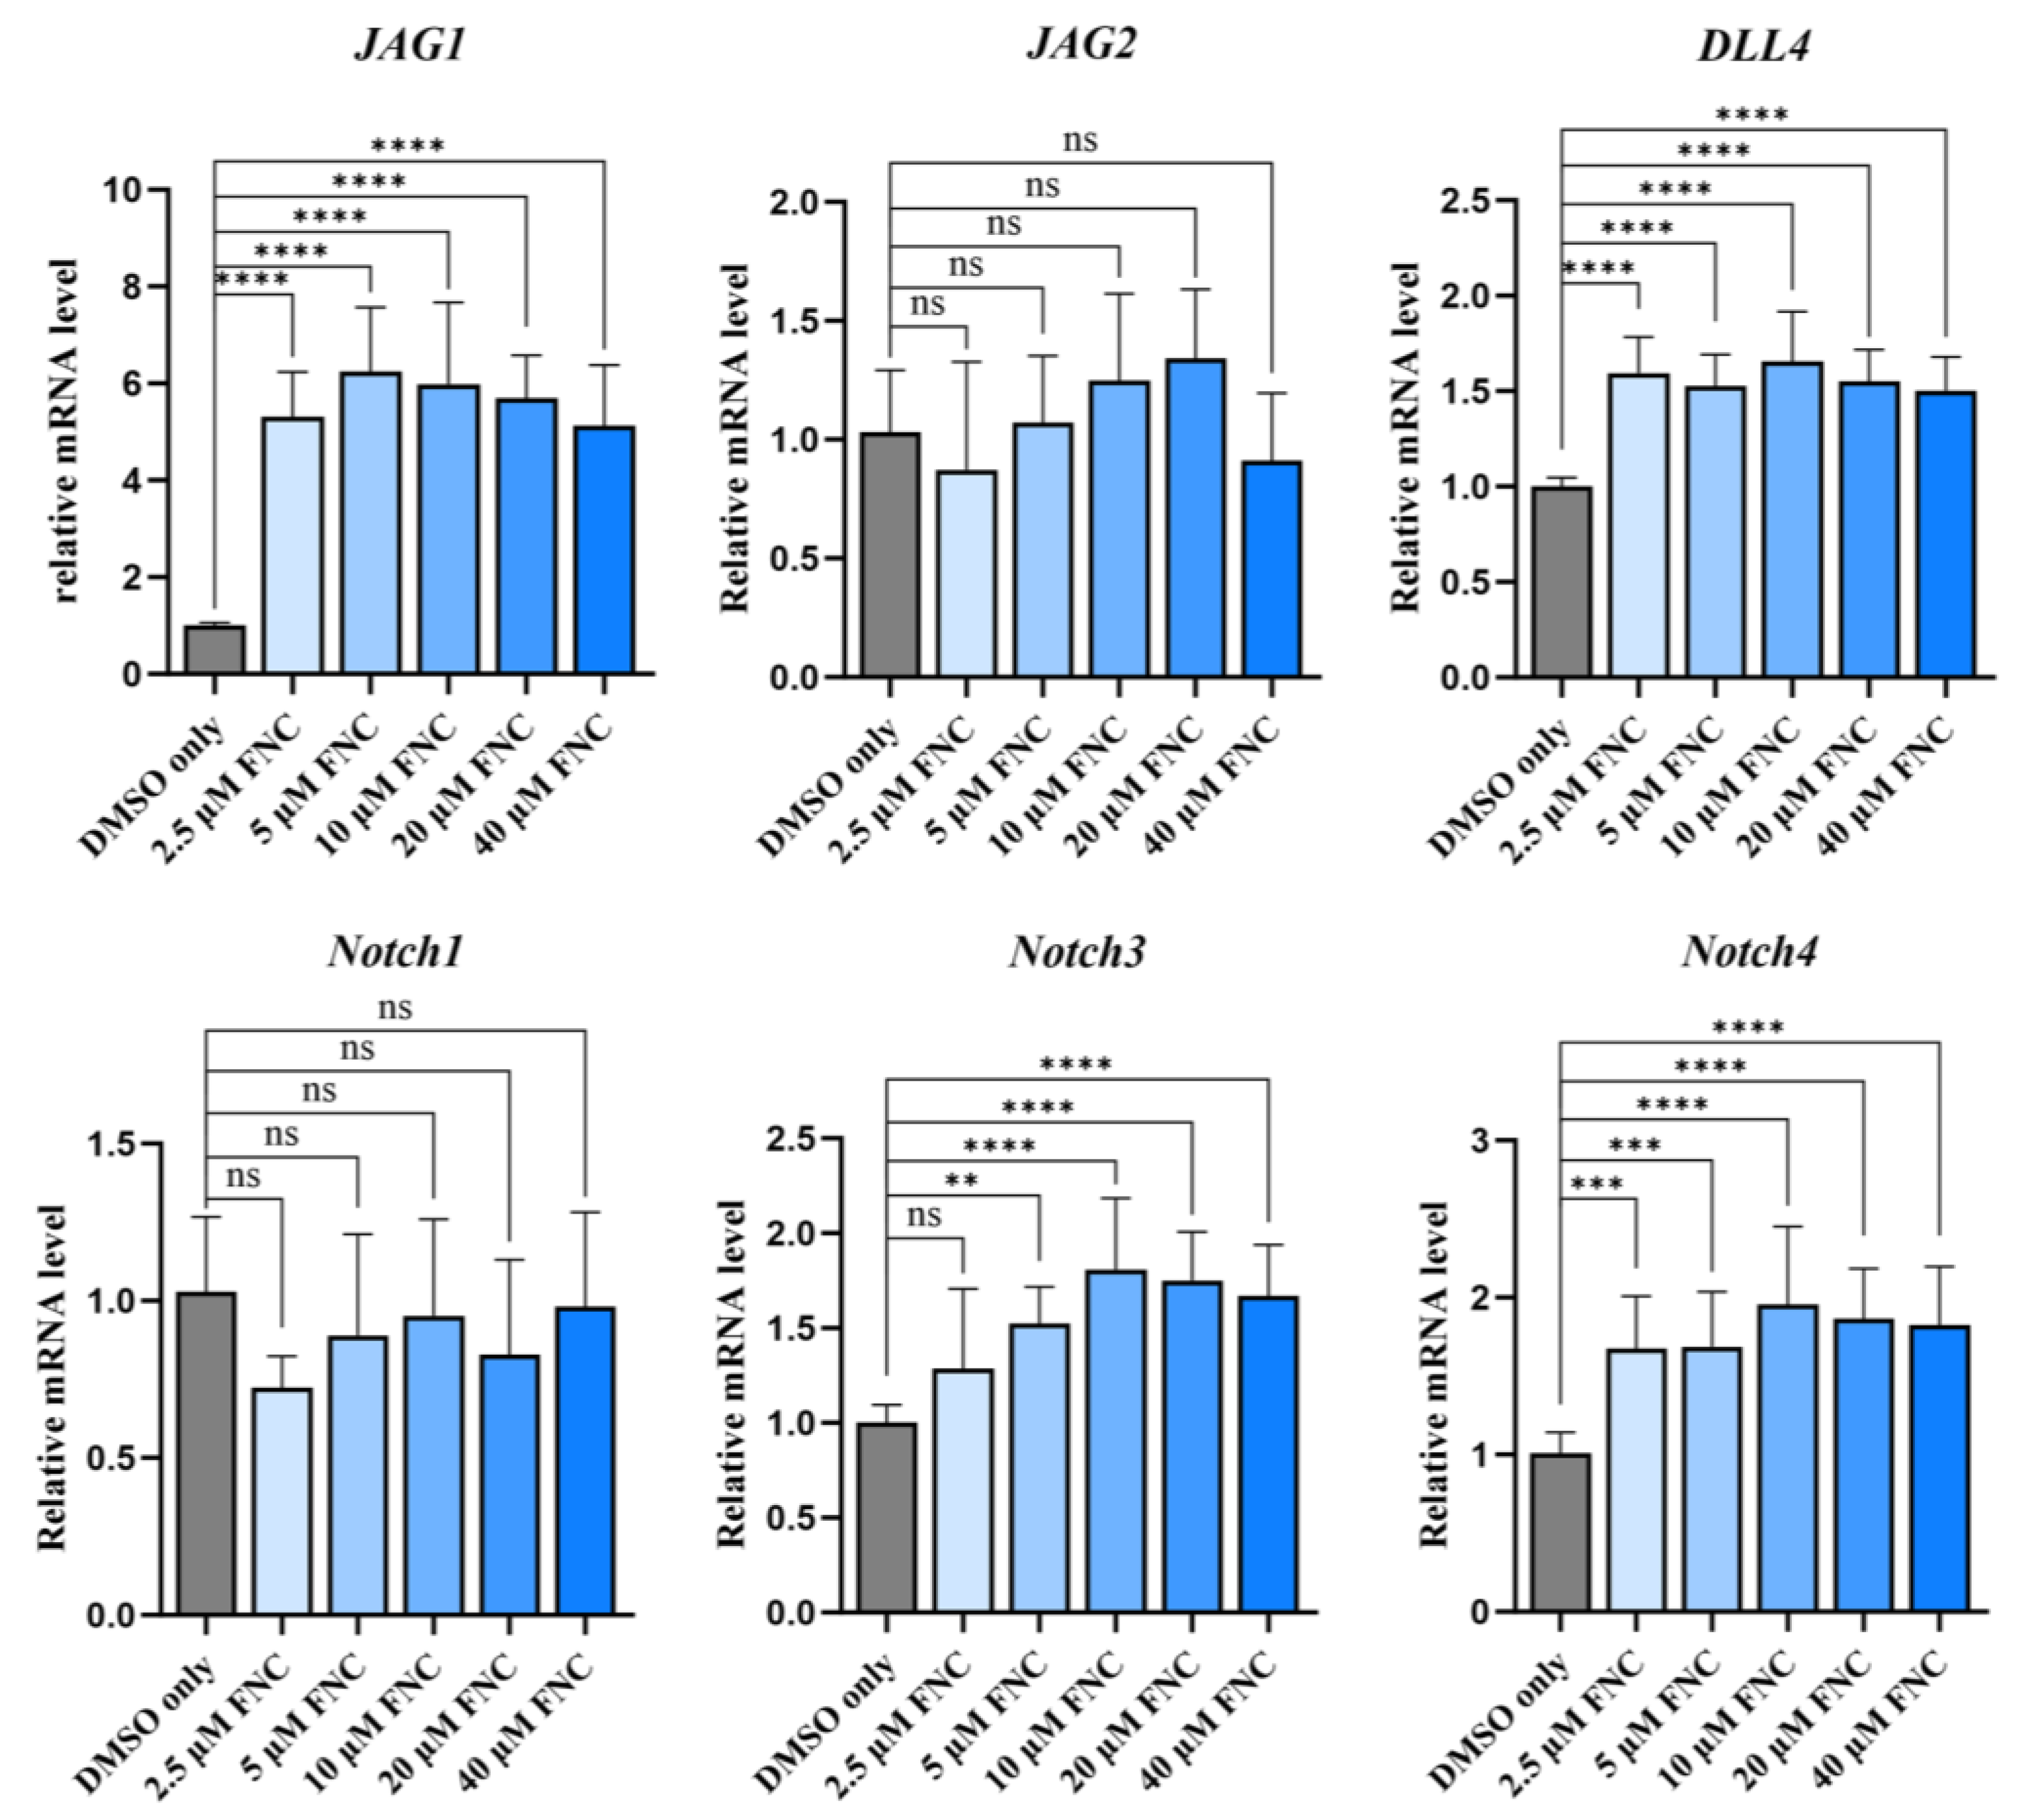

Table 1.
Binding interactions and energies between Notch ligands and FNC as proposed by molecular docking.
Table 1.
Binding interactions and energies between Notch ligands and FNC as proposed by molecular docking.
| Protein * | Residue | Binding Mode | Binding Energy (kcal/mol) |
|---|---|---|---|
| Jagged1 | TYR 82 | H-Bond | -6.592 |
| SER 156 | H-Bond | ||
| SER 158 | H-Bond | ||
| VAL 86 | Pi-A | ||
| Jagged2 | SER 204 | SER 204 | -6.506 |
| ARG 114 | ARG 114 | ||
| CYS 198 | CYS 198 | ||
| ASP 176 | ASP 176 | ||
| TYR 203 | TYR 203 | ||
| DLL1 | HIS 182 | H-Bond | -5.707 |
| ASP 180 | H-Bond | ||
| TYR 183 | H-Bond | ||
| GLY 185 | H-Bond | ||
| CYS 179 | Hal/Pi-S | ||
| DLL4 | GLN 153 | H-Bond | -6.058 |
| CYS 175 | H-Bond | ||
| GLY 181 | H-Bond | ||
| ASP 182 | H-Bond/Attr-Chg | ||
| PRO 202 | C-H Bond |
* Jagged1 PDB = 4CC1; Jagged2 PDB = 5MW7; DLL1 PDB = 4XBM; DLL4 PDB = 5MVX.
Disclaimer/Publisher’s Note: The statements, opinions and data contained in all publications are solely those of the individual author(s) and contributor(s) and not of MDPI and/or the editor(s). MDPI and/or the editor(s) disclaim responsibility for any injury to people or property resulting from any ideas, methods, instructions or products referred to in the content. |
© 2025 by the authors. Licensee MDPI, Basel, Switzerland. This article is an open access article distributed under the terms and conditions of the Creative Commons Attribution (CC BY) license (http://creativecommons.org/licenses/by/4.0/).
Copyright: This open access article is published under a Creative Commons CC BY 4.0 license, which permit the free download, distribution, and reuse, provided that the author and preprint are cited in any reuse.


