
Submitted:
21 March 2025
Posted:
24 March 2025
You are already at the latest version
Abstract
This study examines wind speed, wind shear, and turbulence intensity across three sites in the Geba Catchment, Tigray, Ethiopia. Wind speed analysis shows significant spatial and temporal variations, with Hagere Selam exhibiting the highest annual average wind speeds (8.0 m/s). Dera’s wind speeds vary more, reflecting the influence of rugged terrain and elevation. Wind shear exponent (WSE) analysis highlights the impact of topography on wind profiles. At Dera (2870 m), WSE values ranged from 0.1 to 0.3, indicating strong wind gradients influenced by steep terrain. In contrast, Hagere Selam and Mayderhu, at lower elevations, exhibited WSE values of 0.0 to 0.1, suggesting smoother wind flow. Dera also showed pronounced diurnal WSE variations linked to nighttime cooling. Turbulence intensity (TI) was highest at Dera (up to 0.5 at 10 m), with significant diurnal variation, while Hagere Selam and Mayderhu showed lower and more stable TI values (0.12–0.2). Analysis of wind speed variability revealed that Dera experiences greater turbulence compared to the IEC standards but remains within acceptable limits for wind turbine operations. Prevailing winds at Dera, predominantly from the North, Northeast, and Southeast, correspond to higher wind shear and turbulence levels, emphasizing the role of local topography. These findings underscore the need for tailored wind energy strategies, highlighting Hagere Selam’s potential for stable energy production and the challenges posed by Dera’s complex wind dynamics.
Keywords:
turbulence intensity
; wind shear
; Wind resource
; Ethiopia
1. Introduction
Understanding turbulence intensity and wind shear characteristics at a site is crucial for accurately assessing wind energy resources and predicting power production. Wind shear significantly affects wind speed, which in turn has a substantial impact on power output due to the cubic relationship between wind speed and power. Additionally, wind turbines are optimized to perform efficiently within specific wind speed ranges. Moreover, wind turbulence and shear can cause mechanical stress on wind turbine blades, reducing their lifespan and efficiency [1]. Studies conducted by [2,3,4,5] have established a strong influence of turbulence intensity and wind shear on wind energy production. For instance, [4] reported that the extrapolation error in theoretical energy yield decreased by approximately 50% to 70% on average for a lidar measurement, depending on the extrapolation height and distance. These studies highlight the importance of incorporating wind shear and turbulence factors into data analysis and site selection criteria. Turbulence intensity(TI) and wind shear exponent (WSE) depend on various local conditions, including atmospheric stability, surface roughness, and terrain type. A review by [6] explored different parameters to define atmospheric stability, including wind shear exponent and turbulence intensity. Table 1 summarizes the atmospheric stability classifications reported in various studies, demonstrating general agreement except for the wind shear exponent reported by [3]. These higher values of wind shear exponent are attributed to the specific focus on dense forest conditions.
In complex terrain, thermal stratification further complicates wind behavior, especially under stable conditions, where cooler, dense air near the surface resists upward movement. This alters velocity profiles, turbulence intensity, and wind flow around obstacles, affecting wind turbine performance and energy output. Accurate modeling of stratified wind behavior is crucial for optimizing wind farm siting and operation [7,8,9].
Atmospheric stability is typically characterized by parameters such as the stability parameter () and turbulence intensity (TI). In this classification, strongly stable conditions are identified when is greater than 0.3, and the turbulence intensity (TI) is less than 0.1. These conditions usually represent a strong resistance to vertical air movement, often observed during night-time radiative cooling. Stable conditions are classified when falls between 0.2 and 0.3, with TI remaining below 0.1, indicating reduced but still significant resistance to vertical mixing, often found in the early evening or late morning hours. Moving to neutral atmospheric conditions, ranges between 0.1 and 0.2, and the TI exceeds 0.2. Neutral conditions generally indicate little resistance to vertical movement and can be associated with cloudy skies or windy days, where thermal stratification is minimal. Convective conditions are characterized by values between 0.0 and 0.1, with TI ranging from 0.1 to 0.2. This classification typically indicates weak atmospheric stratification, promoting vertical air movement, which is common on sunny days with moderate ground heating. Lastly, strongly convective conditions are identified when is less than 0.0, and TI is less than 0.2. These conditions are indicative of strong buoyancy forces driving turbulent mixing, often observed during daytime hours with significant solar heating.
However, it is important to note that different researchers have reported varying ranges for these classifications. For example, some studies have suggested alternative thresholds for and TI, reflecting differences in geographical locations, measurement techniques, and specific atmospheric conditions. This variability in the reported ranges highlights the complex and context-dependent nature of the atmospheric stability classification [6,11,12]. Numerous studies have documented these parameters, with a focus on various site locations and terrain types. Table 2 presents a summary of some of these studies, highlighting key characteristics such as site location, type of terrain, TI, and WSE.
Most of the available literature predominantly addresses flat terrain sites, which are easier to model and often used in wind energy assessments. However, complex terrain—characterized by features such as mountains, valleys, or forests—poses additional challenges in both measurement and modeling, and thus, data for such areas remain scarce. A consistent pattern emerges from these studies, where the WSE tends to be higher during night-time hours, with values typically ranging from 0.2 to 0.4. This nocturnal increase in wind shear can be attributed to the development of stable atmospheric layers that suppress vertical mixing, leading to a stronger vertical gradient in wind speed. In contrast, during the daytime, when the atmosphere is often more convective, WSE values are generally lower, ranging from 0.0 to 0.2. Similarly, turbulence intensity follows a recognizable diurnal pattern, with lower TI values at night due to the stable atmospheric conditions that inhibit turbulence. However, daytime turbulence is usually more pronounced due to solar heating and the subsequent destabilization of the atmosphere. Interestingly, a study by [17] focusing on the Fiji Islands reported a contrasting trend (refer Table 2). Here, higher turbulence intensity was observed during the night-time, with values ranging from 0.25 to 0.45, compared to daytime values of 0.2 to 0.25. This anomalous behavior could be influenced by local factors such as oceanic influences, complex terrain, or specific climatic conditions unique to the islands, which might contribute to higher nocturnal turbulence. This deviation from the typical diurnal cycle emphasizes the need for localized studies to account for unique environmental and geographical factors.
Ethiopia has a great potential for wind energy due to its diverse topography and frequent strong winds. However, effectively harnessing this potential requires a comprehensive understanding of wind characteristics, particularly in complex terrains like the Geba Catchment in Tigray, Ethiopia. The Geba catchment exhibits significant wind energy potential, as identified by [19] and supported by ground-based observational data analysis and resource mapping. This region’s unique topography contributes to favorable wind conditions, making it a viable candidate for wind energy projects. Hilly terrain significantly influences wind patterns. The presence of hills and valleys creates obstacles that disrupt airflow, leading to increased turbulence intensity and variation in wind speed and direction. These variations must be thoroughly analyzed to identify suitable locations for wind energy projects.
This study addresses these critical factors by analyzing the turbulence and wind shear characteristics within the hilly terrain of the Geba Catchment. By quantifying these variations, we aim to: 1. Identify how turbulence intensity and wind shear profiles differ across the catchment’s diverse topography. 2. Assess the impact of these variations on the suitability of different locations for wind energy projects. 3. Compare the observed turbulence and wind shear characteristics with existing models for hilly terrain, evaluating their accuracy in representing the complex wind patterns of the Geba Catchment. The findings of this study will contribute valuable information for the characterization of wind energy potential in the Geba Catchment and similar hilly regions. It will contribute to wind shear and turbulence data for hilly terrains which are scarcely available in literature as mentioned in the previous paragraphs.
2. Methodology
2.1. Description of the Sites
The study sites are located within the Geba catchment in the Tigray region of northern Ethiopia. As shown in Figure 1, these sites are positioned in relation to two significant geographical features: the Red Sea and the Rift Valley escarpment. The proximity of these features plays a critical role in shaping the local wind characteristics and broader atmospheric dynamics. The air distances from the Dera, Hagereselam, and Mayderhu sites to the Red Sea are approximately 140 km, 200 km, and 230 km, respectively. Notably, the Dera site is the closest to the Rift Valley escarpment, with a mere 10 km air distance, while Hagereselam and Mayderhu are located 180 km and 70 km to the west of the escarpment, respectively. The Red Sea influences regional wind patterns due to its role as a thermal contrast zone between land and sea. These variations contribute to the complexity of the wind characteristics in the area. The Rift Valley escarpment, with its steep topography, further modulates the wind behavior. The escarpment acts as a barrier, influencing wind flow patterns through orographic effects, where winds are accelerated or deflected along the slope. The proximity of the Dera site to the escarpment subjects it to turbulent winds due to these orographic influences. These geographical influences underscore the importance of site-specific wind assessments in understanding the local atmospheric dynamics across the Geba Catchment.
Figure 2 presents a detailed map of the Dera site and its surrounding valleys and mountains. The terrain map, sourced from Google Earth, highlights the town of Atsbi Dera located to the northeast of the site, along with the surrounding mountains. Additionally, the contour map, generated using ArcGIS, illustrates the altitudinal variations within the region, with elevations ranging from 2,775 meters to approximately 3,000 meters above sea level. Both maps cover an area of approximately 6 km by 4 km, providing a consistent scale and a clear representation of the topography.
Figure 3 displays the terrain and contour maps of the area surrounding the Hagereselam site. The location of the wind mast is marked on the top of a hill on both maps. The town of Hagereselam is visible in the northwest corner of the terrain map. The nearby valleys and mountain peaks around the wind mast vary in elevation, ranging from 2,250 to 2,725 meters above sea level. Similarly, Figure 4 illustrates the terrain and contour maps of the Mayderhu site. Hintalo town is located to the west of the site on the terrain map. The elevations of the nearby valleys and mountain peaks range from 2,250 to 2,700 meters above sea level.
2.2. Measurement Mast and Instruments
A wind and solar energy resource assessment study was conducted by Mekelle University between 2010 and 2015 at four measurement sites in the Geba catchment area. Table 3 provides details on the locations of the masts and the instruments used. Previous publications from this study cover various aspects of renewable energy, including the potential of wind energy resources ([19]), wind pump applications ([20]), solar energy resource assessment [21], and the temporal and spatial variation of solar energy ([22]). For the current turbulence and wind shear analysis, data recorded from the three remaining sites during 2011 and 2015 were used. Table 3 provides an overview of the locations of these sites and the instruments employed for wind measurement.
Data were acquired at a sampling rate of one measurement every three seconds over ten-minute intervals, resulting in 200 samples per interval. For each ten-minute period, the maximum, minimum, average, and standard deviation of wind speeds at 10 meters and 30 meters above ground level were recorded. Wind direction data was also collected, ranging from 0° to 360°, with 0° (or 360°) indicating the North, measured clockwise direction.
2.3. Wind Data Analysis
2.3.1. Wind Speed and Direction Analysis
Wind speed and direction data were collected from multiple meteorological stations distributed at different elevations and locations to understand the characteristics of the wind in the Geba basin. Data preprocessing involved cleaning for outliers, synchronizing time-series data, and averaging wind speeds over standardized intervals hourly, daily, and monthly time scales. Wind roses were generated to visualize the frequency and distribution of wind directions, identifying the prevailing wind patterns and their seasonal variations. Wind direction variation was examined using wind roses, which were based on data from ten-minute intervals categorized into eight compass directions: N, NE, E, SE, S, SW, W, and NW.
Wind shear, defined as the change in wind speed with height, was analyzed using the power-law equation provided in Equation 1. By comparing wind speeds at different heights in various locations, the wind shear exponent was calculated to quantify the rate of change in wind speed with altitude. This analysis was used to generate spatial maps of wind shear in the catchment, with a focus on how terrain characteristics influence wind shear patterns. Temporal analysis was explored how wind shear varies throughout the day and across seasons, identifying periods of heightened shear due to atmospheric conditions. The implications of wind shear on wind turbine performance will be a key focus, as high shear can cause uneven loading on turbine blades. In addition, the study will examine the broader implications of wind shear for infrastructure and safety, especially in the context of the complex and hilly terrain of the Geba Catchment.
The wind shear coefficient () was determined using the logarithmic wind profile law, which relates wind speeds ( and ) at two different heights ( and ), as described by Equation 1.
The values of were calculated at each ten-minute interval and averaged hourly for the wind speeds measured at m and m.
2.3.2. Turbulence Intensity
Turbulence intensity (TI) was calculated as the ratio of the standard deviation of wind speed to the mean wind speed, providing a measure of wind variability at different heights and locations. Vertical profiles of turbulence intensity were developed by analyzing data at multiple elevations of 10 m and 30 m, revealing how turbulence changes with altitude. Turbulence intensity during the ten-minute wind speed measurement was given by the ratio of the standard deviation (SD) to the average speed during the interval as given in Equation 2. The TI values at a measurement height of 30 m were used in the data analysis.
3. Results and Discussions
3.1. Wind Speed Characteristics
The wind speed distribution analysis indicated a wide range of characteristics throughout the Geba Catchment, with mean wind speeds varying between 4.5 and 8.0 m/s at a height of 10 meters. The highest mean wind speeds were recorded at the Hagereselam site with an annual average wind speed of 8.0 m/s. In contrast, lower wind speeds, around 4.5 m/s, were observed at the Dera site. The region’s wind speed and temperature characteristics, as analyzed across the three sites, Dera, Hagere Selam, and Mayderhu (Figure 5) exhibit distinct yet interconnected patterns. The temperature trend consistently peaks in the afternoon, around 15:00, which correlates with increased wind speed. At Dera, wind speeds range from 2 m/s to 6 m/s, with a broad period of higher wind speeds occurring between 10:00 and 16:00. The maximum wind speed at 30 meters is approximately 6 m/s, and the difference in wind speed between 10 meters and 30 meters is notably wider compared to the other sites. This suggests that Dera may experience more variable wind conditions with height, which could be influenced by local topography or thermal dynamics. In contrast, Hagere Selam and Mayderhu both exhibit a sharper increase in wind speed later in the day, with Hagere Selam peaking around 18:00 and Mayderhu around 19:00 (Figure 5). Both sites have maximum wind speeds of about 8 m/s at 30 meters, indicating stronger winds than Dera. However, the difference in wind speed between 10 and 30 meters is relatively small at Hagere Selam, suggesting a more stable wind profile with height. Mayderhu, while similar in trend to Hagere Selam, shows a slightly wider variation in wind speed with height, but still less pronounced than at Dera. Overall, the wind speed characteristics indicate that Dera may be more affected by local factors, while Hagere Selam and Mayderhu demonstrate stronger and more consistent winds, likely making them more favorable for wind energy applications.
The seasonal wind speed characteristics of the region reveal a close relationship between temperature and wind speed variations throughout the year (Figure 6). At Dera, temperatures rise from a low of 8°C in December to a peak of 17°C in June, mirroring the wind speed pattern. Wind speeds at Dera are lowest in December, increase steadily until June, dip slightly in July, and then peak again in August before decreasing back to December levels. Wind speeds generally range from 3 m/s to 5 m/s, indicating moderate wind conditions that fluctuate seasonally with temperature.
Hagere Selam and Mayderhu show more complex seasonal patterns (Figure 6), with temperatures peaking twice: once in May (22 °C for Hagere Selam and 19 °C for Mayderhu) and again in November (25°C for Hagere Selam and 17 ° C for Mayderhu). The lowest temperatures at these sites occur in January and August for Hagere Selam, and in December and August for Mayderhu. Correspondingly, wind speeds at both sites also show dual peaks, with Hagere Selam reaching its maximum wind speed in July and its lowest in September. Mayderhu follows a similar trend, though its wind speeds are slightly lower overall, ranging between 5 m/s and 7.5 m/s, compared to Hagere Selam’s 5 m/s to 9 m/s. This seasonal analysis highlights that Hagere Selam generally experiences stronger winds than Mayderhu, while Dera sees more moderate winds that align more closely with temperature changes.
3.2. Wind Direction Characteristics
The wind direction characteristics of the region, based on data from Dera, Hagere Selam, and Mayderhu, reveal both stability and variability depending on the site and season. At Dera, the wind direction predominantly follows a southeasterly flow for most of the year (Figure 7), but a significant shift to a northerly direction occurs in the summer (Figure 8). This seasonal change suggests that Dera is influenced by larger atmospheric circulation patterns or local topographic effects [23,24,25,26], which alter the prevailing winds during certain times of the year. The clear seasonal variability at Dera indicates a dynamic wind environment that responds to broader regional influences, possibly making it more challenging to predict wind patterns consistently throughout the year.
In contrast, Hagere Selam exhibits more stable wind direction characteristics, with little change observed throughout the year. The prevailing winds remain consistently from the northeast (Figure 7), with only a slight deviation to a southwesterly direction during spring (Figure 8). This stability suggests that Hagere Selam is less influenced by seasonal atmospheric changes compared to the other sites. Mayderhu has predominantly easterly winds. Mayderhu, similar to Dera, experiences a marked seasonal shift in wind direction, with easterly winds becoming northwesterly during the summer months (Figure 8). This shift points to similar regional influences affecting both Dera and Mayderhu, potentially related to monsoonal patterns or other large-scale weather systems. Overall, while Hagere Selam’s wind direction remains steady, the more pronounced seasonal shifts at Dera and Mayderhu highlight the diverse wind dynamics within the region.
Further analysis of daily wind direction patterns reveals that while slight changes occur between morning and afternoon (Figure 9), stronger winds generally prevail in the afternoon across the region. In particular, in Mayderhu, the afternoon winds consistently shift to a purely easterly direction, aligning with similar observations at Dera, where the wind direction also becomes easterly during this time. In contrast, Hagere Selam shows minimal variation in wind direction between morning and afternoon, maintaining a consistent pattern throughout the day. This indicates that while Dera and Mayderhu experience daily fluctuations in wind direction, particularly in the afternoon, Hagere Selam remains more stable in its wind patterns across different times of the day.
3.3. Characteristics in Wind Shear Exponent
At the Dera site, located at 2870 meters with nearby mountains reaching 3050 m elevation, the wind shear exponent varied between 0.1 and 0.3 (refer Figure 10), indicating strong wind gradients. A clear diurnal pattern is observed, where the wind shear is lower during the day (around 0.1) and higher at night (around 0.3). During the day convective atmosphere conditions are observed while high wind shear at night (0.1-0.3) indicates a neutral to stable atmospheric condition that is active during the night, due to cooling processes that enhance temperature gradients and wind shear [27]. High wind shear during the night could also be attributed to the closeness of Dera to the Rift Valley escarpment and the Red Sea.
In contrast, the Hagereselam and Mayderhu sites, at slightly lower elevations (2628 m and 2512 m, respectively), exhibited much lower wind shear exponents (0.0 to 0.1) conforming to convective atmospheric conditions. This indicates relatively smoother wind flow.
The yearly analysis corroborates these findings, with the Dera site showing erratic sinusoidal variations in wind shear (Figure 11), further highlighting the complex interaction between wind and mountainous terrain. However, the Hagereselam and Mayderhu sites maintained a more stable low-wind shear pattern throughout the year.
The strong negative correlation between temperature and wind shear at Dera also underscores the role of atmospheric conditions in shaping wind profiles. In contrast, while there is a strong correlation during night-time at Mayderhu, there is a lack of correlation between temperature and wind speed at the Hagere Selam sites. This suggests a more complex interplay of factors influencing wind dynamics in different environments.
3.4. Variation in Turbulence Intensity
At the Dera site, the highest turbulence intensity of 0.5 was recorded 10 meters above ground level (Figure 12). The significant diurnal variation in turbulence intensity, with lower values during the day (around 0.25) and higher values at night (up to 0.5), points to dynamic atmospheric conditions, driven by temperature inversions and cooling of the surface at night, which enhance turbulence. While Dera shows greater turbulence intensity at night, due to increased temperature gradients, Hagere Selam and Mayderhu display slightly higher turbulence intensity during the day, with values around 0.25. Compared to the night, the smaller gap between the intensities of the turbulence at 10 m and 30 m during the day at Dera suggests that surface heating during the day reduces the vertical shear and turbulence differences between heights.
The yearly turbulence intensity at Dera indicated higher values, approximately 0.4, with a significant difference observed between the turbulence intensities at 10m and 30m (Figure 13). In contrast, the Hagere Selam site exhibited much lower yearly turbulence intensities around 0.12. Similarly, at the Mayderhu site turbulence intensity was slightly higher, close to 0.2, but still exhibited more stable patterns than Dera.
These findings align with existing research that highlights the critical role of terrain complexity in influencing wind behavior in mountain areas. The localized increase in turbulence intensity, particularly at sites like Dera, emphasizes the need for careful consideration of topographical features when assessing wind energy potential and understanding atmospheric processes in such regions. Variability in turbulence intensity also suggests that wind conditions in hilly terrains are highly dynamic, necessitating detailed site-specific studies to capture the full range of wind behavior.
3.5. Wind Turbulence Class
To evaluate the turbulence generated by winds, the wind speed standard deviation was plotted at 10 m and 30 m heights as a function of mean wind speed for three sites: Dera, Mayderhu, and Hagereselam (Figure 14). The resulting scatter plots, differentiated by color, illustrate the relationship between wind speed variability and average wind speeds. The turbulence levels "A," "B," and "C," as defined by the International Electrotechnical Commission (IEC, 1998), provide a benchmark for assessing the severity of turbulence at each site. The IEC levels A, B and C indicate high, medium, and low turbulence.
While the standard deviation at all sites generally falls below the IEC specifications, indicating that turbulence levels are within IEC level C, the Dera site exhibits a higher standard deviation compared to Mayderhu and Hagereselam. This suggests that Dera experiences more variability in wind speeds, although still being within the tolerable range.
The lower standard deviation at Mayderhu and Hagereselam implies more stable wind conditions, which could result in smoother turbine operations and reduced wear and tear. Therefore, while all three sites have conditions of IEC level C, Dera’s relatively higher turbulence intensity warrants further attention, particularly for turbine design and maintenance strategies.
3.6. The Influence of Prevailing Wind Against Turbulence Intensity and Wind Shear
The influence of the prevailing wind against turbulence intensity and wind shear exponent are depicted in Figure 15. At the Dera site, the wind speed analysis reveals that the highest wind speeds, exceeding 6 m/s, predominantly originate from the North, Northeast, and Southeast. This directional pattern suggests that these areas are the primary contributors to significant wind energy at the site. In addition, the wind shear exponent, which indicates the rate at which the wind speed changes with height, is observed to be higher in the east and southeast prevailing wind directions. This suggests that these directions experience more pronounced vertical wind speed gradients.
In terms of turbulence intensity, which reflects the degree of chaotic fluctuations in wind speed, the highest values are recorded from the north to the southeast, following a clockwise pattern. This indicates that winds from these directions are more prone to instability, due to interactions with obstacles or varying thermal conditions. However, it is notable that the most turbulent winds, with turbulence intensity exceeding 0.6, predominantly come from the East and Southeast. This suggests that these directions not only experience higher wind shear but also more significant turbulence, which could have implications for wind energy harvesting and structural safety.
The combination of high wind speeds, increased shear exponents, and elevated turbulence intensity from the east and southeast highlights the importance of these directions in shaping the wind dynamics at the Dera site. For applications such as wind energy, special attention should be paid to mitigating the potential impacts of high turbulence while maximizing the benefits of strong winds from these prevailing directions.
4. Conclusions
The wind shear and turbulence intensity analysis of wind mast measurement data from three sites has provided valuable insights into the wind characteristics of the Geba catchment. The wind shear data analysis indicated that the sites have convective atmospheric conditions except the Dera site which had neutral to stable atmospheric conditions during the night. An average wind shear coefficient of 0.2 could represent the wind condition at Dera, however, an average wind shear coefficient of 0.1 could be appropriate for the Hagere Selam and Mayderhu sites. The turbulence intensity for all three sites was characterized as low turbulence conforming to IEC level C. However, high turbulence intensity (reaching TI=0.5) was observed at Dera sites during the night.
Author Contributions
Conceptualization, Mulu Bayray; methodology, Mulu Bayray and Petros Gebray; software, Mulu Bayray, K. and Petros Gebray; validation, Mulu Bayray; Petros Gebray; Hailekiross Abadi; Fana Filli; and Anwar Mustefa; formal analysis, Mulu Bayray; and Petros Gebray; writing—original draft preparation, Mulu Bayray; writing—review and editing, Mulu Bayray; Petros Gebray; Hailekiross Abadi; Fana Filli; and Anwar Mustefa; visualization, Mulu Bayray; Petros Gebray. All authors have read and agreed to the published version of the manuscript.
Institutional Review Board Statement
Not applicable.
Informed Consent Statement
Not applicable.
Data Availability Statement
Data can be available upon request.
Conflicts of Interest
The authors declare no conflict of interest.
References
- Patil, A.; Thosar, A. Fault Simulation and Severity Analysis in Wind Energy System. In Proceedings of the 2020 International Conference on Industry 4.0 Technology (I4Tech), feb 2020; pp. 7–12. [Google Scholar] [CrossRef]
- St. Martin, C.M.; Lundquist, J.K.; Clifton, A.; Poulos, G.S.; Schreck, S.J. Wind turbine power production and annual energy production depend on atmospheric stability and turbulence. Wind Energy Science 2016, 1, 221–236. [Google Scholar] [CrossRef]
- Kim, D.Y.; Kim, Y.H.; Kim, B.S. Changes in wind turbine power characteristics and annual energy production due to atmospheric stability, turbulence intensity, and wind shear. Energy 2021, 214, 119051. [Google Scholar] [CrossRef]
- Basse, A.; Pauscher, L.; Callies, D. Improving Vertical Wind Speed Extrapolation Using Short-Term Lidar Measurements. Remote Sensing 2020, 12, 1091. [Google Scholar] [CrossRef]
- Asadi, M.; Pourhossein, K. Wind farm site selection considering turbulence intensity. Energy 2021, 236, 121480. [Google Scholar] [CrossRef]
- Pérez Albornoz, C.; Escalante Soberanis, M.A.; Ramírez Rivera, V.; Rivero, M. Review of atmospheric stability estimations for wind power applications. Renewable and Sustainable Energy Reviews 2022, 163, 112505. [Google Scholar] [CrossRef]
- Meldau, L.F.; Li, B.; McKenna Neuman, C.; Cooper, J.R. Constant stress layer characteristics in simulated stratified air flows: Implications for aeolian transport. Aeolian Research 2023, 63-65, 100888. [Google Scholar] [CrossRef]
- Cen, H.; Zhou, Q.; Korobenko, A. Isogeometric variational multiscale modeling of stably stratified flow over complex terrains. Mathematical Models and Methods in Applied Sciences. [CrossRef]
- Letzgus, P.; Guma, G.; Lutz, T. Computational fluid dynamics studies on wind turbine interactions with the turbulent local flow field influenced by complex topography and thermal stratification. Wind Energy Science 2022, 7, 1551–1573. [Google Scholar] [CrossRef]
- Resen, A.K.; Khamees, A.B.; Yaseen, S.F. Determination of Wind Shear Coefficients and Conditions of Atmospheric Stability for Three Iraqi Sites. IOP Conference Series: Materials Science and Engineering 2020, 881, 012161. [Google Scholar] [CrossRef]
- Radünz, W.C.; Sakagami, Y.; Haas, R.; Petry, A.P.; Passos, J.C.; Miqueletti, M.; Dias, E. Influence of atmospheric stability on wind farm performance in complex terrain. Applied Energy 2021, 282, 116149. [Google Scholar] [CrossRef]
- Radünz, W.C.; Sakagami, Y.; Haas, R.; Petry, A.P.; Passos, J.C.; Miqueletti, M.; Dias, E. The variability of wind resources in complex terrain and its relationship with atmospheric stability. Energy Conversion and Management 2020, 222, 113249. [Google Scholar] [CrossRef]
- Rehman, S.; Al-Abbadi, N.M. Wind shear coefficient, turbulence intensity and wind power potential assessment for Dhulom, Saudi Arabia. Renewable Energy 2008, 33, 2653–2660. [Google Scholar] [CrossRef]
- Ren, G.; Liu, J.; Wan, J.; Li, F.; Guo, Y.; Yu, D. The analysis of turbulence intensity based on wind speed data in onshore wind farms. Renewable Energy 2018, 123, 756–766. [Google Scholar] [CrossRef]
- Lopez-Villalobos, C.A.; Rodriguez-Hernandez, O.; Campos-Amezcua, R.; Hernandez-Cruz, G.; Jaramillo, O.A.; Mendoza, J.L. Wind Turbulence Intensity at La Ventosa, Mexico: A Comparative Study with the IEC61400 Standards. Energies 2018, 11, 3007. [Google Scholar] [CrossRef]
- Albani, A.; Ibrahim, M.Z.; Yong, K.H. Wind shear data at two different terrain types. Data in Brief 2019, 25, 104306. [Google Scholar] [CrossRef] [PubMed]
- Kutty, S.S.; Khan, M.G.M.; Ahmed, M.R.; Kutty, S.S.; Khan, M.G.M.; Ahmed, M.R. Estimation of different wind characteristics parameters and accurate wind resource assessment for Kadavu, Fiji. AIMS Energy 2019, 7, 760–791. [Google Scholar] [CrossRef]
- Gautam, A.; Warudkar, V.; Bhagoria, J.L. A comparative analysis of wind characteristics for distinct terrains of India. Sustainable Energy Technologies and Assessments 2022, 52, 102089. [Google Scholar] [CrossRef]
- Bayray, M.; Mustefa, A.; Yohannes, F.; Kiros, H.; Haileslasie, A.; Gebray, P.; Hayelom, M.; Dagne, A. Wind Energy Data Analysis and Resource Mapping of Geba Catchment, North Ethiopia. Wind Engineering 2013, 37, 333–345. [Google Scholar] [CrossRef]
- Bayray, M.; Kiros, H.; Abdelkadir, M.; Mustefa, A.; Hayelom, M.; Haileselasie, A.; Kebedom, A.; Gebray, P.; Yemane, A.; Michael, S.T.; et al. Performance of Wind Pump Prototype. Momona Ethiopian Journal of Science 2015, 7, 176–190. [Google Scholar] [CrossRef]
- Mahmud, A.M.; Kahsay, M.B.; Hailesilasie, A.; Hagos, F.Y.; Gebray, P.; Kelele, H.K.; Gebrehiwot, K.; Bauer, H.; Deckers, S.; De Baerdemaeker, J.; et al. Solar Energy Resource Assessment of the Geba Catchment, Northern Ethiopia. Energy Procedia 2014, 57, 1266–1274. [Google Scholar] [CrossRef]
- Bayray, M.; Gebreyohannes, Y.; Gebrehiwot, H.; Teklemichael, S.; Mustefa, A.; Haileslassie, A.; Gebray, P.; Kebedom, A.; Filli, F. Temporal and spatial solar resource variation by analysis of measured irradiance in Geba catchment, North Ethiopia. Sustainable Energy Technologies and Assessments 2021, 44, 101110. [Google Scholar] [CrossRef]
- Tucker, M.R.; Pedgley, D.E. Summer winds around the southern Red Sea. Archiv für Meteorologie, Geophysik und Bioklimatologie, Serie B 1977, 25, 221–231. [Google Scholar] [CrossRef]
- Segele, Z.T.; Lamb, P.J. Characterization and variability of Kiremt rainy season over Ethiopia. Meteorology and Atmospheric Physics 2005, 89, 153–180. [Google Scholar] [CrossRef]
- Segele, Z.T.; Lamb, P.J.; Leslie, L.M. Large-scale atmospheric circulation and global sea surface temperature associations with Horn of Africa June–September rainfall. International Journal of Climatology 2009, 29, 1075–1100. [Google Scholar] [CrossRef]
- Diro, G.T.; Grimes, D.I.F.; Black, E. Teleconnections between Ethiopian summer rainfall and sea surface temperature: part I—observation and modelling. Climate Dynamics 2011, 37, 103–119. [Google Scholar] [CrossRef]
- Hans, A.C.; Brandt, P.; Gasparin, F.; Claus, M.; Cravatte, S.; Horstmann, J.; Reverdin, G. Observed Diurnal Cycles of Near-Surface Shear and Stratification in the Equatorial Atlantic and Their Wind Dependence. Journal of Geophysical Research: Oceans 2024, 129, e2023JC020870. [Google Scholar] [CrossRef]
Figure 1.
Study sites within the Geba catchment, Tigray region, northern Ethiopia, strategically positioned between two key geographical features: the Red Sea and the Rift Valley escarpment
Figure 1.
Study sites within the Geba catchment, Tigray region, northern Ethiopia, strategically positioned between two key geographical features: the Red Sea and the Rift Valley escarpment
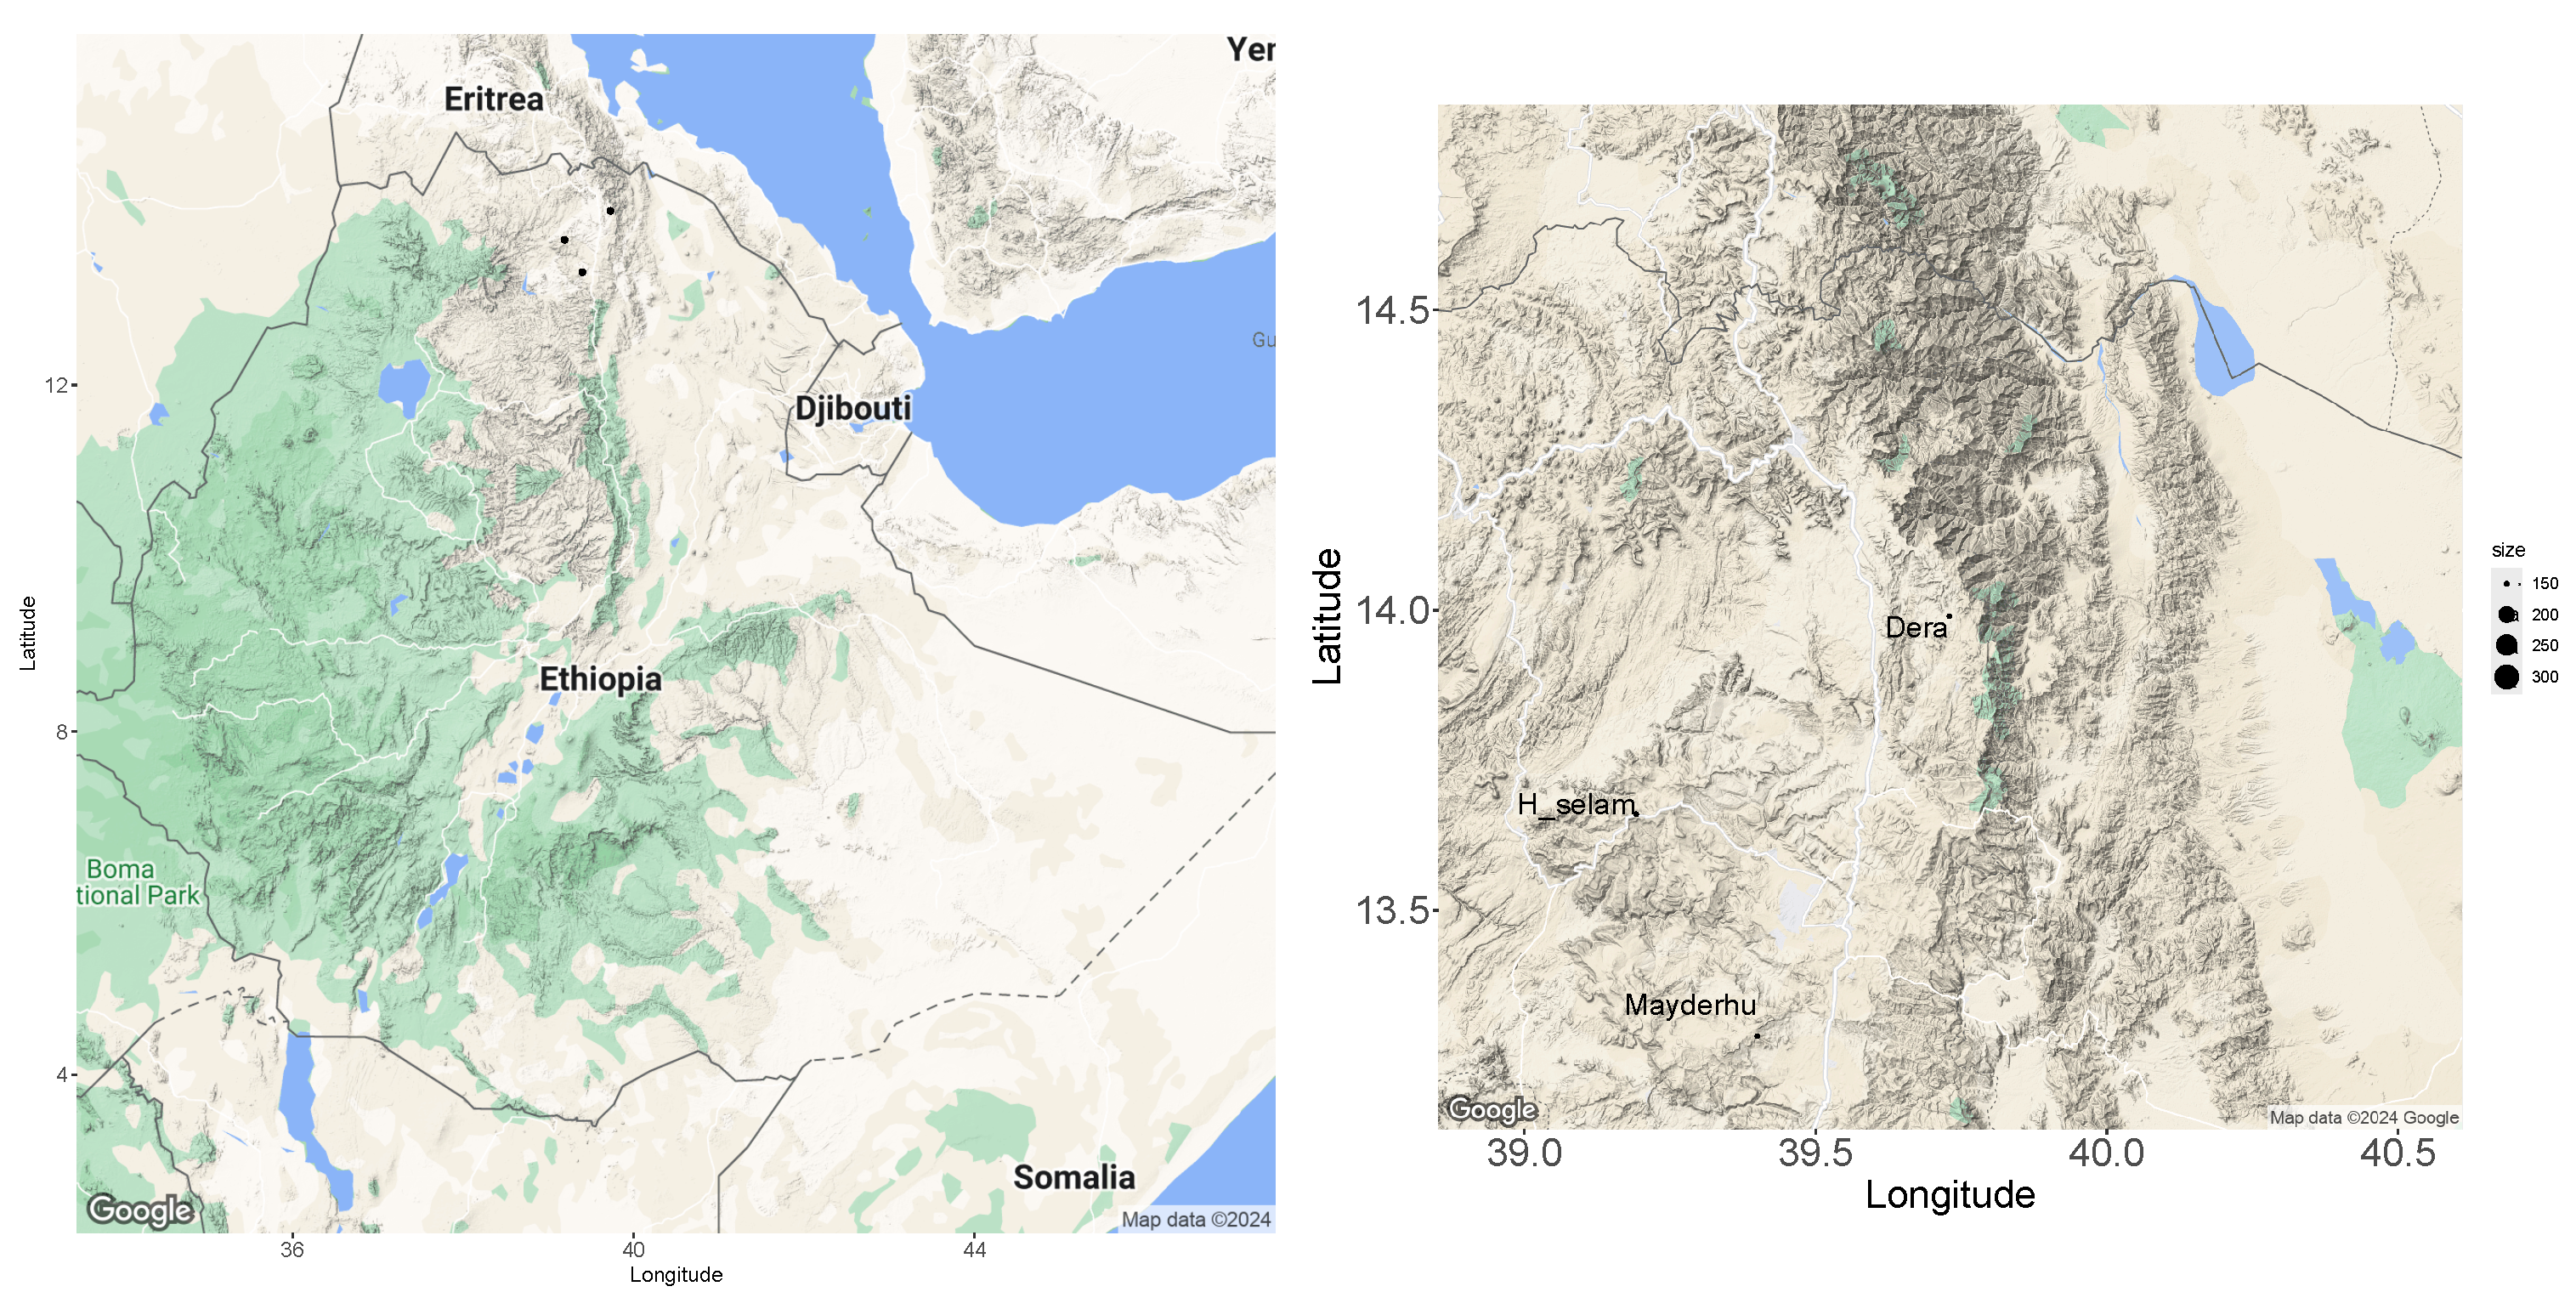
Figure 2.
Detailed terrain map of the Dera site and its surrounding valleys and mountains. The map, sourced from Google Earth, highlights the town of Atsbi Dera to the northeast and the prominent surrounding mountains.
Figure 2.
Detailed terrain map of the Dera site and its surrounding valleys and mountains. The map, sourced from Google Earth, highlights the town of Atsbi Dera to the northeast and the prominent surrounding mountains.
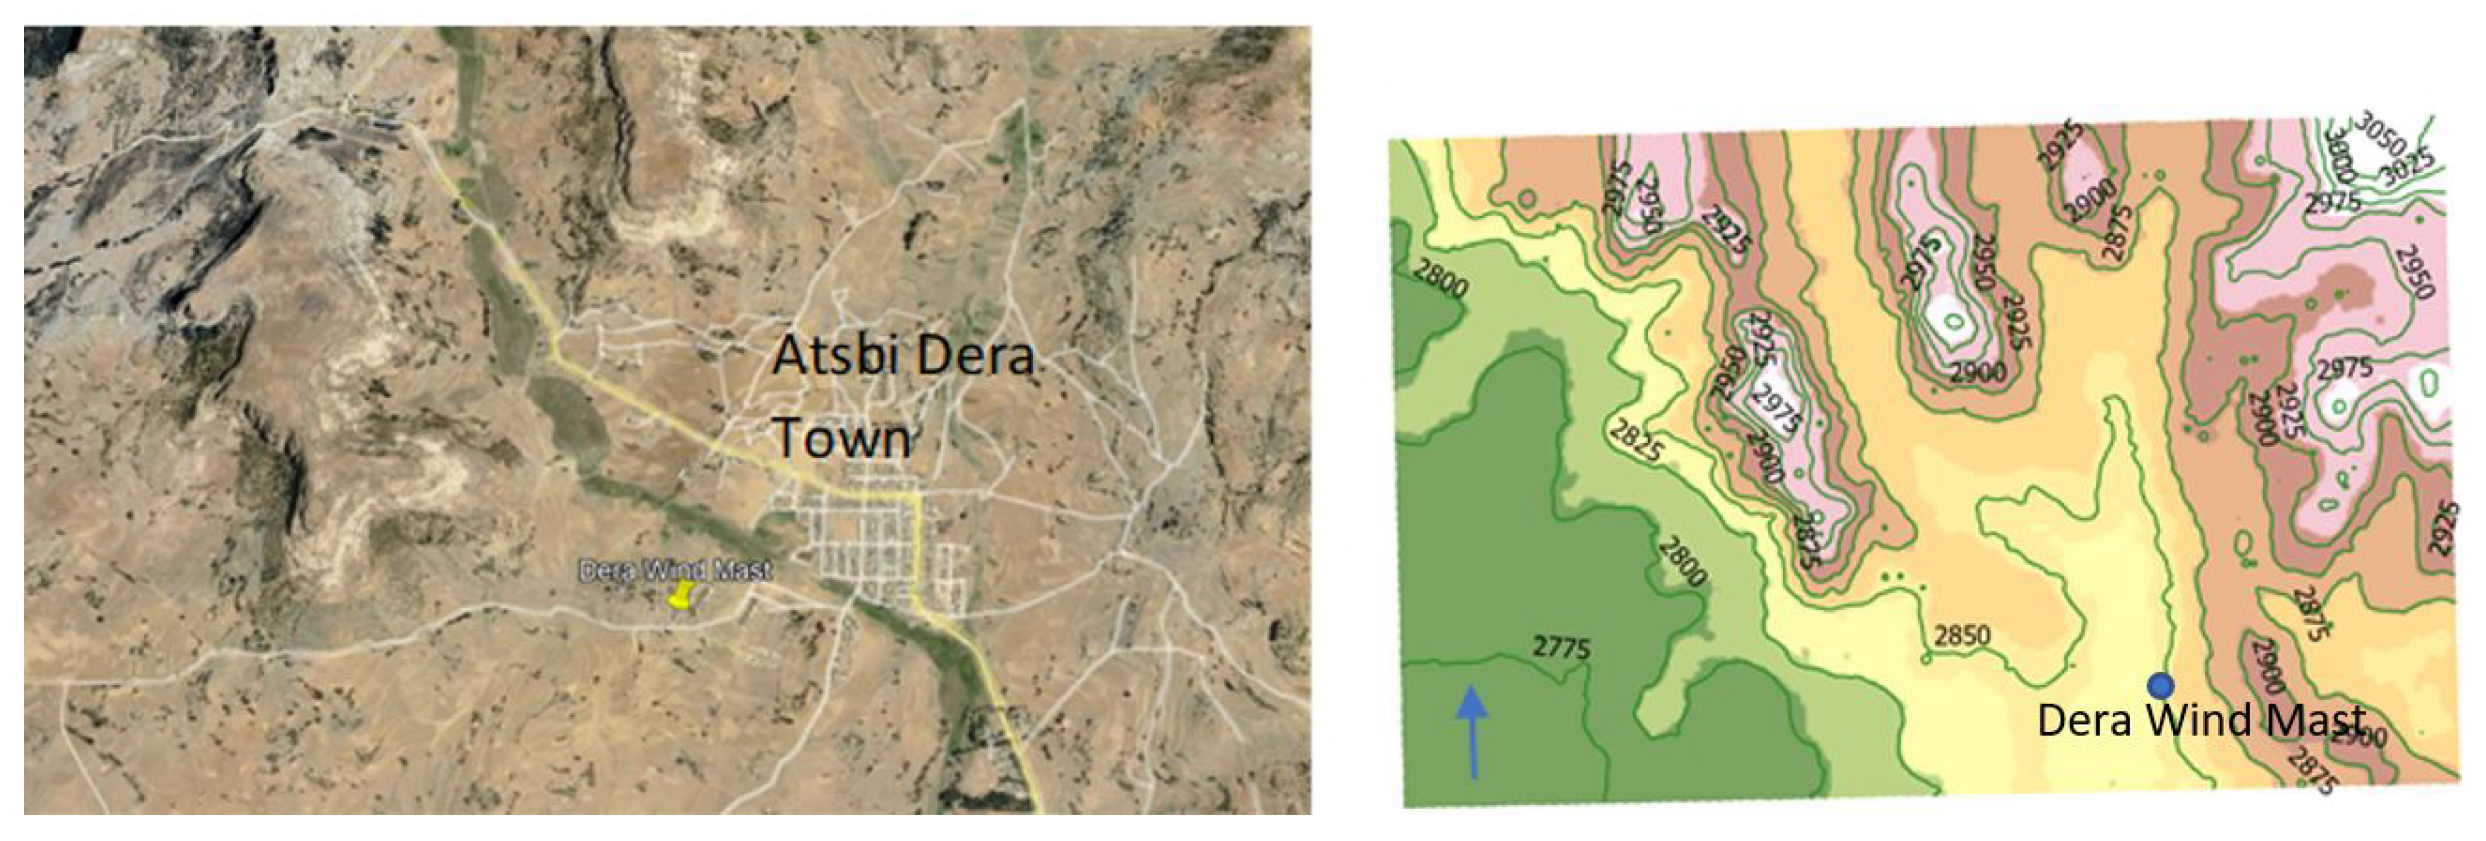
Figure 3.
Terrain and contour maps of the Hagereselam site, with the wind mast marked on a hill. Hagereselam town is visible in the northwest, and elevations range from 2,250 to 2,725 meters.
Figure 3.
Terrain and contour maps of the Hagereselam site, with the wind mast marked on a hill. Hagereselam town is visible in the northwest, and elevations range from 2,250 to 2,725 meters.
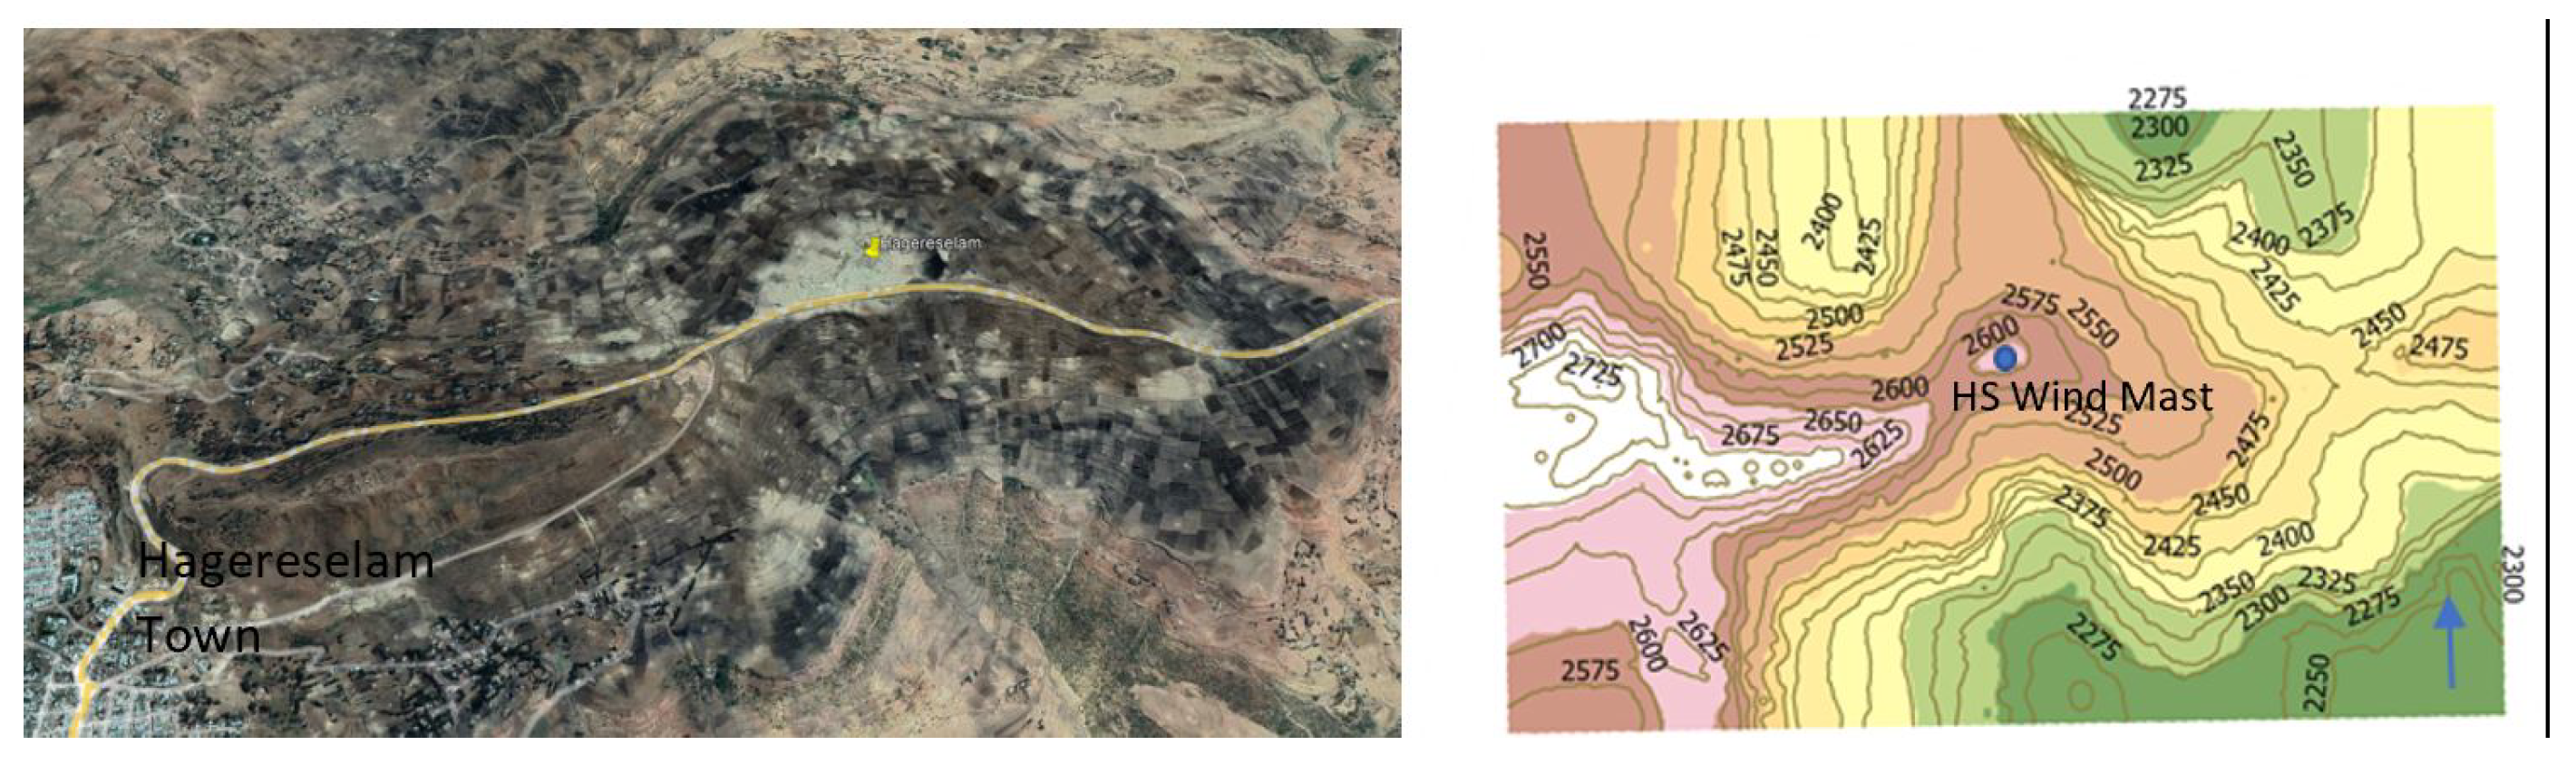
Figure 4.
Terrain and contour maps of the Mayderhu site, with Hintalo town located to the west. Elevations of nearby valleys and mountain peaks range from 2,250 to 2,700 meters.
Figure 4.
Terrain and contour maps of the Mayderhu site, with Hintalo town located to the west. Elevations of nearby valleys and mountain peaks range from 2,250 to 2,700 meters.
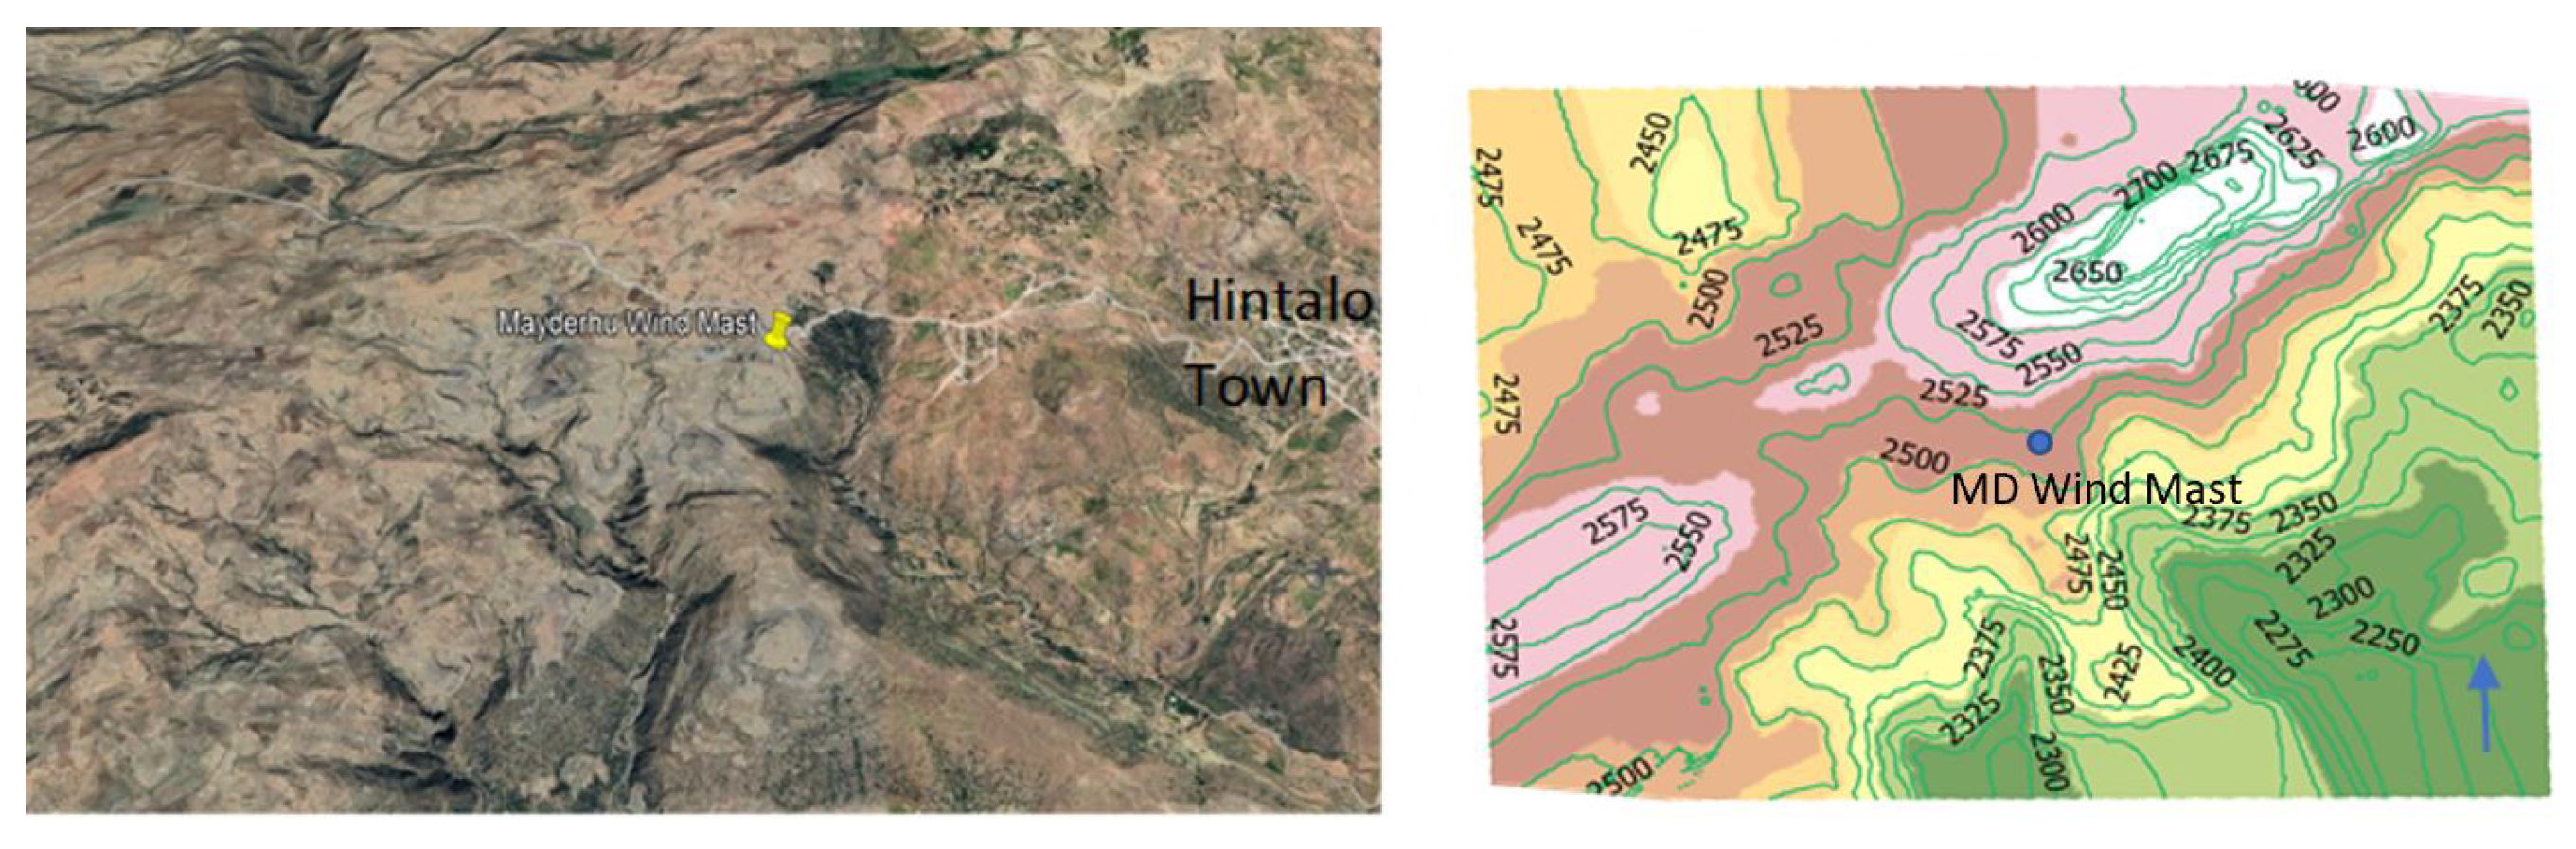
Figure 5.
Wind speed and temperature patterns at Dera, Hagere Selam, and Mayderhu show interconnected trends. Dera experiences variable wind conditions, with speeds ranging from 2 to 6 m/s and a significant difference between 10 and 30 meters. In contrast, Hagere Selam and Mayderhu exhibit stronger, more consistent winds, peaking around 18:00 and 19:00, making them favorable for wind energy applications.
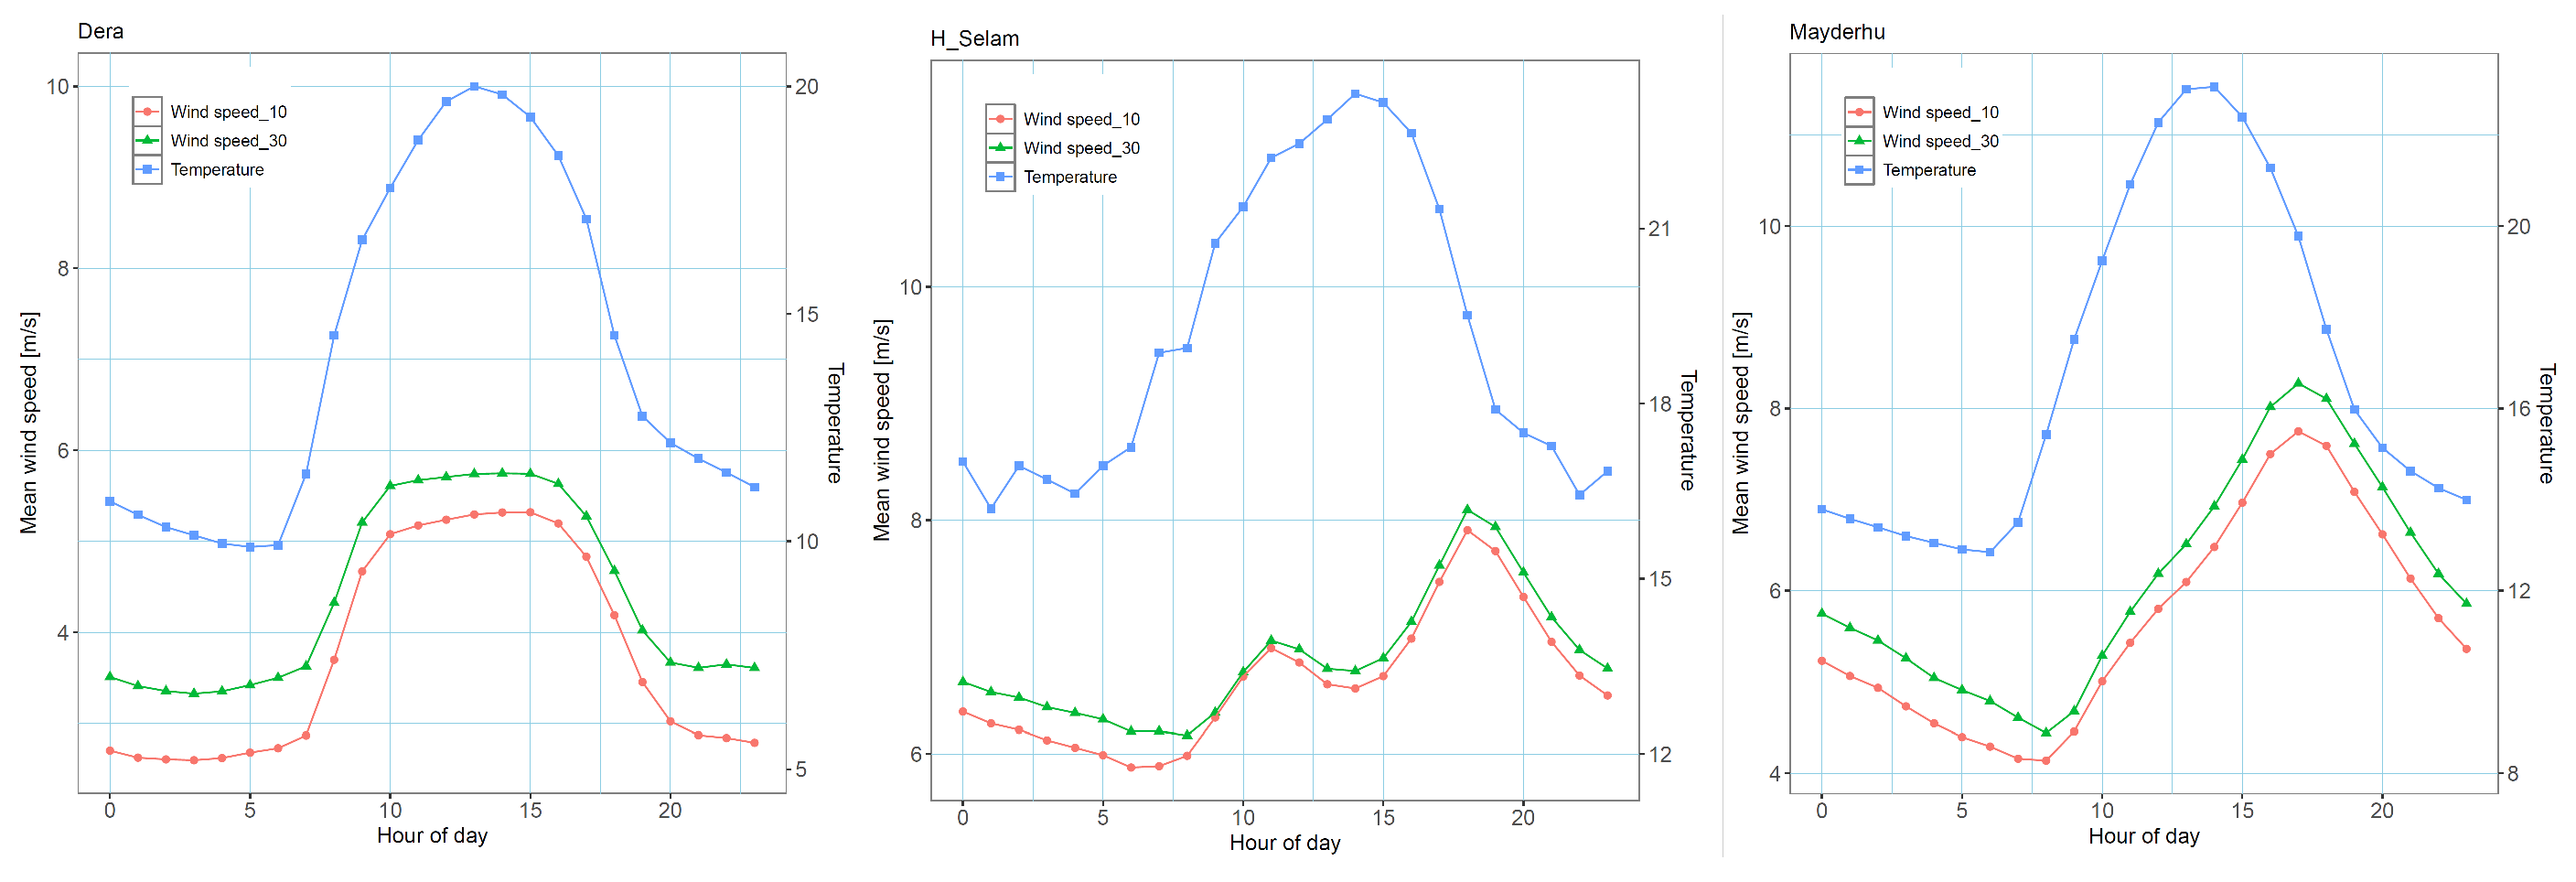
Figure 6.
Seasonal wind speed patterns at Dera, Hagere Selam, and Mayderhu closely follow temperature variations. Dera experiences moderate winds (3–5 m/s) peak in June and August, while Hagere Selam and Mayderhu show dual temperature peaks with stronger winds, particularly at Hagere Selam (5–9 m/s).
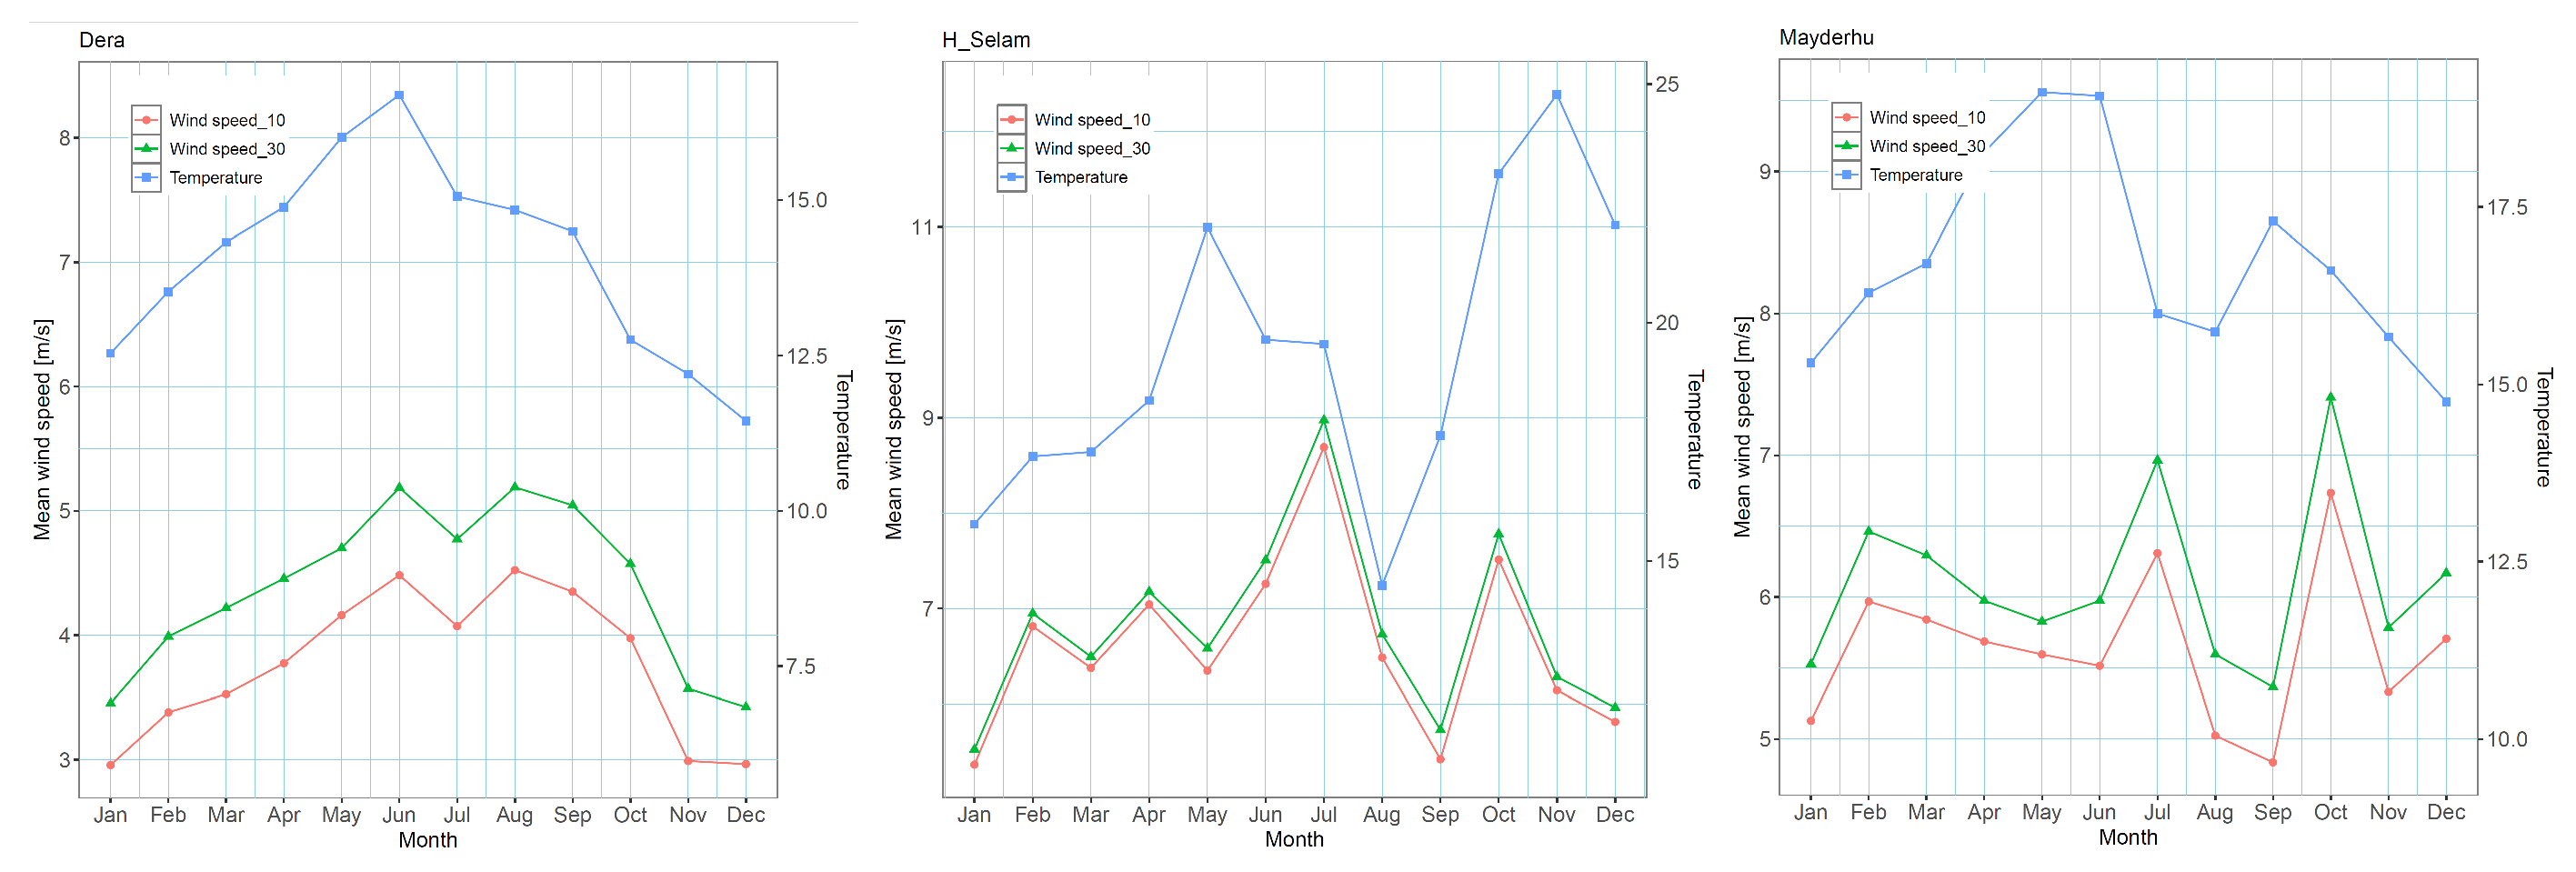
Figure 7.
Wind direction characteristics at Dera predominantly experiences southeasterly winds with seasonal shifts, Hagere Selam shows stable northeasterly winds year-round, and Mayderhu has predominantly easterly winds with marked seasonal changes.
Figure 7.
Wind direction characteristics at Dera predominantly experiences southeasterly winds with seasonal shifts, Hagere Selam shows stable northeasterly winds year-round, and Mayderhu has predominantly easterly winds with marked seasonal changes.
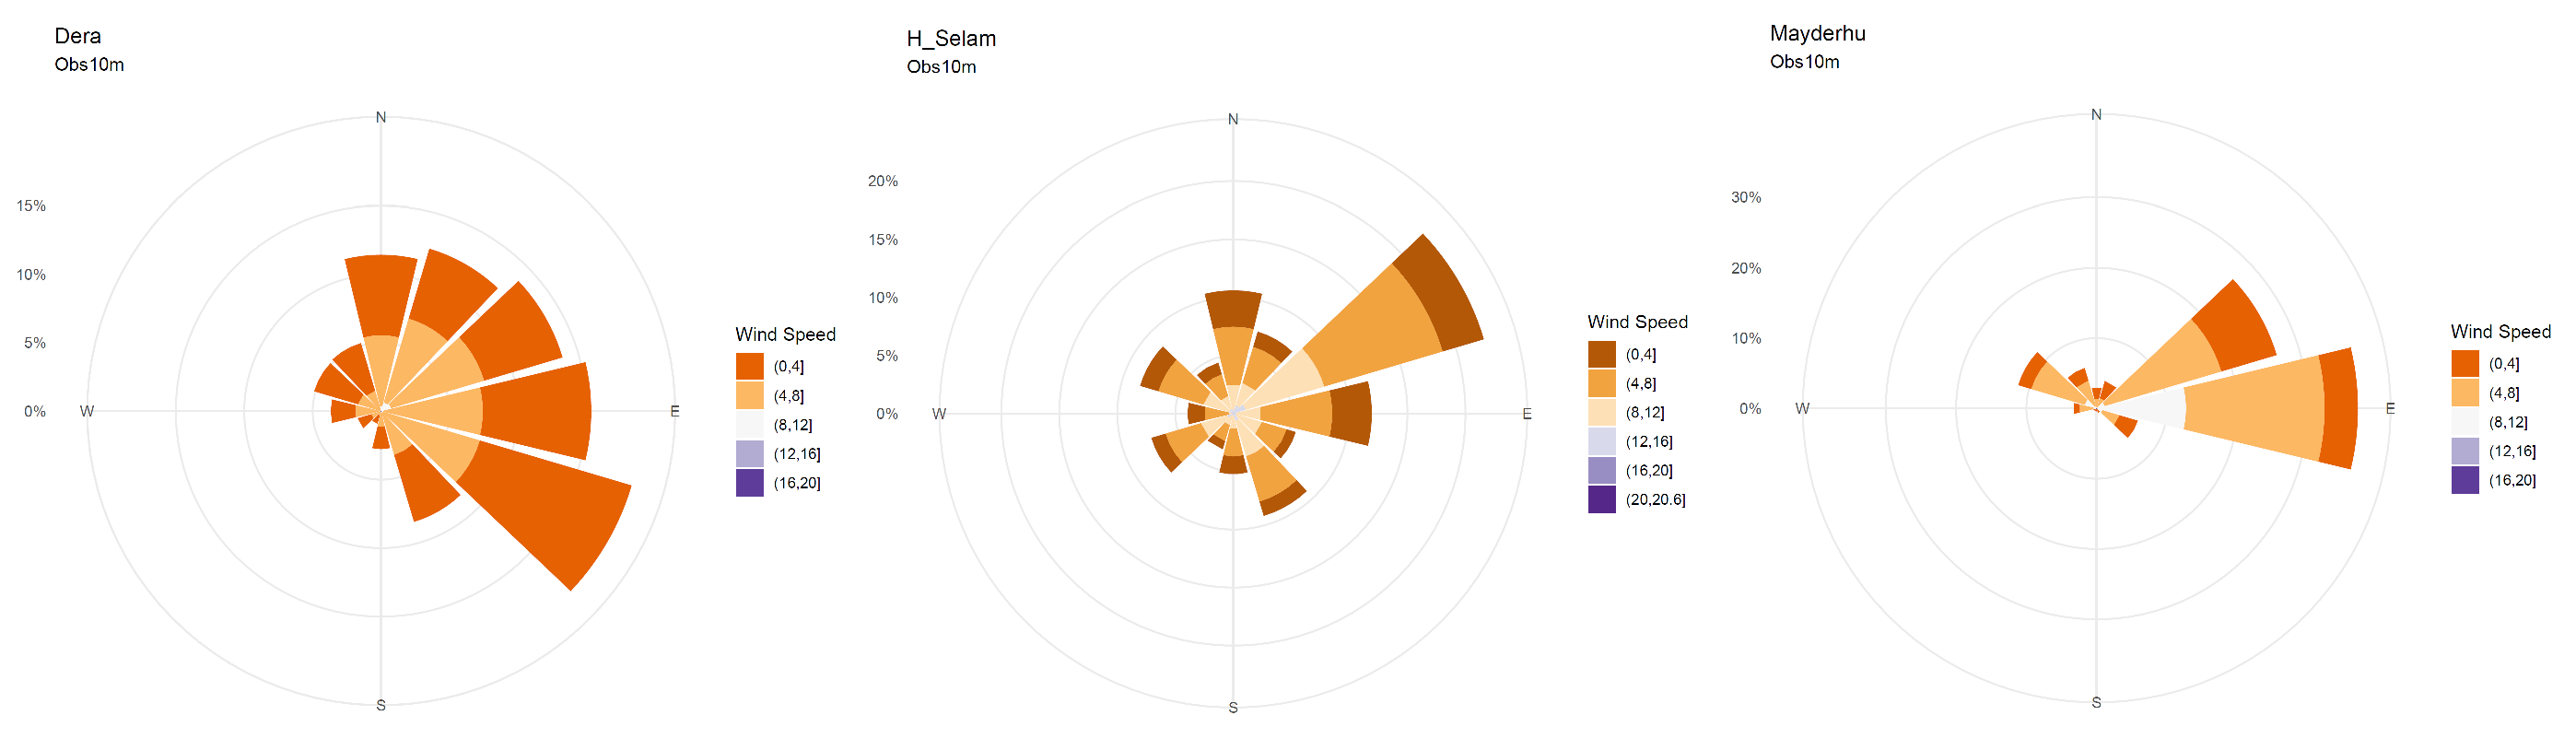
Figure 8.
Seasonal wind direction shifts at Dera, Hagere Selam, and Mayderhu. Dera shifts from southeasterly to northerly winds in summer, Hagere Selam shows a slight southwesterly deviation in spring, and Mayderhu transitions from easterly to northwesterly winds during the summer.
Figure 8.
Seasonal wind direction shifts at Dera, Hagere Selam, and Mayderhu. Dera shifts from southeasterly to northerly winds in summer, Hagere Selam shows a slight southwesterly deviation in spring, and Mayderhu transitions from easterly to northwesterly winds during the summer.
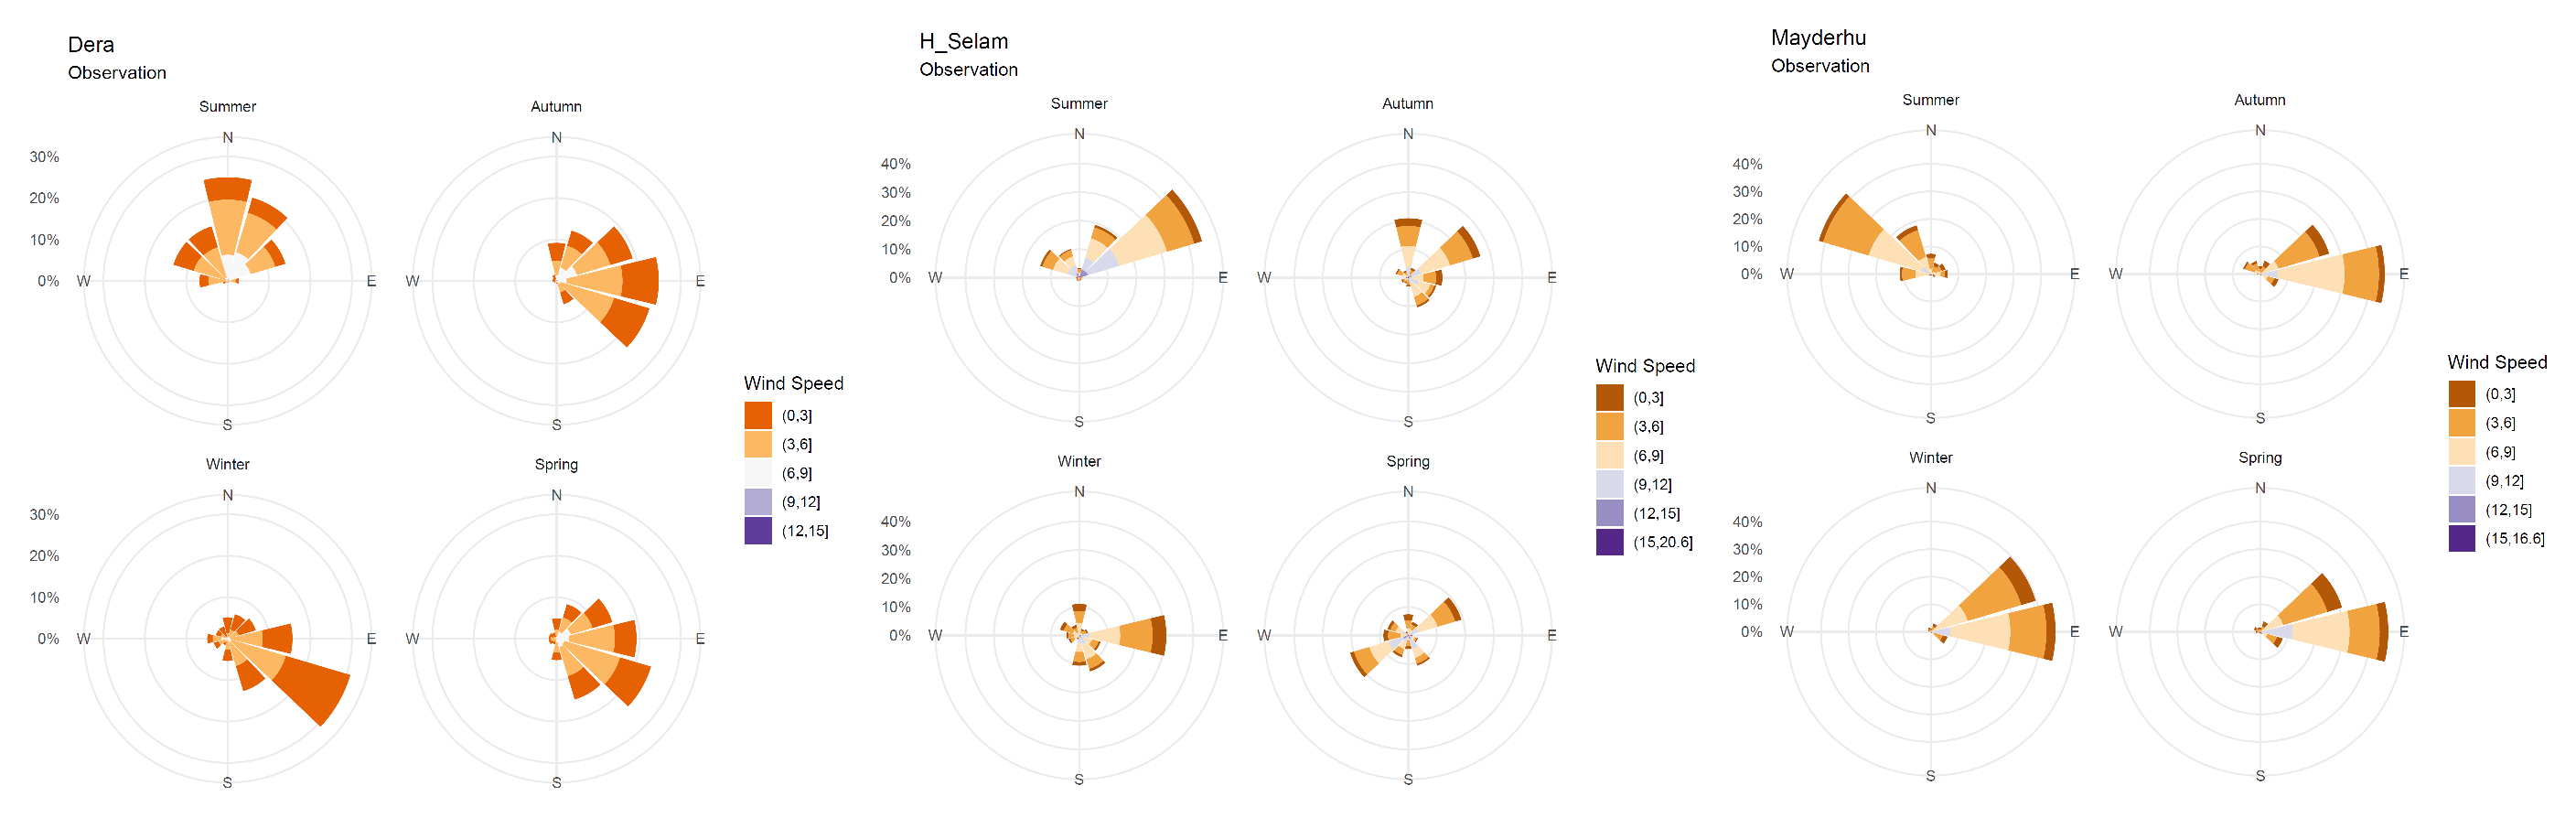
Figure 9.
Daily wind direction patterns across the region. Afternoon winds generally shift to easterly directions in Dera and Mayderhu, while Hagere Selam maintains a consistent wind direction throughout the day.
Figure 9.
Daily wind direction patterns across the region. Afternoon winds generally shift to easterly directions in Dera and Mayderhu, while Hagere Selam maintains a consistent wind direction throughout the day.
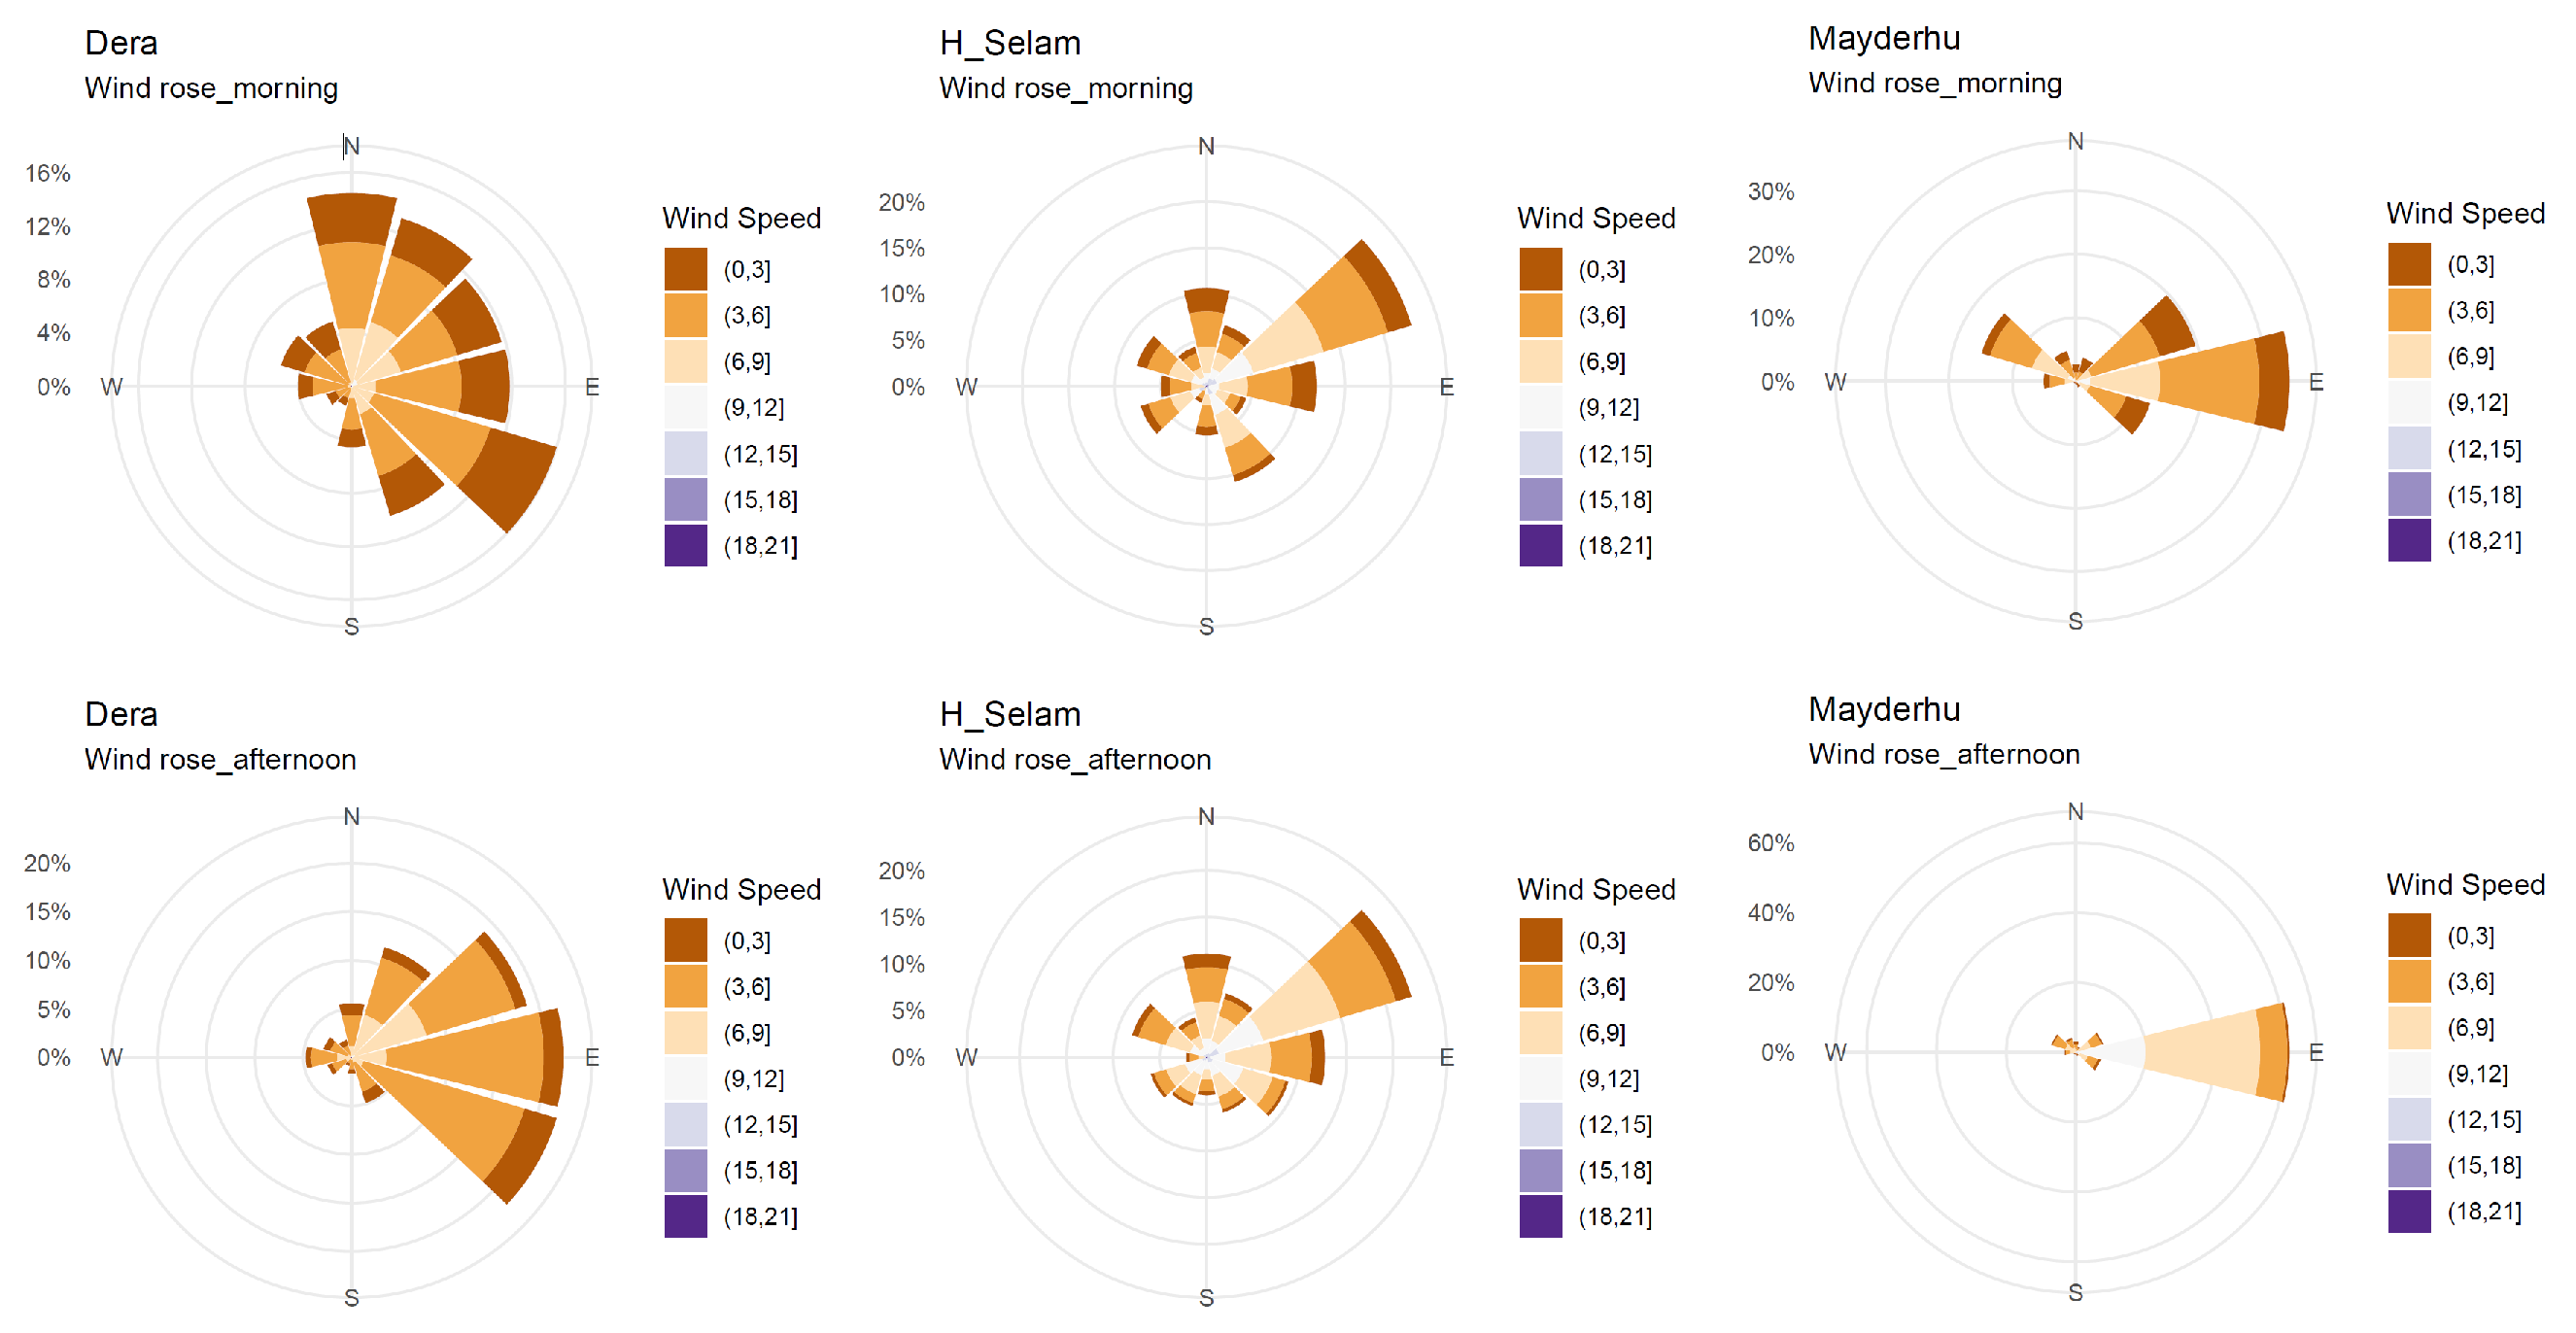
Figure 10.
Wind shear exponent at the Dera site, varying between 0.1 and 0.3, indicating strong wind gradients due to the steep terrain. The diurnal pattern shows lower wind shear during the day and higher at night, suggesting active convective conditions.
Figure 10.
Wind shear exponent at the Dera site, varying between 0.1 and 0.3, indicating strong wind gradients due to the steep terrain. The diurnal pattern shows lower wind shear during the day and higher at night, suggesting active convective conditions.
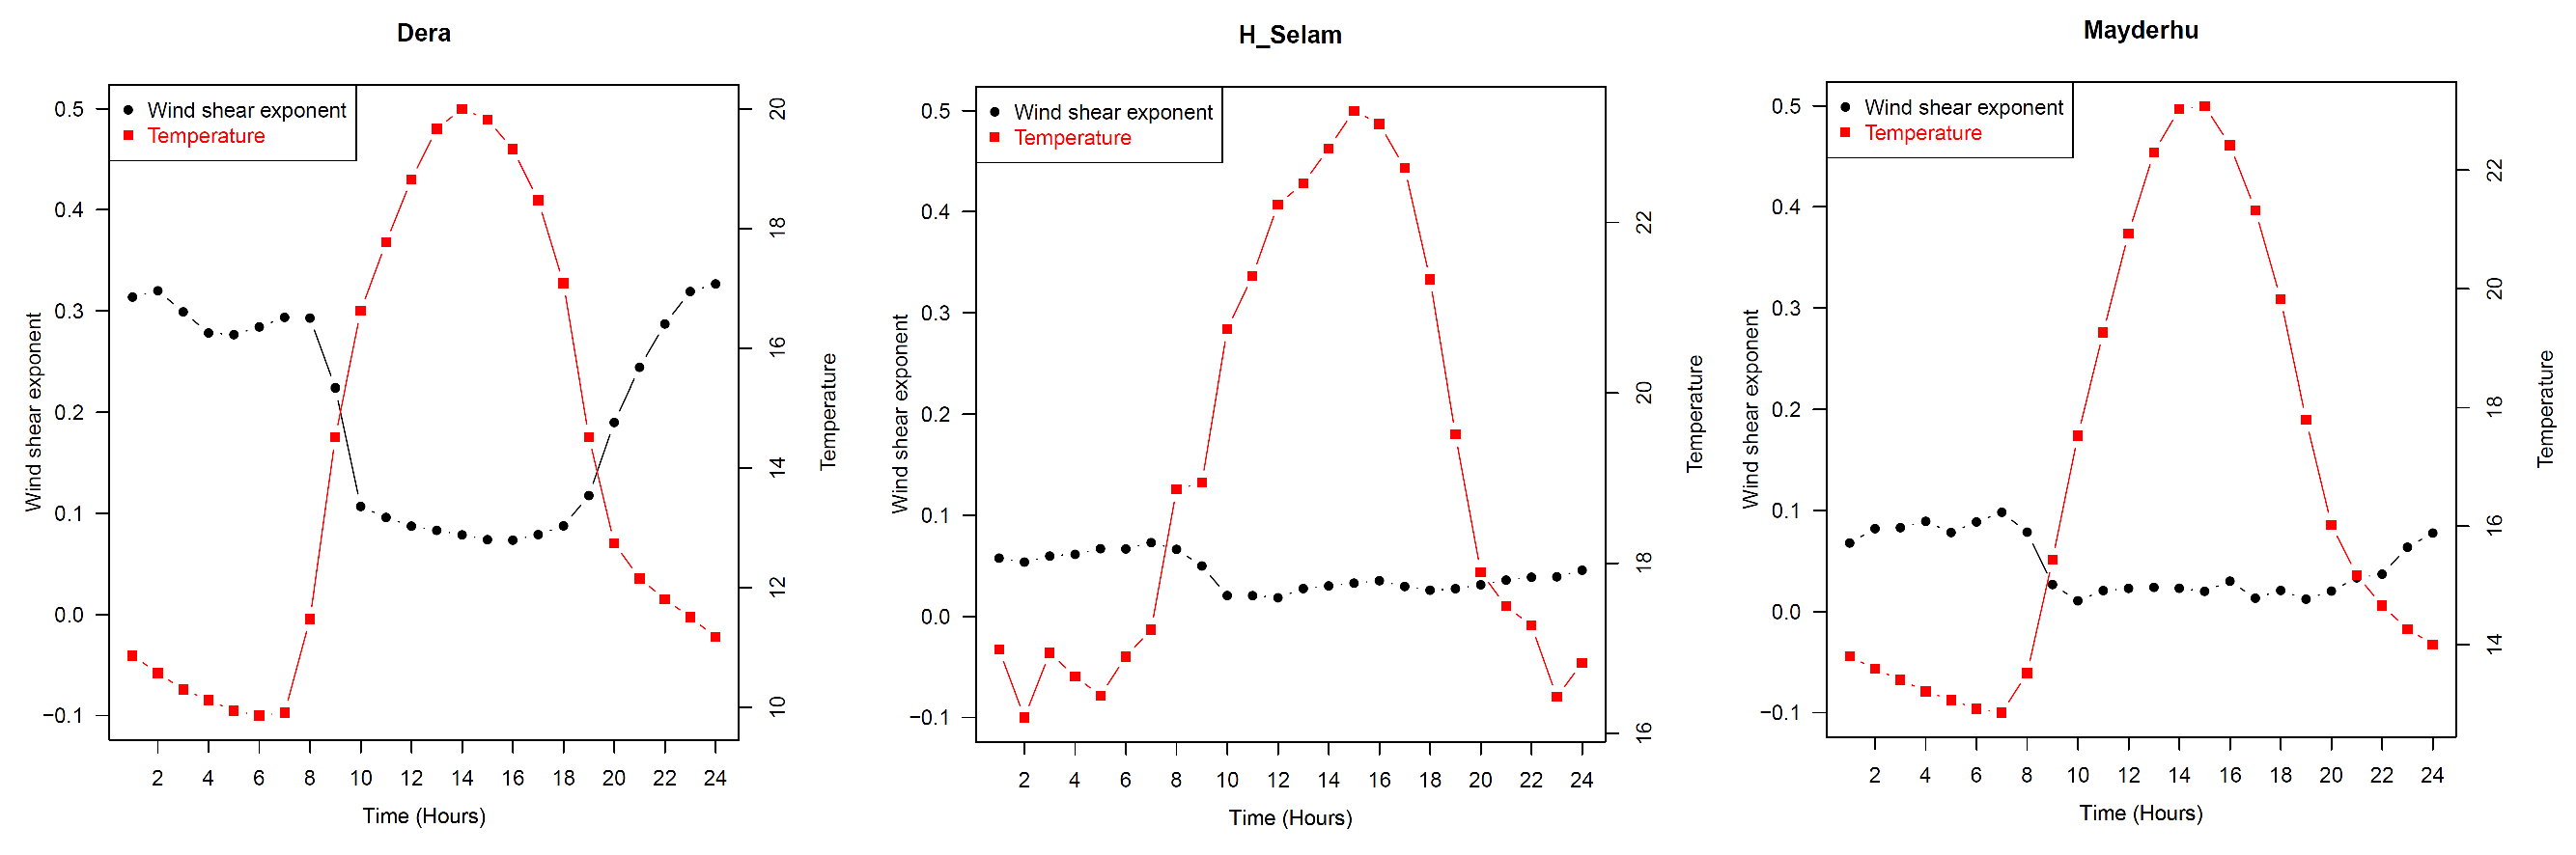
Figure 11.
Yearly wind shear variations at Dera, exhibiting erratic sinusoidal patterns due to complex terrain interactions. Hagereselam and Mayderhu show more stable low-wind shear patterns, reflecting smoother terrain and less diurnal variation.
Figure 11.
Yearly wind shear variations at Dera, exhibiting erratic sinusoidal patterns due to complex terrain interactions. Hagereselam and Mayderhu show more stable low-wind shear patterns, reflecting smoother terrain and less diurnal variation.
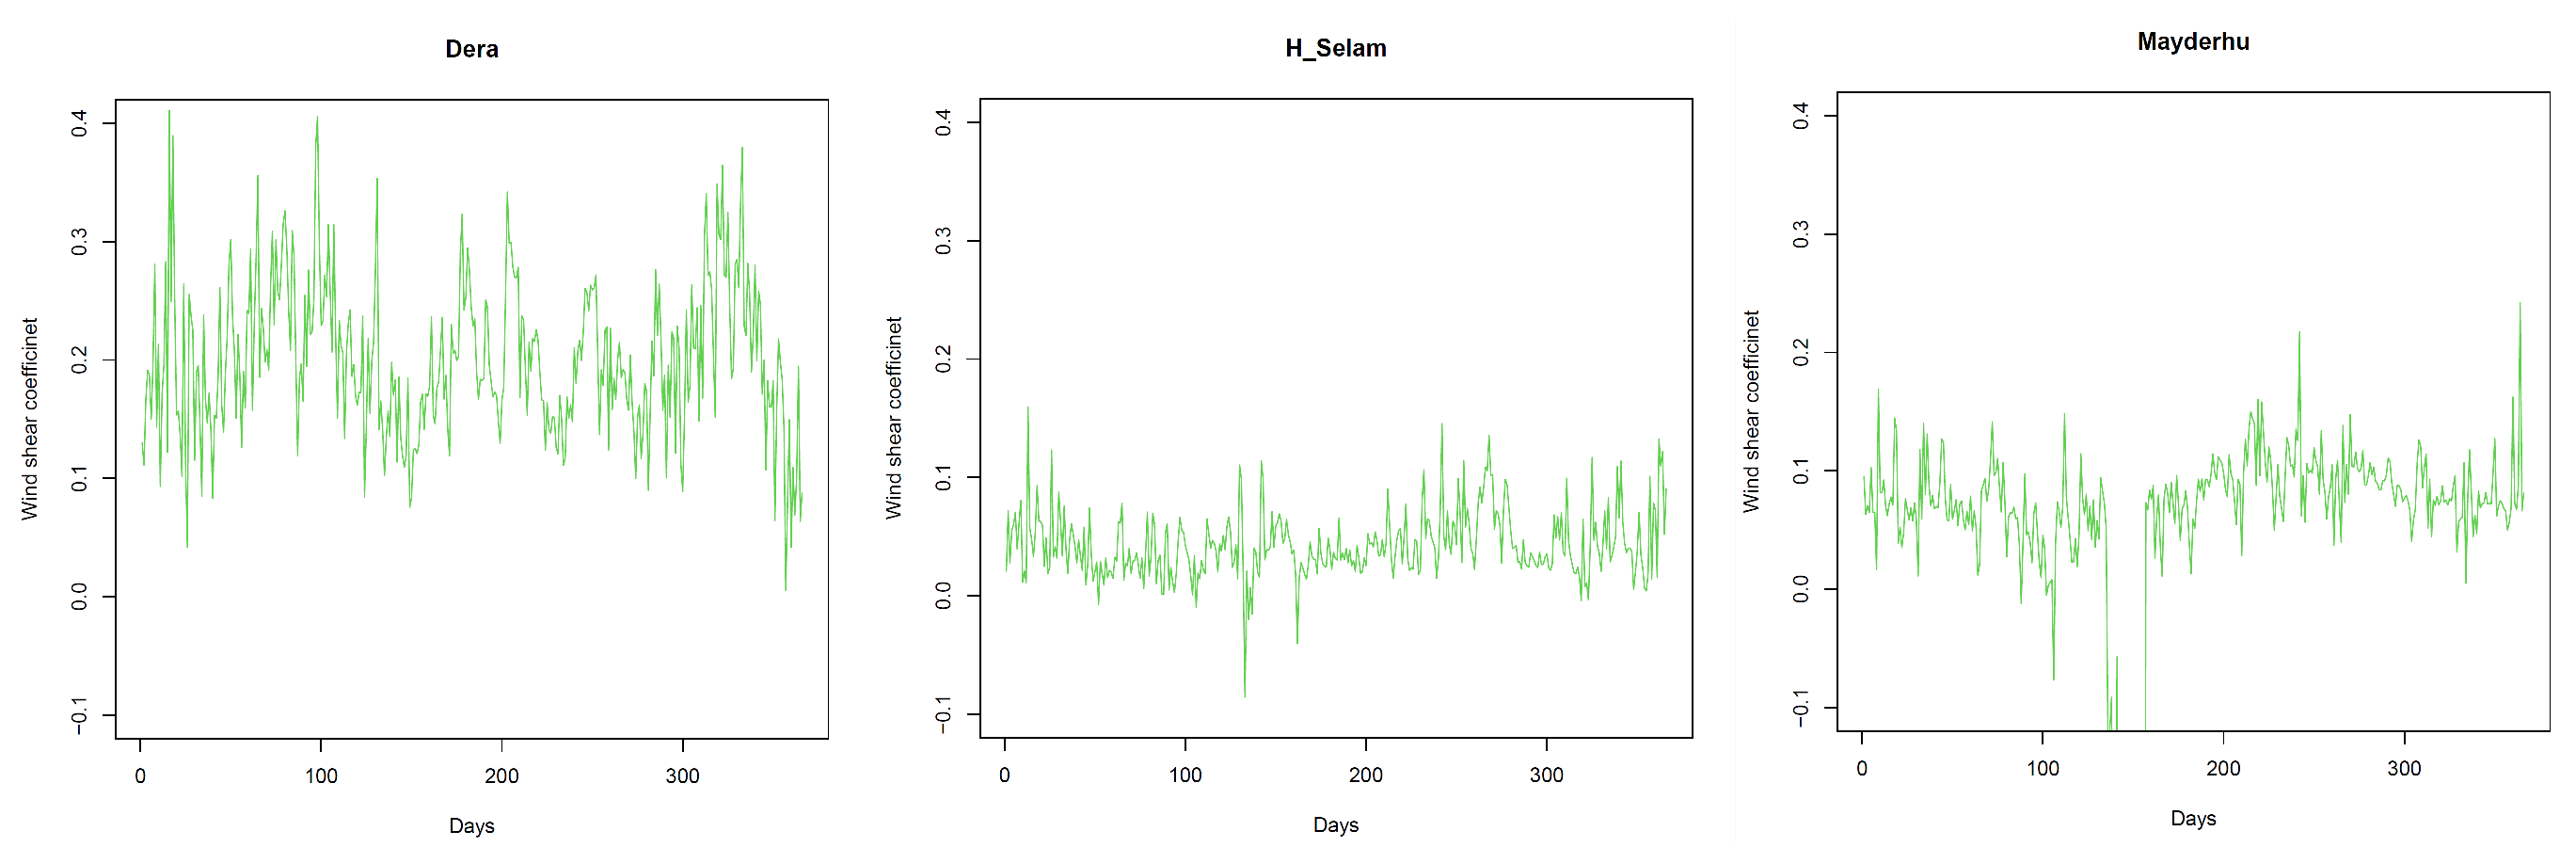
Figure 12.
Turbulence intensity at the Dera site, with a peak of 0.5 at 10 meters above ground, reflecting the impact of steep terrain. Significant diurnal variations are observed, with higher turbulence at night due to temperature gradients.
Figure 12.
Turbulence intensity at the Dera site, with a peak of 0.5 at 10 meters above ground, reflecting the impact of steep terrain. Significant diurnal variations are observed, with higher turbulence at night due to temperature gradients.
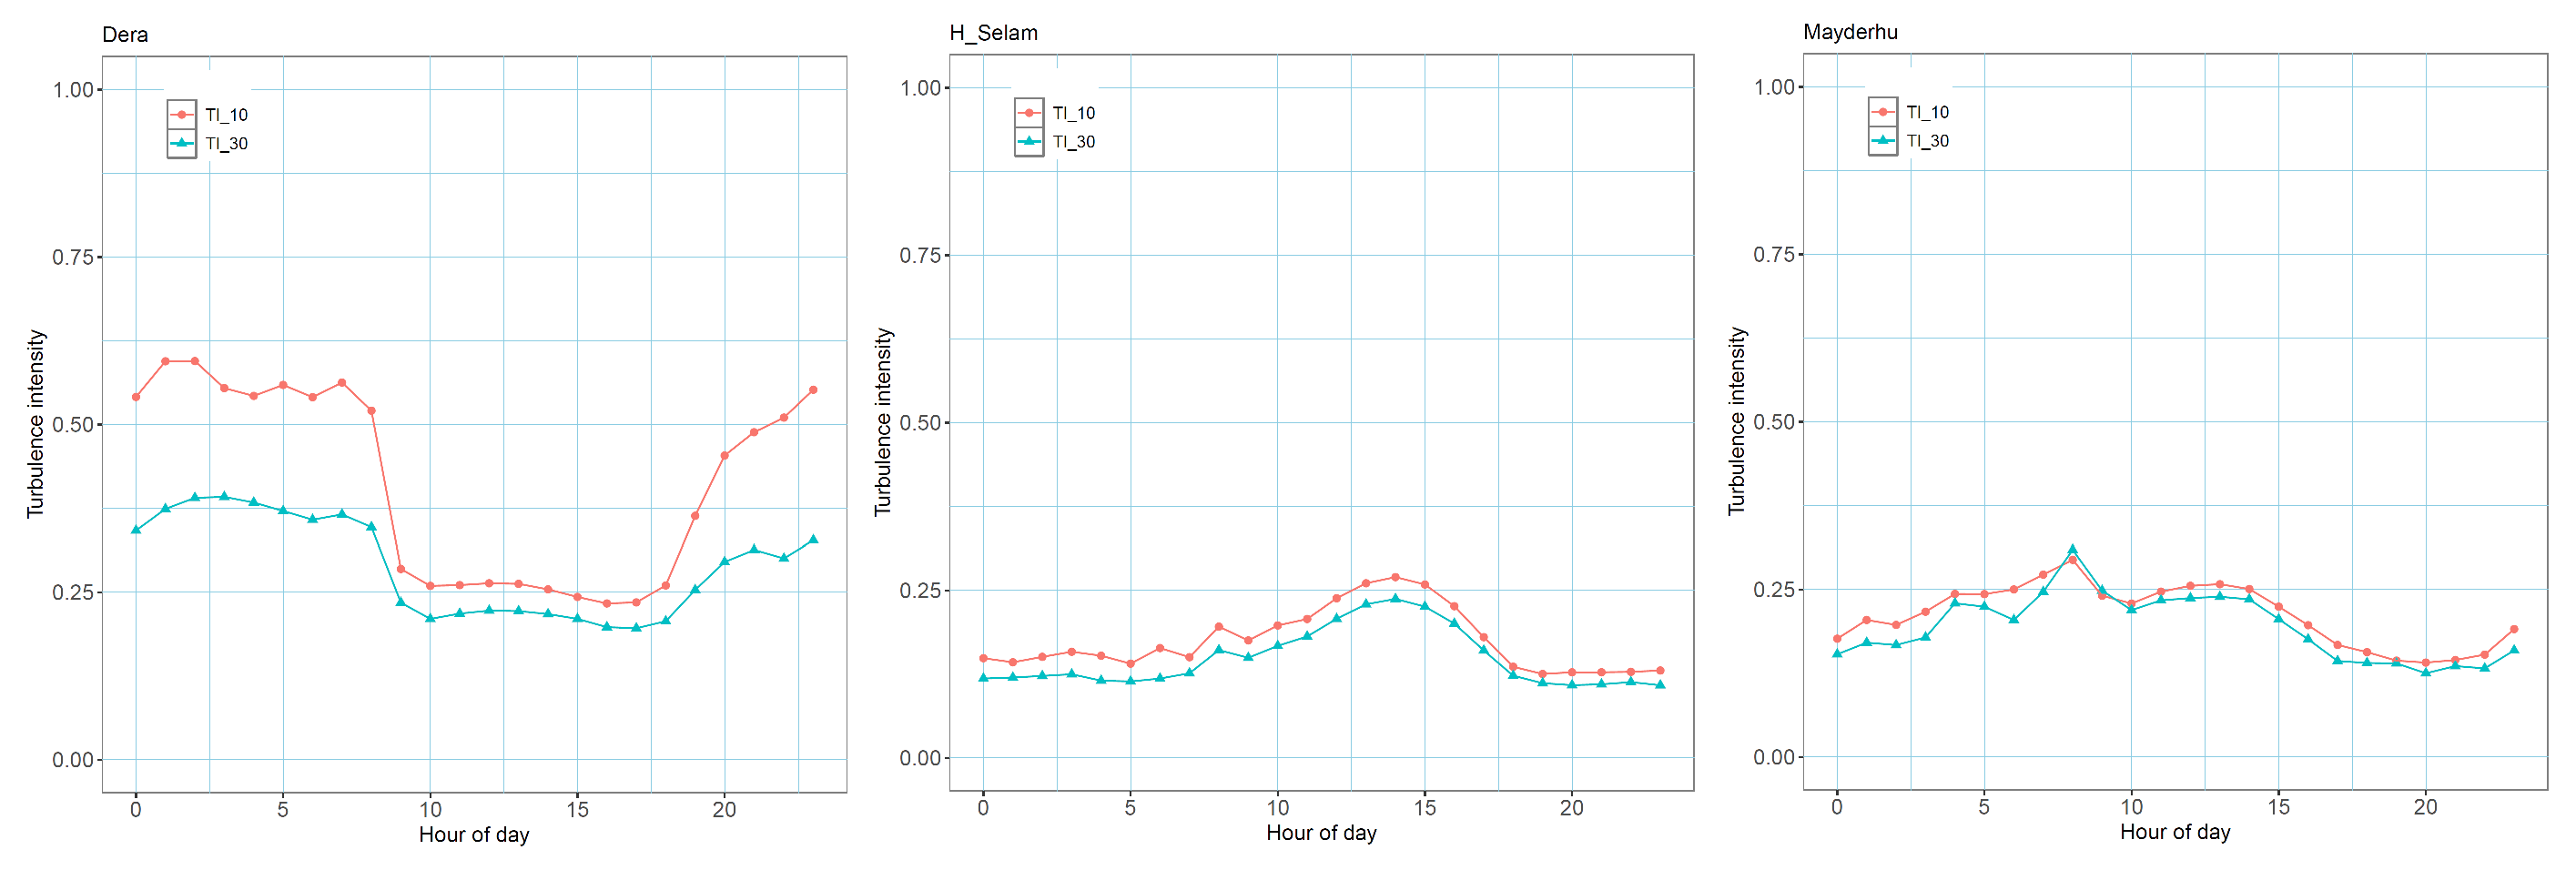
Figure 13.
Yearly turbulence intensity comparisons showing Dera with higher values (approximately 0.4) and greater differences between 10 m and 30 m heights. Hagere Selam and Mayderhu show lower and more stable turbulence intensities, indicating smoother wind flow due to flatter and less rugged terrain.
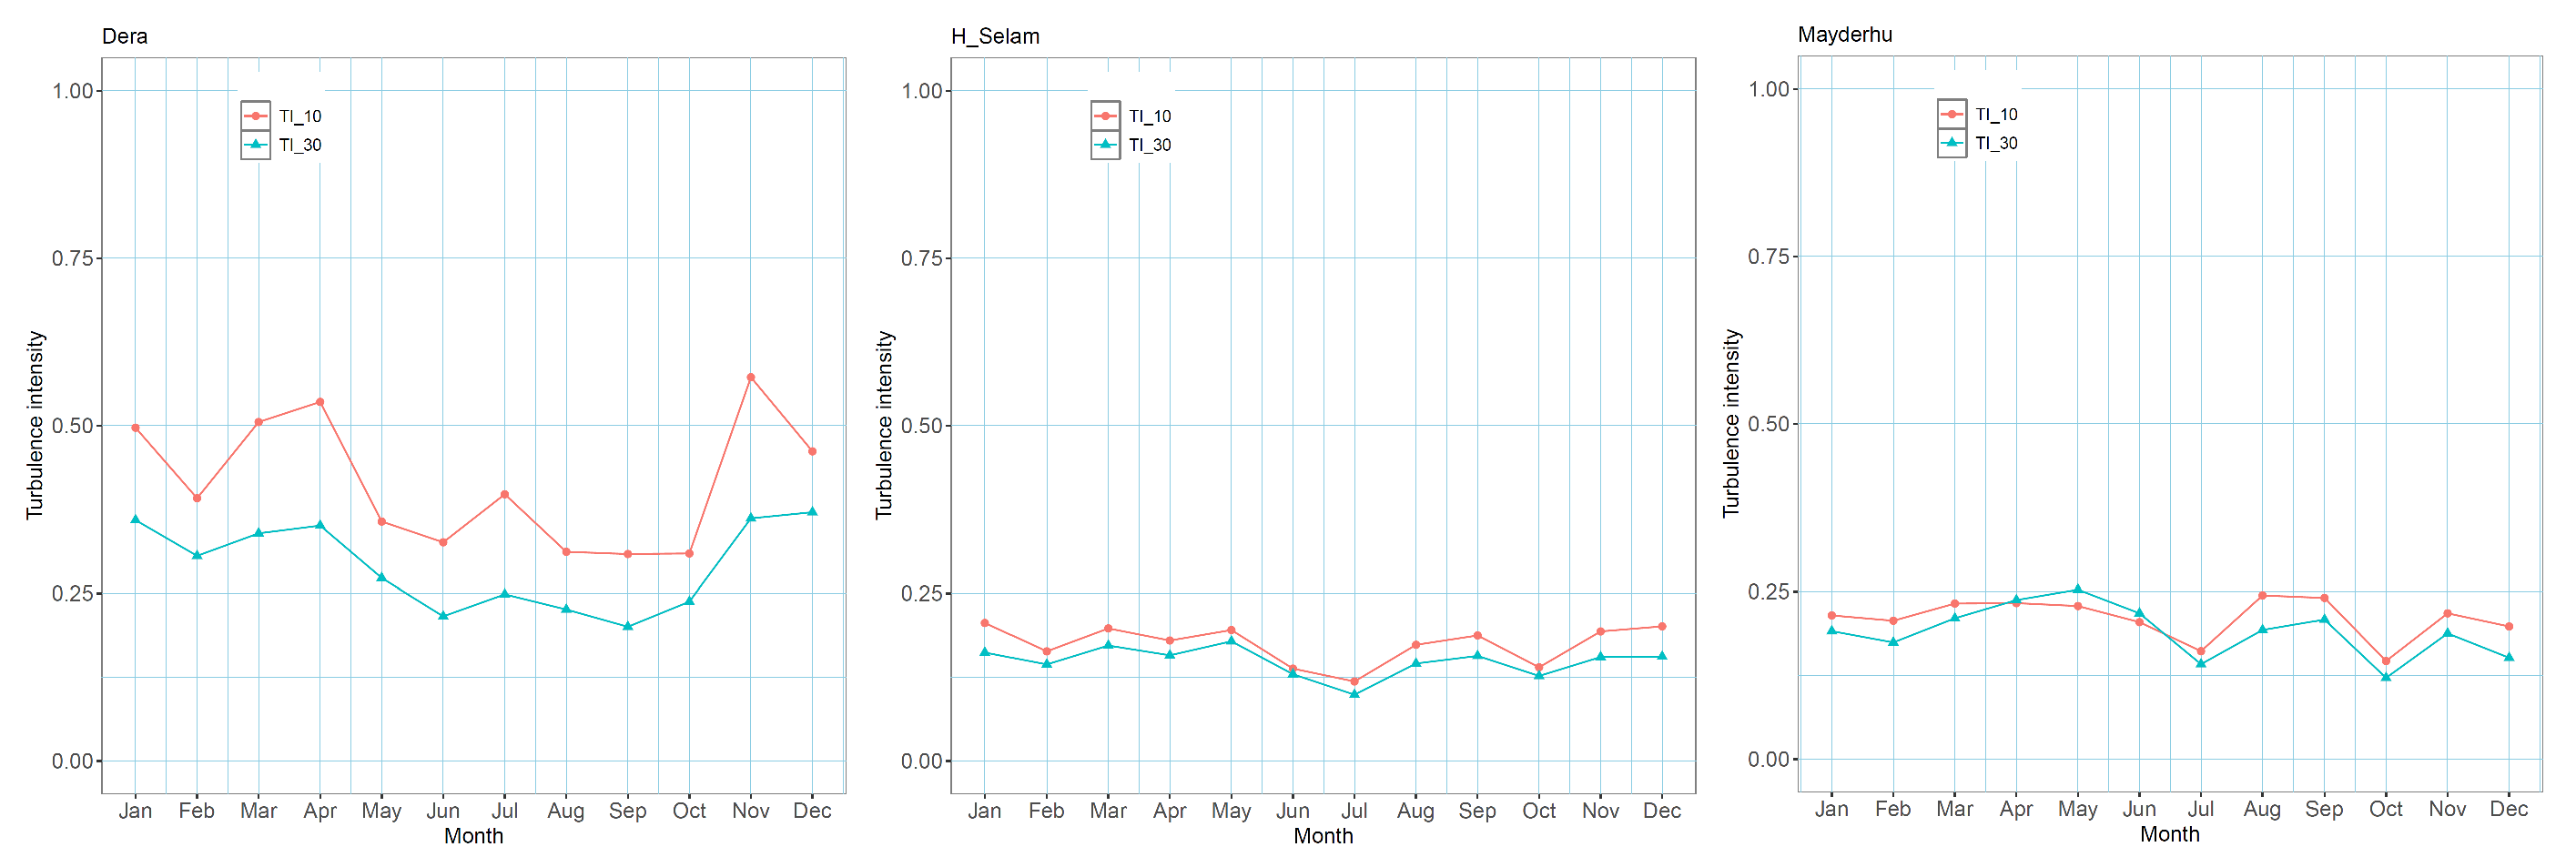
Figure 14.
Wind speed standard deviation as a function of mean wind speed at 10 m and 30 m heights for Dera, Mayderhu, and Hagereselam sites, with turbulence levels "A," "B," and "C" from IEC (1998) as benchmarks. All sites generally exhibit standard deviations below IEC specifications, indicating acceptable turbulence levels for turbine operations. Dera shows higher variability in wind speeds compared to Mayderhu and Hagereselam.
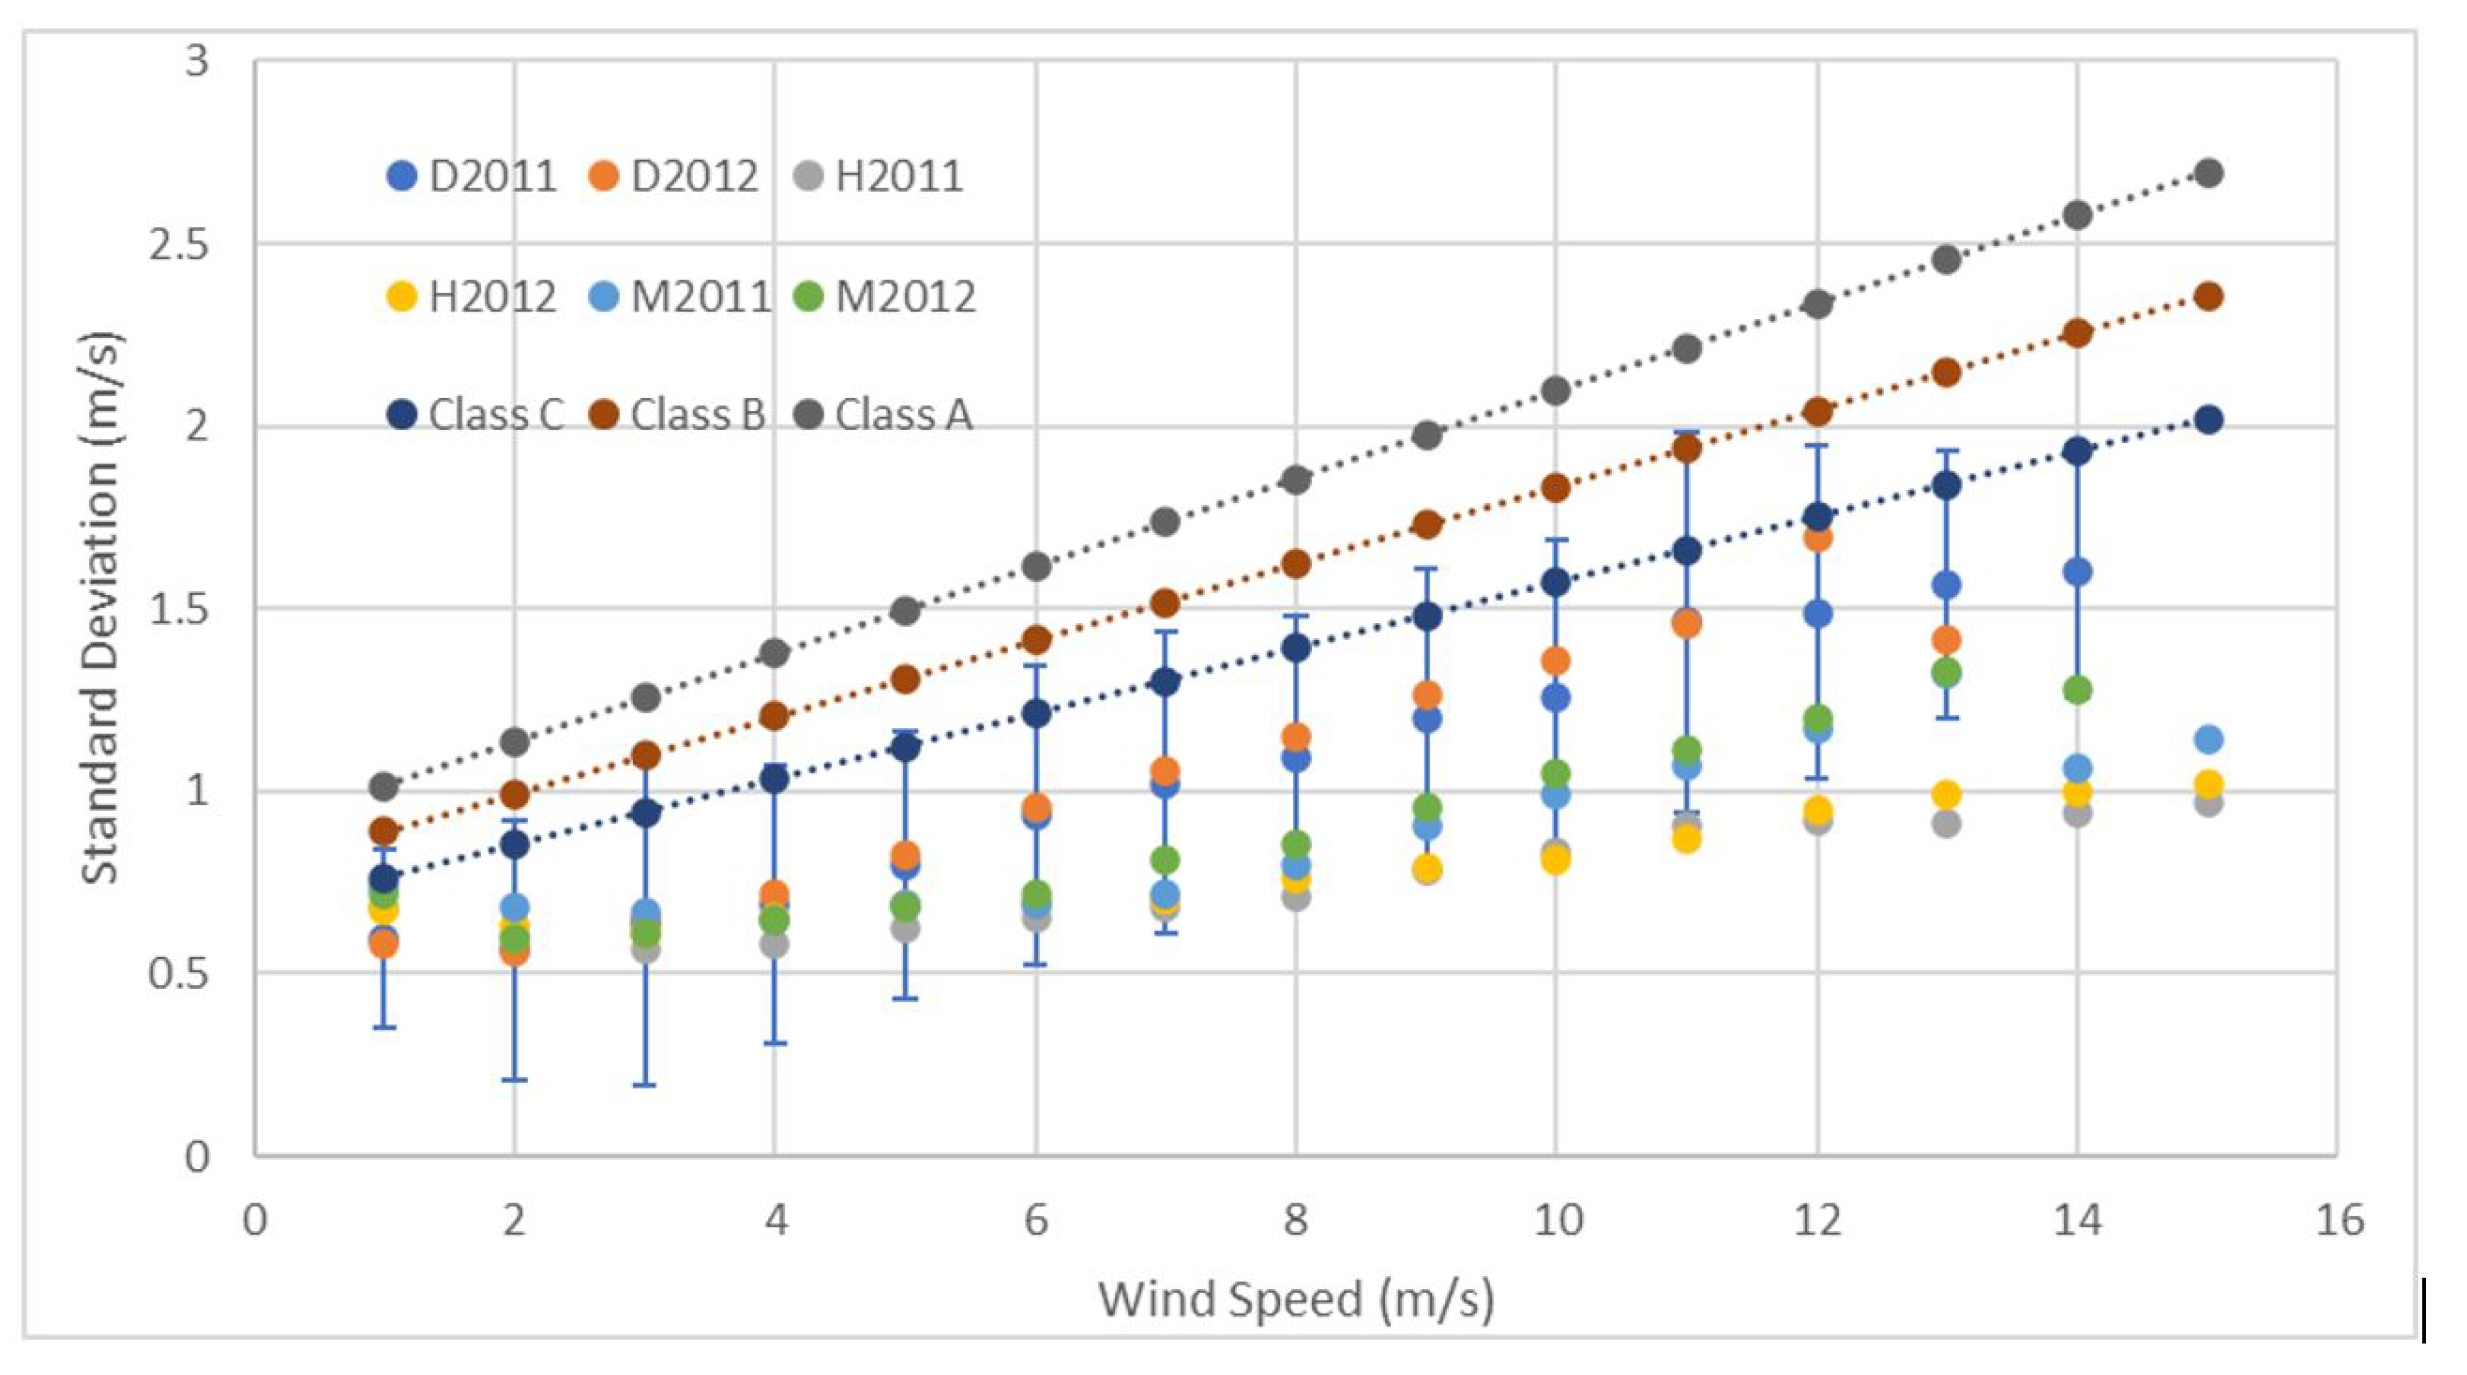
Figure 15.
Influence of prevailing wind direction on turbulence intensity and wind shear exponent at the Dera site. The highest wind speeds, over 6 m/s, originate primarily from the North, Northeast, and Southeast, with the East and Southeast showing higher wind shear exponents, indicating stronger vertical wind gradients. Additionally, turbulence intensity is highest from North to Southeast, with the most turbulent winds (intensity > 0.6) coming from the East and Southeast.
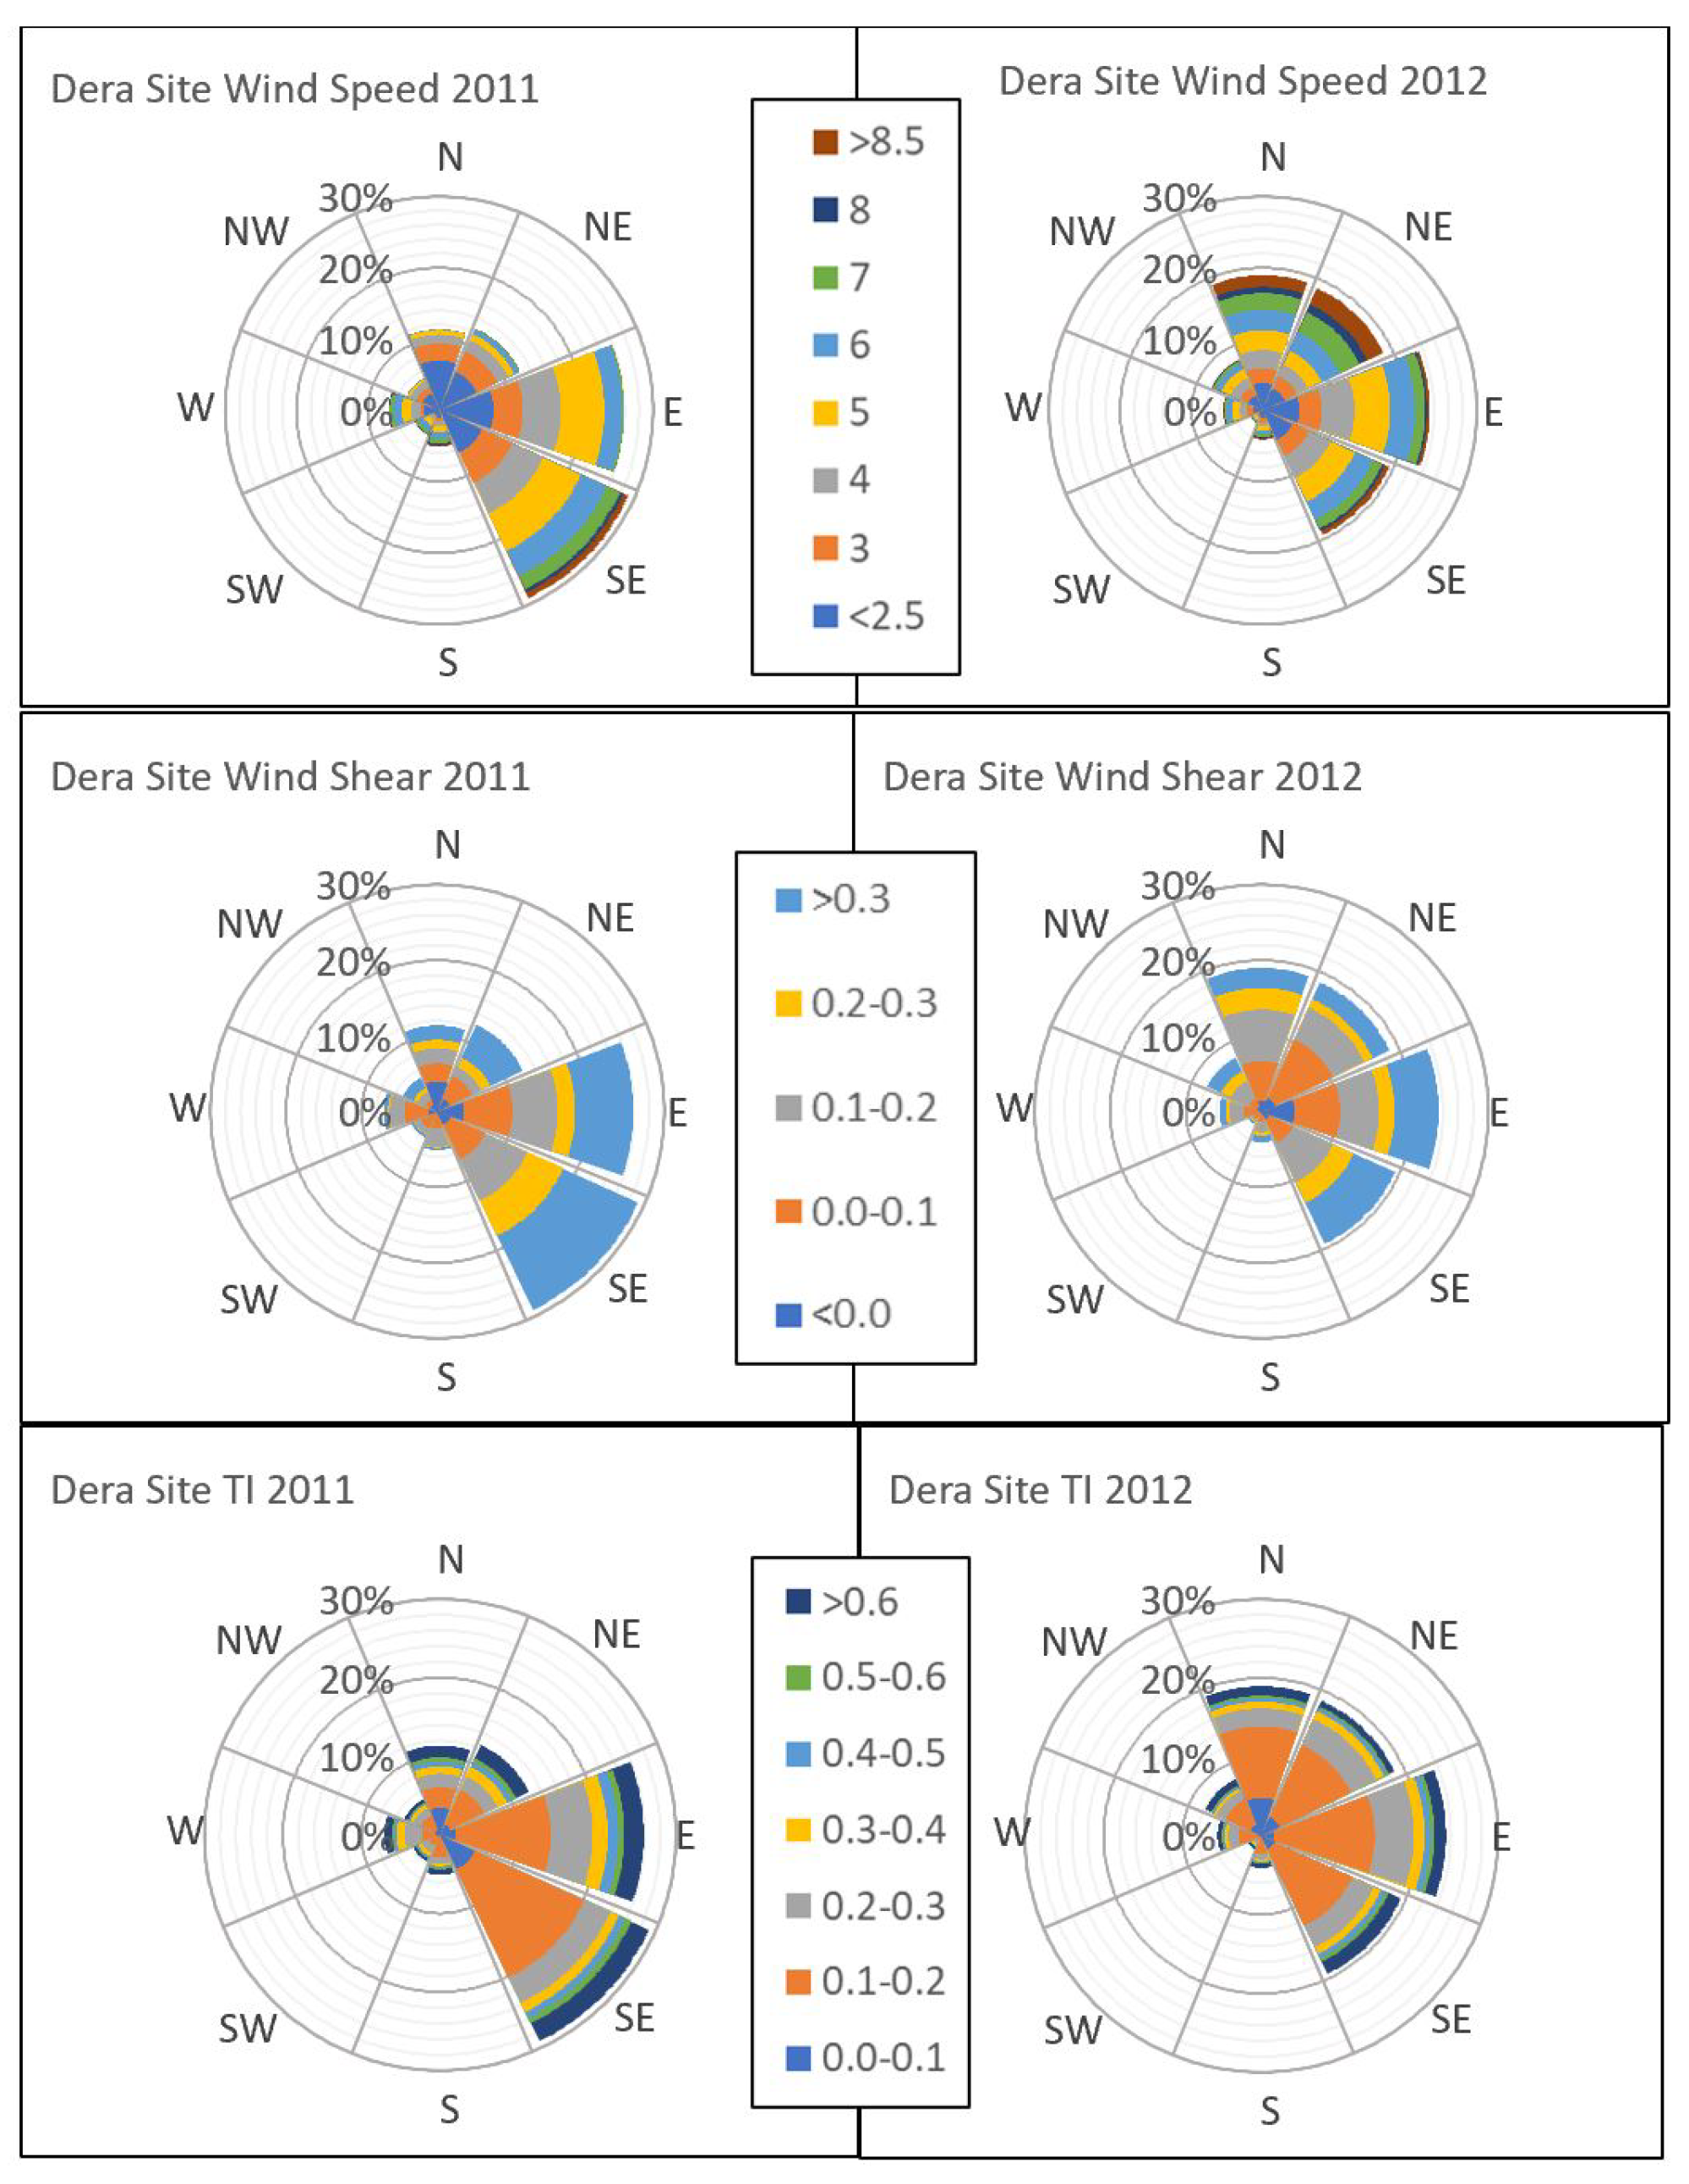

Table 1.
Classification of atmospheric stability based on stability parameter wind shear () and turbulence intensity (TI). This classification categorizes atmospheric conditions into five stability classes: strongly stable, stable, neutral, convective, and strongly convective. Each class is characterized by specific ranges of the stability parameter () and turbulence intensity (TI), highlighting the varying degrees of resistance to vertical air movement and the associated meteorological phenomena.
| Atmospheric stability | [10] | [6] | [3] | ||
|---|---|---|---|---|---|
| zeta | zeta | TI | zeta | TI | |
| Strongly stable | > 0.3 | >0.17 | <0.1 | >0.36 | <0.1 |
| Stable | 0.2-0.3 | >0.17 | <0.1 | >0.36 | <0.1 |
| Neutral | 0.1-0.2 | 0.11-0.17 | 0.1-0.2 | 0.26-0.36 | 0.1-0.15 |
| Convective | 0.0-0.1 | <0.11 | >0.2 | <0.26 | >0.15 |
| Strongly convective | < 0.0 | <0.11 | >0.2 | <0.26 | >0.15 |
Table 2.
Summary of turbulence intensity (TI) and wind shear exponent (WSE) from various studies. This table highlights key characteristics such as site location, terrain type, and the corresponding TI and WSE values. The data predominantly focus on flat terrain sites but also address the challenges posed by complex terrain. Notably, a distinct diurnal pattern in WSE and TI values is observed, with higher WSE at night and increased daytime turbulence due to atmospheric conditions. An exception is noted in a study from the Fiji Islands, where higher turbulence intensity occurs at night, influenced by local factors.
| Reference, Country | Site, Terrain | WSE | TI |
|---|---|---|---|
| [13], Saudi Arabia | Dhulom, Flat terrain | 0.3 - 0.4 night-time | 0.1 - 0.12 night-time |
| 0.0 - 0.1 daytime | 0.26 peak daytime | ||
| [14], China | Complex terrain | 0.11 night-time | |
| 0.15 peak daytime | |||
| [15], Mexico | La Ventosa Open terrain | 0.2 night-time | |
| 0.1-0.15 daytime | |||
| [16], Malaysia | Kudat, coastal few buildings | 0.5 night-time | |
| Langkawi, coastal many buildings | 0.3 lowest daytime | ||
| 0.55 night-time | |||
| 0.27 lowest daytime | |||
| [17], Fiji | Kadavu Island | 0.12-0.14 night-time | 0.25-0.45 night-time |
| 0.08 lowest daytime | 0.2-0.25 daytime | ||
| [10], Iraq | Al-Shehabi, Flat terrain | 0.2-0.45 night-time | |
| Al-Najaf | 0.1-0.2 daytime | ||
| 0.2-0.7 night-time | |||
| 0.0-0.2 daytime | |||
| 0.1-0.45 variable all-day | |||
| [18], India | Dhanushkodi, Coastal | 0.05 | |
| Kayathar, Flat | 0.07 | ||
| Jamgordrani, Complex | 0.24 |
Table 3.
Summary of site characteristics, including latitude, longitude, and elevation above sea level. The table also lists the instruments used for measuring wind direction and speed at each location.
Table 3.
Summary of site characteristics, including latitude, longitude, and elevation above sea level. The table also lists the instruments used for measuring wind direction and speed at each location.
| Mast Site | Location and altitude | Instruments |
|---|---|---|
| Dera | 13.99° N, 39.73° E, 2870 m | EKO21N Data logger At 10 m: Max40+ Anemometer DIR21+ Wind Vane At 30 m: Max40+ Anemometer |
| Hagereselam | 13.66° N, 39.19° E, 2628 m | |
| Mayderhu | 13.29° N, 39.40° E, 2512 m |
Disclaimer/Publisher’s Note: The statements, opinions and data contained in all publications are solely those of the individual author(s) and contributor(s) and not of MDPI and/or the editor(s). MDPI and/or the editor(s) disclaim responsibility for any injury to people or property resulting from any ideas, methods, instructions or products referred to in the content. |
© 2025 by the authors. Licensee MDPI, Basel, Switzerland. This article is an open access article distributed under the terms and conditions of the Creative Commons Attribution (CC BY) license (https://creativecommons.org/licenses/by/4.0/).
Copyright: This open access article is published under a Creative Commons CC BY 4.0 license, which permit the free download, distribution, and reuse, provided that the author and preprint are cited in any reuse.


