
Submitted:
21 March 2025
Posted:
24 March 2025
You are already at the latest version
Abstract
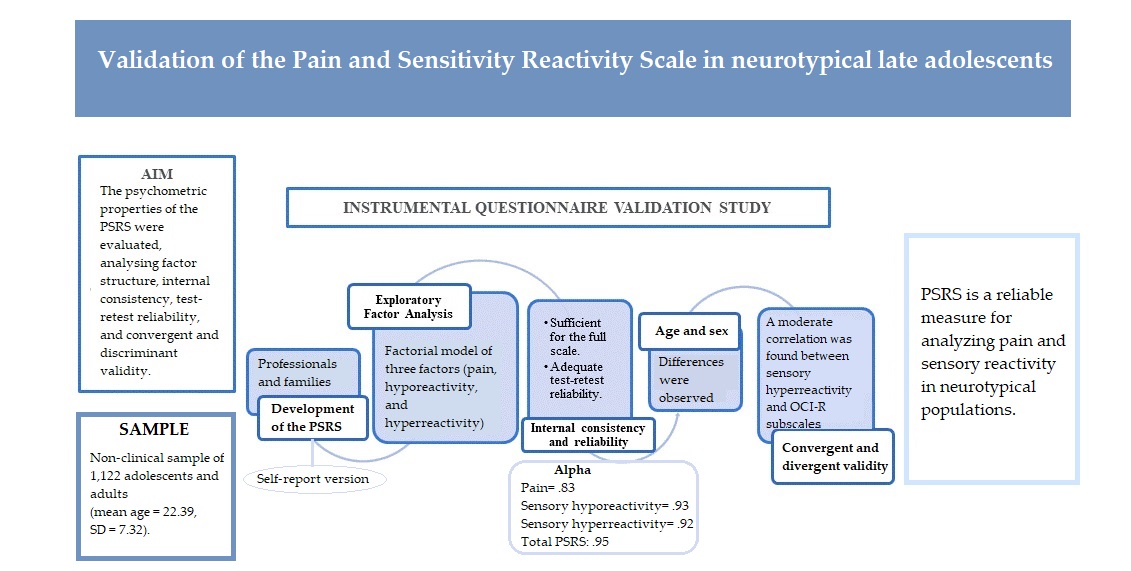
Background: In recent years there has been an increased interest in studying sensory responses to stimuli in both clinical and non-clinical populations. Sensory reactivity has been linked to restric-tive and repetitive behaviors. However, few instruments have been designed to assess the dimen-sions of sensory hyporeactivity and pain in the general population. Methods: The psychometric properties of the Pain and Sensitivity Reactivity Scale (PSRS) were analyzed in a non-clinical sample of 1,122 adolescents and adults (mean age = 22.39, SD = 7.32). Results: The PSRS exhibited excellent psychometric properties and three first-order factor models were confirmed. The sensory hyperreactivity subscales were highly correlated with the sensory over-responsivity scales, whereas a moderate correlation was found between sensory hyperreactivity measured via the PSRS and OCI-R subscales. Furthermore, sensory hyporeactivity and hyperreactivity appear to be moderately and positively correlated. Differences were observed as a function of sex and age. Conclusions: PSRS is a reliable measure for analyzing pain and sensory reactivity in neurotypical populations. Future research should include clinical samples and multiple informants.
Keywords:
Sensory response
; sensitivity reactivity
; sensory hyporeactivity
; sensory hyperreactivity
; sensory-over responsivity
; sensory-under reactivity
; pain
; adolescents
1. Introduction
An accurate understanding and assessment of pain and sensory reactivity are essential to properly address pain management in various populations, including neurotypical adolescents. Late adolescence, a stage marked by significant physical, emotional, and cognitive changes, is a critical period during which pain experiences can have lasting consequences for well-being and quality of life (Eccleston et al., 2003). In this context, reliable and validated measurement tools to assess pain sensitivity and reactivity in this population are paramount.
Altered sensory responsiveness refers to impairment when modulating outputs to several forms of sensory stimuli, including visual, auditory, tactile, odor, taste, and proprioceptive stimuli. Thus, affected individuals face challenges when regulating and organizing the type and intensity of behavioral responses to sensory inputs to match environmental demands. Sensory responsiveness can be classified into three patterns: sensory hyperreactivity/sensory over-responsivity (SOR), sensory hyporeactivity/sensory under-responsivity (SUR), and sensation seeking (Miller et al., 2007).
In addition, altered sensory responsivity is included as a component of restricted and repetitive behaviors (RRBs) pertaining to autism spectrum disorder (ASD), as outlined in the DSM-5 (APA, 2013). There has been an increase in the prevalence of ASD in both women and men around the world, with the prevalence being around 1% (e.g.: Maenner et al., 2020; Myers et al., 2019; Russell et al., 2021, Qiu et al., 2020). However, there is a lower incidence in developing countries (Asia: 0.36%; Qiu et al., 2020; India: 0.11%; Chauhan et al., 2019; Venezuela: 0.17%; Montiel-Nava & Peña, 2008; Brazil: 0.27%; Paula et al., 2011).
Several studies have reported a relationship between RRBs and emotional states in individuals with ASD and OCD, given that RRBs have been linked to anxiety and stress (e.g., Glod et al., 2019; Moritz et al., 2018; Renna et al., 2018; Russell et al., 2019; Martínez-González et al., 2021a; 2021b). Intriguingly, between 45% and 95% of individuals with ASD (Tomcheck & Dunn, 2007), and 65% of individuals with OCD also suffer from sensory symptoms (Ferrão et al., 2012). In this respect, higher levels of SOR and SUR have been found in individuals with ASD than in those with other neurodevelopmental disorders (attention-deficit/hyperactivity disorder or ADHD) and neurotypical controls (Ben-Sasson et al., 2019; Martínez-González et al., 2024b). Furthermore, a recent meta-analysis indicated that individuals with ASD and OCD exhibit olfactory dysfunction (Crow et al., 2020). Specifically, a study examining SOR in a clinical sample of young people with OCD found a high presence of such impairments (32.5% tactile hypersensitivity, 20.3% visual/auditory hypersensitivity, and 20.5% gustatory/olfactory hypersensitivity), and younger children also exhibiting a higher degree of SOR. Moreover, SOR has been found to be associated with compulsions, overall OCD burden, and impaired quality of life (Lewin et al., 2015). As recently reported by Isaacs et al. (2022), SOR also emerges when a wide range of compulsive disorders are detected, such as chronic tic disorders, OCD and OCD plus chronic tic disorders. Indeed, altered sensory responsivity has also been found in relation to other disorders such as ADHD, intellectual disability, anxiety disorders, and trichotillomania (e.g., Conelea et al. 2014; Crow et al., 2020; Falkenstein et al., 2018; Martínez-González et al., 2024b; Panagiotidi et al., 2018). In addition, SOR-related issues in such individuals are more intense than those experienced by healthy individuals with SOR. This provides further evidence of the causal link between neurological disorders and SOR while also pointing to its transdiagnostic nature (Isaacs et al., 2022).
With regard to possible sex differences in sensory reactivity, disparate outcomes have been reported as a function of the sample under study (e.g., ASD, OCD, or neurotypical samples). Various studies in non-clinical populations have reported that males exhibit lower tolerance and sensory thresholds for heat, cold, and pressure than did females (Fillingim et al., 2009; Racine et al., 2012). A recent study with a sample of 930 typically developing adults found that women reported significantly higher scores on somatosensory and pain subdomains than did men. Nonetheless, no gender differences were found in visual and auditory sensitivity in this non-clinical population (Aykan et al., 2020). However, SOR symptoms have distinct sex-based neural correlates in individuals with ASD. Specifically, in males with ASD, the association between SOR and increased connectivity was strongest in relation to attentional networks and primary sensory networks, whereas in females with ASD, SOR was more strongly related to increased connectivity between attentional networks and the prefrontal cortex. This provides a privileged snapshot of the different symptom patterns exhibited by males and females with ASD (Cummings et al., 2020). Furthermore, a higher prevalence of self-reported sensorimotor symptoms has been found in females with high-functioning ASD than in males (Moseley et al., 2018). However, in contrast to ASD, boys and girls with OCD do not seem to exhibit similar reactivity to sensory stimuli (Van Hulle et al., 2019). In consideration of the full body of available evidence, sex differences regarding SOR may be due to the heterogeneity characterizing mental disorders, with OCD, in particular, exhibiting a high degree of heterogeneity (Raines et al., 2018).
As previously mentioned, sensory reactivity has been extensively studied in clinical populations, such as those with Autism Spectrum Disorders (ASD) and Obsessive-Compulsive Disorder (OCD), where a significant prevalence of sensory over-responsivity (SOR) symptoms has been demonstrated (Ben-Sasson et al., 2019; Lewin et al., 2015). However, studies on sensory reactivity in neurotypical populations are scarce. Studies in non-clinical populations are usually limited and often focus on comparing sensory thresholds or pain sensitivity between the sexes (Fillingim et al., 2009; Aykan et al., 2020). The lack of research on neurotypical individuals hinders a comprehensive understanding of sensory variability in the general population and highlights the need to develop measurement instruments applicable to this population (Moreno-Amador et al., 2023).
Screening studies in the general population have found a strong association between symptoms of obsessive-compulsive disorder (OCD) and SOR (Ben-Sasson & Podoly, 2017; Moreno-Amador et al., 2023; Taylor et al., 2014). Specifically, Conelea et al. (2014) found SOR to be moderately correlated with the checking (.47), obsessions (.42), and ordering (.49) subscales of the obsessive-compulsive inventory—parent version and the OCD subscale of the SCARED-R (.42). Similarly, another recent study found that the touch factor of SOR was the most strongly correlated factor pertaining to the OCD spectrum (symmetry/ordering=.43; contamination/cleaning=.41; thoughts/checking= .36). In contrast, the taste factor of the SOR was more weakly correlated with the thoughts/checking subscale (.26) (Moreno-Amador et al., 2023). Despite these findings, studies examining SOR and OCD symptoms in non-clinical populations are lacking. Regarding possible sex differences in sensory reactivity, disparate outcomes have been reported as a function of the sample under study (e.g., ASD, OCD, or neurotypical samples). Various studies in non-clinical populations have reported that males exhibit lower tolerance and sensory thresholds for heat, cold, and pressure than females (Fillingim et al., 2009; Racine et al., 2012). A recent study with a sample of 930 typically developing adults found that women reported significantly higher scores on somatosensory and pain subdomains than men. Nonetheless, no sex differences were found in visual and the auditory sensitivity in this non-clinical population (Aykan et al., 2020). However, SOR symptoms have distinct sex-based neural correlates in individuals with ASD. Recent findings indicate that SOR, abdominal pain, and anxiety are interrelated in clinical and non-clinical populations (Dufton et al., 2010; Mazefsky et al., 2021; Mazurek et al., 2013; 2014; Thapar et al., 2020). In this respect, functional abdominal pain disorders are common in 3–16% of the general population (Thapar et al., 2020). In addition, several studies have pointed to a relationship between abdominal pain, selective dietary patterns, emotional instability, and gut dysbiosis in neurodevelopmental disorders such as ASD, all of which seem to be related to the gut-brain microbiota axis (Andreo-Martínez et al., 2018; 2020; 2021; Martínez-González, & Andreo-Martínez, 2019; 2020).
Recent findings indicate that SOR, abdominal pain and anxiety are inter-related in clinical and non-clinical populations (e.g., Dufton et al., 2010; Mazefsky et al., 2021; Mazurek et al., 2013; 2014; Thapar et al., 2020). In this respect, functional abdominal pain disorders are common in 3–16% of the general population (Thapar et al., 2020). In addition, several studies have pointed to a relationship between abdominal pain, selective dietary patterns, emotional instability and gut dysbiosis in neurodevelopmental disorders such as ASD, all of which seem to be related to the gut-brain microbiota axis (Andreo-Martínez et al., 2018; 2020; 2021; Martínez-González, & Andreo-Martínez, 2019; 2020).
Different scales have been used to analyze sensory symptoms in both clinical and non-clinical populations. Self-report measures include, the short sensory profile 2 (SSP-2; Dunn, 2014), sensory experiences questionnaire version 3.0 (SEQ-3.0; Baranek, 2009), Glasgow sensory questionnaire (GSQ; Robertson & Simmons, 2013), sensory over-responsivity scales (SORS; Falkenstein et al., 2018) and sensory over-responsivity inventory (SensOR; Schoen et al., 2008), amongst others. However, not all measures are available in a self-report format. Instead, many instruments are designed to be completed by primary caregivers as key informants. Notably, some of these scales have not been previously validated in neurotypical populations following a planned approach to address previously established objectives regarding the psychometric validation of instruments. Thus, new self-report instruments, including those for sensory responses and pain, must be developed for use in clinical and non-clinical populations. Pain (abdominal pain) is an independent variable related with SOR and anxiety meaning that it may share some common underlying mechanisms (Mazurek et al., 2013; 2014). In this sense, screening for these factors (pain and reactivity response) may help with the development of an integrative treatment approach. Therefore, the development of these new instruments must incorporate pain as a determining factor (Newton et al., 2019). The development of self-report instruments to measure sensory reactivity and pain is necessary to analyze sensory profiles in the general population and to understand the way in which their symptoms differ from those found in clinical populations.
Thus, the present study aims to examine the psychometric properties of a new instrument, the Pain and Sensitivity Reactivity Scale (PSRS), administered to a community-based sample of Spanish adolescents and adults. To this end, the following specific objectives were established: i) conduct exploratory factor analysis; ii) examine the factor structure of the tool; iii) assess internal consistency and test-retest reliability; iv) examine convergent (sensory over-responsivity scales) and discriminant validity (obsessive-compulsive inventory – revised), and v) explore outcomes both overall and for individual subscales as a function of gender and age.
2. Materials and Methods
An instrumental study was conducted in Spain to develop and examine the psychometric properties of the PSRS in a sample of neurotypical adults. The COSMIN methodology for the development of the PSRS has been used (Mokkink et al., 2019; Terwee et al., 2018).
2.1. Data and Sample
An incidental sample of 1,122 Spanish adolescents and adults was recruited to participate in the present study, with 294 being male and 818 being female. An overall response rate of 99.1% was achieved among the participants. Ten adolescents did not want to participate and were excluded from the study (3 from Alicante, 4 from Andalusia, 3 from Murcia). Mean age was 22.39 (SD = 7.32), with 48% of the sample being under 19 years old. The sample consisted of 1,122 (T0) and 124 (T1) Spanish adolescents and adults aged 16-68 years who completed all survey measures.
2.2. Measurement
Sensory over-responsivity scales (SOR-Scales; Falkenstein et al., 2018)
The SORS assesses sensory hyperreactivity to auditory, tactile, visual, olfactory and taste stimuli. The present study used a version adapted from a version administered to a general community sample in a survey study (Taylor et al., 2014). It consists of rating scales that examine distress and impairment of both auditory and tactile over-reactivity (Falkenstein et al., 2018). Each SORS subscale contains four items that are rated on a five-point scale ranging from 0 to 4, with overall scores ranging from 0 to 80. Total scores for each subscale are calculated individually and range from 0 to 16, with higher scores indicating greater severity. Internal consistency of the SORS and its subscales, examined according to Cronbach’s alpha, has been found to be strong in a sample from the United States (SOR-overall= .93; SOR-hearing=.89; SOR-touch=.88; SOR-smell=.90; SOR-sight=.94; SOR-taste=.88) and a sample from Spain (hearing = .89; touch = .86; smell = .91; sight= .90; taste = .86) (Moreno-Amador, et al., 2023).
Obsessive-compulsive inventory – revised (OCI-R; Foa et al., 2002)
The OCI-R is an 18 item self-report questionnaire that assesses obsessive-compulsive symptom severity using a five-point Likert scale ranging from 0 (not at all) to 4 (very much). The OCI-R comprises six factors that represent the following symptom domains: checking, ordering, neutralizing, washing, obsessing and hoarding. Each factor is composed of three items, with overall scores ranging from 0 to12. Overall, the measure has exhibited good internal consistency in samples from a number of different countries, with Cronbach’s α outcomes ranging from .81 to .95 (Hon et al., 2019; Martínez-González et al., 2011; Piqueras et al., 2009).
Pain and sensitivity reactivity scale (PSRS)
The PSRS is a tool that evaluates reactivity to pain and sensory reactivity according to 50 items. It is composed of three dimensions, namely, pain, sensory hyporeactivity and sensory hyperreactivity. Items are rated on a four-point Likert scale ranging from 0 (behavior does not occur) to 3 (behavior occurs and is a severe problem). Both hyposensitivity and hypersensitivity dimensions comprise tactile, olfactory, visual, gustatory and auditory items. In addition, the PSRS includes a pain reactivity domain which comprises seven items. The PSRS was elaborated based on theoretical requisites conceived by Miller et al. (2007), which characterizes sensory modulation disorders according to three patterns (hyper-response, hypo-response and sensory seeking) as proposed nosology for diagnosis. Two version of the PSRS are available. The first is a version administered for completion by caregivers and professionals, whilst the second is a self-report version. The caregiver version of the PSRS has shown excellent internal consistency in samples with ASD (pain α =.83; broad sensory hyporeactivity α = .90; broad sensory hyperreactivity α =.93) (Martínez-González et al., 2024a). The self-report version was used in the present study.
2.3. Development and Content Validity of the New Instrument
The purpose of the PSRS is to measure sensory reactivity and pain in individuals with typical development and individuals with ASD. The first step in the present study was to validate the PSRS in a non-clinical population. The process of developing the PSRS is described below.
Elaboration of the PSRS was based on the theoretical model conceived by Miller et al. (2007) with regards to SOR and SUR. Similarly, the PSRS is grounded in existing evidence pertaining to pain from the field of neuroscience (Joseph et al., 2009), together with studies arguing that pain is an important variable for explaining sensory reactivity (Mazurek et al., 2013; 2014). The structure of the PSRS adheres to the same parameters as other validated scales that measure symptom severity (e.g., RBS-R). In this sense, a Likert scale is presented that assesses the frequency with which sensations are experienced and the extent to which they are problematic. A feeling is deemed to be problematic when it is determined that it is: 1) very intense, highly bothersome, 2) highly frequent, and 3) negatively affects other activities of daily living (e.g., avoidance of certain activities, people and/or places) and/or generates negative consequences for both the individual themselves and others.
The PSRS was administered by a multidisciplinary team (three pediatric specialists, one psychiatrist, two doctoral neuropsychologists, one doctoral psychologist, one neurodevelopmental psychologist, one doctor in chemistry and specialist in gut microbiota, and two education teachers). Initially, 100 real situations involving SOR and SUR that were reported by families who visited the hospital at which the study was conducted were recorded. Screening was performed, retaining a total of 50 real situations for further analysis. Screening was performed by four experts (two neuropsychologists with clinical experience in instrument validation, one psychiatrist and one pediatrician). With regards to the pain factor, initially, different origins of physical pain were recorded according to records obtained from pediatric and psychiatric services. In this sense, physical pain corresponded to: 1) abdominal pain (constipation, bloating, etc.) measured via five items; 2) infectious conditions (fever, otalgia, etc.) measured via four items; 3) skin (ulcers, wounds, chafing, eczema, bruises, etc.) measured via five items; 4) functional pain (occult fractures, deformities, hangnails, hip/shoulder dislocations, subluxations, spasticity, etc.) measured via three items; 5) sight and taste (eyes: irritation, conjunctivitis, ulcers, wounds; teeth/mouth/throat: caries, canker sores, gingivostomatitis, tonsillitis, abscesses, etc.) measured via four items (Palanca-Sánchez et al., 2011). This produced a total of 32 items related with different physical and medical situations underlying pain. Three doctors (two pediatricians and one psychiatrist) screened the gathered situations, producing a final set of seven items. A large number of items were found to be redundant with regards to at least one of the reported pain-related situation. Consequently, all items were grouped into a single factor, denominated as the pain factor. Subsequently, examples comprised by each item were reviewed. This process was carried out by a pediatrician, a neuropsychologist, and a psychologist. The three experts were all PhDs. Two of them were university professors in the Faculty of Psychology and were also experts in research methods. The other expert has more than twenty years of experience in medical assessment. Furthermore, the protocol of Dunn et al. (1999) was applied to all the experts so that they could evaluate the items. The judges rated the relevance of each item to each on a 5-point scale (1: low degree of item clarity; 5: high degree of item clarity), and find a consensus among the experts. It was calculated the means for item clarity, considering as adequate those items with a score of 3 or more, out of 5 (Alarcón & Blanca, 2020). Items were considered to have an adequate degree of relevance if the V-index was above this cut-off point and the 95% confidence interval did not include the value 0.70 (Aiken, 1980). The mean item clarity scores were above 3.40 in all cases, indicating that the experts considered the items to be clearly worded. Likewise, the clinical opinion of the experts was taken into consideration to indicate the most frequent items in consultation. Subsequently, the self-report version of the instrument was administered to ten young adults to measure their level of understanding in relation to items. Finally, minor adjustments were made to ensure comprehension and clarity of items.
2.4. Procedure
Participants completed all study procedures during regular timetabled lessons. Young adults from different universities across Spain participated in the study (Alicante, Elche, Murcia, Malaga and Zaragoza). All participants were residents in Spain. The survey was filled out online. The reporting assessment protocol was individually applied using the online survey tool LimeSurvey (LimeSurvey GmbH). Appropriate instructions were provided for the completion of each inventory. A researcher remained in the classroom throughout administration to assist students who experienced difficulties. Tests were administered by experienced psychologists who provided instructions and individual assistance to all students who needed it. Approximately 20 minutes were required for completion of all scales. One month following initial administration (T0), data collection procedures were repeated with a random sample of 124 college students who had participated in the first round of data collection (T1). Participants did not receive any financial compensation for their participation in the present study. The survey was conducted between November 2020 and December 2021, with a time-lapse of around one month between T0 and T1.
2.5. Data Analysis
First, structural validity of the PSRS was evaluated. In short, the PSRS comprises a pain scale made up of seven indicators/items, a broad sensory hyporeactivity scale with five subscales (4-6 items each) and a broad sensory hyperreactivity scale, also, with five subscales (4-5 items each). With regards to factorial structure, the five first-order sensory hypo- and hyperreactivity factors were defined as indicators of the higher, second-order hypo- and hypersensitivity scales, which were then modeled as indicators of a broad third-order sensory reactivity scale in accordance with the proposed theoretical model (see Figure 1).
Exploratory factor analysis was performed to examine the factor structure of the scale using SPSS 24.
Confirmatory factor analysis was conducted using EQS 6.2 software (Multivariate Software, Inc., Temple City, CA, USA). Current guidelines for good model fit suggest that comparative fit (CFI) and Tucker-Lewis (TLI) indices greater than .90 indicate good model fit, alongside root mean square error of approximation (RMSEA) values lower than .05. In addition, chi-square change (Δχ2) values were used, alongside CFI, to compare goodness of fit between models whose values were greater than .90 (Brown, 2015). Due the ordinal nature of the item we used Robust Weighted Least Square (WLSMVS) as estimation method. To ensure the stability of the results, the total sample was divided into two samples through random sampling.
Temporal stability and correlations between PSRS subscales were examined using IBM SPSS statistics version 24 (IBM Corp., 2016). For temporal stability, correlations exceeding .70 have been suggested as acceptable for group comparisons (Nunnally & Bernstein, 1994), whereas Cohen’s criteria (Cohen, 1988) were used to assess the magnitude of the relationships exhibited between different variables. In this sense, correlations above .50 were considered high, whilst correlations between .30 and .49 were considered moderate, and correlations between .10 and .29 were considered low.
Reliability was assessed in line with multiple indicators. Given the multidimensional nature of the instrument, Ordinal Cronbach’s alpha and Ordinal McDonald’s omega values were produced (Revelle, 2016). Values between .80 and .90 are considered acceptable for both of these indices (Salvia et al., 2010). In order to examine convergent validity, Pearson correlation analysis was conducted to reveal associations between overall and individual subscale PSRS scores and overall and individual subscale SORS scores. Finally, discriminant validity was examined according to Pearson correlations between overall and individual subscale PSRS scores and OCI-R subscale scores.
2.6. Ethical Cosiderations
The present study was approved by the Ethics Committee (reference number: UA-2019-10-04, approval date: March 27, 2020). Adult participants provided written informed consent, whilst consent for the participation of minors was provided by their parents or legal guardians in accordance with the Declaration of Helsinki.
3. Results
3.1. Characteristics of the Sample
The Table 1 presents participant’s sociodemographic characteristics.
3.2. Inter-Item Correlations
Outcomes pertaining to the correlation matrix revealed that no items produced correlations above .85, with the greatest correlation between two items (48 and 49) being .65.
3.3. Exploratory Factor Analysis
Exploratory factor analysis was performed employing principal axis factoring and oblimin rotation, extracting factors with eigenvalues greater than one. Scale dimensionality was examined, firstly, in accordance with a three-factor model and, secondly, in accordance with a model composed of 11 factors. The latter model produced better outcomes results with Bartlett sphericity outcomes of χ2 (1225) = 17263.90(p< .001), KMO of .925 and less than 1% redundant residue.
3.4. Confirmatory Factor Analysis
Goodness of fit indices indicated that three different correlated models comprising, i) three first-order factors, ii) three factors and iii) eleven first-order factors grouped into two second-order correlated factors modeled as indicators of a broad third-order sensory reactivity scale, fitted the data acceptably. CFI, TLI and GFI values were all equal to or greater than .90, whilst RMSEA values were less than .05 (see Table 2a).

Table 2a.
Results of confirmatory factor analysis of the PSRS of total sample.
| Models | χ2 | df | RMSEA (CI 95%) | CFI | TLI | GFI |
| 3 correlated factors | 4507.28 | 1172 | .05 (.05 - .05) | .96 | .96 | .97 |
| 11 factors | 2786.15 | 1120 | .04 (.04 - .04) | .98 | .98 | .98 |
| 11 + 2 factors* | 3074.37 | 1162 | .04 (.04 - .04) | .98 | .98 | .98 |
| Men - Women 11 + 2 factors* |
3803.56 | 2134 | .04 (.04 - .04) | .98 | .98 | .97 |
| Adolescents - Adults 11 + 2 factors* |
4064.73 | 2228 | .04 (.04 - .04) | .98 | .98 | .97 |
Notes. *Eleven first-order factors grouped under two second-order factors.
Statistically significant differences emerged between the model comprising three correlated factors and the model comprising 11 first-order factors grouped into two second-order correlated factors (Δχ2 = 1294.11; Δdf = 3; p =<.001), with the second model exhibiting higher CFI values). The results obtained using the split samples show similar results, which indicates stability of the fitted model (see Table 2b).
Table 2b.
Results of confirmatory factor analysis of the PSRS with split samples.
| Models | χ2 | df | RMSEA (CI 95%) | CFI | TLI | GFI |
| 3 correlated factors (s1) | 3555.00 | 1124 | .05 (.05 - .05) | .96 | .96 | .96 |
| 11 factors (s1) | 2549.67 | 1072 | .04 (.04 - .04) | .98 | .98 | .98 |
| 11 + 2 factors* (s1) | 2620.08 | 1114 | .04 (.04 - .04) | .98 | .98 | .98 |
| 3 correlated factors (s2) | 2339.73 | 1124 | .05 (.05 - .06) | .96 | .95 | .96 |
| 11 factors (s2) | 1847.48 | 1072 | .04 (.04 - .04) | .98 | .98 | .98 |
| 11 + 2 factors* (s2) | 1943.31 | 1114 | .04 (.04 - .04) | .98 | .98 | .98 |
Notes. s1 = split sample 1; s2 = split sample 2.
All items fit well with each factor, with the exception of item 17 pertaining to olfactory sensory hyporeactivity (factor 3). In addition, factorial invariance as a function of sex and age was examined (item 17 removed), with outcomes revealing that all examined models equally fit the gathered data (see Table 3).
3.5. Inter-Scale Correlations
As shown in Table 4, all PSRS subscale scores were moderately to highly correlated with overall PSRS scores. Correlations between the different examined scales were of low to moderate strength.
3.6. Reliability Measures
Reliability (Ordinal Cronbach’s alpha and Ordinal McDonald’s omega) outcomes pertaining to the PSRS are presented in Table 5. As can be observed, the majority of reliability indices corresponding to the overall PSRS and its individual subscales indicate high reliability. Weakest outcomes were produced in relation to the visual hyperreactivity scale than for the other subscales.
With regards to test-retest reliability, correlations for all scales were statistically significant (p < .01). When examining the overall PSRS, a strong four-week test-retest correlation (r = .86) was produced. Furthermore, high strength coefficients were produced for all PSRS subscales, with the only exception being the visual hyperreactivity scale (r=.52) which produced a weaker correlation than all other subscales.
As presented in Table 6, correlations between the PSRS hyperreactivity scale and measures selected to examine its convergent validity (e.g., SOR-touch, SOR-smell, SOR-sight, SOR-taste and SOR-hoarding) were of greater strength than those produced with measures selected to examine its discriminant validity (e.g. OCI-R), with correlations pertaining to the former ranging from .60 to .69, compared with .28 (PSRS-hyper-taste and OCI-R-checking) to .48 (PSRS-hyper-tactile and OCI-R-ordering and OCI-R-obsessing) for the latter. In contrast, correlations between the sensory hyporeactivity subscale and all OCI-R subscales were between .22 (OCI-R-hypo-taste and OCI-R-washing) and .38 (OCI-R-hypo-auditory and OCI-R-hoarding). The PSRS pain subscale examined was only weakly correlated with the SORS and OCI-R, with the weakest correlation being produced with regards to the OCI-R. In most cases, correlations indicating convergent validity of the overall PSRS were statistically stronger than those indicating its discriminant validity, though evidence generally supports the convergent and discriminant validity of the PSRS overall. Furthermore, correlations produced between PSRS subscales and scales selected to examine convergent validity (e.g., SOR-touch, SOR-smell, SOR-sight, SOR-taste and SOR-hearing) were higher with regards to sensory hyperreactivity items, ranging from .50 to .66, than with regards to sensory hyporeactivity items, ranging from .23 to .34.
3.7. Invariance as a Function of Sex
In order to determine factorial invariance as a function of sex, configural (M1), metric (M2), strong (M3) and strict invariance (M4) were estimated for the 11-factor model (Byrne, 2008). Firstly, examination of the same PSRS structure applied to both sexes (M1) produced good outcomes (RMSEA = .037 [90% CI = .035 - .039]; CFI = .980). Outcomes reveal that the model adequately fit the data in both groups. Secondly, taking M1 as a reference, M2 was tested employing a model in which factor loadings were fixed within both groups. Outcomes demonstrated that M2 also provides a good fit to obtained data (RMSEA = 0.044 [90% CI = .042 - .046]; CFI = .973). When comparing model fit between M2 and M1, no significant differences were observed (ΔCFI = 0.007; ΔRMSEA = 0.007). These findings suggest that the factor loadings are invariant between groups defined according to sex. Thirdly, M3 was examined, in which factor loadings and intercepts were defined to be equal in both groups. Outcomes indicated that M3 was also a good fit to obtained data (RMSEA = .041 [90% CI = .039 - .043]; CFI = .975). When comparing model fit of M2 and M3, no significant differences were evident (ΔCFI = 0.002; ΔRMSEA = 0.003). Thus, the hypothesis that model intercepts are invariant to sex is accepted. Finally, M4 was analyzed, in which factor loadings, intercepts and residuals were fixed and held the same in both groups. Again, adequate outcomes were produced (RMSEA = .041 [90% CI = .039 - .043]; CFI = 0.975). When compared with M3, the extent to which fit indices changed between models (ΔCFI = 0.000; ΔRMSEA = 0.000) provides further empirical support of strict invariance. Taken together, these outcomes indicate measurement invariance of the PSRS as a function of sex with its factor structure being maintained in both males and females.
3.8. Invariance as a Function of Age
In order to determine factorial invariance as a function of age (adolescents versus adults), configural (M1), metric (M2), strong (M3) and strict invariance (M4) were estimated for the 11-factor model (Byrne, 2008). Firstly, the factor structure of the PSRS was examined between both age groups (M1), producing a good outcome (RMSEA = .042 [90% CI = .040 - .044]; CFI = .975). Outcomes demonstrate that the model presented an adequate fit to the data in both groups. Secondly, taking M1 as a reference, M2 was examined, in which factor loadings were fixed and held constant in both groups. Outcomes revealed that M2 was a good fit to the data (RMSEA = 0.047 [90% CI = .046 - .049]; CFI = .970). When comparing M2 with M1, no significant changes in model fit were observed (ΔCFI = 0.005; ΔRMSEA = 0.005). These findings suggest that factor loadings are invariant between groups. Thirdly, M3 was evaluated, in which factor loadings and intercepts were held the same in both groups. Outcomes indicated that M3 showed adequate fit indices (RMSEA = .044 [90% CI = .043 - .046]; CFI = .971). When comparing M2 with M3, no significant changes were evident (ΔCFI = 0.001; ΔRMSEA = 0.003) and so the hypothesis that model intercepts are invariant between age groups is accepted. Finally, M4 was analyzed with factor loadings, intercepts and residuals being held constant in both groups. Again, adequate fit indices were produced (RMSEA = .044 [90% CI = .043 - .046]; CFI = 0.971). When comparing fit indices for M3 and M4, the extent of change (ΔCFI = 0.000; ΔRMSEA = 0.000) provides empirical support of strict invariance. Taken together, all outcomes indicate factorial invariance of the PSRS, with its factor structure being maintained in the two different examined age groups
3.9. Descriptive Statistics of the PSRS: Latent Mean Differences
In order to estimate differences between group as a function of both sex and age, males and adolescents, respectively, were established reference groups (means fixed at zero). Critical ratios (CR) were calculated to estimate whether differences as a function of sex and age were statistically different from zero. Critical ratios larger than 1.96 indicate that the mean value recorded for the comparison group is greater than that in the reference group.
Supplementary Table S1 presents differences in PSRS scores according to gender. Outcomes reveal higher levels of visual (CR = - 4.18), taste (CR = -4.05), auditory (CR = -5.55) and overall sensory hyporeactivity (CR= -4.10) in men than in women, with the magnitude of differences being small (d between .19 and .34). However, women reported higher values of tactile (CR = 2.70), olfactory (CR = 2.35) and overall sensory hyperreactivity (CR = 2.03) and pain (CR = 6.50), with the magnitude of differences being small (d between .11 and .17).
Supplementary Table S1.
Differences in the PSRS according to the gender.
| Male | Female | |||||||
| PSRS | M | (SD) | M | (SD) | t | p | d | |
| Pain | 5.03 | (3.31) | 6.38 | (3.42) | -5.858 | .000** | -.40 | |
| Total Sensory hyporeactivity | 14.49 | (8.64) | 12.80 | (9.00) | 2.792 | .002** | .19 | |
| Hypo-Tactile | 4.43 | (2.84) | 4.33 | (3.12) | .487 | .313 | ||
| Hypo-Olfactory | 2.85 | (2.04) | 2.94 | (2.20) | -5.577 | .282 | ||
| Hypo-Visual | 2.29 | (2.02) | 1.86 | (2.07) | 3.095 | .001** | .21 | |
| Hypo-Taste | 2.16 | (2.01) | 1.61 | (1.80) | 4.347 | .000** | .29 | |
| Hypo-Auditory | 2.76 | (2.06) | 2.07 | (2.04) | 4.980 | .000** | .34 | |
| Total Sensory hyperreactivity | 11.38 | (7.84) | 12.46 | (9.22) | -1.785 | .027* | -.13 | |
| Hyper-Tactile | 2.66 | (2.34) | 3.09 | (2.69) | -2.448 | .007** | -.17 | |
| Hyper-Olfactory | 2.55 | (2.05) | 2.93 | (2.48) | -2.387 | .008** | -.17 | |
| Hyper-Visual | 1.38 | (1.60) | 1.27 | (1.63) | 1.048 | .147 | ||
| Hyper-Taste | 1.68 | (1.81) | 1.91 | (2.31) | -1.544 | .042* | -.11 | |
| Hyper- Auditory | 3.11 | (2.32) | 3.25 | (2.55) | -.857 | .195 | ||
| Total PSRS | 30.90 | (16.27) | 31.64 | (18.12) | -.614 | .269 | ||
Note. PSRS = Pain and Sensitivity Reactivity Scale; M= Mean; SD= Standard Deviation; Hypo= sensory hyporeactivity; Hyper= sensory hyperreactivity; * p < .05; ** p <.01.
With regards to differences in PSRS scores as a function of age, outcomes reveal statistically significant differences in sensory hyporeactivity and hyperreactivity, with both being greater in late adolescents than in adults (see Supplementary Table S2). Specifically, adolescents reported higher scores of overall hyperreactivity (CR = -2.16), and tactile (CR = -2.83), olfactory (CR = -2.19) and taste (CR = - 2.55) hyperreactivity. Furthermore, adolescents reported higher overall hyporeactivity scores (CR = -4.10), alongside higher tactile (CR = -10.48) and auditory (CR = -3.89) hyporeactivity. The magnitude of differences was small for the majority of sensory dimensions (d between .11 and .26). Analysis failed to identify differences between adolescents and adults with regards to pain (CR = -0.33).
Supplementary Table S2.
Differences in the PSRS according to the age.
| Lateadolescents | Adults | |||||||
| PSRS | M | (SD) | M | (SD) | t | p | d | |
| Pain | 5.92 | (83.33) | 5.98 | (3.44) | -.294 | .384 | ||
| Total Sensory hyporeactivity | 13.65 | (8.68) | 12.08 | (8.11) | 3.102 | .001** | .19 | |
| Hypo-Tactile | 4.67 | (3.03) | 3.91 | (2.86) | 4.288 | .000** | .26 | |
| Hypo-Olfactory | 2.98 | (2.15) | 2.71 | (2.04) | 2.128 | .017* | .13 | |
| Hypo-Visual | 1.96 | (1.94) | 1.85 | (2.01) | .948 | .171 | ||
| Hypo-Taste | 1.67 | (1.72) | 1.64 | (1.70) | .334 | .369 | ||
| Hypo-Auditory | 2.38 | (2.04) | 1.97 | (1.83) | 3.485 | .000** | .21 | |
| Total Sensory hyperreactivity | 12.35 | (8.25) | 11.39 | (8.53) | 1.893 | .030* | .11 | |
| Hyper-Tactile | 3.08 | (2.48) | 2.70 | (2.42) | 2.569 | .005** | .16 | |
| Hyper-Olfactory | 2.91 | (2.33) | 2.61 | (2.22) | 2.23 | .013* | .13 | |
| Hyper-Visual | 1.26 | (1.47) | 1.25 | (1.53) | .168 | .433 | ||
| Hyper-Taste | 2.00 | (2.14) | 1.62 | (2.09) | 2.914 | .002** | .18 | |
| Hyper-Auditory | 3.10 | (2.31) | 3.21 | (2.54) | -.690 | .245 | ||
| Total PSRS | 31.95 | (17.09) | 29.45 | (16.25) | 2.482 | .006** | .15 | |
Note. PSRS = Pain and Sensitivity Reactivity Scale; M= Mean; SD= Standard Deviation; Hypo= sensory hyporeactivity; Hyper= sensory hyperreactivity; * p < .05; ** p <.01.
4. Discussion
Previous research has highlighted the links between sensory reactivity and restrictive and repetitive behaviors, such as those underlying symptoms of OCD and ASD (e.g. Ben-Sasson et al., 2019; Crow et al., 2020). Similarly, a lack of studies on sensory reactivity in non-clinical populations has been reported (Moreno-Amador, et al., 2023).
The development of self-report instruments on sensory reactivity is necessary to be able to analyze sensory profiles in the general population and, subsequently, assess sensory profiles in clinical samples. Recently, a self-report instrument (SORS) with strong psychometric properties has been developed to evaluate sensory over-responsivity (Moreno-Amador et al., 2023). However, most sensory response instruments do not consider pain together with sensory hyporeactivity, despite the combination of both factors being strongly related with neurodevelopmental disorders (Martínez-González, & Andreo-Martínez, 2019; 2020). This highlights the importance of monitoring both parameters in the general population.
The present study analyzed the psychometric properties of the PSRS in a non-clinical sample of Spanish adolescents and adults. It confirmed that the PSRS is made up of three robust and independent factors. All items presented adequate fit to their respective factors, with the exception of item 17, "I have a hard time perceiving unpleasant odors or bad smells", which exhibited poor fit. In this sense, poor fit of this item may be due to the way in which the item was written. This being said, similar items were also written with the same grammatical structure and presented good fit (e.g. item 29). Excellent internal consistency of the PSRS was also found (ω=.94), which is in line with that reported in a previous study (Martínez-González et al., 2024a). In addition, test-retest reliability was good (.86), similar to that reported in a previously conducted study with an ASD population (Martínez-González et al., 2024a). In terms of measurement invariance, the factor structure of the PSRS was robust to variations in age and sex.
The initially proposed hypothesis is confirmed in relation to convergent and discriminant validity. Significant correlations, ranging from moderate to strong, were observed between the sensory hyper-reactivity subscale of the PSRS and the SORS (r= .60 and .51). Additionally, similar positive correlations were found between overall hyper-reactivity subscales PSRS scores and all individual subscales of the OCI-R. In this sense, these findings coincide with those reported in previous studies which have reported the existence of a relationship between sensory hyperreactivity and OCD symptoms (e.g. Ben-Sasson & Podoly, 2017; Moreno-Amador et al., 2023). On the other hand, weaker correlations are observed between the overall sensory hyporeactivity PSRS subscale and the SORS. Furthermore, even weaker correlations were found between the PSRS sensory hyporeactivity subscale and all individual OCI-R subscales. These findings seem to indicate that sensory hyporeactivity is independent of repetitive and compulsive behaviors. With regards to pain, the present study indicates a weak relationship between pain and the sensory hyperreactivity and hyporeactivity subscales of the PSRS. This finding suggests that pain is independent of SOR and SUR. Few studies have been conducted to examine these aforementioned relationships in non-clinical populations. However, associations were found between anxiety, SOR and chronic abdominal pain in relation to ASD, with SOR being a significant predictor of pain onset (Mazurek et al., 2014). These findings indicate that SOR and pain could be interrelated yet independent phenomena with common underlying mechanisms (Mazurek et al., 2013; 2014). In relation to differences in pain scores according to sex, findings indicate that females are more sensitive to pain than males. This finding does not coincide with outcomes reported in previous studies (Fillingim et al., 2009; Racine et al., 2012) and may be due to differences in the sample size of males and females. In contrast, no differences in pain were observed according to age. Thus, no clear developmental pattern for pain is evidenced. These findings are consistent with those reported in a recent study examining the relationship between measures used to assess SOR and OCD symptoms in a non-clinical population (Moreno-Amador et al., 2023). Present findings, therefore, are consistent with the transdiagnostic impact of SOR (Isaacs et al., 2022). Additionally, the validation analysis conducted in the present study included sensory hyporesponsiveness and pain variables. Thus, the PSRS responds to calls from the research community to include pain and hyposensitivity variables in analyses of sensory reactivity in clinical and non-clinical populations (Aykan et al., 2020; Moreno-Amador et al., 2023).
In relation to sex differences in sensory reactivity, present findings reveal significantly higher pain and sensory hyperreactivity scores in females than in males. These findings support those reported in another study conducted with a non-clinical population (Aykan et al., 2020). In a study conducted by Aykan, pain was considered to be a subdomain of the somatosensorial subscale as opposed to be considering a factor in itself. Similarly, present findings suggest that no sex differences exist regarding auditory sensory hyperreactivity. This is consistent with findings reported by Aykan et al. (2020). In the same way, a novel contribution of the present work is the emergence of significantly higher levels of sensory hyporeactivity in males than in females. This suggests that a biological sensory pattern or cultural factor may be at play that demands further examination. However, gender differences identified in the present study may be explained by sample size, with substantially more females being recruited than males.
Sensory reactivity has not been examined in relation to different life stages. Some studies have found that between 5–21% of school-age children may have clinical sensory hyperreactivity (Ben-Sasson et al., 2010; Carter et al., 2011). To the best of our knowledge, the present study is the first to compare sensory reactivity between adolescence and adulthood, revealing that adolescents have higher levels of sensory hyperreactivity (tactile, olfactory and gustatory) and sensory hyporeactivity (tactile and auditory) than adults. These findings may indicate that developmental patterns exist that underly sensory reactivity in humans, with development rapidly and clearly advancing over the course of the life cycle before leveling off close to adulthood.
Ultimately, present findings demonstrate that the PSRS has three well-defined first-order factors, with this model showing acceptable fit to gathered data. Thus, a novel aspect of this new instrument is that the PSRS considers pain as an independent factor, alongside two factors describing sensory reactivity (sensory hyporeactivity and sensory hyperreactivity), which are closely related to restricted behavior, selective diet and gastro-intestinal symptoms in autism and other disorders (Andreo-Martínez et al., 2018; 2020; 2021; Martínez-González, & Andreo-Martínez, 2019; 2020). This may represent a small step towards the development of instruments that indirectly measure the relationship between behavior, anxiety and gastro-intestinal symptoms (e.g., abdominal pain, constipation and diarrhea) and variables associated with the so-called gut microbiota-brain axis in humans. However, the present study is not exempt from certain limitations. The first concerns the reliability of data gathered using self-report measures, which is hampered by social desirability. However, self-report measures may better capture sensory reactivity (Schulz, & Stevenson, 2020). Secondly, the cross-sectional nature of the study makes it impossible to make causal inferences. The third limitation is the unequal sex distribution of the sample.
5. Conclusions
The validation of the Pain and Sensitivity Reactivity Scale (PSRS) in neurotypical late adolescents could significantly transform practices in health, education, and psychological assessment. In the health sector, this would allow professionals to personalize treatments based on each individual’s pain sensitivity, thereby improving the effectiveness of interventions for conditions such as chronic pain, anxiety, or depression. It would also facilitate earlier detection of mental health issues linked to pain sensitivity, promote preventive interventions, and enhance overall well-being. In the educational context, the PSRS could be used by school counselors to identify students with high pain sensitivity, enabling the implementation of specific strategies, such as stress management programs, contributing to a more inclusive learning environment that addresses individual needs. In psychological assessment, the integration of the PSRS would provide an additional tool for understanding the impact of pain on adolescents' emotional and behavioral lives, improving diagnostic accuracy, and the planning of therapeutic interventions. Overall, validation of the PSRS would enrich practices in these fields, fostering a more holistic and personalized approach to the care and development of adolescents.
6. Patents
Supplementary Materials
The following supporting information can be downloaded at the website of this paper posted on Preprints.org, Table S1. Differences in the PSRS according to the gender; Table S2: Differences in the PSRS according to the age.
Author Contributions
Conceptualization, A.E.M.G; methodology, A.W.; software, A.E.M.G., J.A.P., and B.M.A.; validation, A.W., and A.V.; formal analysis, A.W., and A.V.; investigation, A.E.M.G., L.I.C., J.A.P., S. H. B., T. R.J., P.A.M., and B.M.A.; resources, A.E.M.G. L.I.C., J.A.P., S. H. B., T. R.J., P.A.M., and B.M.A.; data curation, A.E.M.G., L.I.C., J.A.P., S. H. B., T. R.J., B. M.A., and A.V.; writing—original draft preparation, A.E.M.G. A.W.; writing—review and editing, A.E.M.G., L.I.C. and A.W ; visualization, A.E.M.G; supervision, A.E.M.G; project administration, A.E.M.G; funding acquisition, A.E.M.G All authors have read and agreed to the published version of the manuscript.
Funding
This research was funded by University of Alicante, grant number 5546.
Institutional Review Board Statement
The study was conducted in accordance with the Declaration of Helsinki, and approved by the Institutional Review Board (or Ethics Committee) of Ethics Committee of the University of Alicante in Spain (reference number: UA-2019-10-04).
Informed Consent Statement
“Informed consent was obtained from all subjects involved in the study.”.
Data Availability Statement
The raw data supporting the conclusions of this article will be made available by the authors on request. The data is not publicly available due to privacy concerns.
Conflicts of Interest
The authors declare no conflict of interest.
References
- Aiken, L. R. Content validity and reliability of single items or questionnaires. Educational and psychological measurement 1980, 40(4), 955–959. [Google Scholar] [CrossRef]
- Alarcón, R.; Blanca, M. J. Development and psychometric properties of the questionnaire for assessing educational podcasts (QAEP). Frontiers in Psychology 2020, 11, 579454. [Google Scholar] [CrossRef]
- American Psychiatric Association. Diagnostic and Statistical Manual of Mental Disorders, 5th.Ed. ed; American Psychiatric Publishing; Washington, DC, 2013. [Google Scholar]
- Andreo-Martínez, P.; García-Martínez, N.; Sánchez-Samper, E. P.; Quesada-Medina, J.; MacFabe, D. Metabolites of the gut microbiota involved in the autism spectrum disorder. Revista Discapacidad, Clínica y Neurociencia 2018, 5(2), 39–48. [Google Scholar] [CrossRef]
- Andreo-Martínez, P.; García-Martínez, N.; Sánchez-Samper, E. P.; Martínez-González, A. E. An approach to gut microbiota profile in children with autism spectrum disorder. Environmental microbiology reports 2020, 12(2), 115–135. [Google Scholar] [CrossRef] [PubMed]
- Andreo-Martínez, P.; Rubio, M.; Veas, A.; Sánchez-Meca, J.; Martínez-González, A.E. A meta-analysis on the gut microbiota in children with autism. In press. In Journal of autism and developmental disorders; 2021. [Google Scholar] [CrossRef]
- Aykan, S.; Vatansever, G.; Doğanay-Erdoğan, B.; Kalaycıoğlu, C. Development of sensory sensitivity scales (SeSS): reliability and validity analyses. Research in developmental disabilities 2020, 100, 103612. [Google Scholar] [CrossRef] [PubMed]
- Baranek, G.T. Sensory experiences questionnaire version 3.0; Unpublished manuscript, 2009. [Google Scholar]
- Ben-Sasson, A.; Podoly, T. Y. Sensory over responsivity and obsessive compulsive symptoms: A cluster analysis. Comprehensive Psychiatry 2017, 73, 151–159. [Google Scholar] [CrossRef] [PubMed]
- Ben-Sasson, A.; Carter, A. S.; Briggs-Gowan, M. J. The development of sensory over-responsivity from infancy to elementary school. Journal of Abnormal Child Psychology 2010, 38(8), 1193–1202. [Google Scholar] [CrossRef]
- Ben-Sasson, A.; Gal, E.; Fluss, R.; Katz-Zetler, N.; Cermak, S. A. Update of a meta-analysis of sensory symptoms in ASD: A new decade of research. Journal of Autism and Developmental Disorders 2019, 49(12), 4974–4996. [Google Scholar] [CrossRef]
- Carter, A. S.; Ben-Sasson, A.; Briggs-Gowan, M. J. Sensory over-responsivity, psychopathology, and family impairment in school-aged children. Journal of the American Academy of Child & Adolescent Psychiatry 2011, 50(12), 1210–1219. [Google Scholar] [CrossRef]
- Chauhan, A.; Sahu, J. K.; Jaiswal, N.; Kumar, K.; Agarwal, A.; Kaur, J.; Singh, S.; Singh, M. Prevalence of autism spectrum disorder in Indian children: A systematic review and meta-analysis. Neurology India 2019, 67(1), 100. [Google Scholar] [CrossRef]
- Cohen, J. Statistical power analysis for the behavioral science, 2nd ed.; Lawrence Erlbaum Associates; Hillsdale, NJ, 1988. [Google Scholar]
- Conelea, C. A.; Carter, A. C.; Freeman, J. B. Sensory over-responsivity in a sample of children seeking treatment for anxiety. Journal of Developmental and Behavioral Pediatrics 2014, 35(8), 510. [Google Scholar] [CrossRef] [PubMed]
- Crow, A. J.; Janssen, J. M.; Vickers, K. L.; Parish-Morris, J.; Moberg, P. J.; Roalf, D. R. Olfactory Dysfunction in Neurodevelopmental Disorders: A Meta-analytic Review of Autism Spectrum Disorders, Attention Deficit/Hyperactivity Disorder and Obsessive–Compulsive Disorder. Journal of autism and developmental disorders 2020, 1–13. [Google Scholar] [CrossRef]
- Cummings, K. K.; Lawrence, K. E.; Hernandez, L. M.; Wood, E. T.; Bookheimer, S. Y.; Dapretto, M.; Green, S. A. Sex differences in salience network connectivity and its relationship to sensory over-responsivity in youth with autism spectrum disorder. Autism Research 2020, 13(9), 1489–1500. [Google Scholar] [CrossRef]
- Dufton, L. M.; Dunn, M. J.; Slosky, L. S.; Compas, B. E. Self-reported and laboratory-based responses to stress in children with recurrent pain and anxiety. Journal of pediatric psychology 2010, 36(1), 95–105. [Google Scholar] [CrossRef] [PubMed]
- Dunn, J. G.; Bouffard, M.; Rogers, W. T. Assessing item content-relevance in sport psychology scale-construction research: Issues and recommendations. Measurement in Physical Education and Exercise Science 1999, 3(1), 15–36. [Google Scholar] [CrossRef]
- Dunn, W. Short Sensory Profile 2. Pearson Clinical Assessment, 2014.
- Eccleston, C.; Crombez, G.; Scotford, A.; Clinch, J.; Connell, H. Adolescent chronic pain: Patterns and predictors of emotional distress in adolescents with chronic pain and their parents. Pain 2003, 99(1-2), 201–209. [Google Scholar] [CrossRef]
- Falkenstein, M. J.; Conelea, C. A.; Garner, L. E.; Haaga, D. A. Sensory over-responsivity in trichotillomania (hair-pulling disorder). Psychiatry research 2018, 260, 207–218. [Google Scholar] [CrossRef]
- Ferrão, Y. A.; Shavitt, R. G.; Prado, H.; Fontenelle, L. F.; Malavazzi, D. M.; de Mathis, M. A.; Hounie, A.G.; Miguel, E.C.; do Rosário, M. C. Sensory phenomena associated with repetitive behaviors in obsessive-compulsive disorder: an exploratory study of 1001 patients. Psychiatry research 2012, 197(3), 253–258. [Google Scholar] [CrossRef]
- Fillingim, R. B.; King, C. D.; Ribeiro-Dasilva, M. C.; Rahim-Williams, B.; Riley, J. L. Sex, gender, and pain: A review of recent clinical and experimental findings. Journal of Pain 2009, 10(5), 447–485. [Google Scholar] [CrossRef]
- Foa, E. B.; Huppert, J. D.; Leiberg, S.; Langner, R.; Kichic, R.; Hajcak, G.; Salkovskis, P. M. The Obsessive-Compulsive Inventory: development and validation of a short version. Psychological assessment 2002, 14(4), 485. [Google Scholar] [CrossRef]
- Glod, M.; Riby, D. M.; Rodgers, J. Relationships between sensory processing, repetitive behaviors, anxiety, and intolerance of uncertainty in autism spectrum disorder and Williams syndrome. Autism research 2019, 12(5), 759–765. [Google Scholar] [CrossRef] [PubMed]
- Hon, K.; Siu, B. W.; Cheng, C. W.; Wong, W. C.; Foa, E. B. Validation of the Chinese version of obsessive-compulsive inventory-revised. East Asian Archives of Psychiatry 2019, 29(4), 103–111. [Google Scholar] [CrossRef] [PubMed]
- Isaacs, D.; Key, A. P.; Cascio, C. J.; Conley, A. C.; Riordan, H.; Walker, H. C.; Claassen, D. O. Cross-disorder comparison of sensory over-responsivity in chronic tic disorders and obsessive-compulsive disorder. Comprehensive psychiatry 2022, 113, 152291. [Google Scholar] [CrossRef] [PubMed]
- Joseph, J. E.; Liu, X.; Jiang, Y.; Lynam, D.; Kelly, T. H. Neural correlates of emotional reactivity in sensation seeking. Psychological science 2009, 20(2), 215–223. [Google Scholar] [CrossRef]
- Lewin, A. B.; Wu, M. S.; Murphy, T. K.; Storch, E.A. Sensory Over-Responsivity in Pediatric Obsessive Compulsive Disorder. Journal of Psychopathology and Behavioral Assessment 2015, 37, 134–143. [Google Scholar] [CrossRef]
- Maenner, M.J.; Shaw, K.A.; Baio, J.; Washington, A.; Patrick, M.; DiRienzo, M.; Christensen, D.L.; Wiggins, L., PhD; Pettygrove, S.; Andrews, J.G.; Lopez, M.; Hudson, A.; Baroud, T.; Schwenk, Y.; White, T.; Rosenberg, C.; Lee, L.; Harrington, R.A.; Huston, M.; Hewitt, A.; Esler, A.; Hall-Lande, J.; Poynter, J.N.; Hallas-Muchow; Constantino, J., MD; Fitzgerald, R.T.; Zahorodny, W.; Shenouda, J.; Daniels, J.L.; Warren, Z.; Vehorn, A.; Salinas, A.; Durkin, M.S.; Dietz, P.M. Prevalence of autism spectrum disorder among children aged 8 years—autism and developmental disabilities monitoring network, 11 sites, United States, 2016. MMWR Surveillance Summaries, 2020; pp. 1–12. [Google Scholar] [CrossRef]
- Martínez-González, A. E.; Andreo-Martínez, P. The Role of Gut Microbiota in Gastrointestinal Symptoms of Children with ASD. Medicina 2019, 55(8), 408. [Google Scholar] [CrossRef]
- Martínez-González, A. E.; Andreo-Martínez, P. Prebiotics, probiotics and fecal microbiota transplantation in autism: A systematic review. Revista de Psiquiatría y Salud Mental 2020, 13, 150–164. [Google Scholar] [CrossRef]
- Martínez-González, A. E.; Cervin, M.; Piqueras, J. A. Relationships Between Emotion Regulation, Social Communication and Repetitive Behaviors in Autism Spectrum Disorder. Journal of Autism and Developmental Disorders 2021a, 1–9. [Google Scholar] [CrossRef]
- Martínez-González, A. E.; Cervin, M.; Piqueras, J. A.; Infante-Cañete, L.; Pérez-Sánchez, S. Psychometric properties of the Pain Reactivity and Sensitivity Scale in a diverse sample of autistic people. Journal of autism and Developmental Disorders, 2024a.
- Martínez-González, A. E.; Moreno-Amador, B.; Piqueras, J. A. Differences in emotional state and autistic symptoms before and during confinement due to the COVID-19 pandemic. Research in Developmental Disabilities 2021b, 116, 104038. [Google Scholar] [CrossRef]
- Martínez-González, A. E.; Piqueras, J. A.; Marzo, J. C. Validación del inventario de obsesiones y compulsiones revisado (OCI-R) para su uso en población adolescente española. Anales de psicología 2011, 27(3), 763–773. [Google Scholar]
- Martínez-González, A.E.; Andreo-Martínez, P. Duncan, Lowell T., Ed.; Implications of Gut Microbiota and Gastrointestinal Symptoms in Autism. In Advances in Health and Disease; NOVA Science Publishers, Inc; EEUU, 2020; Vol. 29. pp. 16–21. Available online: https://novapublishers.com/shop/advances-in-health-and-disease-volume-29/Available from.
- Martínez-González, A. E.; Rodríguez-Jiménez, T.; Piqueras, J.A.; Infante-Cañete, L.; Hidalgo-Berutich, S.; Andreo-Martínez, P.; Ordóñez-Rubio, T.; Belmonte Lillo, V.M.; Cubi, M.M.; Navarro-Soria, I. Cross-disorder comparison of sensory reactivity, pain, gastro-intestinal symptoms and obsessive-compulsive symptoms in adolescents and young adults with autism and other neurodevelopmental disorders. International Journal of Developmental Disabilities 2024b. [Google Scholar] [CrossRef]
- Mazefsky, C. A.; Conner, C. M.; Breitenfeldt, K.; Leezenbaum, N.; Chen, Q.; Bylsma, L. M.; Pilkonis, P. Evidence base update for questionnaires of emotion regulation and reactivity for children and adolescents. Journal of Clinical Child & Adolescent Psychology 2021, 50(6), 683–707. [Google Scholar] [CrossRef]
- Mazurek, M. O.; Keefer, A.; Shui, A.; Vasa, R. A. One-year course and predictors of abdominal pain in children with autism spectrum disorders: The role of anxiety and sensory over-responsivity. Research in Autism Spectrum Disorders 2014, 8(11), 1508–1515. [Google Scholar] [CrossRef]
- Mazurek, M. O.; Vasa, R. A.; Kalb, L. G.; Kanne, S. M.; Rosenberg, D.; Keefer, A.; Murray, D.S.; Freedman, B.; Lowery, L. A. Anxiety, sensory over-responsivity, and gastrointestinal problems in children with autism spectrum disorders. Journal of abnormal child psychology 2013, 41(1), 165–176. [Google Scholar] [CrossRef]
- Miller, L. J.; Anzalone, M. E.; Lane, S. J.; Cermak, S. A.; Osten, E. T. Concept evolution in sensory integration: A proposed nosology for diagnosis. The American Journal of Occupational Therapy 2007, 61(2), 135. [Google Scholar] [CrossRef] [PubMed]
- Mokkink, L. B.; Prinsen, C. A.; Patrick, D. L.; Alonso, J.; Bouter, L. M.; De Vet, H. C.; Terwee, C. B. COSMIN Study Design checklist for Patient-reported outcome measurement instruments; Amsterdam, The Netherlands, 2019; Volume 2019, pp. 1–32. [Google Scholar]
- Montiel-Nava, C.; Peña, J. A. Epidemiological findings of pervasive developmental disorders in a Venezuelan study. Autism 2008, 12, 191–202. [Google Scholar] [CrossRef]
- Moreno-Amador, B.; Cervin, M.; Martínez-González, A. E.; Piqueras, J. A.; OCD-Spectrum Spain Research Group. Sensory overresponsivity and symptoms across the obsessive-compulsive spectrum: web-based longitudinal observational study. Journal of Medical Internet Research 2023, 25, e37847. [Google Scholar] [CrossRef] [PubMed]
- Moritz, S.; Fink, J.; Miegel, F.; Nitsche, K.; Kraft, V.; Tonn, P.; Jelinek, L. Obsessive–compulsive disorder is characterized by a lack of adaptive coping rather than an excess of maladaptive coping. Cognitive therapy and research 2018, 42(5), 650–660. [Google Scholar] [CrossRef]
- Moseley, R. L.; Hitchiner, R.; Kirkby, J. A. Self-reported sex differences in high-functioning adults with autism: a meta-analysis. Molecular autism 2018, 9(1), 1–12. [Google Scholar] [CrossRef]
- Myers, S. M.; Voigt, R. G.; Colligan, R. C.; Weaver, A. L.; Storlie, C. B.; Stoeckel, R. E.; Port, J. D.; Katusic, S. K. Autism spectrum disorder: Incidence and time trends in a population-based birth cohort over two decades. Journal of autism and developmental disorders 2019. [Google Scholar] [CrossRef]
- Newton, E.; Schosheim, A.; Patel, S.; Chitkara, D. K.; van Tilburg, M. A. The role of psychological factors in pediatric functional abdominal pain disorders. Neurogastroenterology & Motility 2019, 31(6), e13538. [Google Scholar] [CrossRef]
- Nunnally, J. C.; Bernstein, I. H. Psychometric theory (3eme Edition.); McGraw-Hill. New York, 1994. [Google Scholar]
- Palanca-Sánchez, I.; Puig Riera de Conías, M.; Elola Somoza, J.; Bernal Sobrino, J.; Paniagua Caparrós, J. Unidad de Tratamiento del Dolor. Estándares y recomendaciones de calidad y seguridad; Ministerio de Sanidad, Política Social e Igualdad; Madrid, 2011. [Google Scholar]
- Panagiotidi, M.; Overton, P. G.; Stafford, T. The relationship between ADHD traits and sensory sensitivity in the general population. Comprehensive psychiatry 2018, 80, 179–185. [Google Scholar] [CrossRef] [PubMed]
- Paula, C. S.; Ribeiro, S. H.; Fombonne, E.; Mercadante, M. T. Brief report: prevalence of the pervasive developmental disorder in Brazil: a pilot study. Journal of autism and developmental disorders 2011, 41(12), 1738–1742. [Google Scholar] [CrossRef] [PubMed]
- Piqueras Rodríguez, J. A.; Martínez González, A. E.; Hidalgo Montesinos, M. D.; Fullana Rivas, M. A.; Mataix Cols, D.; Rosa Alcázar, A. I. Psychometric properties of the Obsessive Compulsive Inventory-revised in a non-clinical sample of late adolescents. Behavioral Psychology/Psicologia Conductual 2009, 17(3), 561–672. [Google Scholar]
- Qiu, S.; Lu, Y.; Li, Y.; Shi, J.; Cui, H.; Gu, Y.; Li, Y.; Zhong, W.; Zhu, X.; Liu, Y.; Cheng, Y.; Liu, Y.; Qiao, Y.; Qiao, Y. Prevalence of autism spectrum disorder in Asia: A systematic review and meta-analysis. Psychiatry Research 2020, 284, 112679. [Google Scholar] [CrossRef]
- Racine, M.; Tousignant-Laflamme, Y.; Kloda, L. A.; Dion, D.; Dupuis, G.; Choinire, M. A systematic literature review of 10 years of research on sex/gender and pain perception-Part 2: Do biopsychosocial factors alter pain sensitivity differently in women and men? Pain 2012, 153(3), 619–635. [Google Scholar] [CrossRef]
- Raines, A. M.; Oglesby, M. E.; Allan, N. P.; Mathes, B. M.; Sutton, C. A.; Schmidt, N. B. Examining the role of sex differences in obsessive-compulsive symptom dimensions. Psychiatry research 2018, 259, 265–269. [Google Scholar] [CrossRef]
- Renna, M. E.; O'Toole, M. S.; Spaeth, P. E.; Lekander, M.; Mennin, D. S. The association between anxiety, traumatic stress, and obsessive–compulsive disorders and chronic inflammation: A systematic review and meta-analysis. Depression and anxiety 2018, 35(11), 1081–1094. [Google Scholar] [CrossRef]
- Revelle, W. How to: Use the psych package for factor analysis and data reduction; Northwestern University, Department of Psychology; Evanston, IL, 2016. [Google Scholar]
- Robertson, A. E.; Simmons, D. R. The relationship between sensory sensitivity and autistic traits in the general population. Journal of Autism and Developmental disorders 2013, 43(4), 775–784. [Google Scholar] [CrossRef]
- Russell, G.; Stapley, S.; Newlove-Delgado, T.; Salmon, A.; White, R.; Warren, F.; Warren, F.; Pearson, A.; Ford, T. Time trends in autism diagnosis over 20 years: a U.K. population-based cohort study. Journal of Child Psychology and Psychiatry 2021. [Google Scholar] [CrossRef]
- Russell, K. M.; Frost, K. M.; Ingersoll, B. The relationship between subtypes of repetitive behaviors and anxiety in children with autism spectrum disorder. Research in autism spectrum disorders 2019, 62, 48–54. [Google Scholar] [CrossRef]
- Salvia, J.; Ysseldyke, J. E.; Bolt, S. Assessment in special and inclusive education, 11th ed.; Wadsworth; Belmont, CA, 2010. [Google Scholar]
- Schoen, S. A.; Miller, L. J.; Green, K. E. Pilot study of the sensory over-responsivity scales: Assessment and inventory. American Journal of Occupational Therapy 2008, 62(4), 393–406. [Google Scholar] [CrossRef]
- Schulz, S. E.; Stevenson, R. A. Differentiating between sensory sensitivity and sensory reactivity in relation to restricted interests and repetitive behaviours. Autism 2020, 24(1), 121–134. [Google Scholar] [CrossRef] [PubMed]
- Taylor, S.; Conelea, C. A.; McKay, D.; Crowe, K. B.; Abramowitz, J. S. Sensory intolerance: latent structure and psychopathologic correlates. Comprehensive psychiatry 2014, 55(5), 1279–1284. [Google Scholar] [CrossRef] [PubMed]
- Terwee, C. B.; Prinsen, C.; Chiarotto, A.; De Vet, H.; Bouter, L. M.; Alonso, J.; Mokkink, L. B. COSMIN methodology for assessing the content validity of PROMs–user manual; VU University Medical Center; Amsterdam, 2018; pp. 1159–70. [Google Scholar]
- Thapar, N.; Benninga, M. A.; Crowell, M. D.; Di Lorenzo, C.; Mack, I.; Nurko, S.; Saps, M.; Shulman, R.J.; Szajewska, H.; van Tilburg, Miranda A.L.; Enck, P. Paediatric functional abdominal pain disorders. Nature reviews Disease primers 2020, 6(1), 1–23. [Google Scholar] [CrossRef]
- Tomcheck, S. D.; Dunn, W. Sensory processing in children with and without autism: A comparative study using the Short Sensory Profile. American Journal of Occupational Therapy 2007, 61(2), 190–200. [Google Scholar] [CrossRef]
- Van Hulle, C. A.; Esbensen, K.; Goldsmith, H. H. Co-occurrence of sensory over-responsivity with obsessive-compulsive symptoms in childhood and early adolescence. Journal of developmental and behavioral pediatrics: JDBP 2019, 40(5), 377. [Google Scholar] [CrossRef]
Figure 1.
PSRS theoretical model.
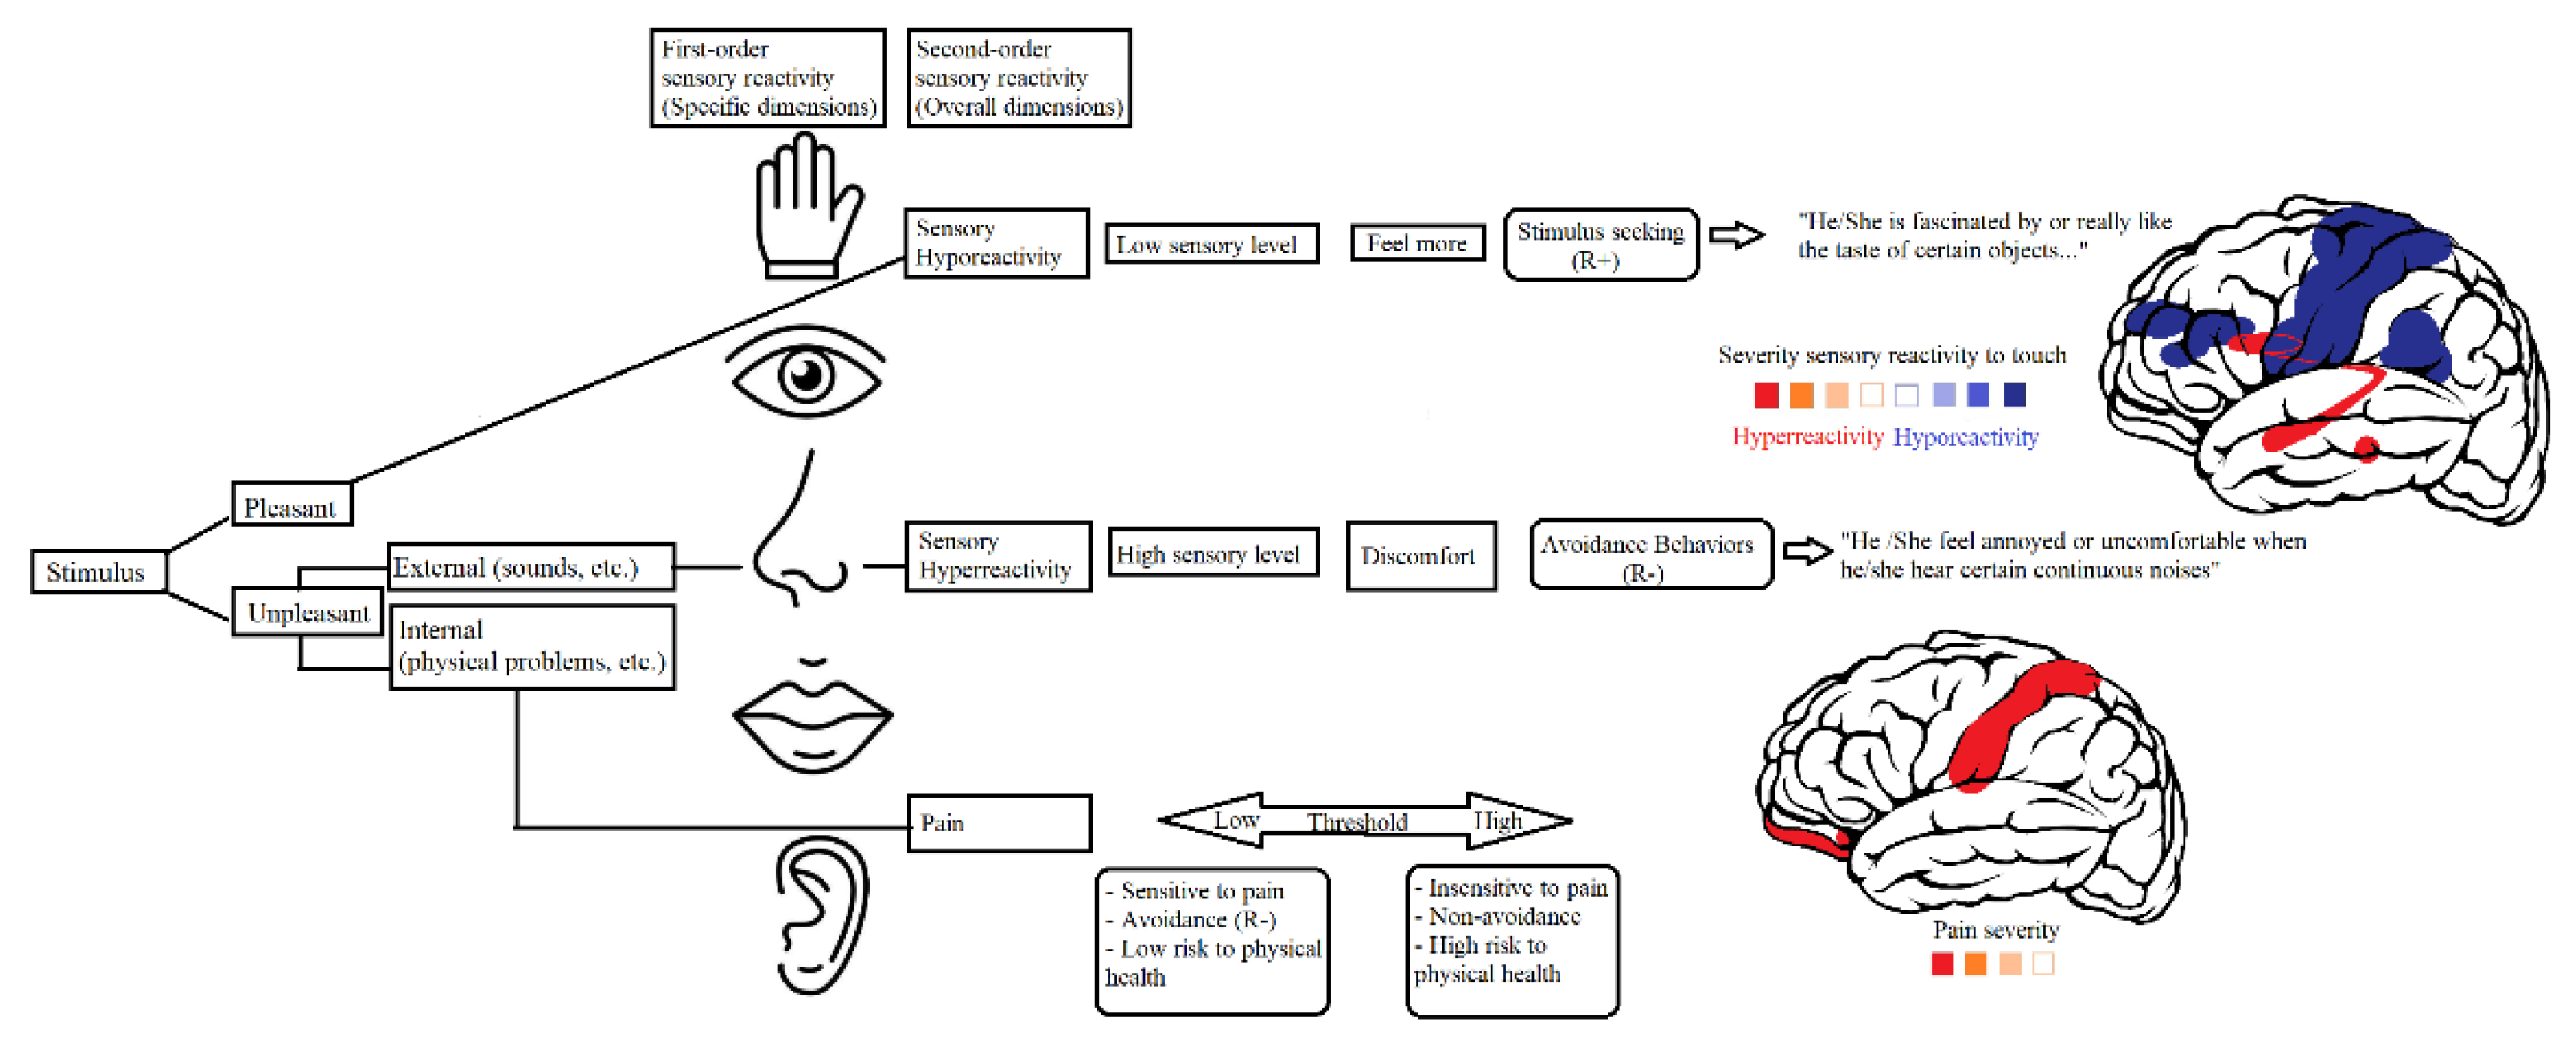
Table 1.
Sociodemographic characteristics of the total sample.
| Variables | n (%) |
| 16-19 years old | 539 (48%) |
| 20-68 years old | 583 (52%) |
| Total | 1122 (100%) |
| Gender | |
| Female | 818 (72.9%) |
| Male | 294 (26.2%) |
| Other | 10 (0.9%) |
| Country/region of birth | |
| Spain | 1079 (96.2%) |
| Rest of Europe | 17 (1.5%) |
| America | 20 (1.8%) |
| Africa | 5 (0.4%) |
| Asia | 1 (0.1%) |
Table 3.
Loadings of the confirmatory factor analysis for the eleven first-order-factor model grouped in two second order factors of the PSRS.
Table 3.
Loadings of the confirmatory factor analysis for the eleven first-order-factor model grouped in two second order factors of the PSRS.
| Item PSRS | Factor loading |
| Factor 1: Pain | .55 |
| 1. I feel pain or discomfort when I have stomach problems (eg constipation, diarrhea, etc.). [Me duele o siento molestias cuando tengo problemas estomacales (p.ej.: estreñimiento, diarrea, etc.)] | .55 |
| 2. It hurts or I feel discomfort when I have inflammation problems (eg: in the ear, throat, dental or mouth, etc.). [Me duele o siento molestias cuando tengo problemas de inflamación (p.ej.: en oído, garganta, dental o bucal, etc.)] | .74 |
| 3. It hurts or I feel discomfort when I have eye irritation, conjunctivitis, etc. [Me duele o siento molestias cuando tengo irritación de los ojos, conjuntivitis, etc.] | .67 |
| 4. I feel pain or discomfort when I have a fever. [Me duele o siento molestias cuando tengo fiebre.] | .82 |
| 5. It hurts or I feel discomfort when I have had a fracture or have gone to rehab. [Me duele o siento molestias cuando he tenido una fractura o he ido a rehabilitación.] | .59 |
| 6. It hurts or I feel discomfort when I am punctured for an analysis. [Me duele o siento molestias cuando me pinchan para una analítica.] | .48 |
| 7. It hurts or I feel discomfort when I have fallen or been hit. [Me duele o siento molestias cuando me he caído o dado un golpe.] | .69 |
| Factor 2: Hypo-Tactile | |
| 8. I prefer very hot or cold water (eg, taking cold showers, drinking hot tap water, hot soup, etc.). [Prefiero el agua muy caliente o fría (p.ej.: ducharse con agua fría; beber agua caliente del grifo, sopa caliente, etc.).] | .49 |
| 9. I scratch the wounds until they bleed again. [ Me rasco las heridas hasta que vuelven a sangrar.] | .50 |
| 10. I like to dress in tight clothes, socks and shoes. [Me gusta vestirse con ropa, calcetines y zapatos apretados.] | .54 |
| 11. I squeeze the pen or pencil a lot when writing. [Aprieto mucho el boli o el lápiz al escribir.] | .53 |
| 12. I like to touch things and people. [Me gusta tocar las cosas y las personas.] | .71 |
| 13. I hug people tightly. [Abrazo con fuerza a las personas.] | .65 |
| Factor 3: Hypo-Olfactory | |
| 14. Certain smells fascinate me. [ Me fascinan determinados olores.] | .85 |
| 15. I smell myself, people and objects. [ Me huelo a mí mismo, a las personas y a los objetos.] | .81 |
| 16. I prefer or like intense or strong scents. [Prefiero o me gustan los olores intensos o fuertes.] | .67 |
| 17. I have a hard time perceiving unpleasant odors or bad smells. [Me cuesta trabajo percibir los olores desagradables o malos olores.] | .12 |
| Factor 4: Hypo-Visual | |
| 18. I am fascinated by moving or rotating objects [Me fascinan los objetos en movimiento o que giran.] | .75 |
| 19. I prefer or like intense or bright colors. [Prefiero o me gustan los colores intensos o brillantes.] | .76 |
| 20. I am attracted to light and reflections [ Me atrae la luz y los reflejos.] | .75 |
| 21. I have trouble perceiving strong light in front of my eyes (eg flashlights, car lights, etc.). [Me cuesta trabajo percibir la luz fuerte ante sus ojos (p.ej.: la luz de una linterna, luces de coches, etc.).] | .45 |
| Factor 5: Hypo-Taste | |
| 22. I am fascinated by or really like the taste of certain objects or body parts (eg, sucking on my fingers, rubber objects, etc.). [Me fascina o me gusta mucho el sabor de ciertos objetos o partes del cuerpo (p.ej.: chupar mis dedos, objetos de goma, etc.).] | .84 |
| 23. I like food with strong flavors. [Me gusta la comida con sabores fuertes.] | .57 |
| 24. I like to suck or lick objects, food, etc. [Me gusta chupar o lamer objetos, comida, etc.] | .85 |
| 25. I don't feel full/satiated after eating a lot [ No me siento lleno/saciado después de comer mucho.] | .41 |
| Factor 6: Hypo-Auditory | |
| 26. I am attracted to certain sounds. [Me atraen ciertos sonidos.] | .74 |
| 27. I listen to television or music at a very high volume. [Escucho la televisión o la música a volumen muy alto.] | .59 |
| 28. I like to cause loud noises or sounds. [Me gusta provocar ruidos o sonidos fuertes.] | .66 |
| 29. I find it hard to hear what others say, etc. [Me cuesta trabajo escuchar lo que dicen los demás, etc.] | .51 |
| Factor 7: Hyper-Tactile | |
| 30. I feel discomfort or discomfort when touched [Siento molestia o incomodidad cuando me tocan.] | .64 |
| 31. I feel annoyance or discomfort when I notice skin imperfections (eg due to a skin wound, scabs or pimples, etc.). [Siento molestia o incomodidad cuando noto imperfecciones en la piel (p.ej.: por una herida en la piel, costras o granos, etc.).] | .65 |
| 32. I feel discomfort or discomfort when I touch certain textures (eg, certain clothing or food). [Siento molestia o incomodidad cuando toco ciertas texturas (p.ej.: ciertas prendas de vestir o alimentos).] | .67 |
| 33. I feel annoyance or discomfort when certain elements or objects that can touch my head or nails come into contact (eg: showering, getting water on your hair, having your hair or nails cut). [Siento molestia o incomodidad cuando entran en contacto ciertos elementos u objetos que pueden tocar mi cabeza o uñas (p.ej.: ducharse, que le caiga agua en el pelo, que le corten el pelo o las uñas).] | .64 |
| 34. I feel annoyed or uncomfortable when my favorite or usual clothes are not ready (eg: fussy about clothes, etc.). [Siento molestia o incomodidad cuando no está preparada mi ropa favorita o habitual (p.ej.: maniático con la ropa, etc.).] | .63 |
| Factor 8: Hyper-Olfactory | |
| 35. I feel annoyed or uncomfortable when I smell certain odors that other people don't mind (eg: colognes, gels, etc.). [Siento molestia o incomodidad cuando huelo ciertos olores que a otras personas no les molestan (p.ej.: colonias, geles, etc.).] | .71 |
| 36. I feel discomfort or discomfort when I smell certain places (eg: public toilets, etc.). [Siento molestias o incomodidad cuando huelo ciertos lugares (p.ej.: aseos públicos, etc.).] | .82 |
| 37. I feel discomfort or discomfort when I smell certain foods. [Siento molestias o incomodidad cuando huelo ciertas comidas.] | .77 |
| 38. I feel discomfort or discomfort when I smell certain people. [Siento molestias o incomodidad cuando huelo a ciertas personas.] | .81 |
| Factor 9: Hyper-Visual | |
| 39. I feel discomfort or discomfort when I see certain colors of food on a plate (eg, different colors of food, shape of food, etc.). [Siento molestias o incomodidad cuando veo ciertos colores de alimentos dentro de un plato (p.ej.: diferentes colores de la comida, forma de la comida, etc.).] | .68 |
| 40. I feel annoyed or uncomfortable when I see the physical appearance of some people (eg: baldness, beard, hair color, etc.). [Siento molestia o incomodidad cuando veo el aspecto físico de algunas personas (p.ej.: calva, barba, color de pelo, etc.).] | .75 |
| 41. I feel annoyed or uncomfortable when I see a change in something or someone (eg, a certain container of food is not there, etc.). [Siento molestia o incomodidad cuando veo un cambio en algo o alguien (p.ej.: no está un determinado recipiente de comida, etc.).] | .74 |
| 42. I feel annoyed or uncomfortable when I see high-intensity light stimuli or bright light (eg, car lights, Christmas lights, toy lights, etc.). [Siento molestia o incomodidad cuando veo estímulos luminosos de alta intensidad o la luz brillante (p.ej.: luces de coches, luces de navidad, luces de juguetes, etc.).] | .53 |
| Factor 10: Hyper-Taste | |
| 43. I feel discomfort or discomfort from the taste of certain foods, so I only accept some flavors (for example: you prefer very sweet, very salty flavored foods, etc.). [Siento molestias o incomodidad por el sabor de ciertos alimentos, así que solo acepto algunos sabores (por ejemplo: prefiere alimentos con sabor muy dulces, muy salados, etc.). ] | .80 |
| 44. I feel annoyed or uncomfortable with foods with specific textures (eg, refuses solid foods). [Siento molestia o incomodidad por alimentos con texturas específicas (p.ej., rechaza alimentos sólidos).] | .75 |
| 45. I feel discomfort or discomfort from foods that are new to me. [Siento molestias o incomodidad por alimentos que son nuevos para mí.] | .75 |
| 46. I feel discomfort or discomfort when there are changes, however small or subtle, in my favorite foods (eg, taking another brand of yogurt, etc.). [Siento molestias o incomodidad cuando se producen cambios, aunque sean pequeños o sutiles, en mis alimentos preferidos (p.ej.: tomar otra marca de yogurt, etc.).] | .70 |
| Factor 11: Hyper-Auditory | |
| 47. I feel annoyed or uncomfortable when I hear certain continuous noises (for example: noise from busy/crowded places, excessive noise in the classroom, etc.). [Siento molestia o incomodidad cuando escucho ciertos ruidos continuos (por ejemplo: ruido de lugares bulliciosos/con mucha gente, exceso de ruido en el aula, etc.).] | .83 |
| 48. I feel annoyed or uncomfortable when I hear certain sudden, unexpected and intense noises (for example: a vacuum cleaner, thunder, etc.). [Siento molestia o incomodidad cuando escucho ciertos ruidos bruscos, inesperados e intensos (por ejemplo: una aspiradora, truenos, etc.).] | .85 |
| 49. I feel annoyed or uncomfortable when I listen to loud noises (eg: concerts, drills, alarm sounds, street works, etc.). [Siento molestia o incomodidad cuando escucho ruidos de volumen alto (p.ej.: conciertos, taladros, sonidos de alarmas, obras en la calle, etc.).] | .85 |
| 50. I feel annoyed or uncomfortable when I listen to music that is not what I usually listen to. [Siento molestia o incomodidad cuando escucho una música que no es la que suele escuchar.] | .50 |
Table 4.
Correlations between PSRS scales.
| (1) | (2) | (3) | (4) | (5) | (6) | (7) | (8) | (9) | (10) | (11) | (12) | (13) | ||
| (1) | Total PSRS | |||||||||||||
| (2) | Pain | .52 | ||||||||||||
| (3) | Total Hypo | .89 | .32 | |||||||||||
| (4) | Total Hyper | .89 | .30 | .64 | ||||||||||
| (5) | HypoTactile | .73 | .29 | .84 | .50 | |||||||||
| (6) | HypoOlfactory | .71 | .25 | .80 | .51 | .60 | ||||||||
| (7) | HypoVisual | .69 | .25 | .76 | .51 | .47 | .53 | |||||||
| (8) | HypoTaste | .64 | .18 | .73 | .47 | .47 | .48 | .51 | ||||||
| (9) | HypoAuditory | .71 | .24 | .79 | .53 | .56 | .52 | .54 | .53 | |||||
| (10) | HyperTactile | .75 | .26 | .56 | .82 | .47 | .45 | .41 | .39 | .45 | ||||
| (11) | HyperOlfactory | .71 | .26 | .52 | .79 | .42 | .44 | .39 | .36 | .43 | .57 | |||
| (12) | HyperVisual | .65 | .18 | .48 | .73 | .33 | .35 | .41 | .42 | .40 | .51 | .50 | ||
| (13) | HyperTaste | .66 | .22 | .46 | .76 | .38 | .34 | .37 | .30 | .42 | .50 | .48 | .48 | |
| (14) | HyperAuditory | .68 | .23 | .46 | .79 | .32 | .39 | .39 | .35 | .36 | .53 | .49 | .50 | .49 |
Note. PSRS = Pain and Sensitivity Reactivity Scale; Total Hypo= total sensory hyporeactivity; Total Hyper= total sensory hyperreactivity; All correlations are statically significant with p = .01.
Table 5.
Ordinal Cronbach’s Alpha, Ordinal MacDonald’s Omega and test-restest realiability.
| Alpha | Omega | T-R Reliability | |
| Pain | .83 | .79 | .69 |
| Total Sensory hyporeactivity | .93 | .91 | .87 |
| Hypo-Tactile | .74 | .68 | .86 |
| Hypo-Olfactory | .65 | .73 | .79 |
| Hypo-Visual | .75 | .68 | .81 |
| Hypo-Taste | .71 | .62 | .74 |
| Hypo-Auditory | .70 | .59 | .78 |
| Total Sensory hyperreactivity | .92 | .90 | .81 |
| Hyper-Tactile | .76 | .68 | .77 |
| Hyper-Olfactory | .85 | .79 | .81 |
| Hyper-Visual | .60 | .53 | .52 |
| Hyper-Taste | .83 | .75 | .73 |
| Hyper- Auditory | .82 | .82 | .82 |
| Total PSRS | .95 | .94 | .86 |
Note. PSRS = Pain and Sensitivity Reactivity Scale; M= Mean; SD= Standard Deviation; Hypo= sensory hyporeactivity; Hyper= sensory hyperreactivity.
Table 6.
Convergent and discriminant validity scores.
| SOR | OCI-R | |||||||||||
| Touch | Smell | Sight | Taste | Hearing | Hoarding | Checking | Ordering | Neutralizing | Washing | Obsessing | ||
| PSRS | Pain | .21 | .21 | .21 | .23 | .24 | .18 | .17 | .14 | .15 | .19 | .19 |
| Total Sensory hyporeactivity | .42 | .36 | .36 | .37 | .40 | .43 | .39 | .38 | .44 | .37 | .43 | |
| Hypo- Tactile | .32 | .28 | .27 | .31 | .30 | .35 | .32 | .31 | .35 | .29 | .35 | |
| Hypo-Olfactory | .32 | .28 | .27 | .28 | .33 | .34 | .30 | .34 | .40 | .33 | .34 | |
| Hypo-Visual | .32 | .28 | .32 | .29 | .33 | .31 | .29 | .30 | .35 | .33 | .33 | |
| Hypo-Taste | .32 | .30 | .27 | .20 | .29 | .30 | .29 | .27 | .31 | .22 | .31 | |
| Hypo-Auditory | .38 | .27 | .31 | .36 | .33 | .38 | .31 | .29 | .32 | .28 | .37 | |
| Total Sensory hyperreactivity | .60 | .55 | .51 | .54 | .59 | .46 | .43 | .50 | .47 | .48 | .50 | |
| Hyper-Tactile | .54 | .42 | .43 | .40 | .44 | .42 | .42 | .48 | .44 | .44 | .48 | |
| Hyper-Olfactory | .44 | .58 | .36 | .41 | .39 | .36 | .33 | .36 | .36 | .38 | .35 | |
| Hyper-Visual | .45 | .41 | .48 | .37 | .42 | .31 | .29 | .38 | .37 | .33 | .36 | |
| Hyper-Taste | .45 | .36 | .31 | .59 | .38 | .32 | .28 | .33 | .34 | .32 | .33 | |
| Hyper-Auditory | .45 | .38 | .42 | .35 | .64 | .37 | .35 | .38 | .32 | .36 | .42 | |
Note. PSRS = Pain and Sensitivity Reactivity Scale; OCI-R=Obsessive Compulsive Inventory – Revised; SOR= Sensory Over-Responsivity Scale; Total Hypo= total sensory hyporeactivity; Total Hyper= total sensory hyperreactivity; All correlations are statically significant with p = .01.
Disclaimer/Publisher’s Note: The statements, opinions and data contained in all publications are solely those of the individual author(s) and contributor(s) and not of MDPI and/or the editor(s). MDPI and/or the editor(s) disclaim responsibility for any injury to people or property resulting from any ideas, methods, instructions or products referred to in the content. |
© 2025 by the authors. Licensee MDPI, Basel, Switzerland. This article is an open access article distributed under the terms and conditions of the Creative Commons Attribution (CC BY) license (http://creativecommons.org/licenses/by/4.0/).
Copyright: This open access article is published under a Creative Commons CC BY 4.0 license, which permit the free download, distribution, and reuse, provided that the author and preprint are cited in any reuse.


