
Submitted:
21 March 2025
Posted:
24 March 2025
You are already at the latest version
Abstract
Photosynthetic vegetation (PV) and non-photosynthetic vegetation (NPV) play significant roles in ecosystem functions and ecological succession. Accurate monitoring of the coverage and distribution of PV and NPV in the grasslands of semi-arid regions is crucial for understanding the environment and addressing climate change. This study examined the Hengshan grassland site in China's semi-arid regions using imagery from unmanned aerial vehicles (UAVs), constructing a semantic segmentation label database via multiscale parameter optimisation, feature indicator selection, and manual correction methods. Three deep learning semantic segmentation models — PSPNet, DeepLabV3+, and U-Net—were employed to extract and compare the PV and NPV to determine the optimal semantic segmentation model. The experimental results showed that the PSPNet model exhibited a superior performance, with an overall classification accuracy of 89.2% and a Kappa coefficient of 0.80. These values were 0.8% and 3.9% higher and 0.02 and 0.07 higher than the corresponding values for DeepLabV3+ and U-Net, respectively. Further generalisability tests indicated that PSPNet achieved an overall classification accuracy of 87.5%–91.5% and a Kappa coefficient of 0.77–0.93 in different scenarios, effectively extracting the PV and NPV in various scenes of Hengshan grassland. Additionally, compared to estimates based on Sentinel-2A imagery, the UAV-based estimates of the fractional PV (fPV) and fractional NPV (fNPV) were closer to the results of field surveys. The method proposed in this study effectively extracted PV and NPV in China’s Hengshan grassland and demonstrated high reliability and applicability for long-term grassland monitoring. Therefore, the proposed approach can significantly contribute to the intelligent protection and sustainable management of grassland ecosystems in semi-arid areas.
Keywords:
UAV imagery
; grassland
; PV and NPV
; deep learning semantic segmentation
; PSPNet
1. Introduction
Grasslands are among the most extensively distributed types of vegetation in the world. They influence the flow and cycling of nutrients, carbon, water, and energy in ecosystems. They are important for studies on biomass estimation, carbon sources/sinks, water and soil conservation, and climate change [1,2]. Photosynthetic vegetation (PV) refers to the parts of vegetation that contain chlorophyll capable of performing photosynthesis. Non-photosynthetic vegetation (NPV) describes plant material that is unable to carry out photosynthesis, such as dead branches, fallen leaves, and tree trunks. [3]. In semi-arid regions, vegetation degradation occurs at an alarming rate, leading to significant ecological concerns. NPV is an important component of natural vegetation in these regions and a crucial factor for monitoring plant survival status and productivity. It plays a significant role in mitigating soil erosion, safeguarding biodiversity, enhancing nutrient cycling, and augmenting carbon sequestration [4]. Prompt and precise observation of PV and NPV coverage and distributions in semi-arid grasslands is crucial for comprehending grassland phenology and ecological succession. [5].
Ground-based measurements of PV cover (fPV) and NPV cover (fNPV) are highly accurate [6], but they are limited by spatial, temporal, and financial constraints [7]. Satellite remote sensing can estimate fPV and fNPV over large areas [8] but it is affected by sensor resolution and weather conditions, which restrict the collection and analysis of remote sensing information [9]. In recent years, the development of low-altitude remote sensing using unmanned aerial vehicles (UAVs) has compensated for the shortcomings of aerospace and aerial remote sensing in terms of image resolution, revisit frequency, and cloud cover [10]. Specifically, UAV remote sensing provides the benefit of being cost-effective. They offer user-friendly operation, real-time imagery, and high resolution, providing a new data source that enables vegetation information to be rapidly and accurately acquired [11,12]. When processing UAV aerial imagery, traditional pixel-based image interpretation techniques applied to satellite remote sensing data exhibit limitations, including complex feature selection, spectral confusion, low recognition accuracy, and long processing times [13]. To address these challenges and enhance the precision and effectiveness of estimating vegetation cover, there has been a growing interest in utilizing object-oriented machine learning techniques. Object-oriented machine learning methods, owing to their strong classification performance and non-linear fitting capabilities, have been widely applied to estimations of vegetation cover and other vegetation parameters [14,15].
For example, De Castro et al. [16] used object-based random forest (RF) algorithms to rapidly and accurately identify weeds in UAV imagery, demonstrating that object-based image analysis (OBIA) technology (integrated with digital surface models, orthophotos, and machine learning methods like RF algorithms) can accurately estimate crop height and classify weeds in images. In addition, Guo et al. [17] used machine learning techniques, such as backpropagation (BP) networks and RF, to model and extract fPV and fNPV using UAVs, thereby achieving a high accuracy. Nonetheless, conventional machine learning algorithms depend significantly on the human-computer interaction, lack intelligence and automation, and exhibit poor transferability.
As computer vision and artificial intelligence have become increasingly developed, deep learning convolutional neural networks (CNNs) have gained significant traction in remote sensing research and applications. By training with large amounts of data to construct deep neural networks, these techniques automatically identify features that are closely associated with the target task by utilizing loss functions, offering strong robustness and easy model transferability [18]. Unlike the initial approach of classifying based on the category of the image block centred on a pixel [19], fully convolutional neural networks (FCNs) substitute the fully connected layers of CNNs with deconvolutional layers, upsample the feature maps generated by the last convolutional layer of the CNN algorithm to restore the input size, and reduce the redundant calculations, significantly improving the efficiency of classifying large-scale imagery. Currently, advanced semantic segmentation networks based on FCNs include Pyramid Scene Parsing Network (PSPNet) [20,21], U-Net [22,23], SegNet [24], and DeepLab [25,26]. The application of deep learning semantic segmentation models to UAV data for vegetation extraction is becoming increasingly common [27,28]. For example, Torres et al. [29] compared five advanced deep FCN architectures—U-Net, SegNet, FC-DenseNet, and DeepLabV3+—using RGB UAV imagery to map birch trees in urban environments. They observed that FC-DenseNet achieved the best overall accuracy. In addition, He et al. [30] combined object-oriented and deep learning methods to compare three advanced deep FCN architectures utilised to extract PV and NPV cover in the arid regions of northern China, and found that the DeepLabV3+ model was more suitable for vegetation extraction in these regions.
The precise and rapid extraction of vegetation cover information has become an urgent issue. This urgency is driven by the need for accurate ecological monitoring and management, especially in critical regions such as the Hengshan grassland. The Hengshan grassland in the Loess Plateau of China is situated in a semi-arid grassland vegetation zone characterised by a limited variety of plant species, low vegetation cover, a simple structure, and ecological fragility [31,32]. Most previous studies that use UAV data to extract vegetation cover in semi-arid regions focus on fPV, but estimations of the NPV cover, which occupies a significant ecological niche, are limited [33,34].
Motivated by the need to understand grassland phenology and ecological succession in semi-arid regions through timely and accurate monitoring of fPV and fNPV, this study Used RGB aerial imagery of the Hengshan grassland taken by the DJI Phantom 4 Pro UAV, this study explored the feasibility and efficiency of extracting the PV and NPV cover in typical grassland plots in semi-arid regions via PSPNet, DeepLabV3+, and U-Net.
The aims of this study are as follows:
1. To evaluate the potential of using UAV-based deep learning semantic segmentation architectures to extract fPV and fNPV from high-resolution optical UAV imagery of semi-arid grasslands.
2. To compare the strengths and weaknesses of three deep learning semantic segmentation networks (PSPNet, DeepLabV3+, and U-Net) in extracting fPV and fNPV from Hengshan grassland plots in semi-arid regions.
3. To apply the optimal model to vegetation monitoring at different times and in regions of the same type, and to verify the model's generalisability for grassland vegetation extraction.
4. To further investigate the correlation between UAV imagery, field surveys, and Sentinel-2A imagery when estimating fPV and fNPV for the long-term monitoring of the plots in the Hengshan grassland.
This study lays the foundation for the application of intelligent detection technologies in the broader vegetation ecology field, and is expected to promote the intelligent protection and sustainable management of grassland ecosystems in semi-arid regions.
2. Materials and Methods
2.1. UAV Aerial Survey Data Acquisition
Hengshan County is located in the central part of the Loess Plateau (Figure 1a) and is a typical semi-arid climatic zone. The region is characterised by harsh natural conditions and complex and varied terrain (Figure 1b), rendering its ecological environment relatively fragile. Hengshan County covers an area of approximately 4353 km2, and its geographical location ranges from 37°32'N to 38°31'N latitude and from 108°45'E to 110°31'E longitude.
In terms of vegetation types, Hengshan County is predominantly characterised by temperate grasslands and meadow steppes. The main vegetation species are long-awned grass (Stipa bungeana), Dahurian buckwheat (Lespedeza davurica), rigid mugwort (Artemisia sacrorum), and pigweed (Amaranthus spp.) (Figure 1b). These plants have adapted to the semi-arid climate and the soil conditions of the Loess Plateau, forming a representative grassland ecosystem that plays an important role in maintaining ecological balance and conserving soil and water in the region.
This study utilised a DJI Phantom 4 Pro UAV, integrated with a CMOS digital camera to acquire low-altitude imagery of typical grassland plots in Hengshan County, a semi-arid region. The UAV remote sensing images were acquired at the beginning of March, in March 1st, March 15th, March 30th, April 14th, May 15th, July 13th, September 14th, and at the end of October. Each flight was scheduled between 11:00 and 13:00, under clear weather conditions with no clouds or wind. The UAV flew at an altitude of approximately 50 m and a speed of 6 m/s, and both the longitudinal and lateral overlaps were set at 80%. The camera lens was maintained at a fixed vertical position relative to the ground to achieve an optimal nadir view. Four plots were surveyed, resulting in 4608 original aerial images across nine time periods. These images had a spatial resolution of 0.015 m and included three visible light bands: red (R), green (G), and blue (B). Pix4Dmapper software was used to process and mosaic the images, generating DOM and DSM for the plots and providing rich data for the subsequent training of the model.
2.2. Acquisition of Validation Samples and Classification of Ground Objects in Images
In addition to the aerial photography, vegetation surveys were conducted on the ground using the transect method. The transect method involves first marking the centre of the plot, and then arranging three 100-m-long measuring tapes that proceed from the centre point, forming a star shape [35,36]. Starting from the 1-m mark on each tape, vertical observations were made every 1 m, recording the components of the objects on the ground, such as green vegetation, dead vegetation, litter, moss, algae, and various forms of exposed soil. This process resulted in a total of 300 ground observations per plot [30,37]. Finally, by merging and classifying the observations into the categories of PV, NPV, and BS, and dividing by the total number of observations (300), the vertical projected PV and NPV cover levels (i.e., fPV and fNPV) within the plot were calculated. In addition, we collected relevant experimental data accumulated by our research group to obtain fPV and fNPV data derived from a pixel-based tripartite model based on Sentinel-2A imagery for the UAV survey area.
2.3. Construction of Semantic Segmentation Label Database
In this study, the object-oriented classification method proposed by He et al. [30] was adopted to construct a label database supplemented with manual corrections. This method involved multiscale segmentation parameter optimisation, feature indicator selection, and manual corrections.
2.3.1. Multiscale Segmentation Parameter Optimisation
The multi-resolution segmentation (MRS) algorithm includes the scale parameter (SP), shape parameter, and compactness parameter [38]. To determine the parameter combinations that best suit the extraction of PV and NPV in the Hengshan grassland plots, the shape and compactness factors were adjusted to values of 0.1, 0.3, 0.5, 0.7, and 0.9. Through extensive experimentation and comparison of various parameter combinations, it was observed that these settings significantly influenced the segmentation outcomes for the Hengshan grassland. Figure 2 illustrates the segmentation results for nine parameter combinations, highlighting more pronounced differences. Undersegmentation occurred when the compactness factor was set to 0.5 and the shape factor was either 0.7 or 0.9, leading to insufficient separation of PV and NPV (Figure 2 h, f). Overfragmentation of the segmentation results was evident shown in figure 2 a, f. Conversely, better results were achieved when the shape factor was 0.1 and the compactness factor was 0.5, as this combination promoted higher object homogeneity and clearer delineation of PV and NPV edges (Figure 2 c). Based on these findings, a shape and compactness factor of 0.1 and 0.5 were chosen as the optimal parameter combination for achieving the desired homogeneity criterion.
To determine the optimal segmentation scale parameter based on the optimal homogeneity criterion parameters, this study conducted multiscale segmentation experiments using the ESP2 tool proposed by Drǎguţ et al. [39], with a step size of 10 within the scale parameter range of 1–400. The local variance of the image and the rate of change of the variance are plotted in Figure 3. According to prior knowledge gained by previous studies on grassland types, the segmentation results can be excessively fragmented when the scale parameter is less than 10, and the PV, NPV, and BS may not be effectively segmented when the scale parameter exceeds 300. Therefore, the scale parameter range was set to between 10 and 300. Based on the peaks of the rate-of-change curve (Figure 3), the following eight candidate optimal scale parameters were selected: 53, 62, 72, 106, 186, 221, 256, and 278. A comparison between the segmentation results produced by these eight scale parameters indicated that the segmentation result with a scale parameter of 72 extracted the PV and NPV most effectively, without significant oversegmentation or undersegmentation. Thus, this study determined that 72 was the optimal segmentation scale parameter.
2.3.2. Optimised Feature Indicator Set and Manual Correction
Feature indicator selection is crucial for object-oriented classification because ideal feature indicators maximise the separability of the objects in segmented images [38]. This study focused on classifying and identifying vegetation in grassland plots. Textural, geometric, and visible-light vegetation indices were considered for this purpose. Initially, 24 feature indicators were extracted from the UAV imagery of the study area. To determine their importance in extracting PV and NPV, the random forest algorithm was applied. The algorithm ranked these features based on their significance for the Hengshan grassland UAV imagery analysis.
Figure 4 shows the ranking of the importance of different features in the Hengshan grassland. Among the spectral features, the maximum spectral difference (Max.dff) was the most critical for PV and NPV extraction, followed by the mean values of the R-band, brightness, G-band, and B-band. Among the visible light vegetation indices, the excess green index (EXG) had the highest importance, indicating its effectiveness at reflecting vegetation cover and growth. The normalised green-blue difference index (NGBDI) ranked second, while the visible difference vegetation index (VDVI), normalised green-red difference index (NGRDI) was also highly important. These indices are sensitive to physiological parameters, such as leaf pigment content and leaf area index. In terms of textural features, the mean value (GLCM_mean) was the most important, followed by the homogeneity (GLCM_Homogeneity), dissimilarity (GLCM_Dissimilarity), and contrast (GLCM_contrast), all of which reflect the spatial relationships between pixels within different types of vegetation areas. In contrast, geometric features such as the density, shape, area, and perimeter played smaller roles in distinguishing between PV and NPV areas.
Therefore, in the subsequent object-oriented classification and extraction process, we selected the top 10 most important features as the basis for classification, accounting for over 90% of the total contribution. This method enhanced the precision of vegetation classification in the Hengshan grassland, reduced the misclassification rate, enhanced the credibility of the classification results, and reduced the time required for classification and the computational complexity.
Misclassification and omission may occur during object-oriented classification. Therefore, manual visual interpretation was required to correct these errors. Upon the completion of manual corrections, the classification result map was transformed into an indexed map. This indexed map played a key role during the training phase of the semantic segmentation model. The regional images underwent additional processing. Specifically, they were divided into image sets with dimensions of 512 × 512 pixels. Additionally, a cutting stride of 256 was applied to ensure efficient processing. To expand the scale of the dataset, thereby reducing the model overfitting and enhancing its generalisation ability, data augmentation operations (e.g., random flipping, translation, and rotation) were performed to enlarge the database. The dataset was subsequently partitioned into training, validation, and testing subsets, employing a ratio of 7:2:1.
2.4. Methods
This study utilised high-resolution visible light imagery from UAVs and deep learning semantic segmentation models to develop a framework for extracting the PV and NPV cover from typical grassland plots. As shown in Figure 5, the framework comprised four major steps. First, UAV aerial image acquisition and preprocessing were conducted. Second, a semantic segmentation label dataset for the grassland plots was constructed using multiscale segmentation parameter optimisation, feature indicator selection, and manual corrections. Third, three representative networks for semantic segmentation—PSPNet, DeepLabV3+, and U-Net—were employed in comparative experiments to determine the optimal deep learning semantic segmentation model. Finally, based on the optimal PV and NPV extraction model, the generalisability of the model was evaluated, the temporal and spatial variations of fPV and fNPV in the Hengshan grassland plots were analysed, and the correlations between the UAV, ground survey, and satellite remote sensing estimates of fPV and fNPV were compared.
2.4.1. PSPNet
PSPNet (Pyramid Scene Parsing Network) is a deep CNN model designed for semantic segmentation tasks [21]. The core principle of the method is to enhance segmentation accuracy by collecting contextual information at various scales. This is achieved through the use of a pyramid pooling module (PPM). The architecture of the PSPNet model is illustrated in Figure 6. To preserve the weight of global features, typical grassland plot samples from UAV remote sensing images are used. These samples are input into the ResNet50 backbone network for feature map extraction. Subsequently, the PPM module divides the feature map into subregions of different sizes, performs pooling operations on each subregion, and upsamples and fuses these feature maps at different scales. Finally, pixel-level prediction results are generated using a convolutional layer [21]. The advantage of PSPNet is its ability to significantly enhance the accuracy of semantic segmentation by integrating multiscale contextual information, particularly when handling complex scenes.
2.4.2. DeepLabV3+
DeepLabV3+ improves upon the DeepLab series of models by introducing a decoder module that combines the advantages of the encoder-decoder framework to further enhance the segmentation accuracy, particularly for fine-grained structures [25]. The architecture of the DeepLabV3+ model is illustrated in Figure 7.
In DeepLabV3+, the encoder extracts semantic features from UAV remote sensing images using the ResNet50 network[25]. The ASPP module captures multiscale contextual information by employing atrous convolution layers with different dilation rates (e.g., 6, 12, and 18) in parallel. In the decoder, DeepLabV3+ introduces a skip connection mechanism, allowing low-level features to participate directly in the generation of the final prediction map. This assists in preserving additional edge details and improves the segmentation accuracy [26]. DeepLabV3+ performs exceptionally well in semantic segmentation, particularly when handling complex scenes and edge details, for which it demonstrates significant advantages.
2.4.3. U-Net
U-Net is a deep learning-based CNN specifically designed for biomedical image segmentation [22]. The network employs a symmetric contracting path (downsampling) and an expansive path (upsampling), and features rich skip connections to capture both local and global information. As shown in Figure 8, the encoder of the U-Net model gradually downsamples the input UAV remote sensing images using the convolutional and max-pooling layers to extract high-level semantic features[22]. Because of its simple yet powerful architecture, U-Net has become a classic model in the field of image segmentation.
2.5. Evaluation Metrics
When evaluating the classification results of the UAV aerial survey imagery, this study used the confusion matrix, overall classification accuracy (OA), Kappa coefficient, user’s accuracy (UA), and producer’s accuracy (PA) to assess the classification results [40,41].
The confusion matrix is an intuitive and effective method that can clearly display the correspondence between the predicted results of the classification model and the actual categories [42]. The OA is determined by the ratio of accurately classified samples to the total number of samples. This metric can intuitively reflect the comprehensive efficacy of the model, but is less sensitive to imbalanced sample categories [43]. The Kappa coefficient is a statistical metric. The UA is characterized as the proportion of the samples. that actually belong to a certain category to those predicted by the model to be in that category. Its formula is
The formula for the OA is
The PA is determined as the ratio of the samples that are correctly predicted by the model to be in a certain category to those that actually belong to that category. Its formula is
The coefficient of determination (R²), root mean square error (RMSE), and significance tests were used for the analysis and evaluation [44]. We analysed the correlation between three sets of data: (1) the fPV and fNPV values extracted from the UAV imagery of the typical grassland plots in Hengshan, (2) the fPV and fNPV values obtained from concurrent ground surveys, and (3) the fPV and fNPV values derived from the pixel-based tripartite model based on Sentinel-2A imagery.
3. Results
The computer hardware configuration included a GeForce GTX 3080 Ti GPU with 128 GB of system memory, which enabled the semantic segmentation models to be rapidly trained and tested.
The neural network's computational framework employed the following configuration: The input layer receives three-channel data streams while generating three distinct target classifications. During optimization cycles, training batches each containing four samples were processed through 200 complete iterations of the dataset. An initial learning rate of 0.001 was selected with an adaptive polynomial adjustment strategy (decay factor: 0.9), implemented through SGD optimization for parameter updates.
3.1. Comparison Between Deep Learning Semantic Segmentation Models for Hengshan Grassland
Based on the self-constructed semantic segmentation label database, three models (PSPNet, DeepLabV3+, and U-Net) were trained to perform semantic segmentation of the PV and NPV in the UAV imagery of the Hengshan grassland. As shown in Figure 9, the extraction results demonstrated that all three models exhibited strong vegetation identification capabilities for this region.
The quantitative accuracy assessment indicated significant differences in the performances of the three models. PSPNet achieved the highest performance among all models. It reached an overall classification accuracy of 89.2%. Its Kappa coefficient was 0.80. These results indicate that PSPNet is the optimal classification model. DeepLabV3+ came in second place. It had an OA of 88.4%. The Kappa coefficient for DeepLabV3+ was 0.79. This shows its performance is quite similar to PSPNet. U-Net, however, demonstrated weaker results. Its OA was 85.3%. The Kappa coefficient for U-Net was 0.73.
Comparatively, PSPNet achieved 0.8% and 3.9% improvements in the OA compared to DeepLabV3+ and U-Net, respectively, as well as increases in the Kappa coefficient of 0.02 and 0.07, respectively. These results not only validate the adaptability of the Pyramid Scene Parsing Network (PSPNet) for complex vegetation scenarios but also reveal the various sensitivities of different network architectures to the extraction of different elements in grassland ecosystems. Overall, the results indicate that the PSPNet model, which is based on multiscale feature fusion, is more suitable for handling heterogeneity when extracting vegetation cover in the Hengshan grassland.
The classification accuracy for the Hengshan grassland achieved using different network models also varied. A comparative analysis of the classification results for the Hengshan grassland showed that the most accurately classified land cover type was PV, with user accuracies ranging from 85.7% to 92.0% across the three network models. For NPV, the PA values of the various network models ranged from 86.9% to 90.4%, with PSPNet achieving the highest PA. Compared to DeepLabV3+ and U-Net, the PA of PSPNet for NPV was 3.5% and 0.1% higher, respectively. The UAs for NPV across the different algorithms ranged from 80.9% to 88.6%. For BS, the PAs of the various network models ranged from 80.9% to 97.3%, with the UA of PSPNet being 1.8% and 5.4% higher than those of DeepLabV3+ and U-Net, respectively. Therefore, the PSPNet network model exhibited the best performance for the classification and extraction of PV and NPV in the Hengshan grassland.
The results indicated that PSPNet outperformed DeepLabV3+ and U-Net. It not only more effectively preserved the detailed information of various land cover types and obtained land cover edges that were more regular, but it also accurately extracted the PV and NPV classes of the Hengshan grassland and reduced the confusion between the NPV and BS (Figure 10). Overall, the extraction process was complete. DeepLabV3+ exhibited a slightly inferior segmentation compared to PSPNet, with some NPV misclassified as BS. U-Net demonstrated weak performance in this region, producing a large number of misclassifications between land cover types and exhibiting poor differentiation between similar land cover types. The PSPNet deep learning semantic segmentation network was the most effective at extracting PV and NPV from the UAV imagery of the Hengshan grassland.
3.2. Generalisability Evaluation of Semantic Segmentation Models for Hengshan Grassland
Based on the optimal network model PSPNet, which was established through comparative experiments on region A of the Hengshan grassland, we selected regions B, C, and D (observed in September) to evaluate different locations during the same period; region A (observed in July) to evaluate the same location at different times; and regions B, C, and D (observed in July) to evaluate different locations at different times. The classification accuracy was verified to assess the transferability of the optimal network model PSPNet to other sample areas of the Hengshan grassland.
As shown in Figure 11 and Table 1, the PSPNet model demonstrated excellent generalisability in the three scenarios of the Hengshan grassland, with an OA ranging from 87.5% to 91.5% and a Kappa coefficient ranging from 0.77 to 0.93. The DeepLabV3+ model demonstrated superior performance in extracting PV and NPV classes across three scenarios. Its PA ranged from 86.3% to 94.9%. For the BS class, the model achieved a PA of 70.0% to 88.2% in various areas during the same month. This was higher than the extraction accuracy for different locations at different times, where the PA was 66.7% to 84.2%. The PSPNet model, identified as the optimal network, effectively extracted PV and NPV data. It performed well across different locations during the same period, the same location at different times, and different locations at different times. In practice, the constructed PSPNet model demonstrated superior generalisability for extracting PV and NPV in the Hengshan grassland sample areas.
3.3. Spatial Distribution of PV and NPV in Hengshan Grassland at Different Times
The orthophotos of the Hengshan grassland obtained at different stages effectively reflected the growth dynamics of the PV and NPV in the area. Using the optimal model constructed in this study, we performed semi-automated extraction on the images of the Hengshan grassland to obtain clear distribution maps of the PV and NPV in the sample areas (Figure 12). These spatial distribution maps of the PV and NPV at different times reflect the dynamic changes in PV and NPV in the Hengshan grassland sample areas over the course of a year.
The PV is primarily distributed in contiguous patches within the region, whereas the NPV is primarily found in the areas surrounding the PV. In the orthophotos of the Hengshan grassland taken on 1, 15, and 30 March and 14 April, almost no PV was present. The NPV primarily consisted of newly greened herbaceous plants and a litter of perennial herbaceous plants (Figure 12 A, B, C, and D). In the distribution maps of the PV and NPV types, the coverage area of the NPV was the largest (Figure 12 a, b, c, and d).
On 15 May, the orthophotos of the Hengshan grassland (Figure 12 E) show the emergence of distinct green vegetation, with leaves beginning to grow near some NPV (Figure 12 e). The orthophotos of the Hengshan grassland for July and September indicate that this period had the highest coverage of PV and the lowest coverage of NPV throughout the growing season (Figure 12 F and G). In the distribution maps of the PV and NPV types, the coverage area of PV was the largest (Figure 12 f and g).
Subsequently, the vegetation entered a declining phase, with the range of PV shrinking and the distribution area of NPV beginning to increase. The orthophoto of the Hengshan grassland taken on 30 October shows that at the end of the growing season, during the period in which the vegetation declined, the green vegetation in the sample area had completely turned yellow and withered, with no green leaves remaining in the image (Figure 12 H). In the distribution map of the PV and NPV, the vegetation mainly consisted of branches and trunks of shrubs and trees, as well as litter (Figure 12 h).
3.4. Correlation Analysis of fPV and fNPV Estimation in Hengshan Grassland Using Three Methods
The correlations between the estimated values of fPV and fNPV for the long-term monitoring plots in the Hengshan grassland obtained using the three methods—UAV imagery, ground surveys, and Sentinel-2A imagery—are shown in Figure 13. Among the three methods, the fPV and fNPV values derived from the UAV imagery using the framework proposed in this study showed a high correlation with those obtained from ground surveys. Specifically, for the fPV extraction results, the R² value between the UAV-derived fPV and ground survey-derived fPV was 0.81, with an RMSE of 9.1. The UAV-derived fPV also correlated well with the fPV obtained from the pixel-based tripartite model using Sentinel-2A imagery, with an R² of 0.74 and an RMSE of 5.2. The correlation between the ground survey-derived fPV and Sentinel-2A-derived fPV was the highest, with an R² of 0.94 and an RMSE of 2.4.
For the fNPV extraction results, the highest correlation was observed between the UAV-derived fNPV and ground survey-derived fNPV, with an R² of 0.79 and an RMSE of 10.0. The UAV-derived fNPV also showed a relatively high correlation with the fNPV obtained from the Sentinel-2A pixel-based tripartite model, with an R² of 0.72 and an RMSE of 6.4. However, the correlation between the ground survey-derived fNPV and Sentinel-2A-derived fNPV was relatively low, with an R² of 0.45 and an RMSE of 8.9.
These results indicate that the UAV-derived fPV and fNPV values obtained in this study were closer to the ground survey results than those derived from the Sentinel-2A pixel-based tripartite model. The correlations were stronger for the UAV-derived estimates than for the Sentinel-2A-derived estimates. These results confirm that UAVs are an effective platform for estimating fPV and fNPV in the Hengshan grassland and that they can serve as a valuable bridge between ground surveys and satellite remote sensing data. Moreover, the framework proposed in this study can effectively estimate fPV and fNPV for Hengshan grassland plots using UAV imagery obtained across different periods.
4. Discussion
4.1. Superior Performance of PSPNet in Extracting PV and NPV in Semi-arid Hengshan Grassland
The PSPNet deep learning network demonstrated the strongest applicability and optimal extraction performance for UAV-based PV and NPV in the semi-arid Hengshan grasslands. This can be ascribed to the pyramid pooling module (PPM) employed by PSPNet, which captured contextual information at different scales within the imagery [21]. This feature enhanced the segmentation accuracy, particularly in areas in which different vegetation types (e.g., grasses, shrubs, and trees) exhibited significant variations in the spatial scale. However, the incorporation of the PPM increased the computational load, resulting in slower inference speeds.
PSPNet performed relatively poor when handling complex backgrounds and small targets. In contrast, U-Net exhibited a superior performance in processing smaller sample images. This implies that the encoder-decoder structure of U-Net may underperform when handling complex backgrounds and multiscale information. Thus, different deep learning semantic segmentation models exhibit various performance levels for different vegetation sample areas, as they exhibit specific strengths and weaknesses depending on the characteristics of the sample area.
4.2. High Applicability of UAV and Deep Learning-Based Estimation of PV and NPV
PV and NPV are crucial for studying vegetation growth, ecological environments, and vegetation types [36]. Long-term monitoring using UAV remote sensing imagery can capture spatiotemporal variations in PV and NPV across different vegetation types and at different times. This information helps researchers better understand the dynamics of vegetation ecosystems, vegetation succession processes, and environmental impacts[9]. Spatial distribution maps and evolution data for PV and NPV can support decision-making and management in vegetation research, ecological monitoring, and resource management. Vegetation distribution and changes are influenced by multiple factors, and the reasons for seasonal variations in the spatial distributions of PV and NPV may differ among vegetation types owing to geographical location, climatic conditions, and other factors [2]. Further research and field surveys are required to explore the underlying causes of changes in PV and NPV cover.
Moreover, the results showed that UAV-based estimation methods are highly reliable and applicable for the long-term monitoring of fPV and fNPV for semi-arid grassland vegetation types. Compared to ground surveys and the pixel-based tripartite model using Sentinel-2A imagery, UAV-based methods yielded estimates that were closer to ground observations, especially for fPV.
4.3. Future Perspectives on Deep Learning Models in Vegetation Classification
The three deep learning semantic segmentation models examined in this study achieved high classification accuracies in PV and NPV segmentation tasks, enabling precise pixel-level classification of images. This is advantageous for fine-scale vegetation classification. Trained using large volumes of remote sensing imagery, these models can learn vegetation features from extensive samples, rendering them suitable for classifying vegetation in large areas. However, these models require substantial amounts of labelled data for training, which may lead to insufficient training and reduced classification performance in areas with limited data or complex vegetation types. Models are typically trained using data from specific regions and periods, resulting in limited generalisability to remote sensing images from different regions, seasons, or times of year. In addition, these models require significant computational resources and memory, which restricts their use in devices with limited computational capabilities. In summary, although these deep learning models showed excellent performance in vegetation classification tasks, their limitations should be considered and addressed in practical applications.
Future research could explore the use of hyperspectral cameras in UAVs to more effectively identify vegetation. Subsequent studies could also focus on combining UAV imagery from different perspectives and altitudes with the SAM large vision model [45] to recognise PV and NPV in different vegetation types. This approach would further improve the accuracy and efficiency of vegetation extraction and expand the application of the proposed methods to larger study areas, offering technical assistance and a theoretical foundation for UAV remote sensing applications in PV and NPV research.
5. Conclusions
This study used UAV aerial imagery of plots in the Hengshan grassland in China's semi-arid regions. A semantic segmentation label database was constructed using multiscale parameter optimisation, feature indicator selection, and manual corrections. Subsequently, three deep learning models (PSPNet, DeepLabV3+, and U-Net) were employed to conduct comparative experiments on the extraction of PV and NPV in the study area, thereby establishing the optimal semantic segmentation model. Finally, the generalisability of the PV and NPV extractions was evaluated based on the optimal PV and NPV extraction model. This study calculated the temporal and spatial variations in fPV and fNPV within the Hengshan grassland plots and analysed their spatiotemporal changes. Additionally, the correlations between the UAV, ground survey, and satellite remote sensing estimates of fPV and fNPV were compared.
1. The PSPNet deep learning network model constructed in this study demonstrated superior performance across various evaluation metrics. The overall classification accuracy was 89.2%, which was higher than that of DeepLabV3+ and U-Net by 0.8% and 3.9%, respectively. Moreover, the Kappa coefficient was 0.80, which was higher than that of DeepLabV3+ and U-Net by 0.02 and 0.07, respectively.
2. The optimal PSPNet model achieved overall classification accuracies ranging from 87.5% to 91.5% and Kappa coefficients ranging from 0.77 to 0.93 in generalisability tests across different scenarios. The PSPNet model established through comparative experiments on region A of the Hengshan grassland effectively extracted PV and NPV across various scenarios, exhibiting strong generalisability for extracting PV and NPV.
3. The spatial distribution maps of the PV and NPV in the Hengshan grassland at different times reflected the dynamic changes in the PV and NPV over the course of a year. In March and April, the PV was almost absent and the NPV, which primarily consisted of newly greened herbaceous plants and litter from perennial herbaceous plants, had the largest coverage area. Green vegetation appeared in May. From July to September, the PV coverage was the highest, whereas that of the NPV was the lowest. Subsequently, as vegetation entered the decline phase, the range of the PV shrank and the NPV coverage increased. By the end of October, all vegetation in the plots had turned yellow and withered, with no remaining green leaves.
4. The UAV-based estimates of fPV and fNPV for the Hengshan grassland plots at different times were closer to the results obtained from ground surveys, with R² values of 0.81 and 0.79. These correlations were higher than those obtained from the pixel-based tripartite model using Sentinel-2A imagery, which had R² values of 0.74 and 0.72 for fPV and fNPV, respectively.
The method proposed in this study can effectively extract PV and NPV from images of China’s Hengshan grasslands. Therefore, it is anticipated to provide intelligent support for the protection and sustainable management of grassland ecosystems in semi-arid areas.
Author Contributions
Conceptualization, J.H. and X.P.Z; methodology, J.H. and D.L.; software, J.H. and W.B.L.; validation, J.H. and W.B.L.; formal analysis, J.H. and W.L.F.; investigation, Y.R.; resources, J.H. and D.L.; data curation, J.H. and X.P.Z; writing—original draft preparation, J.H.; writing—review and editing J.H. and X.P.Z; visualization, W.L.F. and D.L.; supervision, W.B.L.; project administration, X.P.Z and W.B.L.; funding acquisition, X.P.Z and W.B.L. All authors have read and agreed to the published version of the manuscript.
Funding
This research was funded by the Proof of Concept Fund (grant number XJ2023230052、grant number 2024SLKJ-16、grant number SMDZ-2023CX-14) and the Shaanxi Provincial Public Welfare Geological Survey Project (grant number 202508).
Data Availability Statement
Data is contained within the article.
Conflicts of Interest
The authors declare no conflicts of interest.
References
- Bai, X.; Zhao, W.; Luo, W.; An, N. Effect of climate change on the seasonal variation in photosynthetic and non-photosynthetic vegetation coverage in desert areas, Northwest China. Catena. 2024, 239, 107954. [Google Scholar] [CrossRef]
- Hill, M.J.; Guerschman, J.P. Global trends in vegetation fractional cover: Hotspots for change in bare soil and non-photosynthetic vegetation. Agriculture, Ecosystems & Environment. 2022, 324, 107719. [Google Scholar]
- Carlson, T.N.; Ripley, D.A. On the relation between NDVI, fractional vegetation cover, and leaf area index. Remote Sens. Environ. 1997, 62, 241–252. [Google Scholar] [CrossRef]
- Bannari, A.; Pacheco, A.; Staenz, K.; McNairn, H.; Omari, K. Estimating and mapping crop residues cover on agricultural lands using hyperspectral and IKONOS data. Remote Sens. Environ. 2006, 104, 447–459. [Google Scholar] [CrossRef]
- Wardle, J.; Phillips, Z. Examining Spatiotemporal Photosynthetic Vegetation Trends in Djibouti Using Fractional Cover Metrics in the Digital Earth Africa Open Data Cube. Remote Sens. 2024, 16, 1241. [Google Scholar] [CrossRef]
- Lyu, D.; Liu, B.; Zhang, X.; Yang, X.; He, L.; He, J.; Guo, J.; Wang, J.; Cao, Q. An experimental study on field spectral measurements to determine appropriate daily time for distinguishing fractional vegetation cover. Remote Sens. 2020, 12, 2942. [Google Scholar] [CrossRef]
- Zheng, G.; Bao, A.; Li, X.; Jiang, L.; Chang, C.; Chen, T.; Gao, Z. The potential of multispectral vegetation indices feature space for quantitatively estimating the photosynthetic, non-photosynthetic vegetation and bare soil fractions in Northern China. Photogrammetric Engineering & Remote Sensing. 2019, 85, 65–76. [Google Scholar]
- Ez-zahouani, B.; Teodoro, A.; El Kharki, O.; Jianhua, L.; Kotaridis, I.; Yuan, X.; Ma, L. Remote sensing imagery segmentation in object-based analysis: A review of methods, optimization, and quality evaluation over the past 20 years. Remote Sensing Applications: Society and Environment. 2023, 32, 101031. [Google Scholar] [CrossRef]
- Chai, G.; Wang, J.; Wu, M.; Li, G.; Zhang, L.; Wang, Z. Mapping the fractional cover of non-photosynthetic vegetation and its spatiotemporal variations in the Xilingol grassland using MODIS imagery (2000− 2019). Geocarto Int. 2022, 37, 1863–1879. [Google Scholar] [CrossRef]
- Yao, H.; Qin, R.; Chen, X. Unmanned aerial vehicle for remote sensing applications—A review. Remote Sens. 2019, 11, 1443. [Google Scholar] [CrossRef]
- Osco, L.P.; Junior, J.M.; Ramos, A.P.M.; de Castro Jorge, L.A.; Fatholahi, S.N.; de Andrade Silva, J.; Matsubara, E.T.; Pistori, H.; Gonçalves, W.N.; Li, J. A review on deep learning in UAV remote sensing. Int. J. Appl. Earth Obs. Geoinf. 2021, 102, 102456. [Google Scholar] [CrossRef]
- Liu, Z.; Chen, C.; Huang, Z.; Chang, Y.C.; Liu, L.; Pei, Q. A Low-Cost and Lightweight Real-Time Object-Detection Method Based on UAV Remote Sensing in Transportation Systems. Remote Sens. 2024, 16, 3712. [Google Scholar] [CrossRef]
- Ouchra, H.; Belangour, A.; Erraissi, A. A comparative study on pixel-based classification and object-oriented classification of satellite image. International Journal of Engineering Trends and Technology. 2022, 70, 206–215. [Google Scholar] [CrossRef]
- Ozturk, M.Y.; Colkesen, I. A novel hybrid methodology integrating pixel-and object-based techniques for mapping land use and land cover from high-resolution satellite data. Int. J. Remote Sens. 2024, 45, 5640–5678. [Google Scholar] [CrossRef]
- Lin, Y.; Guo, J. Fuzzy geospatial objects− based wetland remote sensing image Classification: A case study of Tianjin Binhai New area. Int. J. Appl. Earth Obs. Geoinf. 2024, 132, 104051. [Google Scholar] [CrossRef]
- De Castro, A.I.; Torres-Sánchez, J.; Peña, J.M.; Jiménez-Brenes, F.M.; Csillik, O.; López-Granados, F. An automatic random forest-OBIA algorithm for early weed mapping between and within crop rows using UAV imagery. Remote Sens. 2018, 10, 285. [Google Scholar] [CrossRef]
- Zi Chen, G.; Tao, W.; Shu Lin, L.; Wen Ping, K.; Xiang, C.; Kun, F.; Ying, Z. Comparison of the backpropagation network and the random forest algorithm based on sampling distribution effects consideration for estimating nonphotosynthetic vegetation cover. Int. J. Appl. Earth Obs. Geoinf. 2021, 104, 102573. [Google Scholar] [CrossRef]
- Kattenborn, T.; Leitloff, J.; Schiefer, F.; Hinz, S. Review on Convolutional Neural Networks (CNN) in vegetation remote sensing. Isprs-J. Photogramm. Remote Sens. 2021, 173, 24–49. [Google Scholar] [CrossRef]
- Gidaris, S.; Komodakis, N. Object detection via a multi-region and semantic segmentation-aware cnn model. Proceedings of the IEEE international conference on computer vision, 2015, 1134–1142.
- Zhao, H.; Shi, J.; Qi, X.; Wang, X.; Jia, J. Pyramid scene parsing network. Proceedings of the IEEE conference on computer vision and pattern recognition, 2017, 2881–2890.
- Fang, H.; Lafarge, F. Pyramid scene parsing network in 3D: Improving semantic segmentation of point clouds with multi-scale contextual information. Isprs-J. Photogramm. Remote Sens. 2019, 154, 246–258. [Google Scholar] [CrossRef]
- Ronneberger, O.; Fischer, P.; Brox, T. U-net: Convolutional networks for biomedical image segmentation. Medical image computing and computer-assisted intervention–MICCAI 2015: 18th international conference, Munich, Germany, -9, 2015, proceedings, part III 18:Springer, 2015, 234–241. 5 October.
- Qin, X.; Zhang, Z.; Huang, C.; Dehghan, M.; Zaiane, O.R.; Jagersand, M. U2-Net: Going deeper with nested U-structure for salient object detection. Pattern Recognit. 2020, 106, 107404. [Google Scholar] [CrossRef]
- Badrinarayanan, V.; Kendall, A.; Cipolla, R. Segnet: A deep convolutional encoder-decoder architecture for image segmentation. Ieee Trans. Pattern Anal. Mach. Intell. 2017, 39, 2481–2495. [Google Scholar] [CrossRef] [PubMed]
- Chen, L.; Zhu, Y.; Papandreou, G.; Schroff, F.; Adam, H. Encoder-decoder with atrous separable convolution for semantic image segmentation. Proceedings of the European conference on computer vision (ECCV), 2018, 801–818.
- Liu, C.; Chen, L.; Schroff, F.; Adam, H.; Hua, W.; Yuille, A.L.; Fei-Fei, L. Auto-deeplab: Hierarchical neural architecture search for semantic image segmentation. Proceedings of the IEEE/CVF conference on computer vision and pattern recognition, 2019, 82-92.
- Li, S.; Zhu, Z.; Deng, W.; Zhu, Q.; Xu, Z.; Peng, B.; Guo, F.; Zhang, Y.; Yang, Z. Estimation of aboveground biomass of different vegetation types in mangrove forests based on UAV remote sensing. Sustainable Horizons. 2024, 11, 100100. [Google Scholar] [CrossRef]
- Putkiranta, P.; Räsänen, A.; Korpelainen, P.; Erlandsson, R.; Kolari, T.H.; Pang, Y.; Villoslada, M.; Wolff, F.; Kumpula, T.; Virtanen, T. The value of hyperspectral UAV imagery in characterizing tundra vegetation. Remote Sens. Environ. 2024, 308, 114175. [Google Scholar] [CrossRef]
- Lobo Torres, D.; Queiroz Feitosa, R.; Nigri Happ, P.; Elena Cué La Rosa, L.; Marcato Junior, J.; Martins, J.; Ola Bressan, P.; Gonçalves, W.N.; Liesenberg, V. Applying fully convolutional architectures for semantic segmentation of a single tree species in urban environment on high resolution UAV optical imagery. Sensors. 2020, 20, 563. [Google Scholar] [CrossRef] [PubMed]
- He, J.; Lyu, D.; He, L.; Zhang, Y.; Xu, X.; Yi, H.; Tian, Q.; Liu, B.; Zhang, X. Combining object-oriented and deep learning methods to estimate photosynthetic and non-photosynthetic vegetation cover in the desert from unmanned aerial vehicle images with consideration of shadows. Remote Sens. 2022, 15, 105. [Google Scholar] [CrossRef]
- Zhang, Z.; Pan, H.; Liu, Y.; Sheng, S. Ecosystem Services’ Response to Land Use Intensity: A Case Study of the Hilly and Gully Region in China’s Loess Plateau. Land. 2024, 13, 2039. [Google Scholar] [CrossRef]
- Yang, H.; Gao, X.; Sun, M.; Wang, A.; Sang, Y.; Wang, J.; Zhao, X.; Zhang, S.; Ariyasena, H. Spatial and temporal patterns of drought based on RW-PDSI index on Loess Plateau in the past three decades. Ecol. Indic. 2024, 166, 112409. [Google Scholar] [CrossRef]
- Sato, Y.; Tsuji, T.; Matsuoka, M. Estimation of rice plant coverage using sentinel-2 based on UAV-observed data. Remote Sens. 2024, 16, 1628. [Google Scholar] [CrossRef]
- Zhang, Z.; Huang, L.; Wang, Q.; Jiang, L.; Qi, Y.; Wang, S.; Shen, T.; Tang, B.; Gu, Y. UAV Hyperspectral Remote Sensing Image Classification: A Systematic Review. Ieee, J. Sel. Top. Appl. Earth Observ. Remote Sens.
- Burnham, K.P.; Anderson, D.R.; Laake, J.L. Estimation of density from line transect sampling of biological populations. Wildl. Monogr. 1980, 3, 202. [Google Scholar]
- Guerschman, J.P.; Hill, M.J.; Renzullo, L.J.; Barrett, D.J.; Marks, A.S.; Botha, E.J. Estimating fractional cover of photosynthetic vegetation, non-photosynthetic vegetation and bare soil in the Australian tropical savanna region upscaling the EO-1 Hyperion and MODIS sensors. Remote Sens. Environ. 2009, 113, 928–945. [Google Scholar] [CrossRef]
- Verrelst, J.; Halabuk, A.; Atzberger, C.; Hank, T.; Steinhauser, S.; Berger, K. A comprehensive survey on quantifying non-photosynthetic vegetation cover and biomass from imaging spectroscopy. Ecol. Indic. 2023, 155, 110911. [Google Scholar] [CrossRef]
- Ye, F.; Zhou, B. Mangrove Species Classification from Unmanned Aerial Vehicle Hyperspectral Images Using Object-Oriented Methods Based on Feature Combination and Optimization. Sensors. 2024, 24, 4108. [Google Scholar] [CrossRef] [PubMed]
- Drǎguţ, L.; Tiede, D.; Levick, S.R. ESP: a tool to estimate scale parameter for multiresolution image segmentation of remotely sensed data. Int. J. Geogr. Inf. Sci. 2010, 24, 859–871. [Google Scholar] [CrossRef]
- Congalton, R.G. A review of assessing the accuracy of classifications of remotely sensed data. Remote Sens. Environ. 1991, 37, 35–46. [Google Scholar] [CrossRef]
- Adegun, A.A.; Viriri, S.; Tapamo, J. Review of deep learning methods for remote sensing satellite images classification: experimental survey and comparative analysis. J. Big Data. 2023, 10, 93. [Google Scholar] [CrossRef]
- Deng, X.; Liu, Q.; Deng, Y.; Mahadevan, S. An improved method to construct basic probability assignment based on the confusion matrix for classification problem. Inf. Sci. 2016, 340, 250–261. [Google Scholar] [CrossRef]
- Foody, G.M. Explaining the unsuitability of the kappa coefficient in the assessment and comparison of the accuracy of thematic maps obtained by image classification. Remote Sens. Environ. 2020, 239, 111630. [Google Scholar] [CrossRef]
- Karunasingha, D.S.K. Root mean square error or mean absolute error? Use their ratio as well. Inf. Sci. 2022, 585, 609–629. [Google Scholar] [CrossRef]
- He, T.; Chen, J.; Kang, L.; Zhu, Q. Evaluation of Global-Scale and Local-Scale Optimized Segmentation Algorithms in GEOBIA with SAM on Land Use and Land Cover. Ieee J. Sel. Top. Appl. Earth Observ. Remote Sens. 2024. [Google Scholar] [CrossRef]
Figure 1.
Overview of the research region. (a) Map of the location of the research area, (b) photograph of the research area, and (c) orthomosaic image of the sub-areas captured by the UAV.
Figure 1.
Overview of the research region. (a) Map of the location of the research area, (b) photograph of the research area, and (c) orthomosaic image of the sub-areas captured by the UAV.
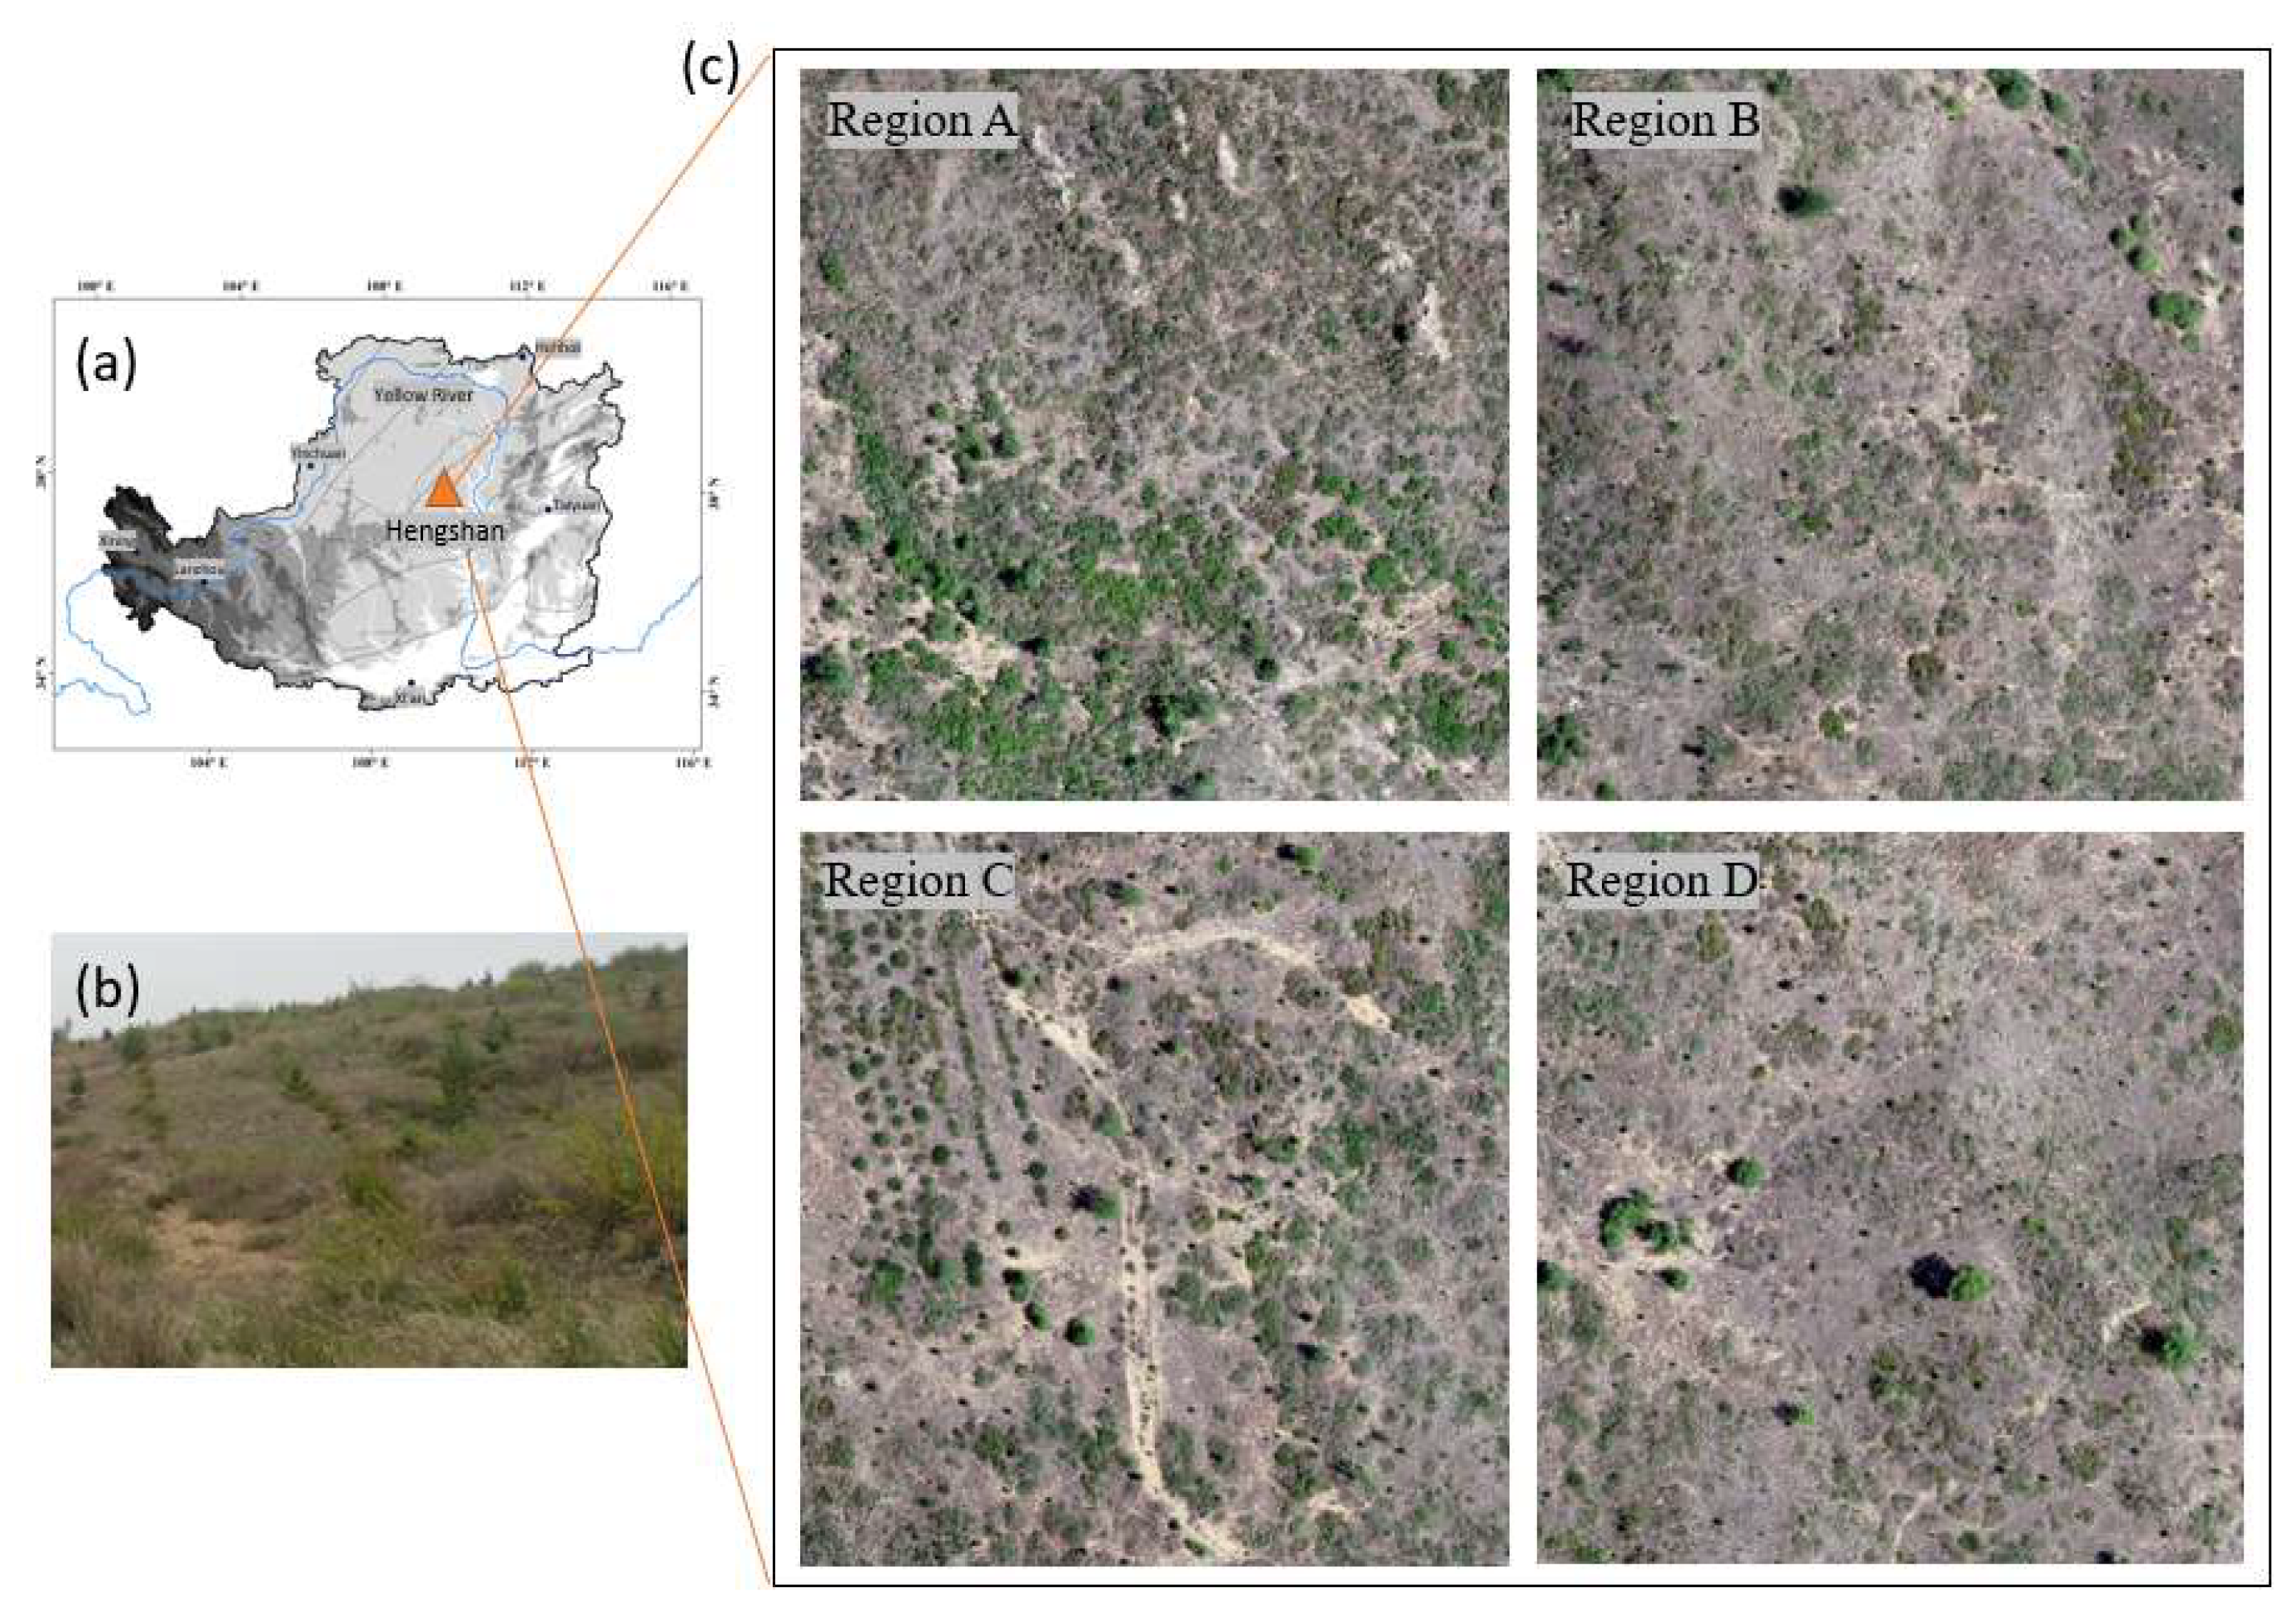
Figure 2.
Segmentation outcomes for various combinations of shape and compactness factors in the Hengshan grassland.
Figure 2.
Segmentation outcomes for various combinations of shape and compactness factors in the Hengshan grassland.
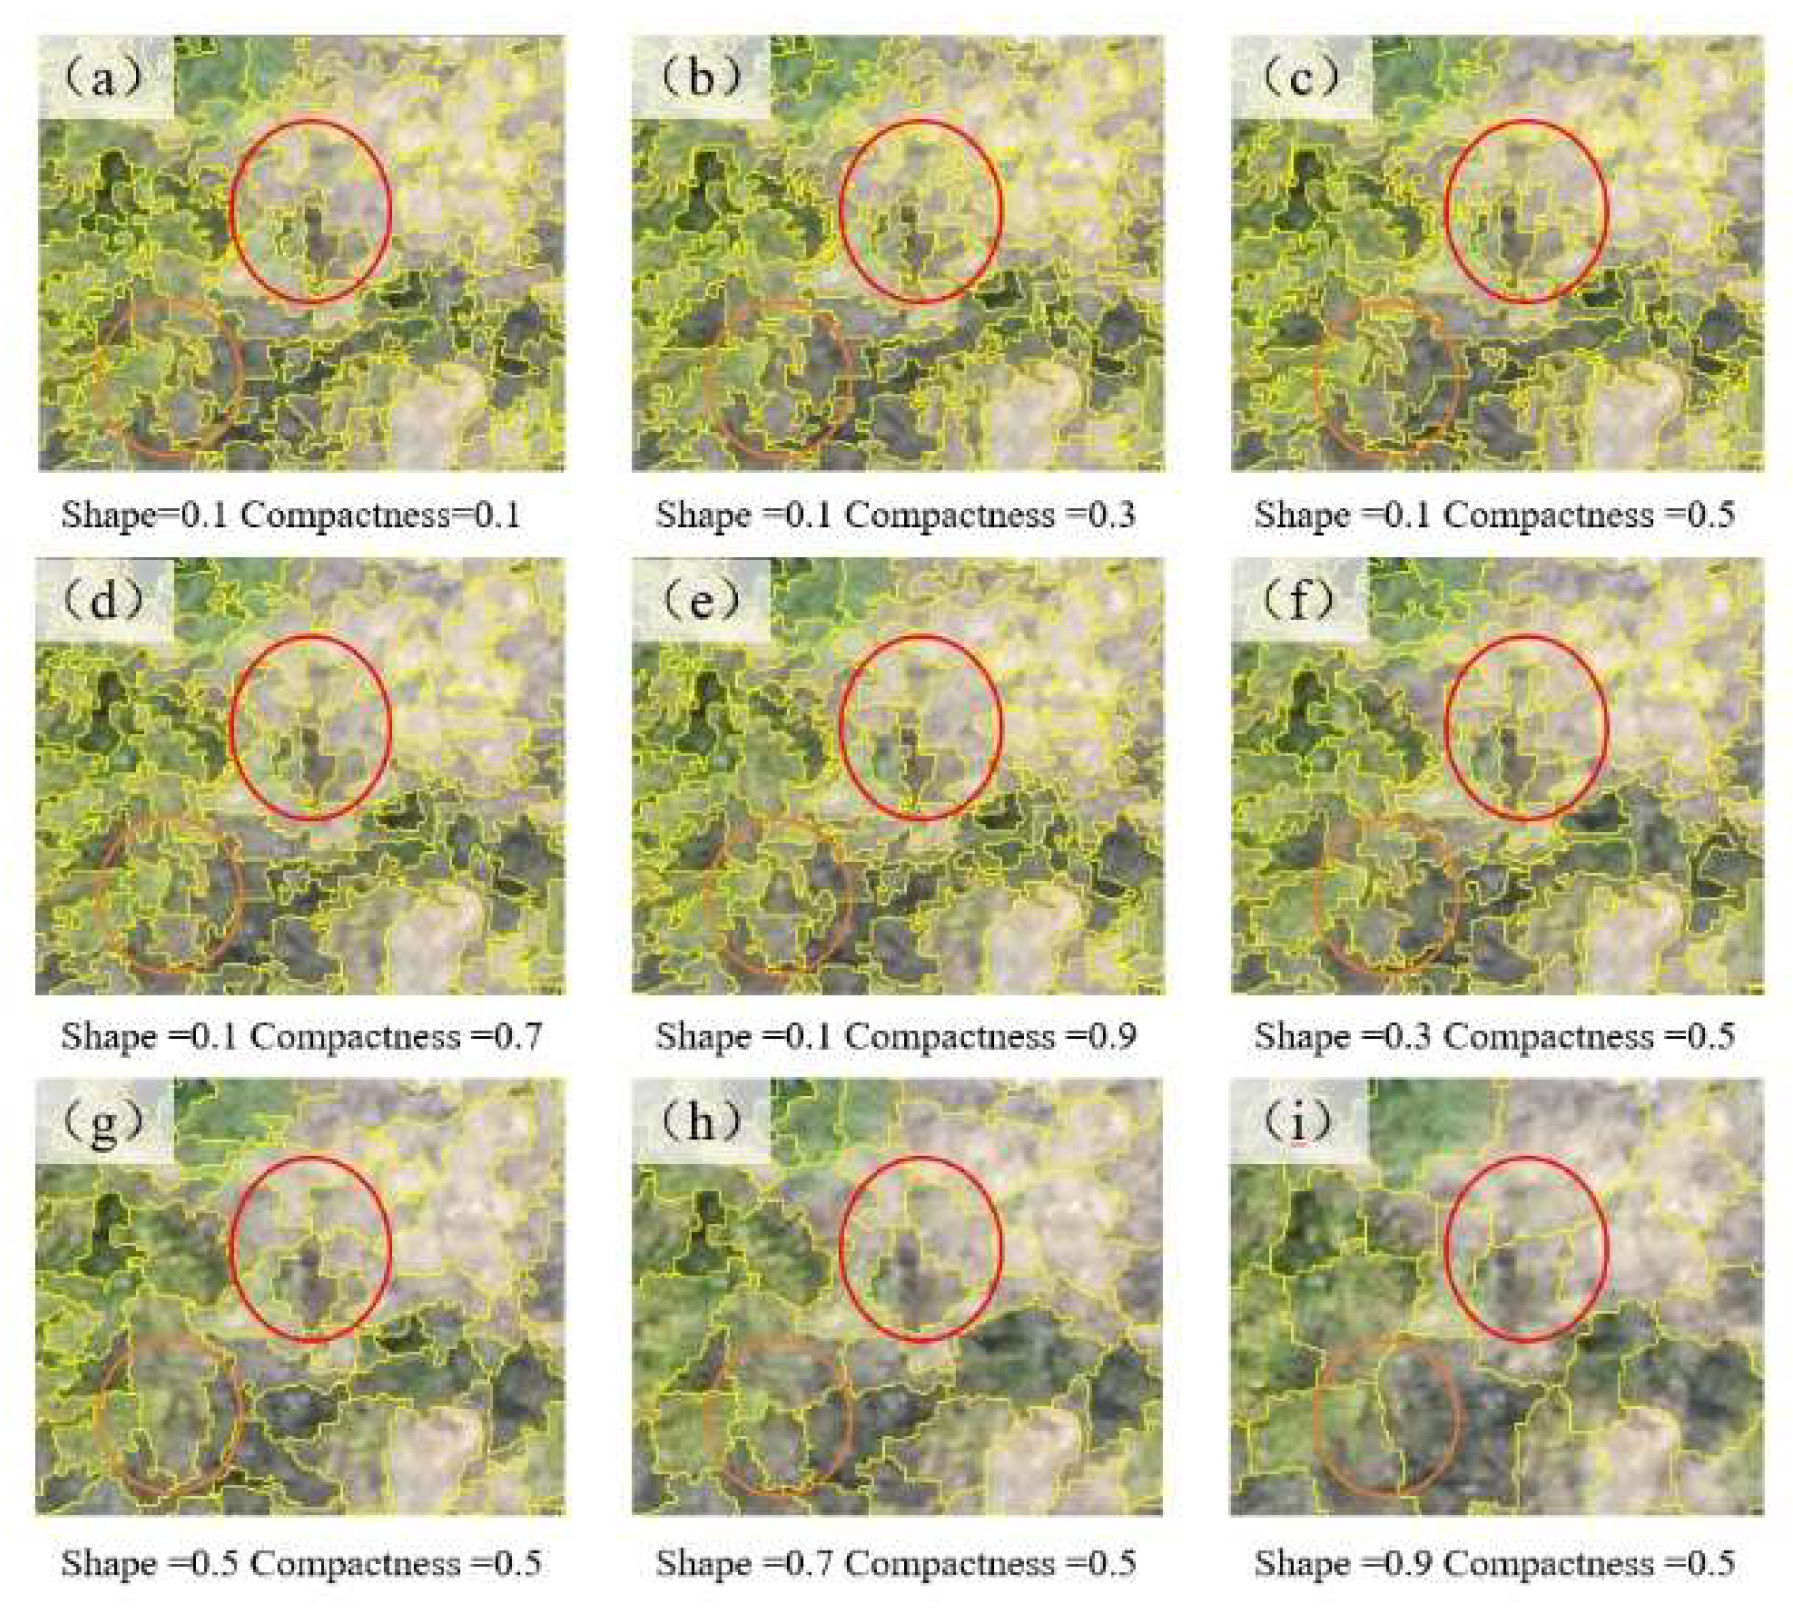
Figure 3.
Local variance and rate of change of the variance in UAV images of the Hengshan grassland.
Figure 3.
Local variance and rate of change of the variance in UAV images of the Hengshan grassland.
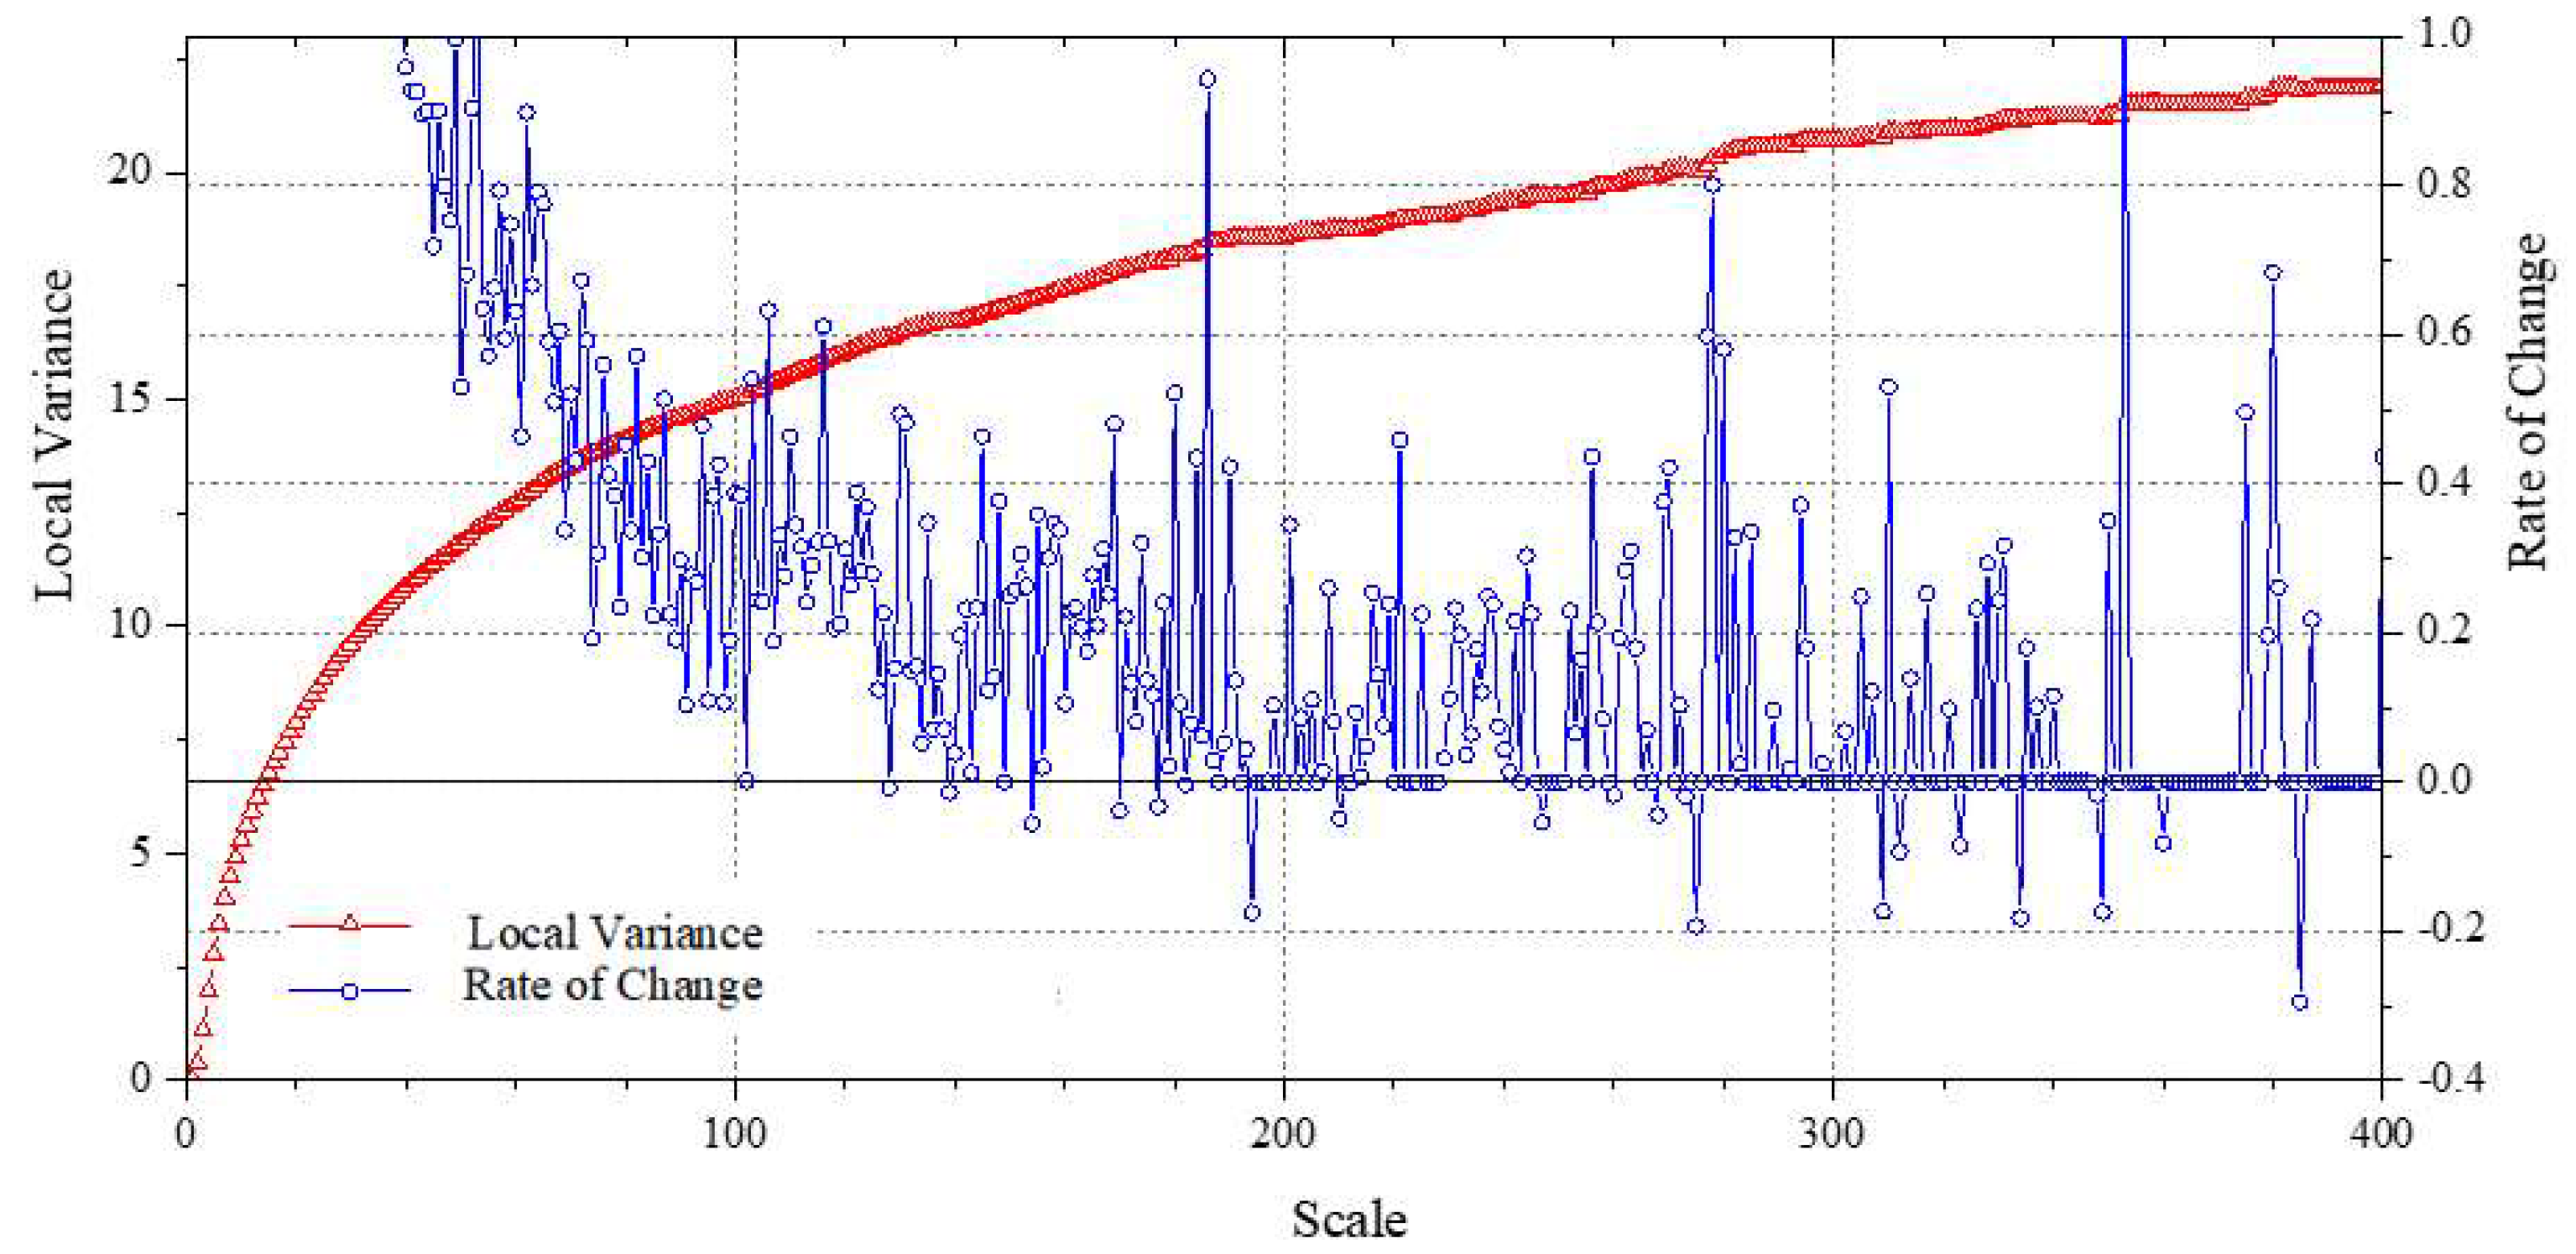
Figure 4.
Ranking of the importance of the features in the UAV images.
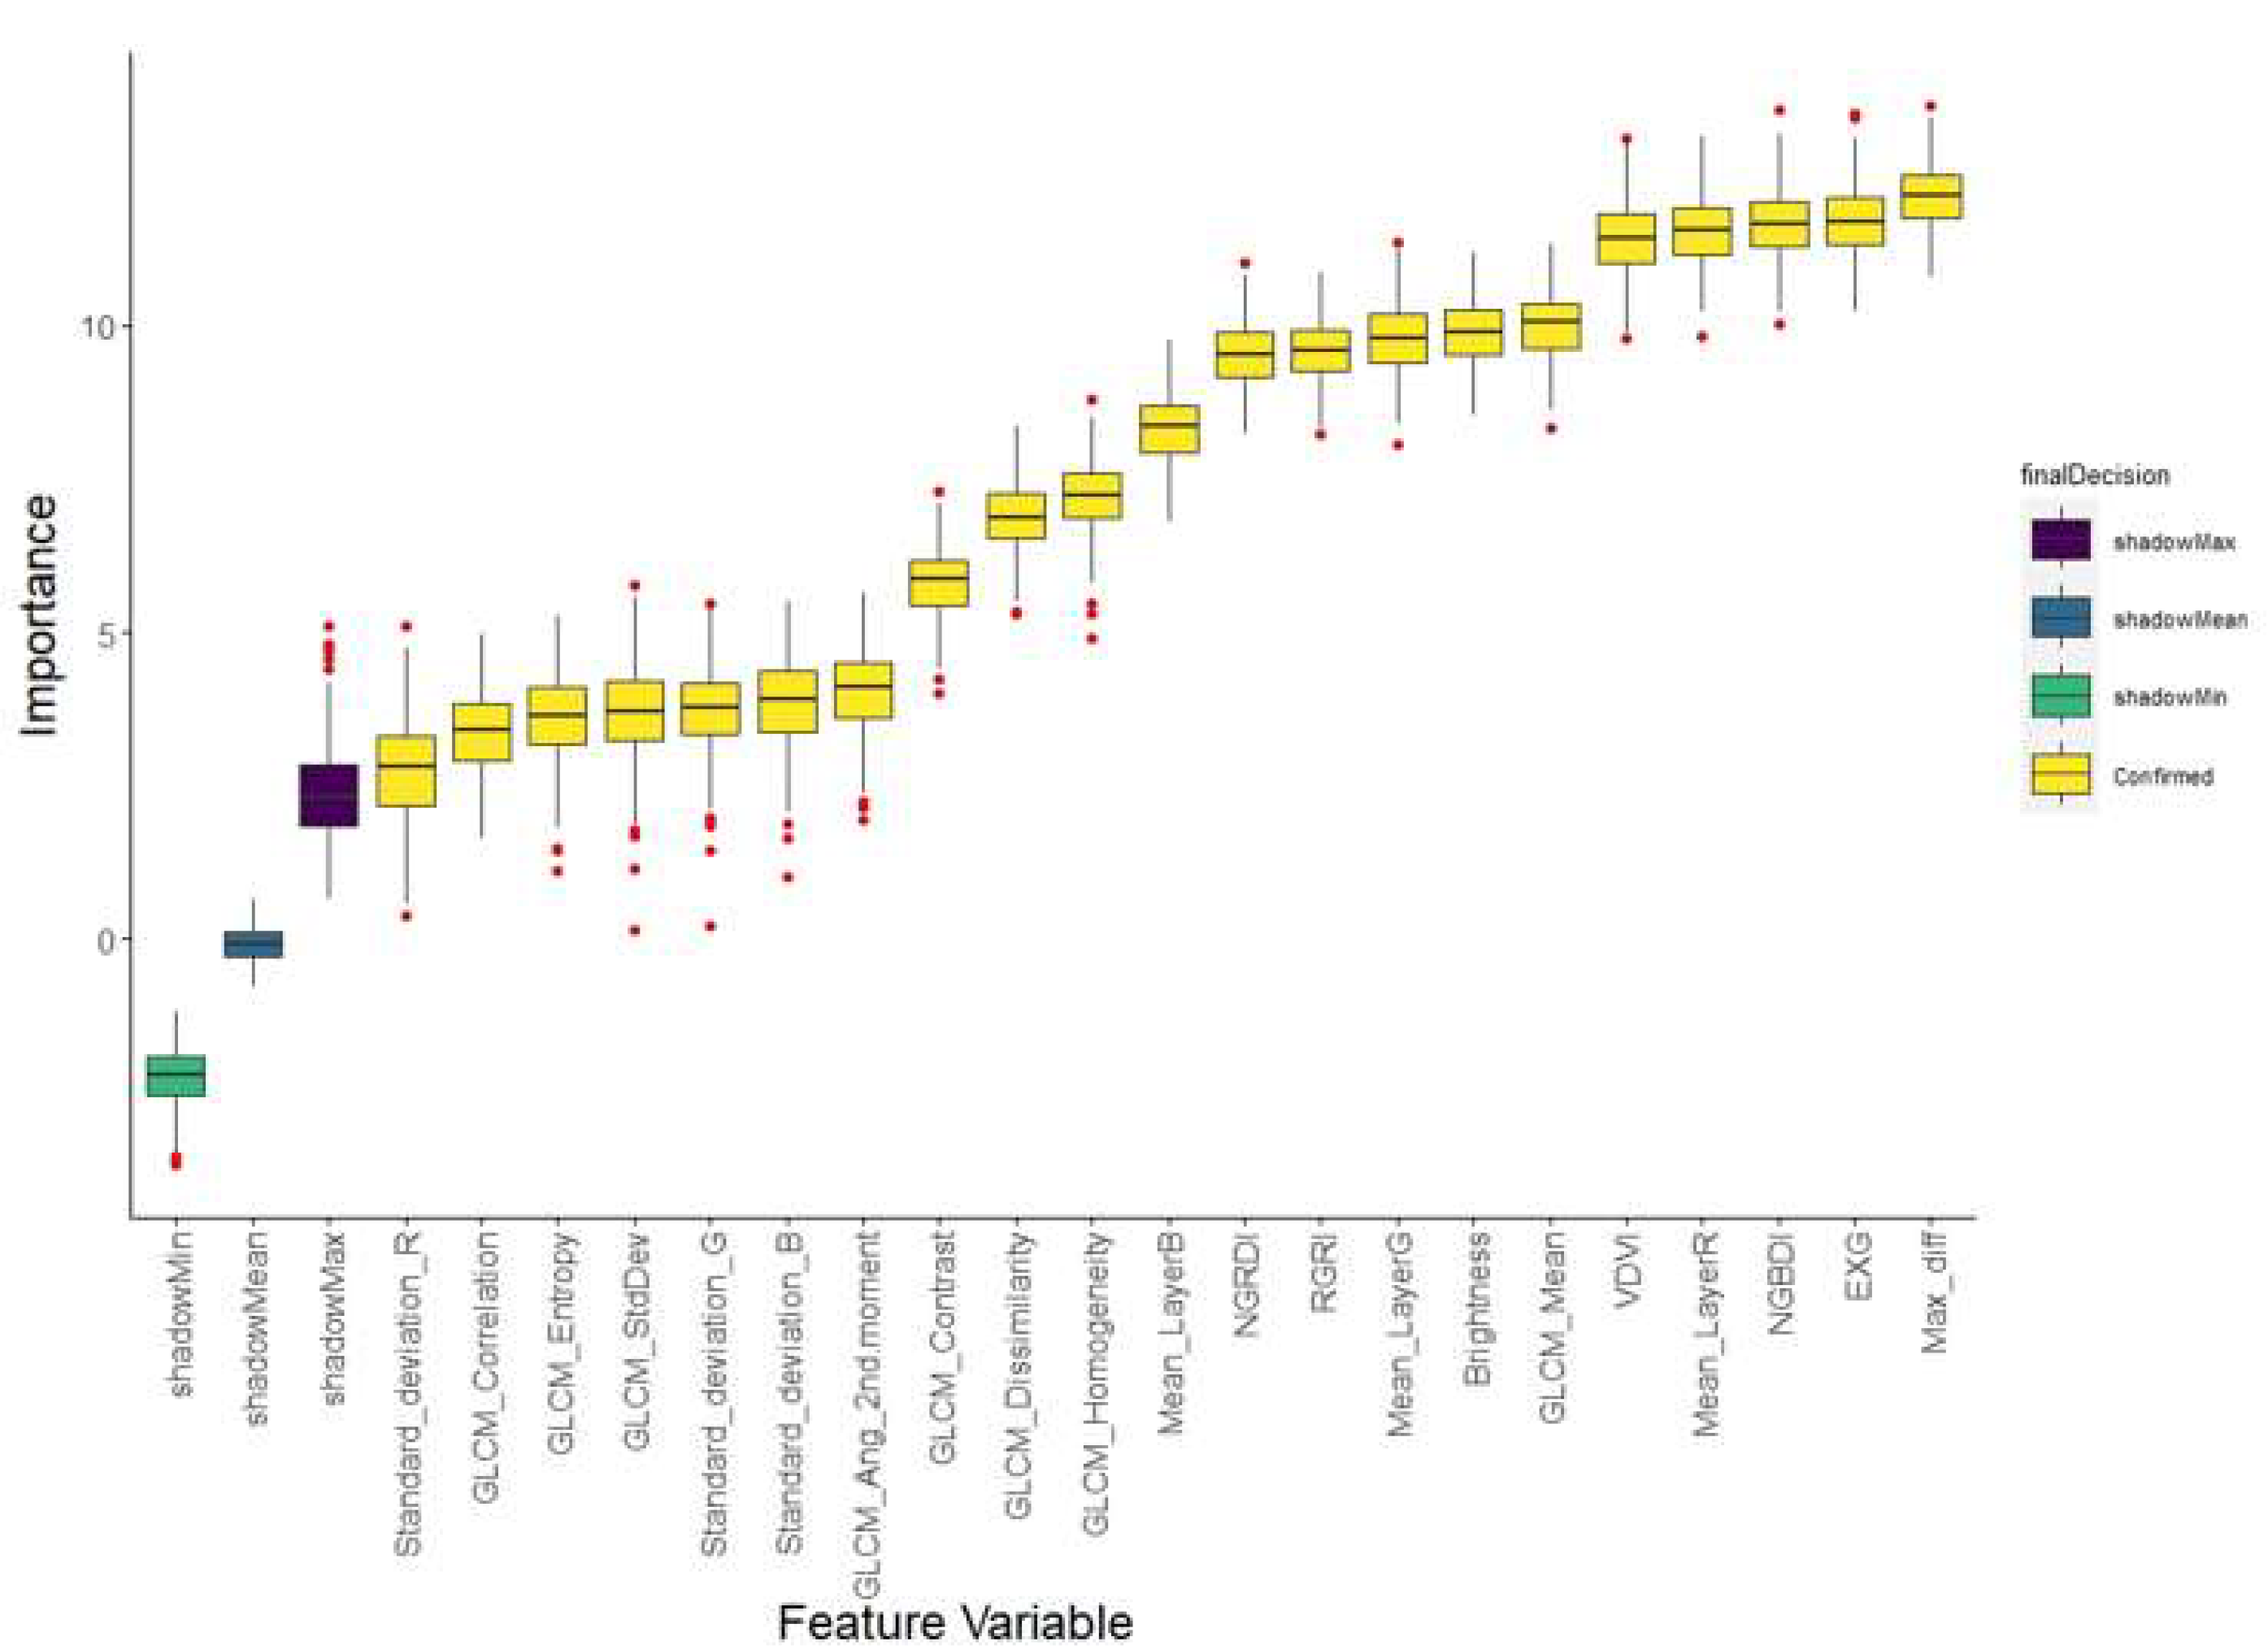
Figure 5.
PV and NPV extraction framework for a typical grassland plot in Hengshan.
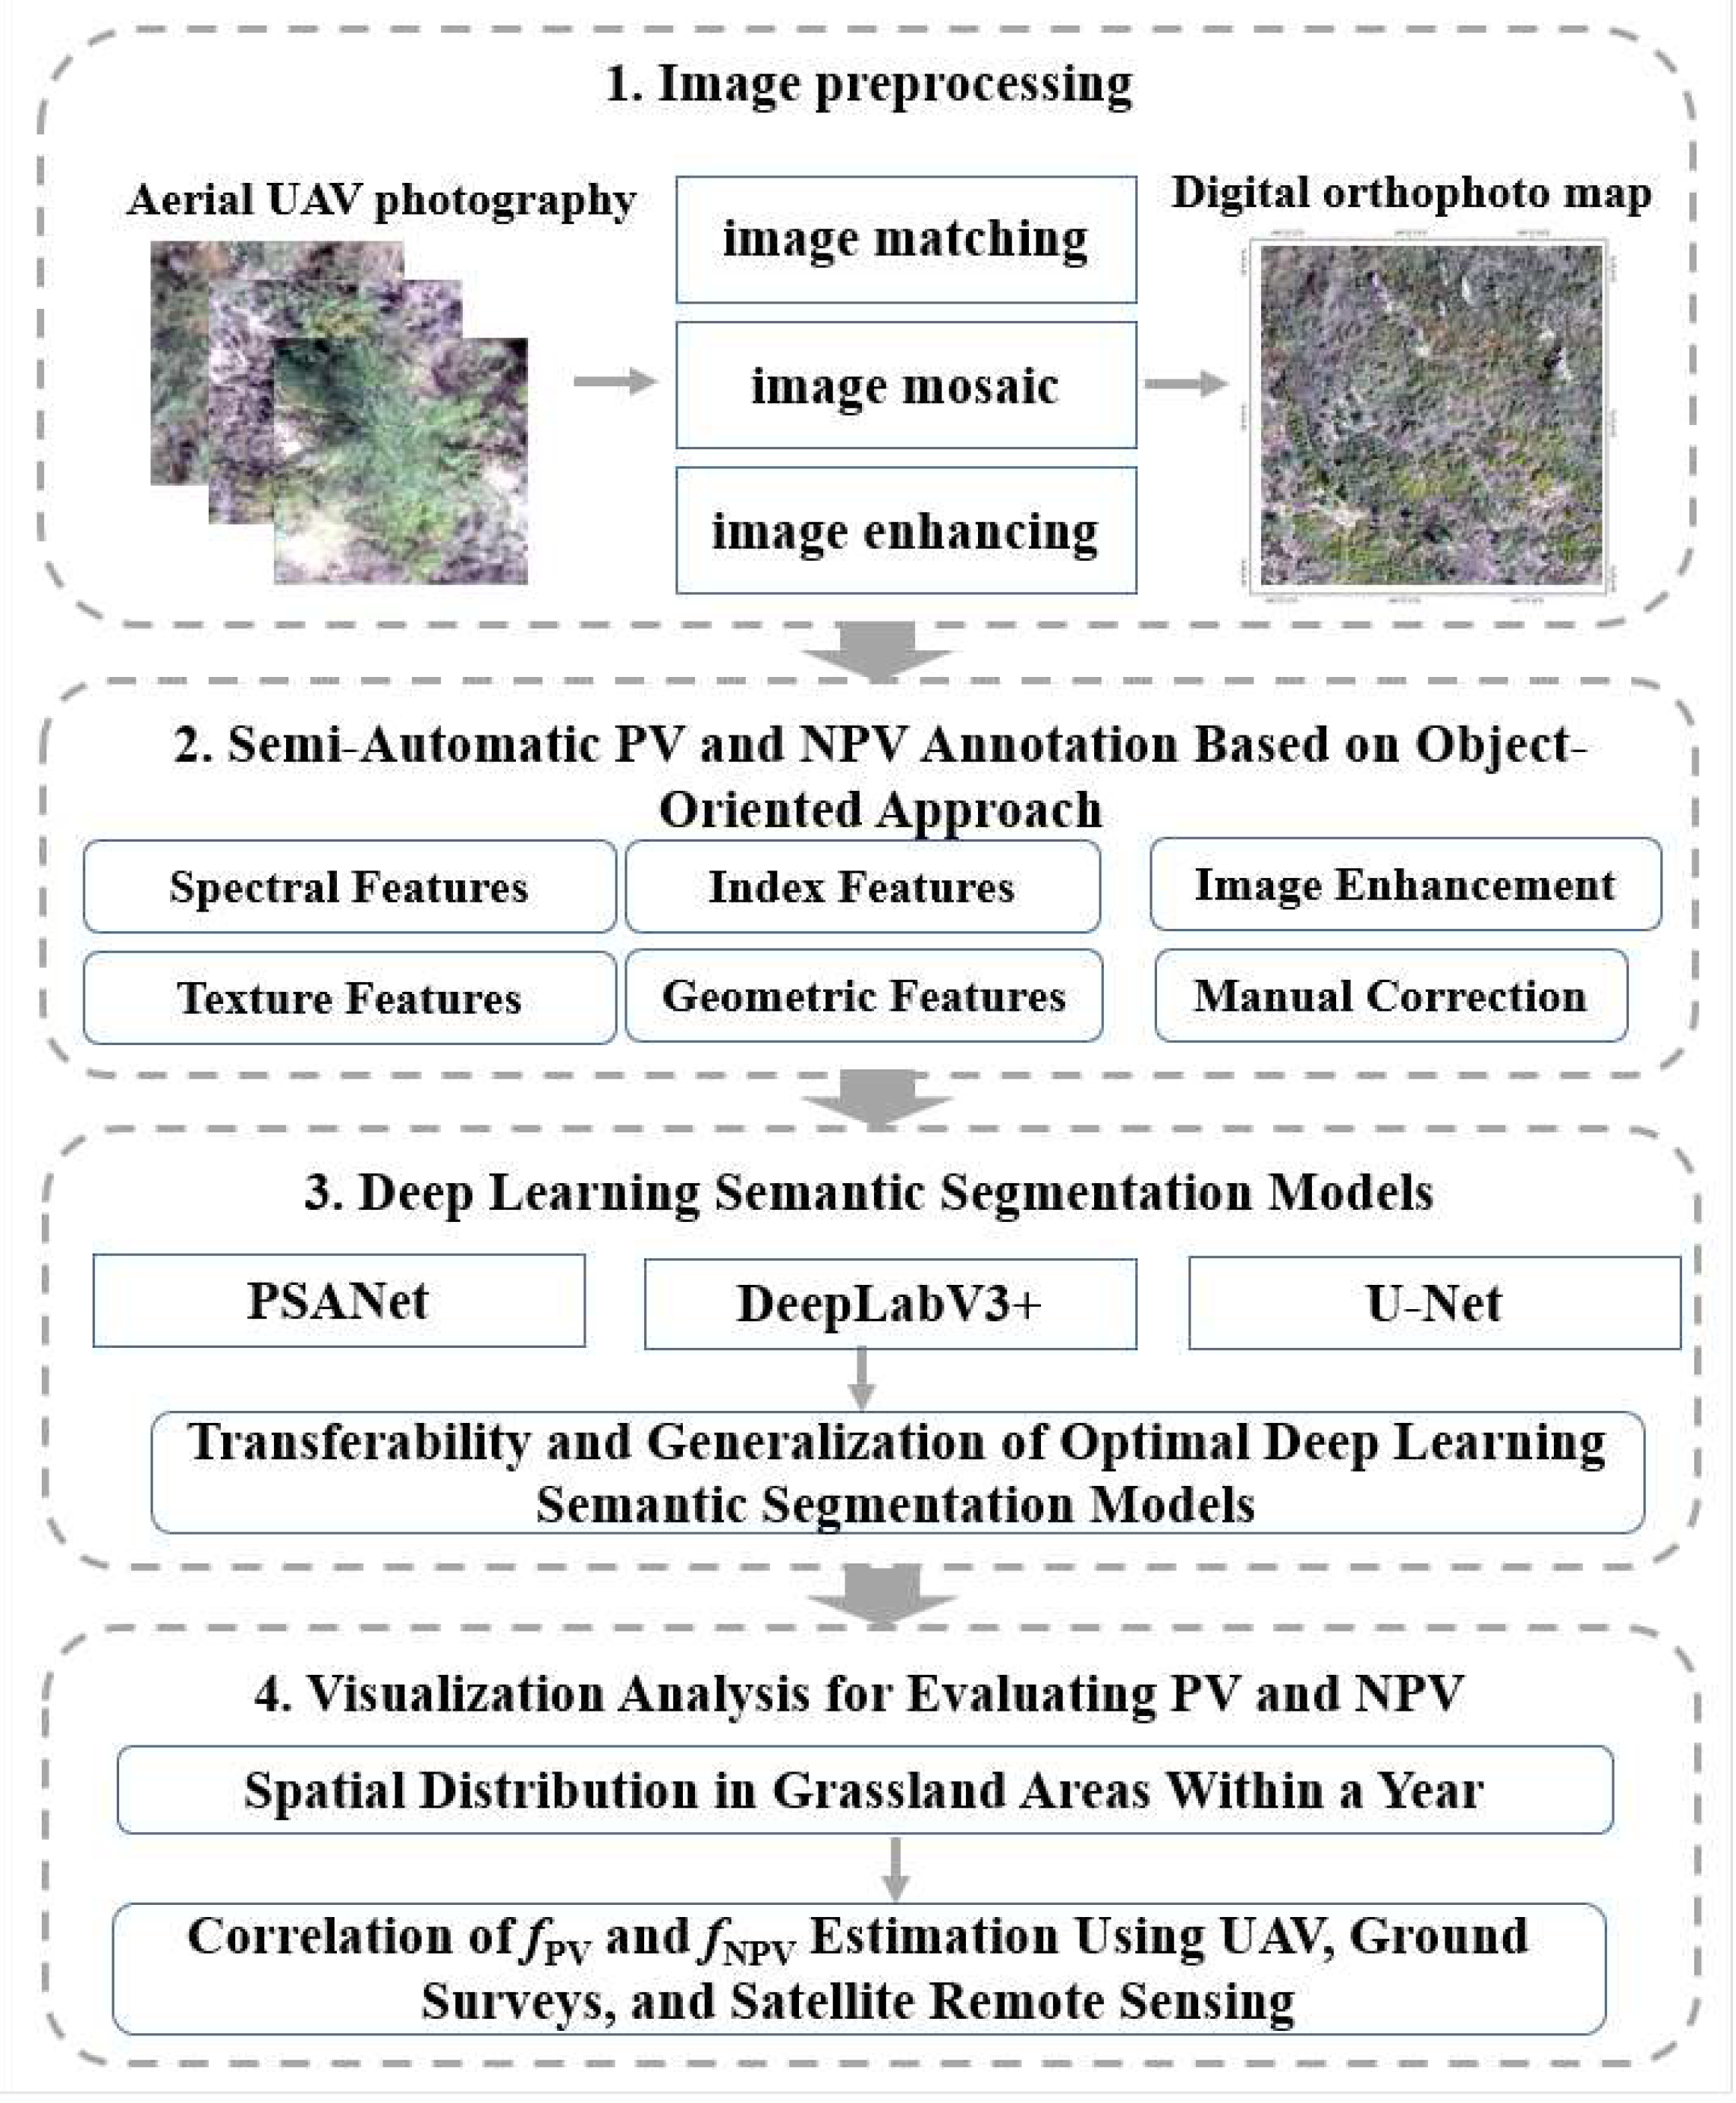
Figure 6.
Architecture of the PSPNet network model.
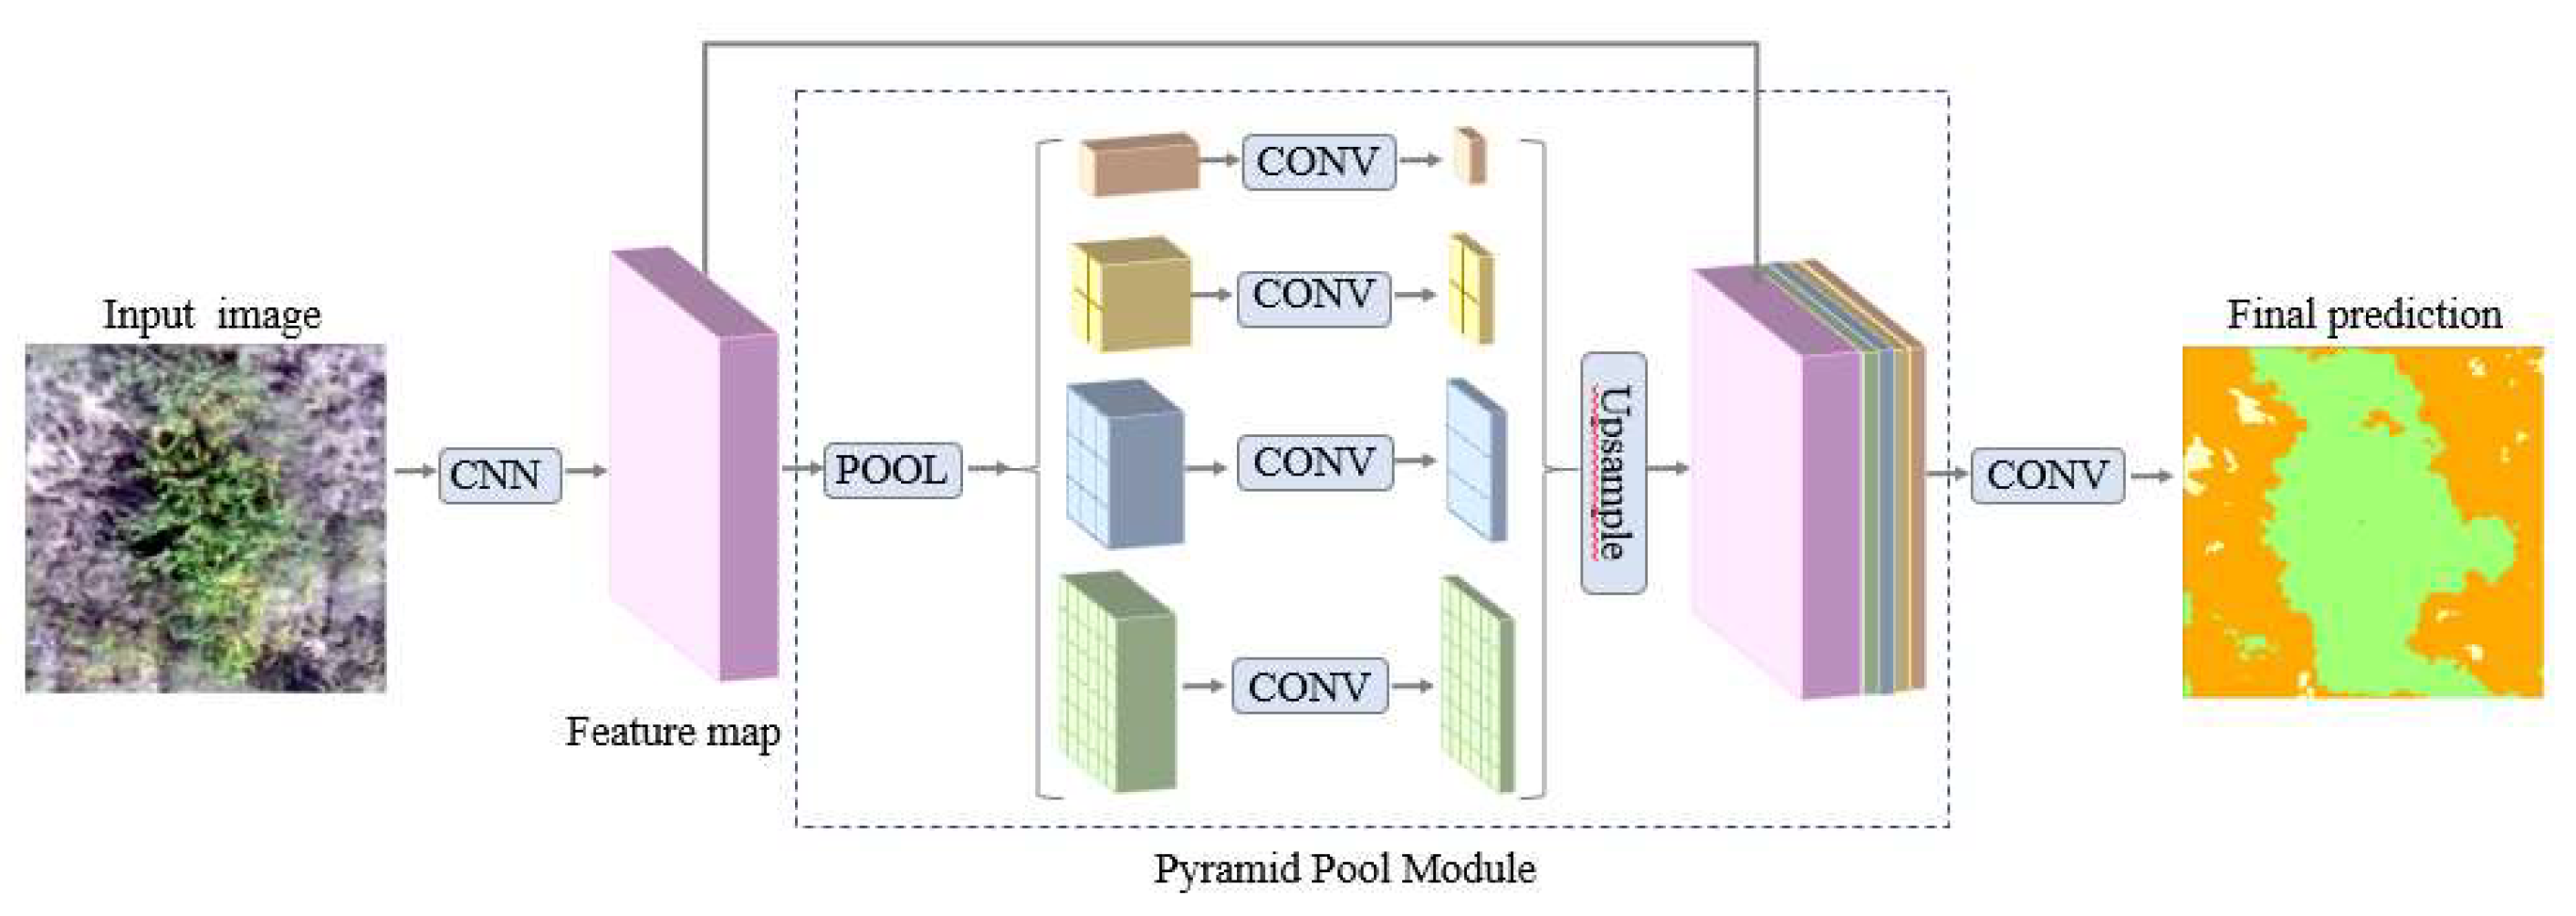
Figure 7.
Architecture of the DeepLabV3+ network model.
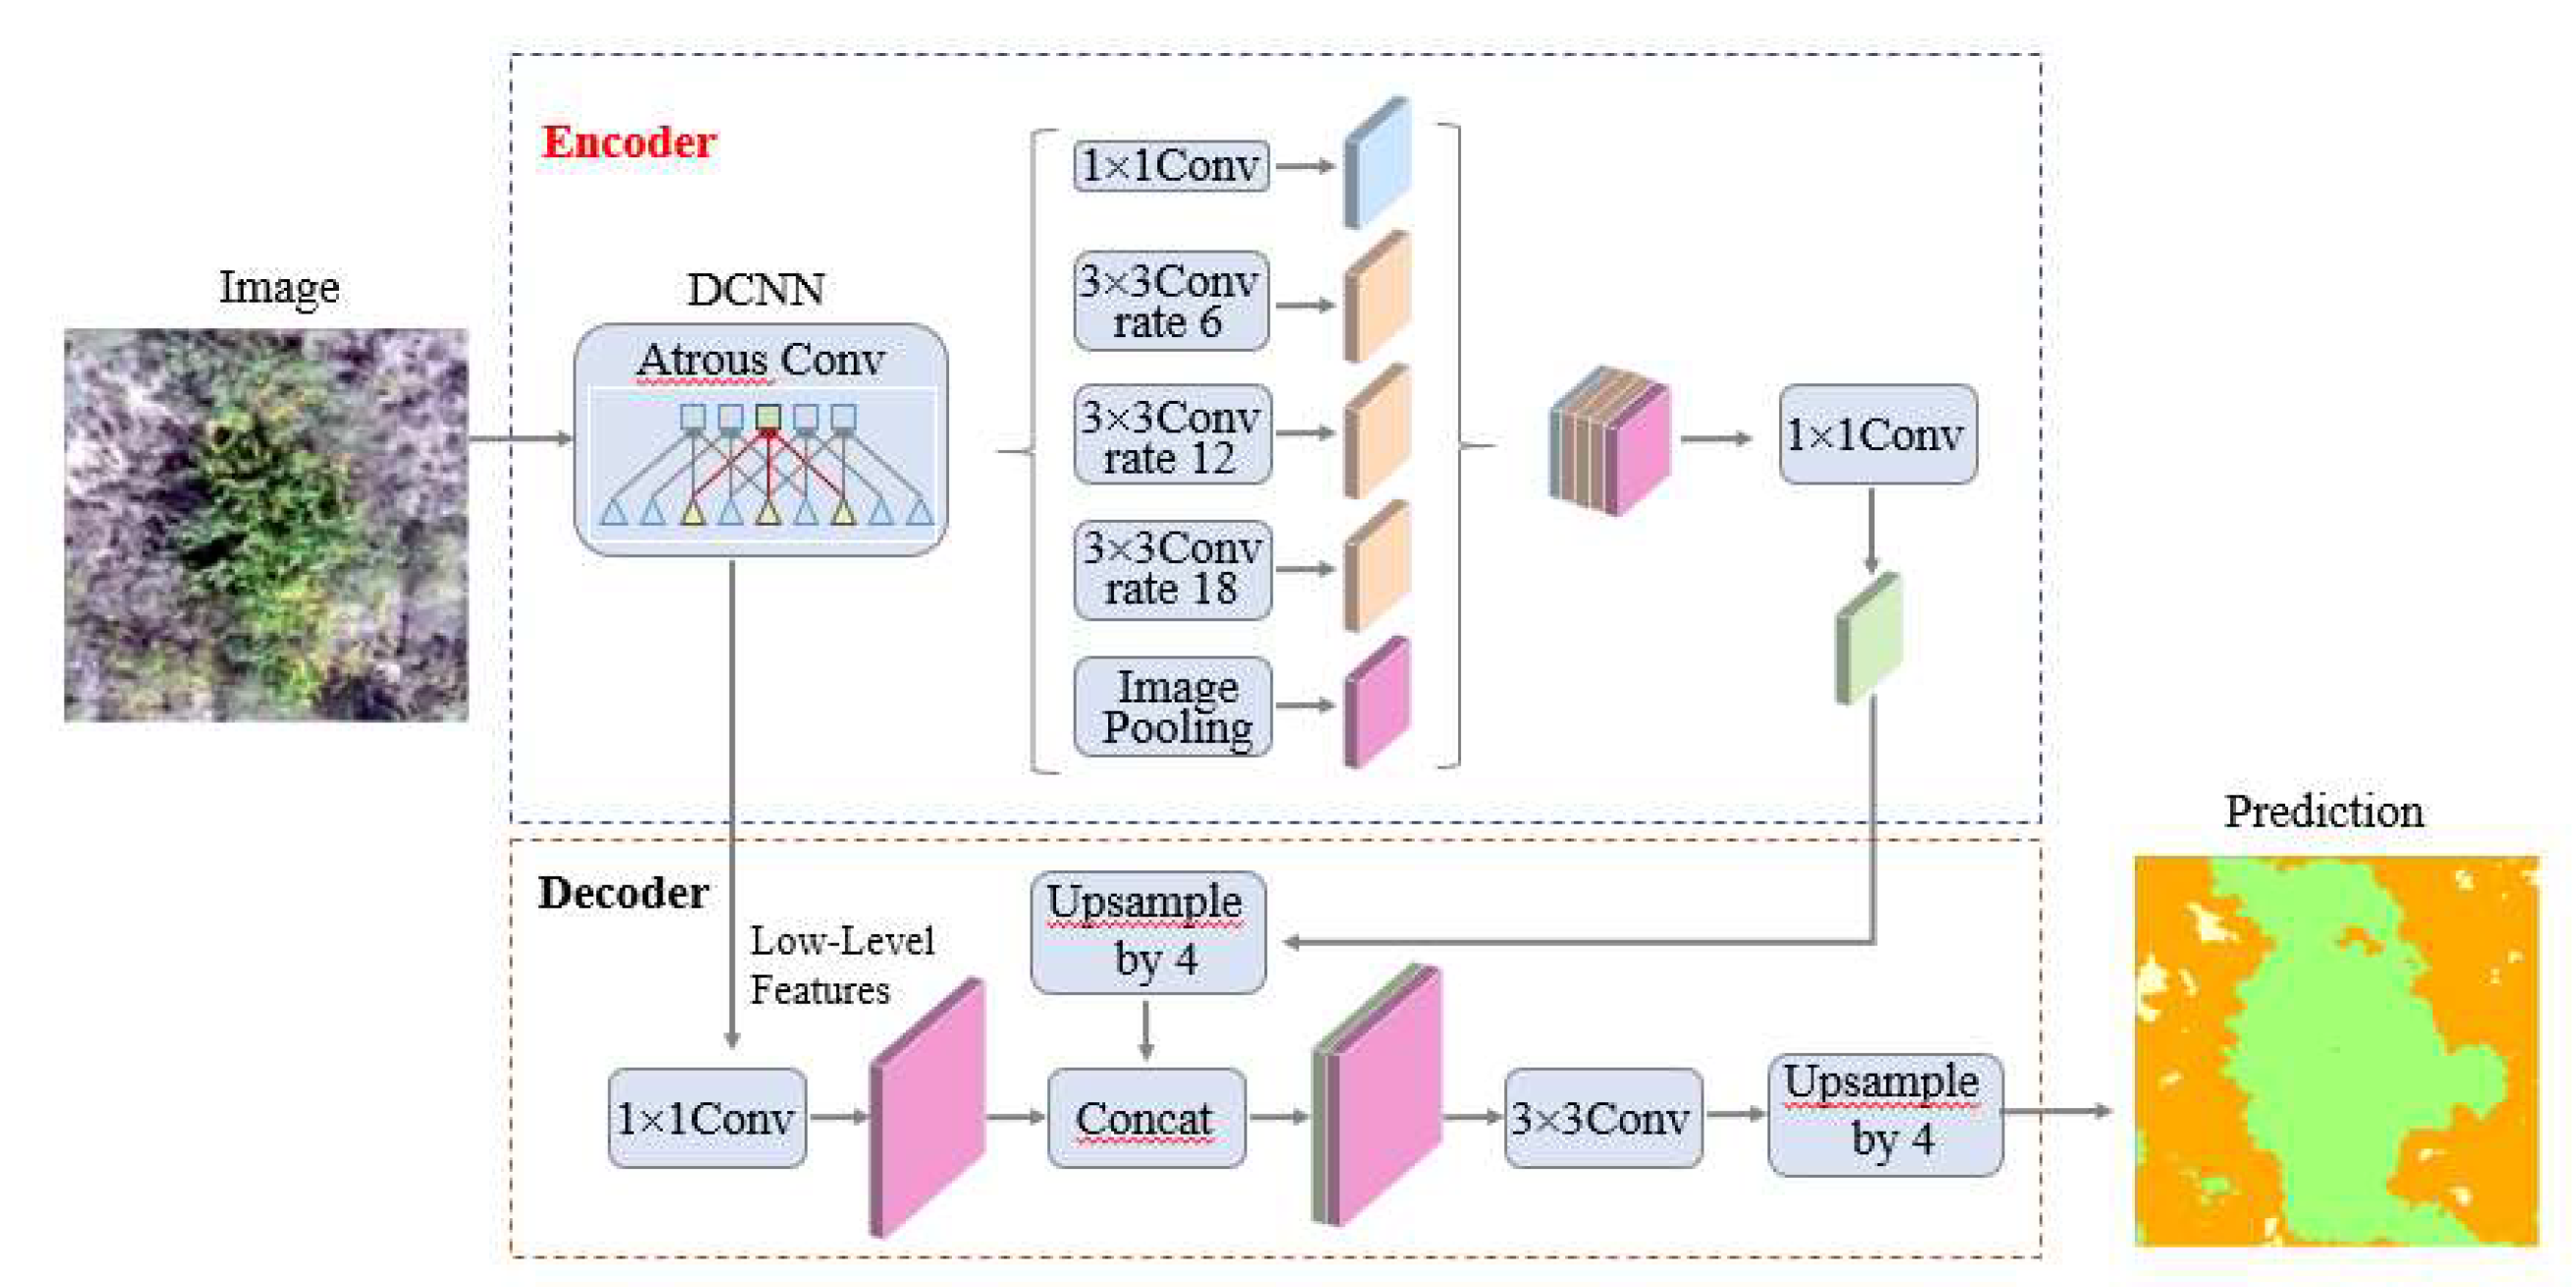
Figure 8.
Architecture of the U-Net network model.
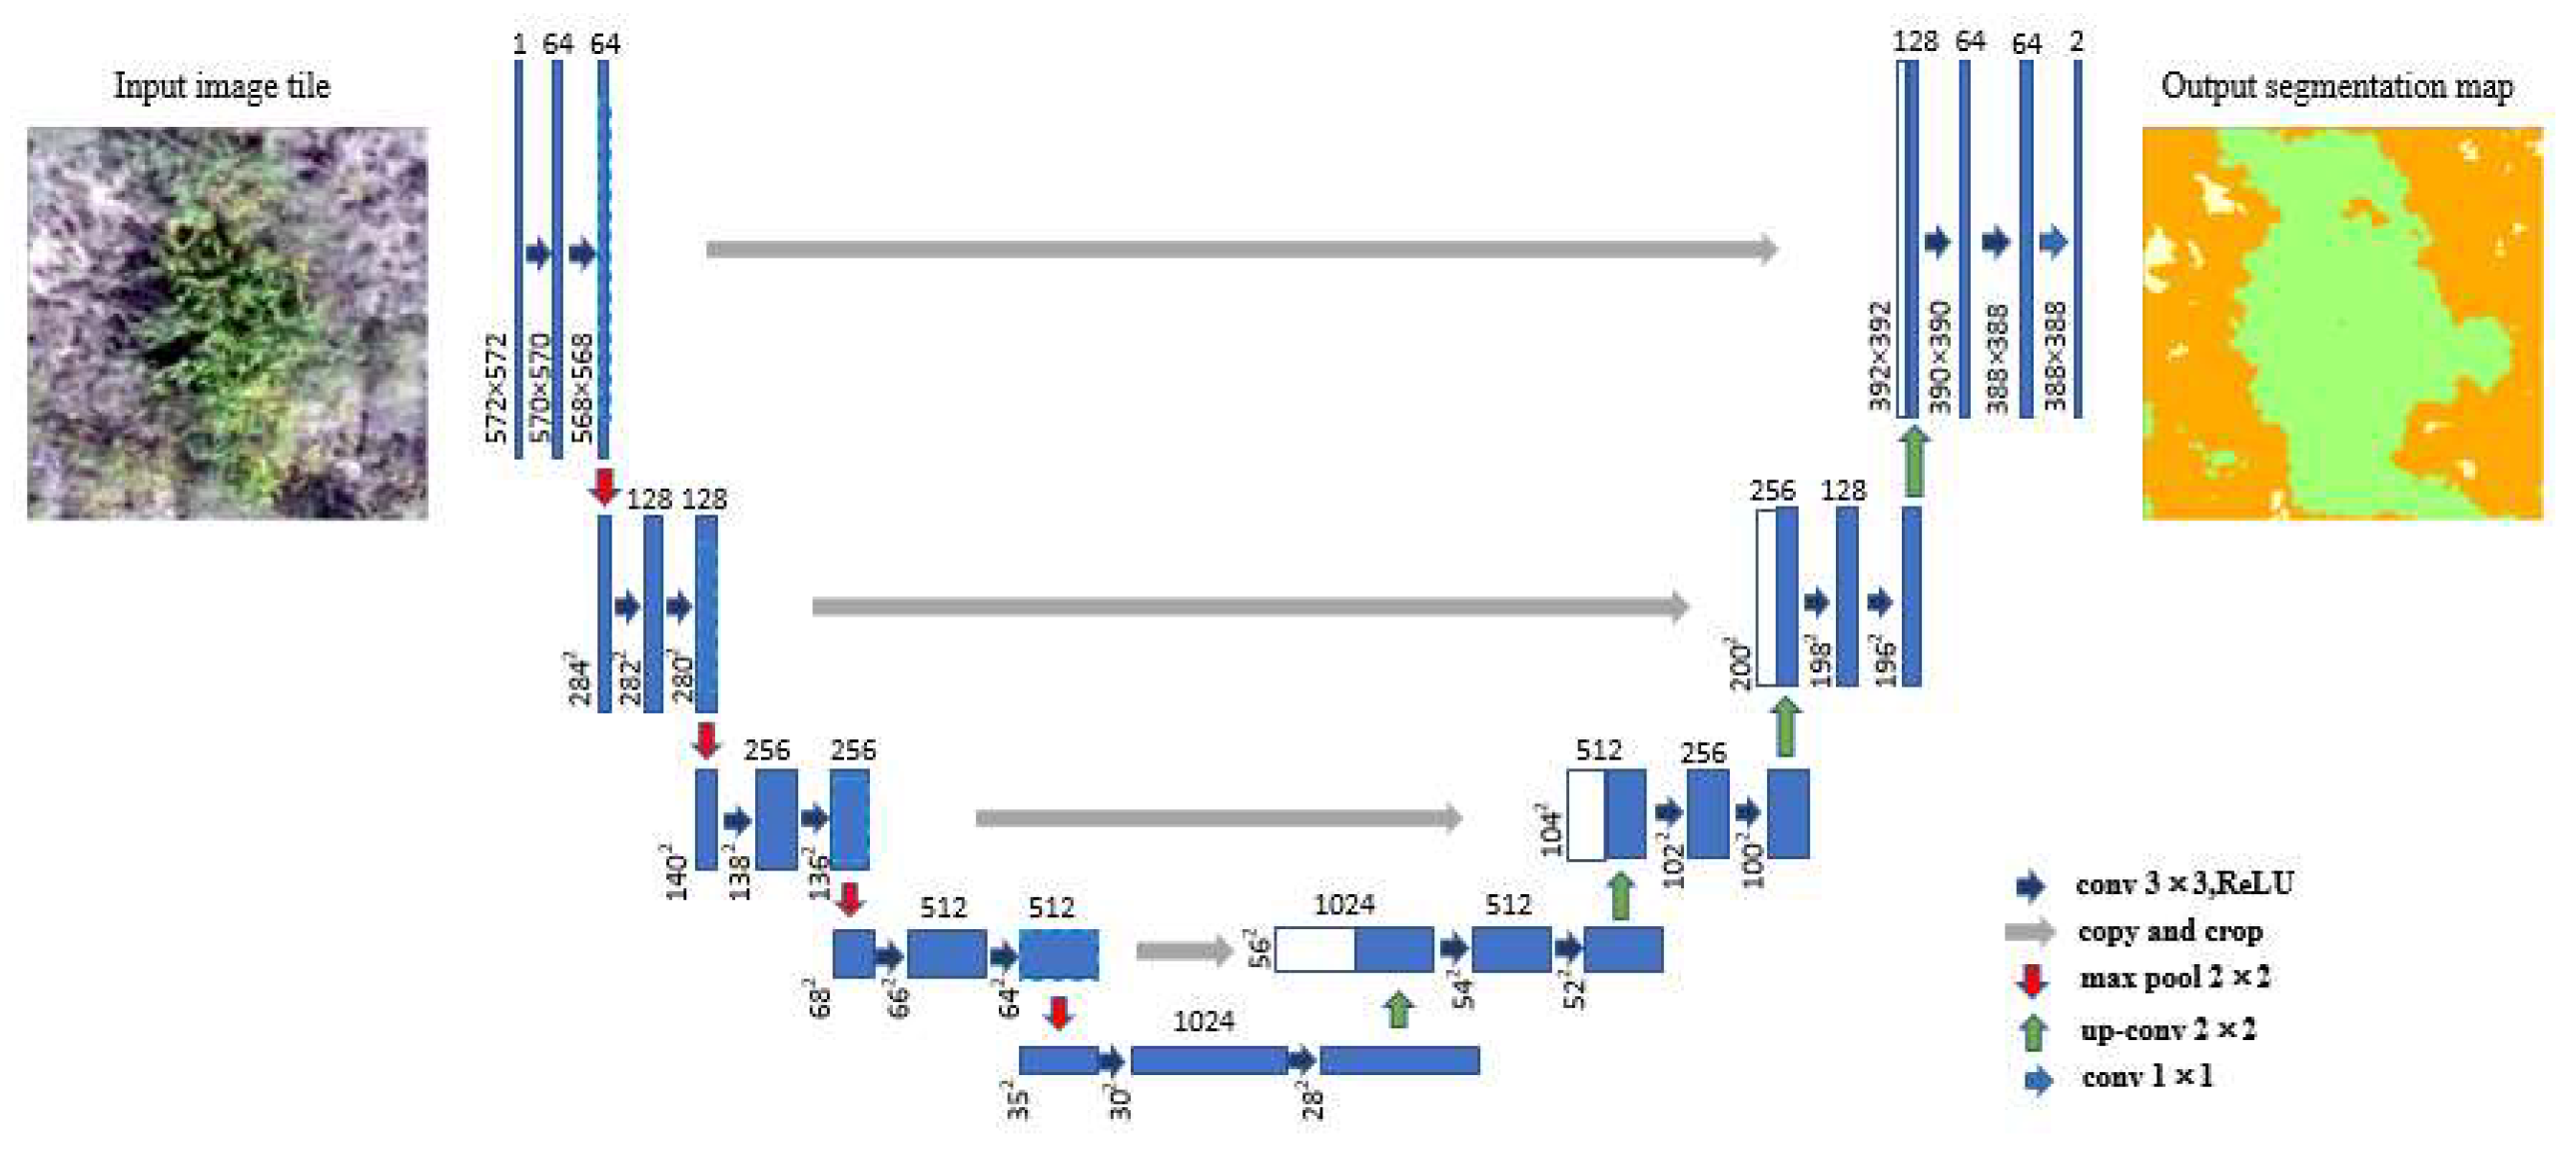
Figure 9.
Results of recognition of region A in the Hengshan grassland using different semantic segmentation models.
Figure 9.
Results of recognition of region A in the Hengshan grassland using different semantic segmentation models.
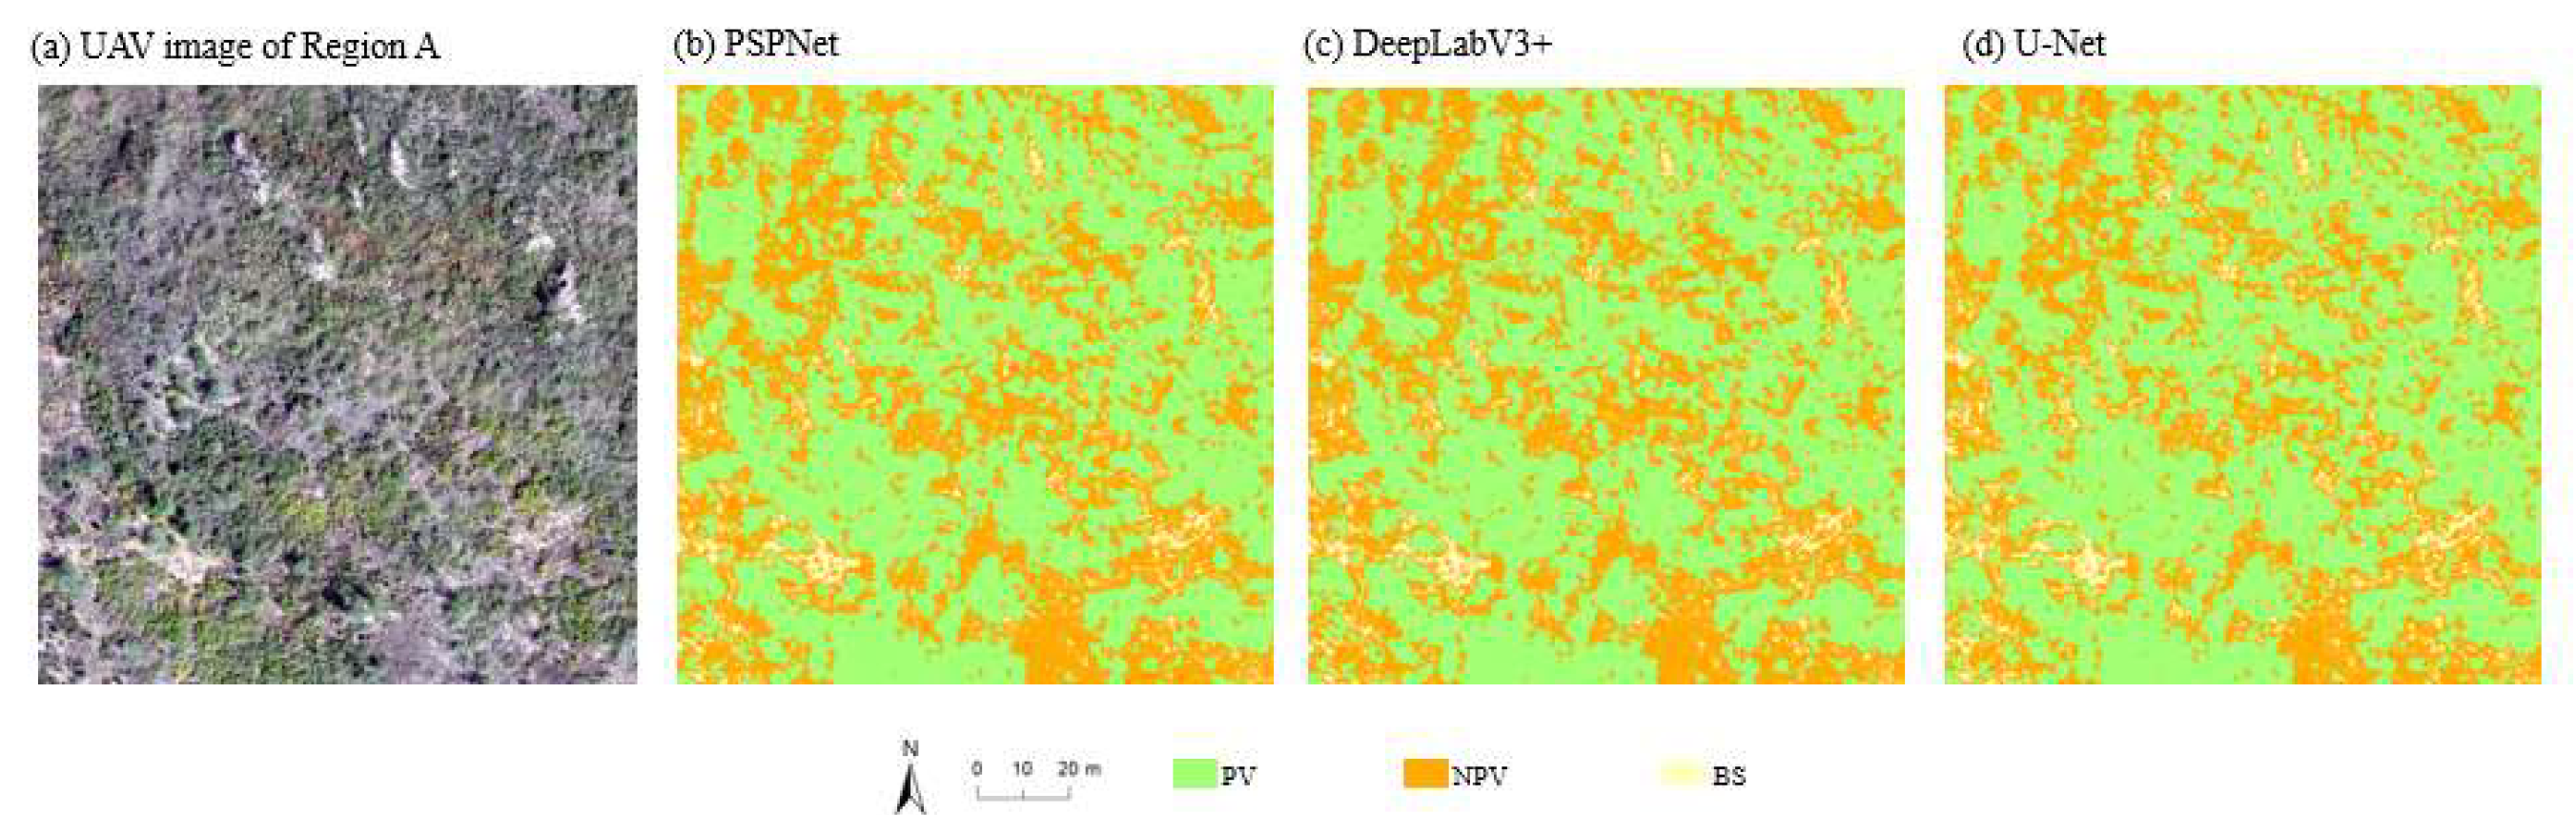
Figure 10.
Recognition results of the different semantic segmentation models for region A of the Hengshan grassland.
Figure 10.
Recognition results of the different semantic segmentation models for region A of the Hengshan grassland.
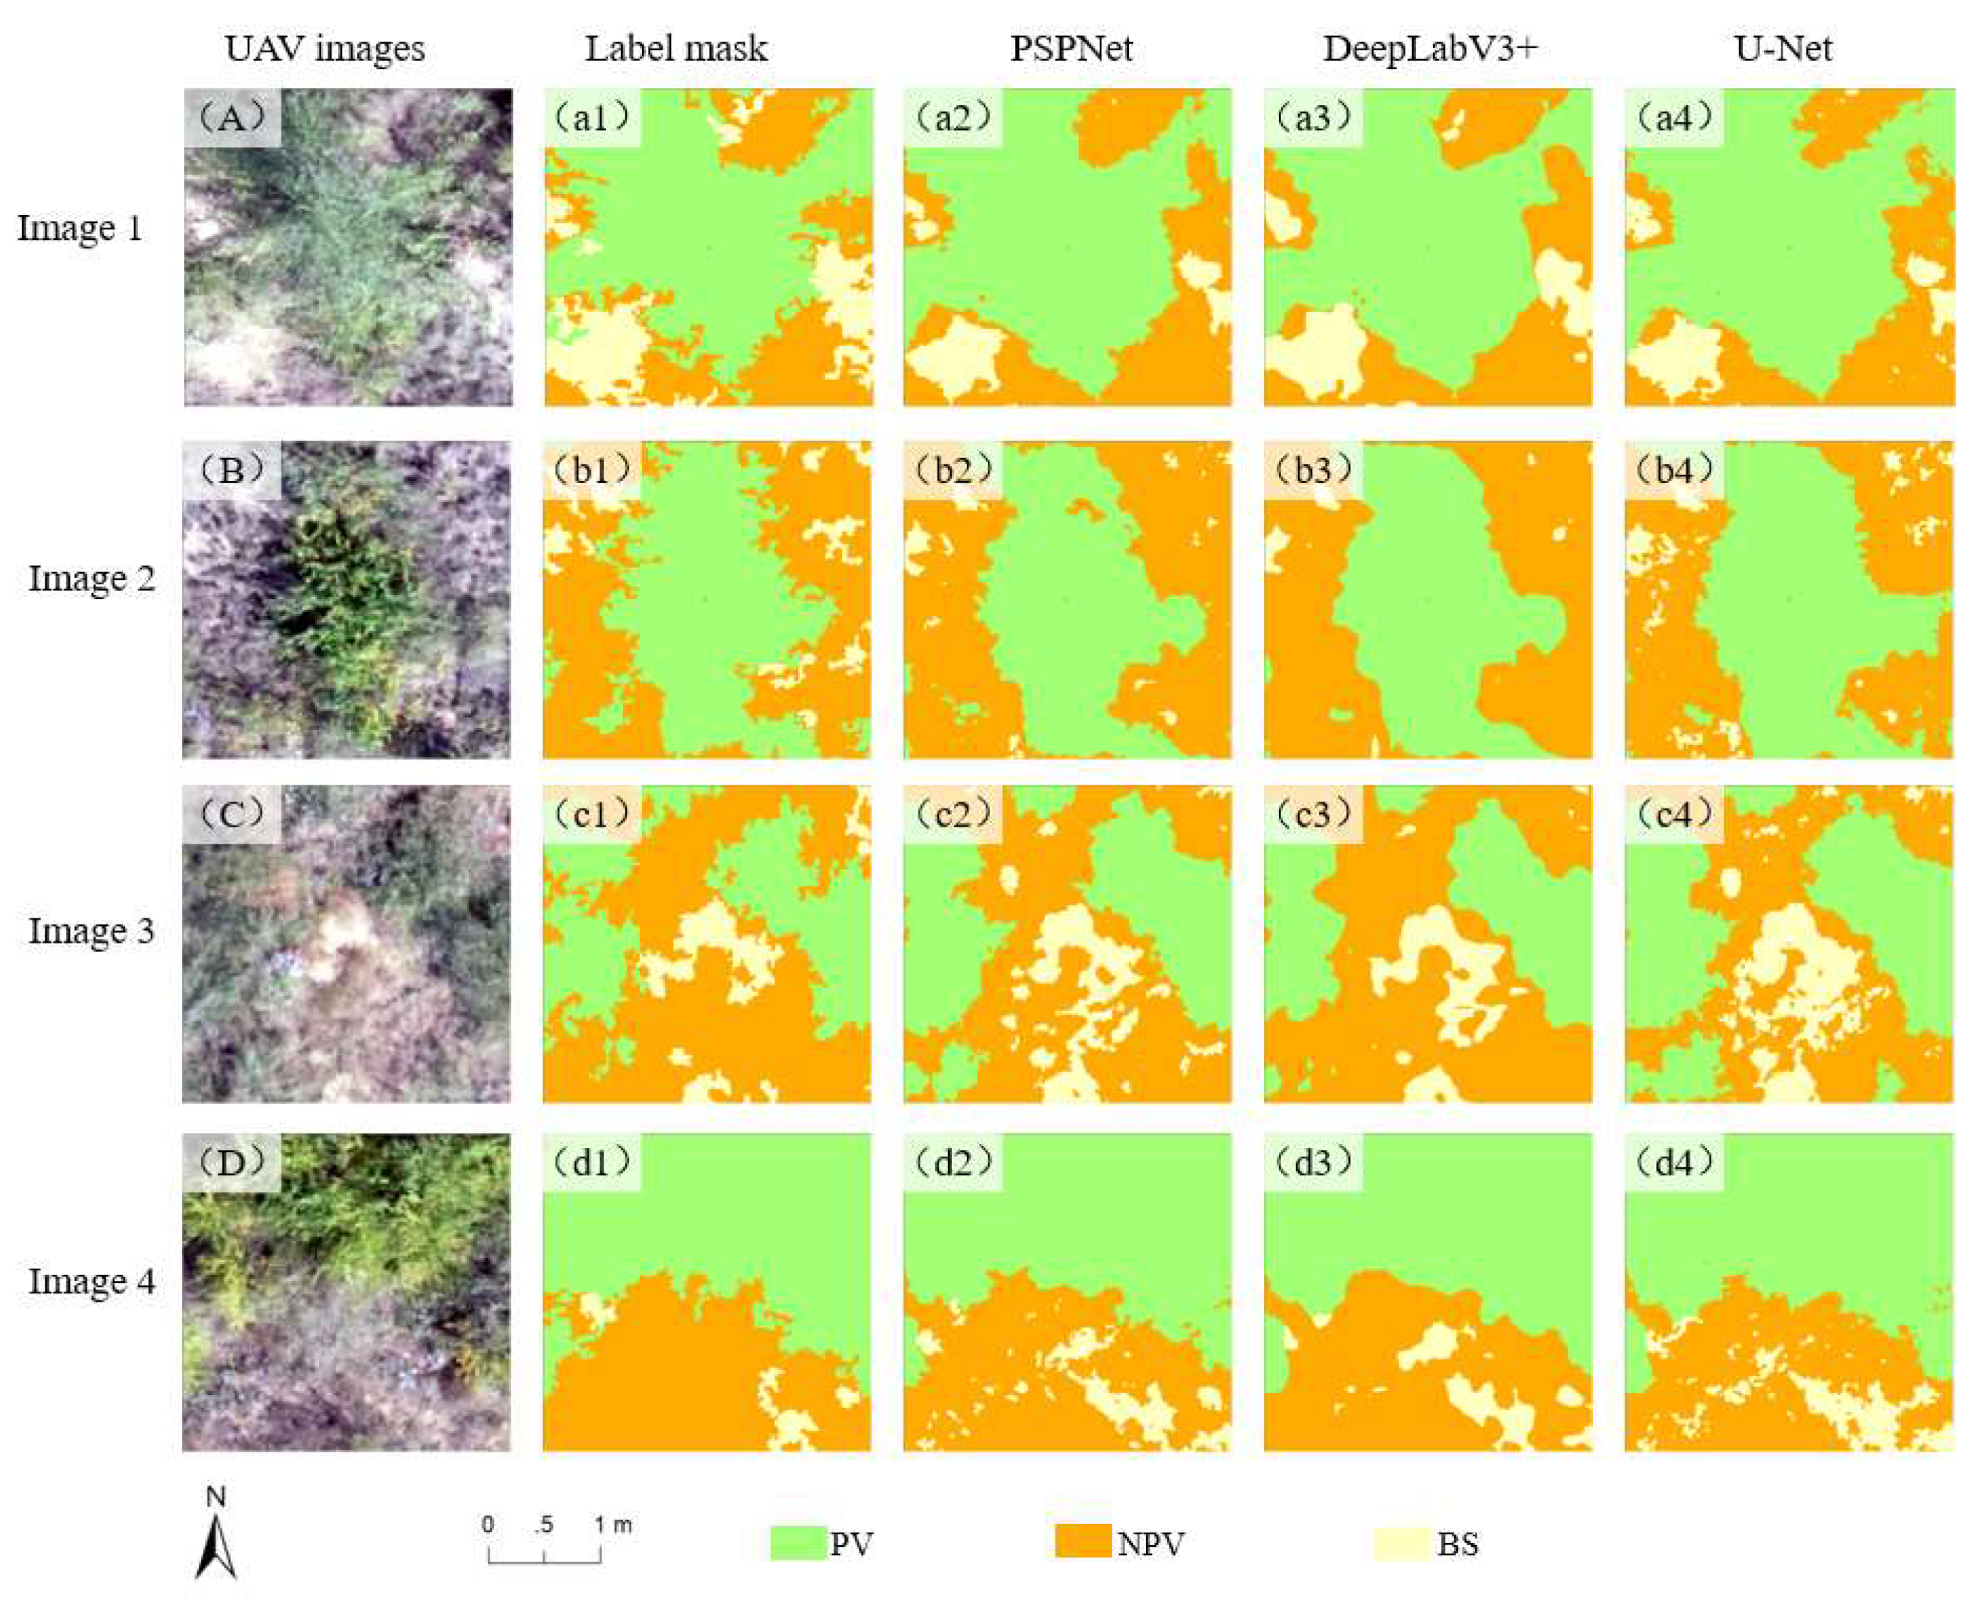
Figure 11.
Comparison between PV and NPV extraction results for July and September when the optimal model PSPNet was applied to different regions in the Hengshan grassland.
Figure 11.
Comparison between PV and NPV extraction results for July and September when the optimal model PSPNet was applied to different regions in the Hengshan grassland.
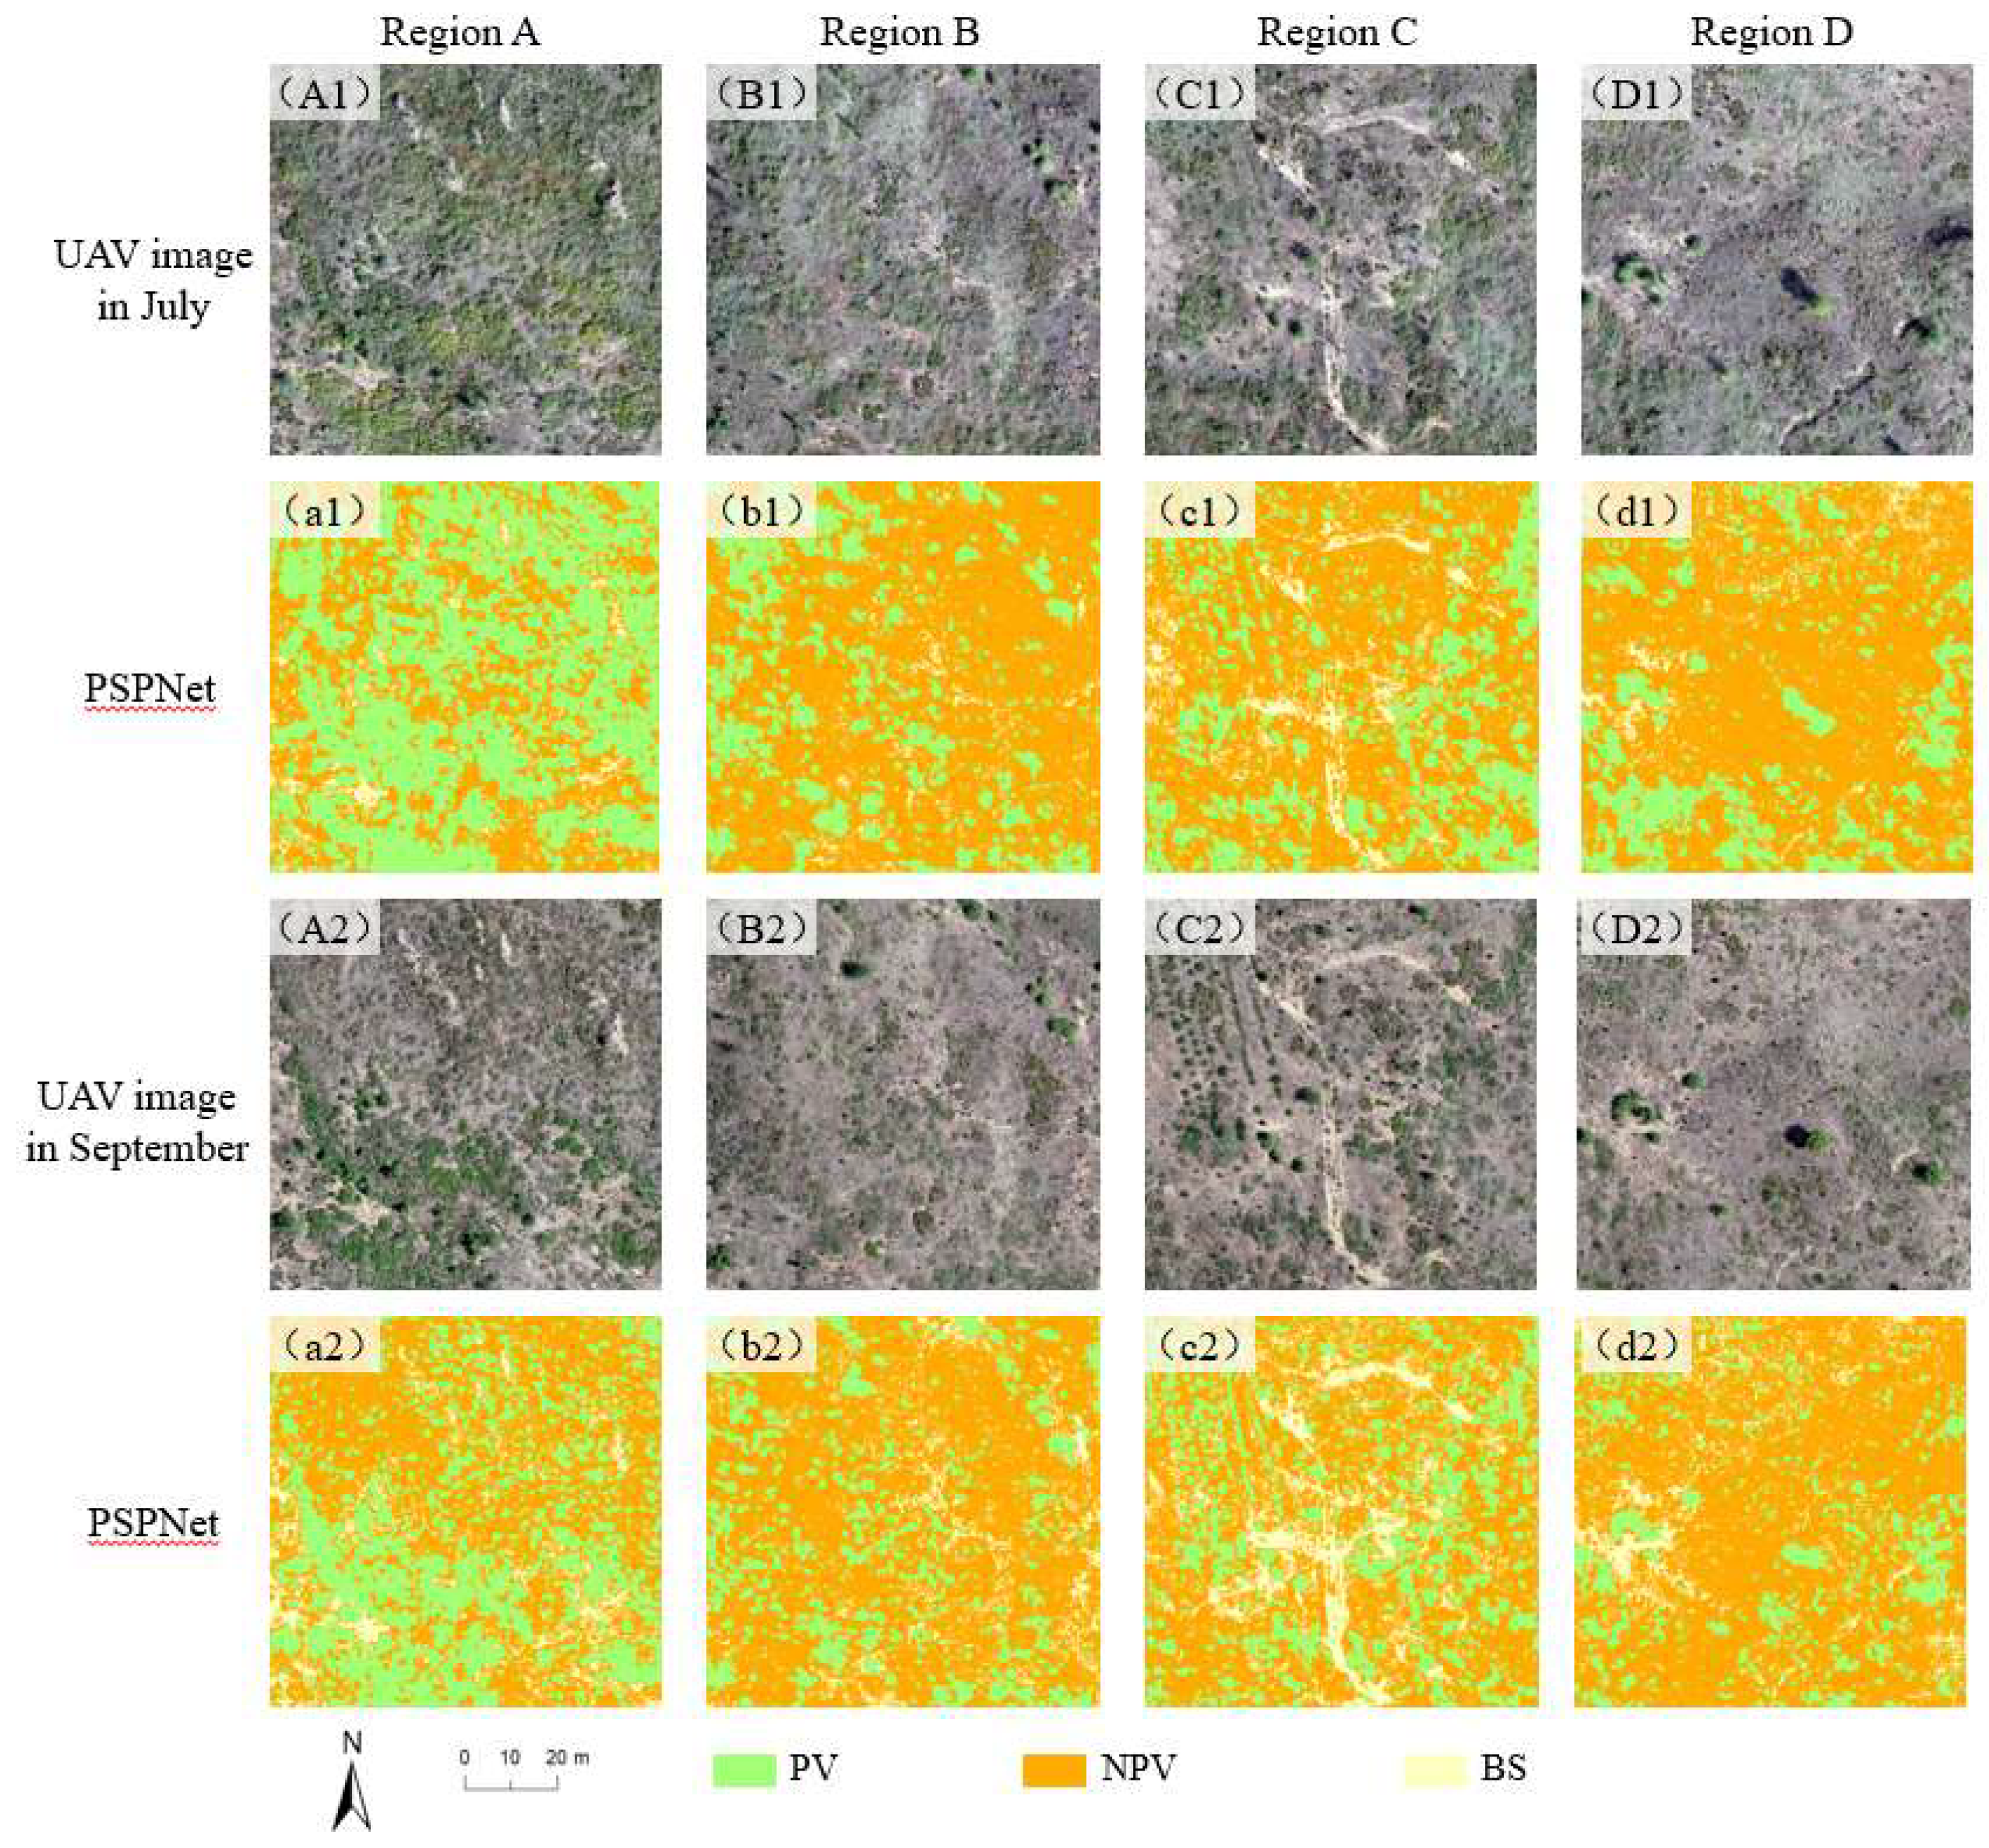
Figure 12.
Results of PV and NPV extraction in different periods for the long-term monitoring sample of the Hengshan grassland.
Figure 12.
Results of PV and NPV extraction in different periods for the long-term monitoring sample of the Hengshan grassland.
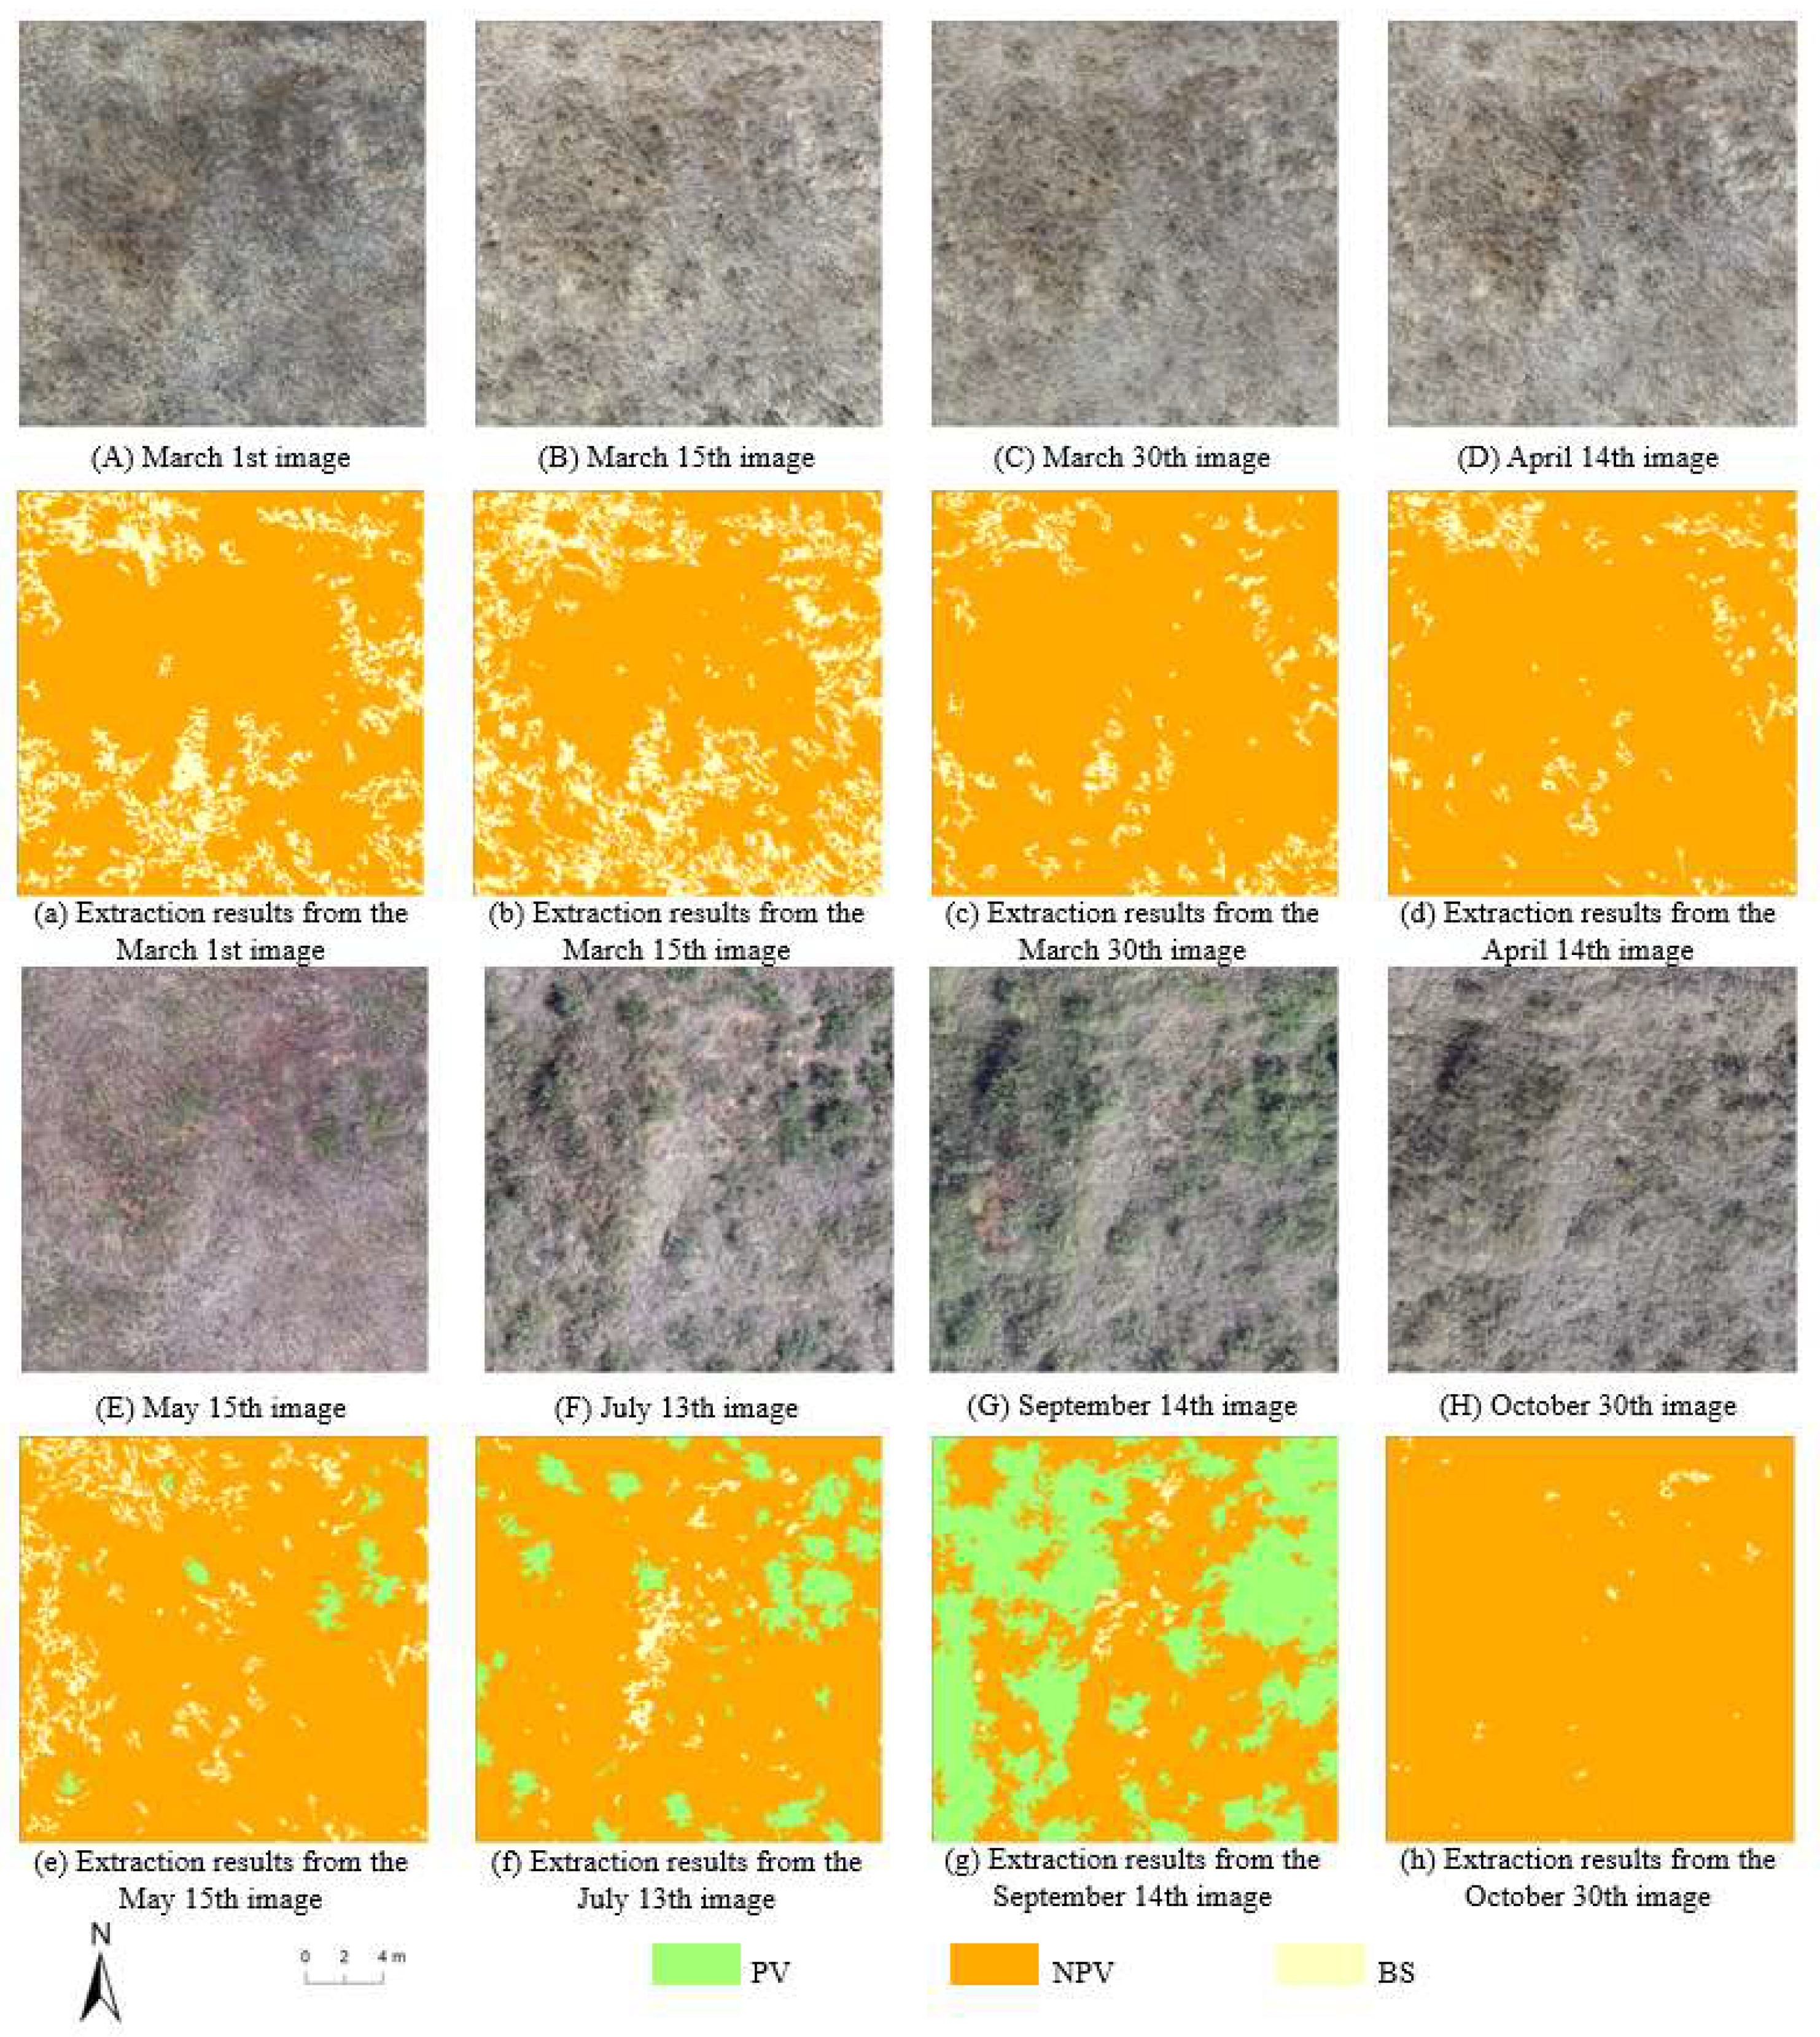
Figure 13.
Correlations between fPV and fNPV estimated from contemporaneous UAV images, ground surveys, and Sentinel-2A images of the Hengshan grassland sample area (**P < 0.01,* P < 0.05).
Figure 13.
Correlations between fPV and fNPV estimated from contemporaneous UAV images, ground surveys, and Sentinel-2A images of the Hengshan grassland sample area (**P < 0.01,* P < 0.05).
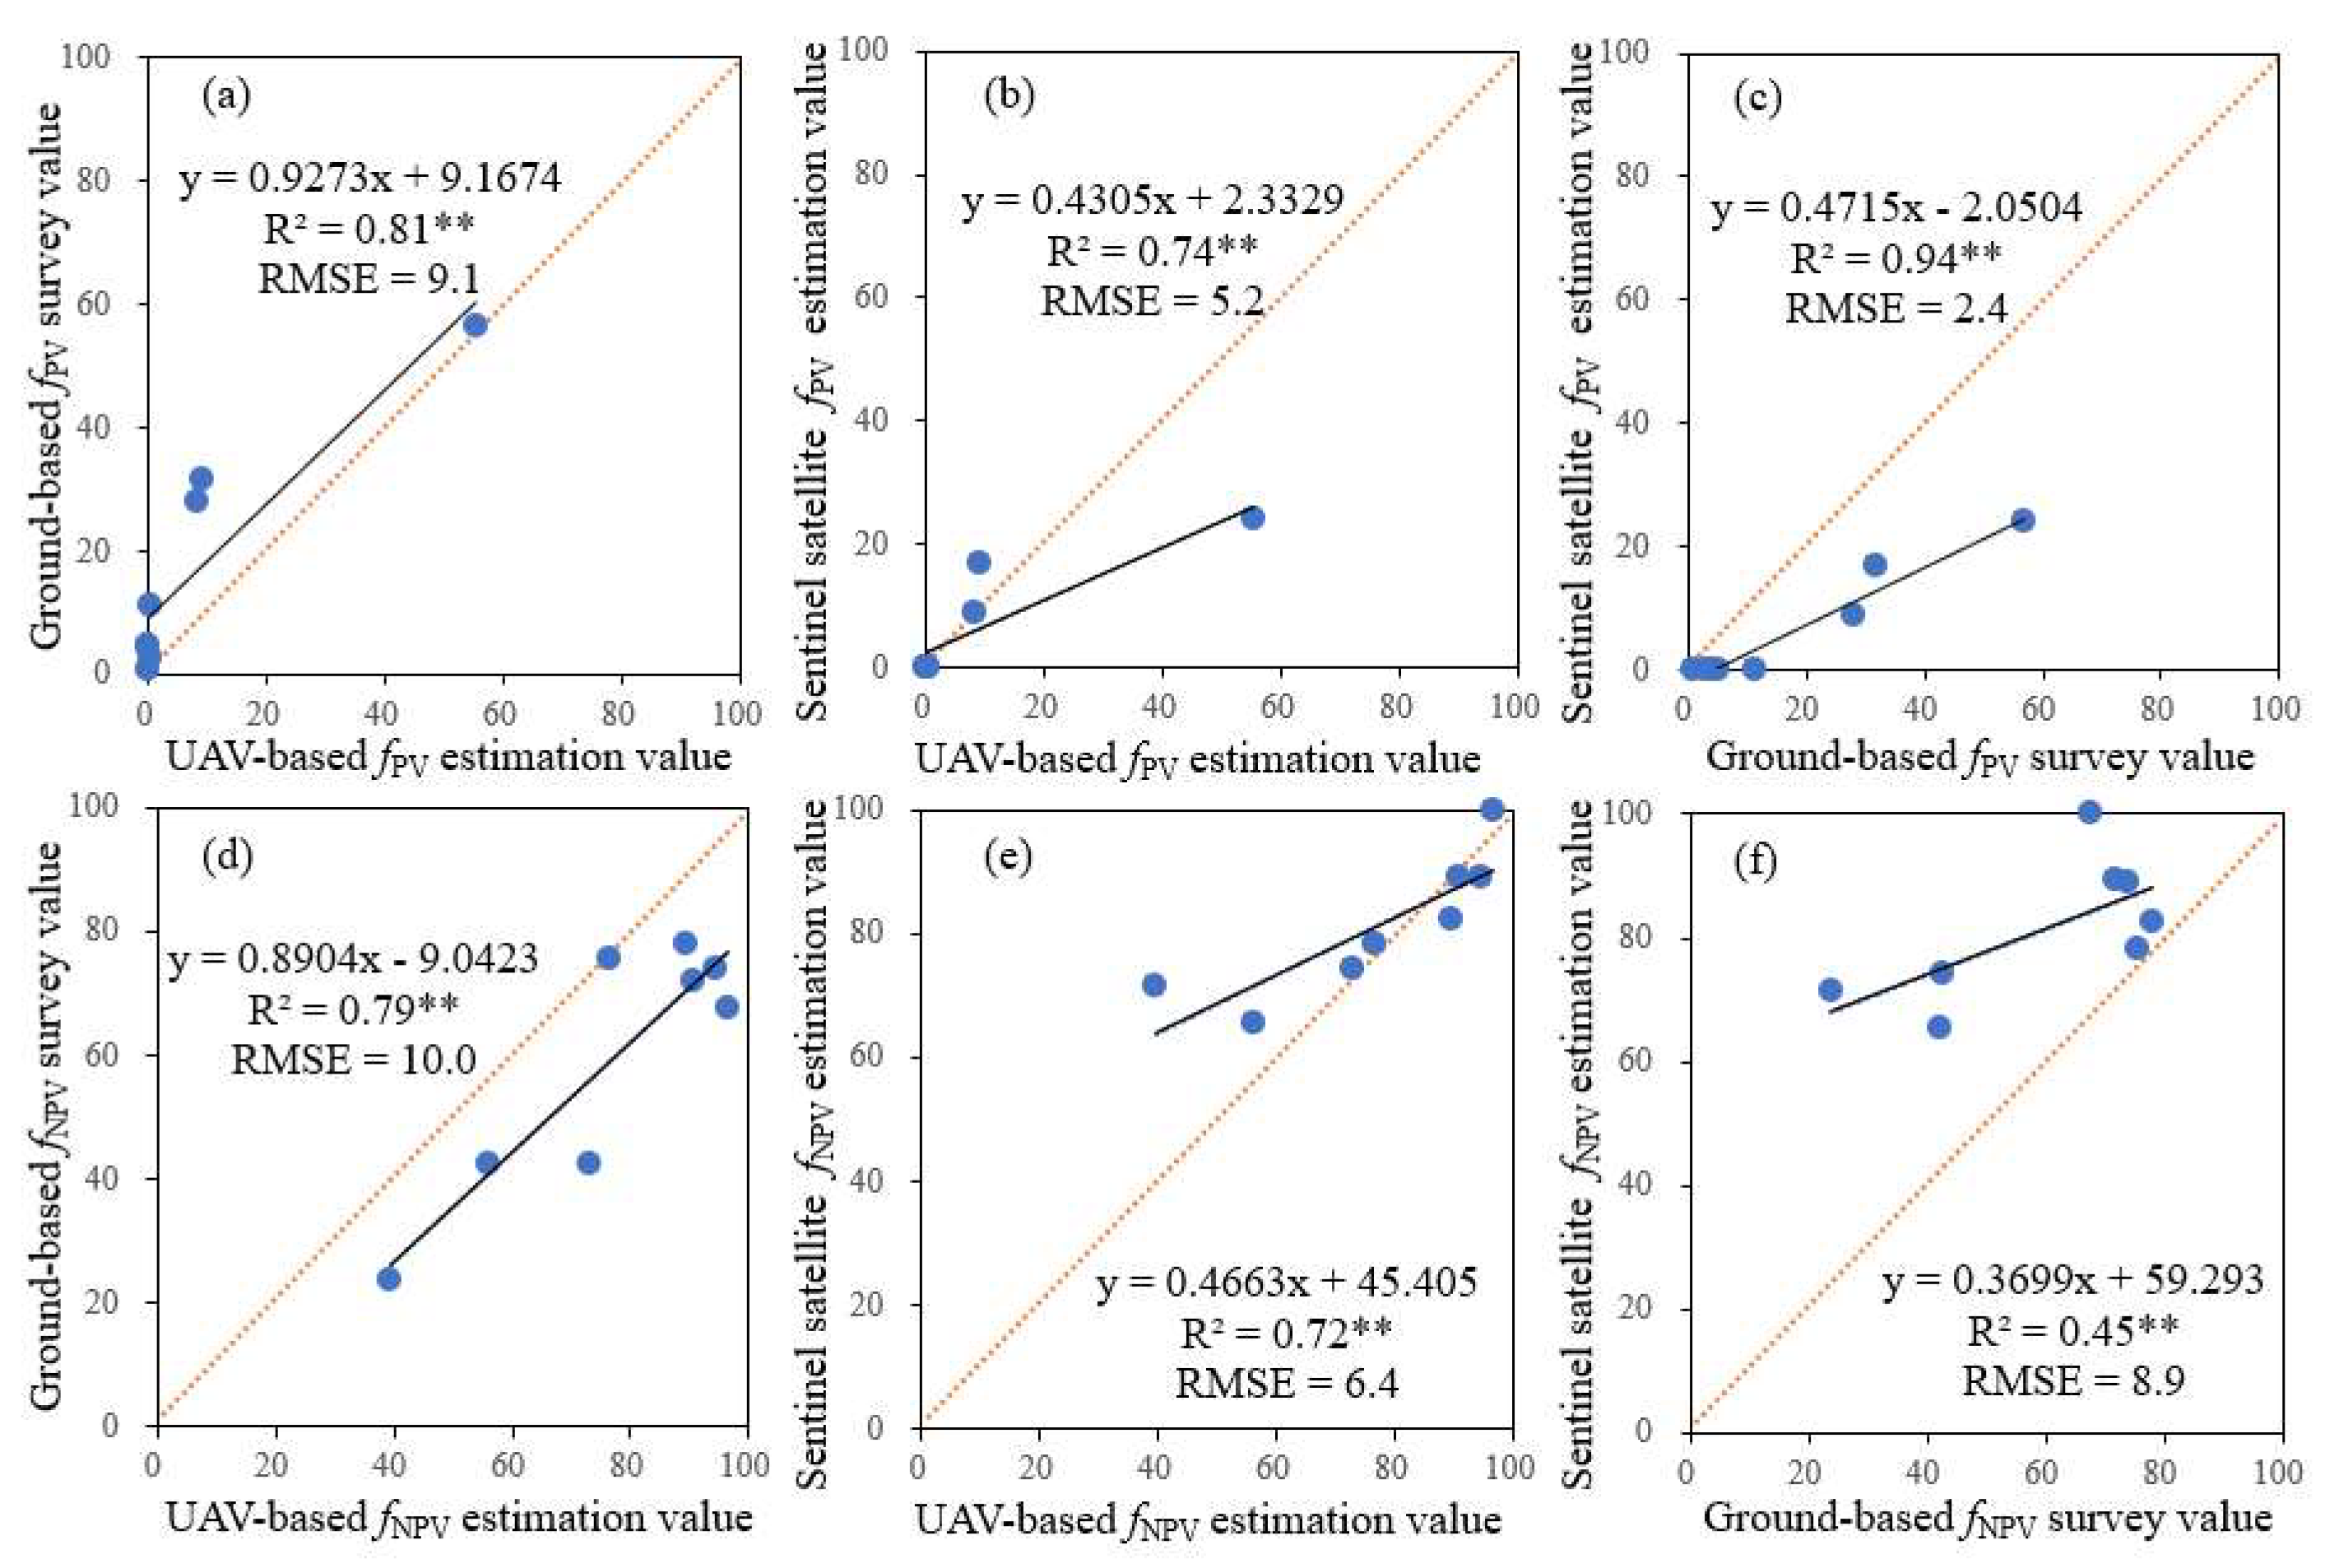

Table 1.
Comparison between PV and NPV extraction accuracy in different regions when the PSPNet model was applied to September and July.
Table 1.
Comparison between PV and NPV extraction accuracy in different regions when the PSPNet model was applied to September and July.
| Date | Type | Region A | Region B | Region C | Region D | ||||
|---|---|---|---|---|---|---|---|---|---|
| PA | UA | PA | UA | PA | UA | PA | UA | ||
| September | PV | 92.5 | 94.9 | 90.5 | 76.0 | 91.5 | 87.8 | 86.9 | 98.1 |
| NPV | 90.4 | 86.8 | 93.8 | 97.2 | 91.1 | 91.9 | 94.9 | 89.6 | |
| BS | 85.7 | 85.7 | 70.0 | 77.8 | 88.2 | 93.8 | 76.2 | 76.2 | |
| OA(%) | 91.5 | 91.0 | 90.5 | 90.5 | |||||
| Kappa | 0.83 | 0.79 | 0.83 | 0.82 | |||||
| July | PV | 86.7 | 92.9 | 88.2 | 78.9 | 91.5 | 87.8 | 86.3 | 93.2 |
| NPV | 89.4 | 89.4 | 94.2 | 95.4 | 91.8 | 91.8 | 94.3 | 83.9 | |
| BS | 83.3 | 58.8 | 75.0 | 90.0 | 84.2 | 98.0 | 66.7 | 87.5 | |
| OA(%) | 88.0 | 92.0 | 91.0 | 87.5 | |||||
| Kappa | 0.78 | 0.79 | 0.84 | 0.77 | |||||
Disclaimer/Publisher’s Note: The statements, opinions and data contained in all publications are solely those of the individual author(s) and contributor(s) and not of MDPI and/or the editor(s). MDPI and/or the editor(s) disclaim responsibility for any injury to people or property resulting from any ideas, methods, instructions or products referred to in the content. |
© 2025 by the authors. Licensee MDPI, Basel, Switzerland. This article is an open access article distributed under the terms and conditions of the Creative Commons Attribution (CC BY) license (http://creativecommons.org/licenses/by/4.0/).
Copyright: This open access article is published under a Creative Commons CC BY 4.0 license, which permit the free download, distribution, and reuse, provided that the author and preprint are cited in any reuse.


