
Submitted:
26 March 2025
Posted:
27 March 2025
You are already at the latest version
Abstract
The electrical installation of a ship includes the generation, transport and distribution of the generated electrical energy to the electrical consumers on board. In recent years, there have been many attempts to replace traditional auxiliary generators with renewable energy sources, in particular solar panels, as this is a highly developed technology on land. Accordingly, this paper analyses the different energy requirements on board and carries out both a feasibility analysis on a merchant vessel. The feasibility analysis considered technical, economic and legal aspects. Sustainable aspects were analyzed too due to their importance nowadays. It has been verified that the use of solar panels is only technically feasible for a small part of the ship's total consumption, as the area of the panels would exceed the available area of the ship to cover the total demand. Therefore, the possibility of installing solar panels only for the fire detection system was analyzed. This is a technically and legally feasible solution, but not economically. However, from a sustainability point of view, which takes into account economic, social and environmental aspects, the proposal is appropriate.
Keywords:
renewable energy
; solar energy
; electrical energy
; marine electricity
1. Introduction
As a general rule, merchant ships must have at least two independent sources of electrical power [1,2]:
- A main source with sufficient capacity to supply all the consumers necessary for navigation conditions without the need to use the emergency source. This system shall be redundant, both in terms of generation and in terms of transformers and converters and other elements of the main network, so that, at least in the event of a failure of one item of equipment, all the consumers necessary for navigation, operation and propulsion can be supplied with power and the comfort of the crew can be maintained.
- An autonomous emergency source of sufficient capacity to supply the emergency consumers must be installed. This source, which may be an electrical generator or a battery system, is connected to the main emergency switchboard in the event of a main power failure.
As a general rule, the following services must be supplied by the emergency source on a cargo vessel for, at least, the following duration:
0.5 hours duration of the emergency power:
- Firefighting system
- Steering gear
- Watertight doors and hatches
3 hours duration of the emergency power:
- Emergency lighting for muster and embarkation stations and similar.
18 hours duration of the emergency power:
- Rest of the emergency lighting
- Navigations lights
- Fire pumps
- VHF radio
- GMDSS communication system
- Internal communication system
- Navigation equipment
- Fire detection system
- Alarm system
In addition, if the emergency source is not connected to the emergency main busbars in less than 45 seconds, it is necessary to include a transitional source to supply the emergency consumers for the time required by the Class rules (3 hours for emergency lighting and 0.5 hours for all other emergency consumers which have been listed above).
Regarding the emergency source, not all vessels have compulsory to install one, but it is always recommendable, being mandatory on all merchant vessels with the exception of those under 500GT, fishing vessels under 24m and those with the following navigation restrictions, in nautical miles: R2 (50 miles winter and 100 miles summer), R3 (20 miles winter and 50 miles summer) and R4 (50 miles winter and 10 miles summer) [3].
These main and emergency networks can be AC (alternating current) or DC (direct current). The use of one or the other depends mainly on the power to be supplied and the installation costs, as well as the end consumers. The use of one or the other depends mainly on the power to be supplied and the installation costs, as well as the consumer power supplies, although for operational reasons AC is currently used almost exclusively on merchant ships [4,5] with independent networks of 24Vdc for small electronical consumers.
At the beginning of the 20th century, most ships were powered by DC, but over the years AC has largely replaced DC for power generation and transport on cargo and passenger ships [6], as it has in civil engineering throughout the world. There are several reasons for this [7], one key factor being the increase in tonnage of ships, which has led to an increase in the installed power on board. Another is that DC cannot be used to carry large amounts of power due to its high losses in both heat and voltage drops, which leads to an unnecessary increase in cable cross-sections. Another reason is that the regulation of DC systems is more complicated than the current regulation of AC systems with frequency converters. Another cause is the standardization of the consumer market with AC electric motors, which are common on ships (sewage treatment plants, engines, incinerators, boilers, etc.). In addition, the commercial ports where ships dock and perform their loading and unloading operations do not have direct current to supply the ship through their shore power, but only alternating current. Another cause is the development and implementation of diesel-electric propulsion, and it is also important to mention the Joule effect losses of any installation, to which the losses of the inverters must be added.
AC is divided into two groups: high voltage (rated voltages greater than 1 kV and up to and including 15 kV with rated frequencies of 50 Hz or 60 Hz) and low voltage (rated voltages greater than 50 V and up to including 1000 V with rated frequencies of 50 Hz or 60 Hz), with the most common networks on ships being 400 V, 440 V and 690 V [8,9]. For lighting, both normal and emergency main networks, a maximum of 250 V must be used, according to the rules of the various classification societies [10]. For power requirements of less than 5 MW, low voltage is generally used [11,12]. On the other hand, for higher power requirements, it is practically essential to use high voltage in order to reduce the weight of the generators, the cross-sections of the cables, and the short-circuit level of the network [13,14].
In accordance with the rules of various classification societies [15], Figure 1 shows the on-board distribution networks.
Due to the fact that each ship has its own particular characteristics, there are no specific publication records of the electrical power balance for each type of ship and loading conditions (navigation, emergency, port, etc...) since the power installed on board depends on the tonnage of the ship, its expected cargo and the experience and expectations of the shipowner, among many other variables [16,17,18,19]. Table 1 shows the power required in port for the various merchant ships, according to EMSA (European Maritime Safety Agency) [20], as well as the estimated power consumed during navigation, based on the power supplied by the port electrical network, considering that this is at least 50% higher than the power consumed while in port.
Solar energy can be a very interesting additional source of energy to help meet the huge electricity demand shown in Table 1. Solar energy can significantly reduce a ship’s fuel consumption and emissions, making it a viable alternative to conventional energy sources [21,22]. Of particular interest are hybrid systems that combine solar panels with batteries and diesel generators to ensure a reliable power supply, even in varying operational conditions [7,23]. Several researchers investigated the optimization of efficiency from the configuration of the solar panels, batteries, and electric drives [24]. For example, a study on a fishing vessel demonstrated that integrating solar panels with a DC electric power system could effectively substitute traditional fuel sources, thereby enhancing the vessel’s sustainability [25]. Furthermore, the use of lithium-ion batteries for energy storage allows for the temporary storage of solar energy, which can be utilized when sunlight is not available, thus ensuring continuous power supply for critical [26]. Recent advancements in solar technology have also contributed to the feasibility of solar-powered ships [27,28,29]. Moreover, the integration of smart energy management systems, such as those based on fuzzy logic or particle swarm optimization, can optimize the distribution of power generated from solar energy and other sources, further enhancing the operational efficiency of hybrid ships [30].
This study analyses the feasibility of installing solar panels on a merchant ship, type multipurpose fisheries oceanography research vessel, for 100% of the electrical load consumption and also for a single and essential consumers as the fire detection system which installation is not net to be connected to the onboard nets (in emergency mode it works isolated by its own batteries) and it is needed to be 24 hours per day powered supply.
2. Materials and Methods
2.1. Case of Study
The multipuropse fisheries oceanographic research vessel, NB730 Jaywun, is shown in Figure 1, and the main characteristics are summarized in Table 2. The Jaywun is a 47.1-meter fisheries oceanographic research vessel operated by the Environment Agency—Abu Dhabi (EAD) and launched in 2022 as the Middle East’s most advanced marine research vessel. Designed for oceanic fisheries assessments, blue carbon evaluations, climate change research, and marine water quality studies, it is equipped with cutting-edge technology, including an ROV, underwater drones, seabed mapping systems, DNA analysis tools, and six onboard laboratories. Powered by twin MTU 16V4000M53 engines, it reaches 13 knots and has a 25-day endurance at 11 knots, while accommodating up to 30 personnel.
2.2. Technical Feasibility of Solar Energy in the Main and Emercengy Networks
As shown in Table 2, in addition to the two shaft generators, the vessel has two 650 kW auxiliary generators, which help to reduce the consumption of the vessel during navigation. The electrical energy generated for different load percentages of the generators, considering only one auxiliary generator connected to the busbars, is sufficient to supply all the electrical consumers in the most unfavourable condition (the starting peak of the heavy consumers has not been considered). The replacement using solar energy is shown in Table 3. This table shows the number of solar panels, for example typical 550 Wp panels, that would need to be installed to supply this load (assuming a theoretical inverter efficiency of 95%), as well as the estimated horizontal surface that they would occupy.
As can be seen from Table 3, the minimum electrical power considered (50% of a generator) would be around 325 kW. This results in a surface area of more than 1350 m2, which is much larger than the total surface area of the ship, calculated as maximum length x width, which is 565 m2. This makes it impossible to install solar panels to cover the ship’s energy needs.
Regarding the emergency network, the same conclusions can be drawn as for the normal (main) network, in addition to the disadvantages that would occur in order to comply with the conditions of the classification society and SOLAS:
• Self-contained emergency source of electrical power shall be provided which will be difficult to provide with solar panels.
• The emergency source of power, associated transforming equipment, emergency switchboard, emergency lighting switchboard and transitional source of emergency power shall be located above the uppermost continuous deck and be readily accessible from open deck. It shall not be located forward of the collision bulkhead.
Due to the aforementioned reasons, it is not possible to supply neither the all the consumers of the normal network nor the emergency network of this ship, and this conclusion can be extrapolated to any other similar cargo ship. The next section analyses the supply of a single critical and emergency load on a ship which operates in isolated emergency mode, such as a fire detection system which is always powered by the main & emergency network in normal conditions and by its own battery network (24Vdc) in emergency mode.
2.3. Technical Feasibility of Solar Energy in the Fire Detection System Network
The fire detection system on a ship, as in any land-based installation, is based on a series of automatic smoke, heat, flame and other detectors, as well as a number of manual call points, installed in the different areas and vertical zones of the ship and connected to one or more fire detection control panels. The basic function of the fire detection system is to automatically, quickly and safely detect the presence of fire in all main spaces of the ship. The more important consideration with this system is that an isolated power network can be used to power the system via internal batteries, so no inverter or other equipment needs to be installed. This system must be powered 24 hours a day and its own batteries must always be fully charged. The design and installation of a fire detection system is based on the FSS code and classification society rules. Continuing with the vessel under analysis (oceanographic and fishery research vessel), a fire detection system is developed with the following specifications:
One complete fire alarm panel is installed in the wheelhouse and also a repeater is installed in the engine control room. The fire alarm system is designed with addressable sensors. The fire system is interfaced to the public address (PA) for general alarm (GA) which is generated and transmitted by this public address.
Fire detectors are automatically lead to fire when:
• A heat detector reaches a pre-set temperature limit (57 °C and 100 °C)
• A combustion gas has reached a smoke detector
• A manual call point is activated
Detectors and installation are according to Classification requirements and National Marine Authorities, and with:
• Smoke detectors in engine room, cabins, corridors, offices, mess, emergency generator and similar spaces
• Heat detectors in laundry, galley, wardrobes, wheelhouse, casing, and engine room and similar spaces
• Flame detectors in engine room and emergency generator room (over engines).
• Manual call point at all entrances to accommodation, corridors and in engine room exits
• Detectors in workshop are equipped with timer for disconnecting the sensors form the fire system for welding work.
All fire detectors and manual call points are installed easily accessible for testing.
A general alarm push button is installed in the main console, into the wheelhouse, and makes that all sounders to operate continuously when activated, via public address and it is observed in all rooms on board.
The fire detection central panel is built-in monitoring circuits which are intended to control that the equipment at any time is in satisfactory order and indicate faults which could prevent fire alarm.
The fire alarm system is interfaced with the installed fans in order to be stopped them when a fire is detected and with the alarm columns, the extinguishing system of the galley, the public addresses system and also the fire doors which will be close automatically when a fire is detected.
Figure 2 shows the topology of the installed fire system and Figure 3 the fire detection main central unit.
Regarding the loops, the system has been designed using tree loops. One loop for accommodation, one loop for category A locals (machinery loop) and one loop for aft fishery locals. No loop will pass through a space twice. A loop of fire detection systems with a zone address identification capability shall not be damaged at more than one point by a fire. Figure 4 shows the accommodation loop.
Figure 5 summaries the installed equipment for the fire detection system, with the location and quantity for decks, and Figure 6 an installed smoke detector.
Regarding the power supplies and according to the rules [31], there shall be not less than two sources of power supply for the electrical equipment used in the operation of the fire detection and fire alarm system, one of which shall be an emergency source. The supply shall be provided by separate feeders reserved solely for that purpose. Such feeders shall run to an automatic change-over switch situated in or adjacent to the control panel for the fire detection system.
Based on the above, a fire detection system has been proposed where the emergency power supply is by means of batteries, for which the consumption balance indicated in Table 4 is carried out, in order to obtain the maximum consumption value of the system.
According to the Class rules, the duration of the emergency power supply of the fire detection system is 18 hours, so the capacity of the emergency power supply is 18 x 1.3503 = 24.3054 Ah, so a set of 2 x 12 Vdc batteries of 26 Ah is installed. From Table 4, the daily energy consumption of the fire alarm system is 30.10 W x 24 h/day = 0.72 kWh/day.
3. Results and Discussion
Once the installation of solar panels for the fire detection system network has been verified, an analysis was carried out from an economic, legal and sustainable point of view. The results are shown in the following sections.
3.1. Economic Analysis
This section analyzes both the investment required and the consumption in tons of marine diesel oil (MDO) for one year to power the fire detection system for several alternatives. It has been taken into account that the ship is out of port 200 days per year, while the rest of the time it is in port and powered by the shore power to the port network (this part is outside the scope of this work).
Alternative 1
The detection system is powered only from the ship’s 230 Vac emergency mains (via interconnection to the 230 Vac main switchboard), where an AC/DC converter is installed to supply the fire detection system at 24 Vdc, in addition to the emergency mains. Under these conditions, the investment planned is shown in Table 5.
In addition to this initial investment, the consumption of MDO that must be consumed in the generator set to power the system must be taken into account. An average consumption of the generators of 180 gr/kWh is considered, which is equivalent to 180 gr/kWh x 0.72 kWh/day x 200 days = 25.93 kg of fuel per year. Taking into account the current price of MDO being around 761 $/t (700 €/t), this is equivalent to 18.15 €/year, which considering a useful life of 25 years would amount to 469 €.
Alternative 2
Normal power supply is provided solely by solar panels installed on the decks with sufficient capacity to keep both the fire detection battery charged and the operating system running when the sun is shining. The rest of the power generated by the panels is used for charged a battery system 2 x 100 Ah—2 x 12 Vdc, in order to power supply the system in nights (10 hours with sun/day). The investment is shown in Table 6.
Although this solution is technically feasible, it is forbidden by SOLAS and also its implementation would mean that during large periods where there is no sun, the system would go into emergency mode and would be powered from its own batteries, which would quickly decrease the life of the batteries and the system would not be prepared for a real emergency of the ship, so it would be necessary to have at least one power supply from the emergency network for at least eight hours a day, as it is shown on alternative 3.
Alternative 3
A solar panel with sufficient capacity to keep the system operational and the fire detection batteries charged is proposed with solar batteries for keep the rest of the generated power supply and power supply the fire detection system on nights, as well as an auxiliary power supply so that in the event of insufficient voltage being generated by the solar panels or by its solar batteries , it would switch to the ship’s emergency 230 Vac network, which would keep the system always operational from the ship’s networks and also the battery always charged. This solution would be a combination of the above situations together with an automatic changeover system so that the power supply to the solar panels would be prioritized. The investment is shown in Table 7.
In addition to this investment, it will not be necessary to consider any fuel consumption given that the power supply of the fire system from the onboard emergency net will be an unusual situation.
In order to have a quantification of the saving obtained by alternative 3 versus alternative 1, the following economic parameters will be estimated: NPV (Net Present Value), IRR (Internal Rate of Return) and DPBP (Discounted Pay-Back Period).
The NPV, Equation (1), is the present value of the cash flows at the required rate of return of economic savings generated of MDO consumption compared to the investment of alternative 3.
(1)
where i is the required return or discount rate and t the number of time periods.
The IRR is calculated by solving the previous NPV expression for the discount rate required to make the NPV equal to zero, Equation (2).
(2)
The DPBP refers to the amount of time it takes to number of years it takes to break even from undertaking the initial expenditure, Equation (3).
(3)
Where the cash flow is considered the revenue between the yearly cost of the MDO consumption of the alternative 1 (18.74 €/year).
The following values were obtained:
-NPV: Considering a useful life of 25 years and a discount rate of 12%, considering an initial investment of 1995.72 € and an expected annual savings of 18.74 €, an estimated NPV of -1849 € was obtained. Giving that this value is negative, the installation of the solar panel is unprofitable from an economic point of view.
-IRR: Considering the previous values, the rate that makes the NPV zero is -35.3%. Giving that this value is negative, the sum of post-investment cash flows is less than the initial investment.
-DPBP: 37 years. The discounted pay-back period is more than the lifespan of the ship.
These results show that, from an economic point of view, the installation of solar panels does not pay off for supplying energy to small consumers as the installation cost is too high compared to supplying energy by means of a diesel generator.
Given the negative previous result, the main conclusion is that it is advisable to install as many panels as possible. Taking into account the different layouts of merchant vessels, it would normally be possible to install around 20 solar panels (550 Wp per panel) on a typical bridge deck occupying an area of around 45 m2 (panels inclined at 30°), which is possible on most merchant vessels. The total power generated by the 20 solar panels should be approximately 10 kW. An inverter (DC/AC 3-phase) would be required to supply this solar energy to any consumer whose power consumption is less than 10 kW. The investment corresponding to this proposal is shown in Table 8. In order to estimate the savings in MDO consumption, as before, it was considered that the solar panels work for 8 hours/day, supplying a load of about 10 kW, for 200 days/year, which (considering a typical consumption of an engine at 180 gr/kWh) corresponds to a saving of 2.88 t/year of MDO, which in economic terms corresponds to 2016 €/year. If the above economic parameters are calculated, the following results are obtained (taking into account 3% of the inversion for maintenance, 25 years of life and a discount rate of 12%):
NPV: 610 €. The investment is profitable, but not a huge saving is going to be made.
IRR: 12.7%. It is positive but it is too like the initial rated return, so it is not a highly profitable project, in economic terms.
DPBP: 21 years.
In view of the results obtained, it can be stated that, from an economic point of view, the installation of solar panels on merchant ships is not profitable, given the small number of panels that can be installed as a result of the limited surface area available and the fact that it takes too many years to recover the cost of the inversion.
Another important problem is that the electricity generated by solar panels is difficult to connect in parallel and synchronized with the auxiliary generators on board, given that the variation of the frequency of them goes, typically, of ±10% of the nominal value and it is not stable, and also the difference of the power supplies of both networks generated that this coupling will be unbalanced.
3.2. Sustainability Analysis
The feasibility analysis carried out above considers technical, legal and economic factors to determine whether the proposal can be realistically implemented. In contrast, a sustainability analysis considers whether a project can maintain its benefits over time without depleting resources or harming the environment [32,33].
A sustainability analysis encompasses environmental, social, and economic factors [34]. Various methods of calculating what is known as the sustainability index (SI) can be found in the literature. One of the most commonly used methods is the simple additive weighting (SAW), according to which the SI can be calculated by Equation (4), where i is the alternative analyzed, c the criteria, w the weight assigned to each criterion j and n the number of criteria. The SI is between 0 (corresponding to the worst sustainability) and 1 (corresponding to the optimal sustainability).
(4)
In the present analysis three criteria are considered: economic, social and environment. Regarding the alternatives, since alternative 2 does not meet the SOLAS legal requirements, only alternatives 1 and 3 are compared. The numerical data are shown in Table 9. Regarding the economic criteria, the costs of alternative 1 and alternative 3 are considered. The cost of alternative 3 refers to the investment cost (1425.72 €), while that of alternative 1 refers to the investment cost plus the MDO consumption cost (432 + 469 = 901 €). These are measurable values obtained in the previous section. In contrast, environmental and social criteria were treated as discrete values, providing a value of 0 to alternative 1 and a value of 1 to alternative 3, given that the latter is more ecological and also more socially appropriate (in terms of community benefits, social equity, cultural impact, and so on).
Once the data for the sustainability analysis are recollected, the next step is to normalize. The normalization process in a sustainability analysis is essential to ensure fair comparisons. In this case, the economic criterion is provided through continuous values in € while the other criteria are provided through discontinuous values as 0 (bad) and 1 (good). The normalization adjusts values to a common scale to consistency and comparability in the analysis. The linear max normalization was used, which follows the following Equations (5) and (6) for beneficial and non beneficial criteria, respectively. In these equations, X is the value and Xj,max the maximum value corresponding to that criterion. In this case, the economic is a non beneficial criterion since it is desirable that the cost is as low as possible, while environmental and social criteria are beneficial since an environmental social solution is desirable.
(5)
(6)
The normalized data are shown in Table 9. This table includes the normalized values calculated according through Equations (5) and (6), as well as the SI calculated according through Equation (4). In order to calculate the SI, a weight must be given to each alternative. In a sustainability analysis, weights represent the relative importance assigned to different environmental, social, and economic criteria to prioritize key factors in the decision-making. For example, Table 9 shows the results of the SI corresponding to 50% economic weight (0.5 on a per unit basis), 25% environmental weight (0.25 on a per unit basis) and 25% social weight (0.25 on a per unit basis). These weights corresponds to economic factors with given the half of the possible importance (50%), and the remaining importance has been equally distributed between the other two factors (25% and 25%). Logically, the sum of the assigned weights must be 100, or 1 on a per unit basis. This weighting reflects a decision-making approach where economic sustainability is considered twice as important as environmental and social aspects, influencing how the project’s overall sustainability performance is assessed. It is worth mentioning that choosing weights in a sustainability analysis depends on several factors such as stakeholder priorities, industry standards, regulatory requirements, project goals, and so on. Common methods include expert judgment, stakeholder surveys, historical data analysis and even statistical analyses. For example, a government policy might prioritize environmental factors, while a business-driven project may emphasize profitability. According to this, a sensitivity analysis of the weights has been carried out. The results are shown in Figure 6, which shows the SI corresponding to alternative 1 and alternative 3 for economic criterion weights ranging from 0 (lowest possible) to 100 (highest possible). As can be seen, from a sustainability point of view, the solution of installing solar panels is recommendable unless the economic issue is of high relevance in the decision-making process.
4. Conclusions
This paper presents an analysis of the different energy requirements on an oceanographic and fisheries research vessel and the possibility of installing solar energy. The results obtained can be extrapolated to other load distributions. It was found that it is not technically possible to provide all the energy required by solar panels, as the surface area required for the installation of the panels exceeds that available on the ship. Solar panels could only be used on merchant ships and always in combination with other technologies, as the number of panels that would have to be installed to meet the ship’s needs would be unfeasible, making them technically unfeasible. It is therefore proposed to use solar panels to power the fire detection network only. Calculations show that this is a technically feasible but not economically viable option. The main reason for this is that the cost of installing solar panels does not compensate for the electricity they produce. The installation of solar panels is only recommended for recreational craft and small fishing vessels, where the electrical network is powered only by batteries or small auxiliary generators that produce the same power as the installed solar panels.
In addition to the techno-economic study, a sustainability analysis was carried out, taking into account economic, social and environmental criteria. This analysis shows that it is advisable to install solar panels unless the economic criteria are of extreme importance.
Author Contributions
Conceptualization, L.G.C. and M.I.L.G.; methodology, L.G.C. and L.C.-S.; software, L.G.C.; validation, L.G.C.; formal analysis, M.I.L.G.; investigation, L.G.C., L.C.-S. and M.I.L.G.; resources, L.G.C., L.C.-S. and M.I.L.G.; writing—original draft preparation, L.G.C.; writing—review and editing, M.I.L.G. and L.C.-S; supervision, L.C.-S.; project administration, L.C.-S.; funding acquisition, L.C.-S. All authors have read and agreed to the published version of the manuscript.”
Funding
This research was partially funded by Project PID2019- 105386RA-I00 “Design of a tool for the selection of offshore renewable energy locations and technologies: application to Spanish territorial waters (SEARENEW)”, financed by Ministerio de Ciencia e Innovación—Agencia Estatal de Investigación/10.13039/501100011033. This research was also partially funded by Project TED2021-132534B-I00 “Characterization of a software to determine the roadmap of the offshore solar energy in the Spanish shore (SEASUN)”, financed by MCIN/AEI/10.13039/501100011033 and by the European Union “NextGenerationEU”/PRTR.
Institutional Review Board Statement
Not applicable.
Informed Consent Statement
Not applicable.
Conflicts of Interest
The authors declare no conflicts of interest.
References
- Y. Yuan, J. Y. Yuan, J. Wang, X. Yan, B. Shen, and T. Long, “A review of multi-energy hybrid power system for ships,” Renew. Sustain. Energy Rev., vol. 132, p. 110081, Oct. 2020. [Google Scholar] [CrossRef]
- Y. Shi and W. Luo, “Application of Solar Photovoltaic Power Generation System in Maritime Vessels and Development of Maritime Tourism,” Polish Marit. Res., vol. 25, no. s2, pp. 176–181, Aug. 2018. [CrossRef]
- “DNV rules, Part 4 Chapter 8 Section 2, 3.1.1 Emergency power source.
- S. Babu, M. S. Babu, M. Chacko, and M. Paulson, “Leveraging an installed standalone photovoltaic system for eco-friendly shipping,” Eng. Rev., vol. 44, no. 1, pp. 2024; 98. [Google Scholar] [CrossRef]
- O. Melnyk, O. O. Melnyk, O. Onishchenko, and S. Onyshchenko, “Renewable Energy Concept Development and Application in Shipping Industry,” Lex Portus, vol. 9, no. 6, Dec. 2023. [Google Scholar] [CrossRef]
- A. A. Salem and I. S. Seddiek, “Techno-Economic Approach to Solar Energy Systems Onboard Marine Vehicles,” Polish Marit. Res., vol. 23, no. 3, pp. 64–71, Sep. 2016. [CrossRef]
- E. Koenhardono, D. E. Koenhardono, D. Putri, and I. Kusuma, “Application of Hybrid Power Generation System on a Tanker Ship to Support the Development of Eco Ship Technology,” IOP Conf. Ser. Earth Environ. Sci., vol. 1081, no. 1, p. 012053, Sep. 2022. [Google Scholar] [CrossRef]
- U. Javaid, D. U. Javaid, D. Dujic, and W. van der Merwe, “MVDC marine electrical distribution: Are we ready?,” in IECON 2015—41st Annual Conference of the IEEE Industrial Electronics Society, Nov. 2015, pp. 0008; 28. [Google Scholar] [CrossRef]
- S. Jayasinghe, L. S. Jayasinghe, L. Meegahapola, N. Fernando, Z. Jin, and J. Guerrero, “Review of Ship Microgrids: System Architectures, Storage Technologies and Power Quality Aspects,” Inventions, vol. 2, no. 1, p. 4, Feb. 2017. [Google Scholar] [CrossRef]
- “DNV rules Part 4 Chapter 8 Section 2, 1.2. “DNV rules Part 4 Chapter 8 Section 2, 1.2.2 Maximum system voltages.
- A. Morandi, “HTS dc transmission and distribution: concepts, applications and benefits,” Supercond. Sci. Technol., vol. 28, no. 12, p. 123001, Dec. 2015. [CrossRef]
- D. C. van der Laan, C. H. D. C. van der Laan, C. H. Kim, S. V Pamidi, and J. D. Weiss, “A turnkey gaseous helium-cooled superconducting CORC ® dc power cable with integrated current leads,” Supercond. Sci. Technol., vol. 35, no. 6, p. 065002, Jun. 2022. [Google Scholar] [CrossRef]
- G. J. Tsekouras, F. D. G. J. Tsekouras, F. D. Kanellos, and J. Prousalidis, “Simplified method for the assessment of ship electric power systems operation cost reduction from energy storage and renewable energy sources integration,” IET Electr. Syst. Transp., vol. 5, no. 2, pp. 61–69, Jun. 2015. [Google Scholar] [CrossRef]
- R. F. Crețu, S. R. F. Crețu, S. Gheorghe, E. C. Șerban, D. Țuțui, and R. C. Crețu, “Analysis of Influencing Factors of the Energy Transition Process in Sustainable Nautical Tourism.” Aug. 2023; 03. [Google Scholar] [CrossRef]
- “DNV rules Part 4 Chapter 8 Section 2, 1.1. “DNV rules Part 4 Chapter 8 Section 2, 1.1.4 Types of distribution system.
- A. Kelmalis, A. A. Kelmalis, A. Dimou, D. F. Lekkas, and S. Vakalis, “Cold Ironing and the Study of RES Utilization for Maritime Electrification on Lesvos Island Port,” Environments, vol. 11, no. 4, p. 84, Apr. 2024. [Google Scholar] [CrossRef]
- A. G. Alisafaki and A. D. Papanikolaou, “On the Energy Efficiency Design Index of Ro-Ro passenger and Ro-Ro cargo ships,” Proc. Inst. Mech. Eng. Part M J. Eng. Marit. Environ., vol. 231, no. 1, pp. 19–30, Feb. 2017. [CrossRef]
- Y. Lu, Z. Y. Lu, Z. Gu, S. Liu, C. Wu, W. Shao, and C. Li, “Research on Main Engine Power of Transport Ship with Different Bows in Ice Area According to EEDI Regulation,” J. Mar. Sci. Eng., vol. 9, no. 11, p. 1241, Nov. 2021. [Google Scholar] [CrossRef]
- Ö. E. Karaçay, Ç. Karatuğ, T. Uyanık, Y. Arslanoğlu, and A. Lashab, “Prediction of Ship Main Particulars for Harbor Tugboats Using a Bayesian Network Model and Non-Linear Regression,” Appl. Sci., vol. 14, no. 7, p. 2891, Mar. 2024. [CrossRef]
- “EMSA (European Maritime Safety Agency). Quick-reference guide for devel-opment of shore-side electricity/ ops in maritime ports.
- R. Yang, Y. R. Yang, Y. Yuan, R. Ying, B. Shen, and T. Long, “A Novel Energy Management Strategy for a Ship’s Hybrid Solar Energy Generation System Using a Particle Swarm Optimization Algorithm,” Energies, vol. 13, no. 6, p. 1380, Mar. 2020. [Google Scholar] [CrossRef]
- G. S. Spagnolo, D. G. S. Spagnolo, D. Papalillo, A. Martocchia, and G. Makary, “Solar-Electric Boat,” J. Transp. Technol., vol. 02, no. 02, pp. 2012. [Google Scholar] [CrossRef]
- H. Lan et al., “Modeling and Stability Analysis of Hybrid PV/Diesel/ESS in Ship Power System,” Inventions, vol. 1, no. 1, p. 5, Mar. 2016. [CrossRef]
- A. G. Elkafas, “Numerical investigation of photovoltaic solar system performance for a high-speed ship.” Jan. 2024; 25. [CrossRef]
- B. Sudjasta, P. B. Sudjasta, P. Suranto, D. Montreano, and R. Rizal, “THE DESIGN OF 3 GT FISHING VESSELS USING DC ELECTRIC POWER AS DRIVING AND ELECTRICITY,” J. Rekayasa Mesin, vol. 16, no. 3, p. 329, Dec. 2021. [Google Scholar] [CrossRef]
- P. Pratama and M. D. Arifin, “Analysis of Solar Panel Energy Consumption on Tourist Boats in Labuan Bajo,” Int. J. Mar. Eng. Innov. Res., vol. 8, no. 4, Nov. 2023. [CrossRef]
- O. Petrychenko, M. O. Petrychenko, M. Levinskyi, S. Goolak, and V. Lukoševičius, “Solar Energy: Revolutionizing Shipping Industry Towards Sustainability and Environmental Stewardship.” Feb. 2024; 02. [Google Scholar] [CrossRef]
- L. McAllister and H. Wang, “Techno-Economic and Environmental Analysis of the Integration of PV Systems into Hybrid Vessels,” Energies, vol. 17, no. 10, p. 20 May 2303; 24. [CrossRef]
- E. Lee, J. E. Lee, J. Khan, U. Zaman, J. Ku, S. Kim, and K. Kim, “Synthetic Maritime Traffic Generation System for Performance Verification of Maritime Autonomous Surface Ships,” Appl. Sci., vol. 14, no. 3, p. 1176, Jan. 2024. [Google Scholar] [CrossRef]
- Y. Yuan, T. Y. Yuan, T. Zhang, B. Shen, X. Yan, and T. Long, “A Fuzzy Logic Energy Management Strategy for a Photovoltaic/Diesel/Battery Hybrid Ship Based on Experimental Database,” Energies, vol. 11, no. 9, p. 2211, Aug. 2018. [Google Scholar] [CrossRef]
- “SOLAS reg. II-2/13.1.3 as referred to by MODU Code 9.7.1.
- A. Nikoyan, L. O. A. Nikoyan, L. O. Alwi, and N. M. Rahni, “Assessing Feasibility and Sustainability against Corn Commodities in Muna Areas, Southeast Sulawesi, Indonesia: A Comprehensive Analysis,” Agric. Sci. Dig.—A Res. J., no. Of, Nov. 2023. [Google Scholar] [CrossRef]
- M. F. Abakar et al., “Evaluation of the Feasibility and Sustainability of the Joint Human and Animal Vaccination and Its Integration to the Public Health System in the Danamadji Health District, Chad.” Feb. 2021; 04. [CrossRef]
- M. S. Correia, “Sustainability,” Int. J. Strateg. Eng., vol. 2, no. 1, pp. 29–38, Jan. 2019. [CrossRef]
Figure 1.
On-board AC and DC networks.
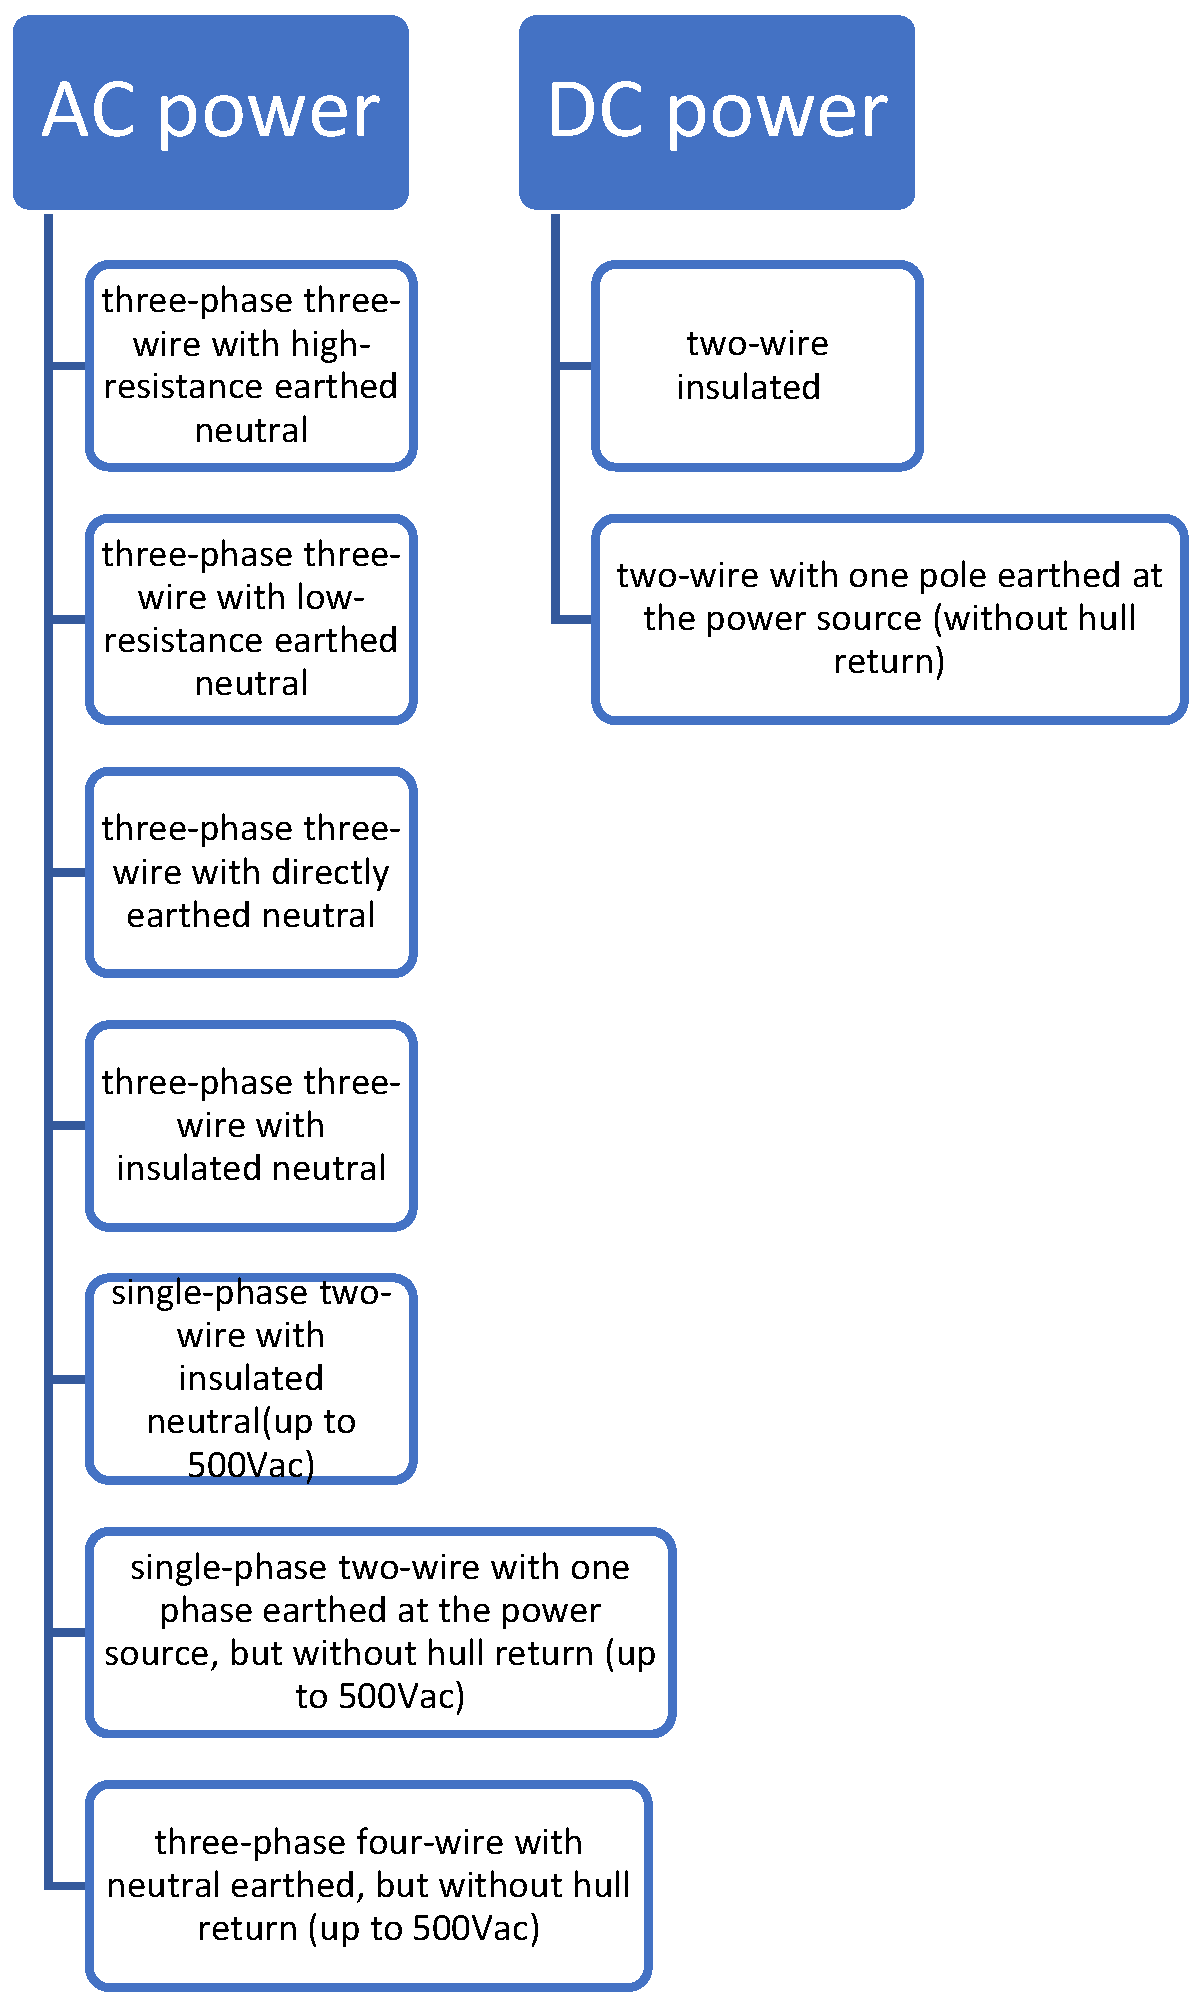
Figure 1.
Ship analyzed in the present work.
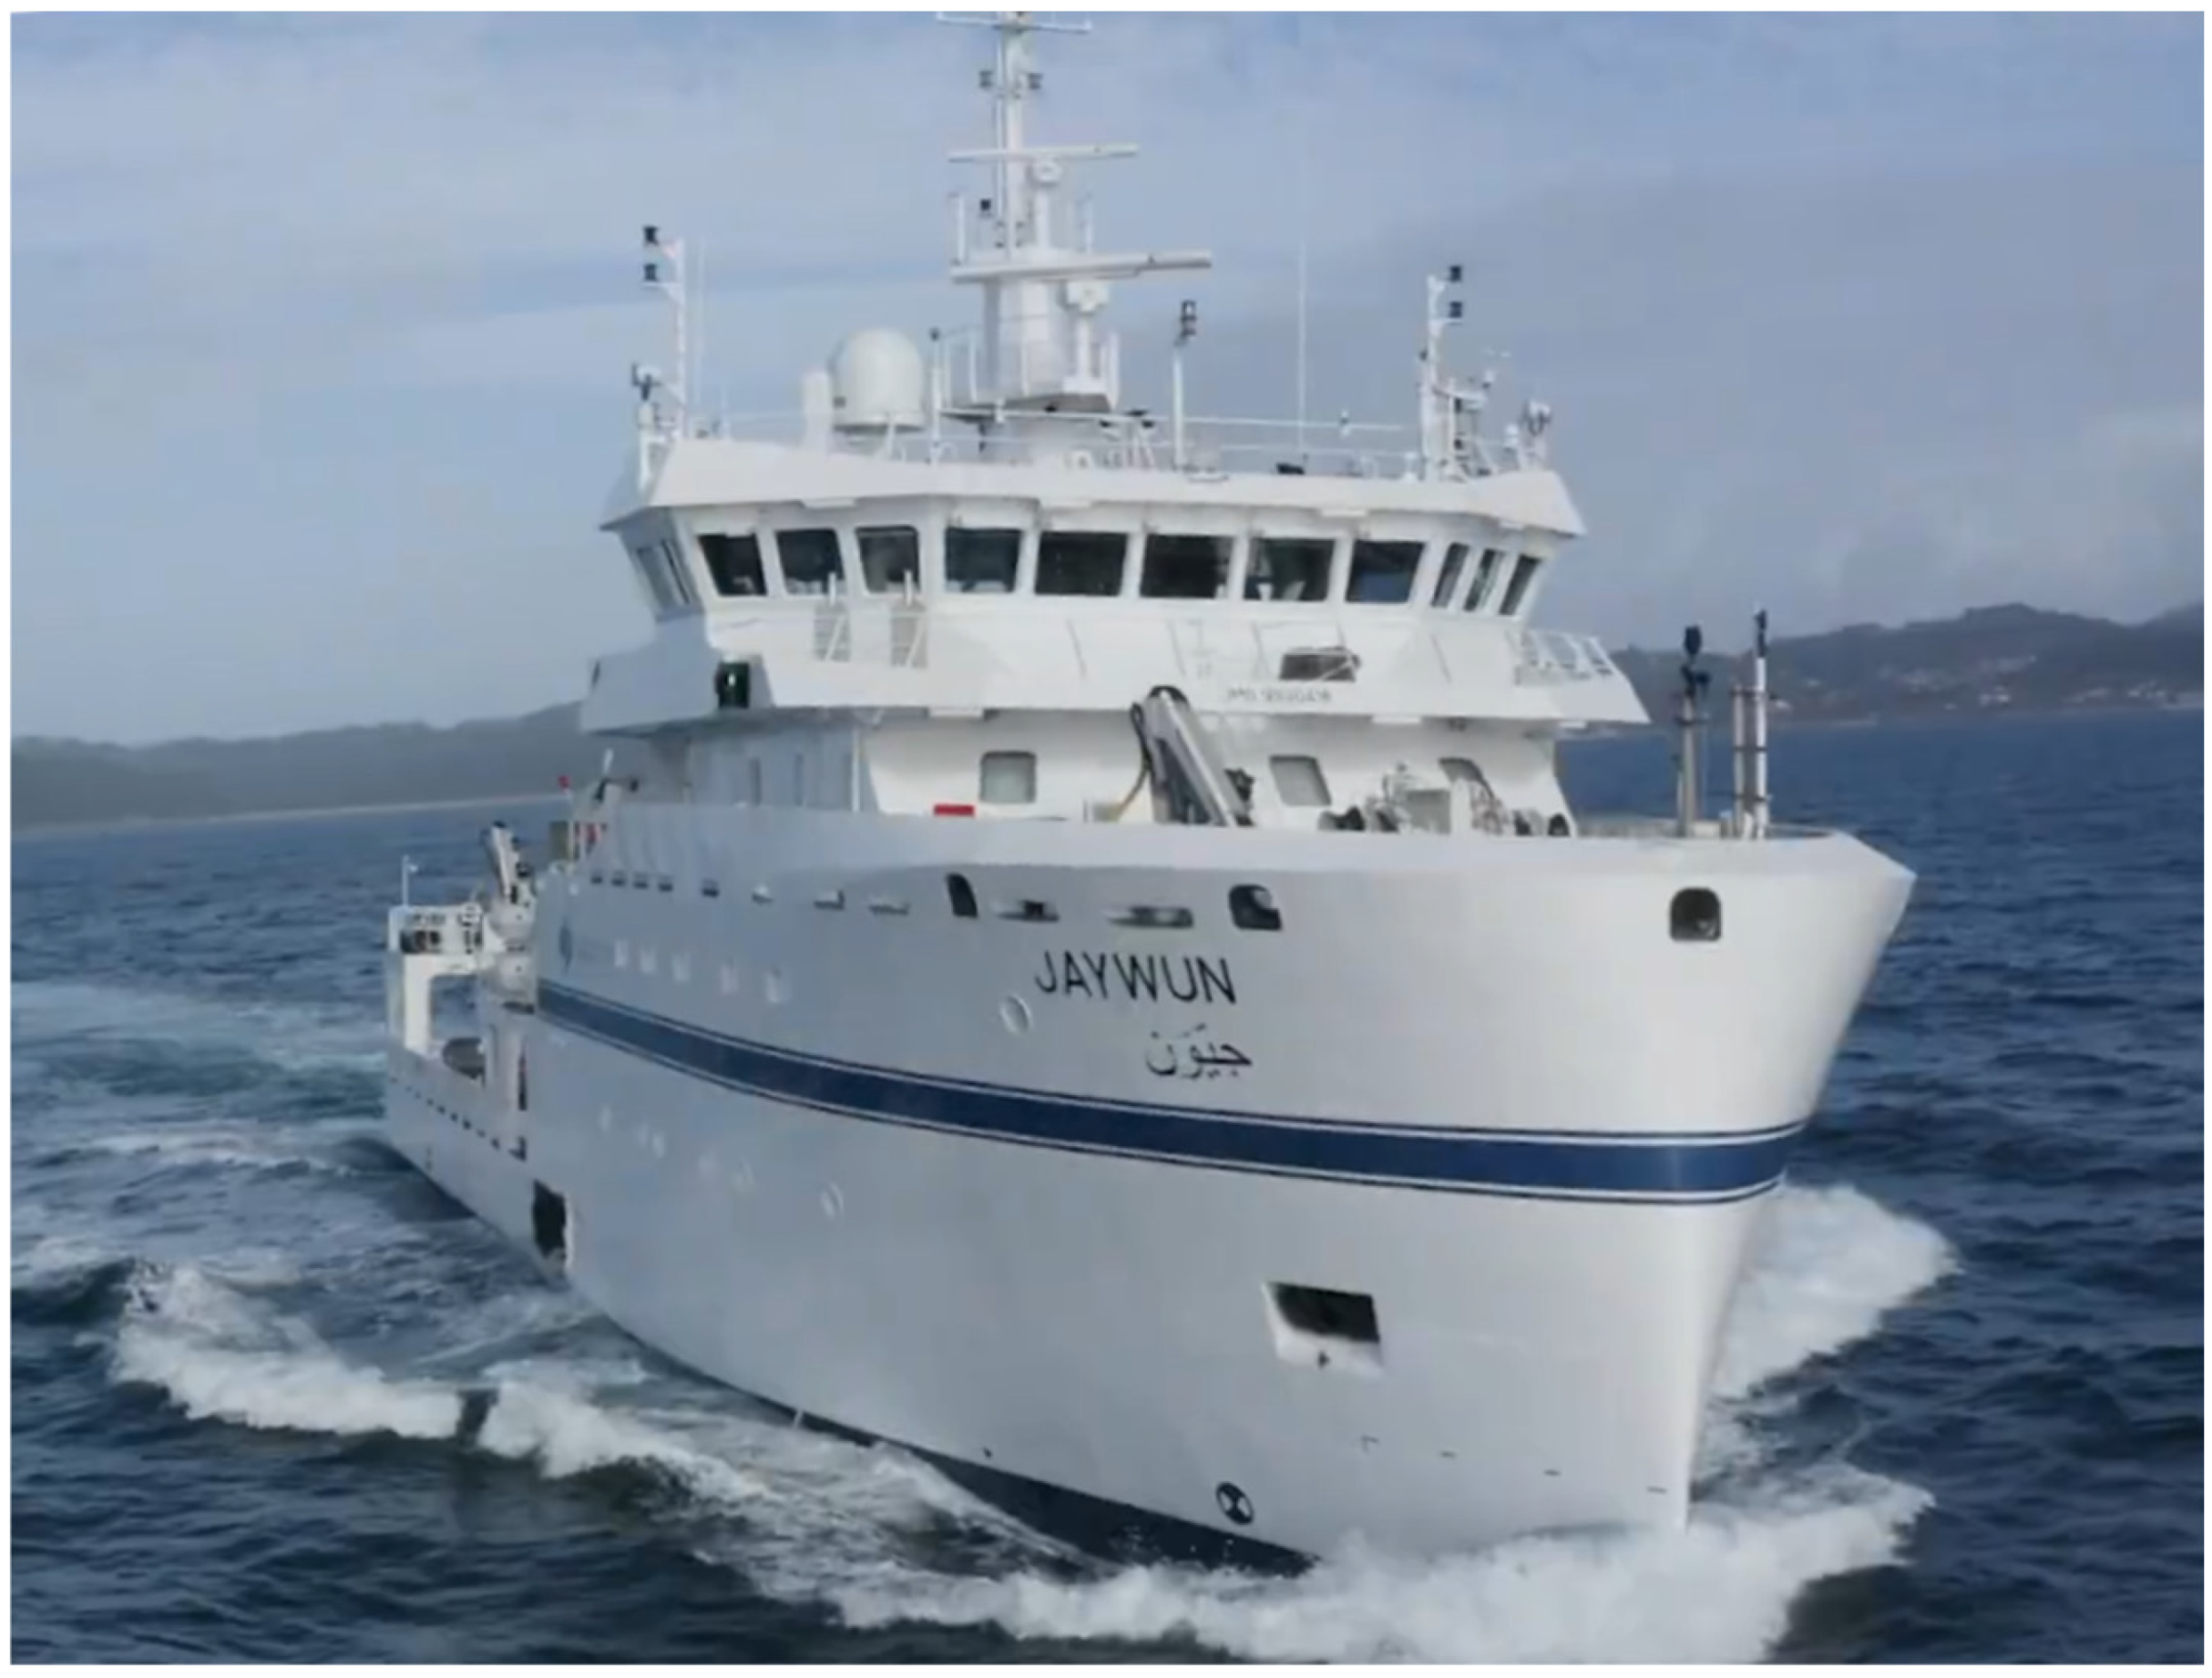
Figure 2.
Topology of the installed fire system.
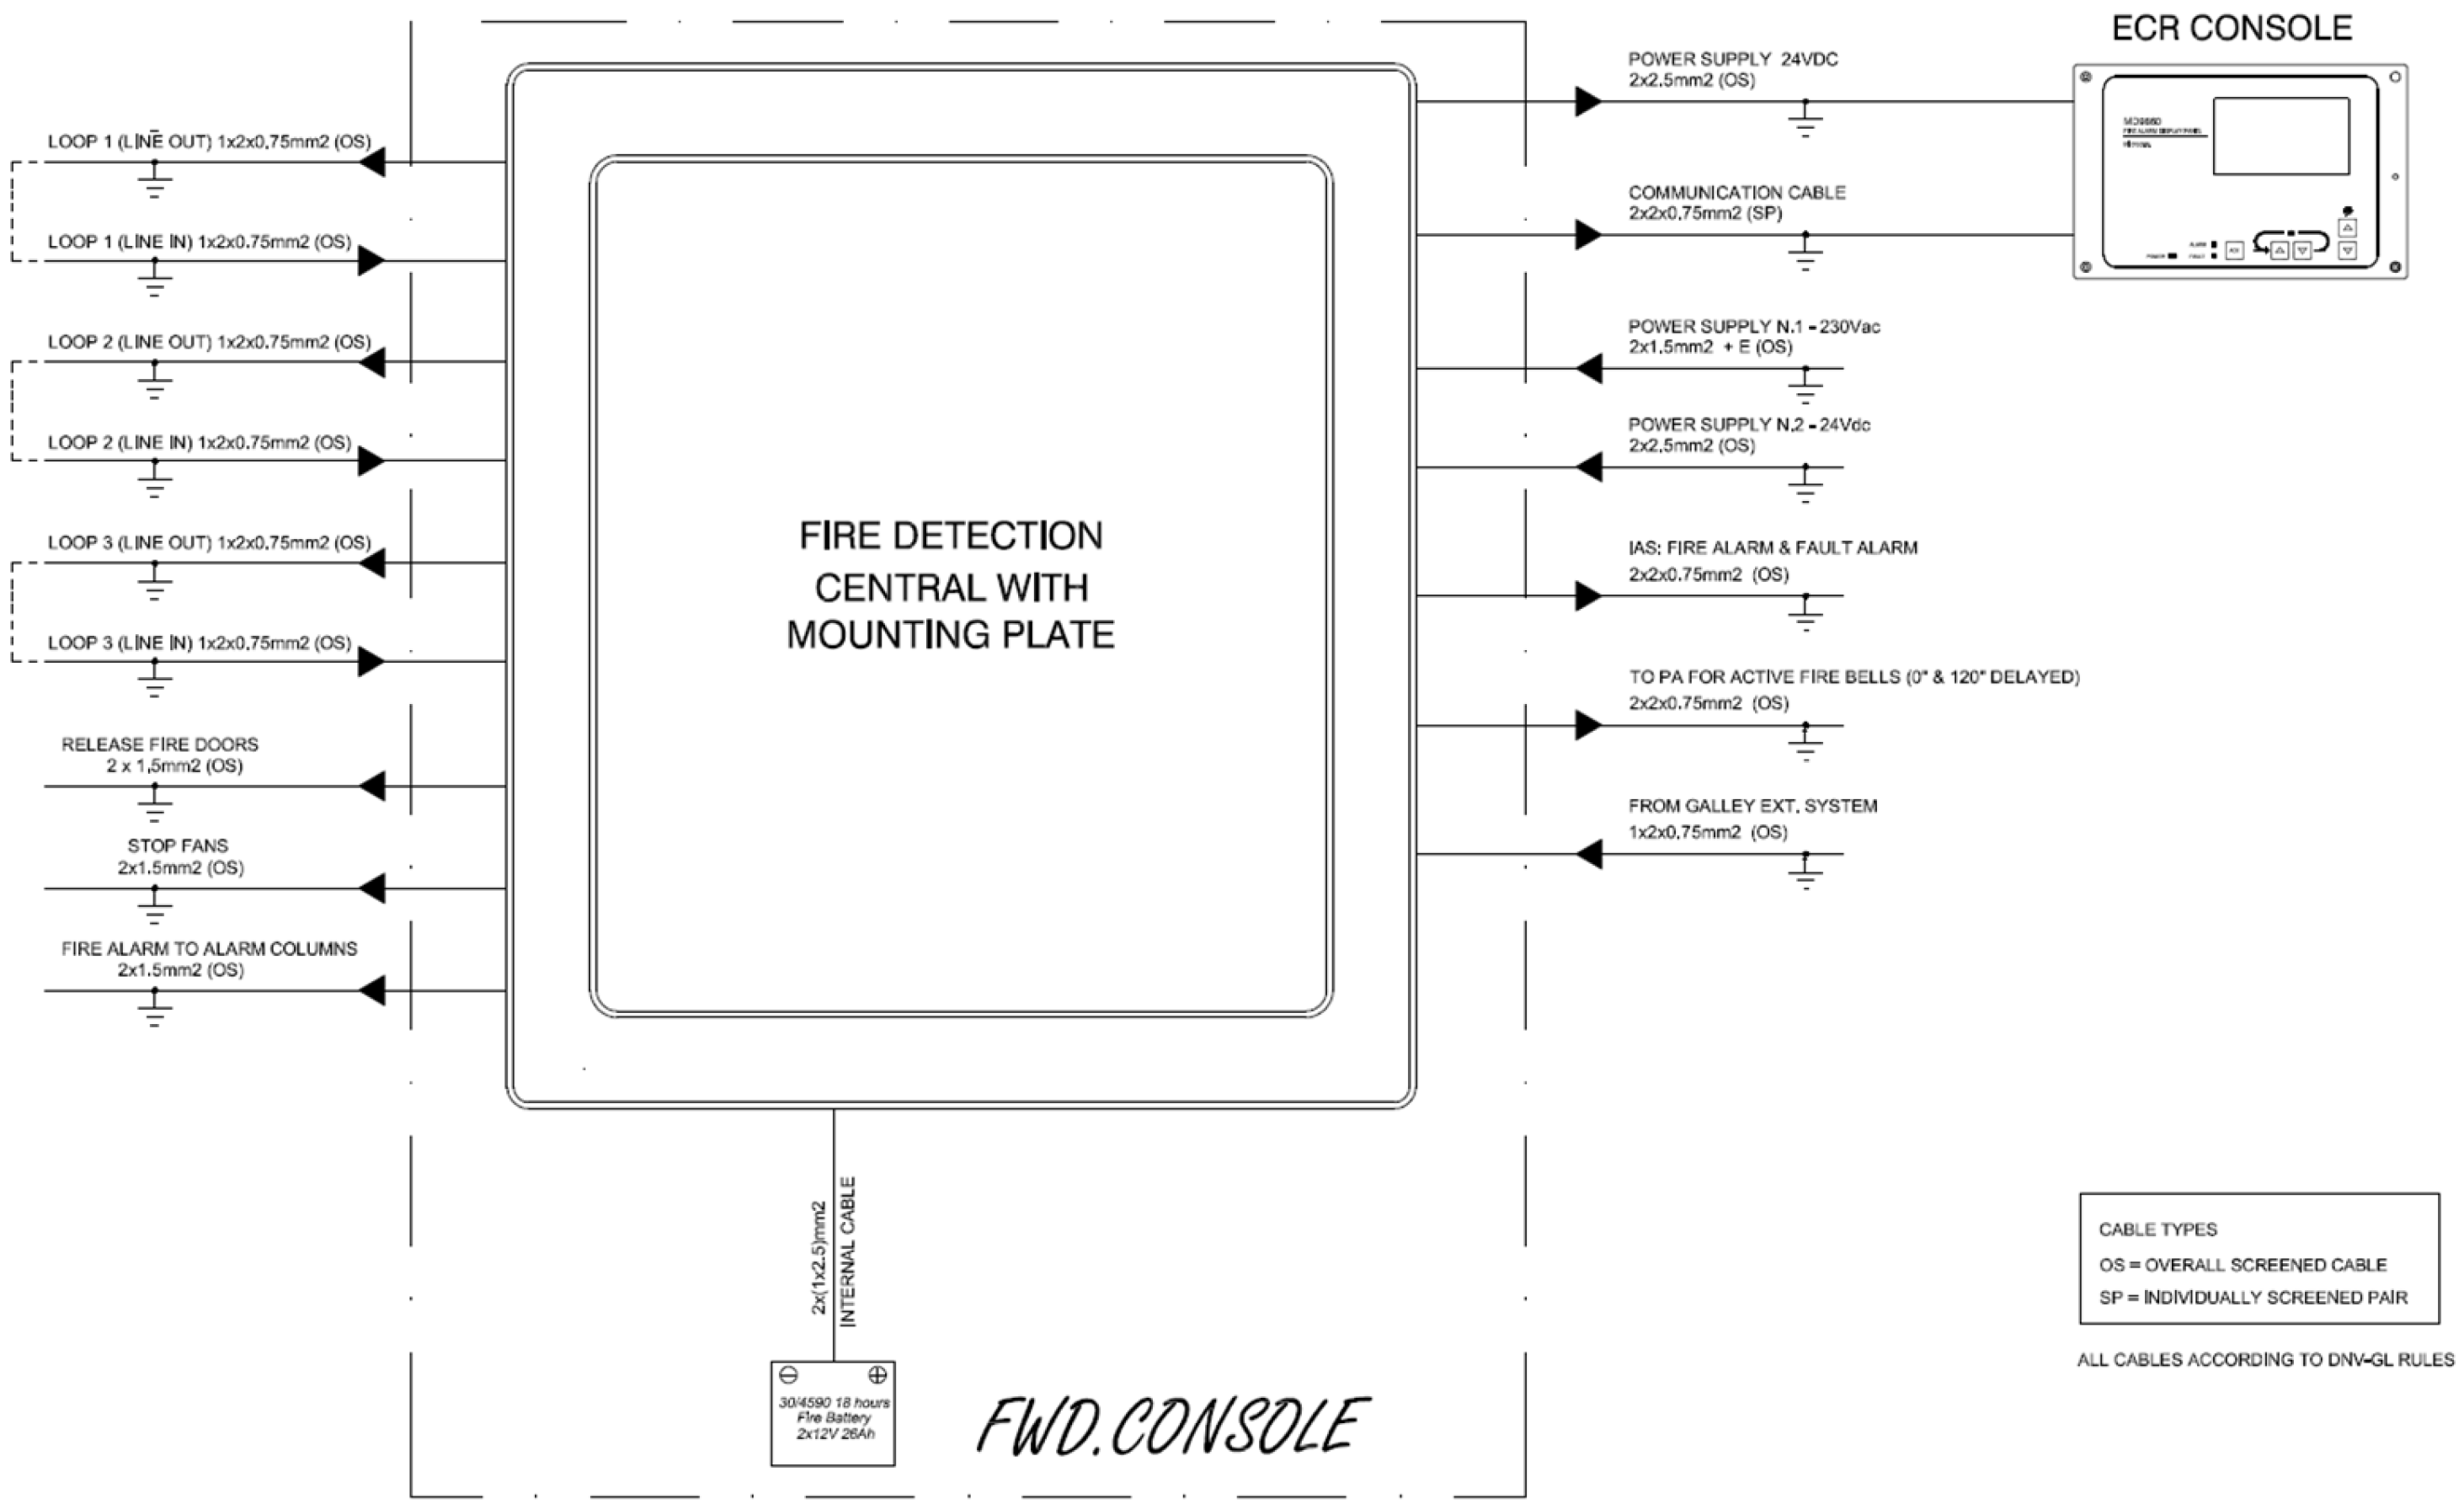
Figure 3.
Fire detection main central unit.
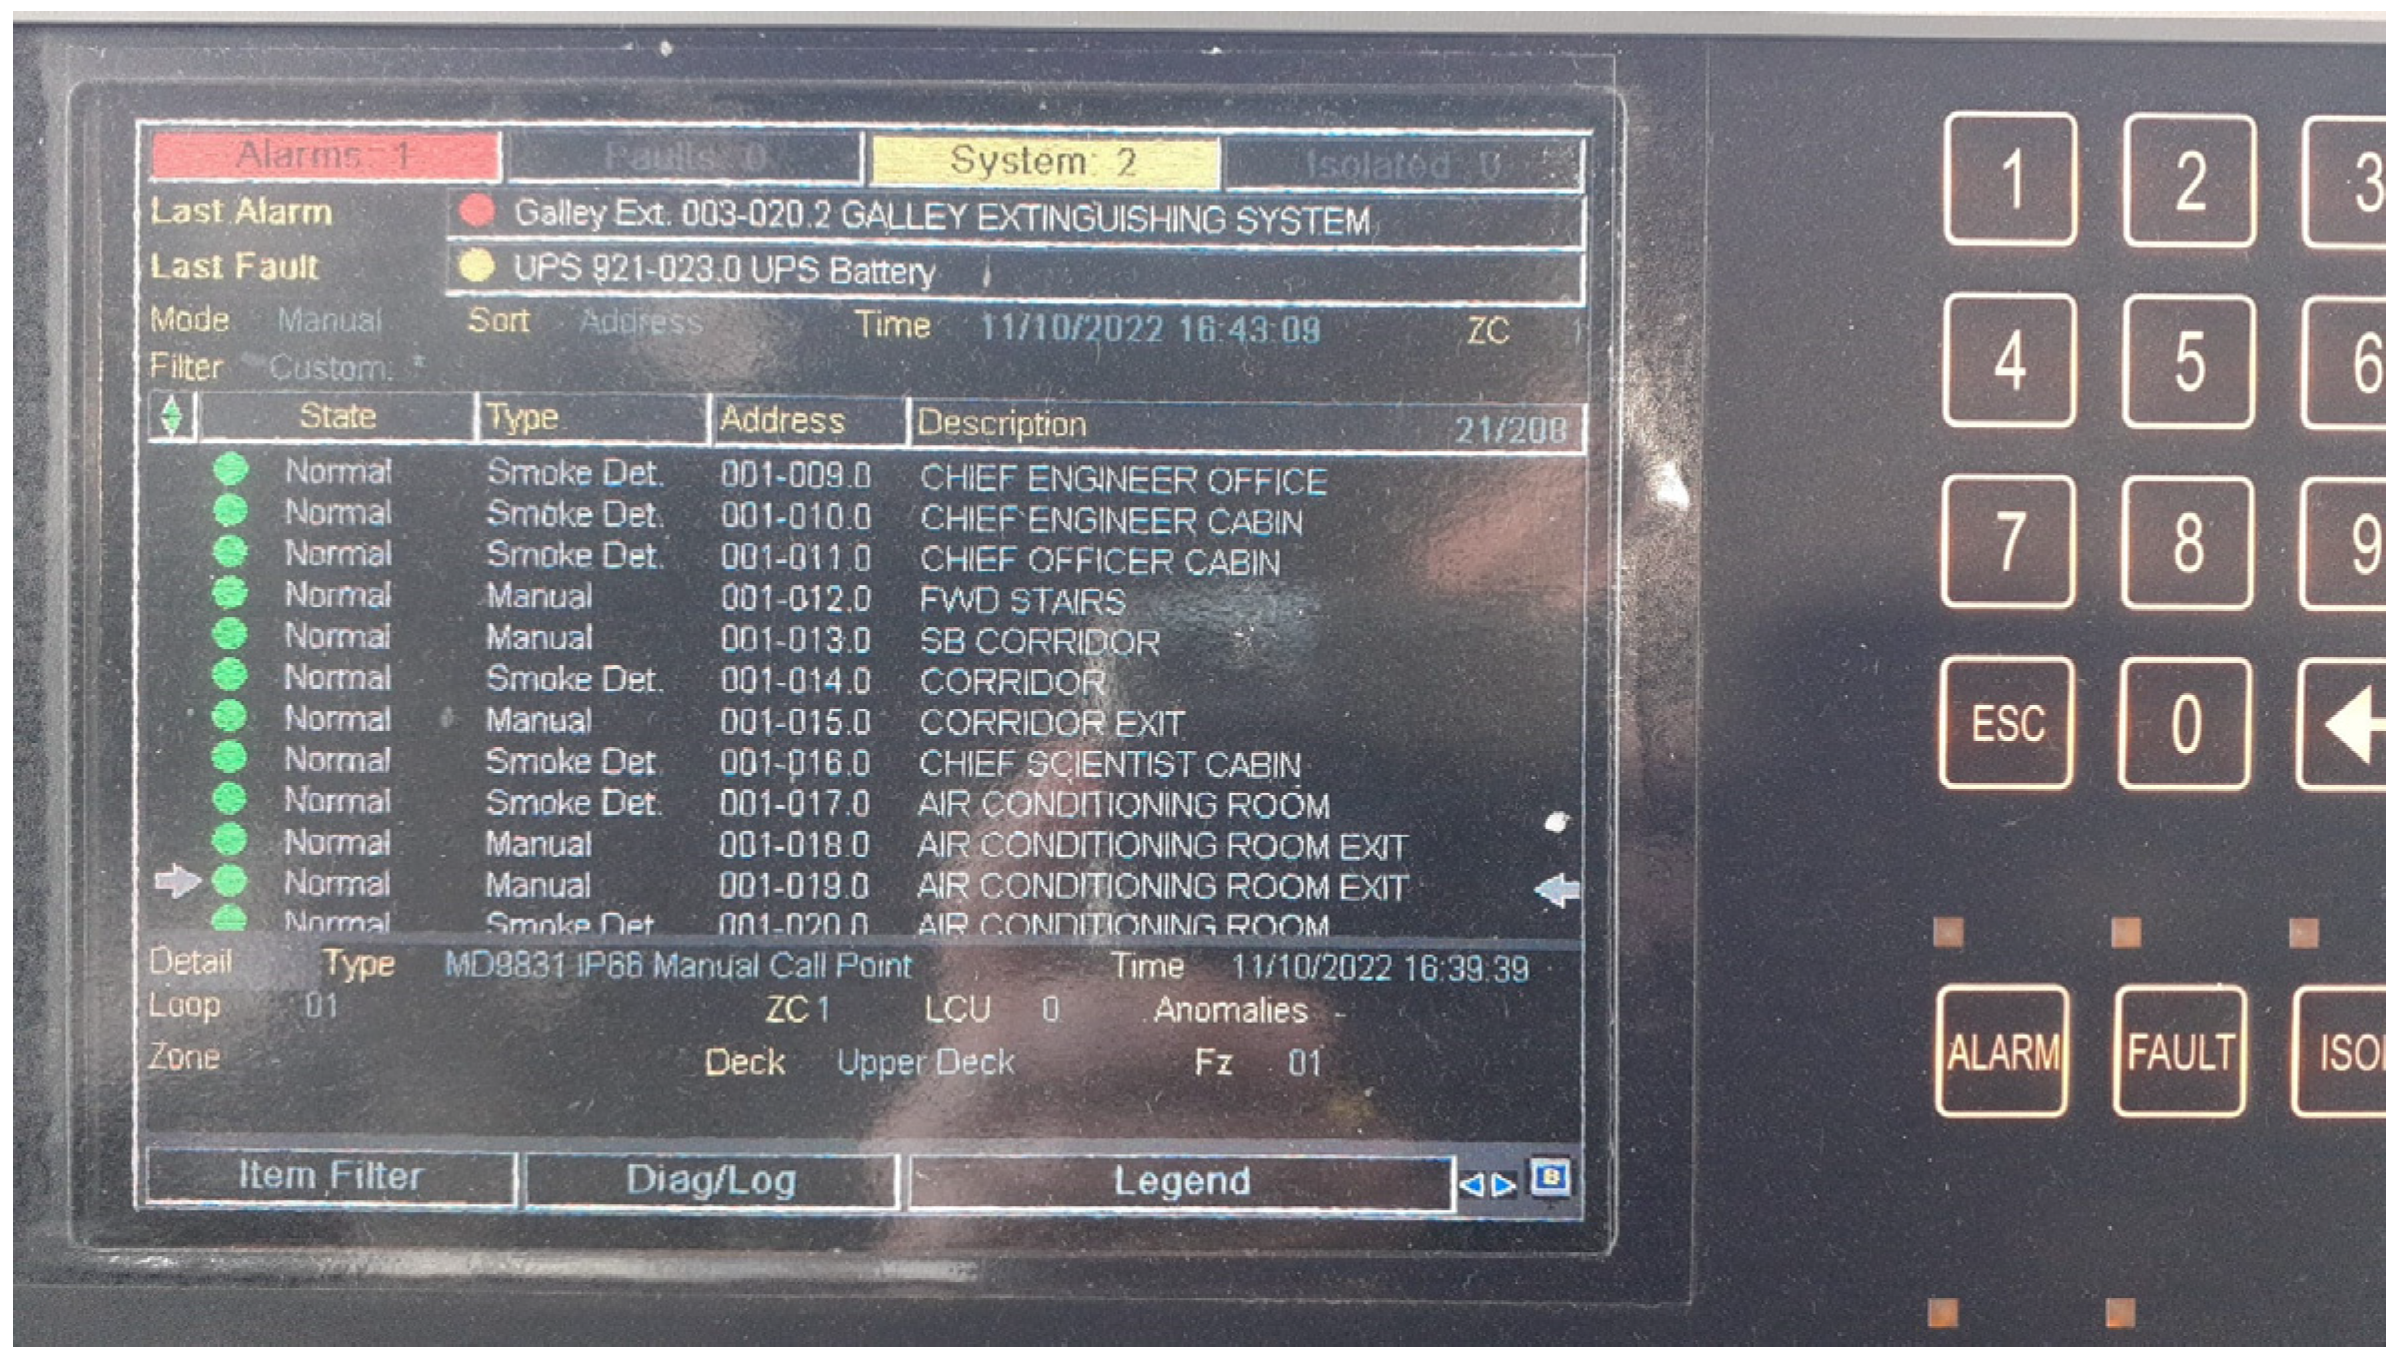
Figure 4.
Accommodation loop.
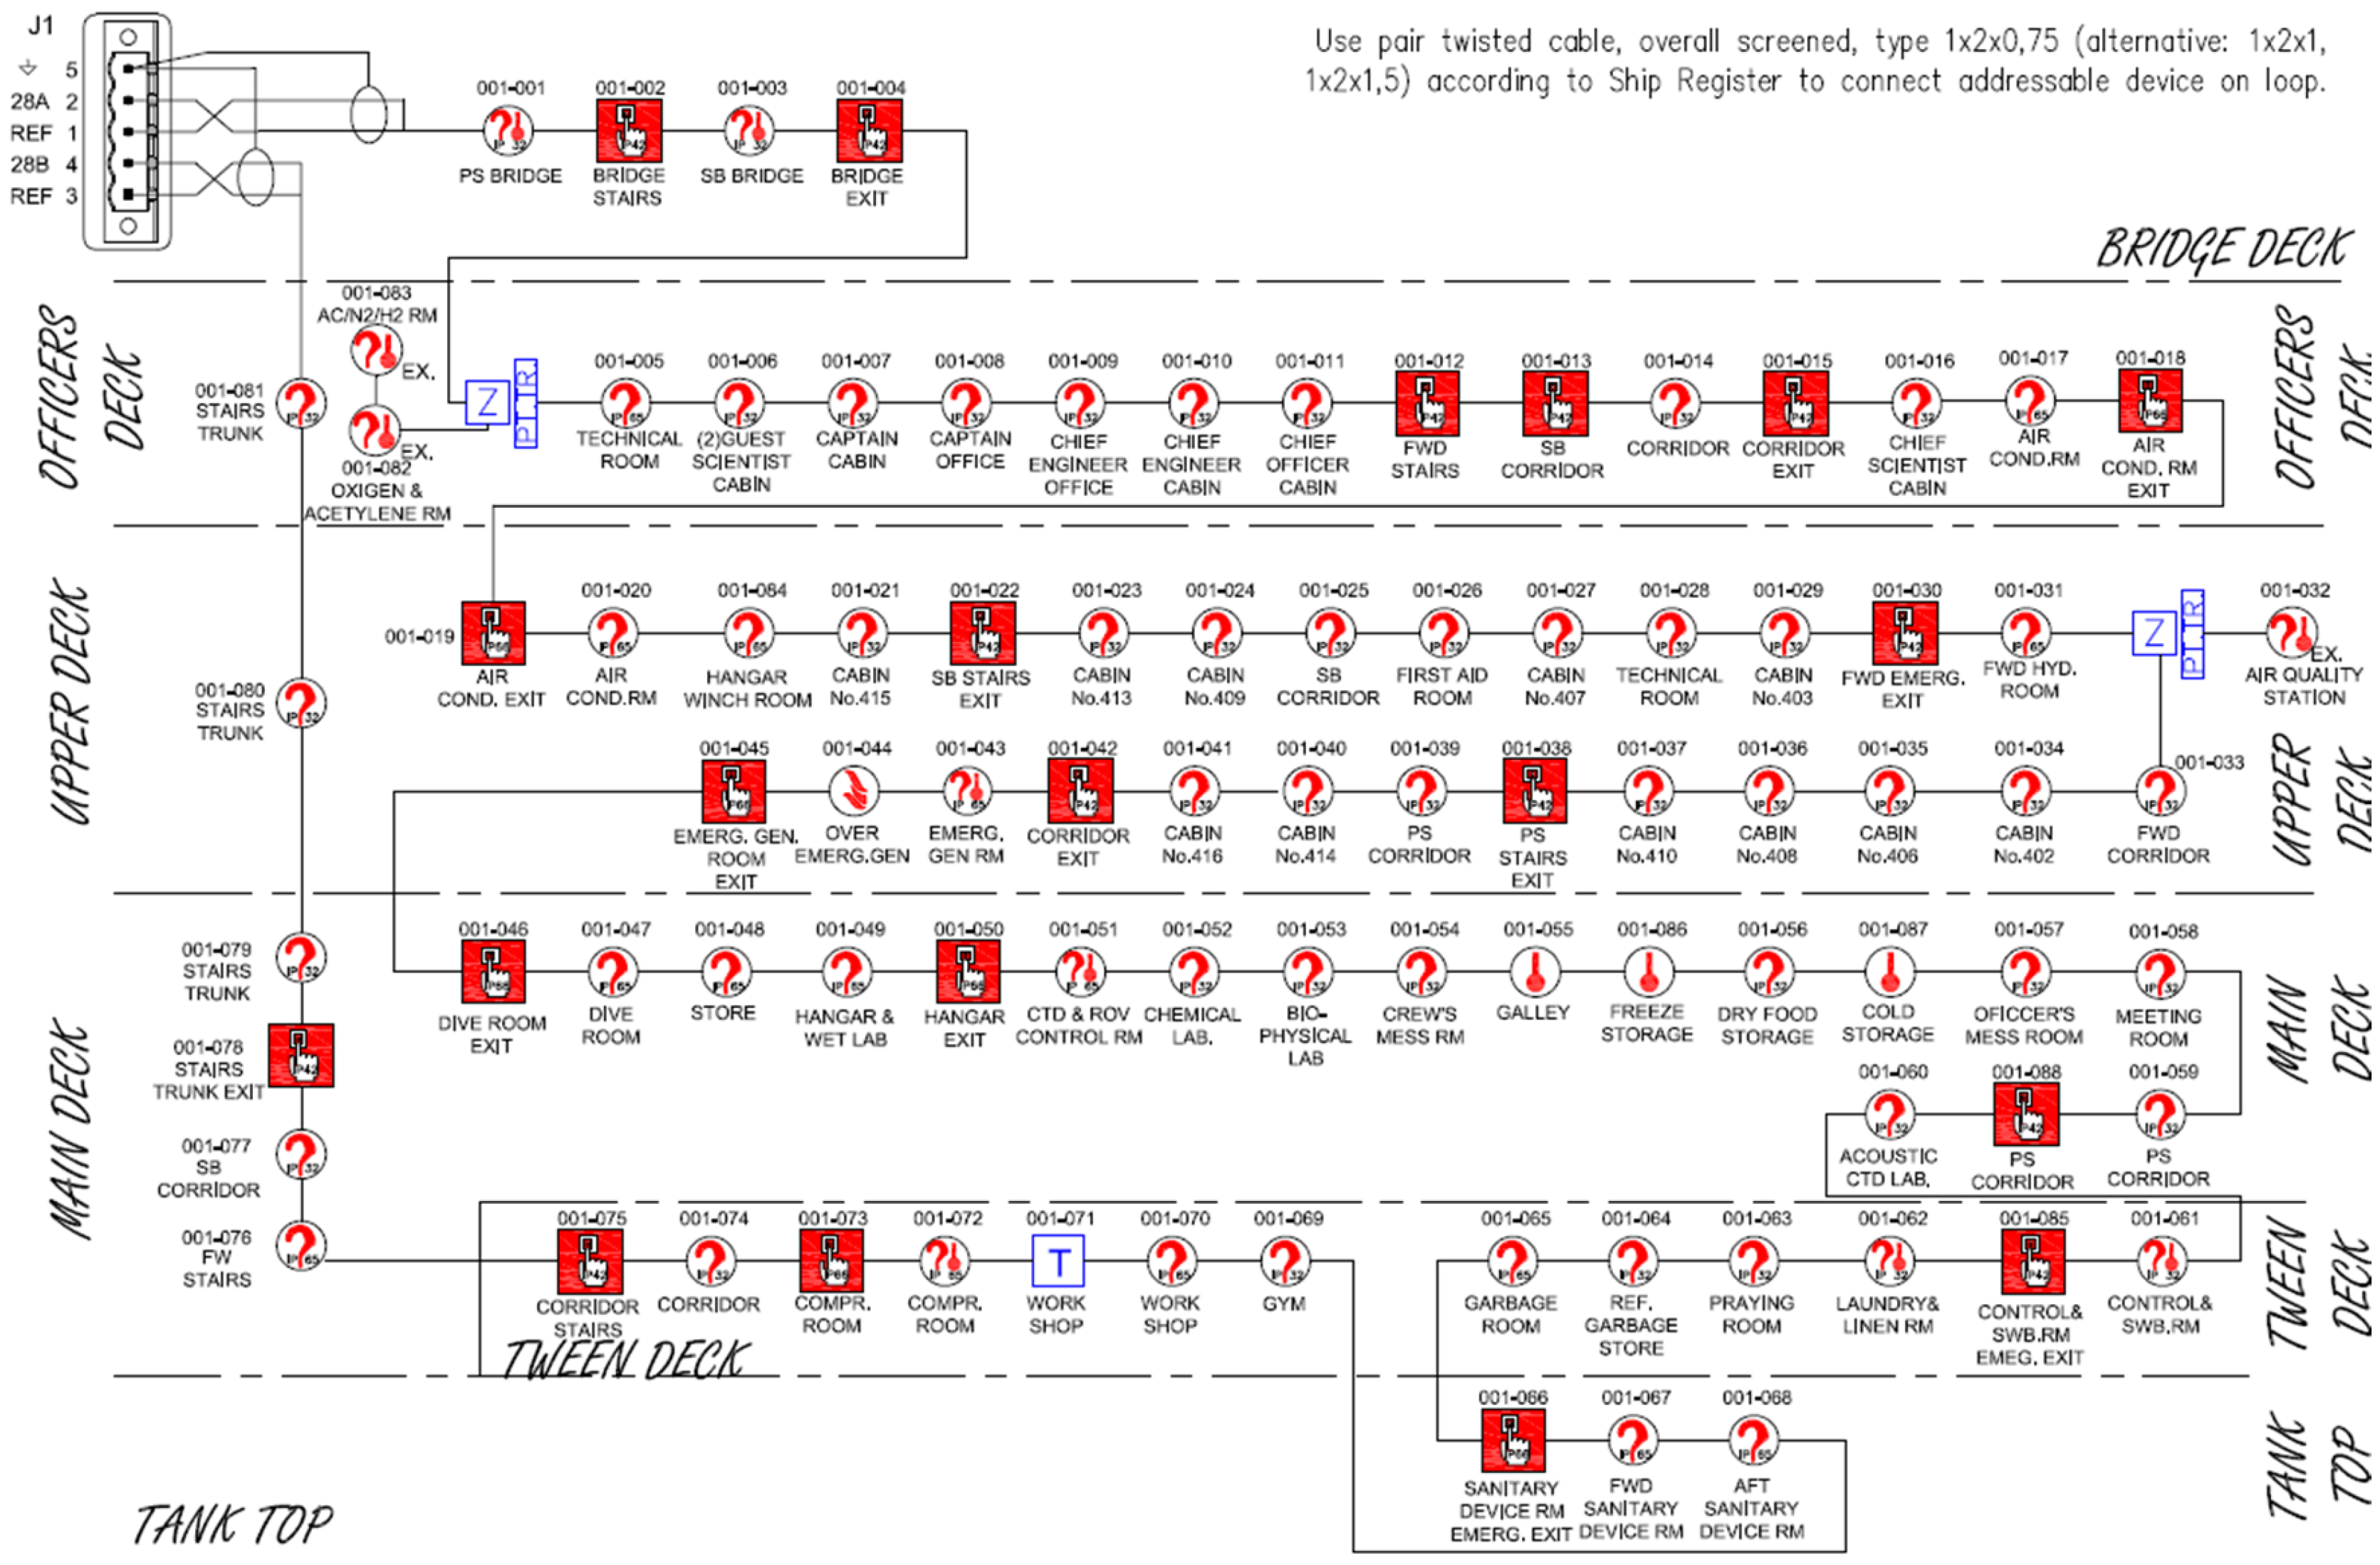
Figure 5.
Installed equipment for the fire detection system.
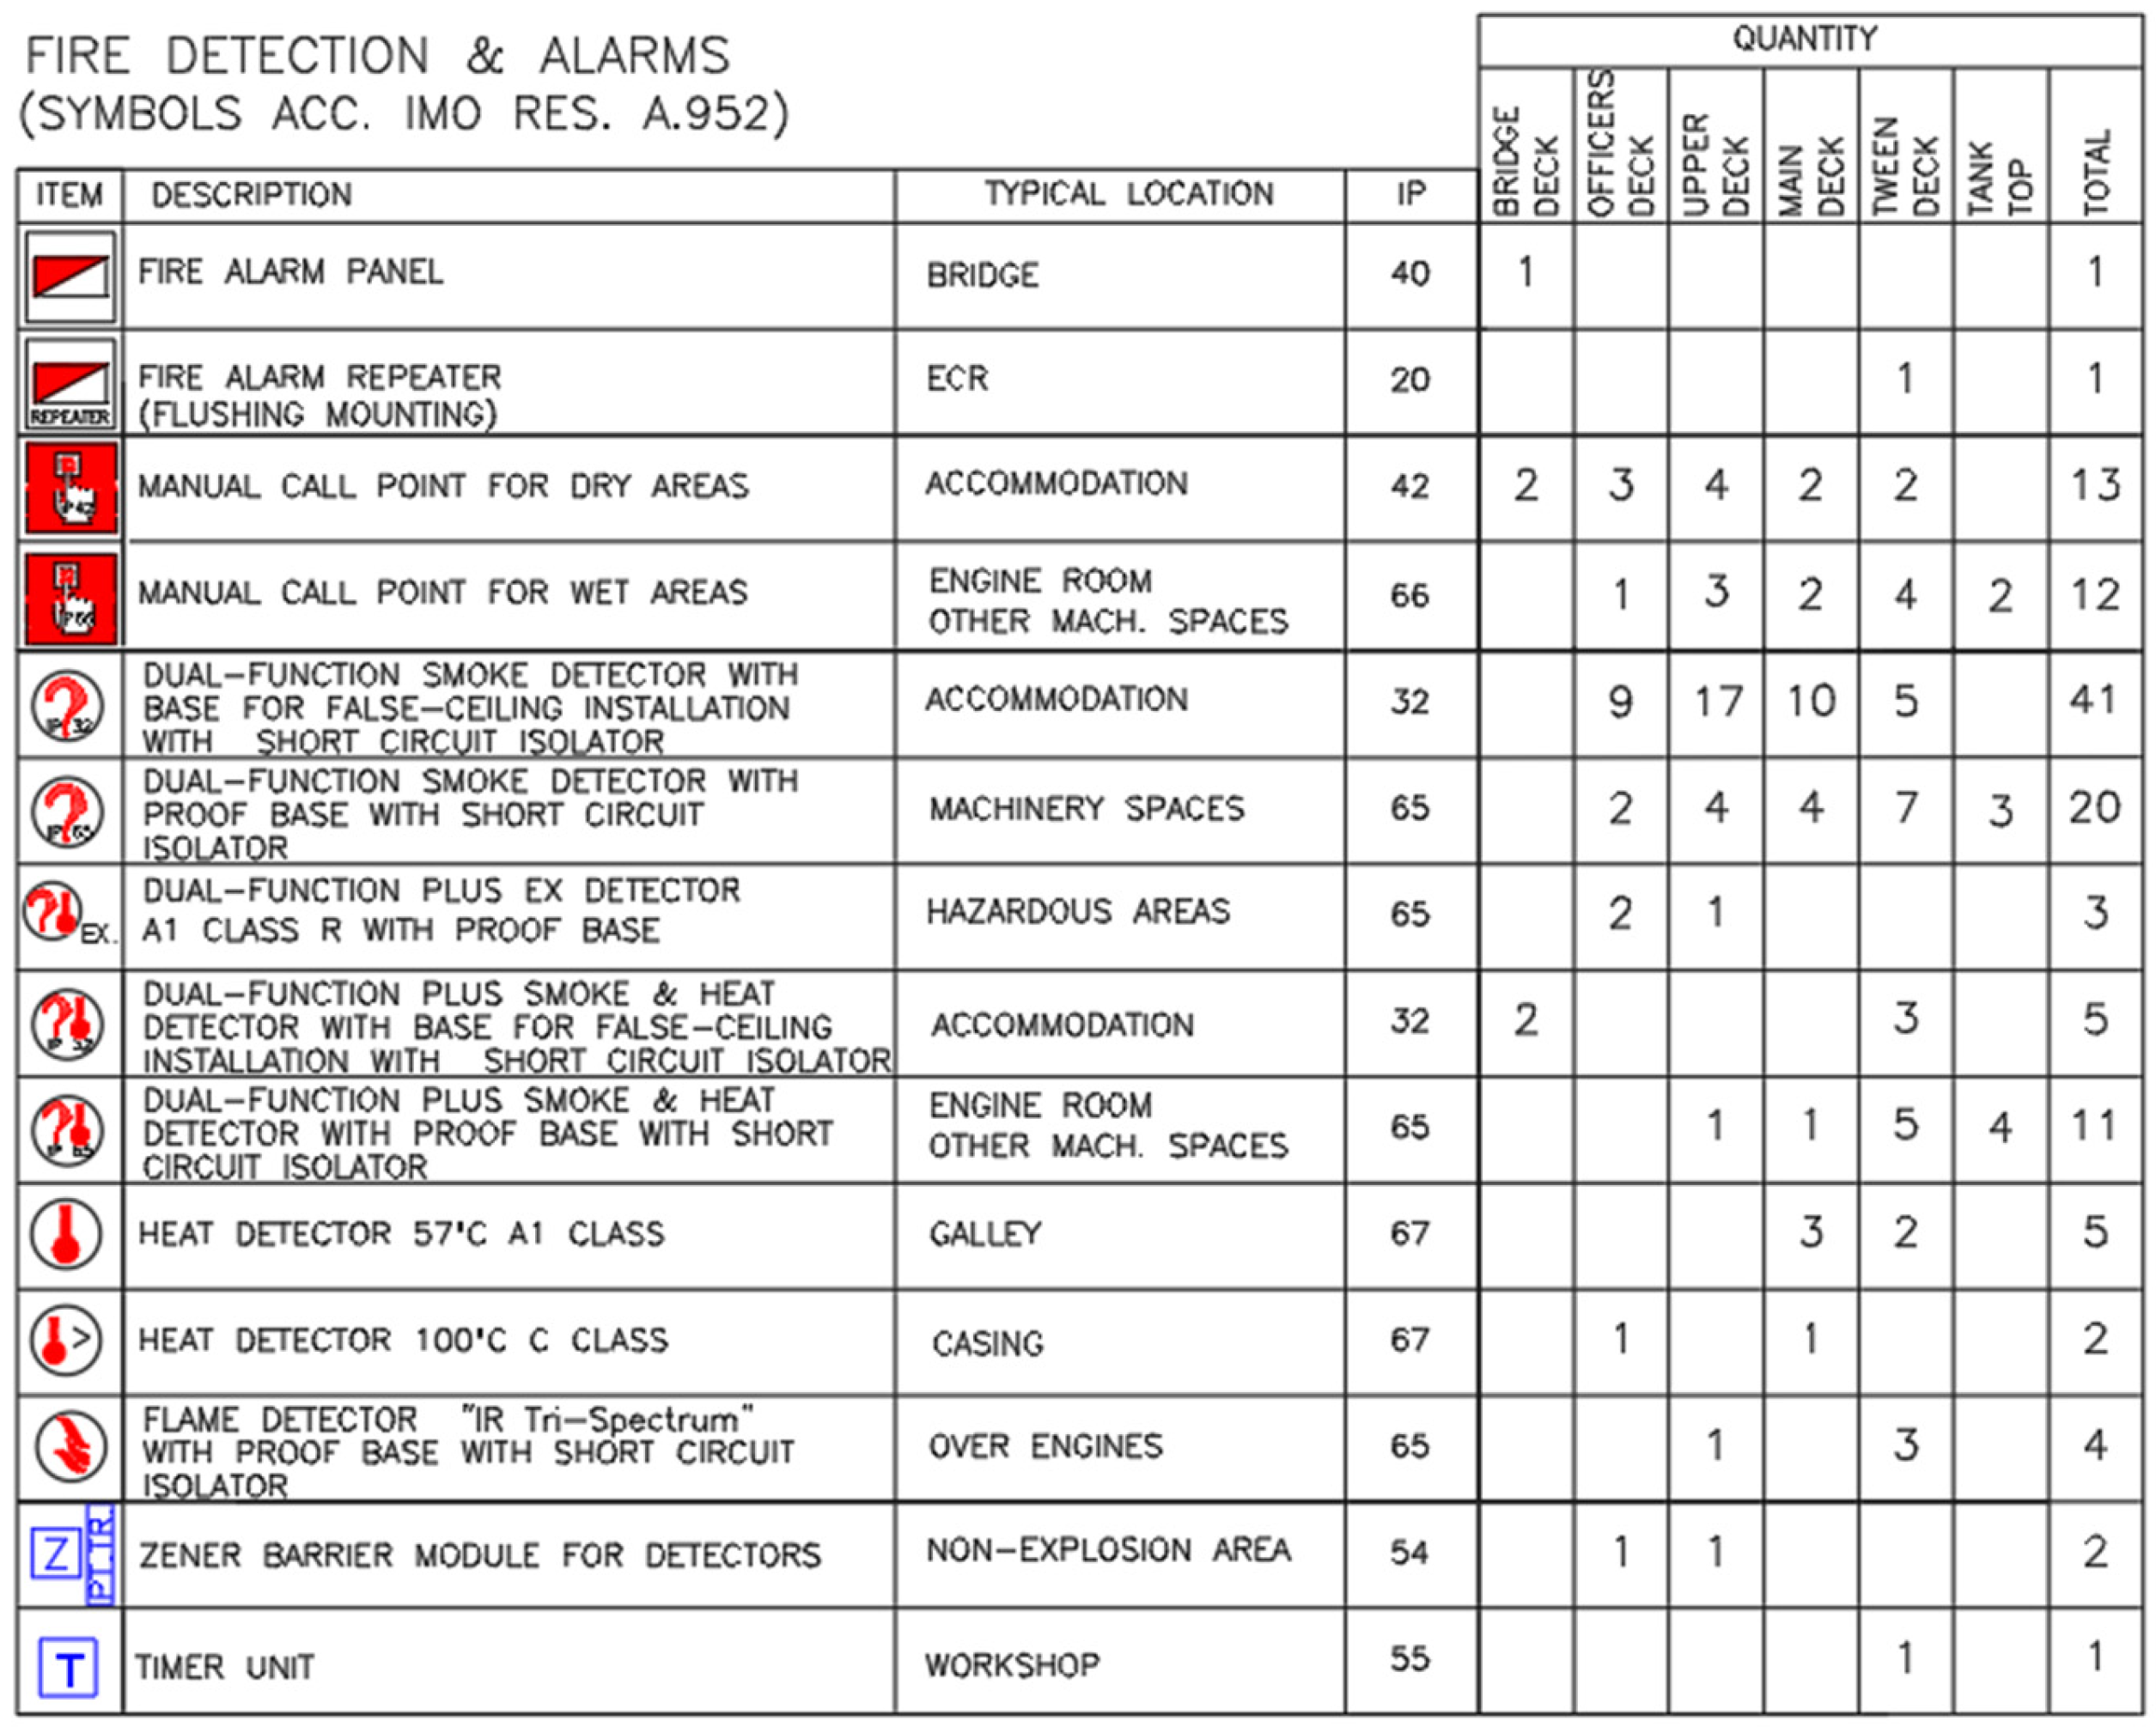
Figure 6.
Installed smoke detector.
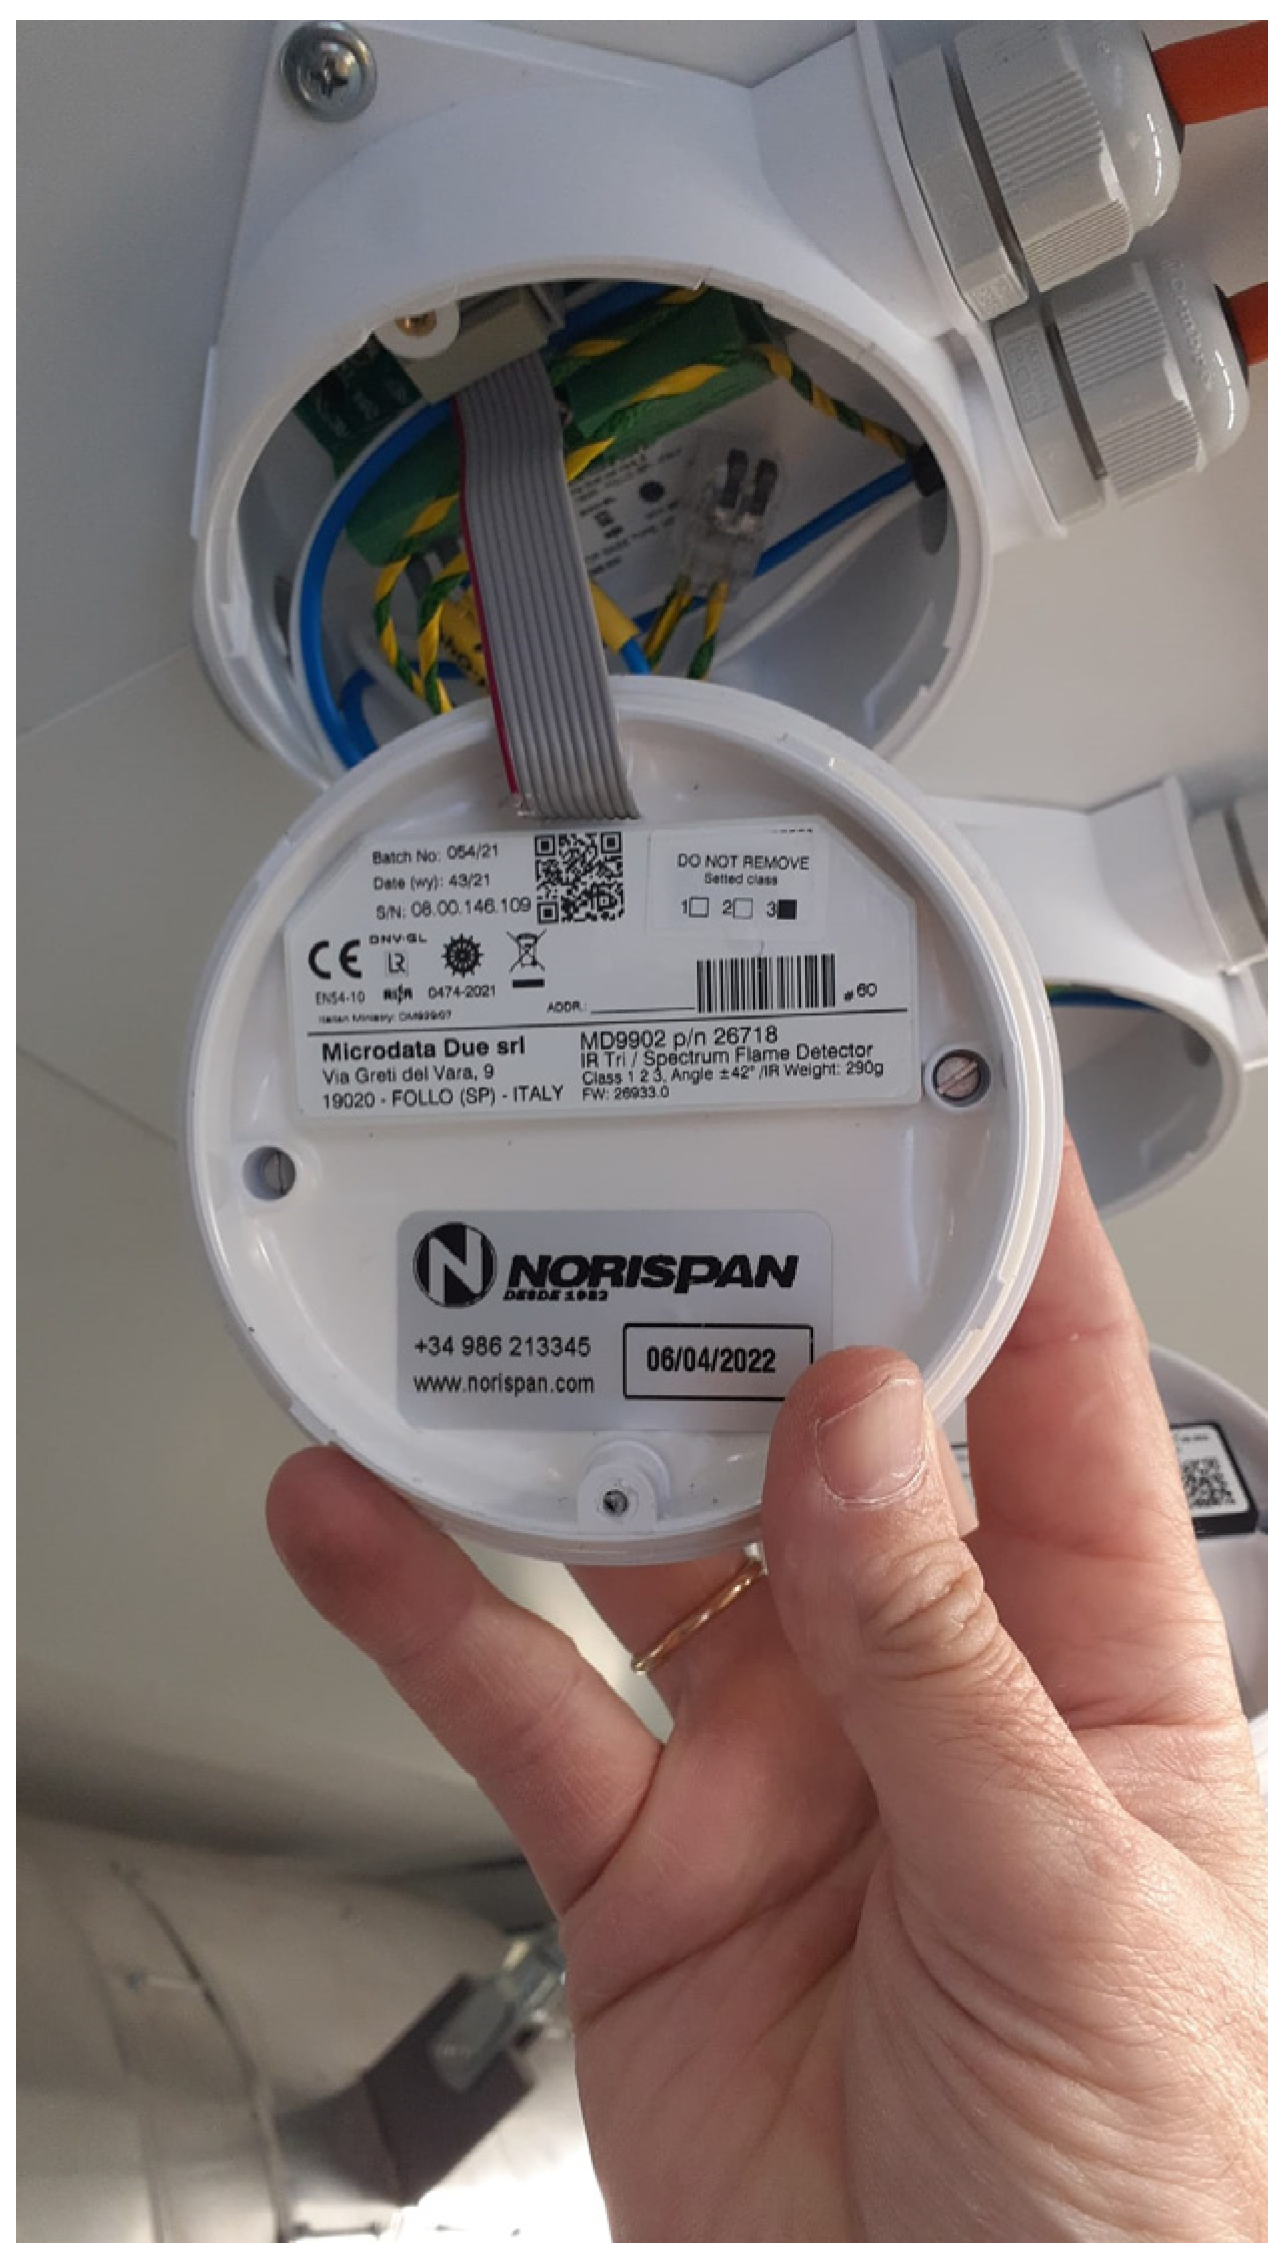
Figure 6.
Results of the weight sensitivity analysis.
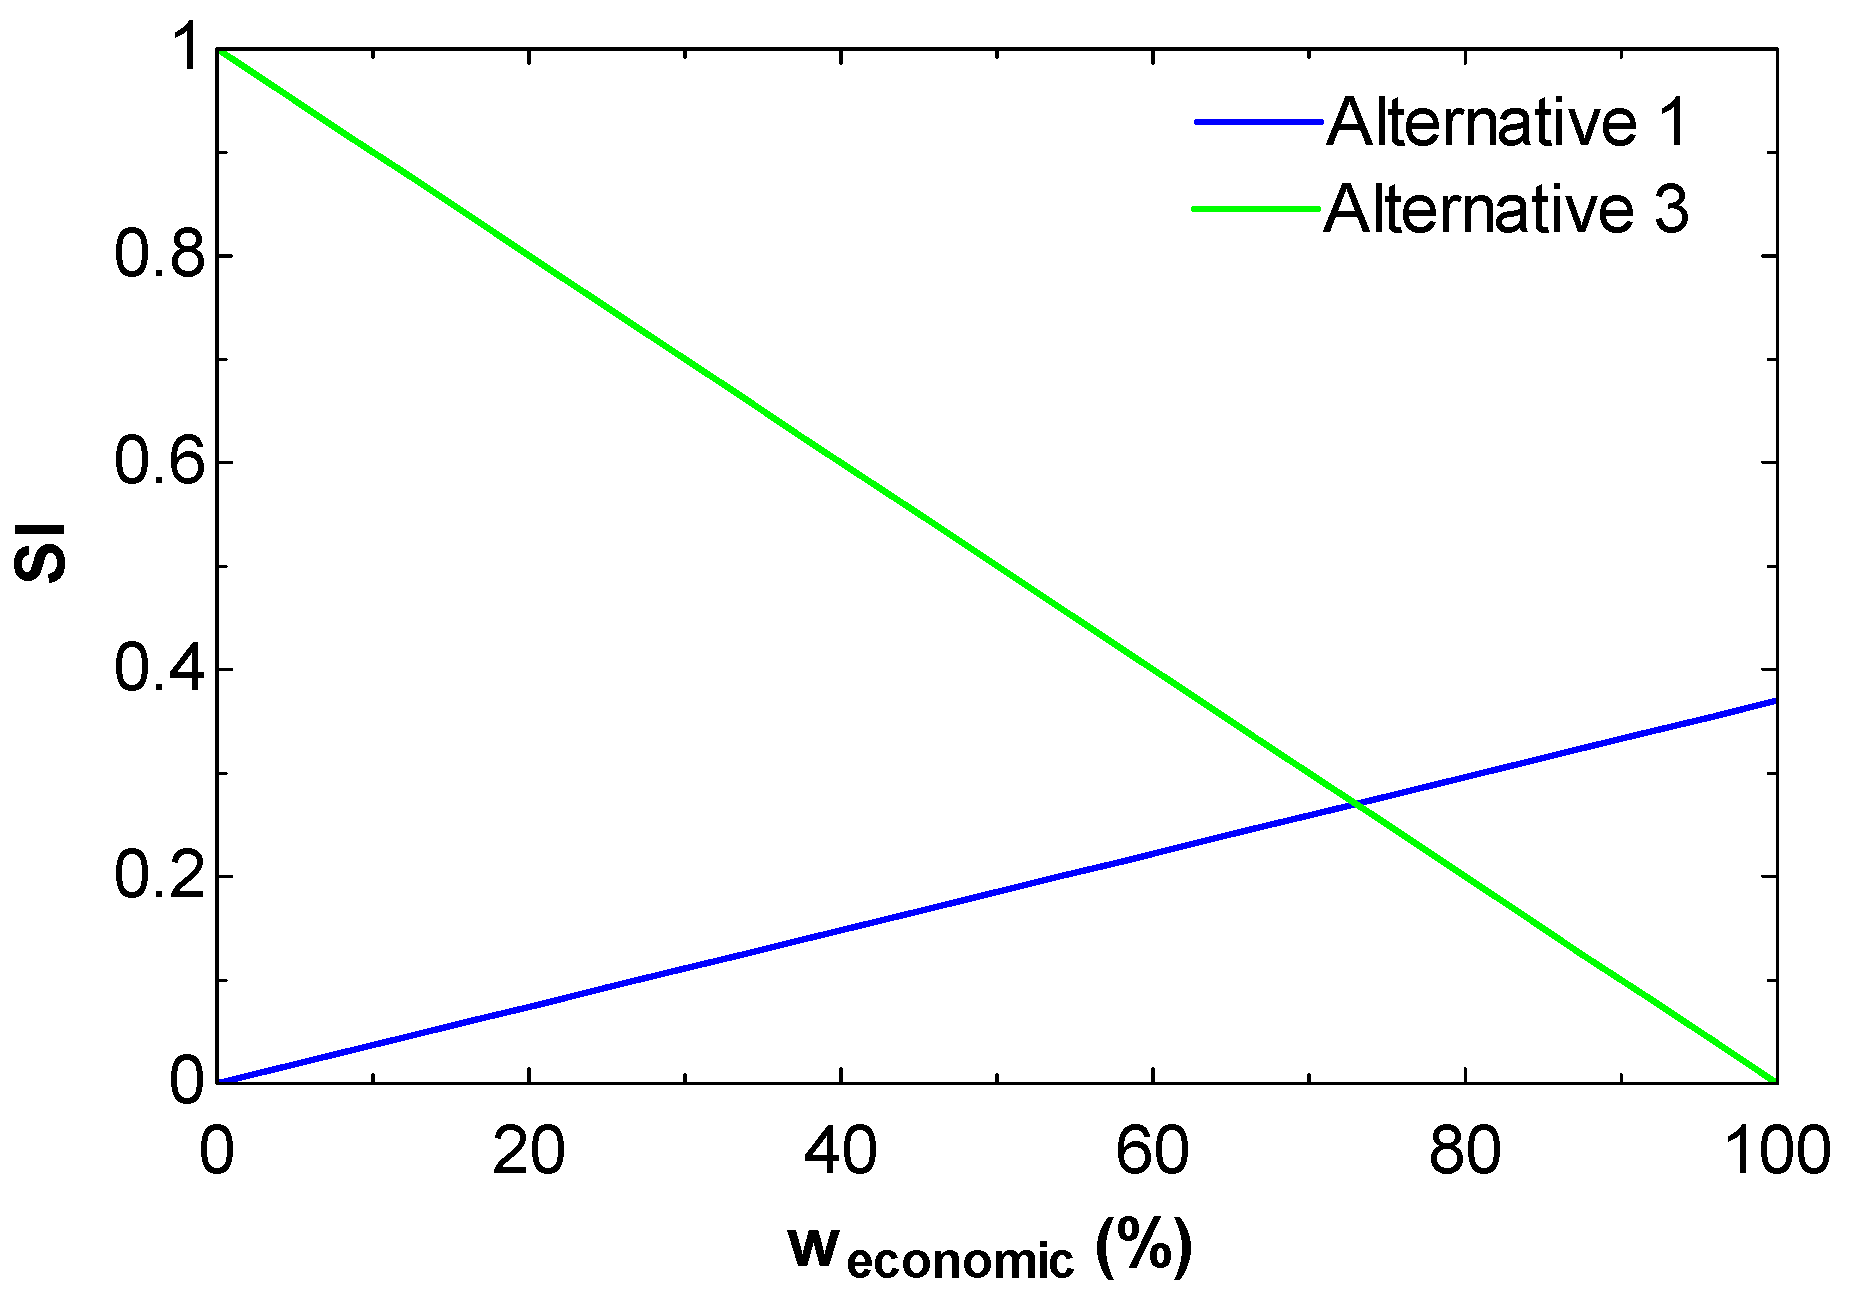

Table 1.
Common values of power required in port.
| Ship type | Gross tonnage (GT) | Voltage (kV) | Power demand average (MW) | |
|---|---|---|---|---|
| Berth | Navigation | |||
| Oil tankers | <5000 | 0.4/0.44/0.69 | 4 | 6 |
| <10000 | 0.69/6.6/11 | 6 | 9 | |
| >10000 | 0.69/6.6/11 | 8 | 12 | |
| Chemical / product tankers | <5000 | 0.4/0.44/0.69 | 6 | 9 |
| <10000 | 6.6/11 | 9 | 14 | |
| >10000 | 6.6/11 | 10 | 15 | |
| Gas tankers | <5000 | 0.4/0.44/0.69 | 5 | 8 |
| >5000 | 6.6/11 | 9 | 14 | |
| Bulk carriers | <50000 | 0.4/0.44/0.69 | 0.5 | 1 |
| >50000 | 0.69/6.6/11 | 2 | 3 | |
| General cargo | <25000 | 0.4/0.44/0.69 | 1.5 | 2 |
| >25000 | 0.69/6.6/11 | 3 | 5 | |
| Container vessels | <10000 | 0.4/0.44/0.69 | 1.5 | 2 |
| <50000 | 0.69/6.6/11 | 2 | 3 | |
| >50000 | 6.6/11 | 4 | 6 | |
| Ro-pax vessels | <20000 | 0.4/0.44/0.69 | 2 | 3 |
| >20000 | 0.69/6.6/11 | 5 | 8 | |
| Cruise ships | <50000 | 0.4/0.44/0.69 | 4 | 6 |
| <100000 | 0.69/6.6/11 | 9 | 14 | |
| >150000 | 6.6/11 | 18 | 27 | |
| Offshore supply vessel | <5000 | 0.4/0.44/0.69 | 1 | 2 |
| >5000 | 6.6/11 | 2 | 3 | |
| Fishing vessel | <5000 | 0.4/0.44/0.69 | 0.5 | 1 |
| >5000 | 6.6/11 | 2 | 3 | |
Table 2.
Main characteristics of the ship analyzed.
| Characteristic | Value | |
|---|---|---|
| Length over all (m) | 47.1 | |
| Beam (m) | 12 | |
| Depth to main deck (m) | 5.95 | |
| Speed (knots) | 13 | |
| Endurance | 25 days at 11 knots | |
| Propulsion | Type: Twin screw. 2 x Controllable pitch propellers Main engines: 2 x 1840 kW @ 1800 rpm | |
| Electrical plant | Main generator sets: 2 x 650 kWe @ 1500 rpm | |
| Emergency generator: 1 x 248 kWe @ 1500 rpm | ||
| Shaft alternators (PTI): 2 x 200 kWe @ 1485 rpm | ||
| Maneuvering thrusters | Bow: 1 x 95 kW @ 1500 rpm | |
| Stern: 1 x 265 kW @ 1500 rpm |
Table 3.
Electrical energy generated by the generators and corresponding solar panels.
| Percentage (%) | Power (kW) | Solar panels 550 Wp | ||
|---|---|---|---|---|
| Number of solar panels | Horizontal Surface (m2) solar panel inclination: 0° | Horizontal Surface (m2) solar panel inclination: 30° | ||
| 50% | 325 | 616 | 1590 | 1377 |
| 60% | 390 | 739 | 1908 | 1652 |
| 70% | 455 | 862 | 2226 | 1928 |
| 80% | 520 | 985 | 2544 | 2203 |
| 90% | 585 | 1108 | 2862 | 2479 |
| 100% | 650 | 1231 | 3180 | 2754 |
Table 4.
Consumption balance.
| Qty. | Equipment description | Max Current | Max. Installed | |
|---|---|---|---|---|
| current (A) | power (W) | |||
| 1 | Central panel with four (4) addressable loops | 1.2 A | 1.2 | 28.80 |
| 1 | Alarm Repeater Unit | 500 µA | 0.0005 | 0.01 |
| 41 | Addressable Smoke Detector for dry spaces | 450 µA | 0.01845 | 0.44 |
| 20 | Addressable Smoke Detector for wet spaces | 450 µA | 0.009 | 0.22 |
| 2 | IS Addressable Smoke & Heat Detector | 450 µA | 0.0009 | 0.02 |
| 5 | Addressable Smoke and Heat Detector for dry Spaces | 450 µA | 0.00225 | 0.05 |
| 11 | Addressable Smoke and Heat Detector for wet Spaces | 450 µA | 0.00495 | 0.12 |
| 5 | Addressable Heat Detector (57°C) | 450 µA | 0.00225 | 0.05 |
| 2 | Addressable Heat Detector (90°C) | 450 µA | 0.0009 | 0.02 |
| 4 | Addressable 3IR Flame detector | 800 µA | 0.0032 | 0.08 |
| 13 | Addressable manual call point with isolator for accommodation spaces | 300 µA | 0.0039 | 0.09 |
| 12 | Addressable manual call point with isolator for machinery and / or wet spaces. | 300 µA | 0.0036 | 0.09 |
| 2 | Zener Barrier for IS devices | 50 µA | 0.0001 | 0.00 |
| 1 | Timer unit for Workshop | 300 µA | 0.0003 | 0.01 |
| TOTAL | 1.2503 | 30.01 | ||
Table 5.
Investment corresponding to alternative 1.
| Description | Quantity | Unit cost (€) | Total investment (€) |
|---|---|---|---|
| A circuit breaker in the ship’s 230 Vac Main Emergency switchboard dedicated exclusively to the fire detection system. | 1 | 15.9 | 15.9 |
| 30 m cable 2x1.5mm2+E from the 230V ESB to the fire alarm control panel | 15 | 2.54 | 38.1 |
| Converter 230 Vac/24 Vdc-output 10A for console installation next to the panel | 1 | 168.43 | 168 |
| Auxiliary material and labor | 6 | 35 | 210 |
| TOTAL | 432 |
Table 6.
Investment corresponding to alternative 2.
| Description | Quantity | Unit cost (€) | Total investment (€) |
|---|---|---|---|
| Supply, installation and connection of a monocrystalline PV panel 550 Wp with the following technical characteristics: | 1 | 131.11 | 131 |
| Rated power: 550 Wp | |||
| Efficiency: 21.29% | |||
| VImp: 41.48 V | |||
| Impp: 13.26 A | |||
| Battery set (2 batteries 100Ahx12Vdc) | 1 | 299.72 | 299.72 |
| 30° inclined support 60 kg or similar | 1 | 142.08 | 142 |
| Fuse type G 20A Icc: 100 kA | 2 | 22.73 | 45 |
| Watertight junction box IP54 RAL 7035 89.4x89.4 | 1 | 11.46 | 11 |
| Cu conductor line 2x4mm2 Z2Z2, 1.5/1.5kV 1T DN25 | 50 | 3.74 | 187 |
| Circuit Breaker, 2P, 10C | 1 | 50 | 50 |
| Auxiliary material and labour | 16 | 35 | 560 |
| TOTAL | 1425.72 |
Table 7.
Investment corresponding to alternative 3.
| Description | Quantity | Unit cost (€) | Total investment (€) |
|---|---|---|---|
| Supply, installation and connection of monocrystalline PV panel 550 Wp with the following technical characteristics: | 1 | 131.11 | 131 |
| Nominal power: 550 Wp | |||
| Efficiency: 21.29%. | |||
| VImp: 41.48 V | |||
| Impp: 13.26 A | |||
| Battery set (2 batteries 100 Ah x 12 Vdc) | 1 | 299.72 | 299.72 |
| Support inclined 30° 60 kg | 1 | 142.08 | 142 |
| Fuse type G 20A Icc.: 100 kA | 2 | 22.73 | 45 |
| Watertight junction box IP54 RAL 7035 89.4 x 89.4 | 1 | 11.46 | 11 |
| Cu conductor line 2x4mm2 Z2Z2, 1.5/1.5kV 1T DN25 | 50 | 3.74 | 187 |
| Circuit Breaker, 2P, 10C | 1 | 50 | 50 |
| Circuit breaker, on the ship’s main 230 Vac Emergency Main switchboard dedicated exclusively to the fire detection system | 1 | 15.9 | 15.9 |
| 30 m cable 2x1.5mm2+E from the 230V ESB to the fire alarm control panel | 15 | 2.54 | 38.1 |
| Converter 230Vac/24Vdc-output 10A for console installation next to the panel | 1 | 168.425 | 168.43 |
| Power supply switching and paralleling system | 1 | 325 | 325 |
| Auxiliary material and labour | 23 | 35 | 805 |
| 1995.72 |
Table 8.
Investment corresponding to the installation of 20 solar panels.
| Description | Quantity | Unit cost (€) | Total investment (€) |
|---|---|---|---|
| Supply, installation and connection of monocrystalline PV panel 550 Wp with the following technical characteristics: | 20 | 131.11 | 2622.2 |
| Nominal power: 550 Wp | |||
| Efficiency: 21.29%. | |||
| VImp: 41.48 V | |||
| Impp: 13.26 A | |||
| Inverter 17,5kW/400Vac | 1 | 2587.77 | 2587.77 |
| Support inclined 30° 60 kg structure for 10 panels | 2 | 1601.71 | 3203.42 |
| Fuse type G 20A Icc.: 100 kA | 2 | 22.73 | 45 |
| electrical installation up to inverter (junction boxes, cables, cable trays and others) | 1 | 3850 | 3850 |
| TOTAL | 12308.39 |
Table 9.
Data for the sustainability analysis.
| Alternative (i) | Criterion (j) | ||
|---|---|---|---|
| j = 1 | j = 2 | j = 3 | |
| Economic (€) | Environmental (-) | Social (-) | |
| Alternative 1 | 901 | 0 | 0 |
| Alternative 3 | 1425.72 | 1 | 1 |
Table 9.
Normalized data for the sustainability analysis and sustainability index of each alternative.
Table 9.
Normalized data for the sustainability analysis and sustainability index of each alternative.
| Alternative (i) | Criterion (j) | SI | ||
|---|---|---|---|---|
| j = 1 | j = 2 | j = 3 | ||
| Economic (€) | Environmental (-) | Social (-) | ||
| Alternative 1 | 0.37 | 0 | 0 | 0.185 |
| Alternative 3 | 0 | 1 | 1 | 0.5 |
Disclaimer/Publisher’s Note: The statements, opinions and data contained in all publications are solely those of the individual author(s) and contributor(s) and not of MDPI and/or the editor(s). MDPI and/or the editor(s) disclaim responsibility for any injury to people or property resulting from any ideas, methods, instructions or products referred to in the content. |
© 2025 by the authors. Licensee MDPI, Basel, Switzerland. This article is an open access article distributed under the terms and conditions of the Creative Commons Attribution (CC BY) license (http://creativecommons.org/licenses/by/4.0/).
Copyright: This open access article is published under a Creative Commons CC BY 4.0 license, which permit the free download, distribution, and reuse, provided that the author and preprint are cited in any reuse.


