
Submitted:
28 March 2025
Posted:
29 March 2025
You are already at the latest version
Abstract
Urban documents like city planning reports and environmental data often feature complex charts and texts that require effective summarization tools, particularly in smart city management systems. These documents increasingly use graphical abstracts alongside textual summaries to enhance readability, making automated abstract generation crucial. This study explores the application of summarization technology using scientific paper abstract generation as a case. The challenge lies in processing the longer multimodal content typical in research papers. To address this, we propose a deep multimodal-interactive network for accurate document summarization. This model enhances structural information from both images and text, using a combination module to learn the correlation between them. The integrated model aids both summary generation and significant image selection. For the evaluation, we create a dataset that encompasses both textual and visual components along with structural information, such as the coordinates of the text and the layout of the images. While primarily focused on abstract generation and image selection, the model also supports text-image cross-modal retrieval. Comparative experiments on a proprietary dataset demonstrate that our method consistently outperforms other models, potentially benefiting smart city applications like accident scene documentation and automated environmental monitoring summaries, thereby enhancing the processing of urban multimodal data.
Keywords:
Multi-Task Learning
; Multimodal Learning
; Paper Summarization
; Important Image Selection
; Cross-Modal Retrieval
; Smart City Information Management Systems
1. Introduction
The rapid development of smart cities presents an urgent challenge: the need to process the exponentially growing multimodal urban data. For example, transportation incident reports [1] require the simultaneous analysis of textual narratives and images from accident scenes. Environmental monitoring systems [2] produce thousands of sensor data charts daily, while urban planning documents [3] feature complex text-diagram layouts. Scientific papers, as exemplars of structured multimodal documents, provide valuable methodological insights for tackling these urban data challenges. The exponential growth of scholarly publications has been further accelerated by recent technological advancements, including the emergence of large language models (LLMs) like GPT-4, Llama 3, and Qwen 2.5 [4], especially following the onset of the 2024 pandemic. According to the latest Stanford AI Index Report (Stanford, 2023), the number of published scientific papers has surged 1.4 times over the past five years, now reaching approximately 500,000 annually, with significant contributions in areas such as multimodal language models, generative AI, and healthcare AI [5]. This rapid expansion poses a significant challenge for researchers, who must navigate an overwhelming volume of information.
To address these challenges, natural language processing (NLP) [6] technologies can be employed to generate multimodal summaries of scientific papers, thereby enabling researchers to efficiently grasp the forefront of research topics. Scientific papers are complex documents [7] that integrate text, visual, and structural information, encompassing not only textual content but also visual elements [8,9] such as charts, figures, and tables. These visual components provide researchers with a visual understanding of the paper’s content, while the textual components offer detailed information. Structural information, which includes the coordinate and layout of textual and visual elements, also plays a critical role in conveying meaning. For instance, the placement and size of images [10] and text can indicate their relative importance, with earlier-positioned images and larger text segments often carrying greater significance. While the graphical abstract [11] captures essential visual and structural information, it is insufficient for conveying the paper’s specific content. Therefore, a comprehensive multimodal summary that integrates both the abstract and the most important image is necessary. Such a summary can leverage the complementary strengths of different modalities [12] to enhance understanding and improve research efficiency.
Scientific document summarization has long been a foundational task in the field of NLP. Early summarization methods were limited to text-based approaches [13], but recent advancements in multimodal summarization have expanded its applications to domains such as social media analysis, e-learning, and medical imaging summarization [14]. Unlike traditional text-only models, multimodal summarization models provide a more holistic approach to capturing the essence of a document. In scientific papers, textual and visual information often conveys complementary content at different semantic levels, with a significant degree of semantic similarity between the two modalities [15,16,17]. These cross-modal correlations enable one modality to fill in the information gaps of the other. Furthermore, it is essential to consider the structural information, which includes the spatial arrangement and layout of textual and visual elements.
This paper takes scientific paper abstract generation as a methodological proving ground, proposing a novel deep multimodal-interactive network designed to simultaneously generate an abstract and select the most representative image from scientific papers. Figure 1 shows some input and output examples, which implies the primary goals and pipelines of this work. This approach enhances the understanding of the research content by integrating both textual and visual modalities. Our multimodal learning framework allows researchers to access information beyond the limitations of text alone, thereby advancing scientific research. By incorporating a structural information enhancement module, we enhance the semantic understanding of a paper’s structure. The features enriched with this structural information will then be combined to generate informative and meaningful summaries, including both the abstract and the most significant image. Notably, we leverage the power of large language models for generating the abstract. To validate this multimodal learning methodology, we conducted comparative experiments on a newly constructed dataset specifically designed for generating scientific paper abstracts and selecting important images. This novel dataset integrates structural information, such as text coordinates and image layouts, overcoming the limitations of most existing summarization datasets, which typically include only text and images for training and validation. Future work will expand the dataset with more smart city document types (e.g., infrastructure topology maps, and public safety surveillance reports). Beyond its primary functionality, the proposed model can be extended to support text-image cross-modal retrieval applications [18,19,20]. In this context, researchers can utilize the generated abstract and selected image to effectively query related papers, facilitating easier access to relevant scientific literature [19,21]. We can leverage the power of retrieval in the smart city domain for other applications, such as locating accident scene images, automated visualization summaries for environmental monitoring systems, and decision support by quickly extracting information from municipal documents. This research establishes a bridge between academic exploration and urban intelligence [22], providing methodological foundations for deploying multimodal summarization in urban computing scenarios. To summarize, the main contributions of this work are as follows:
- We present a novel deep multimodal-interactive network that generates the abstract of a research paper while simultaneously selecting its most representative image. This approach facilitates a deeper understanding of the research content. By integrating both textual and visual modalities that convey complementary information at different semantic levels through a combination module, our multimodal learning framework enables researchers to access paper information beyond the constraints of text alone, thereby advancing scientific research.
- A structural information enhancement module that incorporates the spatial arrangement and layout of textual and visual elements is proposed. This module enhances the semantic understanding of the paper’s structure by generating informative and meaningful summaries that include both the abstract and the most significant image.
- A new multimodal dataset that incorporates structural information is constructed to facilitate the evaluation process. This dataset overcomes the limitations of most existing summarization datasets, which typically only contain text and images for training and validation.
- Extensive experiments demonstrate the superior summarization capabilities of the proposed multimodal learning network, as evidenced by several key performance indicators. Additionally, the proposed model supports image-text cross-modal retrieval applications, showcasing its strong capabilities and significant potential in handling multimodal learning tasks, especially in the future smart city information management systems.
In the next section, we discuss some related works in the field of paper summarization and abstract generation. Subsequently, the proposed framework is detailed in Section 3, followed by a presentation of all experimental results in Section 4. Finally, in Section 4.1 and Section 6, we discuss future research directions and summarize this work.
2. Related Work
2.1. Document Summarization
Smart city data, including spatiotemporal traffic data [23] and cargo transportation information [24], often comes in text and image formats. Natural Language Processing (NLP) is a common method used to analyze this data. NLP technology can evaluate the shape, sound, and context of the collected information by leveraging computational resources. In the context of smart city applications—such as text and voice assistants in homes and businesses—NLP plays a crucial role in efficient data retrieval and analysis. It is also applied in medical data analysis, managing social networking platforms, language translation for improved communication, opinion mining, and Big Data Analytics (BDA) [25,26]. Among them, scientific document summarization has emerged as a significant research topic within the field of NLP [27]. This area encompasses various research directions, including dataset creation and multiple generation tasks such as abstract generation, literature review generation, figure caption generation, keyword extraction, and paper poster generation [28]. The development of summarization models is greatly influenced by the characteristics of the underlying datasets. While some models utilize textual content directly, others incorporate auxiliary information, such as text length and structural features [29], to aid in summary generation, including abstract creation. The combination of different datasets and tasks has established a comprehensive research framework in the domain of scientific document summarization. However, most of these methods primarily rely on text-based approaches, often overlooking the rich information embedded within the papers.
The intricate structure and extensive length of scientific documents create challenges in identifying the most representative components that effectively encapsulate the paper’s information. To address this, researchers have investigated alternative modalities, particularly graphical abstracts, to create more concise summaries. The graphical abstract serves as the most critical visual element in our methodology, providing a succinct yet comprehensive representation of the paper’s core concepts. Insights from related studies, such as those by Backer Johnsen et al. [30], emphasize the diversity of graphical abstracts in terms of expressive modes and clarity of arguments presented. Additionally, Ma et al. [31] highlighted the role of graphical abstracts in engaging readers and facilitating the dissemination of research findings to both domain experts and interdisciplinary scholars. Beyond textual descriptions, the visual modality offers unique advantages through the use of colors and line elements [32], thereby complementing the information conveyed by text. This synergy between textual and visual modalities underscores their complementary roles in effectively communicating scientific information [33].
2.2. Multimodal Summarization Techniques
Nowadays, multimodal summarization is rapidly developing, having many applications like reference text summarization [34] and meeting recordings summarization [35]. Different from the text-only summarization [36], multimodal summarization want to combine the feature from many modalities such as text and images, generating a meaningful summary which contain the multi-modal semantics. Multimodal summarization methodologies are roughly divided into two types: Multi-modal Summarization with Single-modal Output (MSSO) [37] and Multi-modal Summarization with Multi-modal Output (MSMO) [38].
MSSO focus on the quality of the generated text summary using multimodal data, which has only one type of output. A foundational contribution by Li et al. [39] introduced a specialized multimodal summarization framework that is trained on asynchronous documents, images, audio, and video. This framework employs four distinct criteria for sentence selection, thus enhancing the quality of the generated summaries. In a subsequent work, Li et al. [40] focused on the visual modality and proposed image filters, which are further refined through inner- and inter-modality attention mechanisms. These methods focus on critical image patches and text units to generate textual summaries, facilitating the extraction of useful information from both modalities.In parallel, several advancements have centered around the optimization of multimodal models through attention mechanisms. Xiao et al. [41] introduced a contribution network aimed at identifying the most informative image segments for multimodal summarization. This method efficiently integrates multimodal information, improving the semantic richness of the summaries. Building on this, Lu et al. [42] proposed an attention-based multimodal network that refines the synthesis of multi-modal inputs. Their approach enhances the semantic depth and logical coherence of the generated summaries by optimizing the interplay between modalities. In order to improve the quality of multimodal summarization, Li et al. [43] introduced a visual-guided modality regularization technique. This method directs the model’s focus to the most crucial visual and textual elements within the source content, thereby improving sentence-level summarization. Yuan et al. [44] explored the trade-off between task-relevant and task-irrelevant visual information within an Information Bottleneck framework, aiming to optimize the extraction of meaningful content for task-specific summarization. In the realm of opinion summarization, Im et al. [45] presented the self-supervised multimodal opinion summarization model. This approach addresses the heterogeneity among input modalities, enabling more coherent and informative summaries from diverse sources. Song et al. [46] leveraged a vision-to-prompt methodology to generate product summaries. By converting visual information into semantic attribute prompts, this model harnesses the pre-trained language model’s capabilities for generating coherent and contextually rich summaries. On a different front, Liu et al. [47] developed an annotation framework for multimodal dialogue summarization. This framework includes a video scene-cutting model and a set of standards for evaluating dialogue summaries, facilitating better integration of multimodal content. Zhang et al. [48] designed a multimodal generative adversarial network (GAN) that employs reinforcement learning techniques to generate concise and informative product titles. This model emphasizes the synthesis of visual and textual information, delivering more effective outputs in product summarization tasks.
Different from MSSO, MSMO fully utilized multimodal semantics through multimodal interaction networks to improve the quality of generated text summaries by combining collaborative tasks such as the most important selection task, which has several types of outputs like images and text. Early work in the domain includes Chen et al. [49], who introduced a multi-modal attentional mechanism to process images and text simultaneously. Their approach aimed to enhance text summarization by generating informative image summaries alongside textual content. Fu et al. [50] advanced this idea by proposing a model with bi-hop attention and an improved late fusion mechanism, which refined the generated summaries by extracting relevant images from video content. Their method produced both textual summaries and significant images simultaneously, addressing the challenges in summarizing articles and videos. In the same vein, Zhu et al. [51] developed a model designed for abstractive summarization, generating both textual summaries and the most relevant images for a given context. Their work laid the groundwork for more complex models that integrate multiple modalities in summarization tasks. This line of research was further expanded by Zhu et al. [52], who introduced a multi-modal objective function that incorporates both image and text references during training. The combined loss function facilitated the generation of more coherent multimodal summaries by jointly considering both tasks in the model’s learning process. Tan et al. [53] contributed to the field by utilizing the power of large language models (LLMs) while effectively integrating multimodal information within a unified framework. Their approach not only generated text summaries but also selected a graphical abstract, thus enhancing the ability to summarize complex multi-modal content. Similarly, Zhu et al. [54] presented a unified framework for multi-modal summarization that integrated various tasks into a single system. They also introduced three unsupervised multi-modal ranking models, which could be tailored to different tasks or scenarios based on specific requirements. Zhang et al. [55] proposed a unified multi-modal summarization framework based on an encoder-decoder multitask architecture built on BART. This framework was capable of simultaneously generating text summaries and selecting images, enabling more effective multimodal summarization. In a subsequent study, Zhang et al. [56] further enhanced inter-modality interaction by introducing a multimodal visual graph learning method. This method helped capture both structural and content information, facilitating stronger interactions between modalities. Zhuang et al. [38] addressed the evaluation aspect of multi-modal summarization by designing mLLM-EVAL, a reference-free evaluation method utilizing multimodal LLMs. This model aimed to improve the accuracy and reliability of evaluating multi-modal summaries without relying on manually annotated references. Mukherjee et al. [57] proposed a multi-task learning approach that simultaneously tackled two tasks: classifying in-article images as either "on-topic" or "off-topic" and generating a multimodal summary. The classification task served as an auxiliary task, helping the model to extract combined features from text and images for more effective summary generation.
Existing datasets in multimodal summarization field lack the annotation of image labels and the simultaneous acquisition of coordinates to get the structural information, making the most important image selection task difficult to accomplish [58]. The proposed method learns the correlations between images and text accompanied by structural information like coordinate of text and layout of image. And we create a new dataset to provide more perspectives on multimodal learning to generate scientific paper abstract.
3. Methodology
3.1. Overall Framework
The proposed learning framework leverages multimodal data to simultaneously generate paper abstracts and identify the most relevant image. The architecture incorporates multimodal information by augmenting both textual and visual feature representations through different modules. To effectively integrate these complementary modalities, the model employs advanced fusion mechanisms that exploit cross-modal correlations to enhance the performance of both tasks. This model architecture consists of three primary components, as illustrated in Figure 2. Overall, the proposed deep model involves three key components: (1) a structural information enhancement module that incorporates structural information (e.g., coordinate of text and layout of image) to extracted features from both text and images; (2) a combination module that establishes correlations between textual and visual content to fuse them; and (3) an output module that optimizes the model for both abstract generation and image selection tasks. These modules integrate features from multiple levels, including text, images, coordinates, and layout information, while accounting for cross-modal interactions.
Our model takes as input the textual content , text coordinates , paper images , and image layout information of a scientific paper. The goal is to generate a multimodal summary consisting of an abstract and the most important image . The model is defined by a set of trainable parameters and aims to solve the following optimization problem:
where represents the loss function to be minimized in Equation (1).
3.2. Structural Information Enhancement Module
To effectively incorporate the structural information of images and text into the feature representation, we propose a structural information enhancement module. This component processes the image and text components separately, as illustrated in Figure 3.
3.2.1. Structural Embedding Layer
Given a collection of image layouts and text coordinates , we employ these to enhance the image and text embeddings by incorporating structural information. Specifically, the structural embedding layer is trained to generate layout embeddings and coordinate embeddings, which are subsequently integrated into the respective image and text embeddings. For image embedding enhancement, we define distinct embedding functions for each layout dimension () and aggregate these embeddings to compute the overall position embedding as follows (Equation (2) and Equation (3)):
where and are trainable embedding functions for each layout dimension. The resulting embedding, denoted as , is the summation of these individual embeddings.
3.2.2. Image Enhancement
Given a set of paper images , we utilize ResNet-152 [59] to extract visual features, thereby obtaining the image embedding . The feature extraction process can be expressed as Equation (6):
In addition, we have derived a layout embedding from the image layout as described earlier. We use a standard attention mechanism, with the Equation (7). When the query, key, and value all come from the same sequence, it is referred to as self-attention. When the query comes from one sequence and the key and value come from another sequence, it is referred to as cross-attention. To enhance the image embedding, we first apply a self-attention mechanism (Equation (8)) to strengthen the layout information, followed by a cross-attention mechanism (Equation (9)) to fuse the image and layout features. The operations are defined as:
Here, represents the output of the self-attention layer, while denotes the output of the cross-attention layer.
The final enhanced image embedding is obtained by integrating the layout-enhanced features into the original image embedding in Equation (10):
where is a trainable weight, and (Equation (11)) is the result of applying a feed-forward network with residual connections and normalization. Notably, all layers except the feature extraction component are retrained to adapt to the specific task.
3.2.3. Text Enhancement
Given a set of paper text , we leverage the BART model [60] to extract text embeddings through its embedding layer. The process can be expressed as Equation (12):
We also derive a coordinate embedding from the text coordinates, as described earlier. To enhance the text embedding, we first apply a self-attention mechanism (Equation (13)) to emphasize the coordinate information and then employ a cross-attention mechanism (Equation (14)) to combine the text and coordinate features. The operations are defined as:
Here, represents the output of the self-attention layer, while denotes the output of the cross-attention layer.
The final enhanced text embedding is obtained by integrating the coordinate-enhanced features into the original text embedding in Equation (15):
where is a trainable weight, and (Equation (16)) is the result of applying a feed-forward network with residual connections and normalization. Unlike the image enhancement process, we utilize pre-trained weights for layers overlapping with the original BART model to improve performance.
3.3. Combination Module
The integration of visual and textual information is crucial for capturing comprehensive and diverse representations of scientific papers. Specifically, the most important image should encapsulate the primary topic of the paper, while the abstract contains key information. Therefore, text and image modalities can complement each other, providing a more holistic understanding. This module is designed to fuse the information between images and text, as illustrated in Figure 4.
3.3.1. Image-to-Text Combination
To integrate image and text features, we employ a two-stage process that begins with compressing and transforming the text features before combining them with the image features. Specifically, the text embedding is compressed into a vector using an averaging operation and then expanded back into a matrix (Equation (17)). This matrix is transformed using a trainable weight matrix (Equation (18)) and passed through a linear layer to generate a new feature representation (Equation (19)). Subsequently, a cross-attention mechanism is applied to combine these transformed text features with the image features (Equation (20)), which already contain structural information. The final output is obtained by weighting and summing the enhanced features (Equation (21)). The image-text combination process is implemented as follows:
Here, (Equation (22)) represents the compressed and expanded text embedding, is the transformed text feature, and is the output of the linear transformation. The cross-attention mechanism produces , which is then combined with the image features to form . Finally, is obtained through a feed-forward network with residual connections and normalization.
3.3.2. Text-to-Image Combination
In parallel, we develop a complementary strategy to integrate image and text features in the reverse direction, ensuring a bidirectional flow of information. The image embedding is first compressed into a vector using an averaging operation and then expanded back into a matrix (Equation (23)). This matrix is transformed using a trainable weight matrix (Equation (24)) and passed through a linear layer to generate a new feature representation (Equation (25)). Subsequently, a cross-attention mechanism (Equation (26)) is applied to combine these transformed image features with the text features , which already contain structural information. The final output is obtained by weighting and summing the enhanced features (Equation (27)). The text-image combination process is implemented as follows:
Here, (Equation (28)) represents the compressed and expanded image embedding, is the transformed image feature, and is the output of the linear transformation. The cross-attention mechanism produces , which is then combined with the text features to form . Finally, is obtained through a feed-forward network with residual connections and normalization.
3.4. Output Module
To maximize the utilization of multimodal information, we developed the output module capable of concurrently generating the paper abstract and selecting the most representative image. This module leverages a pre-trained BART decoder to derive decoded text features, which are subsequently employed for abstract generation. Simultaneously, the most significant image is identified using the encoded visual information, enabling the two modalities to complement each other and enhance task performance. For training, we employ negative log-likelihood loss for abstract generation and cross-entropy loss for image selection. A multi-task learning framework [61] is implemented to train both tasks in parallel, as illustrated in Figure 5.
3.4.1. Paper Abstract Generation
The abstract generation task aims to utilize the integrated text-image feature to produce the paper’s abstract. This is achieved by feeding the fused text-image embedding into a pre-trained BART decoder [60] to extract decoded embeddings, which are then used for abstract generation. The decoding process can be mathematically represented as Equation (29):
Here, denotes the decoded embeddings.
Subsequently, these embeddings undergo a series of transformations to generate token probabilities (Equation (30) and Equation (31)):
In these equations, represents the output after applying a feed-forward network, residual connections, and normalization. signifies the probability distribution over tokens.
The loss function is defined as Equation (32):
This negative log-likelihood loss is minimized during training to refine the model’s ability to generate tokens closely resembling the target sequence .
3.4.2. The Most Important Image Selection
For the image selection task, we recognize the importance of both visual and textual information in identifying the most representative image. This task is performed using the previously derived image-text embedding . The process involves transforming the embedding through a linear layer (Equation (33)) to match the dimensionality required by a GRU [62] model (Equation (34)), which captures the temporal relationships among images. The resulting features are subsequently reduced to a 1D tensor (Equation (35) and Equation (36)), enabling the selection of the most crucial image for each paper. The process can be formalized as:
In this formulation, represents the output of the linear transformation layer, is the GRU output, and denotes the computed score for each image.
The loss function is defined as Equation (37):
This cross-entropy loss measures the discrepancy between the predicted scores and the ground truth scores . The selected image not only serves as the most representative visual summary but also aligns with the textual content.
3.5. Total Loss Function
The proposed model enables joint training of the abstract generation and image selection tasks. Both tasks are optimized simultaneously through the combined loss function in Equation (38):
Here, a and b are learnable parameters that balance the contributions of the two tasks during training.
4. Experiment and Result
4.1. Dataset Detail
Existing summarization datasets typically contain either text or images for training and validation. To address this limitation, we developed a novel dataset that incorporates both text and images, along with structural information such as text coordinates and image layouts. Our dataset creation methodology draws inspiration from recent advancements in the field. Below, we outline the dataset construction process.
First, we sourced a diverse collection of scientific publications from reputable open-access repositories, including top-tier conferences such as NIPS, ACL, and ICML. To extract images and their associated structural information, we employed PDFigCapX [63], a robust tool for parsing academic paper’s content. After collecting the original image data, we implemented a labeling process. Following the methodology proposed by Tan et al. [53], we identified the most significant image in each paper based on specific keywords in the captions, such as "overview," "overall," and "model architecture." This step ensured that the selected images were representative of the paper’s core content. The output included figures, their captions, and layout, as illustrated in Figure 6.
Additionally, we adopted the dataset creation method outlined by [29] to extract token-level information, including token coordinates (x1, y1, x2, y2, w, h), as demonstrated in Figure 7.
Table 1 provides a detailed overview of our dataset, including the number of papers, images, and associated metadata.
4.2. Implementation Detail
Data Preprocessing: We utilized the BART tokenizer [64] to tokenize all text content from our scientific papers.
Model Architecture: Our model’s text embedding matrix was initialized using the pre-trained BART model, which features a vocabulary size of 50,264 and an embedding dimension of 1,024. Both the source text (including paper content and summaries) and the target text shared the same vocabulary. For image processing, we employed the ResNet-152 encoder to extract visual features, resulting in a 2048-dimensional representation for each image.
Training: The model was trained with the following hyperparameters: batch size of 2, learning rate of 0.00001, and the Adam optimizer [65]. All experiments were conducted on an NVIDIA RTX 4090 GPU.
Testing: During evaluation, we set the maximum decoding length to 256 tokens. Other parameters, such as beam size and length penalty, were kept at their default values.
4.3. Baseline Model
To assess the performance of our proposed model, we conducted a comprehensive comparison against various baseline approaches, encompassing both extractive and abstractive summarization methods.
Extractive Models: Extractive summarization techniques [68] generate summaries by selecting the most relevant sentences or phrases directly from the source document. These methods are valued for their simplicity and efficiency, as they preserve the original meaning of the text. For this study, we evaluated several prominent extractive models:
- Lead-3: Lead-3 is a simple yet widely used baseline model that selects the first three sentences of a document as the summary. It is based on the assumption that the most important information is often located at the beginning of a text.
- SumBasic: SumBasic is a sentence extraction algorithm that relies on basic features such as sentence length, position, and the presence of capital words. It assigns scores to sentences based on these features and selects the top-ranked sentences to form the summary.
- TF-IDF: TF-IDF (Term Frequency-Inverse Document Frequency) identifies important words in a document by calculating their frequency and their rarity across a corpus. The model then extracts sentences containing these high-weight words to form the summary.
- TextRank: TextRank treats sentences as nodes in a graph and computes their importance based on their similarity to other sentences. It iteratively ranks sentences and selects the top-ranked ones to generate the summary.
- LexRank: LexRank is an improved version of TextRank that uses a more efficient algorithm to compute sentence importance. It also focuses on maintaining semantic similarity between sentences to produce coherent summaries.
Abstractive Models: Abstractive methods [69] leverage semantic understanding to generate summaries by rephrasing the source content. These models produce more natural and human-like outputs compared to extractive approaches. The abstractive models evaluated in this study include:
- T5: T5 is a versatile and powerful model designed for various text-based tasks, including text summarization. It leverages a pre-training approach on a wide range of text-to-text tasks and has shown remarkable performance in generating concise and coherent summaries.
- MBart: MBart is a multilingual pre-trained model optimized for text summarization and machine translation. Its ability to handle multiple languages makes it particularly suitable for cross-lingual summarization tasks, providing robust performance across diverse datasets.
- LED: LED is a model specifically designed for document summarization, focusing on generating informative and concise summaries. It employs a lightweight approach to editing and compression, making it efficient for handling long texts.
- Pegasus: Pegasus is a model developed for abstractive summarization tasks. It utilizes a novel pre-training strategy that incorporates extracted summarization guidance, enabling it to generate high-quality, human-like summaries.
- DistilBART: DistilBART is a lightweight and efficient variant of the BART model, designed to reduce computational resources while maintaining high performance. It is particularly useful for scenarios where resource constraints are a concern.
4.4. Comparison Result
To evaluate the effectiveness of our proposed model, we conducted a comprehensive comparison with baseline models, which can be categorized into extractive and abstractive models. Notably, our abstractive models underwent pre-training on the widely-used CNN Daily Mail dataset prior to fine-tuning on our dataset. As demonstrated in Table 2, our model achieves superior performance across all metrics. Our findings reveal three key insights. First, abstractive models consistently outperform extractive models, underscoring the importance of content generation over mere information extraction for effective summarization. Second, our model demonstrates the best performance among all abstractive approaches, likely due to its unique architecture that integrates both multimodal data and multi-task learning. The incorporation of multiple modalities, combined with structural information, enables our model to effectively capture the interdependencies between images and text. Third, our experiments indicate that the image selection task, when conducted in tandem with the primary abstract generation task, enhances the model’s ability to identify salient images while producing high-quality summaries. This dual capability contributes significantly to the model’s overall performance.
4.5. Visualization Result
Table 3 presents the output summaries generated by different models. For reference, the original abstract is included in the top line of Table 3. To assess the quality of the generated summaries, we employ human evaluation. In Table 3, we use blue labels to highlight segments that share the same meaning as the original summary, red labels to denote segments that are semantically irrelevant to the original summary, and orange labels to identify redundant parts that have been generated multiple times. Our findings indicate that the results of the human evaluation align closely with the trends observed in the ROUGE scores. Summaries that achieve higher ROUGE scores tend to be more precise and semantically accurate. As shown in Table 3, the integration of image features in our model enables the generation of summaries that are not only more accurate but also more meaningful, selecting the most relevant image to represent the content.
4.6. Ablation Study
To investigate the impact of different components on model performance, we conducted ablation studies on two modules by modifying the full model architecture. In the first study, we compared two configurations of the Combination Module (CM): one that included the CM and one that did not (W/o CM). In the second study focusing on the Structural Information Enhancement Module (SEM), we similarly compared configurations with the SEM and without it (W/o SEM). Our experiments targeted three tasks: the most important image selection task (I), the scientific paper abstract generation task (T), and a joint task that combined both (I+T). The results, shown in Table 4 and Table 5, indicate that incorporating both the CM and SEM significantly improves performance across all tasks. With the integration of these modules, the model demonstrates enhanced capabilities in both image selection and abstract generation, highlighting the effective fusion of visual and textual information. Conversely, when only a single module is utilized (W/o CM or SEM), the performance declines, emphasizing the importance of multimodal data fusion. Notably, in the joint task (I+T), our model achieves slightly higher ROUGE scores compared to the single-modality tasks, reinforcing the significance of the image selection task in enhancing overall model performance.
4.7. Cross-Modal Retrieval Application
We further apply our model to cross-modal retrieval tasks in the forms of image-to-text and text-to-image. This application holds significant value in the realm of information retrieval, as it can greatly enhance the efficiency with which researchers retrieve relevant scientific literature. In the context of text-to-image retrieval, we utilize the abstract of a paper to compute its similarity with images associated with the paper, identifying the most relevant image and verifying whether it corresponds to the same article. Conversely, in image-to-text retrieval, we assess the similarity between the paper’s image and its abstract, aiming to retrieve the most pertinent abstract and determine if it pertains to the same paper. To evaluate the effectiveness of the retrieval process, we employ the Mean Average Precision at top-K (MAP@K) metric [19,21], which is commonly used for evaluating performance in both text-to-image and image-to-text retrieval tasks. MAP offers a holistic evaluation of a retrieval system’s performance by considering its ability to rank relevant results highly, taking into account precision at various recall levels. The MAP score is derived by averaging the Average Precision (AP) scores for all queries in the dataset. In our experiments, we adjust the value of K such as 10, 30, 50, 80, and 100 and conduct comparative tests by substituting the GRU in our image selection model with other architectures like CNN, MLP, LSTM, RNN, and Transformer. The results of these information retrieval experiments are summarized in Table 6. Overall, our model demonstrates superior retrieval performance compared to other benchmark models in both text-to-image and image-to-text retrieval tasks.
5. Discussion
The findings presented in this study demonstrate the critical role of multimodal integration in scientific paper abstract generation. Our structural information enhancement module and combination module successfully bridge the modality gap between textual and visual representations and simultaneously incorporate structural information, addressing a persistent challenge in cross-modal understanding. Compared to conventional text-centric approaches [85], our multimodal framework achieves higher performance. This performance gain validates our hypothesis that complementary information from figures and diagrams can effectively compensate for textual information loss during summarization. Notably, the proposed multi-task learning paradigm introduces an important innovation by simultaneously optimizing for summary quality and image selection. This dual-objective strategy [86] creates a self-reinforcing mechanism where improved image-text alignment facilitates better summary generation, enhancing image selection accuracy. Our ablation studies confirm that removing either the structural information enhancement module or the combination module reduces ROUGE scores, emphasizing their synergistic importance.
The success of our proposed multimodal fusion framework in scientific paper abstract generation provides a methodological foundation for smart city multi-modal data processing. The joint modeling of text coordinates and image layouts through the structural information enhancement module can be transferred to intelligent transportation report parsing scenarios, enabling precise alignment between road network diagrams and accident description texts [87]. Notably, the semantic alignment capability developed through our multi-task learning mechanism can be extended to environmental monitoring data visualization summarization tasks, such as generating joint summaries of air quality sensor data charts and monitoring reports to support rapid decision-making by urban administrators [88].
However, two limitations warrant discussion. First, the current model requires figures to be explicitly labeled using a special method, which may restrict application scenarios. Second, while our dataset covers major computer science fields, domain adaptation challenges may emerge when processing humanities papers or smart city material with different visual conventions. Future work should explore self-supervised pretraining strategies [89] to reduce annotation dependency and investigate dynamic modality weighting mechanisms [90] for heterogeneous document types.
6. Conclusion
In this paper, we present an innovative model for generating abstracts of scientific papers using multimodal fusion and multi-task learning techniques. Additionally, we explore new pathways for multimodal information fusion in smart cities. Our model effectively combines both text and image modalities to enhance the quality of the generated summaries. A significant contribution of our work is the integration of structural information from both text and image modalities through a Structural Information Enhancement Module. We have also developed a Combination Module that enables deep interaction and integration of the enhanced text and image features, capturing the correlation between the two modalities. The Output Module is responsible for generating a multimodal summary while simultaneously selecting the most relevant image to better align the semantics of the image with the text. Unlike previous studies that primarily focus on a single modality, especially textual data, our approach addresses the gap in multimodal content processing. Much of the existing research has centered on text-only materials; our work broadens this focus by incorporating image data, thus enriching the summary generation process. Experimental results demonstrate that our model produces more informative and accurate summaries, showcasing its effectiveness. While the current research is centered on academic literature, the underlying architectural design already incorporates characteristics of urban multimodal data, such as the fusion of traffic flow time-series data and spatial distribution maps. Future work will aim to integrate city-specific data types, including real-time IoT device data streams and multimedia attachments in citizen emergency service tickets, thereby advancing urban governance towards intelligent, multimodal collaborative decision-making paradigms.
Author Contributions
Conceptualization, W.Y., G.W. and J.H.; methodology, W.Y., G.W. and J.H.; software, W.Y.; validation, W.Y.; formal analysis, W.Y. and G.W.; investigation, W.Y., G.W. and J.H.; resources, G.W.; data curation, W.Y. and G.W.; writing—original draft preparation, W.Y.; writing—review and editing, W.Y., G.W. and J.H.; visualization, W.Y.; supervision, G.W.; project administration, W.Y., G.W. and J.H.; funding acquisition, G.W.. All authors have read and agreed to the published version of the manuscript.
Funding
This research was funded by the Science and Technology Development Fund, Macao SAR. Grant number: 0004/2023/ITP1.
Data Availability Statement
The code and data can be accessible from the corresponding author upon a reasonable request.
Conflicts of Interest
The authors declare no conflicts of interest.
References
- Elassy, M.; Al-Hattab, M.; Takruri, M.; Badawi, S. Intelligent transportation systems for sustainable smart cities. Transportation Engineering 2024, 100252. [Google Scholar] [CrossRef]
- Kumar, A.; Kim, H.; Hancke, G.P. Environmental monitoring systems: A review. IEEE Sensors Journal 2012, 13, 1329–1339. [Google Scholar] [CrossRef]
- Yarashynskaya, A.; Prus, P. Smart Energy for a Smart City: A Review of Polish Urban Development Plans. Energies 2022, 15, 8676. [Google Scholar] [CrossRef]
- Chang, Y.; Wang, X.; Wang, J.; Wu, Y.; Yang, L.; Zhu, K.; Chen, H.; Yi, X.; Wang, C.; Wang, Y.; et al. A survey on evaluation of large language models. ACM transactions on intelligent systems and technology 2024, 15, 1–45. [Google Scholar] [CrossRef]
- Utkirov, A. Artificial Intelligence impact on higher education quality and efficiency. 2024. [Google Scholar]
- Zhang, Z.; Sun, Y.; Su, S. Multimodal Learning for Automatic Summarization: A Survey. In Proceedings of the International Conference on Advanced Data Mining and Applications. Springer; 2023; pp. 362–376. [Google Scholar]
- Altmami, N.I.; Menai, M.E.B. Automatic summarization of scientific articles: A survey. Journal of King Saud University-Computer and Information Sciences 2022, 34, 1011–1028. [Google Scholar] [CrossRef]
- Zhao, B.; Yin, W.; Meng, L.; Sigal, L. Layout2image: Image generation from layout. International journal of computer vision 2020, 128, 2418–2435. [Google Scholar] [CrossRef]
- Ding, X.; Zhang, X.; Ma, N.; Han, J.; Ding, G.; Sun, J. Repvgg: Making vgg-style convnets great again. In Proceedings of the Proceedings of the IEEE/CVF Conference on Computer Vision and Pattern Recognition, 2021, pp. 13733–13742.
- Haralick. Document image understanding: Geometric and logical layout. In Proceedings of the 1994 Proceedings of IEEE Conference on Computer Vision and Pattern Recognition. IEEE, 1994, pp. 385–390.
- Hendges, G.R.; Florek, C.S. The graphical abstract as a new genre in the promotion of science. In Science communication on the internet; John Benjamins Publishing Company, 2019; pp. 59–80.
- Ye, X.; Chaomurilige.; Liu, Z.; Luo, H.; Dong, J.; Luo, Y. Multimodal Summarization with Modality-Aware Fusion and Summarization Ranking. In Proceedings of the International Conference on Algorithms and Architectures for Parallel Processing. Springer, 2024, pp. 146–164.
- Ramathulasi, T.; Kumaran, U.; Lokesh, K. A survey on text-based topic summarization techniques. In Advanced Practical Approaches to Web Mining Techniques and Application; IGI Global Scientific Publishing, 2022; pp. 1–13.
- Zhang, H.; Yu, P.S.; Zhang, J. A systematic survey of text summarization: From statistical methods to large language models. arXiv 2024, arXiv:2406.11289 2024. [Google Scholar]
- Zhou, X.; Wu, G.; Sun, X.; Hu, P.; Liu, Y. Attention-Based Multi-Kernelized and Boundary-Aware Network for image semantic segmentation. Neurocomputing 2024, 597, 127988. [Google Scholar] [CrossRef]
- Cui, C.; Liang, X.; Wu, S.; Li, Z. Align vision-language semantics by multi-task learning for multi-modal summarization. Neural Computing and Applications 2024, 36, 15653–15666. [Google Scholar] [CrossRef]
- Liu, Y.; Zhang, D.; Zhang, Q.; Han, J. Part-object relational visual saliency. IEEE Transactions on Pattern Analysis and Machine Intelligence 2021. [Google Scholar] [CrossRef]
- Anwaar, M.U.; Labintcev, E.; Kleinsteuber, M. Compositional learning of image-text query for image retrieval. In Proceedings of the Proceedings of the IEEE/CVF Winter conference on Applications of Computer Vision, 2021, pp. 1140–1149.
- Wu, G.; Lin, Z.; Han, J.; Liu, L.; Ding, G.; Zhang, B.; Shen, J. Unsupervised Deep Hashing via Binary Latent Factor Models for Large-scale Cross-modal Retrieval. In Proceedings of the IJCAI, 2018, Vol. 1, p. 5.
- Chen, C.; Debattista, K.; Han, J. Virtual Category Learning: A Semi-Supervised Learning Method for Dense Prediction with Extremely Limited Labels. IEEE Transactions on Pattern Analysis and Machine Intelligence (T-PAMI) 2024.
- Henderson, P.; Ferrari, V. End-to-end training of object class detectors for mean average precision. In Proceedings of the Computer Vision–ACCV 2016: 13th Asian Conference on Computer Vision, Taipei, Taiwan, November 20-24, 2016, Revised Selected Papers, Part V 13. Springer, 2017, pp. 198–213.
- Yigitcanlar, T. Smart cities: An effective urban development and management model? Australian Planner 2015, 52, 27–34. [Google Scholar] [CrossRef]
- Wang, B.; Leng, Y.; Wang, G.; Wang, Y. Fusiontransnet for smart urban mobility: Spatiotemporal traffic forecasting through multimodal network integration. arXiv 2024, arXiv:2405.05786 2024. [Google Scholar]
- Dzemydienė, D.; Burinskienė, A.; Čižiūnienė, K. An approach of integration of contextual data in e-service system for management of multimodal cargo transportation. Sustainability 2024, 16, 7893. [Google Scholar] [CrossRef]
- Tyagi, N.; Bhushan, B. Demystifying the role of natural language processing (NLP) in smart city applications: background, motivation, recent advances, and future research directions. Wireless personal communications 2023, 130, 857–908. [Google Scholar] [CrossRef]
- Fu, X. Natural language processing in urban planning: A research agenda. Journal of Planning Literature 2024, 39, 395–407. [Google Scholar] [CrossRef]
- Reshamwala, A.; Mishra, D.; Pawar, P. Review on natural language processing. IRACST Engineering Science and Technology: An International Journal (ESTIJ) 2013, 3, 113–116. [Google Scholar]
- Wibawa, A.P.; Kurniawan, F.; et al. A survey of text summarization: Techniques, evaluation and challenges. Natural Language Processing Journal 2024, 7, 100070. [Google Scholar]
- Nguyen, L.; Scialom, T.; Piwowarski, B.; Staiano, J. LoRaLay: A multilingual and multimodal dataset for long range and layout-aware summarization. arXiv 2023, arXiv:2301.11312 2023. [Google Scholar]
- Backer Johnsen, H. Graphical abstract?-Reflections on visual summaries of scientific research. 2022. [Google Scholar]
- Ma, Y.; Jiang, F.K. Verbal and visual resources in graphical abstracts: Analyzing patterns of knowledge presentation in digital genres. Ibérica: Revista de la Asociación Europea de Lenguas para Fines Específicos (AELFE) 2023, pp. 129–154.
- Jambor, H.K.; Bornhäuser, M. Ten simple rules for designing graphical abstracts. PLOS Computational Biology 2024, 20, e1011789. [Google Scholar] [CrossRef]
- Givchi, A.; Ramezani, R.; Baraani-Dastjerdi, A. Graph-based abstractive biomedical text summarization. Journal of Biomedical Informatics 2022, 132, 104099. [Google Scholar] [CrossRef]
- Jangra, A.; Mukherjee, S.; Jatowt, A.; Saha, S.; Hasanuzzaman, M. A survey on multi-modal summarization. ACM Computing Surveys 2023, 55, 1–36. [Google Scholar] [CrossRef]
- Li, M.; Zhang, L.; Ji, H.; Radke, R.J. Keep meeting summaries on topic: Abstractive multi-modal meeting summarization. In Proceedings of the Proceedings of the 57th annual meeting of the association for computational linguistics, 2019, pp. 2190–2196.
- Bhatia, N.; Jaiswal, A. Automatic text summarization and it’s methods-a review. In Proceedings of the 2016 6th international conference-cloud system and big data engineering (Confluence). IEEE, 2016, pp. 65–72.
- Chen, Z.; Lu, Z.; Rong, H.; Zhao, C.; Xu, F. Multi-modal anchor adaptation learning for multi-modal summarization. Neurocomputing 2024, 570, 127144. [Google Scholar] [CrossRef]
- Zhuang, H.; Zhang, W.E.; Xie, L.; Chen, W.; Yang, J.; Sheng, Q. Automatic, meta and human evaluation for multimodal summarization with multimodal output. In Proceedings of the Proceedings of the 2024 Conference of the North American Chapter of the Association for Computational Linguistics: Human Language Technologies (Volume 1: Long Papers), 2024, pp. 7768–7790.
- Li, H.; Zhu, J.; Ma, C.; Zhang, J.; Zong, C. Multi-modal summarization for asynchronous collection of text, image, audio and video. In Proceedings of the Proceedings of the 2017 conference on empirical methods in natural language processing, 2017, pp. 1092–1102.
- Li, H.; Zhu, J.; Liu, T.; Zhang, J.; Zong, C.; et al. Multi-modal Sentence Summarization with Modality Attention and Image Filtering. In Proceedings of the IJCAI; 2018; pp. 4152–4158. [Google Scholar]
- Xiao, M.; Zhu, J.; Lin, H.; Zhou, Y.; Zong, C. Cfsum: A coarse-to-fine contribution network for multimodal summarization. arXiv 2023, arXiv:2307.02716 2023. [Google Scholar]
- Lu, M.; Liu, Y.; Zhang, X. A modality-enhanced multi-channel attention network for multi-modal dialogue summarization. Applied Sciences 2024, 14, 9184. [Google Scholar] [CrossRef]
- Li, H.; Zhu, J.; Zhang, J.; He, X.; Zong, C. Multimodal sentence summarization via multimodal selective encoding. In Proceedings of the Proceedings of the 28th International Conference on Computational Linguistics, 2020, pp. 5655–5667.
- Yuan, M.; Cui, S.; Zhang, X.; Wang, S.; Xu, H.; Liu, T. Exploring the Trade-Off within Visual Information for MultiModal Sentence Summarization. In Proceedings of the Proceedings of the 47th International ACM SIGIR Conference on Research and Development in Information Retrieval, 2024, pp. 2006–2017.
- Im, J.; Kim, M.; Lee, H.; Cho, H.; Chung, S. Self-supervised multimodal opinion summarization. arXiv 2021, arXiv:2105.13135 2021. [Google Scholar]
- Song, X.; Jing, L.; Lin, D.; Zhao, Z.; Chen, H.; Nie, L. V2P: Vision-to-prompt based multi-modal product summary generation. In Proceedings of the Proceedings of the 45th International ACM SIGIR conference on research and development in information retrieval, 2022, pp. 992–1001.
- Liu, Z.; Zhang, X.; Zhang, L.; Yu, Z. MDS: A Fine-Grained Dataset for Multi-Modal Dialogue Summarization. In Proceedings of the Proceedings of the 2024 Joint International Conference on Computational Linguistics, Language Resources and Evaluation (LREC-COLING 2024), 2024, pp. 11123–11137.
- Zhang, J.G.; Zou, P.; Li, Z.; Wan, Y.; Pan, X.; Gong, Y.; Yu, P.S. Multi-modal generative adversarial network for short product title generation in mobile e-commerce. arXiv 2019, arXiv:1904.01735 2019. [Google Scholar]
- Chen, J.; Zhuge, H. Abstractive text-image summarization using multi-modal attentional hierarchical RNN. In Proceedings of the Proceedings of the 2018 conference on empirical methods in natural language processing, 2018, pp. 4046–4056.
- Fu, X.; Wang, J.; Yang, Z. Multi-modal summarization for video-containing documents. arXiv 2020, arXiv:2009.08018 2020. [Google Scholar]
- Zhu, J.; Li, H.; Liu, T.; Zhou, Y.; Zhang, J.; Zong, C. MSMO: Multimodal summarization with multimodal output. In Proceedings of the Proceedings of the 2018 conference on empirical methods in natural language processing, 2018, pp. 4154–4164.
- Zhu, J.; Zhou, Y.; Zhang, J.; Li, H.; Zong, C.; Li, C. Multimodal summarization with guidance of multimodal reference. In Proceedings of the Proceedings of the AAAI conference on artificial intelligence, 2020, Vol. 34, pp. 9749–9756.
- Tan, Z.; Zhong, X.; Ji, J.Y.; Jiang, W.; Chiu, B. Enhancing Large Language Models for Scientific Multimodal Summarization with Multimodal Output. In Proceedings of the Proceedings of the 31st International Conference on Computational Linguistics: Industry Track, 2025, pp. 263–275.
- Zhu, J.; Xiang, L.; Zhou, Y.; Zhang, J.; Zong, C. Graph-based multimodal ranking models for multimodal summarization. Transactions on Asian and low-resource language information processing 2021, 20, 1–21. [Google Scholar] [CrossRef]
- Zhang, Z.; Meng, X.; Wang, Y.; Jiang, X.; Liu, Q.; Yang, Z. Unims: A unified framework for multimodal summarization with knowledge distillation. In Proceedings of the Proceedings of the AAAI conference on artificial intelligence, 2022, Vol. 36, pp. 11757–11764.
- Zhang, L.; Zhang, X.; Pan, J. Hierarchical cross-modality semantic correlation learning model for multimodal summarization. In Proceedings of the Proceedings of the AAAI Conference on Artificial Intelligence, 2022, Vol. 36, pp. 11676–11684.
- Mukherjee, S.; Jangra, A.; Saha, S.; Jatowt, A. Topic-aware multimodal summarization. In Proceedings of the Findings of the association for computational linguistics: AACL-IJCNLP 2022, 2022, pp. 387–398. [Google Scholar]
- Fu, X.; Wang, J.; Yang, Z. Mm-avs: A full-scale dataset for multi-modal summarization. In Proceedings of the Proceedings of the 2021 Conference of the North American Chapter of the Association for Computational Linguistics: Human Language Technologies, 2021, pp. 5922–5926.
- Jin, X.; Liu, K.; Jiang, J.; Xu, T.; Ding, Z.; Hu, X.; Huang, Y.; Zhang, D.; Li, S.; Xue, K.; et al. Pattern recognition of distributed optical fiber vibration sensors based on resnet 152. IEEE Sensors Journal 2023, 23, 19717–19725. [Google Scholar] [CrossRef]
- Lewis, M.; Liu, Y.; Goyal, N.; Ghazvininejad, M.; Mohamed, A.; Levy, O.; Stoyanov, V.; Zettlemoyer, L. Bart: Denoising sequence-to-sequence pre-training for natural language generation, translation, and comprehension. arXiv 2019, arXiv:1910.13461 2019. [Google Scholar]
- Zhang, Y.; Yang, Q. An overview of multi-task learning. National Science Review 2018, 5, 30–43. [Google Scholar] [CrossRef]
- Dey, R.; Salem, F.M. Gate-variants of gated recurrent unit (GRU) neural networks. In Proceedings of the 2017 IEEE 60th international midwest symposium on circuits and systems (MWSCAS). IEEE; 2017; pp. 1597–1600. [Google Scholar]
- Li, P.; Jiang, X.; Shatkay, H. Figure and caption extraction from biomedical documents. Bioinformatics 2019, 35, 4381–4388. [Google Scholar] [CrossRef] [PubMed]
- Yadav, H.; Patel, N.; Jani, D. Fine-tuning BART for abstractive reviews summarization. In Computational Intelligence: Select Proceedings of InCITe 2022; Springer, 2023; pp. 375–385.
- Zhang, Z. Improved adam optimizer for deep neural networks. In Proceedings of the 2018 IEEE/ACM 26th international symposium on quality of service (IWQoS). Ieee; 2018; pp. 1–2. [Google Scholar]
- Ng, J.P.; Abrecht, V. Better summarization evaluation with word embeddings for ROUGE. arXiv 2015, arXiv:1508.06034 2015. [Google Scholar]
- Lee, J.; Lee, D.; Lee, Y.C.; Hwang, W.S.; Kim, S.W. Improving the accuracy of top-N recommendation using a preference model. Information Sciences 2016, 348, 290–304. [Google Scholar] [CrossRef]
- Moratanch, N.; Chitrakala, S. A survey on extractive text summarization. In Proceedings of the 2017 international conference on computer, communication and signal processing (ICCCSP). IEEE; 2017; pp. 1–6. [Google Scholar]
- Gupta, S.; Gupta, S.K. Abstractive summarization: An overview of the state of the art. Expert Systems with Applications 2019, 121, 49–65. [Google Scholar] [CrossRef]
- Zhu, C.; Yang, Z.; Gmyr, R.; Zeng, M.; Huang, X. Make lead bias in your favor: A simple and effective method for news summarization. 2019. [Google Scholar]
- Nenkova, A.; Vanderwende, L. The impact of frequency on summarization. Microsoft Research, Redmond, Washington, Tech. Rep. MSR-TR-2005 2005, 101. [Google Scholar]
- Mihalcea, R.; Tarau, P. Textrank: Bringing order into text. In Proceedings of the Proceedings of the 2004 conference on empirical methods in natural language processing, 2004, pp. 404–411.
- Erkan, G.; Radev, D.R. Lexrank: Graph-based lexical centrality as salience in text summarization. Journal of artificial intelligence research 2004, 22, 457–479. [Google Scholar] [CrossRef]
- Christian, H.; Agus, M.P.; Suhartono, D. Single document automatic text summarization using term frequency-inverse document frequency (TF-IDF). ComTech: Computer, Mathematics and Engineering Applications 2016, 7, 285–294. [Google Scholar] [CrossRef]
- Etemad, A.G.; Abidi, A.I.; Chhabra, M. Fine-tuned t5 for abstractive summarization. International Journal of Performability Engineering 2021, 17, 900. [Google Scholar]
- Li, J.; Chen, J.; Chen, H.; Zhao, D.; Yan, R. Multilingual Generation in Abstractive Summarization: A Comparative Study. In Proceedings of the Proceedings of the 2024 Joint International Conference on Computational Linguistics, Language Resources and Evaluation (LREC-COLING 2024), 2024, pp. 11827–11837.
- Abualigah, L.; Bashabsheh, M.Q.; Alabool, H.; Shehab, M. Text summarization: a brief review. Recent Advances in NLP: the case of Arabic language 2020, 1–15. [Google Scholar]
- Zhang, J.; Zhao, Y.; Saleh, M.; Liu, P. Pegasus: Pre-training with extracted gap-sentences for abstractive summarization. In Proceedings of the International conference on machine learning. PMLR; 2020; pp. 11328–11339. [Google Scholar]
- Mishra, N.; Sahu, G.; Calixto, I.; Abu-Hanna, A.; Laradji, I.H. LLM aided semi-supervision for Extractive Dialog Summarization. arXiv, 2023; arXiv:2311.11462 2023. [Google Scholar]
- Pinkus, A. Approximation theory of the MLP model in neural networks. Acta numerica 1999, 8, 143–195. [Google Scholar] [CrossRef]
- Abdulnabi, A.H.; Wang, G.; Lu, J.; Jia, K. Multi-task CNN model for attribute prediction. IEEE Transactions on Multimedia 2015, 17, 1949–1959. [Google Scholar] [CrossRef]
- Bhojanapalli, S.; Chakrabarti, A.; Glasner, D.; Li, D.; Unterthiner, T.; Veit, A. Understanding robustness of transformers for image classification. In Proceedings of the Proceedings of the IEEE/CVF international conference on computer vision, 2021, pp. 10231–10241.
- Dhruv, P.; Naskar, S. Image classification using convolutional neural network (CNN) and recurrent neural network (RNN): A review. Machine learning and information processing: proceedings of ICMLIP 2019 2020, 367–381. [Google Scholar]
- Tatsunami, Y.; Taki, M. Sequencer: Deep lstm for image classification. Advances in Neural Information Processing Systems 2022, 35, 38204–38217. [Google Scholar]
- Krubiński, M. Multimodal Summarization. 2024. [Google Scholar]
- Chen, Z.; Zhou, Y.; He, X.; Zhang, J. Learning task relationships in evolutionary multitasking for multiobjective continuous optimization. IEEE Transactions on Cybernetics 2020, 52, 5278–5289. [Google Scholar] [CrossRef]
- Bhatti, F.; Shah, M.A.; Maple, C.; Islam, S.U. A novel internet of things-enabled accident detection and reporting system for smart city environments. sensors 2019, 19, 2071. [Google Scholar] [CrossRef]
- Ma, M.; Preum, S.M.; Ahmed, M.Y.; Tärneberg, W.; Hendawi, A.; Stankovic, J.A. Data sets, modeling, and decision making in smart cities: A survey. ACM Transactions on Cyber-Physical Systems 2019, 4, 1–28. [Google Scholar] [CrossRef]
- Chen, T.; Liu, S.; Chang, S.; Cheng, Y.; Amini, L.; Wang, Z. Adversarial robustness: From self-supervised pre-training to fine-tuning. In Proceedings of the Proceedings of the IEEE/CVF conference on computer vision and pattern recognition, 2020, pp. 699–708.
- Yang, Y.; Wan, F.; Jiang, Q.Y.; Xu, Y. Facilitating multimodal classification via dynamically learning modality gap. Advances in Neural Information Processing Systems 2024, 37, 62108–62122. [Google Scholar]
Figure 1.
Input and output examples from the proposed multimodal-interactive network.
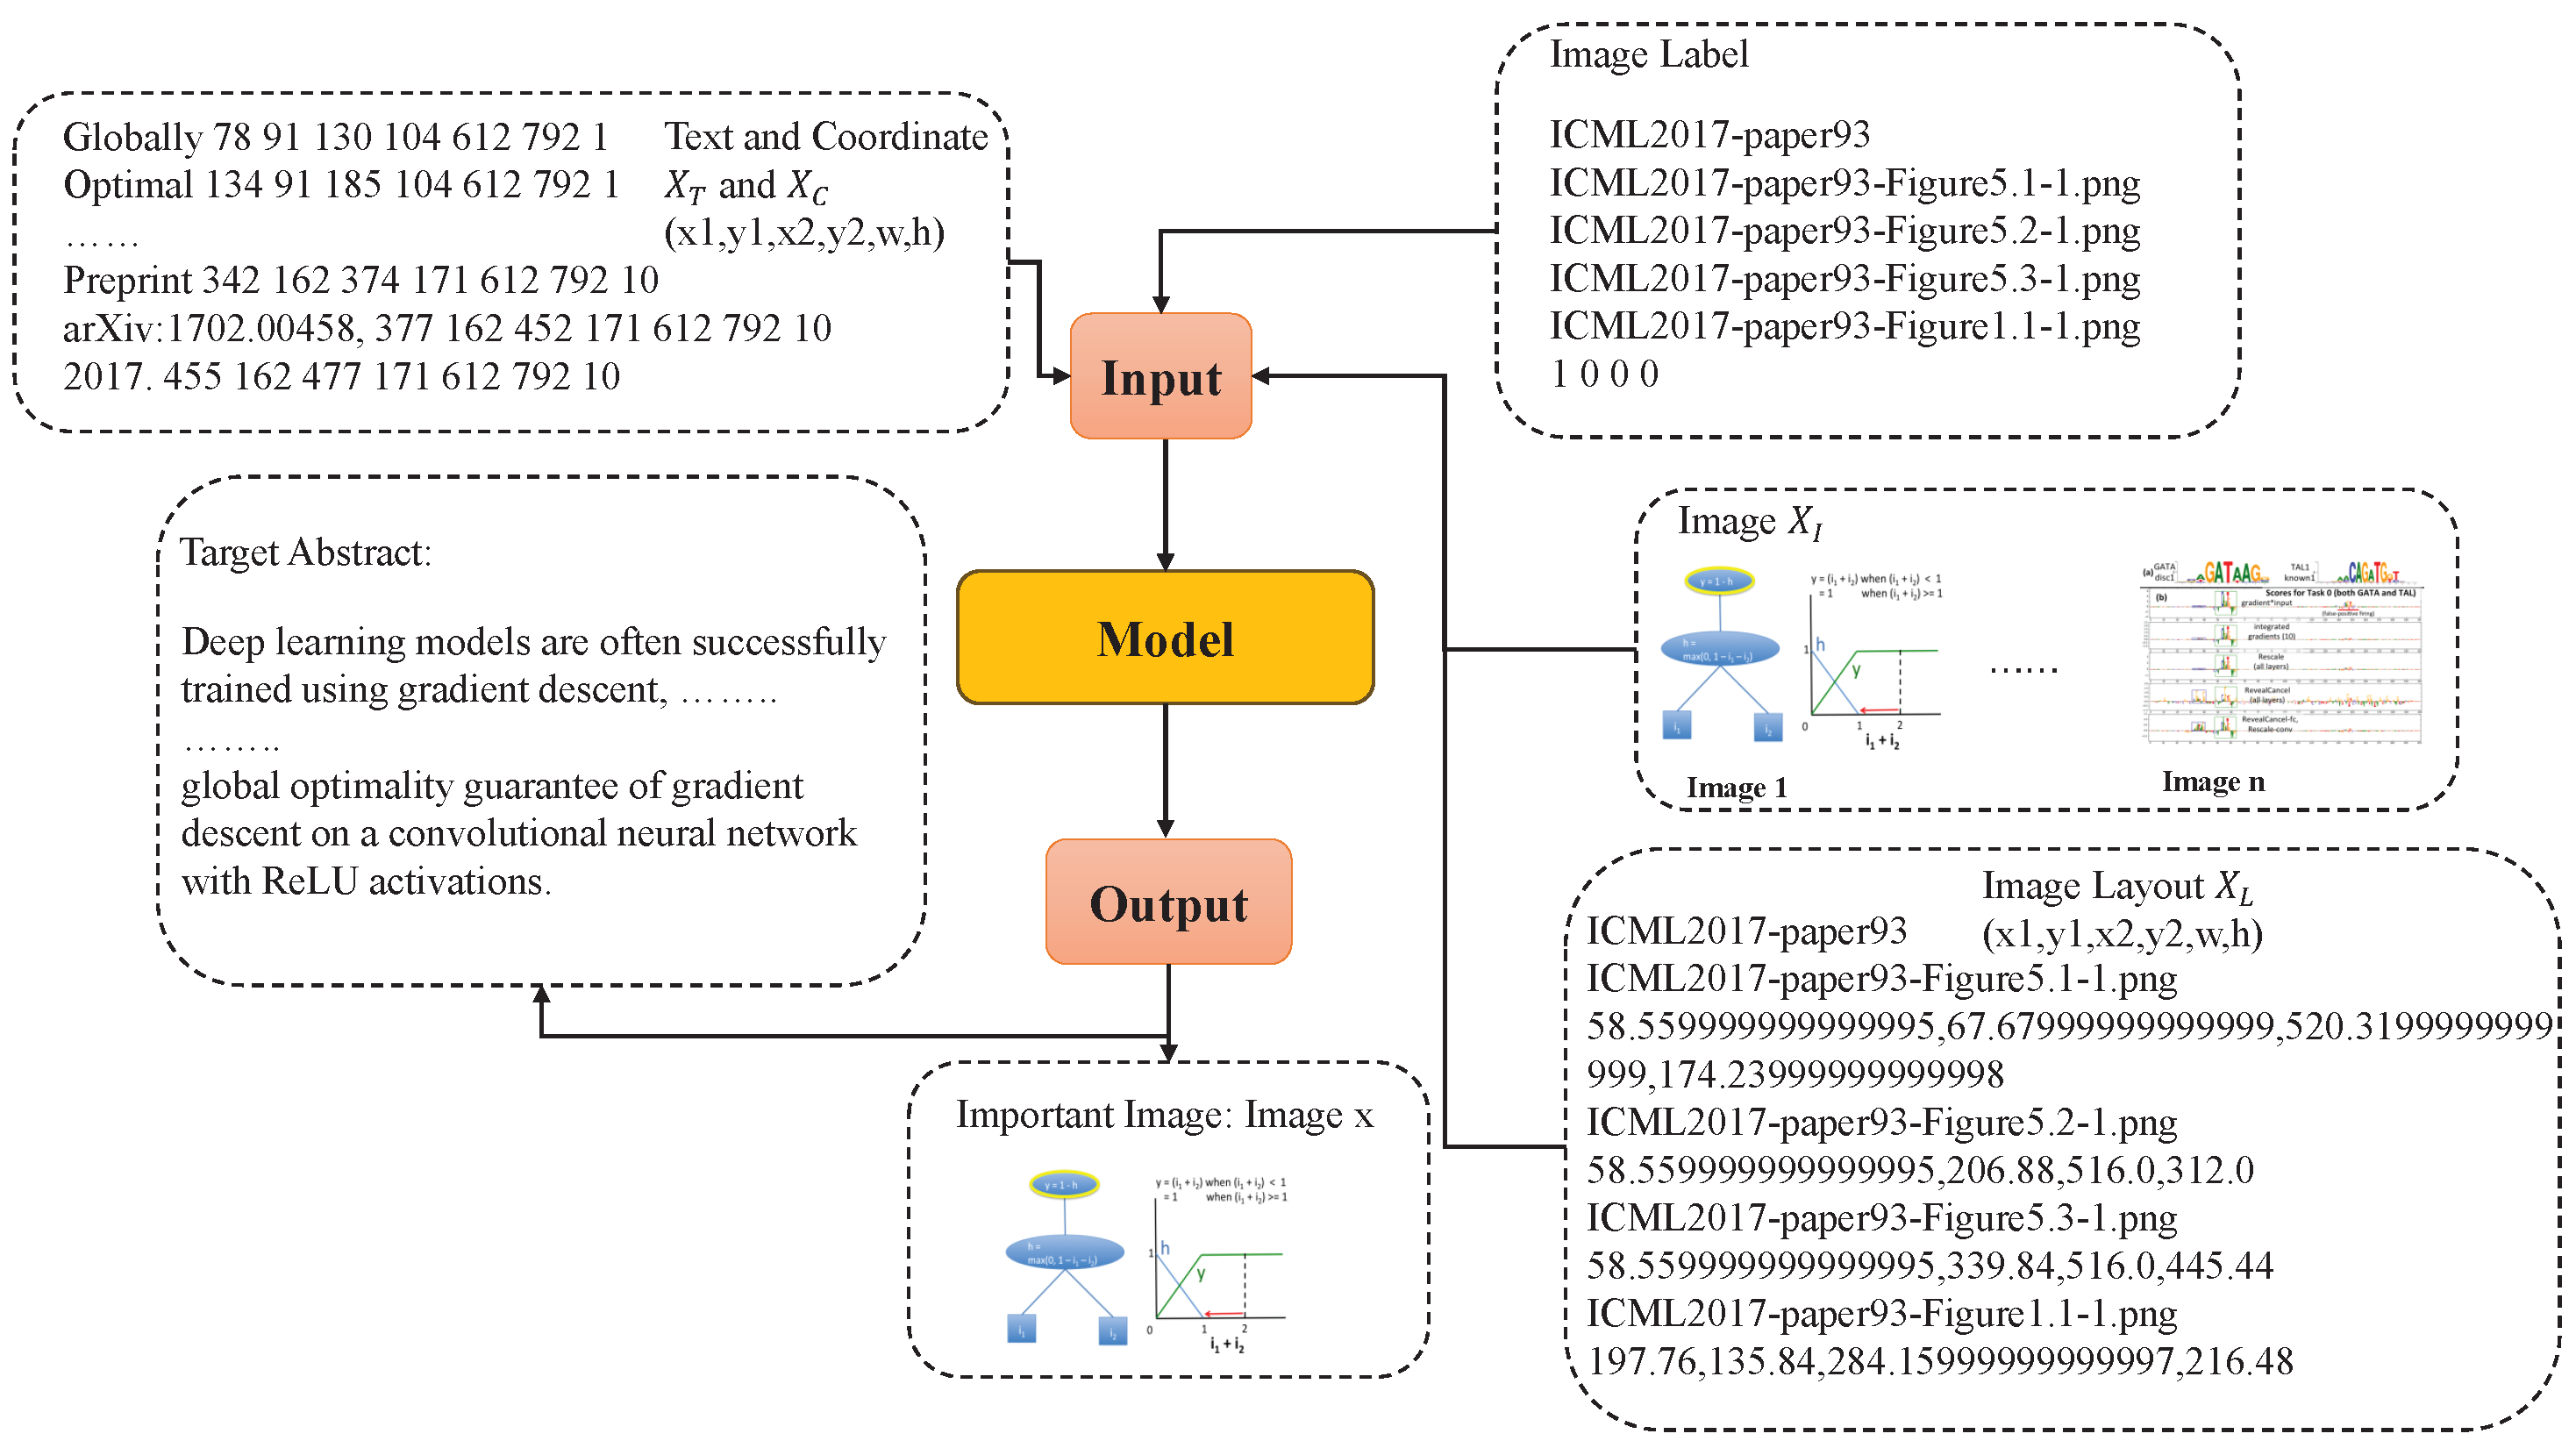
Figure 2.
The overall framework of our model.
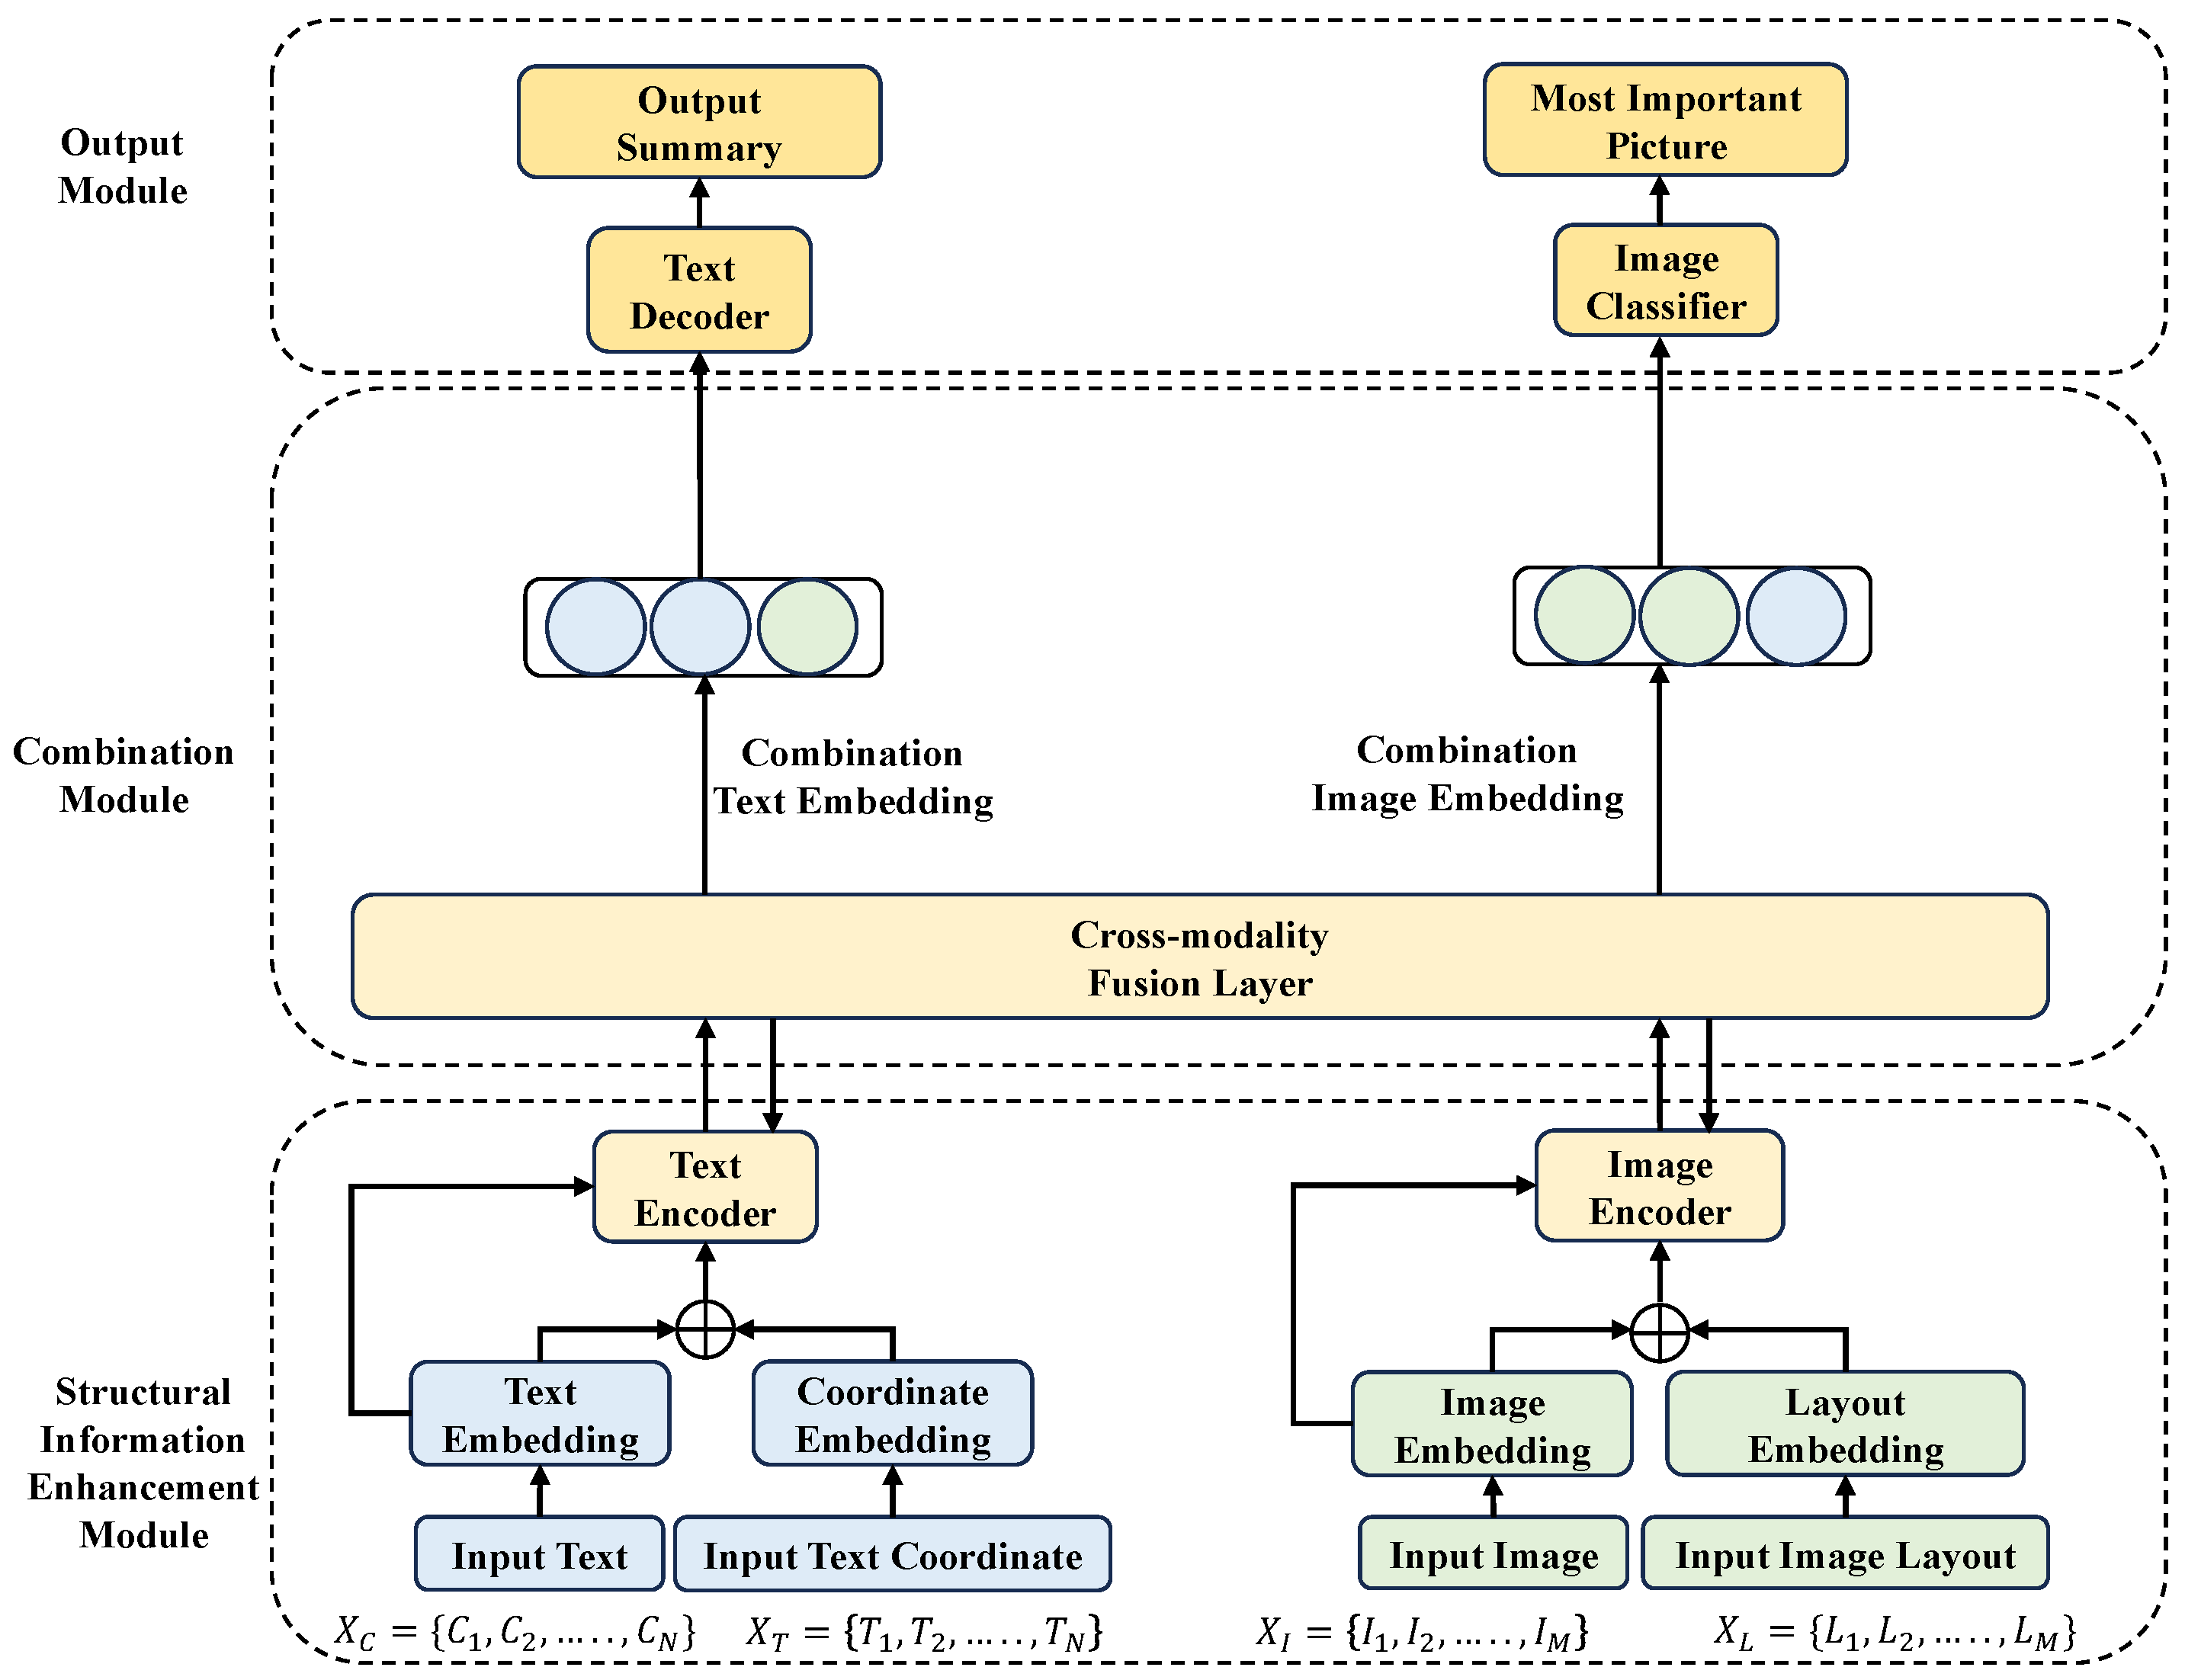
Figure 3.
The structural information enhancement module.
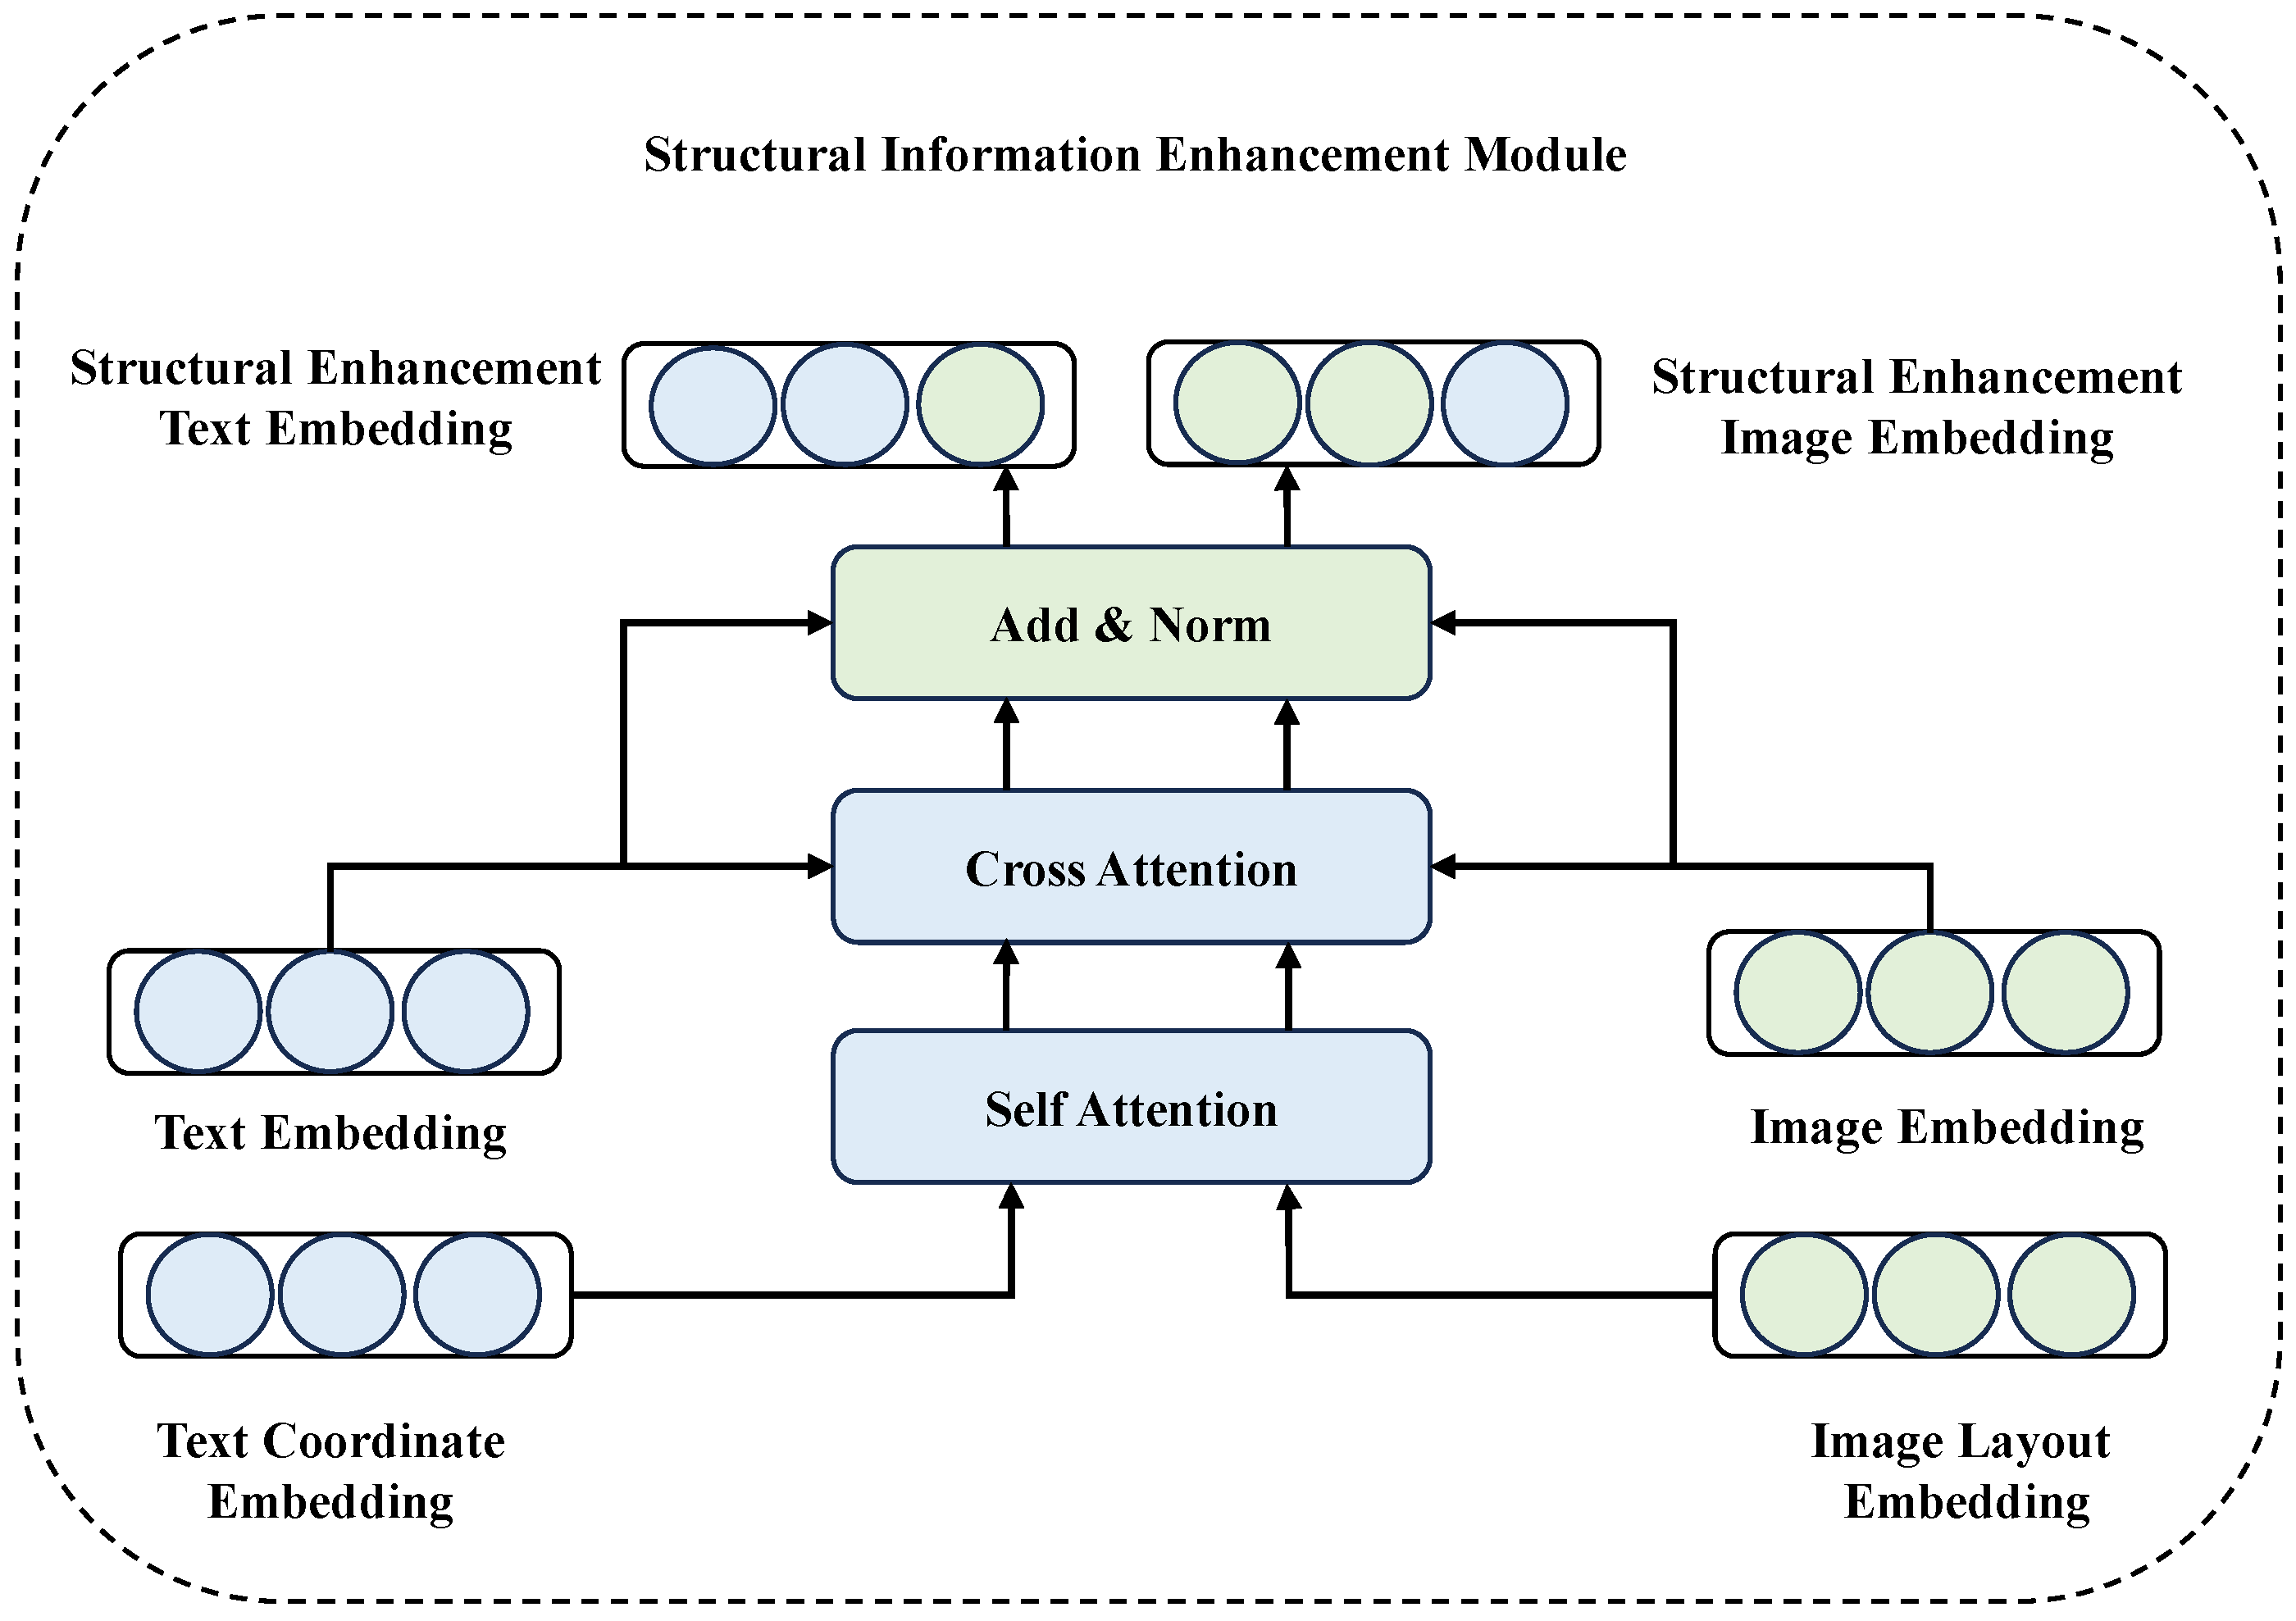
Figure 4.
The combination module.
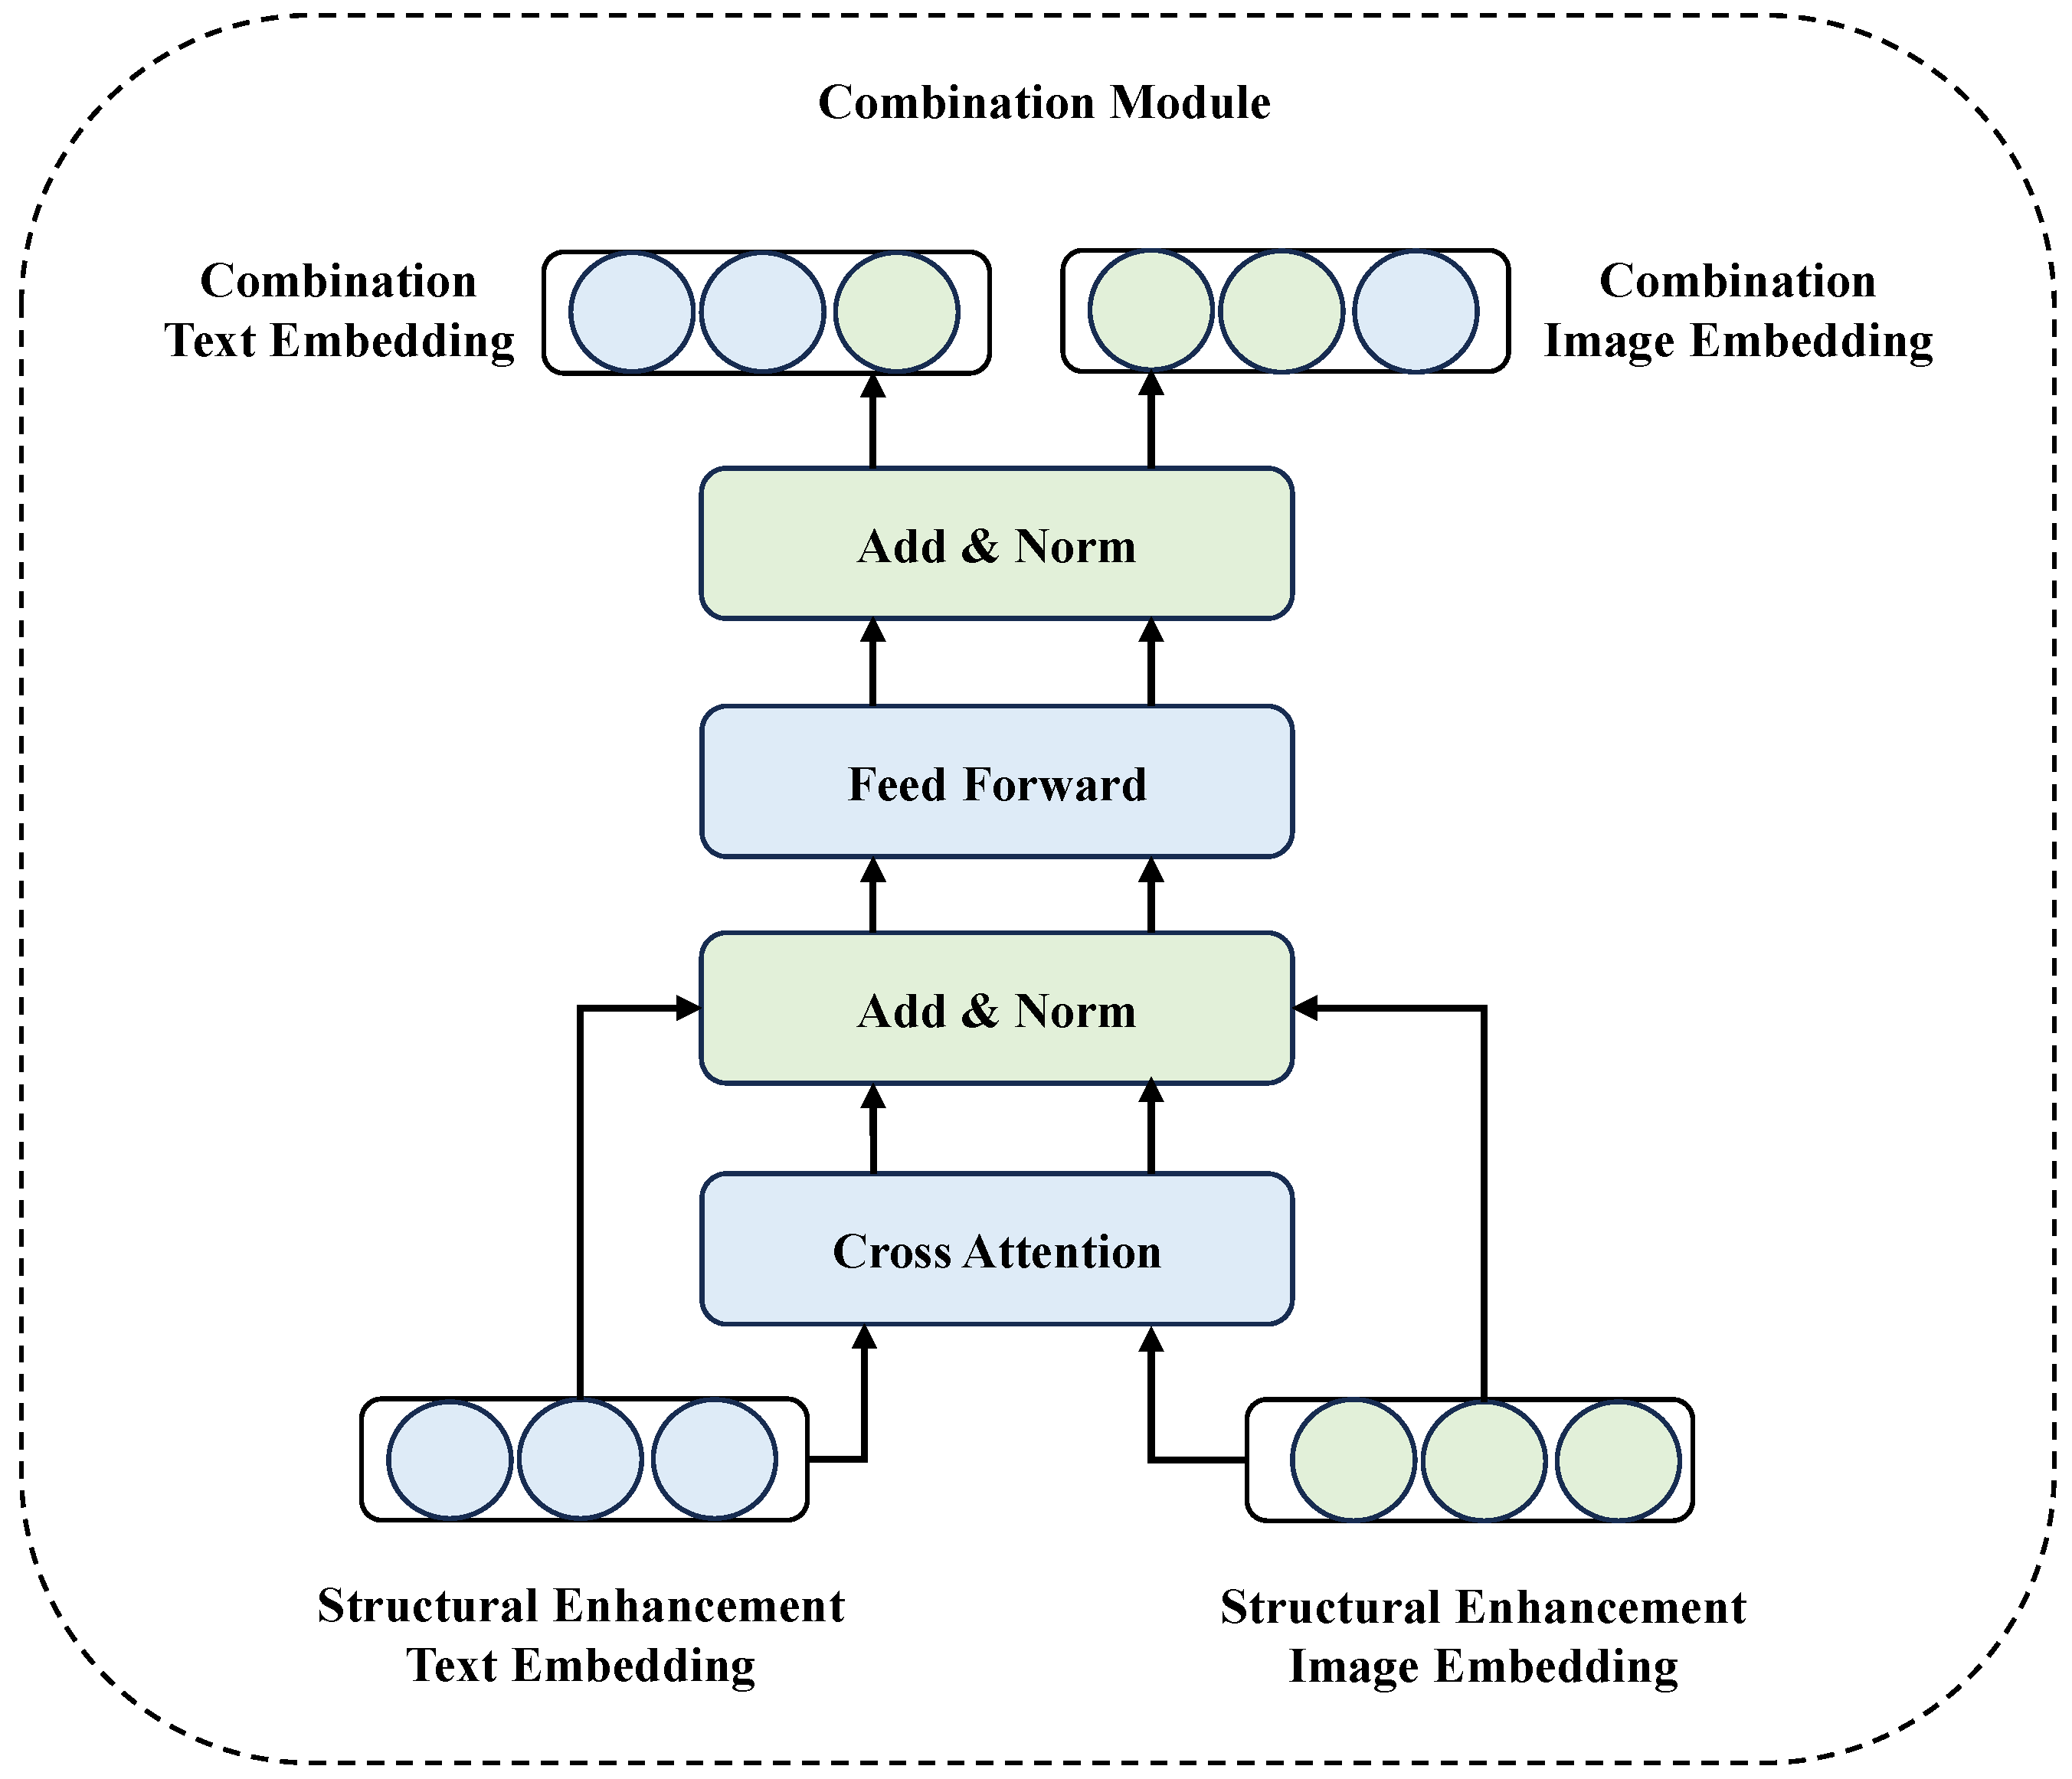
Figure 5.
The output module.
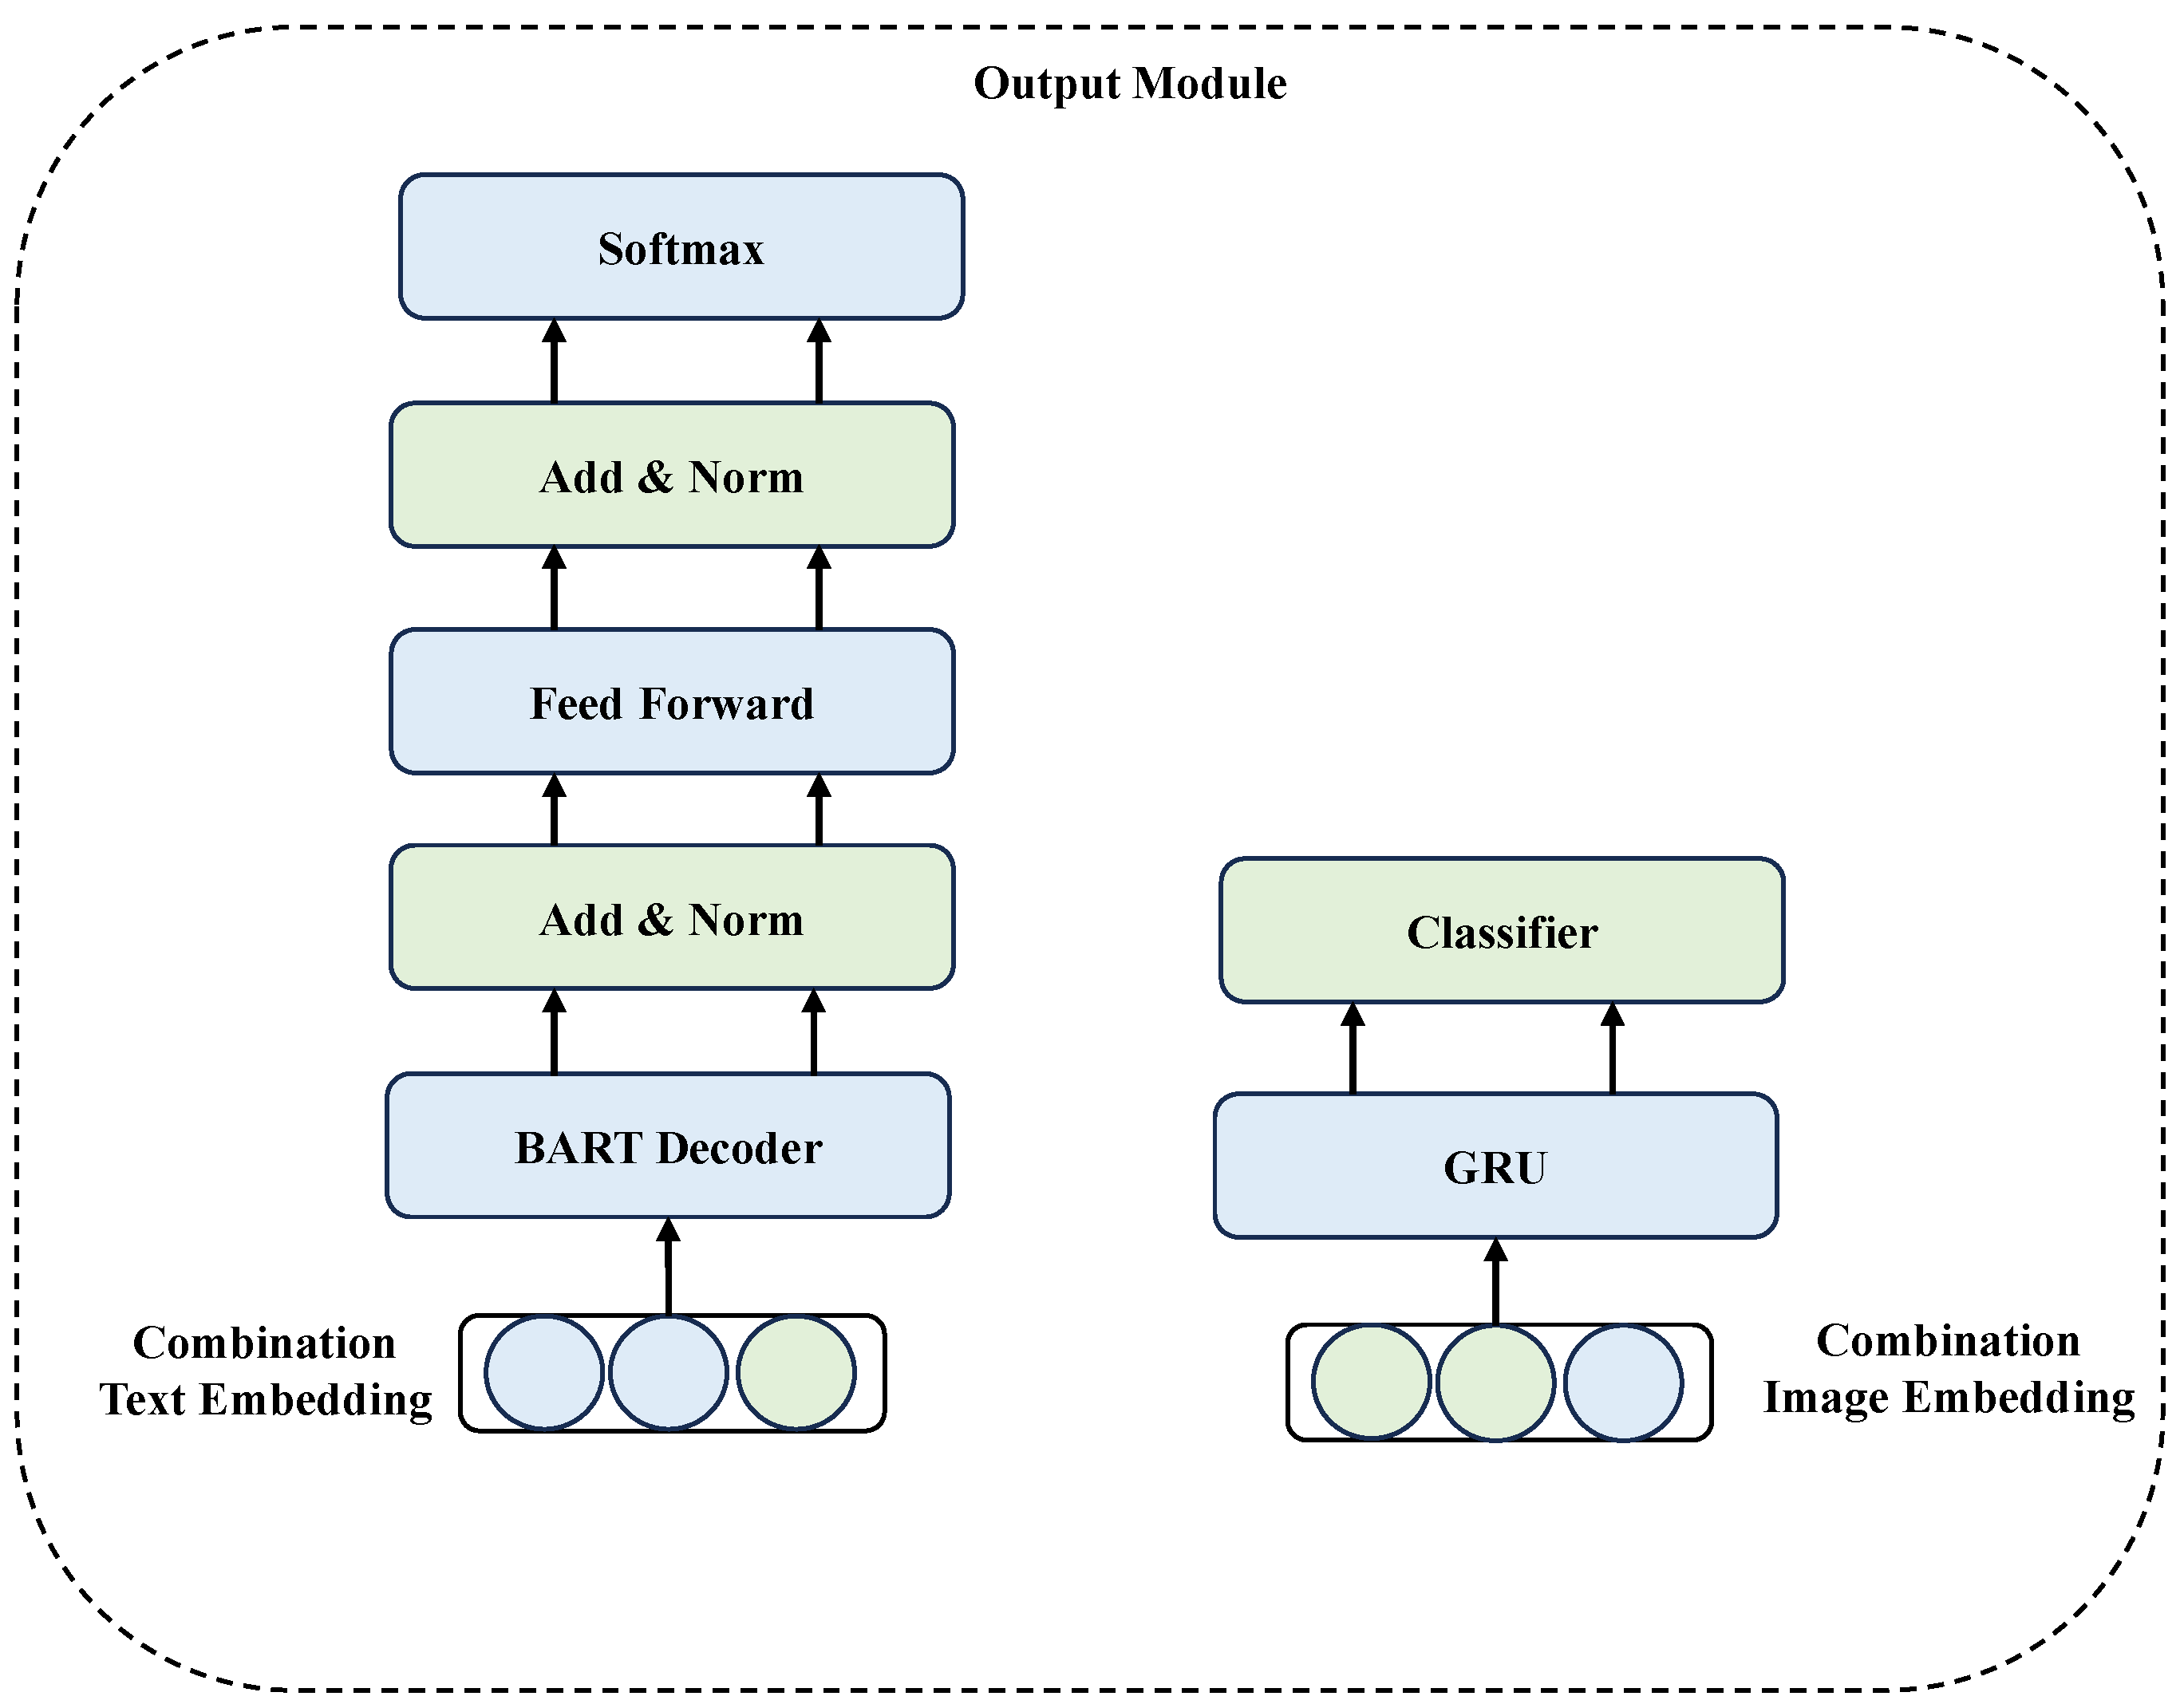
Figure 6.
The image part of the dataset.
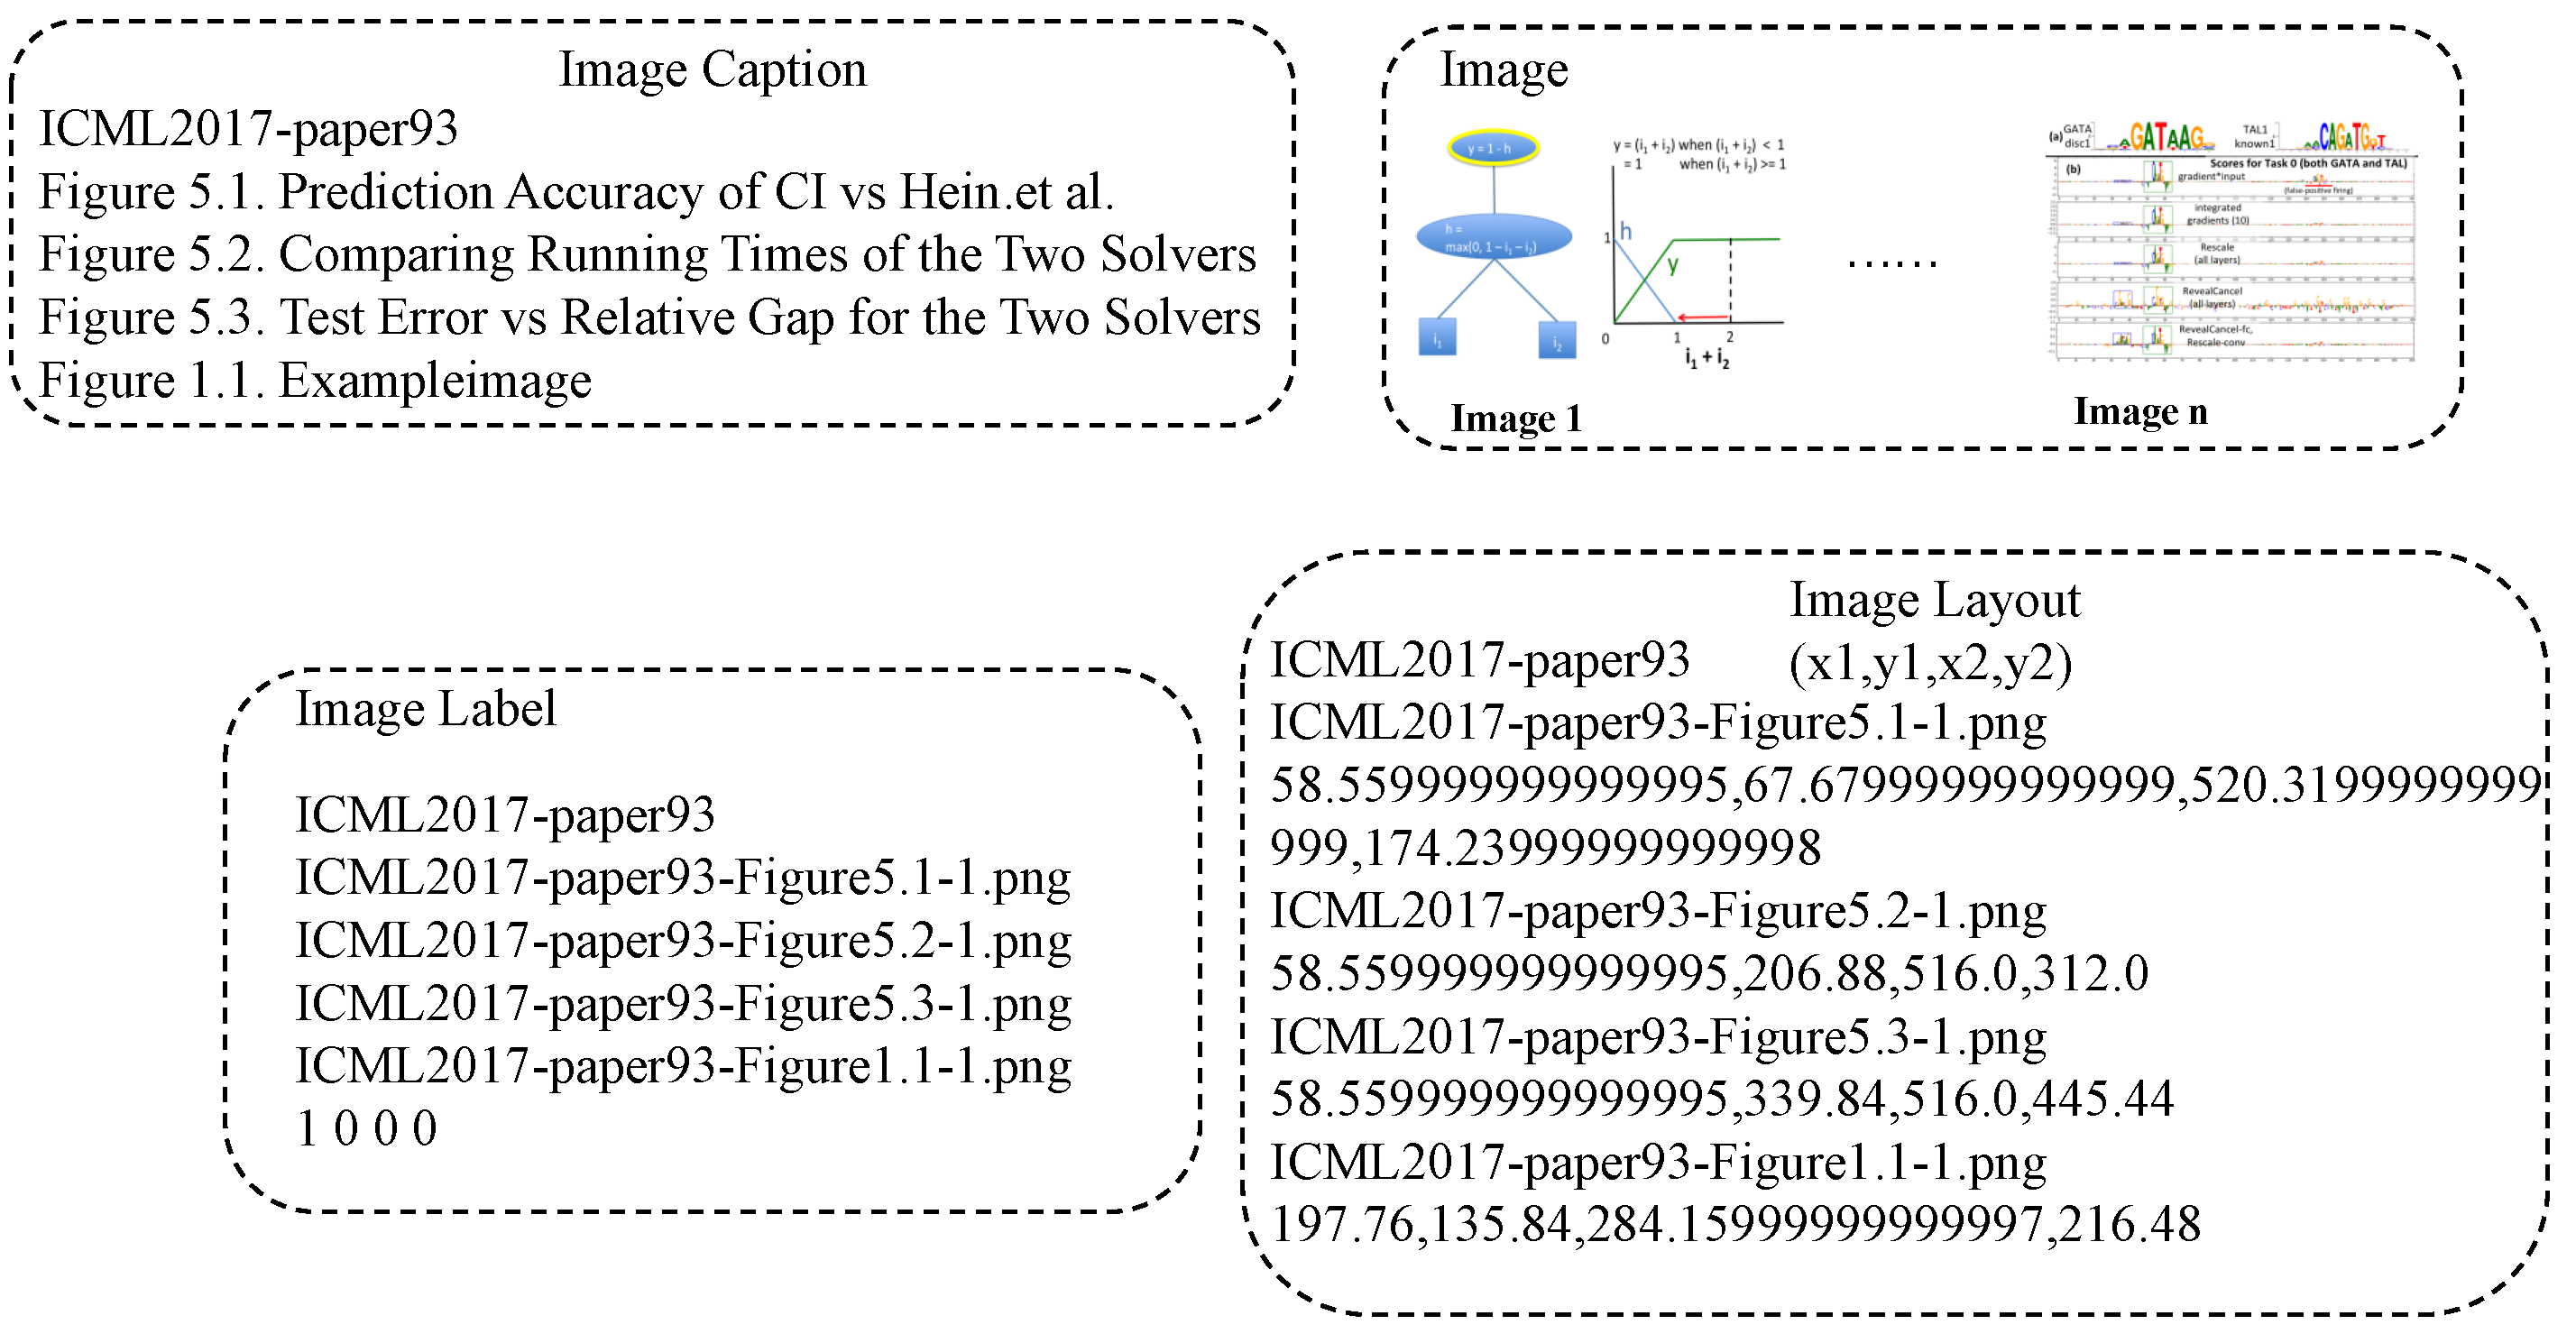
Figure 7.
The text part of the dataset.
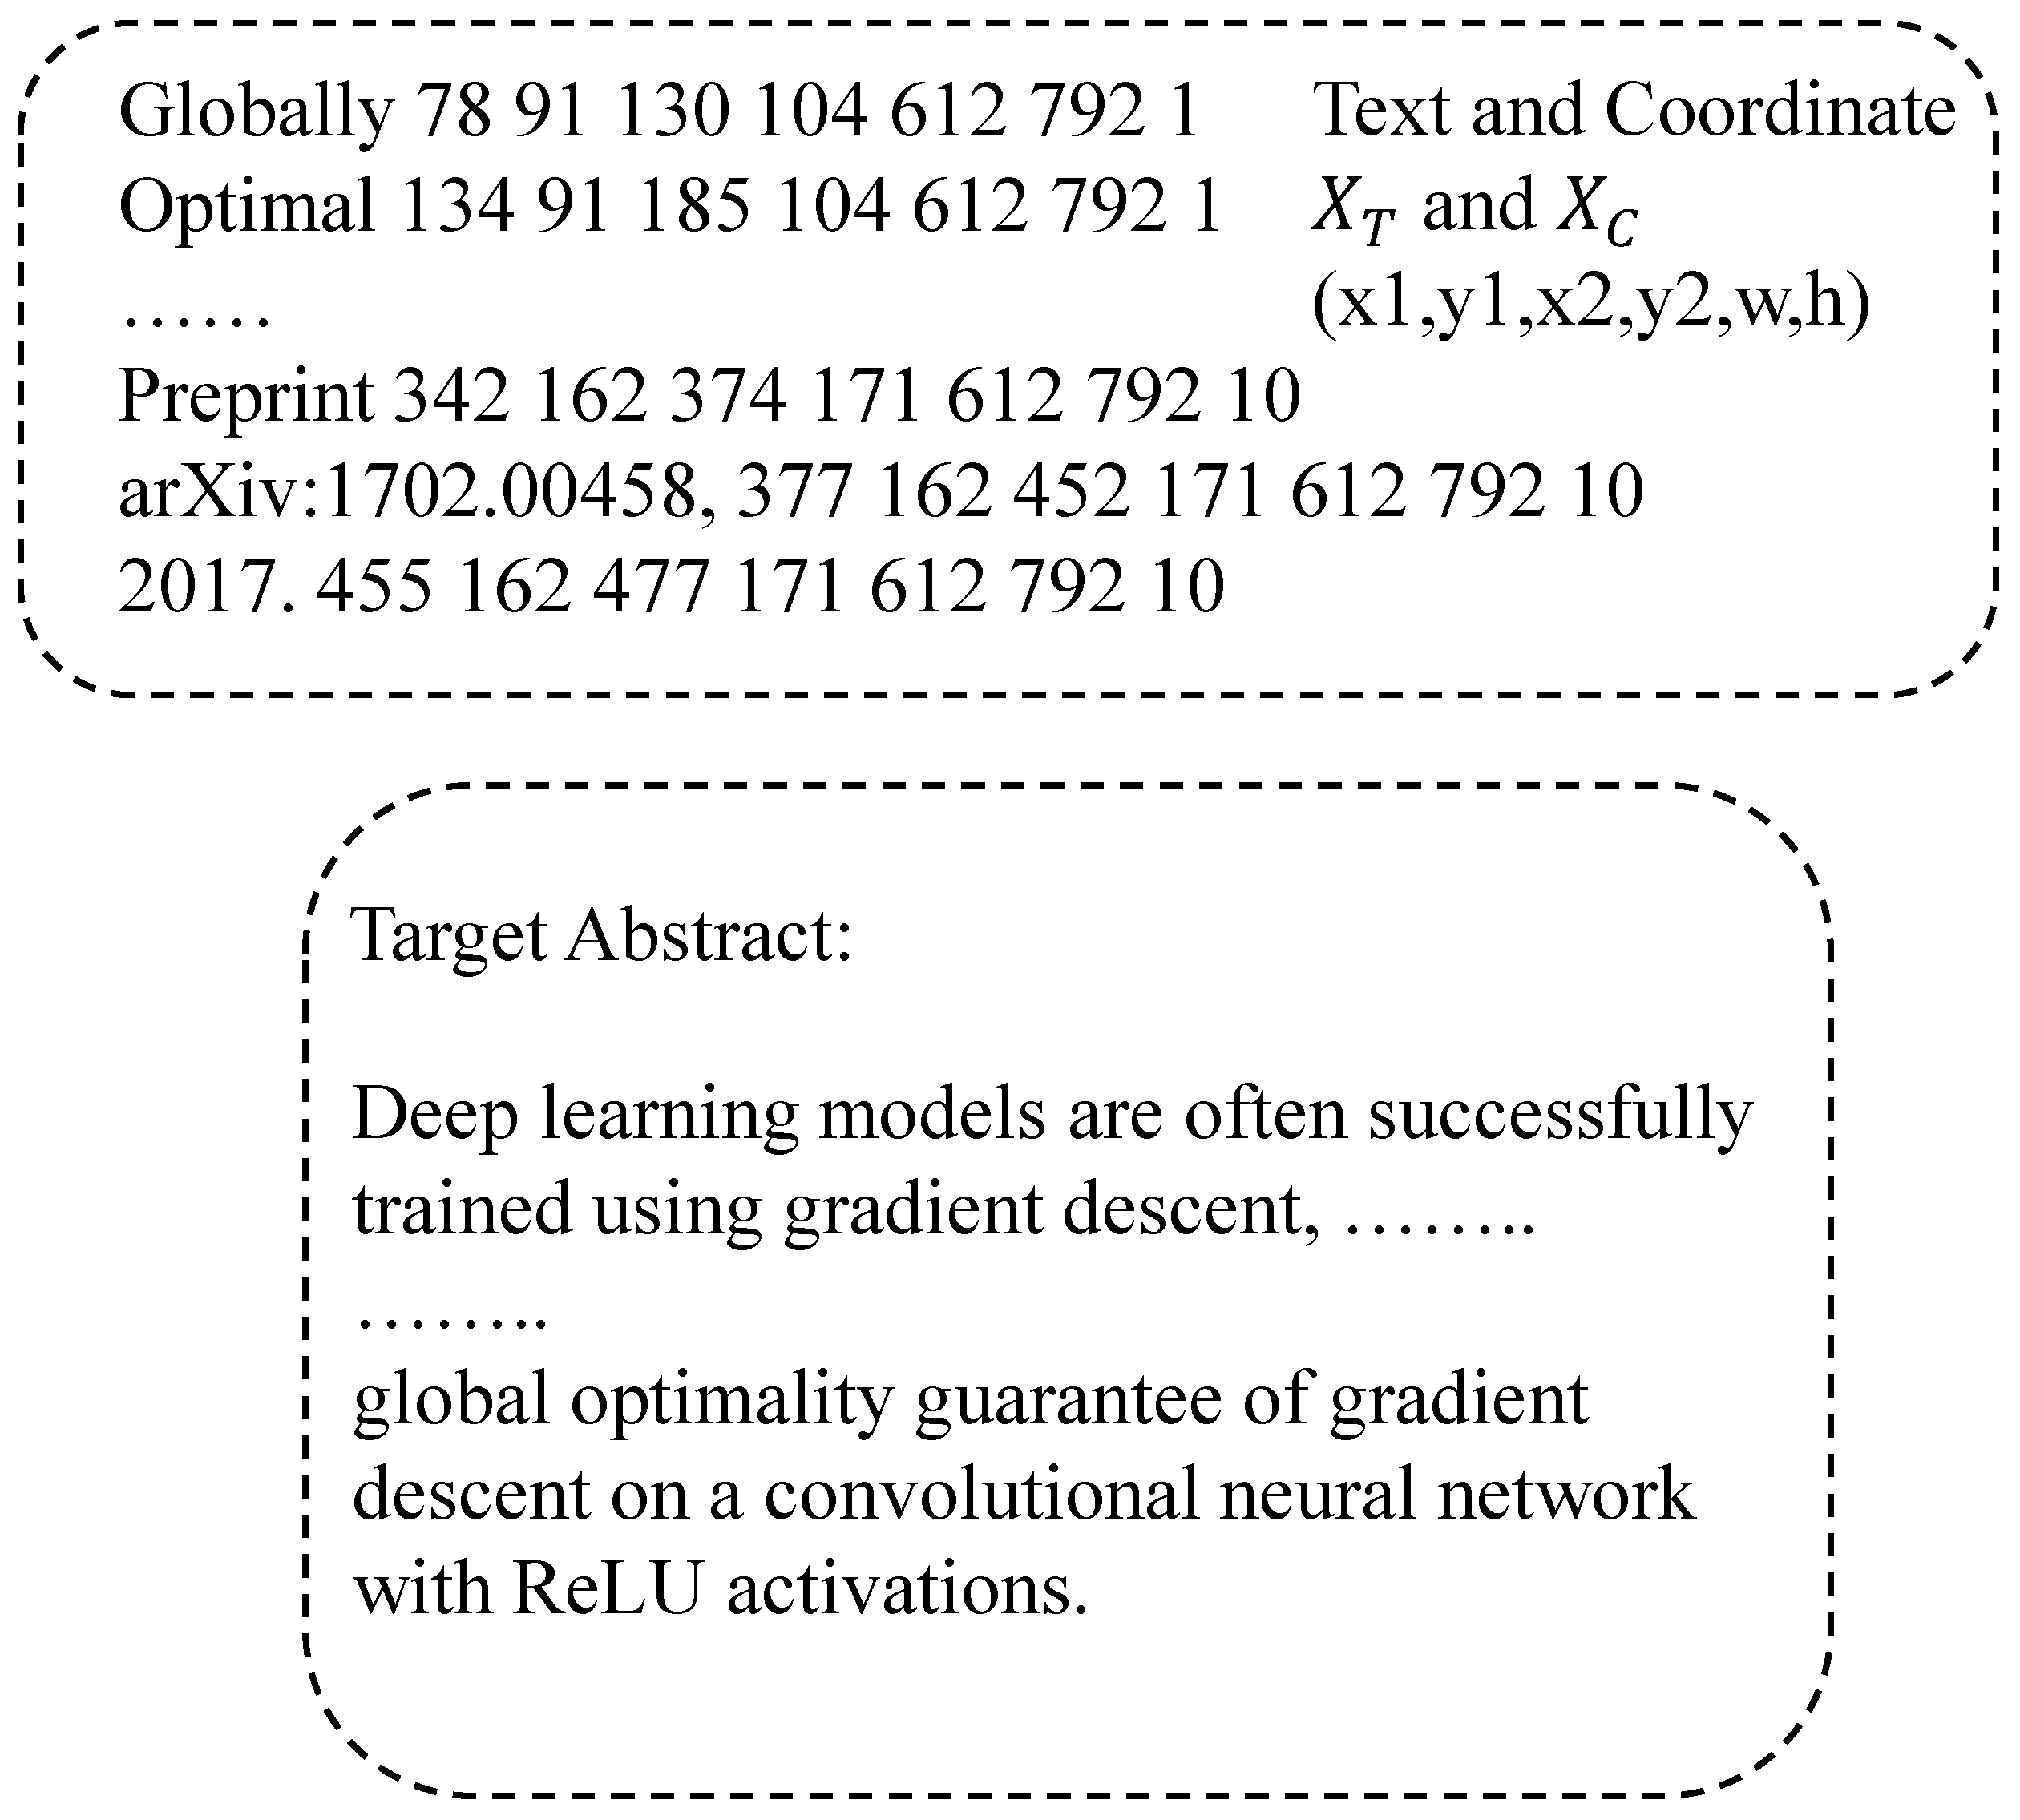

Table 1.
Dataset statistics.
| Train | Valid | Test | |
|---|---|---|---|
| Num. Papers | 615 | 65 | 163 |
| Avg. Num. Words in papers | 6784.90 | 7088.75 | 6836.77 |
| Avg. Num. Words in Summary | 124.30 | 128.78 | 125.64 |
| Avg. Num. Image in Papers | 6.69 | 6.85 | 6.74 |
| Max. Num. Image in Papers | 19 | 17 | 25 |
| Min. Num. Image in Papers | 1 | 1 | 1 |
| Max. Num. Words in Papers | 14084 | 12746 | 13119 |
| Min. Num. Words in Papers | 2854 | 3166 | 3085 |
| Max. Num. Words in Summary | 285 | 216 | 285 |
| Min. Num. Words in Summary | 40 | 56 | 32 |
Table 2.
The performance of comparative models on the dataset.
| Model | Rouge1 | Rouge2 | RougeL | RougeLSum | |
|---|---|---|---|---|---|
| Extractive Models | Lead3[70] | 24.9487 | 6.3754 | 13.6919 | 13.6954 |
| Sumbasic[71] | 22.9243 | 3.9666 | 11.3793 | 11.3944 | |
| TextRrank [72] | 30.9347 | 6.2924 | 17.0652 | 17.0658 | |
| LexRank[73] | 29.6314 | 5.8603 | 16.184 | 16.2027 | |
| TF-IDF[74] | 24.8868 | 5.0350 | 11.4188 | 11.4339 | |
| Abstractive Models | T5 [75] | 30.4562 | 7.5950 | 19.0483 | 19.0540 |
| Mbart[76] | 37.3201 | 9.0104 | 19.8601 | 19.8400 | |
| Led[77] | 42.1852 | 12.3763 | 20.3438 | 20.3380 | |
| Pegasus[78] | 43.6267 | 14.6201 | 24.4578 | 24.4086 | |
| DistilBart [79] | 38.9486 | 10.9574 | 21.0662 | 21.0610 | |
| Proposed | 46.5545 | 16.1336 | 24.9548 | 24.9227 |
Table 3.
The comparison of output between the proposed network and other models.
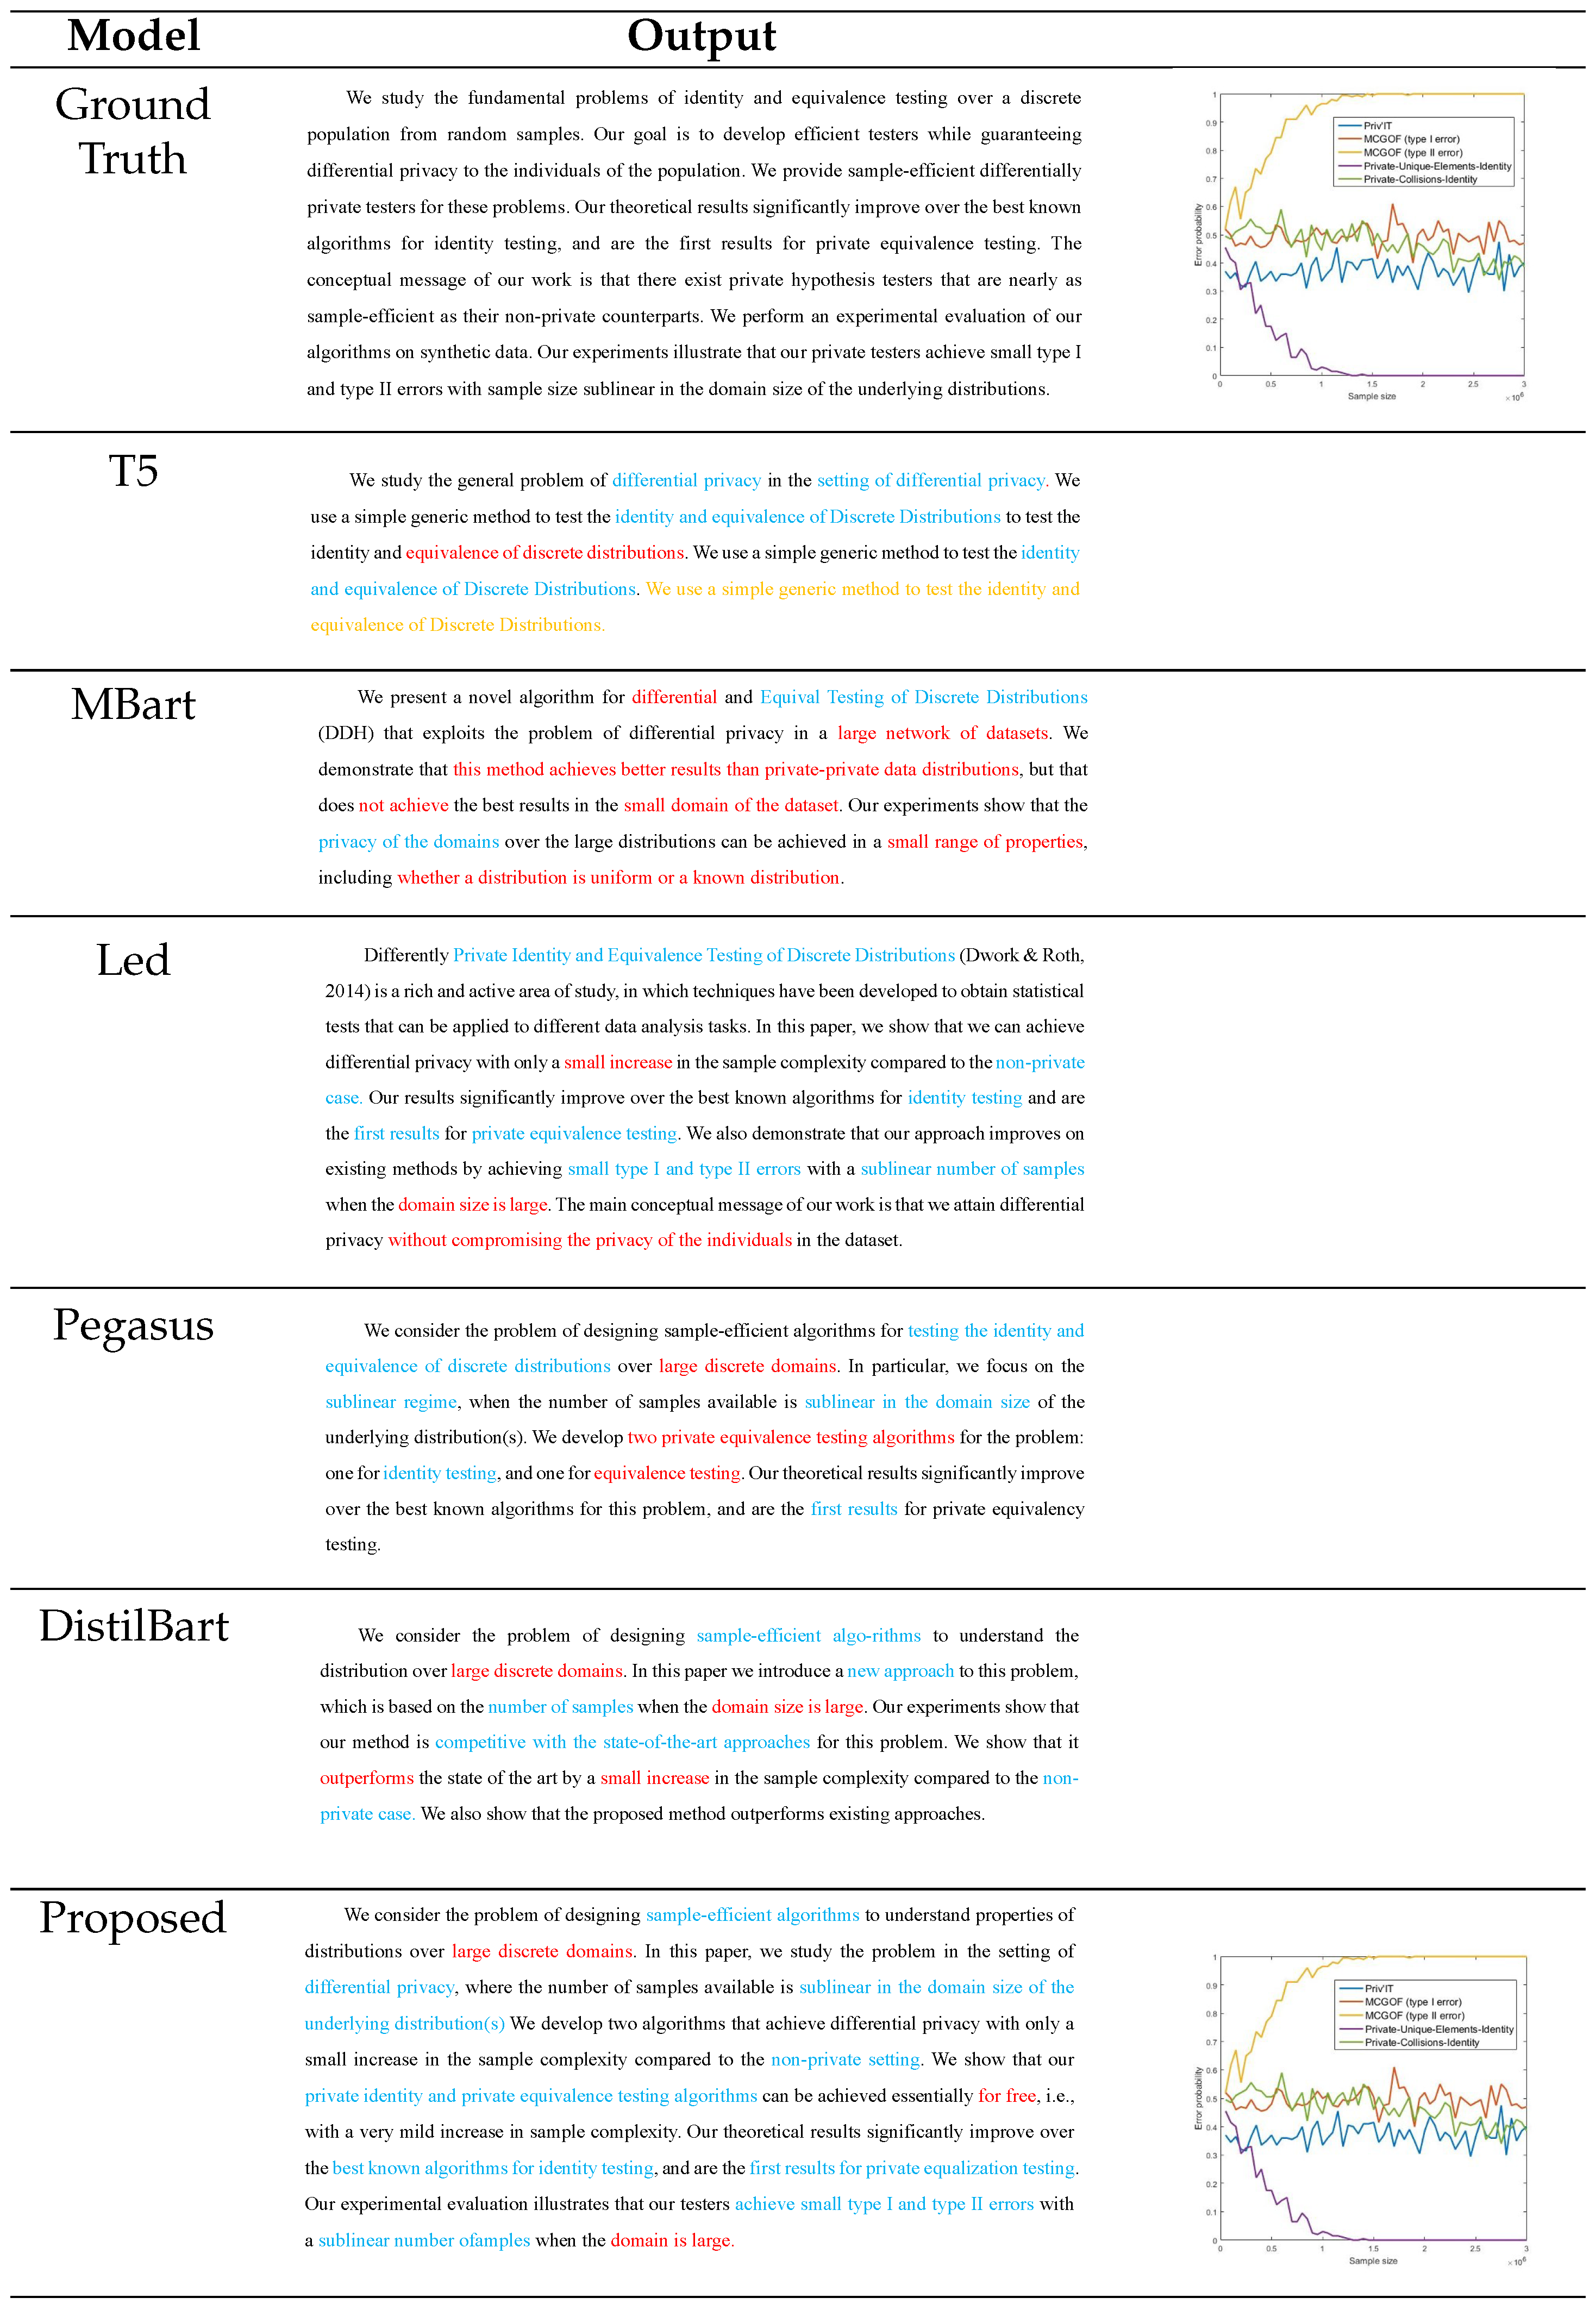
Table 4.
The ablation study of the combination module on the dataset.
| Type | Task | Rouge1 | Rouge2 | RougeL | RougeLSum | Top-1 | Top-2 |
|---|---|---|---|---|---|---|---|
| W/o CM | I | - | - | - | - | 85.28% | 94.48% |
| T | 45.8707 | 15.4908 | 24.7259 | 24.6456 | - | - | |
| I+T | 46.0182 | 15.5612 | 24.7648 | 24.7674 | 85.89% | 95.09% | |
| With CM | I | - | - | - | - | 86.50% | 93.87% |
| T | 46.2762 | 15.8483 | 24.7441 | 24.7765 | - | - | |
| I+T(ours) | 46.5545 | 16.1336 | 24.9548 | 24.9227 | 87.12% | 95.71% |
Table 5.
The ablation study of the structural information enhancement module on the dataset.
| Type | Task | Rouge1 | Rouge2 | RougeL | RougeLSum | Top-1 | Top-2 |
|---|---|---|---|---|---|---|---|
| W/o SEM | I | - | - | - | - | 84.66% | 93.87% |
| T | 45.8372 | 15.6966 | 24.5167 | 24.5102 | - | - | |
| I+T | 46.2108 | 15.8813 | 24.7682 | 24.8199 | 85.28% | 95.09% | |
| With SEM | I | - | - | - | - | 86.50% | 93.87% |
| T | 46.2762 | 15.8483 | 24.7441 | 24.7765 | - | - | |
| I+T(ours) | 46.5545 | 16.1336 | 24.9548 | 24.9227 | 87.12% | 95.71% |
Table 6.
The retrieval performance of text query image and image query text tasks.
| Task | Model | 10 | 30 | 50 | 80 | 100 |
|---|---|---|---|---|---|---|
| Text query Image | MLP [80] | 0.0181 | 0.0253 | 0.0282 | 0.0310 | 0.0324 |
| CNN [81] | 0.0179 | 0.0242 | 0.0276 | 0.0303 | 0.0316 | |
| Transformer [82] | 0.0162 | 0.0231 | 0.0263 | 0.0290 | 0.0304 | |
| RNN [83] | 0.0172 | 0.0246 | 0.0277 | 0.0304 | 0.0319 | |
| LSTM [84] | 0.0154 | 0.0214 | 0.0248 | 0.0278 | 0.0289 | |
| Proposed | 0.0216 | 0.0286 | 0.0315 | 0.0344 | 0.0356 | |
| Image query Text | MLP [80] | 0.0256 | 0.0311 | 0.0341 | 0.0378 | 0.0385 |
| CNN [81] | 0.0193 | 0.0242 | 0.0270 | 0.0299 | 0.0312 | |
| Transformer [82] | 0.0244 | 0.0312 | 0.0334 | 0.0369 | 0.0383 | |
| RNN [83] | 0.0153 | 0.0241 | 0.0283 | 0.0318 | 0.0332 | |
| LSTM [84] | 0.0170 | 0.0228 | 0.0256 | 0.0289 | 0.0302 | |
| Proposed | 0.0270 | 0.0344 | 0.0375 | 0.0409 | 0.0420 |
Disclaimer/Publisher’s Note: The statements, opinions and data contained in all publications are solely those of the individual author(s) and contributor(s) and not of MDPI and/or the editor(s). MDPI and/or the editor(s) disclaim responsibility for any injury to people or property resulting from any ideas, methods, instructions or products referred to in the content. |
© 2025 by the authors. Licensee MDPI, Basel, Switzerland. This article is an open access article distributed under the terms and conditions of the Creative Commons Attribution (CC BY) license (http://creativecommons.org/licenses/by/4.0/).
Copyright: This open access article is published under a Creative Commons CC BY 4.0 license, which permit the free download, distribution, and reuse, provided that the author and preprint are cited in any reuse.


