
Submitted:
28 March 2025
Posted:
28 March 2025
You are already at the latest version
Abstract
Background: Left ventricular hypertrophy (LVH) is an adaptive response to hypertension. The Cornell Product (CP) criteria, combining Cornell voltage and QRS duration in Electrocardiogram (ECG), is a widely used method for diagnosing LVH due to its sensitivity in detecting changes in the left ventricle’s electrical activity and structure. The CP criteria remain one of the most accessible and effective ECG-based methods for LVH detection in hypertensive populations. However, research on the diagnostic performance remains limited. Methods: This study aimed to evaluate the diagnostic accuracy of the CP criteria in hypertensive patients. A cross-sectional design was employed with normal group (41) and LVH group (74). Results: Age was the most significant predictor of left ventricular geometry (LVG) (adjusted p-value 0.000, OR 9.01, 95% CI 2.81-28.9). The correlation between LVH detection using ECG with CP criteria and echocardiography was not significant (p-value 0.513). At the standard threshold of ≥2440 mmms, the CP criteria showed a sensitivity of 16.22% and high specificity of 88%. After modifying the cutoff to ≥1240 mmms, sensitivity improved to 55.41% and specificity to 58%. Conclusion: while the CP criteria show high specificity, their sensitivity for detecting LVH remains suboptimal, though adjusting the cutoff enhances diagnostic performance.
Keywords:
Hypertension
; Cornell Product
; Left Ventricular Hypertrophy
; Left Ventricle Geometry
1. Introduction
Hypertensive heart disease is a medical burden characterized by the cardiac adaptation reaction to elevated blood pressure. Left ventricular hypertrophy is a distinctive feature that might anticipate occurrences of cardiovascular disease events; myocardial fibrosis is the prevailing consequence of hypertensive heart disease. Hypertension, also referred to as excessive blood pressure, is the leading cause of death worldwide, resulting in 10.4 million fatalities yearly [1].
Hypertension is generally recognized for its ability to produce difficulties in multiple target organs, including the brain (transient ischemic attack or stroke), heart (ischemia, infarction, or heart failure), kidneys, blood arteries, and eyes. During the initial phases of hypertension, the enlargement of the left ventricle of the heart, known as left ventricular hypertrophy (LVH), serves as a compensatory mechanism and an adaptive response to the aberrant pressure placed on the heart. Left ventricular hypertrophy is the initial stage in the progression of clinical conditions such as congestive heart failure, coronary heart disease, cardiac dysrhythmias, and stroke. Hemodynamic stress is a significant role in causing left ventricular hypertrophy, with increasing blood pressure being the primary trigger. Varying geometric changes may occur as the left ventricle adjusts to elevated blood pressure in the arteries. Therefore, it is crucial to identify hypertrophy patterns in individuals diagnosed with hypertension [2,3,4].
Left ventricular hypertrophy is directly linked to a higher likelihood of experiencing cardiovascular events. Hence, promptly detecting left ventricular hypertrophy (LVH) in patients is a crucial element of clinical cardiovascular risk reduction measures for individuals at risk, particularly those with hypertension [5]. A 12-lead surface electrocardiographic (ECG) examination is a readily accessible and cost-effective screening tool for early detection of LVH. Several approaches for assessing LVH using ECG have been established. Currently, one of the most often employed methods is the gender-adjusted Cornell criteria and the Cornell duration product. The Sokolow-Lyon index and Romhilt-Estes score are frequently employed, however both criteria are not influenced by gender. The validity of these methods' assessments has been typically confirmed through comparison with postmortem measurements of left ventricular mass (LVM) or with echocardiography-based LVM measurements. The variation in ECG results is then associated with the individual's physical characteristics, leading to the determination of LVH cut-off values based on the adjustment for body surface area (BSA) and height [5,6,7].
The Cornell Product was created by expanding upon the Cornell Voltage ECG criteria, resulting in a superior and more accurate method for detecting LVH. Casale et al. observed notable disparities between genders in the S wave in V3 leads, although age did not impact the identification of LVH using electrocardiography. This elucidates the reason why women do not possess a cranial capacity exceeding 1800 mm*ms, as opposed to men.[8] Irrespective of gender, the assessment of age, heart rate, and systolic blood pressure were individually linked to CP. Previous studies have established a correlation between ECG parameters and age, gender, and ethnicity. Specifically, males tend to have a larger QRS and deeper SV3, whereas increasing age is linked to a wider QRS and higher RaVL. Given the very small population of ethnic Malays and Indians compared to ethnic Chinese, it is unlikely to observe any significant ethnic disparities in CP. The impact of heart rate on cardiac performance is less certain, as indicated by recent research demonstrating a decrease in QRS length with elevated heart rate. The impact of heart rate on RaVL and SV3 is still uncertain [8,9,10].
Echocardiography utilises the relative wall thickness (RWT) to assess the left ventricle's (LV) geometry by examining the ratio of wall thickness to LV radius. This ratio was first associated with the severity of aortic stenosis. The combination of RWT and LVM enables the identification of left ventricular hypertrophy and the specific geometric pattern. Based on multiple research utilising these two metrics, concentric LVH is the most prevalent anomaly in geometry in arterial hypertension. However, it is important to note that hypertension-related LVH also includes a component of volume overload as per its definition. The prevailing interpretation for this evidence is that LV geometry is indicative of the effects of both volume and pressure overload. Arterial hypertension is a complex condition where both volume and pressure overload can be independently linked, and the volume load is significant in sustaining elevated blood pressure levels [11]. Left ventricular hypertrophy occurs when there is an increase in the size of the chamber or an increase in the thickness of the wall. Echocardiography or MRI can provide a more sensitive assessment of left ventricular mass and offer valuable additional insights. Approximately 25 years ago, researchers identified four distinct patterns of left ventricular geometry in hypertensive patients using echocardiography. These patterns are based on geometric remodelling and left ventricular hypertrophy. The four patterns are: normal LV geometry and mass, LV remodelling (characterised by increased relative wall thickness and normal left ventricular mass), eccentric LVH, and concentric LVH. The study demonstrated that long-term cardiovascular morbidity and all-cause mortality were linked to the shape and size of the left ventricle. Patients with normal left ventricular geometry had the lowest risk, while those with concentric LV remodelling, eccentric LVH, and concentric LVH had progressively higher risks [7,11,12]
Thus far, no study has examined the precision of ECG and LVH criteria in detecting cardiac burden, specifically the Cornell Product criteria in conjunction with echocardiography-based LV geometry change patterns, in individuals with uncomplicated hypertension. Uncomplicated hypertension, as defined by the World Health Organisation (WHO) Expert Committee and supported by JNC VII, refers to high blood pressure without any stage III organ damage. Therefore, the individual in question does not exhibit symptoms of heart failure, ischemic heart disease, chronic renal disease, or strokes [11,13,14]
2. Materials and Methods
Study design
This study utilises a cross-sectional design strategy to gather quantitative data. The study was an observational study conducted at the Integrated Cardiac Centre of Wahidin Sudirohusodo Hospital during the time of data collection, specifically when the patient underwent an echocardiographic test.
Setting
The research was conducted at Wahidin Sudirohusodo Hospital, the center of refferal hospital in Eastern Indonesia, located in South Sulawesi, Makassar City. The investigation lasted for a duration of 6 months, January - June 2023.
Samples
The study focused on patients who received echocardiographic exams at the Integrated Cardiac Centre of Wahidin Sudirohusodo Hospital. A sample size calculator was used to determine the target number of responders, which resulted in a total of 124 participants. The total number of responses was categorised into four groups: the normal group consisting of 41 respondents, the concentric remodelling group consisting of 9 respondents, the concentric LVH group consisting of 63 respondents, and the eccentric LVH group consisting of 11 respondents. We categorise the participants into different categories in order to examine the distribution of their frequencies. For the purpose of data analysis, we will focus solely on two groups: the normal group and the LVH group. The data gathering is conducted in a forward-looking manner. There were two categories of criteria for participants: individuals who had previously been diagnosed with high blood pressure but experienced a blood pressure increase of 140/90 mmHg on at least two visits to the polyclinic, and individuals who had been aware of their high blood pressure for a minimum of four weeks.
Additionally, participants who were taking medication for high blood pressure, regardless of whether their blood pressure was typically controlled or not, were also included. The exclusion criteria for this study are as follows: professional athletes, pregnant patients, patients with poor echo window, patients with poor ECG quality, patients with atrio-ventricular dyssynchrony (including total AV block and post permanent pacemaker implantation), patients with interventricular dyssynchrony (including right bundle branch block/RBBB and left bundle branch block/LBBB), patients with right ventricular hypertrophy (as determined by both ECG and echocardiography), patients with moderate/severe valve abnormalities, patients with congenital heart disease, patients with pulmonary arterial hypertension, and patients with complications from hypertension (specifically functional class III-IV heart failure, ischaemic heart disease, chronic kidney disease stage 4 and 5 with an eGFR < 30 mL/min per 1.73 m2), and stroke.
Instrument
The research in question employed an observation sheet as a means of collecting data during the investigation. The data results were inputted into a data management system and analysed using the SPSS version 29.0.1.0 software.
Ethical considerations
The study obtained approval from the ethics committee for human biomedical research at Hasanuddin University, situated in Makassar, with the reference number 319/UN4.6.4.5.31/PP36/2023.
3. Results
The data revealed that among the 124 respondents, the mean age ranged from 27 years (the youngest) to 80 years (the oldest). Out of the total number of subjects, 61 were male, accounting for 50.8% of the sample. The average BMI was 23.13 with a standard deviation of 3.07. Among the subjects, 65 (52.4%) belonged to the Bugis tribe, making it the most prevalent ethnicity. The second greatest representation was observed among the Makassar tribe, with 25 (20.2%) subjects. Out of the total number of respondents, 106 individuals (85.5%) had a documented history of hypertension. The characteristic results based on group division are presented in Table 1 below.
3.1. Characteristics of Respondents
3.2. Relationship Between Cornell Product Criteria and Left Ventricular Geometry Pattern
Table 2 displays the distribution of Cornell Product criteria according to the pattern of left ventricular shape. The CP score of greater than 2440 mm/s (LVH) was observed to be the predominant finding in the concentrated LVH group, accounting for 11 cases (61.1%). A statistical analysis was conducted to examine the correlation between CP score and geometric pattern, and the outcome was not statistically significant (p = 0.598).
The greatest predictor of left ventricular hypertrophy was age, with an adjusted p-value of 0.000, an odds ratio of 9.01, and a 95% confidence interval of 2.81-28.9, as demonstrated in Table 3. The other variables did not have a substantial impact.
Table 4 presents a statistically insignificant correlation between the assessment of LVH based on ECG using the CP criteria, LVH determined using echocardiography (p-value 0.513). The table indicates that the sensitivity value was 16.22%, the specificity was 88%, the positive predictive value was 66.67%, and the negative predictive value was 41.51%. Subsequently, a receiver operating characteristic (ROC) analysis was performed, yielding an area under the curve of 0.618. The cut-off value was determined to be 1240, with a p-value of less than 0.026 and a 95% confidence interval ranging from 0.516 to 0.720.
3.3. Sensivity Test
Table 4 presents a statistically insignificant correlation between LVH evaluation using CP score based on ECG and echocardiography LVH, with a p-value of 0.513. The table indicates that the sensitivity value was 16.22%, the specificity was 88%, the positive predictive value was 66.67%, and the negative predictive value was 41.51%. Subsequently, a receiver operating characteristic (ROC) analysis was performed, resulting in an area under the curve of 0.618. The cut-off value was determined to be 1240, with a p-value of less than 0.026 and a 95% confidence interval ranging from 0.516 to 0.720.
Figure 1.
Receiver operating characteristics (ROC) Curve.
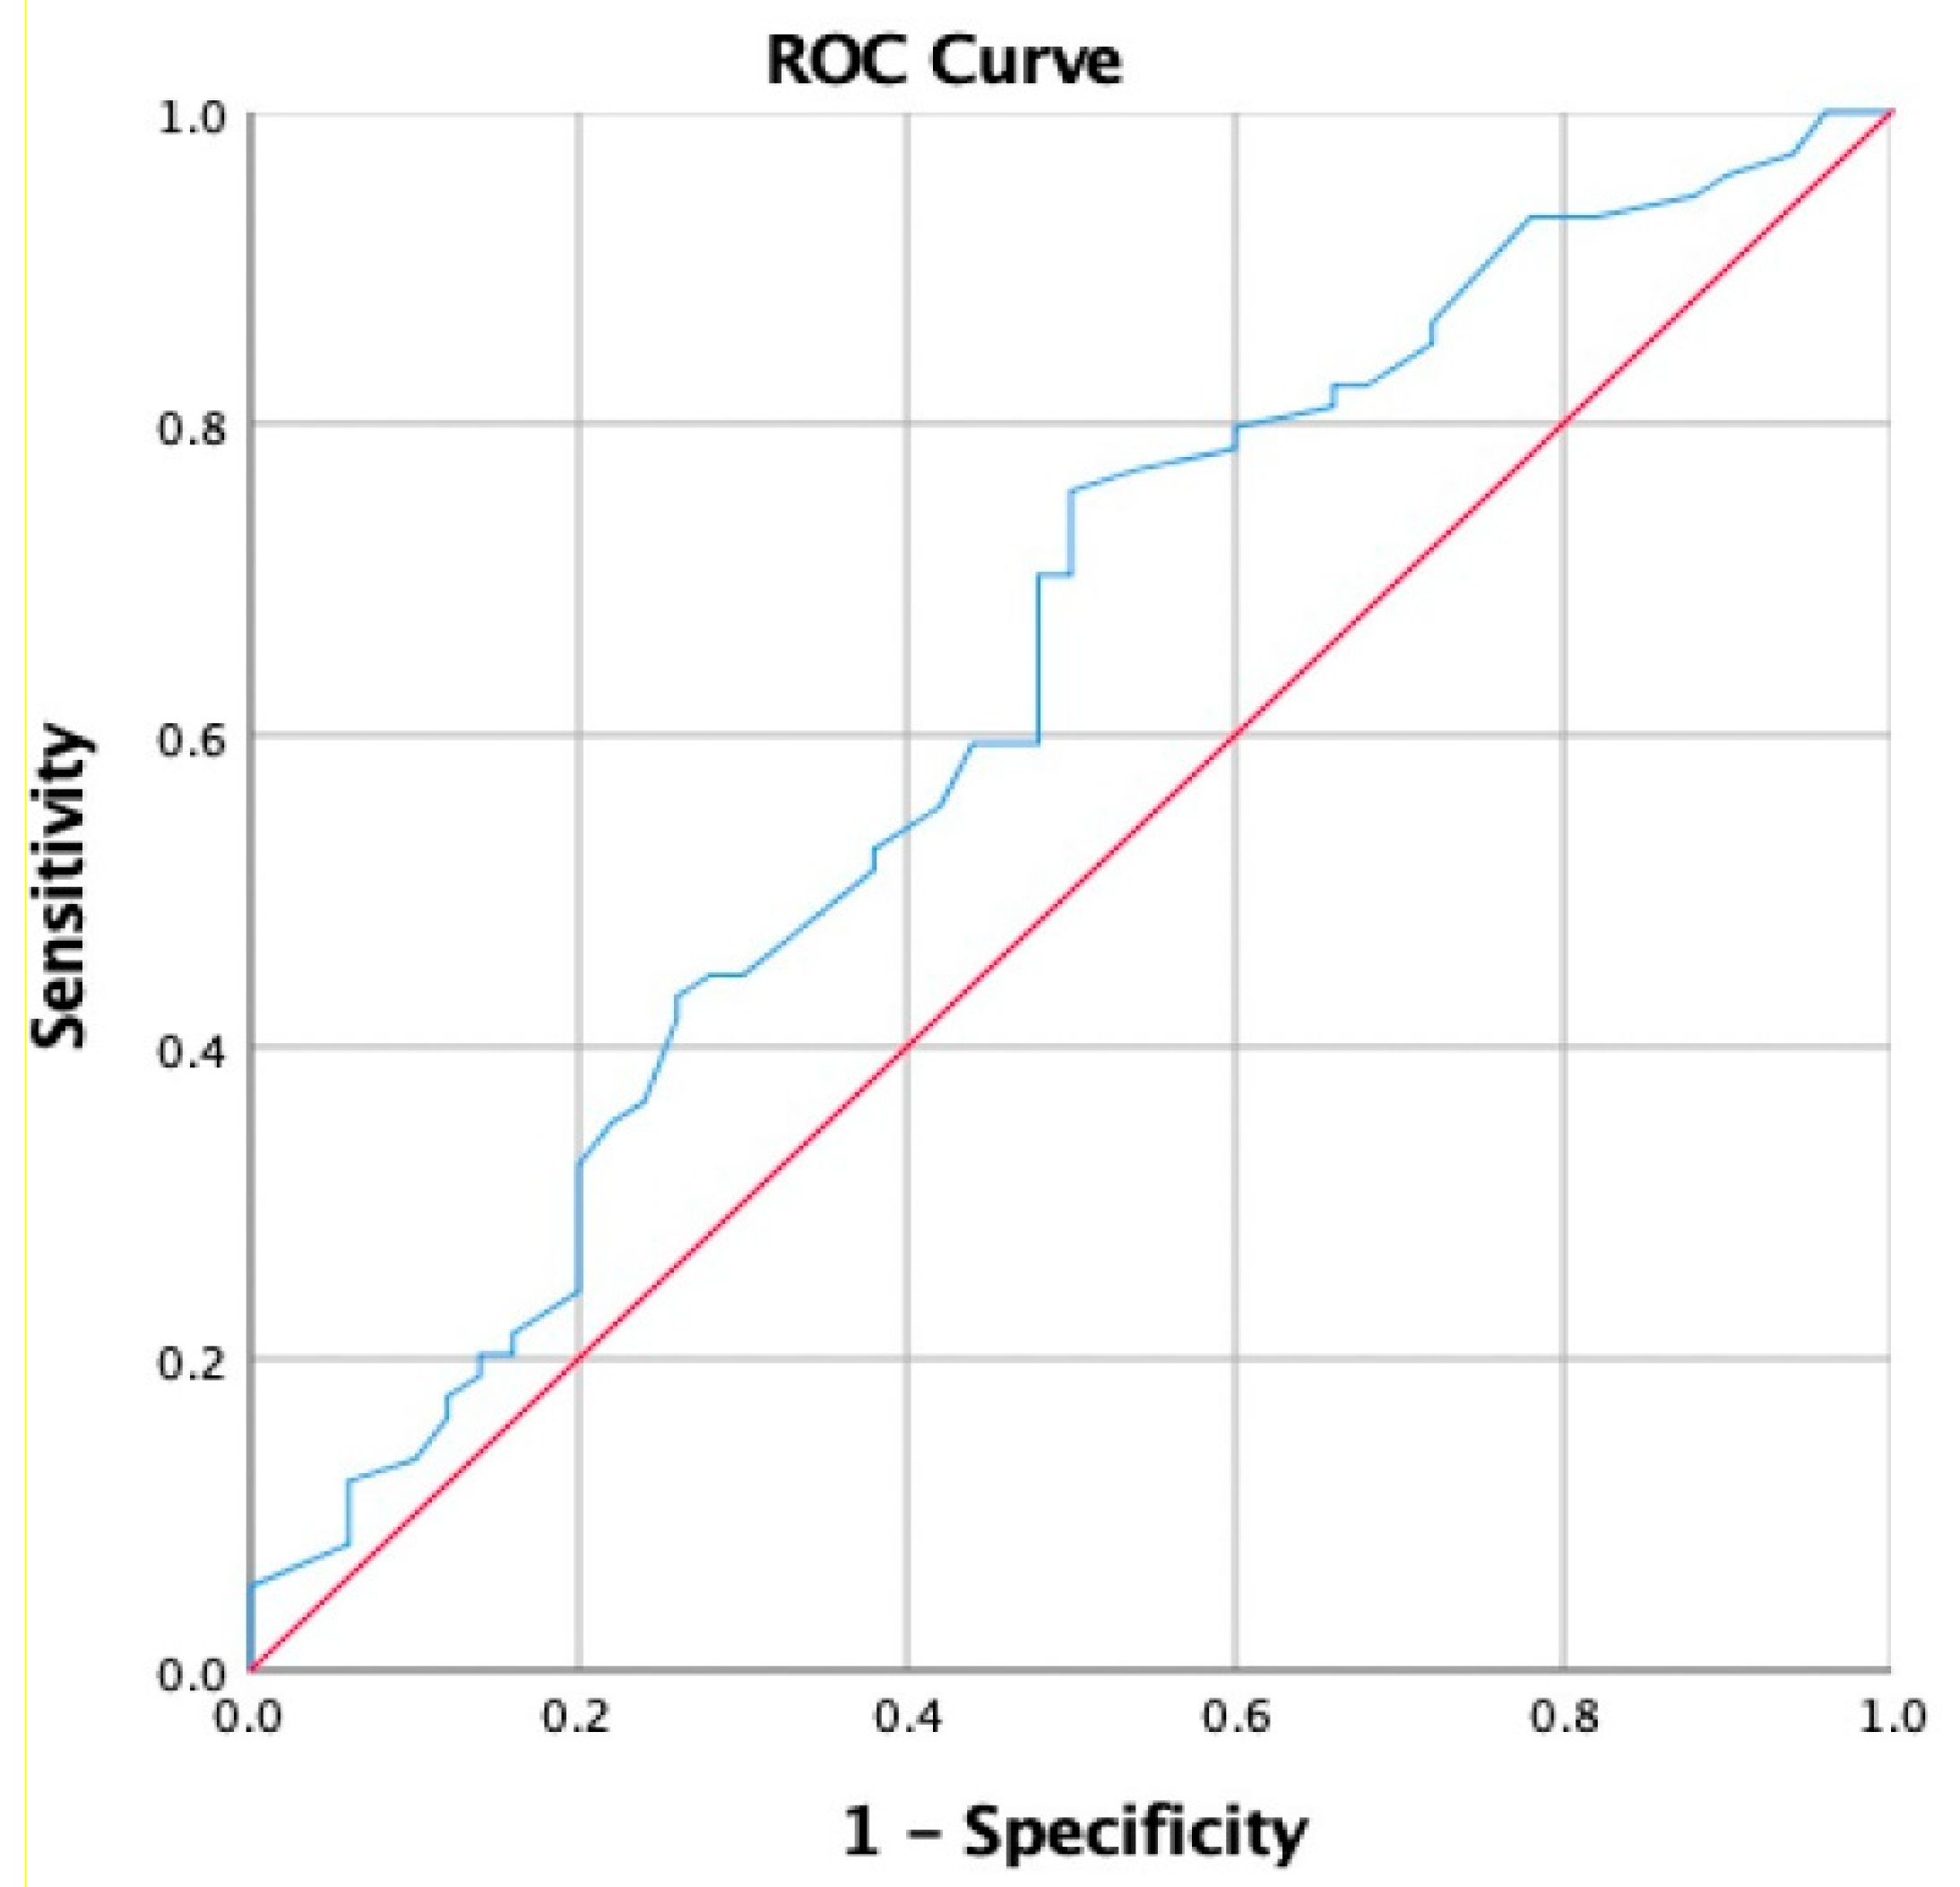

Table 5.
Receiver operating characteristics.
| AUC | P-value | 95%CI | Cut off | Sensitivity | Specifity | Youndens’s Indeks | |
| LVH | 0.618 | 0.026 | 0.516-0.720 | 1240 | 0.554 | 0.580 | 0.134 |
Adjusting the cutoff is a method to enhance sensitivity. The Cornell product cutoff, as determined by conventional criteria, is >2440 mm*ms. After analyzing the ROC data, we conducted a re-test with a cutoff value of >1240 mm*ms. The sensitivity and specificity rose to 55.41% and 58%, respectively.
The sensitivity value obtained from the table was 55.41%, while the specificity value was 58%. The positive predictive value (PPV) was determined to be 66.13%, and the negative predictive value (NPV) was found to be 46.7%.
4. Discussion
Hypertension is commonly associated health burden in elderly individuals. Hypertension causes to specific organs disorder, such as cardiac, resulting in an enlargement of the left ventricle [15] Prior research has demonstrated that an elevation in left ventricular mass is a distinct indicator of both the likelihood of death and the occurrence of burden related to cardiovascular disease. An efficient and cost-effective diagnostic method for LVH is electrocardiography [16,17]. The CP-LVH criteria, as established by Ishikawa et al. [18] are considered to be a set of electrocardiogram measures that are highly responsive to alterations in the morphology of the left ventricle. The CP-LVH ECG criteria are an expansion of the Cornell Voltage (CV) ECG criteria. Prior studies have demonstrated that there are notable disparities in S waves at V3 between males and females. Male individuals exhibit elongated QRS complexes and more pronounced S waves at V3, while elderly individuals often shows broader QRS complexes and elevated R waves at aVL. Prior research has demonstrated a correlation between CP and heart failure preserved ejection fraction (HFpEF), specifically, CP serving as an indicator of heart failure mortality and rehospitalization [19]. Therefore, both echo-LVH and ECG-LVH have the ability to independently predict mortality as well as cardiovascular risk variables. This demonstrates the capacity of echo-LVH and ECG-LVH to provide distinct prognostic information. Consequently, it is necessary to do both tests in order to thoroughly evaluate the correlation between heightened risk and these disorders [20].
In this study, the main features were an average age of 57.42 years (with a standard deviation of 13.35), and 61 participants who were male, accounting for 50.8% of the total individuals. The average BMI was 23.13 with a standard deviation of 3.07. Among the respondents in the ethnicity variable, 65 individuals (52.4%) belonged to the Bugis tribe, while the second highest number of subjects, 25 individuals (20.2%), belonged to the Makassar tribe (Table 1). A total of 106 individuals, accounting for 85.5% of the sample, had previously been diagnosed with hypertension. The average systolic and diastolic pressures recorded during data collection were 146.26 ± 17.16 and 84.48 ± 10.48, respectively. The left ventricular geometry pattern was analyzed to determine the causes influencing variations in this pattern. Age was determined to be a significant factor in 63 individuals (mean age: 60.82 ± 12.13) with concentric left ventricular hypertrophy (LVH) and 11 individuals (mean age: 64.27 ± 15.29) with eccentric LVH.
According to the literature, the impact of hypertension on the structure and function of the left ventricle is not influenced by age [21]. Additional data indicates that elderly people with hypertension have a prevalence of LVH that is 2-4 times greater than that of adults and young adults. In addition, both age and the extent of LVH are linked to a greater occurrence of alterations in the concentric geometric pattern of the left ventricle.22 Both the length of time a person has had hypertension and their systolic blood pressure showed statistical significance. The duration of hypertension was most common in the group with concentric left ventricular hypertrophy (LVH), with 46 individuals (64.8%) having a duration of 2-9 years. Subsequently, we examined the systolic blood pressure variables, which were determined to be statistically significant, especially in blood pressures ranging from 140 to 160 mmHg. Among the cases with concentric left ventricular hypertrophy, there were as many as 29 individuals, accounting for 50.9% of the total. The intensity, length, and onset of pressure elevation, age, comorbidities such as coronary heart disease (CHD), diabetes mellitus (DM), obesity, and heart valve disease, as well as genetic variables, are all factors that influence left ventricular (LV) geometry in hypertensive individuals. In addition, when comparing to normal LV geometry, concentric LVH raises the occurrence of coronary disease events by 1.61 times and the occurrence of congestive heart disease by 3.32 times [23].
This study shows the correlation between CP-ECG criteria with the LV geometrical patterns, found 18 subjects had >2440 mm*ms which the concentric LVH was the biggest group, 11 subjects (61,1) with the p value = 0.598. The result differents with the literature that shows CP-ECG criteria has a better sensitivity in LVH detection and correlated with the diastolic dysfunction. In other literature, the CP-ECG criteria had superiority compared to the Sokolow Lyon- ECG criteria when correlated to the LV mass utilized by echocardiography [24].
When the left ventricular mass increases, both the size and length of the vector-cardiographic QRS complex, as well as the QRS duration, also increase. The mechanism of the QRS complex prolongation in LVH has believed to be caused by several factors. These include the longer time it takes for the myocardium to activate due to the increased distance of the conduction tissue, the slower increase in action potential velocity in the hypertrophied myocardium, alterations in the activation sequence, and changes in the conductivity of the spaces within and outside of fibrotic tissue. The product, obtained by multiplying the QRS duration with Cornell voltage criteria, demonstrates a significant correlation between the length of the QRS signal and the presence of left ventricular hypertrophy (LVH). This can aid physicians in more precisely diagnosing left ventricular hypertrophy (LVH) in individuals with hypertension. Furthermore, there is a direct correlation observed between QRS prolongation and an increase in left ventricular mass [22].
During the evaluation of the criteria for ECG CP-LVH compared to echo-LVH, the sensitivity was found to be 16.22%, the specificity was 88%, the positive predictive value (PPV) was 66.7%, and the negative predictive value (NPV) was 41.51%. These findings are inconsistent with the literature mentioned above. However, the ROC curve demonstrated a strong diagnostic capability as it was positioned over the 50% threshold line, with a value of 61.8% (p = 0.026). Multiple studies have demonstrated that the CP-ECG criteria exhibit limited diagnostic accuracy in identifying LVH. Abhishek et al. conducted a study in India on the ECG-LVH criteria. They discovered that these criteria had a sensitivity of just 23.5% and a specificity of 98.4% in a population of individuals with high blood pressure. One method to enhance sensitivity is to adjust the cutoff, as indicated by the comparative analysis conducted by Eugene SJ et al. According to this, we adjusted the cutoff to a value greater than 1240 mm*ms. As a result, we saw an increase in sensitivity to 55.41% and a fall in specificity to 58%. The precise etiology remains uncertain. However, it is hypothesized that the interplay between body surface area (BSA) and ethnicity may contribute to its development [25,26].
Drezzner et al. shown that ethnicity had an impact on variations in left ventricular (LV) mass characteristics among patients with hypertension. Chahal et al. demonstrated the importance of including demographic characteristics in echocardiographic evaluations, particularly when assessing LV mass, longitudinal function, and LV filling pressure. This finding is supported by previous studies [26,27].
Pewsner et al. conducted a study and found that the electrocardiogram (ECG) is not an effective screening technique for ruling out left ventricular hypertrophy. The study's findings demonstrate that the CP-LVH ECG criteria have limited applicability as a screening tool for LVH, but are better suited for identifying patients with LVH [28]. According to the guidelines from the Joint National Committee on Prevention, Detection, Evaluation, and Treatment of High Blood Pressure (JNC 7), it is clinically beneficial for hypertension patients to undergo routine ECG tests instead of echocardiography [21,29]. One of the drawbacks of this investigation is the absence of data regarding the past occurrence of cerebrovascular illness in the study population. (2) The study did not provide any information or examination of the echocardiographic aspect of diastolic function; (3) it did not assess the hypertension medicine that is commonly consumed as part of normal treatment; and (4) it did not track any mortality events that occurred after the collection of data [30,31,32].
5. Conclusions
This study highlights the significant role of electrocardiography in diagnosing left ventricular hypertrophy (LVH) using the Cornell Product ECG criteria, particularly in hypertensive populations. While the traditional cutoff of >2440 mmms shows high specificity (88%), its sensitivity remains limited at just 16%. However, adjusting the cutoff to >1240 mmms significantly improved diagnostic sensitivity to 55.41%, making it a more effective tool in detecting LVH among hypertensive individuals in South Sulawesi. Despite this improvement, the sensitivity remains suboptimal, indicating that the Cornell Product ECG criteria are not ideal for diagnosing LVH in hypertensive patient. The relatively low sensitivity and moderate specificity suggest that while the test may still offer some value, it cannot be relied upon as a sole diagnostic tool. Further refinements to the cutoff values or the use of complementary diagnostic methods, such as echocardiography, would enhance diagnostic accuracy and help in better managing hypertension-related cardiac complications.
Supplementary Materials
The following supporting information can be downloaded at the website of this paper posted on Preprints.org. Table 1: Demographic Characteristics of Research Subjects. Table 2: Cornell Product Test Result. Table 3: Bivariat Test of LVH predictor. Table 4: Relationship between Cornell Product criteria and LV geometry pattern. Table 5: Receiver operating characteristics (ROC) Curve. Table 6: Cornell Product with Echocardiography of LVH with Sensitivity, Specificity, Positive Predictive Value (PPV) and Negative Predictive Value (NPV). Figure 1: Receiver Operating Characteristics (ROC) Curve.
Author Contributions
Conceptualization, M.Z., P.K., A.F.G. and A.U.A.; methodology, M.Z., N.M., and P.K.; formal analysis, N.M., M.Z.R., and M.Z.; investigation, N.M., M.Z., A.F.G., and A.U.A.; writing—original draft preparation, M.Z., and N.M.; writing—review and editing, M.Z., N.M., P.K., A.F.G. and A.U.A., and M.Z.R. All authors have read and agreed to the published version of the manuscript.
Funding
This research received no external funding
Institutional Review Board Statement
The study was conducted in accordance with the Declaration of Helsinki, and approved by the Institutional Review Board of Ethics Committee for human biomedical research at Hasanuddin University, situated in Makassar, with the reference number 319/UN4.6.4.5.31/PP36/2023.
Informed Consent Statement
Based on the decision of the ethics committee, no informed consent was required for data analysis in the absence of specific intervention.
Data Availability Statement
The raw data supporting the conclusions of this article will be made available by the authors on request.
Acknowledgments
The authors expresses sincere gratitude for the ongoing support from the Cardiology and Vascular Medicine Department, Hasanuddin University, Makassar, Indonesia and Wahidin Sudirohusodo General Hospital, Makassar, Indonesia.
Conflicts of Interest
The authors declare no conflicts of interest
References
- Unger T, Borghi C, Charchar F, et al,. 2020 International Society of Hypertension Global Hypertension Practice Guidelines. Hypertension. 2020;75(6):1334-1357. [CrossRef]
- Quinn AE, Ronksley PE, Bresee L, et al. Antihypertensive Prescribing for Uncomplicated, Incident Hypertension: Opportunities for Cost Savings. CJC Open.2021;3(6):703-713. [CrossRef]
- National High Blood Pressure Education Program. The Seventh Report of the JointNational Committee on Prevention, Detection, Evaluation, and Treatment of High Blood Pressure. US Dep Heal Hum Serv. Published online 2004.
- Muiesan ML, Salvetti M, Monteduro C, et al. Left Ventricular Concentric Geometry during Treatment Adversely Affects Cardiovascular Prognosis in Hypertensive Patients. Hypertension. 2004;43(4):731-738. [CrossRef]
- Katholi RE, Couri DM. Left ventricular hypertrophy: Major risk factor in patients with hypertension: Update and practical clinical applications. Int J Hypertens. 2011;2011. [CrossRef]
- Truong QA, Ptaszek LM, Charipar EM, et al. Performance of electrocardiographiccriteria for left ventricular hypertrophy as compared with cardiac computed tomography: From the Rule Out Myocardial Infarction Using Computer Assisted Tomography trial. J Hypertens. 2010;28(9):1959-1967. [CrossRef]
- Marwick TH, Gillebert TC, Aurigemma G, et al. Recommendations on the Use of Echocardiography in Adult Hypertension: A Report from the European Association ofCardiovascular Imaging (EACVI) and the American Society of Echocardiography (ASE). J Am Soc Echocardiogr. 2015;28(7):727-754. [CrossRef]
- Romhilt DW, Estes EH. A point-score system for the ECG diagnosis of left ventricular hypertrophy. Am Heart J. 1968;75(6):752-758. [CrossRef]
- Estes EH, Zhang ZM, Li Y, Tereschenko LG, Soliman EZ. The Romhilt-Estes left ventricular hypertrophy score and its components predict all-cause mortality in the general population. Am Heart J. 2015;170(1):104-109. [CrossRef]
- Gjesdal O, Bluemke DA, Lima JA. Cardiac remodeling at the population level- riskfactors, screening, and outcomes. Nat Rev Cardiol. 2011;8(12):673-685. [CrossRef]
- Cuspidi C, Sala C, Negri F, Mancia G, Morganti A. Prevalence of left-ventricular hypertrophy in hypertension: An updated review of echocardiographic studies. J HumHypertens. 2012;26(6):343-349. [CrossRef]
- Nalin B, Mbbs S. Normal reference range values in adult echocardiography : Further evidence that race matters. Indian Heart J. 2016;68(6):758-759. [CrossRef]
- Fagard RH, Pardaens K, Staessen JA, Thijs L. The pulse pressure-to-stroke index ratio predicts cardiovascular events and death in uncomplicated hypertension. J Am Coll Cardiol. 2001;38(1):227-231. [CrossRef]
- WHO. Arterial hypertension. Report of a WHO expert committee. World Heal Organ - TechRep Ser. 1978;(628):7-56.
- Sudikno S., et al,. Prevalence and Associated Factors for Prehypertension and Hypertension among Indonesian adolescents : a cross sectional community survey. BMJ Open. 2023;13:e065056. [CrossRef]
- Hina T.,et al,. Left Ventricular Hypertrophy: an ECG-Based Study of Prevalence and Risk Factors In a Multiethnic Population. Openheart. Cardiac Risk Factors and Prevention. 2023;10:e002495. [CrossRef]
- Hafiz N., et al,. Predicting Left Ventricular Hypertrophy From The 12-Lead Electrocardiogram In The UK Biobank Imaging Study Using Machine Learning. European Heart Journal. 2023; 4,316-324. [CrossRef]
- Ishikawa J., et al,. Cornell Product Left Ventricular Hypertrophy in Electrocardiogram and The Risk of Stroke In a General Population. Hypertension. 2009;53:28-34.
- Eugene., et al,.Cornell Product is An ECG Marker of Heart Failure With Preserved Ejection Fraction.Heart Asia.2019;11:e011108. [CrossRef]
- Johan S., et al,. Echocardiographic and Electrocardiographic Diagnoses of Left Ventricular Hypertrophy Predict Mortality Independently of Each Other in a Population of Elderly Men. Circulation American Heart Association.2001; 2346- 2351.
- Susan C., et al,. Age-Related Left Ventricular Remodelling and Associated Risk for Cardiovascular Outcomes. Circ Cardiovascular Imaging. 2009. [CrossRef]
- Cesare C., et al,. Age Related Prevalence of Severe Left Ventricular Hypertrophy in Essential Hypertension: Echocardiographic Findings From The ETODH Study. Blood Pressure. 2012;21:139-145. [CrossRef]
- Wilbert S,. Hypertension and Left Ventricular Hypertrophy. Ann Transl Med.2017;5(15):310. [CrossRef]
- Fang Ying S., et al,. A Comparison of Cornell and Sokolow-Lyon Electrocardiographic Criteria For Left Ventricular Hypertrophy In a Military Male Population In Taiwan: The Cardiorespiratory Fitness and Hospitalization Events in Armed Forces Study. Cardiovasc Diagn Ther.2017;7(3):244-251. [CrossRef]
- Abhishek G., Ramkumar V., Ashok K., et al,. Comparative Study of Echocardiography and Electrocardiography Criteria for Detecting Left Ventricular Hypertrophy in Hypertensive Patients. Int J Res Med Sci 2021. Nov;9(11):3364-3369.
- Drazner MH, Dries DL, Peshock RM, et al. Left ventricular hypertrophy is more prevalent in blacks than whites in the general population: The Dallas heart study. Hypertension. 2005;46(1):124-129.
- Chahal NS, Lim TK, Jain P, Chambers JC, Kooner JS, Senior R. Ethnicity- related differences in left ventricular function , structure and geometry : a population study of UK Indian Asian and European white subjects. Heart. 2010;96:466-472.
- Pewsner, D., Jüni, P., Egger, M., Battaglia, M., Sundström, J., & Bachmann, L. M. (2007). Accuracy of electrocardiography in diagnosis of left ventricular hypertrophy in arterial hypertension: systematic review. BMJ (Clinical research ed.), 335(7622), 711. [CrossRef]
- Barbieri A, Bursi F, Mantovani F, et al. Left ventricular hypertrophy reclassification and death: Application of the Recommendation of the American Society of Echocardiography/ European Association of Echocardiography. Eur Heart J Cardiovasc Imaging. 2012;13(1):109-117. [CrossRef]
- Miceli F, Presta V, Citoni B, et al. Conventional and new electrocardiographic criteria for hypertension-mediated cardiac organ damage: A narrative review. J ClinHypertens. 2019;21(12):1863-1871. [CrossRef]
- Kannel W, Cobb J. Left ventricular hypertrophy and mortality: result from the Framingham Study. Cardiology. 1992;81(4-5):291-298.
- Yildiz M, Oktay AA, Stewart MH, Milani R V., Ventura HO, Lavie CJ. Left ventricular hypertrophy and hypertension. Prog Cardiovasc Dis. 2020;63(1):10- 21. [CrossRef]
Table 1.
Demographic Characteristics of Research Subjects.
| Variables | Normal | Concentric Remodelling | Concentric LVH | Eccentric LVH |
| (n=41) | (n=9) | (n=63) | (n=11) | |
| Age | 50,46 + | 57,0 + 7,41 | 60, 82 + | 64,27 + |
| 13,04 | 12,13 | 15,29 | ||
|
Sex Women |
24 (38,1) |
5 (7,9) |
31 (49,2) |
3 (4,8) |
| Men | 17 (27,9) | 4 (6,6) | 32 (52,5) | 8 (13,1) |
|
Body mass index Underweight |
5 (71,4) |
0 (0,0) |
1 (14,3) |
1 (14,3) |
| Normal | 28 (30,1) | 6 (6,5) | 51 (54,8) | 8 (8,6) |
| Overweight | 5 (33,3) | 1 (6,7) | 7 (46,7) | 2 (13,3) |
| Obesse | 3 (33,3) | 2 (22,2) | 4 (44,4) | 0 (0,0) |
|
Ethnic Bugis |
22 (33,8) |
7 (10,8) |
28 (43,1) |
8 (12,3) |
| Makassar | 6 (24,0) | 2 (8,0) | 16 (64,0) | 1 (4,0) |
| Toraja | 5 (50,0) | 0 (0,0) | 4 (40,0) | 1 (10,0) |
| Mandar | 3 (50,0) | 0 (0,0) | 3 (50,0) | 0 (0,0) |
| Others | 5 (27,8) | 0 (0,0) | 12 (66,7) | 1 (5,6) |
|
Hypertension History No. |
9 (50,0) |
0 (0,0) |
9 (50,0) |
0 (0,0) |
| Yes | 32 (30,2) | 9 (8,5) | 54 (50,9) | 11 (10,4) |
|
Duration of hypertension < 2 |
24 (60,0) |
2 (5,0) |
13 (32,5) |
1 (2,5) |
| 2-9 | 13 (18,3) | 4 (5,6) | 46 (64,8) | 8 (11,3) |
| > 10 | 4 (30,8) | 3 (23,1) | 4 (30,8) | 2 (15,4) |
|
Systolic pressure SBP < 140 mmHg |
15 (34,9) |
5 (11,6) |
16 (37,2) |
7 (16,3) |
| SBP > 140 – 160 | 23 (40,4) | 2 (3,5) | 29 (50,9) | 3 (5,3) |
| mmHg | ||||
| SBP > 160 mmHg | 3 (12,5) | 2 (8,3) | 18 (75,0) | 1 (4,2) |
|
Diastolic pressure DBP < 90 mmHg |
31 (31,3) |
5 (5,1) |
52 (52,5) |
11 (11,1) |
| DBP > 90 – 100 | 6 (50,0) | 2 (16,7) | 4 (33,3) | 0 (0,0) |
Table 2.
Cornell Product Test Result.
| Variable | Normal | Concentric Remodelling | Concentric LVH | Eccentric LVH | p-value |
| (n=41) | (n=9) | (n=63) | (n=11) | ||
| CP score < 2440 | 37 (34,9) | 7 (6,6) | 52 (49,1) | 10 (9,4) | 0,598 |
| CP score > 2440 (22,2) | 4 | 2 (11,1) | 11 (61,1) | 1 (5,6) |
Table 3.
Bivariat Test.
| Variables | crude | adjusted | ||
| OR (95% CI) | p-value | OR (95% CI) | p-value | |
| Age | 9,01 (2,81-28,90) | 0,000 | 8,65 (2,62-28,53) | 0,000 |
| Men | 1,62 (0,78-3,82) | 0,188 | 1,24 (0,56-2,76) | 0,585 |
| Obesse | 0,51 (0,13-2,01) | 0,483 | 0,50 (0,11-2,30) | 0,374 |
| Hypertension History | 1,58 (0,58-4,32) | 0,365 | 1,37 (0,45-4,13) | 0,574 |
| Bugis Ethnic | 0,68 (0,33-1,41) | 0,306 | 0,65 (0,29-1,44) | 0,288 |
| Cornell Product | 1,41 (0,49-4,07) | 0,513 | 1,37 (0,43-4,40) | 0,592 |
Table 4.
Relationship between Cornell Product criteria and LV geometry pattern.
| Cornell Product | Echocardiography | Total | p-value | |
| LVH | Normal | |||
| LVHa | 12 | 6 | 18 | 0,513 |
| Normalb | 62 | 44 | 106 | |
| Total | 74 | 50 | 124 | |
aCornell Product score > 2400 / bCornell Product Score< 2400
Table 6.
Cornell Product with Echocardiography of LVH.
| Cornell Product | Echocardiography | Total | |
| LVH | Normal | ||
| LVHa | 41 | 21 | 62 |
| Normalb | 33 | 29 | 62 |
| Total | 74 | 50 | 124 |
aCornell Product score > 2400 / bCornell Product Score< 2400.
Disclaimer/Publisher’s Note: The statements, opinions and data contained in all publications are solely those of the individual author(s) and contributor(s) and not of MDPI and/or the editor(s). MDPI and/or the editor(s) disclaim responsibility for any injury to people or property resulting from any ideas, methods, instructions or products referred to in the content. |
© 2025 by the authors. Licensee MDPI, Basel, Switzerland. This article is an open access article distributed under the terms and conditions of the Creative Commons Attribution (CC BY) license (http://creativecommons.org/licenses/by/4.0/).
Copyright: This open access article is published under a Creative Commons CC BY 4.0 license, which permit the free download, distribution, and reuse, provided that the author and preprint are cited in any reuse.


