
Submitted:
27 March 2025
Posted:
28 March 2025
You are already at the latest version
Abstract
The objective of this study was to examine whether fine motor skills (FMS) and executive function (EF) are unique predictors of school readiness (SR). The sample was 108 pre-schoolers with externalizing behavior problems (EBP; Mean ± SD = 60.37 ± 3.94 months pre-intervention, 68% male) enrolled in a comprehensive 7-week school readiness summer program open trial. FMS were measured with the Learning Accomplishment Profile Diagnostic 3rd edition (LAP-D), EF was measured with the Head-Toes-Knees-Shoulders (HTKS), and SR was measured with the Bracken School Readiness Assessment 3rd edition (BSRA-3). All assessments were given pre- and post-intervention. All models controlled for participant age and SES. Examining data pre-intervention, FMS but not EF uniquely predicted SR, explaining 46% of the variance. At post-intervention, both FMS and EF predicted SR, explaining 33% of the variance. These findings underscore the importance of screening both FMS and EF in preschoolers with EBP as they prepare to transition to kindergarten as these domains both contribute to characterizing SR.
Keywords:
fine motor skills
; executive function
; school readiness
; externalizing behavior
; preschoolers
1. Introduction
Fine motor skills and executive function have been linked with school readiness skills during the preschool years (McClelland & Cameron, 2019). Although often studied and modeled separately in relation to school readiness, research suggests that fine motor skills and executive function, while correlated, independently contribute to early academic achievement (Malone et al., 2022). Yet, the role each domain plays in school readiness needs to be disentangled (Cameron et al., 2012). Preschoolers with externalizing behavior problems (EBP) who show a range of disruptive behaviors such as aggression, defiance, inattention and hyperactivity/impulsivity have been a population of interest in school readiness studies as they experience difficulties transitioning to kindergarten (Hart et al., 2019). While studies have reported that preschoolers with EBP have deficits in their fine motor skills (King-Dowling et al., 2015; Pagani & Messier, 2012; Peyre et al., 2019) as well as deficits in executive function (Schoemaker et al., 2013), the extent to which these skills contribute to school readiness in this population is unknown. This study addresses this knowledge gap by examining fine motor skills, executive function and school readiness in preschoolers with EBP.
1.1. School Readiness and Fine Motor Skills
School readiness refers to a child’s level of preparedness to enter formal education and it is measured by various skills (Mashburn & Pianta, 2006). Contemporary literature highlights that school readiness goes beyond traditional academic domains like numeracy and reading to include physical, behavioral, social-emotional and attentional competencies that together contribute to future academic achievement (Blair, 2002; Duncan et al., 2007; Pan et al., 2019). Among the various competencies contributing to school readiness, motor skills have recently received attention in the literature (e.g., Kamphorst et al., 2021). Motor skills are divided into two types: gross motor skills that involve the use of large muscles for movements such as crawling, sitting and walking, and fine motor skills which involve the use of smaller muscles of hands and wrists for movements such as manipulation, drawing, writing and grasping (Gonzalez et al., 2019).
Extensive research has demonstrated a link between fine motor skills and school readiness skills (for a review, see McClelland & Cameron, 2019). The link between fine motor skills and school readiness is evident as early as the preschool years. For instance, Ricciardi et al. (2021) showed that fine motor skills at 4 years of age predicted academic performance at kindergarten as well as in the 1st, 3rd and 5th grades. Moreover, a study with 4- to 5-year-old children found that fine motor skills were a concurrent predictor of school readiness (Jones et al., 2021). Likewise, Dinehart and Manfra (2013) studied two types of fine motor skills, manipulation and writing, as predictors of later academic performance. Results found that both manipulation and writing at 5 years were predictive of 2nd grade math and reading, although writing was the stronger predictor of the two. There is also an association between fine motor skills and school readiness during kindergarten. Grissmer et al. (2010) showed that fine motor skills measured at kindergarten entry strongly predicted reading and math skills in 5th grade.
1.2. School Readiness and Executive Function
Executive function is a higher order cognitive construct that integrates components such as cognitive flexibility, working memory and inhibitory control utilized in planning and performing goal-directed activities, problem solving and self-regulation (Blair, 2002; Zelazo, 2015). Executive function is essential for self-regulation, an important skill for school readiness which allows children to manage their emotions, sustain attention and engage effectively in preschool tasks (Blair & Raver, 2015; Cameron et al., 2012). In contrast to activities that require an automatic response, executive function involves active manipulation of information (Nayfeld et al., 2013). Preschool activities require attending to instructions and holding them in memory, manipulating information and inhibiting responses to distracting stimuli—all of which require components of executive function (Welsh et al., 2010). As a result executive function has been studied as a potential predictor of school readiness skills in the literature (Mann et al., 2017).
A large number of studies have reported that advances in preschoolers’ executive function are linked with children’s school readiness skills and later academic success (Bull et al., 2011; Shaul & Schwartz, 2014). For example, executive function in 3- to 4-year-old children was predictive of prekindergarten math, vocabulary and literacy abilities (McClelland et al., 2007). Moreover, Blair and Razza (2007) found that executive function in 3- to 5-year-old children predicted math and literacy ability in kindergarten. Not only has executive function been predictive of academic school readiness skills, but associations between executive function and non-academic school readiness skills have also been found. For example, advances in executive function in the preschool years were positively associated with social competence (Razza & Blair, 2009). Finally, preschoolers with better executive function at age 3 had fewer problem behaviors at age 4 (Hughes & Ensor, 2008).
1.3. School Readiness, Fine Motor Skills and Executive Function
The relation between fine motor skills and executive function to school readiness is complex; various investigators have been interested in whether these domains uniquely predict school readiness or alternatively whether they share variance in explaining school readiness outcomes (Cameron et al., 2012). In one study, executive function and fine motor skills in 3- to 5-year-old children uniquely and distinctively predicted school readiness skills at the beginning of the kindergarten year. Executive function was strongly associated with math and literacy outcomes while fine motor skills, especially copying shapes and designs, were strongly associated with letter-word identification and sound awareness (Cameron et al., 2012). Another study found that fine motor skills were significantly predictive of school readiness skills when executive function was also considered in 4- to 5-year-old children, suggesting fine motor skills play a more crucial role than executive function in school readiness. (Aydoner & Bumin, 2023). These studies suggest fine motor skills and executive function may uniquely predict school readiness outcomes.
However, in some studies fine motor skills and executive function shared variance in predicting school readiness. For instance, in a study that followed 3-year-old preschoolers to the first grade, fine motor skills and executive functions both contributed to the same profile of school readiness after a latent class analysis was done. (Kamphorst et al., 2021). In another longitudinal study the association between fine motor skills at age 5 and math and reading skills at age 6 was fully accounted for by executive function, negating fine motor skills and executive function as unique predictors of academic achievement (Malone et al., 2022). Together these studies argue that executive function and fine motor skills might alternatively share some variance in predicting school readiness outcomes.
Considering the mixed evidence from prior studies with some supporting unique contributions of executive function and fine motor skills and some supporting shared variance between them, further examination is needed to disentangle the complexities of these links. The present study aimed to build on this growing body of work by examining the extent to which fine motor skills and executive function predict school readiness in preschoolers with EBP.
1.4. Current Study
The current study assessed two different types of fine motor skills, manipulation and writing, as well as executive function alongside school readiness skills prior to and after a 7-week comprehensive summer program aimed at improving school readiness of preschoolers with EBP for the kindergarten transition (Hart et al., 2024). The summer school readiness program was an open trial for children living in urban poverty. All children received services as required by the local agency that supported the program. Therefore, there were no control groups in this study (i.e., children with EBP that did not receive the intervention; children without EBP). We tested fine motor skills and executive function as predictors of school readiness before and after the intervention.
We expected fine motor skills would be associated with school readiness such that preschoolers with EBP with more proficient fine motor skills in both domains would exhibit higher school readiness skills. Moreover, we expected that preschoolers with EBP who have more advanced executive function would show higher school readiness skills. We predicted that fine motor skills and executive function would uniquely predict school readiness skills in children with EBP. To test our hypotheses, we used regression analysis. We first examined three single-domain models with fine motor manipulation, fine motor writing or executive function as the predictor and school readiness as the outcome and then one model with fine motor skills and executive function together as predictors and school readiness as the outcome for comparison. All models were run separately for pre- and post-intervention data.
2. Materials and Methods
2.1. Participants
The participants in this study were 128 preschoolers enrolled in a 7-week summer school readiness program designed for rising kindergarteners with EBP (for details on the open trial, see Hart et al., 2024). The goal of the program was to improve school readiness by addressing behavioral, social-emotional, and academic skills through evidence-based practice. Data were collected at both baseline and post-intervention to examine how fine motor skills and executive functions relate to school readiness in this population. While fine motor skills were not an inclusion criterion for the program or the primary focus of the intervention, they were considered as a secondary focus of the intervention and were assessed as part of comprehensive program evaluations. The study was conducted in a large urban area in the southeastern United States. Participants came from historically marginalized, underserved, and low-income backgrounds. Recruitment was carried out through local preschools, mental health agencies, brochures, social media advertisements, e-newsletters, and school-based workshops. Families interested in the study were invited for a screening appointment.
To be eligible, children had to (1) transition to kindergarten in the upcoming school year; (2) exhibit behavioral, learning, attention, or social-emotional challenges as confirmed by a diagnosis of a behavioral or emotional disorder (e.g., Attention-Deficit/Hyperactivity Disorder, Oppositional Defiant Disorder) or qualification for special education services through an Individualized Education Program (IEP); (3) possess sufficient cognitive and language abilities to engage in the program; and (4) be able to attend the 7-week intervention as well as weekly parent training. Enrollment decisions were made based on clinical judgment, assessment scores, caregiver and teacher reports, and direct observations, rather than a single diagnostic criterion or score serving as the sole exclusion criterion.
Demographic data for children and parents are presented in Table 1 and Table 2, respectively. The sample was predominantly Black (92.59%) with approximately 87.98% of families living at or below the poverty line. Data were collected across three cohorts between 2017 and 2019 and then combined for the analysis (Figure 1). At pre-intervention, preschoolers were 52 to 70 months old (Mean ± SD = 60.37 ± 3.94 months, 68.52% male). At post-intervention, preschoolers were 58 to 71 months old (Mean ± SD = 64.83 ± 3.72 months, 68.52% male).
2.2. Measures
2.2.1. Learning Accomplishment Profile Diagnostic 3rd Edition (LAP-D)
The Learning Accomplishment Profile-Diagnostic (LAP-D) is a standardized, norm-referenced assessment designed for children aged 30 to 72 months. It evaluates four domains: fine motor, cognitive, language, and gross motor skills (Nehring & Nering, 1992). This study focused on the fine motor domain, which is divided into two subscales: fine motor manipulation (FM) and fine motor writing (FW). The FM subscale includes 28 items that assess children's manual dexterity through tasks involving object manipulation (e.g., building towers with blocks, turning book pages, and cutting with scissors). The FW subscale consists of 31 items measuring early writing skills through activities such as copying letters and drawing basic shapes. The LAP-D demonstrates strong psychometric properties, including high internal consistency (FM α = 0.91, FW α = 0.96), strong test-retest reliability (FM r = 0.91, FW r = 0.96), and robust construct and criterion validity (Hardin et al., 2005). In this study, raw LAP-D scores were used in the regression analyses.
2.2.2. Bracken School Readiness Assessment 3rd Edition (BSRA-3)
The Bracken School Readiness Assessment, Third Edition (BSRA-3) is a widely used measure of school readiness, comprising five subtests: colors, letters, numbers/counting, size/comparison, and shapes (Bracken, 2007). Crafted to assess concept acquisition and receptive language skills, it is appropriate for children between the ages of 2.5 and 7 years. The BSRA-3 demonstrates strong psychometric properties, with an overall internal consistency of 0.98 and reliability coefficients ranging from 0.96 to 0.99 across age groups (Panter & Bracken, 2009). Each subtest also exhibits high internal consistency, with reliability values ranging from 0.85 to 0.98 (Panter & Bracken, 2009). In terms of concurrent validity, the BSRA-3 has shown moderate to high correlations with the Peabody Picture Vocabulary Test-III (r = .69 to .79). Additionally, it has been validated as a strong predictor of children's academic success, showing its value in assessing kindergarten readiness (Panter & Bracken, 2009).
2.2.3. Head-Toes-Knees-Shoulders (HTKS)
Executive function was assessed using the Head-Toes-Knees-Shoulders (HTKS) task (Ponitz et al., 2009), a widely used measure of executive functioning in preschool-aged children. A meta-analysis has shown the positive association between performance on HTKS and children’s academic performance (Kenny et al., 2023). The HTKS requires children to perform behavioral responses in the opposite way of verbal instructions (e.g., when instructed to "touch your head," they must instead touch their toes). This task has been designed to assess behavioral self-regulation which involves components of executive function such as controlling attention, working memory and inhibitory control, all of which contribute to school readiness (Cameron et al., 2012). The HTKS has demonstrated strong psychometric properties (Ponitz et al., 2009; Wanless et al., 2011) and has been validated in preschoolers with externalizing behavior problems (Graziano et al., 2015). HTKS scores range from 0 to 60, with 2 points awarded for correct initial responses, 1 point for self-corrected responses, and 0 points for incorrect responses. Higher scores indicate stronger executive functioning abilities. If the child makes four consecutive error in one section the test is discontinued.
2.2.4. Behavior Assessment System for Children 3rd Edition (BASC-3)
The Behavior Assessment System for Children, Third Edition (BASC-3) is a norm-referenced questionnaire designed to evaluate children's behavioral and emotional functioning (Reynolds et al., 2015). In this study, the parent-report form for preschool-aged children, consisting of 139 items was administered. The BASC-3 includes nine clinical scales—Hyperactivity, Aggression, Anxiety, Depression, Somatization, Atypicality, Withdrawal, Attention Problems, and Developmental Social Disorders—as well as five adaptive scales—Adaptability, Social Skills, Functional Communication, Activities of Daily Living, and Leadership. Parents rate the frequency of behaviors observed over the past six months on a four-point scale (never, sometimes, often, almost always). The assessment takes approximately 10 to 20 minutes to complete. BASC-3 shows appropriate internal consistency (Cronbach’s Alpha= ranging from 0.75 to 0.90 in different scales) (Reynolds et al., 2015) and test-retest reliability with coefficients between 0.70 and 0.90 (Reynolds et al., 2015). The measure also shows strong validity. BASC-3 scores were converted to T-scores, with a mean of 50 and a standard deviation of 10, for analyses.
2.3. Procedure
The study protocol was approved by the Florida International University Institutional Review Board (IRB-19-0093). Families first completed an initial screening process, starting with a brief phone call where caregivers provided basic information about their child and completed BASC-3. Children were invited for an in-person visit if caregivers reported elevated scores (60 or above) on the Attention Problems, Hyperactivity, or Aggression subscales of the BASC-3, if the child had an Individualized Education Program (IEP) at school, or if caregivers expressed clinically significant concerns. Parents provided written informed consent for their child’s participation. The in-person assessment included two stages: an initial eligibility visit (Visit 1) and an enrollment visit (Visit 2) for those who met the eligibility criteria. The BASC-3 was completed by parents over the phone as part the pre-intervention assessment and again at the end of the intervention. Direct child assessments, including the BSRA-3 and the HTKS task, were conducted before and after the intervention. The LAP-D was administered during the first and last weeks of the program. Although there was no specific activity aimed at improving fine motor skills in the program, the curriculum included tasks that required fine motor manipulation and fine motor skills. For instance, children used manipulation skills in activities such as turning pages, inserting objects into and removing objects from one another, stabilizing a paper, removing lids and holding utensils. They also used writing skills for tracing, scribbling and circling while doing their science and math activities.
All assessments took place in an early childhood center in a local community where the summer school readiness program was held. Children were randomly signed out of their classrooms for the LAP-D assessment, which was administered individually in a quiet room by trained assessors. Children received a small toy after completing each LAP-D fine motor subscale. The order of tests was randomized, and all assessments were done between 9:30 AM and 2:30 PM.
2.4. Statistical Analysis
A paired sample t-test was used to examine the differences between fine motor skills, executive function, school readiness and externalizing behavior pre and post intervention. Linear regression analysis was used to predict school readiness outcomes from fine motor skills and executive function at both pre and post intervention timepoints. For each timepoint, we first examined separate models with FM or FW or HTKS as predictors and total BSRA-3 scores as the outcome and then one model with FM, FW and HTKS altogether as predictors and total BSRA-3 as the outcome. Models were tested separately for pre and post intervention data. This approach allowed us to tease apart the effects of fine motor and executive function skills on school readiness. LAP-D, HTKS and BSRA-3 raw scores were used in regression models. Parents’ income and education and participants’ age were controlled in all models. All statistical analysis were done in RStudio with an alpha level of .05. In each statistical test, individuals were excluded if they were missing data for one of the variables in the analysis using listwise deletion.
3. Results
Descriptive Statistics
Descriptive statistics for all the assessments in the study pre and post intervention can be seen in Table 3 and Table 4 respectively. A paired-samples t-test was performed to analyze the difference between participants’ externalizing behavior, fine motor skills, executive function and school readiness pre and post intervention. Results indicated that there was a significant reduction in externalizing symptoms post intervention, t(99) = 6.55, p < .001, d = 0.64, CI= 6.03, 11.28. Fine motor manipulation skills improved significantly post intervention, t(100) = 4.82, p < .001, d = 0.36, CI= 0.65, 1.56), and a similar effect was seen for fine motor writing scores, t(98) = 5.91, p < .001, d = 0.35, CI= 1.28, 2.58). Executive function also improved significantly post intervention, t(64) = 4.81, p < .001, d = 0.62, CI= 5.65, 13.67). Lastly, school readiness skills improved from pre to post intervention, t(105) = 17.24, p < .001, d = 0.81, CI= 12.49, 15.74).
Table 5 shows the estimates of the four pre-intervention regression model coefficients along with their corresponding standard errors, 95% confidence intervals, and p-values. In the model with HTKS scores as the predictor and total BSRA-3 score as the outcome, there was a significant effect of HTKS scores on BSRA-3 scores = 0.12, F(4, 62) = 2.30, p < 0.01). For every one-unit increase in HTKS scores, there was an associated increase of 0.41 units in BSRA-3 scores. Parent education, income, and participant age were not significant predictors. Overall, this model explained 12% of the variance in total school readiness. Likewise, in the model with FM scores as the predictor and total BSRA-3 score as the outcome, there was a significant effect of FM scores on BSRA-3 scores = 0.21, F(4, 95) = 6.34, p < 0.001). For every one-unit increase in FM scores, there was an associated increase of 2.39 units in BSRA-3 scores. Parent education, income, and participant age were not significant predictors. Overall, this model explained 21% of the variance in total school readiness. Similarly, in the model with FW scores as the predictor and total BSRA-3 score as the outcome, there was a significant effect of FW scores on BSRA-3 scores = 0.40, F(4, 25) = 16.28, p < 0.001). For every one-unit increase in FW scores, there was an associated increase of 2.00 units in BSRA-3 scores. Parent education, income, and participant age were not significant predictors. Overall, this model explained 40% of the variance in total school readiness.
In the model with FM, FW and HTKS as the predictors and total BSRA-3 score as the outcome, there was a significant effect of only FW scores on BSRA-3 scores = 0.46, F(6, 59) = 8.25, p < 0.001). For every one-unit increase in FW scores, there was a corresponding increase of 1.77 units in BSRA-3 scores. FM scores, HTKS scores, parent education, and participant age were not significant predictors however parents’ income was. For every one-unit increase in income, there was an associated decrease of 1.67 in BSRA-3 scores. Overall, this model with manipulation and writing as predictors explained 46% of the variance in total school readiness (Figure 2).
Table 6 shows the estimates of the four post-intervention regression model coefficients along with their corresponding standard errors, 95% confidence intervals, and p-values. In the model with HTKS scores as the predictor and total BSRA-3 score as the outcome, there was a significant effect of HTKS scores on BSRA-3 scores = 0.25, F(4, 78) = 6.38, p < 0.001). For every one-unit increase in HTKS scores, there was an associated increase of 0.35 units in BSRA-3 scores. Parent education, income, and participant age were not significant predictors. Overall, this model explained 25% of the variance in total school readiness. Likewise, in the model with FM scores as the predictor and total BSRA-3 score as the outcome, there was a significant effect of FM scores on BSRA-3 scores = 0.19, F(4, 91) = 6.04, p < 0.001). For every one-unit increase in FM scores, there was an associated increase of 2.10 units in BSRA-3 scores. Parent education, income, and participant age were not significant predictors. Overall, this model explained 21% of the variance in total school readiness. Similarly, in the model with FW scores as the predictor and total BSRA-3 score as the outcome, there was a significant effect of FW scores on BSRA-3 scores = 0.30, F(4, 90) = 9.68, p < 0.001). For every one-unit increase in FW scores, there was an associated increase of 1.39 units in BSRA-3 scores. Parent education, income, and participant age were not significant predictors. Overall, this model explained 30% of the variance in total school readiness.
In the model with FM, FW and HTKS as the predictors and total BSRA-3 score as the outcome, there was a significant effect of FM scores and HTKS scores on BSRA-3 scores = 0.29, F(6, 70) = 5.71, p < 0.05). For every one-unit increase in HTKS scores, there was an associated increase of 0.19 units in BSRA-3 scores. For every one-unit increase in FW scores, there was an associated increase of 0.99 units in BSRA-3 scores. FM scores, parent education and income, and participant age were not significant predictors. Overall, this model explained 33% of the variance in total school readiness (Figure 3).
4. Discussion
The goal of the current study was to examine whether fine motor skills and executive function uniquely predict school readiness in preschoolers with EBP. Our results indicated that after attending the summer intervention, fine motor skills, executive function and school readiness skills improved in this sample. In the models with fine motor skills and executive function as separate predictors, both domains significantly predicted school readiness outcomes. However, when predictors were examined together, fine motor skills emerged as a unique predictor pre-intervention and both fine motor skills and executive function emerged as significant predictors post-intervention. Statistically, these findings mean that prior to intervention, executive function did not predict something unique and different from fine motor skills and the other predictors in the combined model. After intervention, fine motor writing but not manipulation and executive function were unique predictors for school readiness. We consider the results from the single predictor models first before turning to explaining the combined predictor models.
Results from the single predictor models confirmed the predicted link between fine motor skills and school readiness in children with EBP. This pattern was in harmony with findings in the literature on children without EBP (Grissmer et al., 2010; Pagani & Messier, 2012; Ricciardi et al., 2021). Preschool tasks involve both cognitive and motor demands (Cameron et al., 2012). Preschoolers’ ability to develop automaticity in motor-related tasks such as manipulation and writing may influence the amount of cognitive capacity they can allocate to other learning objectives. On the contrary, children who struggle with the motor demands of preschool tasks such as holding a pencil, will have less cognitive capacity to process other aspects of the task (Cameron et al., 2016; Medwell, 2007). Findings from the single predictor models using executive function also found predictive links to school readiness in children with EBP, which is in line with prior studies on preschoolers without EBP and with our predictions (Blair & Razza, 2007; McClelland et al., 2007; Shaul & Schwartz, 2014). Preschool tasks require problem solving, recalling, maintaining and manipulating information in novel ways, following instructions and sustaining attention (Cameron et al., 2012). Examined in this way, both domains were predictors for school readiness in children with EBP. However, we also observed small to medium correlations between fine motor skills and executive function, prompting us to examine all predictors in combined models to determine which, if any, were unique predictors for school readiness pre- and post-intervention.
In the models where all predictors were considered, fine motor skills were the unique predictor of school readiness skills children with EBP pre-intervention and both executive function and fine motor skills were predictors of school readiness skills in children with EBP post-intervention. This change in predictors may be explained by considering that the primary goal of the intervention was to address the behavioral skills in participants, which may more closely align with executive function rather than fine motor skills. It is possible that executive function skills may moderate the impact of the intervention, though this hypothesis needs further investigation as it was not the goal of the current study. Alternatively, greater fine motor skills may compensate for poorer executive function or vice versa. In a study by Cameron et al. (2015), visual motor integration, inhibitory control and academic knowledge was tested at the beginning and the end of the preschool year in a sample of 467 children. Multilevel regression models found that children with advanced visuomotor integration, but low inhibitory control performed similarly to those with high inhibitory control but poor visuomotor integration, and vice versa at both timepoints. Moreover, a longitudinal study on children with motor delays found that those with more advanced fine motor skills at 10 to 14 months and later at 20 to 25 months exhibited higher executive function at 36 months (Cunha et al., 2024). These findings suggest that there may be more complex relations between fine motor skills, executive function, and school readiness. A dynamic link between these variables creating a compensatory mechanism may explain the shift in predictors from pre to post intervention in our dataset for children with EBP. However, a larger sample size is required to test this potential mechanism in future work. Similarly, EF skills may have moderated the impact of the intervention, though this needs future investigation.
We observed the variance explained for school readiness dropped in our models from pre to post intervention. This difference may be due to the comprehensiveness of the program and the overall goal of improving school readiness. Indeed, children showed significant improvements in all three areas: fine motor skills (manipulation and writing), executive function, and school readiness. It is likely there was greater variability in scores pre-intervention relative to post. A reduction in individual differences may have decreased the predictive power of the post-intervention model. Alternatively, we cannot rule out the contribution of potential predictors that we did not examine in this study such as quality of parent-child interactions and language skills (Linder et al., 2013; Prior et al., 2011).
Limitations and Future Directions
While this study provided valuable insights on fine motor skills and executive function as predictors of school readiness in preschoolers with EBP, the generalizability of its findings may be limited. The local agency that supported the intervention required that all children receive services, therefore there was no control group of children with EBP followed longitudinally that did not participate in the school readiness intervention. Moreover, the sample was predominantly black and low-income, which is not representative of all children with EBP. We want to stress that these limitations for generalizability are also the unique aspects of the study in its diverse sample, which broadens behavioral science (Henrich et al., 2010).
In addition to the sample, there were also limitations with the measurements used in the study. To perform HTKS items, some proficiency in motor skills was required. The reliance on motor skills for the HTKS could also explain why HTKS scores in this study were clustered towards the bottom. To minimize the confounding effect of motor skills on the HTKS, a revised version called the HTKS-R has been developed (McClelland et al., 2021). The revised version includes items that ask children to respond verbally to prompts., e.g., “When I say toes, you say head” with the purpose of reducing the motor demands of the task. This version was not available for the cohorts reported here (2017-2019). We have started utilizing the HTKS-R in data collection, but we do not yet have sufficient data for analyses. For performing LAP-D items, preschoolers needed to follow instructions, which requires executive function. To mitigate executive function demands, we administered the manipulation items separately from the writing items with a break in between, and sometimes on different days depending on the child.
To advance research on the link between fine motor skills and executive function, application of more precise methodologies may be required. Cassidy and Willoughby (2024) proposed researchers should go beyond correlational studies and separate behavioral assessments of fine motor skills and executive function. They argue researchers should use corticomuscular coherence (CMC) instead. CMC measures the functional connectivity between motor cortex and muscles during the motor tasks using EEG and EMG. CMC provides a more integrated picture of motor-executive function interactions by capturing brain-muscle synchronization. Since complex motor tasks involve executive function components like attention, planning, and inhibition, CMC can serve as a biomarker of typical motor development and track developmental changes more effectively than behavioral measures alone (McClelland et al., 2020). Additionally, CMC can be used to assess the effectiveness of motor interventions, revealing whether improvements in motor control and motor-cognition integration also enhance executive function development.
5. Conclusions
Identifying fine motor skills and executive function as unique predictors of school readiness in preschoolers with EBP carries important clinical and educational implications. Our findings demonstrate that fine motor skills account for a substantial portion of school readiness, while executive function also emerges as a key contributor to school readiness. These findings contribute to the existing literature by supporting the unique role of fine motor skills and executive function in predicting school readiness in children with EBP. Our findings also highlight the importance of screening both fine motor skills and executive function as markers of school readiness skills in EBP.
Author Contributions
Conceptualization, A.K. (lead) and E.L.N (supporting); Data curation, A.K.; Formal analysis, A.K., Investigation, B.P.; Project Administration, K.C.H. and E.L.N.; Supervision, K.C.H. (lead) and B.P. (supporting); Writing – original draft, A.K. (lead) and E.L.N. (supporting); Writing – review & editing, A.K., B.P., K.C.H., and E.L.N. All authors have read and agreed to the published version of the manuscript.
Funding
A.K. was supported during the project by a Florida International University Presidential Fellowship. The summer program in which the children were enrolling was funded entirely by The Children’s Trust of Miami-Dade County.
Institutional Review Board Statement
The study protocol was approved by the Florida International University Institutional Review Board (IRB-19-0093).
Informed Consent Statement
. Parents provided written informed consent for their child’s participation.
Data Availability Statement
The data for this study can be found in the following link: X.
Acknowledgments
The authors would like to thank the children and families who participated in the program, the staff and students who worked tirelessly to make it all happen, and our incredible school partners. Many thanks to the amazing research assistants in the School R.E.A.D.Y lab and HANDS Lab for their dedication to data collection, especially Kaityn Contino, Sandy Gonzalez, Megan Taylor, and Samantha Croney for their early contributions to the project.
Conflicts of Interest
The authors declare no conflict of interest.
Abbreviations
The following abbreviations are used in this manuscript:
| EBP | Externalizing Behavior Problems |
| HTKS | Heads-Toes-Knees-Shoulders |
| LAP-D | Learning Accomplishment Profile-Diagnostic |
| BASC-3 | Behavior Assessment System for Children 3rd |
| BSRA-3 | Bracken School Readiness Assessment 3rd Edition |
References
- Aydoner, S., & Bumin, G. (2023). The factors associated with school readiness: Sensory processing, motor, and visual perceptual skills, and executive functions in kindergarten children. Applied Neuropsychology: Child, 1-9.
- Blair, C. (2002). School readiness: Integrating cognition and emotion in a neurobiological conceptualization of children's functioning at school entry. American psychologist, 57(2), 111. [CrossRef]
- Blair, C., & Raver, C. C. (2015). School readiness and self-regulation: A developmental psychobiological approach. Annual review of psychology, 66(1), 711-731.
- Blair, C., & Razza, R. P. (2007). Relating effortful control, executive function, and false belief understanding to emerging math and literacy ability in kindergarten. CHILD DEVELOPMENT, 78(2), 647-663.
- Bracken, B. A. (2007). Bracken school readiness assessment. Psychological Corporation.
- Bull, R., Espy, K. A., Wiebe, S. A., Sheffield, T. D., & Nelson, J. M. (2011). Using confirmatory factor analysis to understand executive control in preschool children: Sources of variation in emergent mathematic achievement. DEVELOPMENTAL SCIENCE, 14(4), 679-692.
- Cameron, Brock, L. L., Murrah, W. M., Bell, L. H., Worzalla, S. L., Grissmer, D., & Morrison, F. J. (2012). Fine motor skills and executive function both contribute to kindergarten achievement. CHILD DEVELOPMENT, 83(4), 1229-1244.
- Cameron, C. E., Brock, L. L., Hatfield, B. E., Cottone, E. A., Rubinstein, E., LoCasale-Crouch, J., & Grissmer, D. W. (2015). Visuomotor integration and inhibitory control compensate for each other in school readiness. DEVELOPMENTAL PSYCHOLOGY, 51(11), 1529.
- Cameron, C. E., Cottone, E. A., Murrah, W. M., & Grissmer, D. W. (2016). How are motor skills linked to children's school performance and academic achievement? Child Development Perspectives, 10(2), 93-98. [CrossRef]
- Cassidy, J. M., & Willoughby, M. T. (2024). Toward a mechanistic understanding of the association between motor and executive function skill development in early childhood. Child Development Perspectives.
- Cunha, A. B., Babik, I., Harbourne, R. T., Dusing, S. C., Hsu, L.-Y., Koziol, N. A., Westcott-McCoy, S., Willett, S. L., Bovaird, J. A., & Lobo, M. A. (2024). Evaluation of Potential Developmental Precursors to Executive Function in Young Children with Motor Delays: Exploratory Study. Behavioral Sciences, 14(12), 1201.
- Dinehart, L., & Manfra, L. (2013). Associations between low-income children's fine motor skills in preschool and academic performance in second grade. Early Education & Development, 24(2), 138-161. [CrossRef]
- Duncan, G. J., Dowsett, C. J., Claessens, A., Magnuson, K., Huston, A. C., Klebanov, P., Pagani, L. S., Feinstein, L., Engel, M., Brooks-Gunn, J., Sexton, H., Duckworth, K., & Japel, C. (2007). School readiness and later achievement. Dev Psychol, 43(6), 1428-1446. [CrossRef]
- Gonzalez, S. L., Alvarez, V., & Nelson, E. L. (2019). Do Gross and Fine Motor Skills Differentially Contribute to Language Outcomes? A Systematic Review. Front Psychol, 10, 2670. [CrossRef]
- Graziano, P. A., Garb, L. R., Ros, R., Hart, K., & Garcia, A. (2015). Executive Functioning and School Readiness Among Preschoolers With Externalizing Problems: The Moderating Role of the Student–Teacher Relationship. Early Education and Development, 27(5), 573-589. [CrossRef]
- Grissmer, D., Grimm, K. J., Aiyer, S. M., Murrah, W. M., & Steele, J. S. (2010). Fine motor skills and early comprehension of the world: two new school readiness indicators. Dev Psychol, 46(5), 1008-1017. [CrossRef]
- Hardin, B., Peisner-Feinberg, E., & Weeks, S. (2005). The Learning Accomplishment Profile–Diagnostic (LAP-D): Examiner’s manual & technical report. Lewisville, NC: Kaplan Early Learning.
- Hart, K. C., Maharaj, A. V., & Graziano, P. A. (2019). Does dose of early intervention matter for preschoolers with externalizing behavior problems? A pilot randomized trial comparing intensive summer programming to school consultation. J Sch Psychol, 72, 112-133. [CrossRef]
- Hart, K. C., Poznanski, B., Cheatham-Johnson, R., Gregg, D., Zambrana, K., Gutierrez Renzulli, A., Flores, H., Sotolongo, L., Chou, T., & Moses, J. (2024). Utilizing the Summer Treatment Program Model to Promote School Readiness in Young Children Living in Urban Poverty: An Initial Effectiveness Open Trial. Evidence-Based Practice in Child and Adolescent Mental Health, 1-16.
- Henrich, J., Heine, S. J., & Norenzayan, A. (2010). Beyond WEIRD: Towards a broad-based behavioral science. Behavioral and Brain Sciences, 33(2-3), 111. [CrossRef]
- Hughes, C., & Ensor, R. (2008). Does executive function matter for preschoolers’ problem behaviors? Journal of Abnormal Child Psychology, 36, 1-14.
- Jones, D., Innerd, A., Giles, E. L., & Azevedo, L. B. (2021). The association between physical activity, motor skills and school readiness in 4–5-year-old children in the northeast of England. International journal of environmental research and public health, 18(22), 11931. [CrossRef]
- Kamphorst, E., Cantell, M., Van Der Veer, G., Minnaert, A., & Houwen, S. (2021). Emerging School Readiness Profiles: Motor Skills Matter for Cognitive- and Non-cognitive First Grade School Outcomes. Front Psychol, 12, 759480. [CrossRef]
- Kenny, S. A., Cameron, C. E., Karing, J. T., Ahmadi, A., Braithwaite, P. N., & McClelland, M. M. (2023). A meta-analysis of the validity of the Head-Toes-Knees-Shoulders task in predicting young children's academic performance. Frontiers in Psychology, 14, 1124235.
- King-Dowling, S., Missiuna, C., Rodriguez, M. C., Greenway, M., & Cairney, J. (2015). Co-occurring motor, language and emotional–behavioral problems in children 3–6 years of age. Human movement science, 39, 101-108. [CrossRef]
- Linder, S. M., Ramey, M. D., & Zambak, S. (2013). Predictors of school readiness in literacy and mathematics: a selective review of the literature. Early childhood research & practice, 15(1), n1.
- Malone, S. A., Pritchard, V. E., & Hulme, C. (2022). Domain-specific skills, but not fine-motor or executive function, predict later arithmetic and reading in children. Learning and Individual Differences, 95, 102141.
- Mann, T. D., Hund, A. M., Hesson-McInnis, M. S., & Roman, Z. J. (2017). Pathways to school readiness: Executive functioning predicts academic and social–emotional aspects of school readiness. Mind, Brain, and Education, 11(1), 21-31.
- Mashburn, A. J., & Pianta, R. C. (2006). Social relationships and school readiness. Early Education and Development, 17(1), 151-176. [CrossRef]
- McClelland, M. M., & Cameron, C. E. (2019). Developing together: The role of executive function and motor skills in children’s early academic lives. Early Childhood Research Quarterly, 46, 142-151. [CrossRef]
- McClelland, M. M., Cameron, C. E., Connor, C. M., Farris, C. L., Jewkes, A. M., & Morrison, F. J. (2007). Links between behavioral regulation and preschoolers' literacy, vocabulary, and math skills. DEVELOPMENTAL PSYCHOLOGY, 43(4), 947.
- Medwell, J. (2007). Strand S، Wray D. The role of handwriting in composing for Y2 children. Journal of Reading، Writing and Literacy, 2(1), 11-21.
- Nayfeld, I., Fuccillo, J., & Greenfield, D. B. (2013). Executive functions in early learning: Extending the relationship between executive functions and school readiness to science. Learning and Individual Differences, 26, 81-88.
- Nehring, A. D., & Nering, E. F. (1992). Learning Accomplishment Profile Diagnostic Standardized Assessment Revised (LAP-DR). Kaplan Press.
- Pagani, L. S., & Messier, S. (2012). Links between motor skills and indicators of school readiness at kindergarten entry in urban disadvantaged children. Journal of educational and developmental psychology, 2(1), 95. [CrossRef]
- Pan, Q., Trang, K. T., Love, H. R., & Templin, J. (2019). School readiness profiles and growth in academic achievement. Frontiers in Education(4), 1-17. [CrossRef]
- Panter, J. E., & Bracken, B. A. (2009). Validity of the Bracken School Readiness Assessment for predicting first grade readiness. Psychology in the Schools, 46(5), 397-409. [CrossRef]
- Peyre, H., Albaret, J. M., Bernard, J. Y., Hoertel, N., Melchior, M., Forhan, A., Taine, M., Heude, B., De Agostini, M., Galera, C., Ramus, F., & Study, E. M.-C. C. (2019). Developmental trajectories of motor skills during the preschool period. Eur Child Adolesc Psychiatry, 28(11), 1461-1474. [CrossRef]
- Ponitz, C. C., McClelland, M. M., Matthews, J. S., & Morrison, F. J. (2009). A structured observation of behavioral self-regulation and its contribution to kindergarten outcomes. Dev Psychol, 45(3), 605-619. [CrossRef]
- Prior, M., Bavin, E., & Ong, B. (2011). Predictors of school readiness in five-to six-year-old children from an Australian longitudinal community sample. Educational Psychology, 31(1), 3-16.
- Razza, R. A., & Blair, C. (2009). Associations among false-belief understanding, executive function, and social competence: A longitudinal analysis. Journal of Applied Developmental Psychology, 30(3), 332-343.
- Reynolds, C. R., Kamphaus, R. W., & Vannest, K. J. (2015). BASC3: Behavior assessment system for children. PscyhCorp San Antonio, TX.
- Ricciardi, C., Manfra, L., Hartman, S., Bleiker, C., Dineheart, L., & Winsler, A. (2021). School readiness skills at age four predict academic achievement through 5th grade. Early Childhood Research Quarterly, 57, 110-120. [CrossRef]
- Schoemaker, K., Mulder, H., Deković, M., & Matthys, W. (2013). Executive functions in preschool children with externalizing behavior problems: A meta-analysis. Journal of Abnormal Child Psychology, 41, 457-471.
- Shaul, S., & Schwartz, M. (2014). The role of the executive functions in school readiness among preschool-age children. Reading and Writing, 27, 749-768.
- Wanless, S. B., McClelland, M. M., Acock, A. C., Ponitz, C. C., Son, S. H., Lan, X., Morrison, F. J., Chen, J. L., Chen, F. M., Lee, K., Sung, M., & Li, S. (2011). Measuring behavioral regulation in four societies. Psychol Assess, 23(2), 364-378. [CrossRef]
- Welsh, J. A., Nix, R. L., Blair, C., Bierman, K. L., & Nelson, K. E. (2010). The development of cognitive skills and gains in academic school readiness for children from low-income families. Journal of Educational Psychology, 102(1), 43.
- Zelazo, P. D. (2015). Executive function: Reflection, iterative reprocessing, complexity, and the developing brain. Developmental Review, 38, 55-68.
Figure 1.
Consort Diagram.
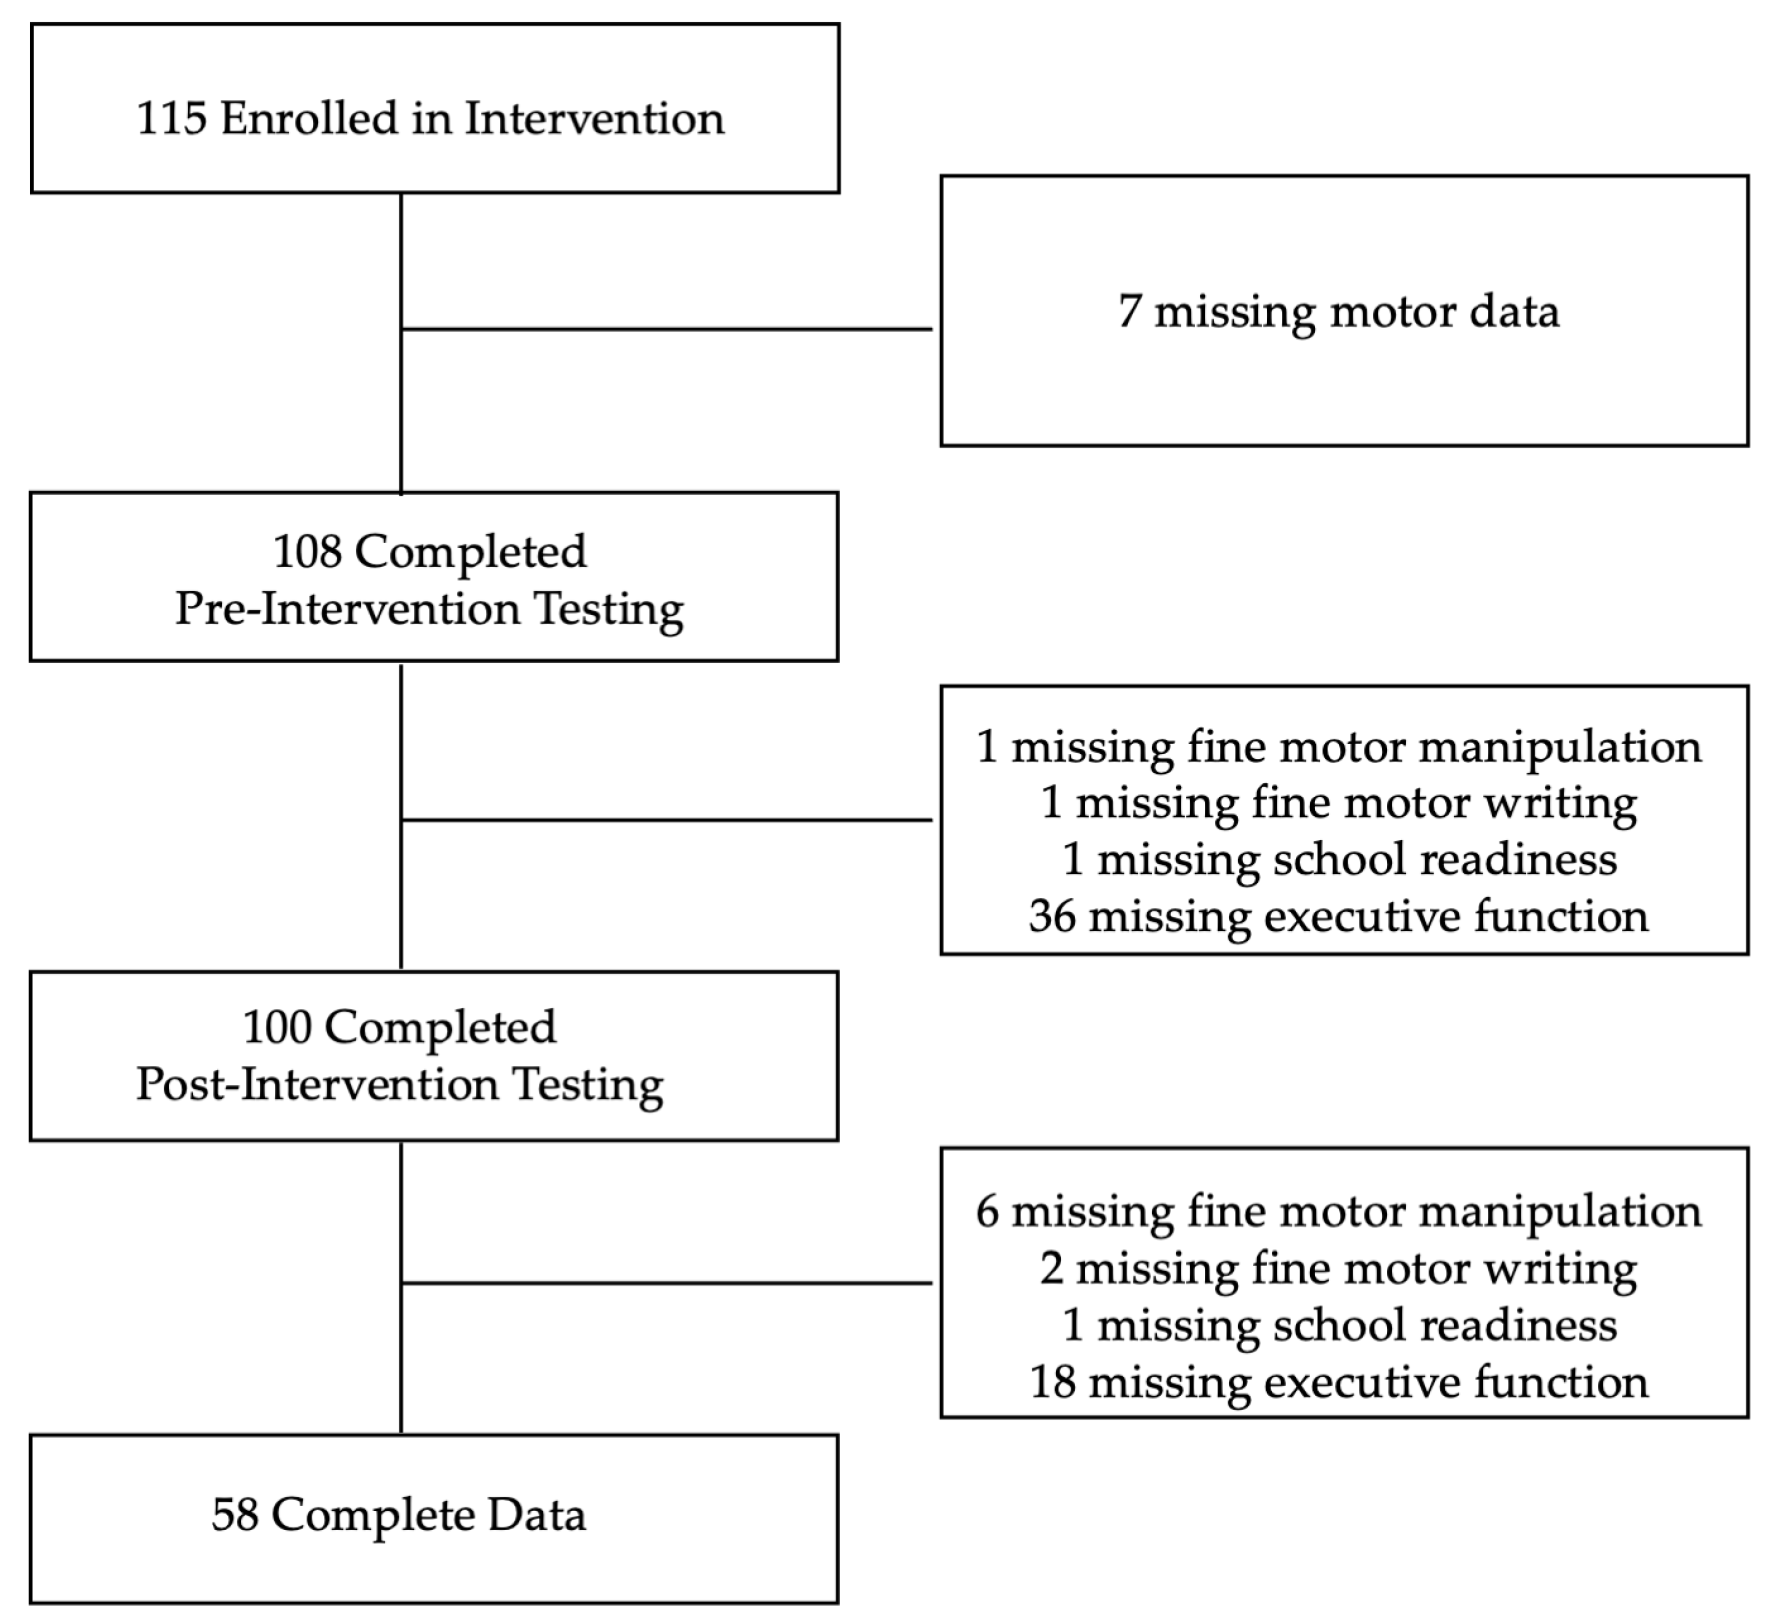
Figure 2.
Scatter plots with regression lines showing the relation between school readiness scores and the three predictors pre-intervention.
Figure 2.
Scatter plots with regression lines showing the relation between school readiness scores and the three predictors pre-intervention.
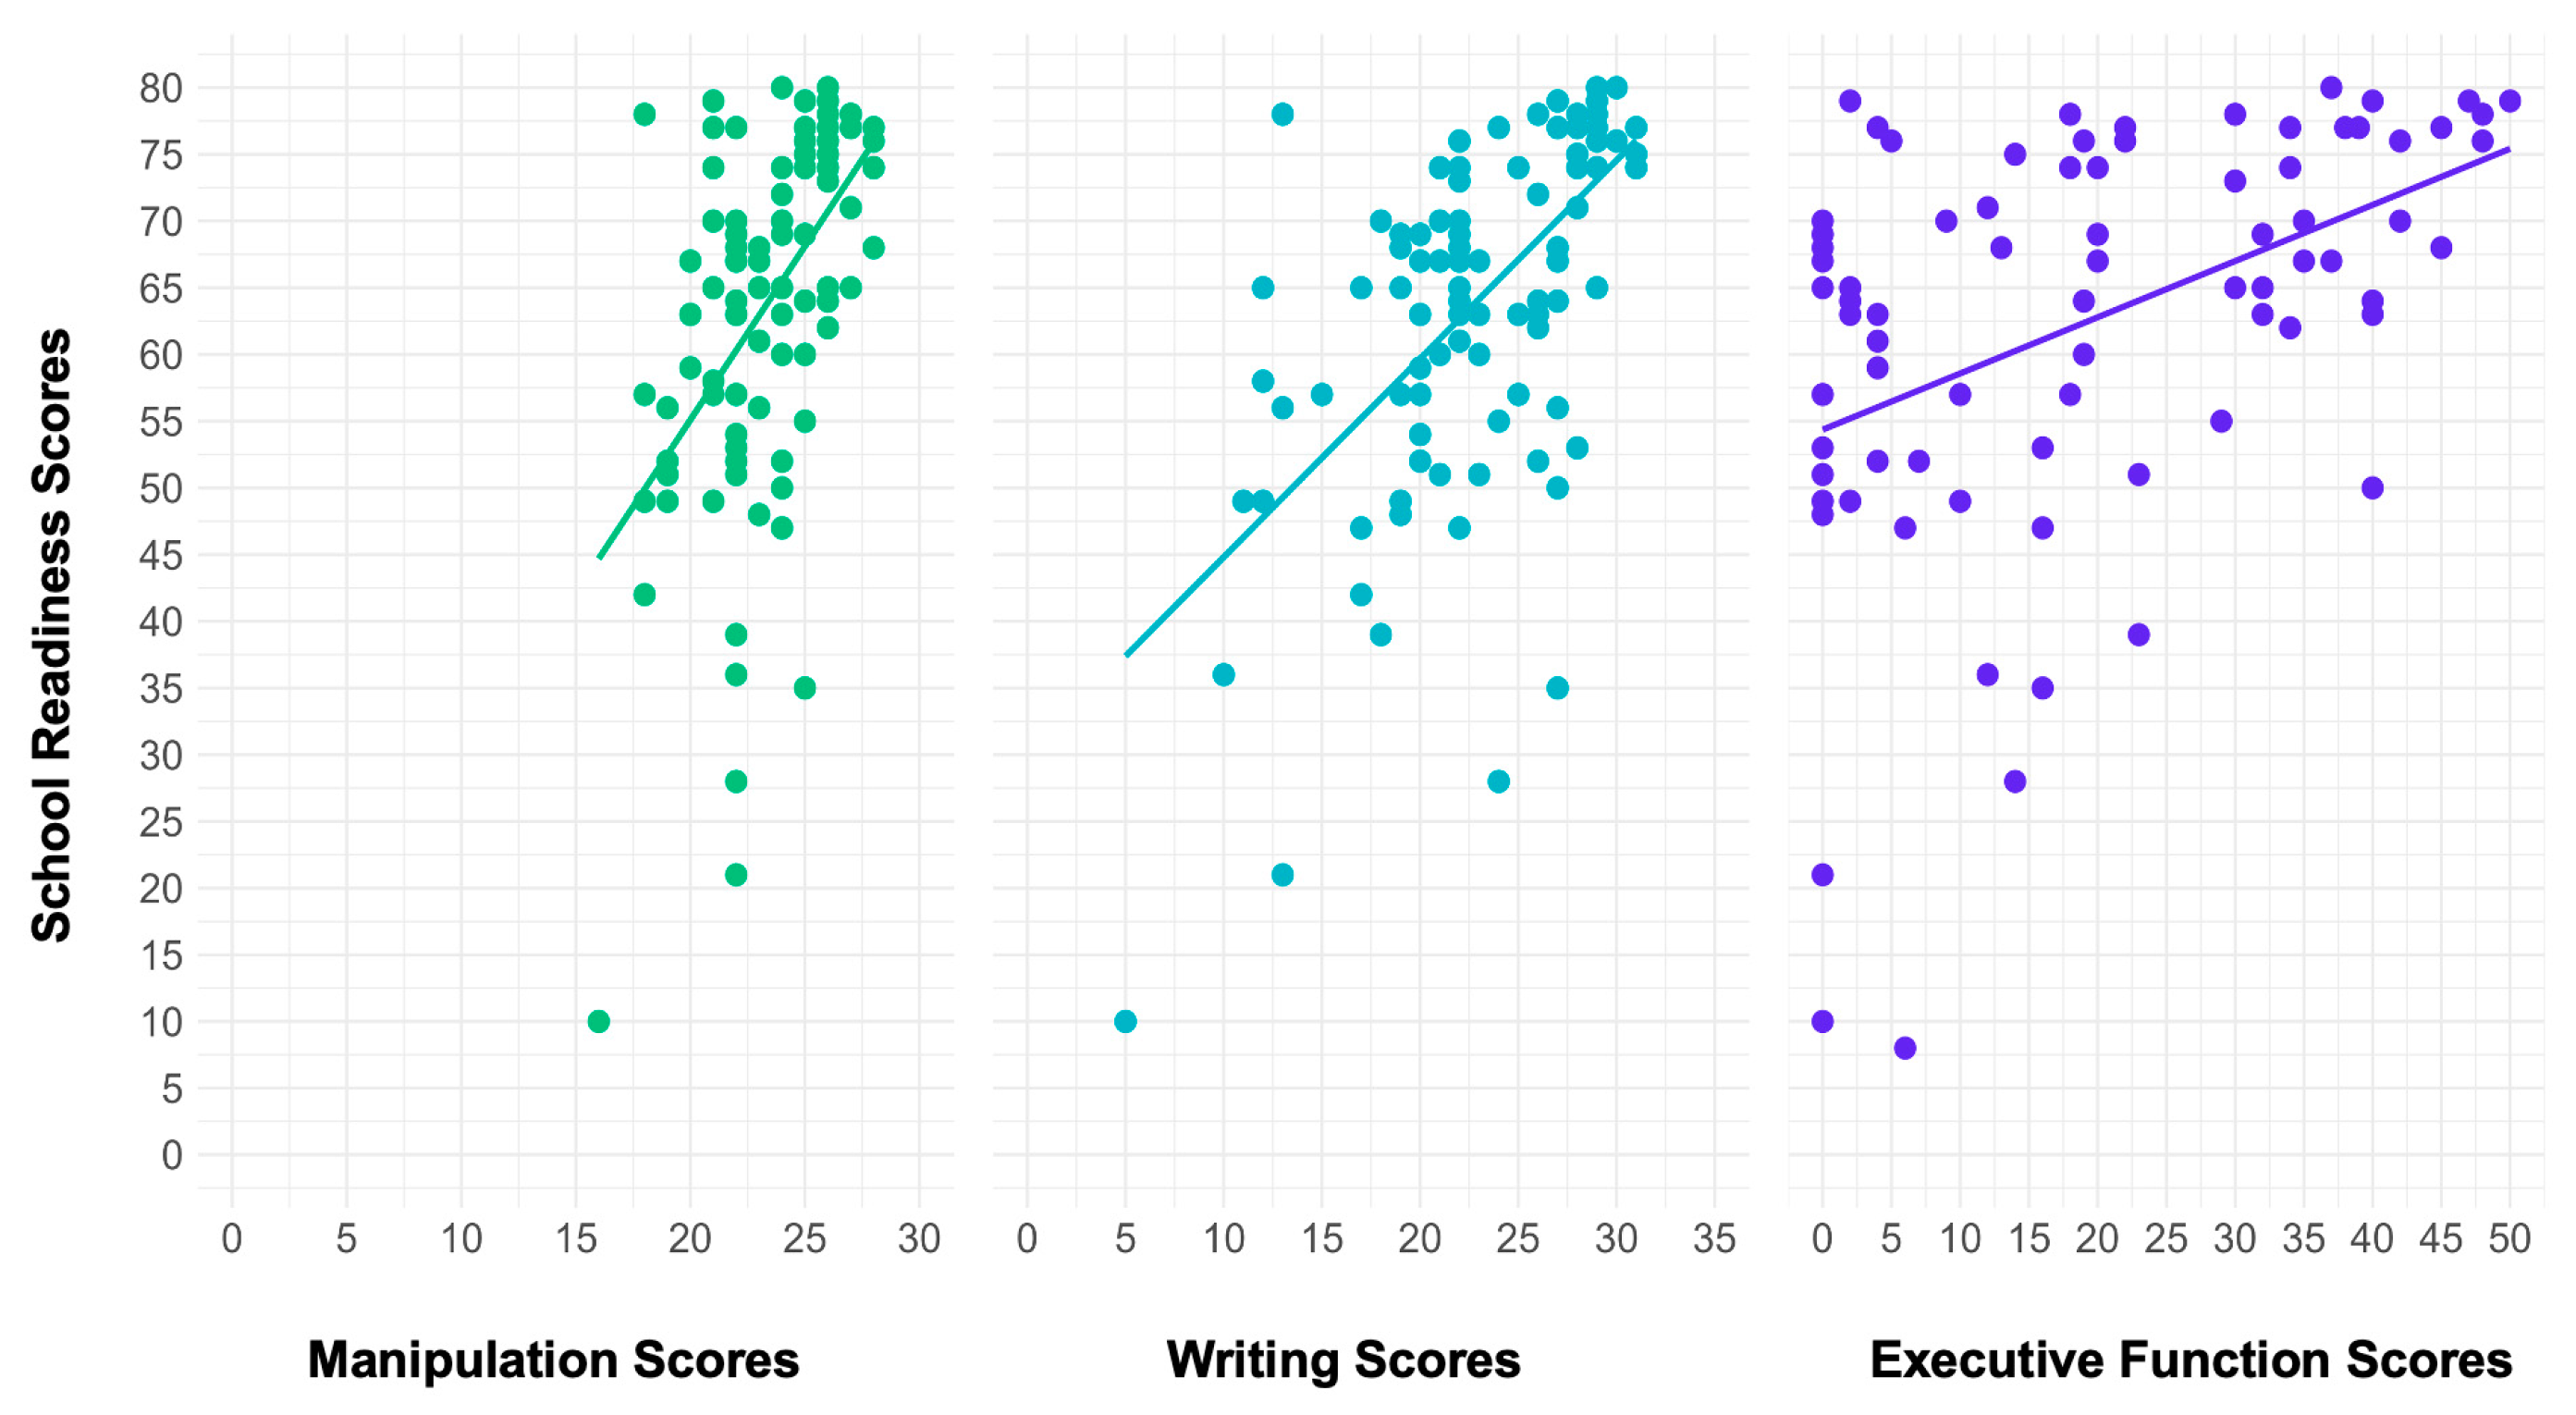
Figure 3.
Scatter plots with regression lines showing the relation between school readiness scores and the three predictors post-intervention.
Figure 3.
Scatter plots with regression lines showing the relation between school readiness scores and the three predictors post-intervention.
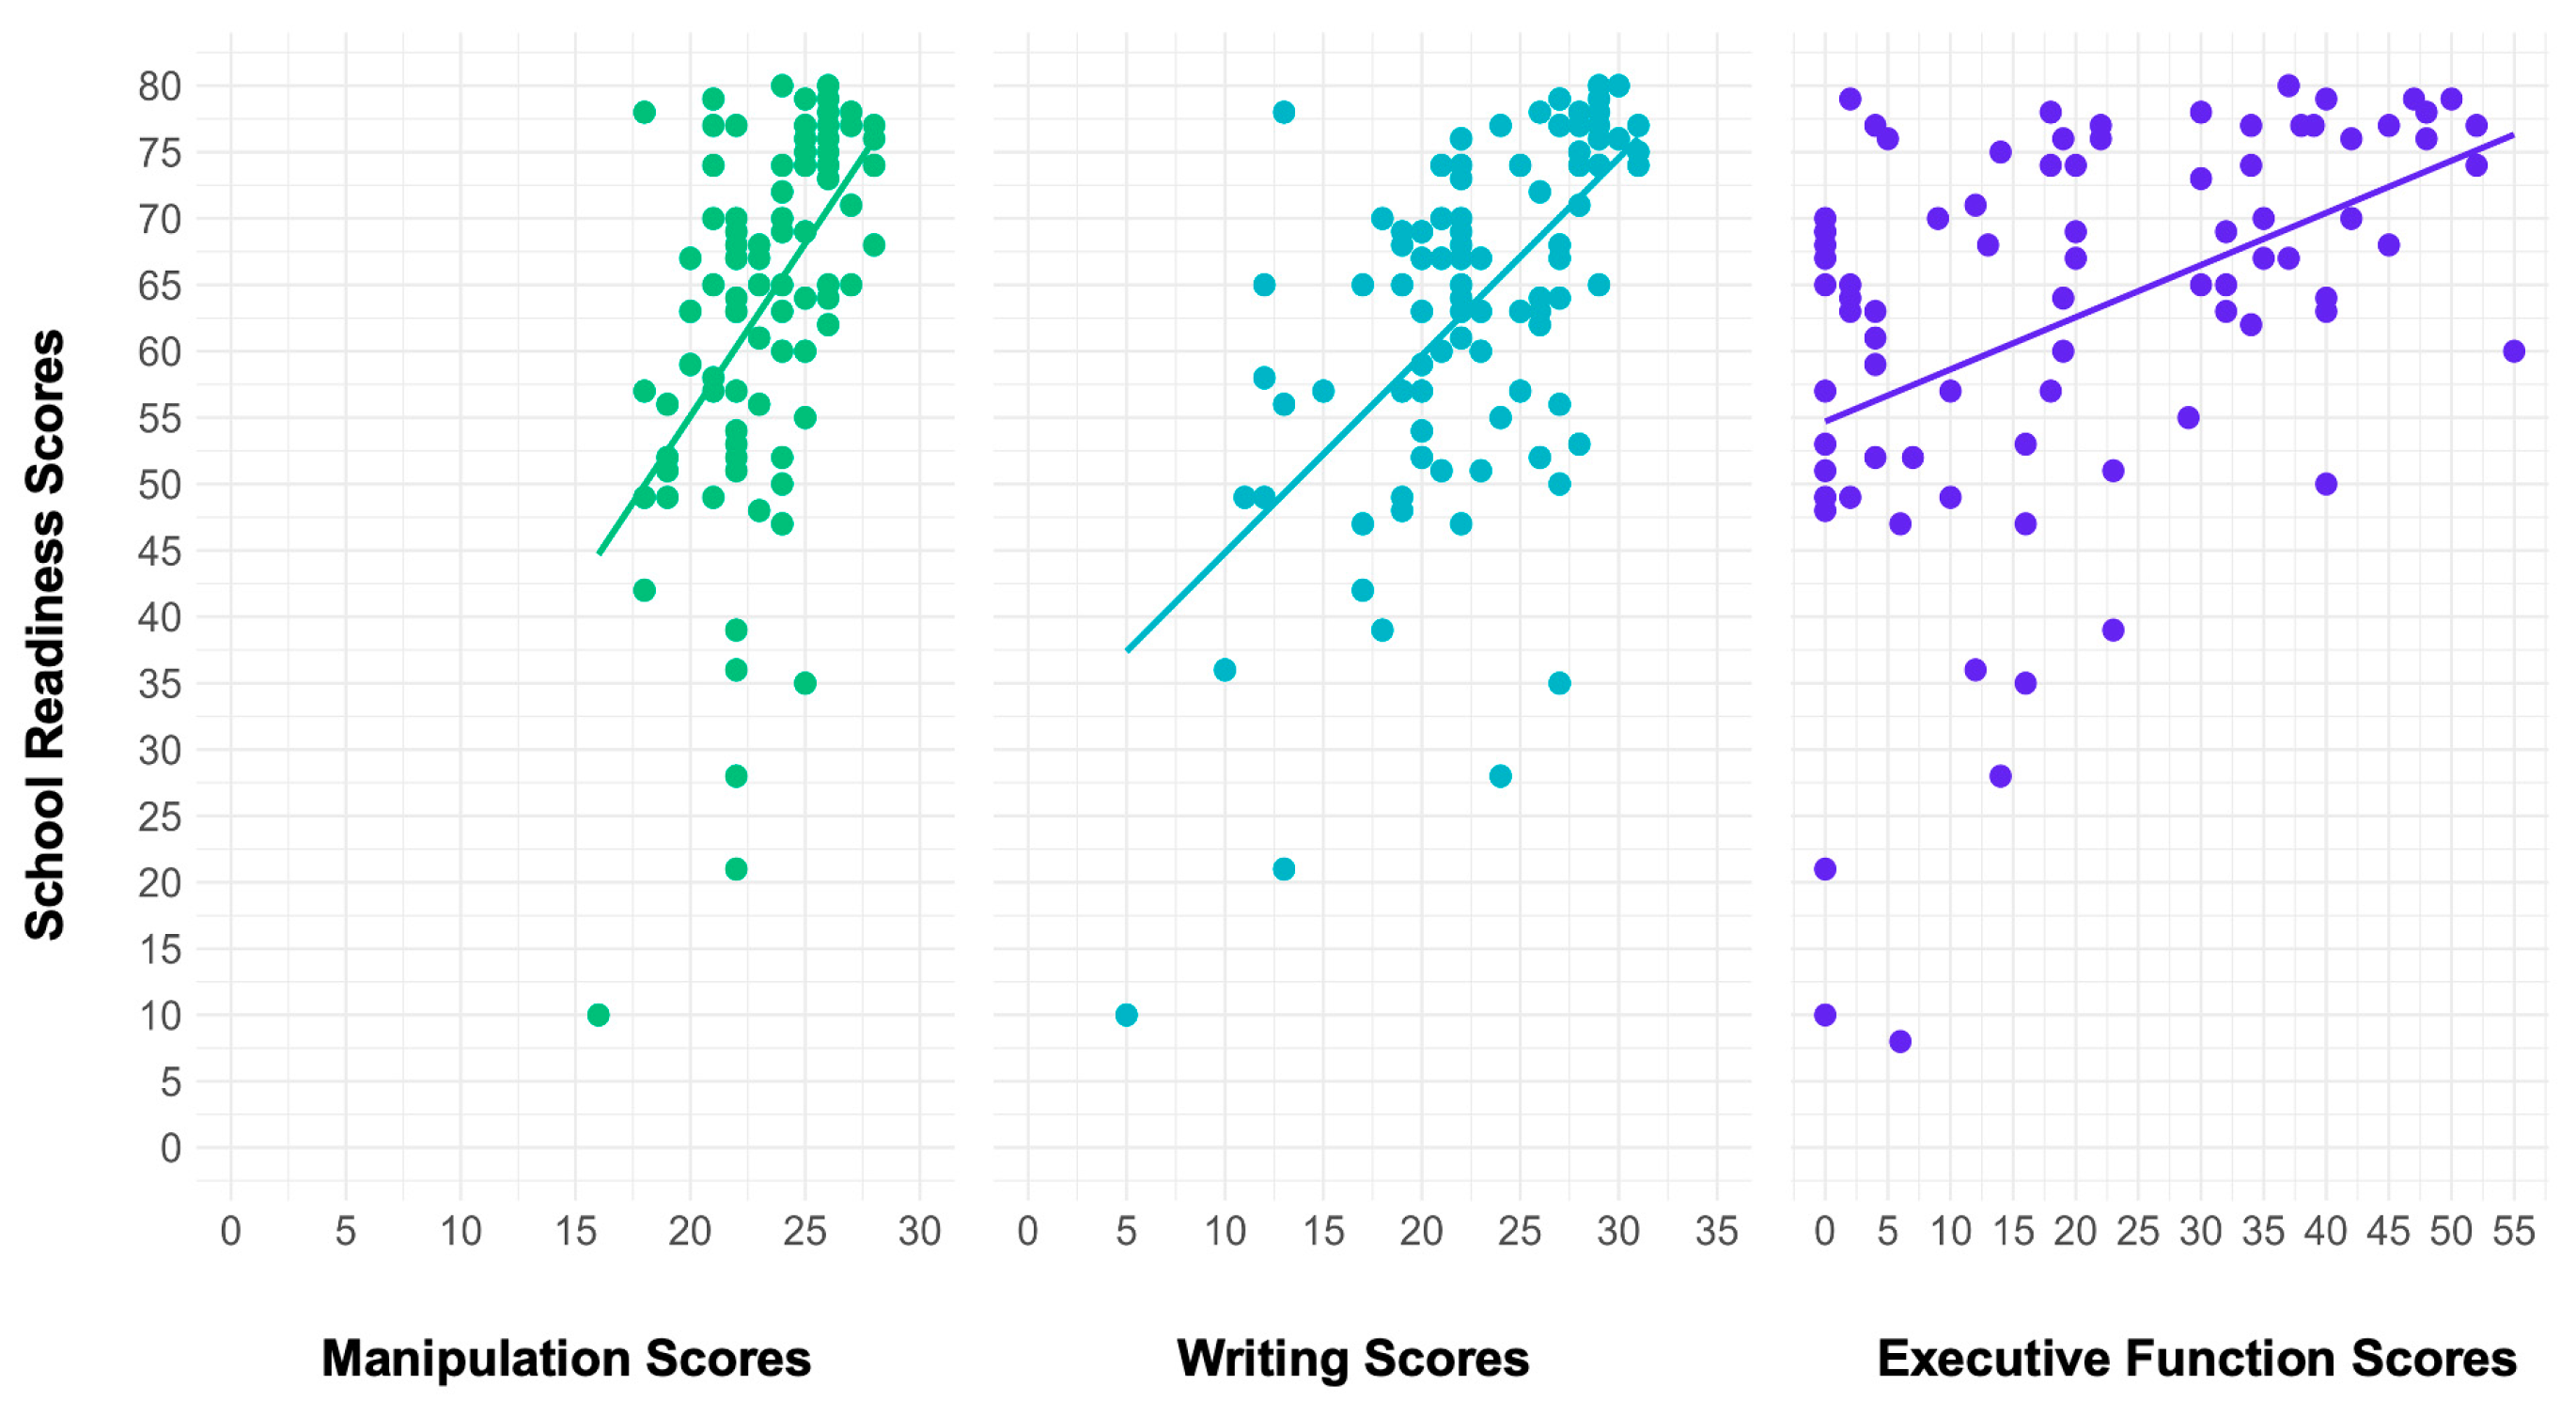

Table 1.
Demographics for children.
| Characteristic | Percentage in sample | n |
| Child’s sex | ||
| Male Female |
68.52% 31.48% |
74 34 |
| Child’s race | ||
| Black or African American White Multiracial Asian Other |
92.59% 2.78% 0.93% 0.93% 2.78% |
100 3 1 1 3 |
| Child’s ethnicity | ||
| Hispanic Not Hispanic Haitian Other |
5.56% 19.44% 23.15% 51.85% |
6 21 25 56 |
Table 2.
Demographics for parents.
| Characteristic | Percentage in sample | n |
| Parents’ sex | ||
| Male Female |
9.26% 90.74% |
10 98 |
| Parents’ race | ||
| Black or African American White American Indian or Alaskan Multiracial Other Not reported |
88.89% 2.78% 1.85% 0.93% 3.70% 1.85% |
96 3 2 1 4 2 |
| Parents’ ethnicity | ||
| Hispanic Not Hispanic Haitian Other Not reported |
4.63% 35.19% 12.04% 43.52% 4.63% |
5 38 13 47 5 |
| Parents’ education | ||
| Some high school High school graduate Some college or associate’s degree Bachelor’s degree Graduate degree Not reported |
35.19% 28.70% 22.22% 6.48% 5.56% 1.85% |
38 31 24 7 6 2 |
| Parents’ income | ||
|
$11,720 - $35,743 $35,744 - $47,297 $47,298 - $75,000 $75,000 + Not reported |
87.98% 5.55% 1.85% 0.93% 3.70% |
95 6 2 1 4 |
| Parents’ marital status | ||
| Single/never married Married Living with a partner Separated/divorced Widowed Unknown |
35.19% 10.19% 4.63% 3.71% 1.85% 44.44% |
38 11 5 4 2 48 |
Table 3.
Correlation between variables pre-intervention.
| Variables | Mean | SD | Min | Max | 1 | 2 | 3 | 4 | 5 |
|
60.36 | 14.38 | 38 | 105 | - | 0.20* | 0.11 | 0.12 | 0.04 |
|
22.27 | 3.22 | 11 | 28 | - | 0.60*** | 0.50*** | 0.30* | |
|
20.70 | 5.98 | 4 | 31 | - | 0.67*** | 0.35** | ||
|
49.72 | 17.70 | 4 | 79 | - | 0.34** | |||
|
12.34 | 15.07 | 0 | 57 | - |
Note. *** p <0.001 ** p <0.01 * p <0.05.
Table 4.
Correlation between variables post intervention.
| Variables | Mean | SD | Min | Max | 1 | 2 | 3 | 4 | 5 |
|
51.85 | 11.99 | 33 | 83 | - | 0.13 | 0.09 | 0.18 | 0.17 |
|
23.28 | 2.67 | 16 | 28 | - | 0.69*** | 0.51*** | 0.38*** | |
|
22.98 | 5.35 | 5 | 31 | - | 0.60*** | 0.47*** | ||
|
63.82 | 14.56 | 8 | 83 | - | 0.47*** | |||
|
21.75 | 17.63 | 0 | 58 | - |
Note. *** p <0.001 ** p <0.01 * p <0.05.
Table 5.
Estimates of model regression coefficients, 95% confidence intervals of those coefficients and p-values for pre-intervention data.
Table 5.
Estimates of model regression coefficients, 95% confidence intervals of those coefficients and p-values for pre-intervention data.
| Variable | β | SE | 95% CI | p |
| Pre-intervention model with HTKS as predictor | ||||
| HTKS scores | 0.41 | 0.14 | [0.13, 0.69] | 0.004** |
| Parent education | -0.20 | 1.35 | [-2.90, 2.50] | 0.88 |
| Parent income | -0.77 | 0.89 | [-2.56, 1.01] | 0.39 |
| Age | 0.03 | 0.51 | [-1.00, 1.07] | 0.94 |
| 0.12 | ||||
| Pre-intervention model with FM as predictor | ||||
| FM scores | 2.10 | 0.47 | [1.16, 3.04] | < 0.001*** |
| Parent education | 0.12 | 0.81 | [-1.48, 1.72] | 0.88 |
| Parent income | -0.14 | 0.45 | [-1.03, 0.75] | 0.76 |
| Age | 0.30 | 0.34 | [-0.38, 0.98] | 0.39 |
| 0.21 | ||||
| Pre-intervention model with FW as predictor | ||||
| FW scores | 2.00 | 0.25 | [1.50, 2.51] | < 0.001*** |
| Parent education | 0.69 | 0.93 | [-1.16, 2.54] | 0.46 |
| Parent income | -0.85 | 0.53 | [-1.90, 0.21] | 0.11 |
| Age | -0.11 | 0.36 | [-0.82, 0.61] | 0.76 |
| 0.40 | ||||
| Pre-intervention model with all predictors | ||||
| FM scores | 1.38 | 0.71 | [-0.03, 2.79] | 0.05 |
| FW scores | 1.78 | 0.40 | [1.04, 2.52] | < 0.001*** |
| HTKS scores | 0.11 | 0.12 | [-0.13, 0.35] | 0.38 |
| Parent education | -0.22 | 1.08 | [-2.38, 1.95] | 0.84 |
| Parent income | -1.67 | 0.78 | [-3.23, -0.11] | 0.03* |
| Age | 0.21 | 0.43 | [-0.64, 1.07] | 0.61 |
| 0.46 | ||||
Note. *** p <0.001 ** p <0.01 * p <0.05.
Table 6.
Estimates of regression coefficients, 95% confidence intervals of those coefficients and p-values for post-intervention data.
Table 6.
Estimates of regression coefficients, 95% confidence intervals of those coefficients and p-values for post-intervention data.
| Variables | β | SE | 95% CI | p |
| Post-intervention model with HTKS as predictor | ||||
| HTKS scores | 0.35 | 0.07 | [0.20, 0.49] | <0.001*** |
| Parent education | 0.52 | 0.93 | [-1.34, 2.38] | 0.58 |
| Parent income | -0.30 | 0.53 | [-1.35, 0.76] | 0.58 |
| Age | 0.37 | 0.33 | [-0.33, 1.08] | 0.29 |
| 0.25 | ||||
| Post-intervention model with FM as predictor | ||||
| FM scores | 2.09 | 0.49 | [1.11, 3.07] | <0.001*** |
| Parent education | 0.40 | 0.83 | [-1.25, 2.04] | 0.63 |
| Parent income | -0.31 | 0.46 | [-1.23, 0.61] | 0.51 |
| Age | 0.12 | 0.36 | [-0.58, 0.84] | 0.72 |
| 0.19 | ||||
| Post-intervention model with FW as predictor | ||||
| FW scores | 1.39 | 0.23 | [0.91, 1.86] | 0.001*** |
| Parent education | 0.22 | 0.76 | [-1.29, 1.73] | 0.77 |
| Parent income | -0.66 | 0.44 | [-1.54, 0.22] | 0.14 |
| Age | 0.16 | 0.33 | [-0.48, 0.81] | 0.61 |
| 0.30 | ||||
| Post-intervention model with all predictors | ||||
| FM scores | 0.23 | 0.64 | [-1.05, 1.51] | 0.72 |
| FW scores | 0.99 | 0.36 | [0.28, 1.70] | 0.007** |
| HTKS scores | 0.19 | 0.08 | [0.02, 0.33] | 0.02* |
| Parent education | 0.22 | 0.93 | [-1.64, 2.07] | 0.81 |
| Parent income | -0.69 | 0.56 | [-1.81, 0.43] | 0.22 |
| Age | 0.18 | 0.36 | [-0.55, 0.92] | 0.61 |
| 0.33 | ||||
Note. *** p <0.001 ** p <0.01 * p <0.05.
Disclaimer/Publisher’s Note: The statements, opinions and data contained in all publications are solely those of the individual author(s) and contributor(s) and not of MDPI and/or the editor(s). MDPI and/or the editor(s) disclaim responsibility for any injury to people or property resulting from any ideas, methods, instructions or products referred to in the content. |
© 2025 by the authors. Licensee MDPI, Basel, Switzerland. This article is an open access article distributed under the terms and conditions of the Creative Commons Attribution (CC BY) license (http://creativecommons.org/licenses/by/4.0/).
Copyright: This open access article is published under a Creative Commons CC BY 4.0 license, which permit the free download, distribution, and reuse, provided that the author and preprint are cited in any reuse.


