
Submitted:
27 March 2025
Posted:
31 March 2025
You are already at the latest version
Abstract
Using a digital oscilloscope, the primary harmonics resulting from applying different frequencies and power levels of ultrasonic waves during the polymer extrusion process were identified. The primary harmonics are located between 10 and 60 kHz and exhibit unique characteristics such as shape, crest, and trough, the latter being associated with voltage and current. The crest-to trough distance (height) observed during processing at 34 kHz and 375 W shows the highest value, correlating with the highest melt flow index and the lowest apparent viscosity. It is well known that ultrasonic waves can randomly break C-C bonds in hydrocarbon compounds, leading to a decrease in molecular weight. However, applying ultrasonic waves at different frequencies and power levels can promote chain scission in both high and medium molecular weight chains, increasing molecular weight distribution. This phenomenon can lead to chain disentanglement along with chain scission as molecular weight decreases at medium power and frequency intensities. Finally, a schematic representation of the interaction between polymer chains and ultrasonic waves is proposed.

Keywords:
ultrasonically assisted melt extrusion
; polypropylene
; monitoring
; oscilloscope
; harmonic
1. Introduction
Ultrasonic waves are a type of wave that can propagate through different media (solid, liquid, or gas). These waves typically carry mechanical energy through the local vibration of particles without actually transporting the particles themselves. Ultrasound is generally defined as waves with frequencies above the upper limit of human hearing (typically considered to be 20 kHz) [1]. Ultrasonic waves have been widely used across various disciplines, including biology, medicine, chemistry, physics, and materials science, due to their cost-effectiveness and environmentally friendly nature. This technology is commonly used in industrial applications and has been successfully tested in laboratory and field conditions [2]. The effectiveness of ultrasonic waves in these processes is attributed to their ability to enhance heat and mass transfer and modify the structure and properties of dispersed phases. This is achieved by generating mechanical energy, which is converted into acoustic waves propagating through the medium and producing secondary effects.
One of the most significant effects of ultrasonic waves is the cavitation phenomenon, in which acoustic vibrations subject the liquid to high stress, forming bubbles. The collapse of these bubbles results in the formation of a shockwave, which can significantly accelerate diffusion processes and increase localized heating [3,4]. Recently, Dangaev et al. [5] suggested that ultrasonic waves may also interact through other mechanisms, such as acoustic transmission and radiation forces, in addition to cavitation and heating mechanisms. Acoustic transmission refers to the movement of fluid caused by the propagation of sound waves, which can enhance mixing and mass transfer. Radiation forces refer to the transfer of momentum from the sound wave to the medium, which can induce movement and separation of particles in viscous liquids such as crude oil.
Based on these principles, ultrasonic waves have been applied during the processing of molten polymers, a technique known as ultrasonically assisted melt extrusion (USME). The USME process has been used to enhance polymer compatibility [6,7], improve the dispersion of nanoparticles in polymers [8,9], and promote the production of branched polymers [10]. However, the interaction mechanism between polymer chains and ultrasonic waves remains largely unexplored. In the USME process, an extruder, an adapter, a horn, and an ultrasonic generator are required. When the generator is connected to the power source, it converts low-frequency electrical energy into high-frequency energy. This energy is then transformed into mechanical vibrations through a piezoelectric transducer, amplifying the signal and transferring the vibrational energy to the medium or material [4,11].
When propagating through a liquid or gaseous medium, ultrasonic waves are characterized as longitudinal waves, meaning that compression and rarefaction occur in the same direction as wave propagation [12]. Consequently, when the horn vibrates, it transfers energy to the polymer, propagating through the melt via acoustic transmission and radiation forces [5]. Various techniques exist to measure the effects and efficiency of this process [13]. However, the most commonly used methods involve post-processing evaluations of the material’s physicochemical, rheological, thermal, electrical, or mechanical properties. Additionally, real-time measurements can be conducted for process monitoring and control [14].
Ultrasonic waves have also been used as a non-destructive technique for evaluating the mechanical properties of materials, assessing agricultural product quality, and even measuring the thickness of extruded tubes, among other applications [15,16]. Furthermore, it has been utilized to study the melting behavior of polymers [14,17,18,19,20]. Wang and Ming [21] implemented an in-line ultrasound monitoring system to investigate the melting behavior of linear low-density polyethylene (LLDPE) and polyvinyl chloride (PVC).
Since an ultrasonic generator operates as an electrical circuit, it is possible to monitor voltage and current variations using an oscilloscope. An oscilloscope is an instrument used to visualize, measure, record, and analyze variations in voltage signals over time [22]. Kumar et al. [23] analyzed voltage and current signals using a high-speed digital oscilloscope to understand the arc welding process better. They varied power sources, inverters, and welding electrodes, finding that oscilloscope data could differentiate the performance of various power sources and consumables in the welding process. A similar study was conducted by Savyasachi et al. [24], who monitored a metal arc welding process using different power sources and welding electrodes. Dynamic variations in current and voltage were recorded using a digital oscilloscope, while the arc welding process was captured with a high-speed camera. The voltage and current data were analyzed using probability distribution analysis. These authors found that voltage variations could be correlated with physical processes and demonstrated the feasibility of using an oscilloscope and a high-speed camera for arc welding process supervision.
Most studies reported to date have focused on the application of ultrasonic waves generated at a single frequency within the range of 15–100 kHz, primarily at 20 ± 1 kHz, as this is the primary or resonant frequency of commercial piezoelectric transducers and ultrasonic generators, as reported by Hamidi et al. [2]. For example, in the study by Mohammadian et al. [25], different single frequencies (25, 40, and 65 kHz) were used, and the output power of the ultrasonic waves was varied between 50 and 500 W in each experiment. The effects on crude oil recovery were examined, identifying output power as the most significant factor. Increased output power (intensity) and higher wave frequencies enhanced and accelerated oil recovery. Specifically, ultrasonic waves increased oil recovery by 10%, 14%, and 17% for 100, 200, and 400 W output power levels, respectively. Additionally, at an output power of 100 W, with a treatment time of 200 minutes, and at a 25 kHz frequency, the recovery rate was 51%, whereas it reached 53% and 57% at 40 kHz and 65 kHz, respectively. Recently, Dangaev et al. [26] demonstrated that using multifrequency ultrasound reduced heavy crude oil viscosity by applying ultrasonic waves with principal harmonics between 20 and 60 kHz. They proposed that molecular degradation occurs when valence bond energy is lower than the external forces acting upon it. In normal alkanes, this effect is primarily observed in C-C bonds located near the center of the molecule, while in aromatic hydrocarbons with alkyl substituents, it occurs at the β-bond of peripheral chains.
The effects observed upon the application of ultrasonic waves to molten polymers have been explained by cavitation collapse, which reduces the non-Newtonian flow characteristics of the molten polymer [27] or the formation of microvoids within the material due to cavitation during extrusion [28]. However, some research groups have proposed alternative mechanisms based on acoustic transmission, radiation forces, molecular segment relaxation, and fatigue effects caused by successive expansion and compression cycles in polymer chains [5,29,30].
Given these considerations, there is a need to implement non-invasive methodologies that provide insights into the application of ultrasonic waves with varying power levels and frequencies (harmonics) to study the in-line extrusion process and establish correlations between electrical parameters (voltage, current, frequency) and the final material properties. Therefore, this study aims to identify the natural harmonics of the system using an oscilloscope, analyze power variations during ultrasonically assisted extrusion of a model polymer, polypropylene, and evaluate its final physicochemical properties.
2. Materials and Methods
2.1. Materials
A polypropylene homopolymer (iPP), designed for cable coating applications and nonwoven fabric manufacturing, with a melt flow index of 35 g/10 min, was used. The material was obtained from Formosa Plastics Corporation (TX, USA) under the commercial name Formolene 4111T.
2.2. Sample Preparation
The iPP was processed in a PRISM TSE 24-MC twin-screw extruder from Thermo Fisher Scientific (Karlsruhe, Germany) with a configuration of two intensive mixing zones at a speed of 100 rpm and a flat temperature profile of 200°C along the barrel. A specially designed chamber containing a catenoidal titanium horn from Branson Ultrasonics Corp. (CT, USA) with a primary frequency of 20 ± 0.1 kHz was used for the ultrasonic treatment. The horn had a diameter of 0.5 inches, a total length of 3 1/2 inches, with 2 inches of straight cross-sectional length and a 0.5-inch exponential section. The horn was connected to the extruder die via a threaded joint in the direction of polymer flow.
The chamber consisted of a hollow steel cylinder threaded at both ends, with a total length of 5.2 inches. One end was connected to the extruder die via another hollow threaded cylinder (1/4-inch internal diameter) in the direction of polymer flow. At the opposite end, the horn was attached via a threaded joint (1 1/2-inch diameter). This chamber had a controlled temperature and a nozzle for material output. The gap between the cross-section of the horn and the chamber was 0.25 inches, while the gap between the nozzle and the horn was 1 inch, located at the end of the exponential section. The horn was secured to the chamber via a countercurrent threaded connection to the polymer exit.
The horn was connected to a piezoelectric transducer model CL33 from QSonica Sonicators Inc. (CT, USA) by screwing it at its nodal point. The transducer was then connected to a homemade ultrasonic generator, operating within a frequency range of 10 to 60 kHz (adjustable via a tuning knob), with a maximum output power of 750 W. The generator included impedance matching and suppression circuits to protect it from parasitic frequencies. This system compensated for return voltage fluctuations due to rebound vibrations when the horn tip made contact with the molten polymer. This protection ensured the proper operation of the system and was developed by Ávila-Orta et al. [31].
An Agilent DSO3102A digital oscilloscope, now Keysight (CA, USA), was connected to the ultrasonic generator and a PC running Windows™ XP to analyze the behavior of ultrasonic waves. The oscilloscope software (Series 3000, version 1.1.27) was used to visualize and record ultrasonic wave signals at different frequencies and power levels. Figure 1 presents a schematic representation of the system used in this study.
2.3. Characterization Techniques
Physicochemical characterization was conducted using various techniques to determine the effect of ultrasound variables such as voltage, current, and frequency after iPP processing via USME.
2.3.1. Oscillograms
An Agilent Technologies DSO3102A oscilloscope with a bandwidth of 100 MHz, a maximum sampling rate of 1 GS/s, two channels, and AC/DC coupling was used to record in-situ ultrasonic waves. The device featured a 5.7-inch graphical display with an input impedance of 1 MΩ. A probe was used to measure voltage and current, with measurements obtained directly from the probes connected to the oscilloscope. During the USME process, the natural harmonics of the system were identified, and the voltage and current of the entire circuit were monitored to detect changes due to variations in ultrasonic power and frequency. Data were visualized and collected via an external PC connected through an Ethernet cable, with subsequent analysis conducted using the proprietary software of the oscilloscope.
2.3.2. Molecular Weight Analysis
The number-average molecular weight (Mn) and molecular weight distribution (Mw/Mn) of the ultrasonic-treated samples were determined using a gel permeation chromatography (GPC) system Alliance GPCV-2000, now Waters Corporation (MA, USA), with a refractive index detector. Trichlorobenzene was used as the mobile phase solvent. The analysis was conducted at 140°C, and the GPC was calibrated using polystyrene standards.
2.3.3. Melt Flow Index (MFI)
The melt flow index of the ultrasonic-treated samples was determined using a plastometer model LMI Series 4000 from Dynisco (MA, USA) under a load of 2.16 kg at 230°C, following ASTM D1238.
2.3.4. Capillary Rheometry
The effect of ultrasonic waves on molecular mobility and viscosity was analyzed using a high-pressure capillary rheometer Goettfert Rheograph 25 (Buchen, Germany) equipped with a die and a 15-mm diameter piston. The analysis was performed at 230°C, with a 12 to 4800 s⁻¹ shear rate range. This shear rate range encompasses various polymer processing methods, including compression molding, extrusion, and injection molding, following ASTM D3835.
3. Results
3.1. Collection of Oscillograms
In this study, "harmonics" are defined as those frequencies that exhibit a stable waveform and can be consistently replicated in the digital oscilloscope. The harmonics were identified based on minimal noise and interference in the voltage and current signals, as well as their attenuation or magnification. The observed alterations in electrical behavior originate from the mechanical stress applied by the molten polymer on the horn tip, leveraging the well-known property known as the piezoelectric effect [11]. In this scenario, the polymer acts as a resistive element, generating electric charges in response to the applied pressure. Consequently, variations in polymer viscosity induced by ultrasonic wave exposure result in corresponding modifications in both current and voltage. As a result, a characteristic waveform pattern is observed for each voltage-current pair at each of the detected harmonics [22]. It is essential to clarify that while the horn is designed to resonate at a primary frequency of 20 kHz, this is determined when it is not immersed in a fluid. However, when the horn is in contact with a fluid, the resonance frequencies are modified due to changes in the density or viscosity of the medium, reducing the probability of cavitation [1].
Using an ultrasonic generator, the electrical system converts conventional low-frequency electrical energy (60 Hz) into ultrasonic energy (10–100 kHz). This high-frequency energy is subsequently transferred to the piezoelectric transducer. The transducer generates longitudinal mechanical vibrations transmitted directly to the polymer as a shock wave front through the expansion and contraction of metallic electrodes connected to the piezoelectric elements. These generated vibrations exhibit a periodic oscillatory behavior governed by the applied voltages and currents, which are determined by the frequency and power supplied by the generator.
To monitor the electrical behavior of the system and detect changes induced by the piezoelectric effect, an oscilloscope was connected to the voltage and current outputs of the ultrasonic generator. The oscilloscope recorded sinusoidal voltage and current oscillations as "oscillograms," providing an instantaneous and non-invasive representation of these signals, as illustrated in Figure 2. In addition to the variations in voltage-current parameters, the observed behavior exhibited a degree of phase shift, meaning a forward or backward delay of the current signal relative to the voltage signal [22]. These changes in electrical parameters and phase shift are unique system behaviors that were quantified and analyzed.
These observations identified different harmonics at 20, 25, 27, 34, 43, and 52 ± 0.1 kHz for working power levels of 225, 375, and 450 W, respectively. Under these conditions, no frequency exhibited stable signals beyond 450 W. The samples were labeled accordingly. The W_U sample refers to polypropylene extruded without ultrasound, while ultrasound-treated extruded samples are labeled with the corresponding frequency and power used.
Voltage and current output signals were analyzed for each condition pair (frequency-power) (Figure 3). It was observed that increasing power at a constant frequency led to an increase in voltage and current values, with the current signal exhibiting a positive shift relative to voltage. At low frequencies (20, 25, and 27 kHz) and power levels exceeding 375 W, the current wave presented more significant interference in the system, with its amplitude failing to remain constant. Conversely, at frequencies above 27 kHz, the voltage and current waves exhibited a more defined waveform. The maximum peak values (crest), known as maximum amplitude (Amax), represent the amount of energy transmitted to the molten polymer, serving as a valuable indicator of material behavior. Table 1 presents parameters such as period (T) and maximum amplitude (Amax) associated with each voltage and current wave. The amplitude values of voltage and current increased as power increased. At 20 and 43 kHz frequencies, the current wave exhibited a phase shift relative to the voltage wave, indicating more significant charge accumulation in the horn. However, at a frequency of 34 kHz, voltage values were lower, while current values were higher than at any other frequency under the same applied power. Additionally, voltage and current waves were observed to be in phase. Interferences or deviations from the characteristic sinusoidal behavior of an electrical voltage and current wave were primarily attributed to variations in polymer viscosity, which caused higher or lower pressure on the horn, modifying the electrical charge and work required for the horn to operate at a specific amplitude at a given frequency [14,17].
3.2. Molecular Weight Analysis
A molecular weight analysis was conducted to understand the effect of ultrasonic waves (frequency and power) on the molecular weight of iPP chains. Figure 4 shows the molecular weight distribution curves for samples processed with and without ultrasound under different conditions. Detailed molecular weight values are provided in Table 2. The GPC traces shifted to lower values than the untreated sample, regardless of the applied power, indicating a reduction in molecular weight as the curves moved toward lower molecular weights. Overall, both Mw and Mn decreased upon ultrasound application. However, the number-average molecular weight (Mn) decreased more significantly than the weight-average molecular weight (Mw). This effect was most pronounced at a frequency of 34 kHz and a power of 375 W. Additionally, a decrease in peak amplitude was observed for ultrasound-treated samples, indicating that chain scission occurred randomly, favoring the cleavage of high- and medium-molecular-weight chains, increasing molecular weight distribution, and reducing Mw. This suggests that greater polymer chain scission was induced after ultrasonic treatment, consistent with literature reports [27].
3.3. Effect of Ultrasonic Waves on MFI
The pure iPP exhibits an MFI value of 34 g/10 min, as measured in the laboratory, as shown in Figure 5. Following polymer extrusion without ultrasonic treatment, an increase of 3 units in the MFI was observed compared to pure iPP, attributed to the extrusion process itself. When ultrasonic waves were applied to the molten polymer, the increase in the MFI of the extruded iPP was found to be a function of both frequency and power, with values ranging from 38 to 41 g/10 min. Ultrasonic waves induce chain scission in iPP, allowing it to flow more efficiently than pure polypropylene and extruded iPP without ultrasound treatment. This behavior results from the combined effects of acoustic transmission and radiation forces. The highest MFI value was recorded at a power of 375 W and a frequency of 34 kHz, reaching 41 g/10 min. This observation is consistent with GPC results, which indicate an increased polydispersity of the polymer chain.
3.4. Rheological Analysis
Capillary rheometry was used to evaluate the viscous behavior of material under deformation. Figure 6 illustrates the effect of ultrasonic waves on selected samples, including pure iPP, W_U, and samples treated at 34 kHz and different power levels.
In general, as the apparent shear stress increases, the apparent viscosity of the materials gradually decreases. The highest viscosity value was observed in pure iPP, followed by the W_U sample, consistent with values reported in the literature [33]. When ultrasonic waves were applied at 34 kHz, the apparent shear viscosity exhibited a more significant reduction than in the W_U sample, particularly at 225 and 450 W power levels. However, the sample treated at 375 W exhibited the most significant decrease in apparent shear viscosity, attributed to molecular weight reduction and chain scission during processing. This increase in polymer fluidity during extrusion may offer multiple advantages, such as higher production rates, improved extrudate quality, and forming a -phase during polymer crystallization [28,32].
3.5. Polymer Chain Interactions and Ultrasonic Wave Model
Figure 7 presents a conceptual model illustrating the potential effects of ultrasonically assisted melt extrusion on polymer chains. It is well established that polymers experience orientation and stress due to extensional flow during the extrusion process, leading to various polymer chain conformations. Upon exiting the die, the chains rapidly interact with ultrasonic waves due to acoustic transmission and radiation forces, which collectively influence the final orientation and structure. Since longer polymer chains have higher relaxation times than shorter chains, greater interchain friction is expected, reducing the number of entanglements (Figure 7a). Other chains undergo stretching and disentanglement (Figure 7b and Figure 7c), followed by polymer chain scission (Figure 7d and Figure 7e).
4. Discussion
When using different natural harmonics, the piezoelectric transducer undergoes mechanical deformation due to the vibrations generated by the ultrasonic generator, resulting in variations in voltage and current. The oscilloscope enables the waveform analysis of these signals, including amplitude, frequency, phase, and other relevant characteristics. Consequently, the oscilloscope provides precise information regarding electrical changes associated with the piezoelectric effect, enabling real-time, in-situ monitoring and analysis of system behavior.
When ultrasonic waves interact with polymer chains, they can generate vibratory motion known as acoustic transmission, inducing a "stretching and relaxation" effect. This can lead to greater chain friction, promoting chain disentanglement and polymer chain scission. It has been widely reported that one of the most notable effects of ultrasonic waves is molecular weight reduction. Chen et al. [27] investigated the physical and chemical effects of ultrasound on polypropylene matrices at an operational frequency of 20 kHz. Their findings indicated that as ultrasonic power increased (0–200 W), a reduction in molecular weight and molecular weight distribution of polypropylene was observed.
Due to acoustic transmission and radiation forces, ultrasonic waves create chain scission points, leading to polymer chain fragmentation, which enhances the material's fluidity. This finding aligns with the study conducted by Cao and Li [32], who reported that the application of ultrasonic waves to a polypropylene matrix during extrusion reduced die pressure and apparent viscosity, increased production rates, reduced extrudate swelling, and improved surface quality of the extruded PP.
As demonstrated, ultrasonic waves significantly influence reductions in molecular weight and increases in polymer fluidity, depending on the applied frequency and power. This observation supports the hypothesis that each harmonic interacts with polymer chain segments of a similar size, promoting chemical reactions and secondary effects that enhance polymer processability.
Depending on the structure and nature of the polymer, the mechanical energy supplied by ultrasonic waves may also influence polymer reactivity. Based on the voltage and current oscillograms, the polymer exhibits distinct harmonics between 10 and 60 kHz, suggesting that each specific frequency-power combination of ultrasonic waves may induce different effects on the polymer chain. Given these findings, further research is warranted on other polymers with different chemical structures and in the presence of functional additives to explore their response to ultrasonic waves.
5. Conclusions
Under the experimental conditions, the primary harmonics of the ultrasound-assisted extrusion of iPP between 10 and 60 kHz were identified. Ultrasonically assisted polypropylene extrusion was performed using the identified harmonics. Applying ultrasonic waves during polymer extrusion increases the vibrational energy of polymer chains, primarily due to acoustic transmission and radiation forces, leading to polymer chain scission. This results in a reduction in molecular weight, an increase in melt flow index, and a decrease in viscosity. The 34 kHz frequency and 375 W power level exhibited the most effective coupling between voltage and current signals and induced the most significant modifications in the final properties of the polymer.
This study demonstrates that the effects of frequency and power on each identified harmonic improve polymer processability. It suggests potential applications for further studies on molecular weight, copolymer presence, and nanoparticle incorporation. Such investigations could aid in establishing a harmonic database to promote and optimize ultrasonic processing in polymer engineering.
Finally, the findings indicate that ultrasonically assisted extrusion can be monitored in real-time and noninvasively using a digital oscilloscope, enabling the identification of process-relevant electrical signals (oscillograms).
Author Contributions
Conceptualization, V.J.C.-D. and C.A.A.-O.; methodology, D.A.-V. and A.G.-S.; software, G.F.H.-L..; validation, H.A.F.-F. and J.G.C-M; formal analysis, M.T.R.-H.; investigation, D.A.-V.; J.A.V.-G. and A.G.-S.; writing—original draft preparation, D.A.-V. and A.G.-S.; writing—review and editing, V.J.C.-D. and C.A.A.-O.; supervision, H.A.F.-F. and J.G.C-M.; project administration, J.A.V.-G. All authors have read and agreed to the published version of the manuscript.
Funding
This research received no external funding.
Data Availability Statement
Data are contained within the article.
Acknowledgments
The authors acknowledge the financial support from CIQA through scholarship 6438 (2018) and the Secretaría de Ciencia, Humanidades, Tecnología e Innovación de México (SECIHTI) through scholarship 276952 for Diana Agüero-Valdez. The authors also extend their gratitude to Rubén Sierra-Ávila, María G. Méndez-Padilla, and Javier Gudiño-Rivera for their support in the experimental measurements conducted in this study.
Conflicts of Interest
The authors declare no conflicts of interest.
References
- Leighton, TG. What is ultrasound? Prog Biophys Mol Biol 2007;93:3–83. [CrossRef]
- Hamidi H, Sharifi Haddad A, Wisdom Otumudia E, Rafati R, Mohammadian E, Azdarpour A, et al. Recent applications of ultrasonic waves in improved oil recovery: A review of techniques and results. Ultrasonics 2021;110:106288. [CrossRef]
- Saha A, Mathur M. Ultrasound Physics & Overview. Ultrasound Fundam., Cham: Springer International Publishing; 2021, p. 3–16. [CrossRef]
- Timothy J M, Lorimer JP. Applied sonochemistry – the uses of power ultrasound in chemistry and processing. 1st ed. Weinheim: Wiley-VCH Verlag; 2002.
- Dengaev A, V. , Khelkhal MA, Getalov AA, Baimukhametov GF, Kayumov AA, Vakhin A V., et al. Innovations in Oil Processing: Chemical Transformation of Oil Components through Ultrasound Assistance. Fluids 2023;8:108. [CrossRef]
- Lee S, Lee Y, Lee JW. Effect of ultrasound on the properties of biodegradable polymer blends of poly(lactic acid) with poly(butylene adipate-co-terephthalate). Macromol Res 2007;15:44–50. [CrossRef]
- Gunes K, Isayev AI, Li X, Wesdemiotis C. Fast in situ copolymerization of PET/PEN blends by ultrasonically-aided extrusion. Polymer (Guildf) 2010;51:1071–81. [CrossRef]
- Swain SK, Isayev AI. PA6/clay nanocomposites by continuous sonication process. J Appl Polym Sci 2009;114:2378–87. [CrossRef]
- Mata-Padilla JM, Avila-Orta CA, Medellin-Rodriguez FJ, Hernandez-Hernandez E, Jimenez-Barrera RM, Cruz-Delgado VJ, et al. Structural and Morphological Studies on the Deformation Behavior of Polypropylene/Multi-Walled Carbon Nanotubes Nanocomposites Prepared Through Ultrasound-Assisted Melt Extrusion Process. J Polym Sci PART B-POLYMER Phys 2015;53:475–91. [CrossRef]
- Kim KY, Nam GJ, Lee JW. Continuous extrusion of long-chain-branched polypropylene/clay nanocomposites with high-intensity ultrasonic waves. Compos Interfaces 2007;14:533–44. [CrossRef]
- Gallego-Juárez, JA. Power ultrasonics: new technologies and applications for fluid processing. Ultrason. Transducers, Elsevier; 2012, p. 476–516. [CrossRef]
- Price GJ, West PJ, Smith PF. Control of polymer structure using power ultrasound. Ultrason Sonochem 1994;1:S51–7. [CrossRef]
- Coates PD, Barnes SE, Sibley MG, Brown EC, Edwards HGM, Scowen IJ. In-process vibrational spectroscopy and ultrasound measurements in polymer melt extrusion. Polymer (Guildf) 2003;44:5937–49. [CrossRef]
- Wu, J. Determination of velocity and attenuation of shear waves using ultrasonic spectroscopy. J Acoust Soc Am 1996;99:2871–5. [CrossRef]
- Verdier C, Piau M. Analysis of the morphology of polymer blends using ultrasound. J Phys D Appl Phys 1996;29:1454–61. [CrossRef]
- Kim K-B, Lee S, Kim M-S, Cho B-K. Determination of apple firmness by nondestructive ultrasonic measurement. Postharvest Biol Technol 2009;52:44–8. [CrossRef]
- Abu-Zahra, NH. Measuring melt density in polymer extrusion processes using shear ultrasound waves. Int J Adv Manuf Technol 2004;24:661–6. [CrossRef]
- Abu-Zahra NH, Seth A. In-process density control of extruded foam PVC using wavelet packet analysis of ultrasound waves. Mechatronics 2002;12:1083–95. [CrossRef]
- Erwin L, Dohner J. Measurement of mixing in polymer melts by focused ultrasound. Polym Eng Sci 1984;24:1277–82. [CrossRef]
- Brown EC, Olley P, Coates PD. In line melt temperature measurement during real time ultrasound monitoring of single screw extrusion. Plast Rubber Compos 2000;29:3–13. [CrossRef]
- Wang D, Min K. In-line monitoring and analysis of polymer melting behavior in an intermeshing counter-rotating twin-screw extruder by ultrasound waves. Polym Eng Sci 2005;45:998–1010. [CrossRef]
- Dias Pereira, JM. The history and technology of oscilloscopes. IEEE Instrum Meas Mag 2006;9:27–35. [CrossRef]
- Kumar V, Chandrasekhar N, Albert SK, Jayapandian J. Analysis of arc welding process using Digital Storage Oscilloscope. Measurement 2016;81:1–12. [CrossRef]
- Savyasachi N, Chandrasekar N, Albert SK, Surendranathan AO. Evaluation of Arc Welding Process Using Digital Storage Oscilloscope and High Speed Camera. Indian Weld J 2015;48:35. [CrossRef]
- Mohammadian E, Parak M, Babakhani P. The Effects of Properties of Waves on the Recovery of Ultrasonic Stimulated Waterflooding. Pet Sci Technol 2014;32:1000–8. [CrossRef]
- Dengaev A, V. , Kayumov AA, Getalov AA, Aliev FA, Baimukhametov GF, Sargin B V., et al. Chemical Viscosity Reduction of Heavy Oil by Multi-Frequency Ultrasonic Waves with the Main Harmonics of 20–60 kHz. Fluids 2023;8:136. [CrossRef]
- Chen J, Chen Y, Li H, Lai S-Y, Jow J. Physical and chemical effects of ultrasound vibration on polymer melt in extrusion. Ultrason Sonochem 2010;17:66–71. [CrossRef]
- Isayev AI, Wong CM, Zeng X. Effect of oscillations during extrusion on rheology and mechanical properties of polymers. Adv Polym Technol 1990;10:31–45. [CrossRef]
- Li Y, Li J, Guo S, Li H. Mechanochemical degradation kinetics of high-density polyethylene melt and its mechanism in the presence of ultrasonic irradiation. Ultrason Sonochem 2005;12:183–9. [CrossRef]
- Espinoza-Gonzalez C, Avila-Orta C, Martinez-Colunga G, Lionetto F, Maffezzoli A. A Measure of CNTs Dispersion in Polymers With Branched Molecular Architectures by UDMA. IEEE Trans Nanotechnol 2016;15:731–7. [CrossRef]
- Ávila Orta CA, Martínez Colunga JG, Bueno Baqués D, Raudry López CE, Cruz Delgado VJ, González Morones P, et al. Proceso continuo asistido por ultrasonido de frecuencia y amplitud variable, para la preparación de nanocompuestos a base de polímeros y nanopartículas. 323756B, 2014.
- Cao Y, Li H. Influence of ultrasound on the processing and structure of polypropylene during extrusion. Polym Eng Sci 2002;42:1534–40. [CrossRef]
- Medellín Rodríguez FJ, Gudiño Rivera J, Rodríguez Velázquez JG, Lara Sánchez JF, Salinas Hernández M. Gradually modified fibers of Yucca Filifera ( Asparagaceae ) as biodegradable and mechanical reinforcement of polypropylene composites. Polym Compos 2024;45:751–62. [CrossRef]
Figure 1.
Schematic representation of the ultrasound-assisted melt extrusion process and oscillograms capture.
Figure 1.
Schematic representation of the ultrasound-assisted melt extrusion process and oscillograms capture.
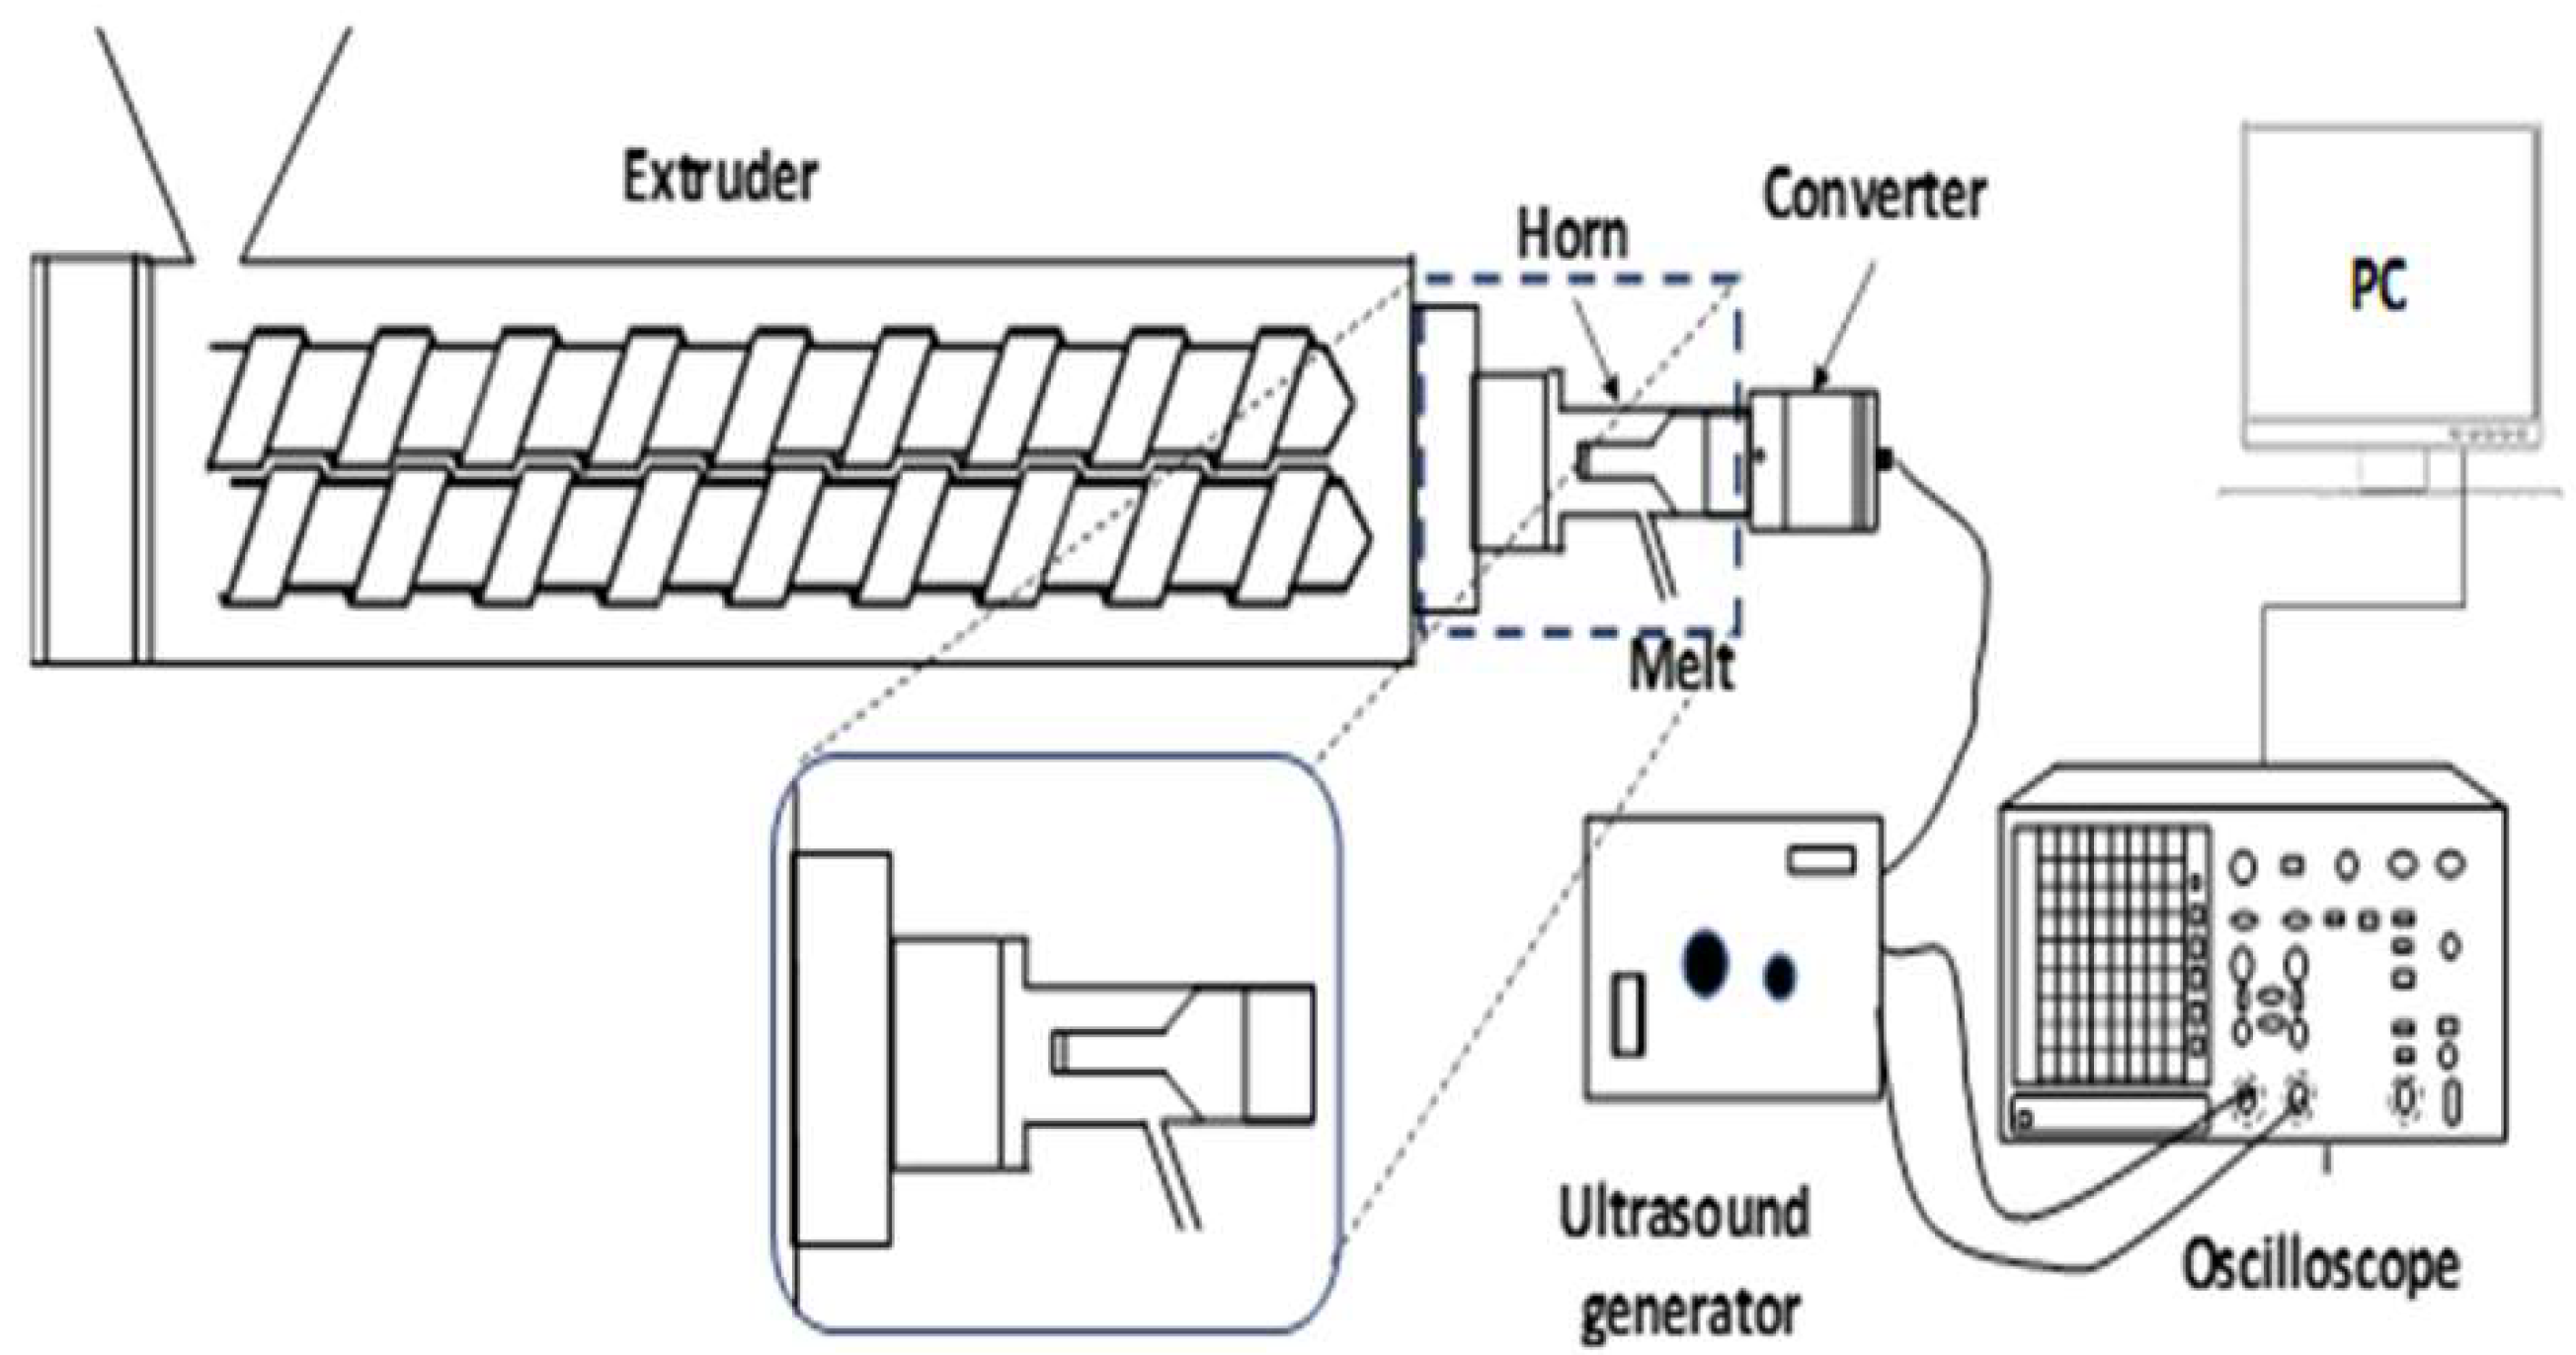
Figure 2.
Schematic representation of the energy change on the system from electric to mechanical and interaction with polymer.
Figure 2.
Schematic representation of the energy change on the system from electric to mechanical and interaction with polymer.
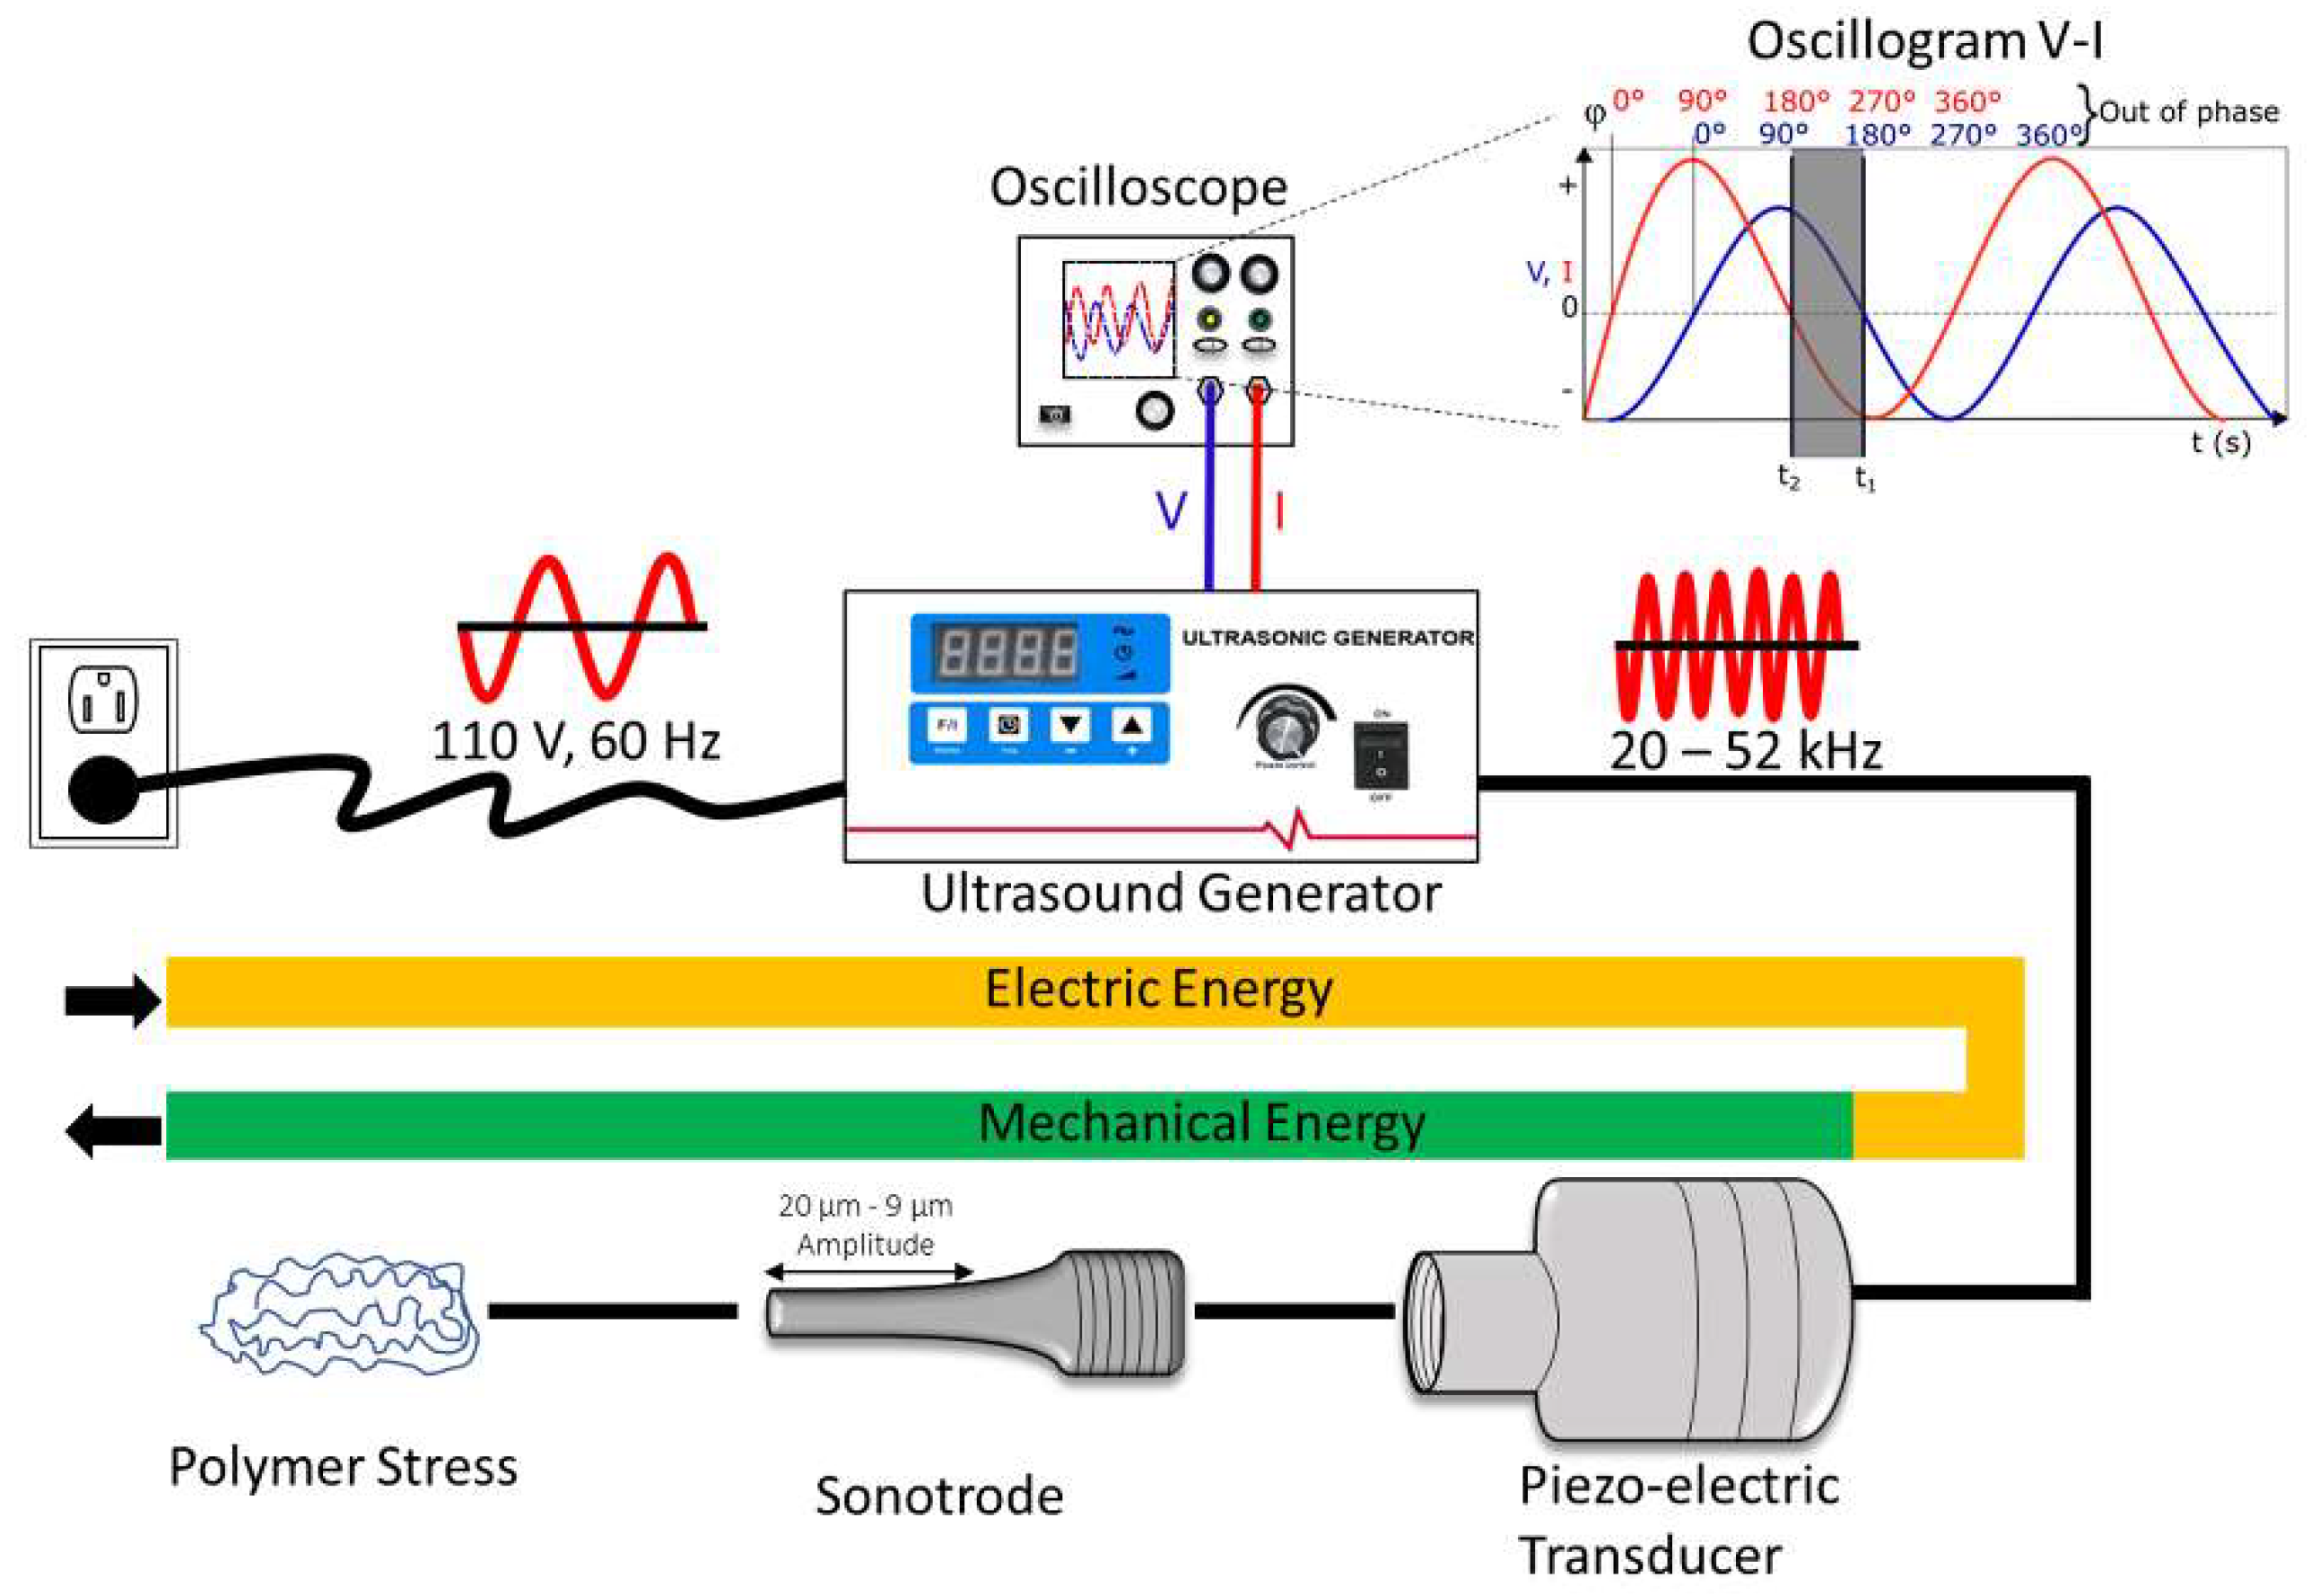
Figure 3.
Oscillograms obtained from ultrasonic waves applied under different conditions.
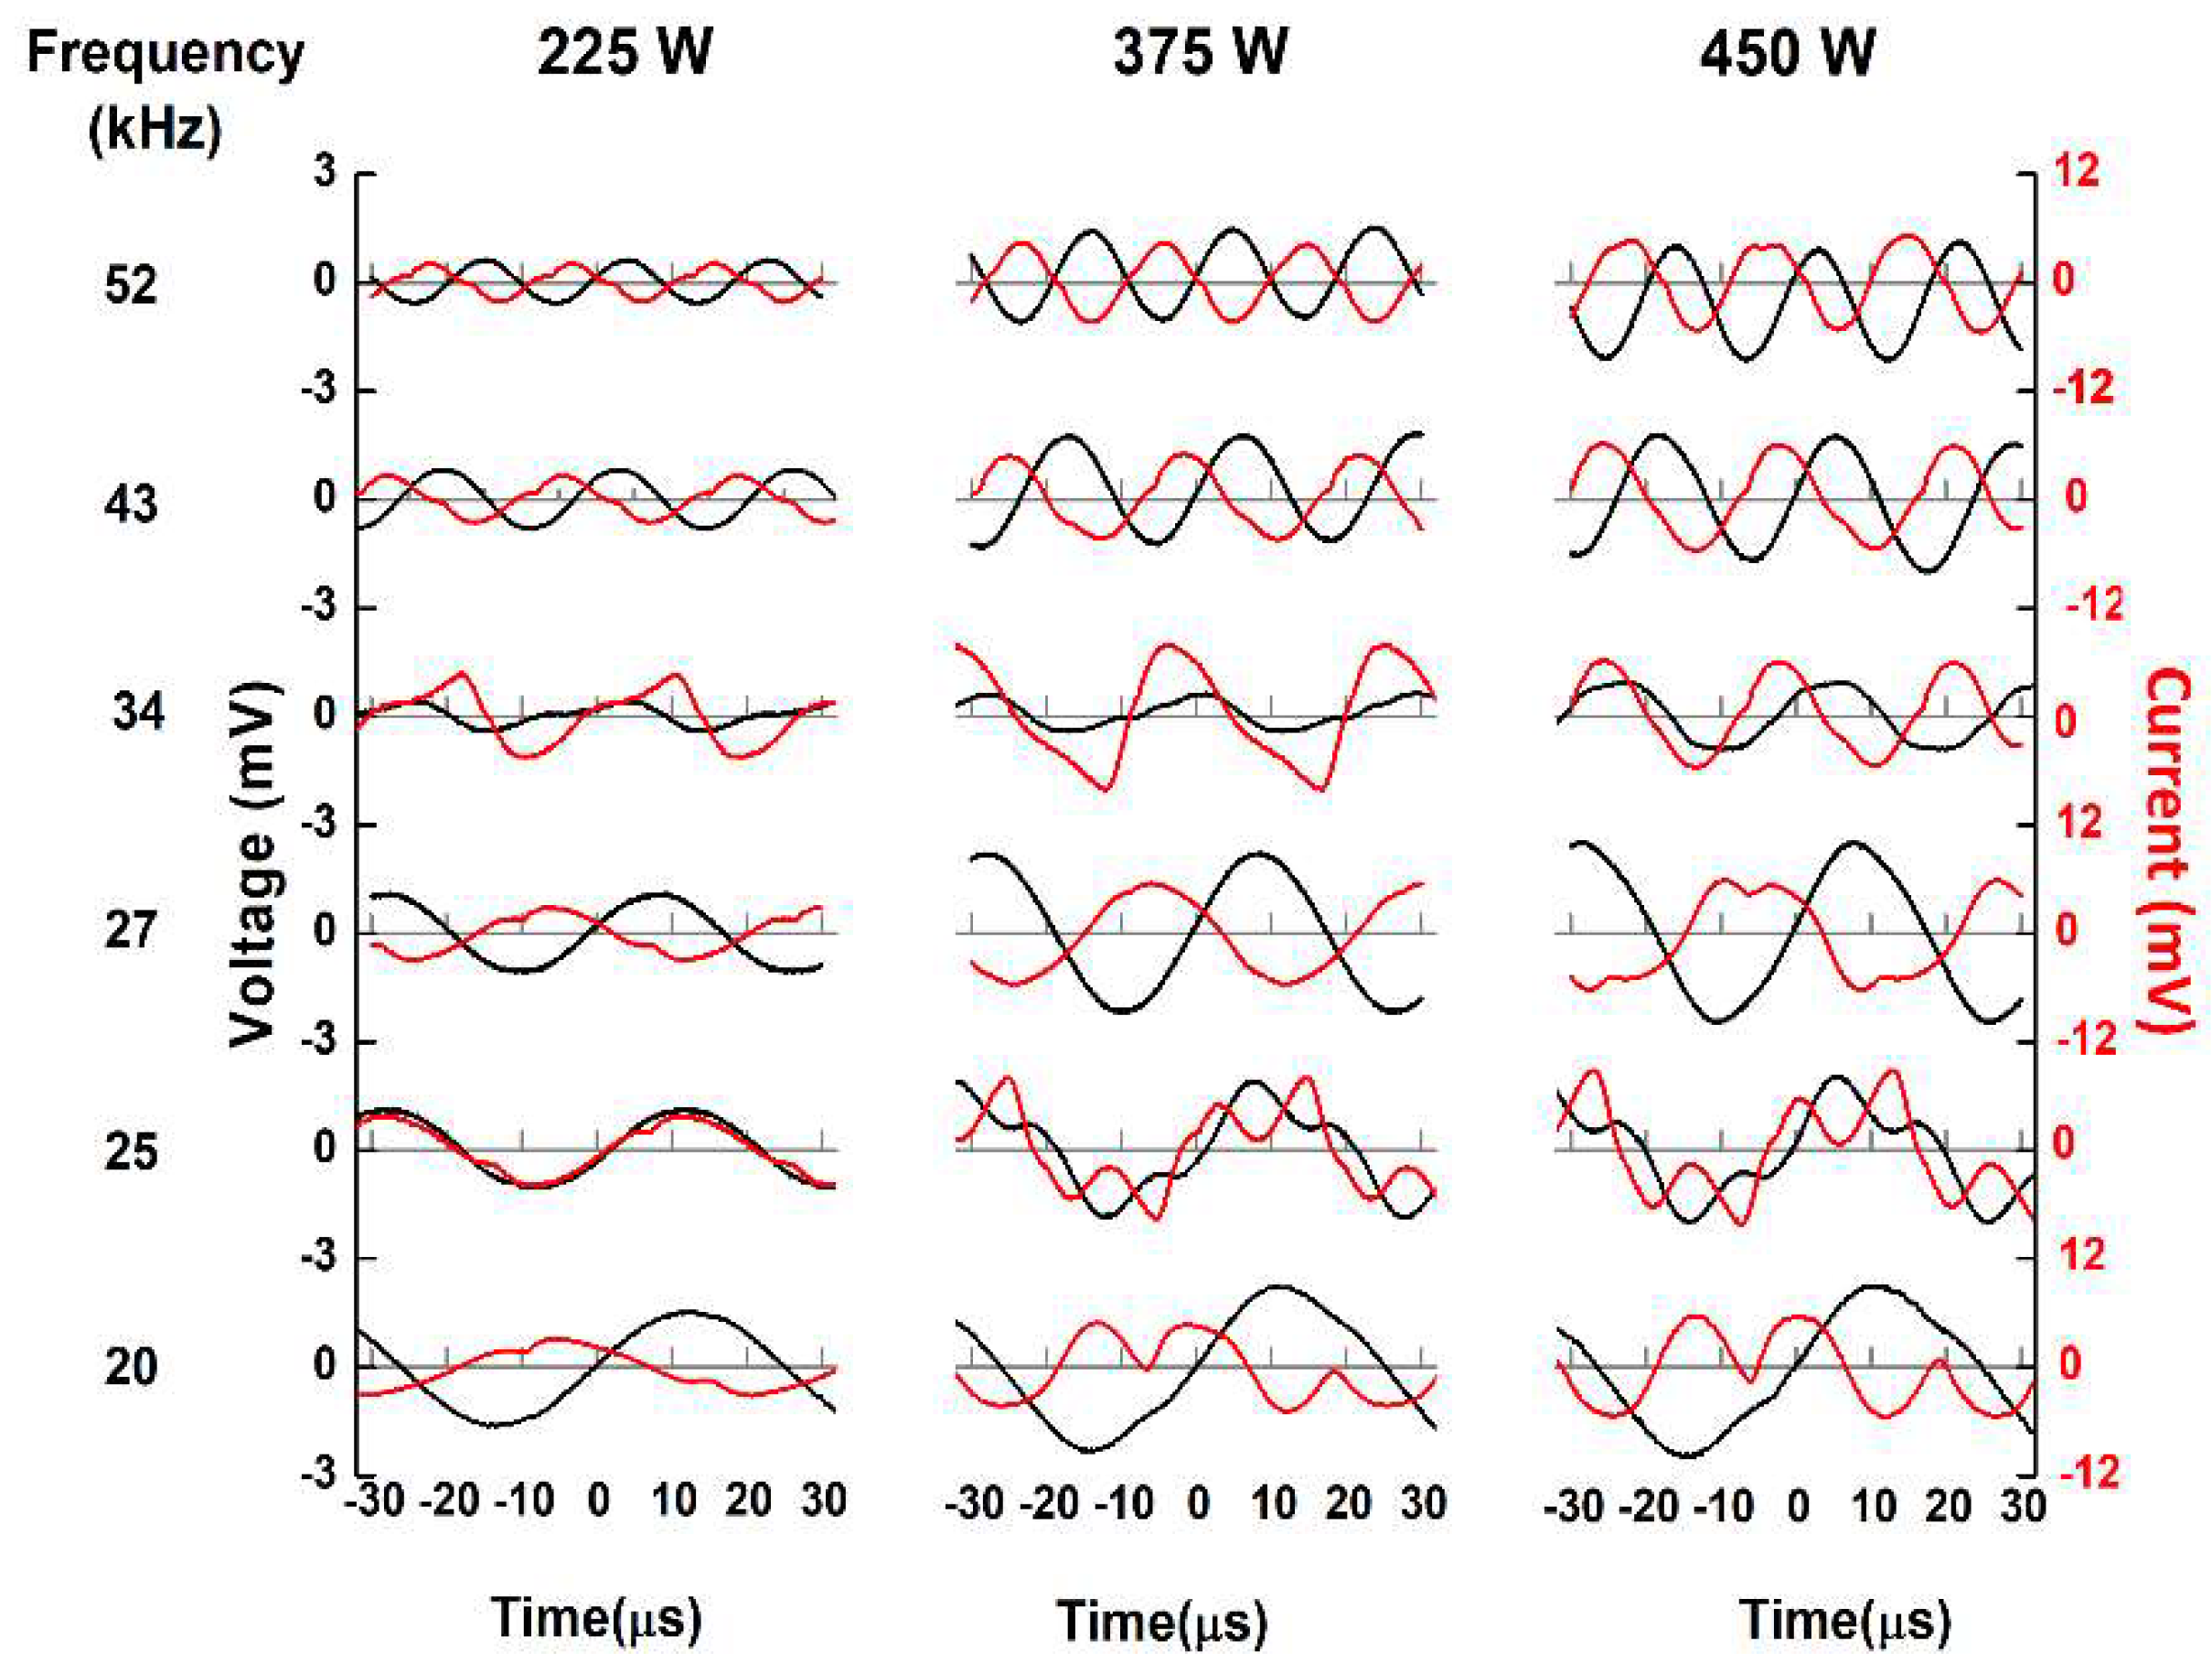
Figure 4.
GPC traces of extruded samples under different conditions.
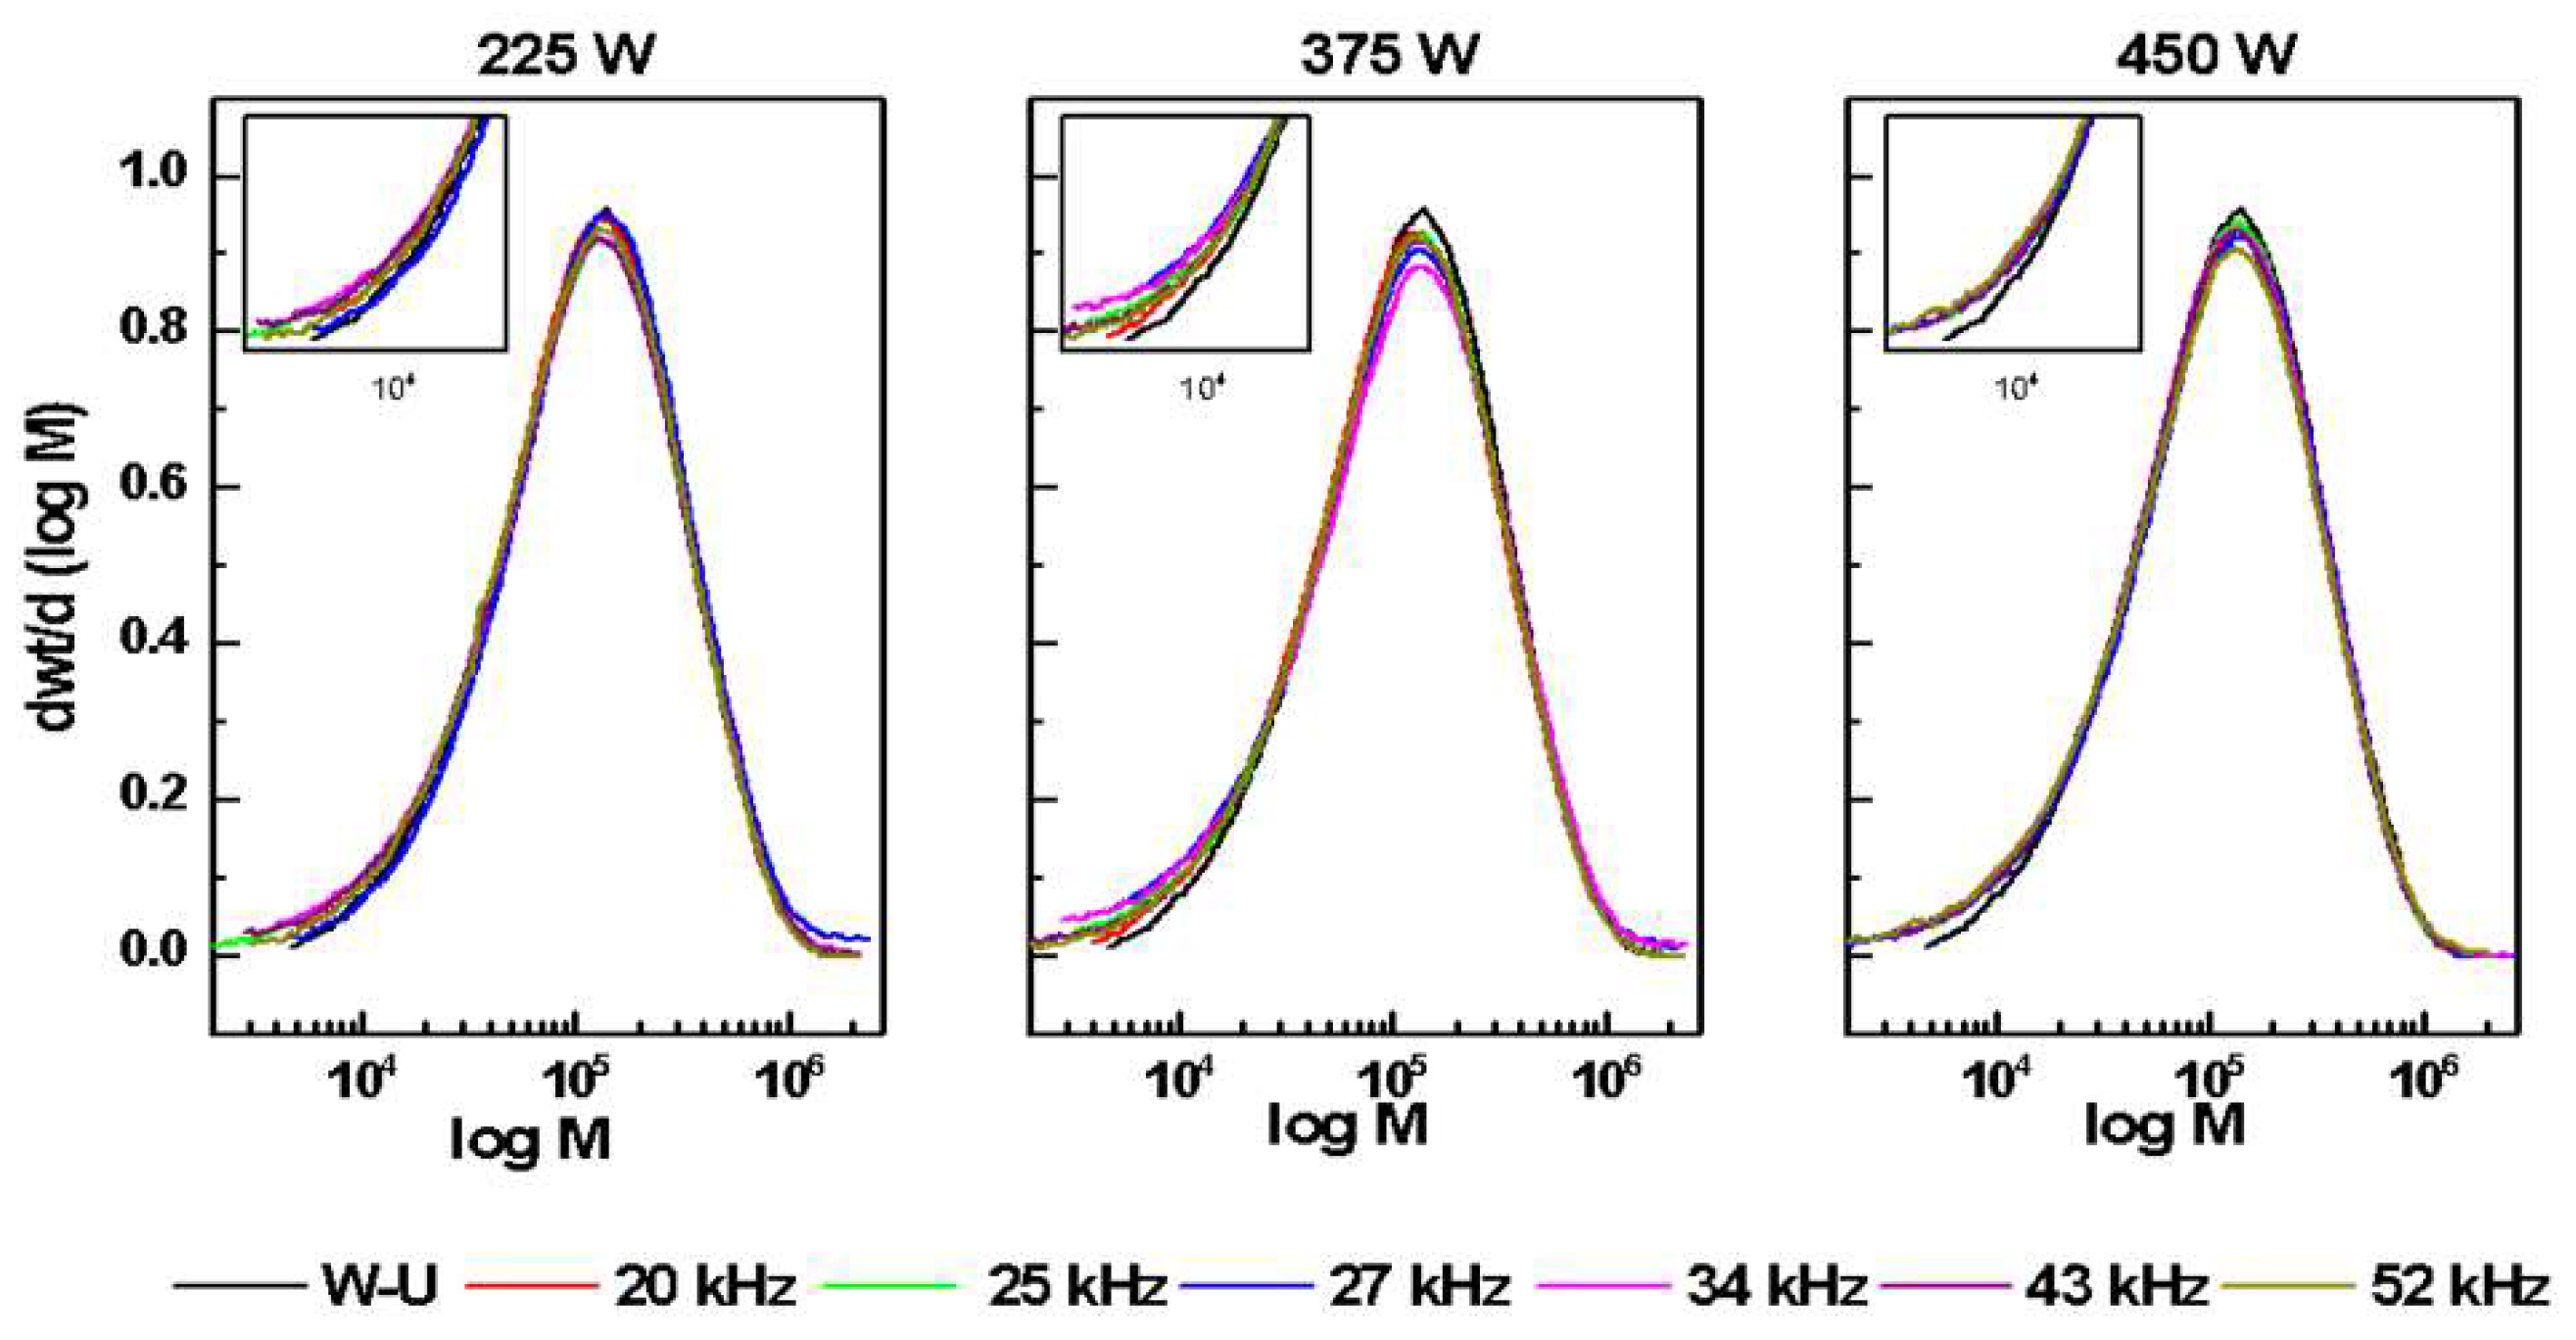
Figure 5.
MFI values for samples processed under different conditions.
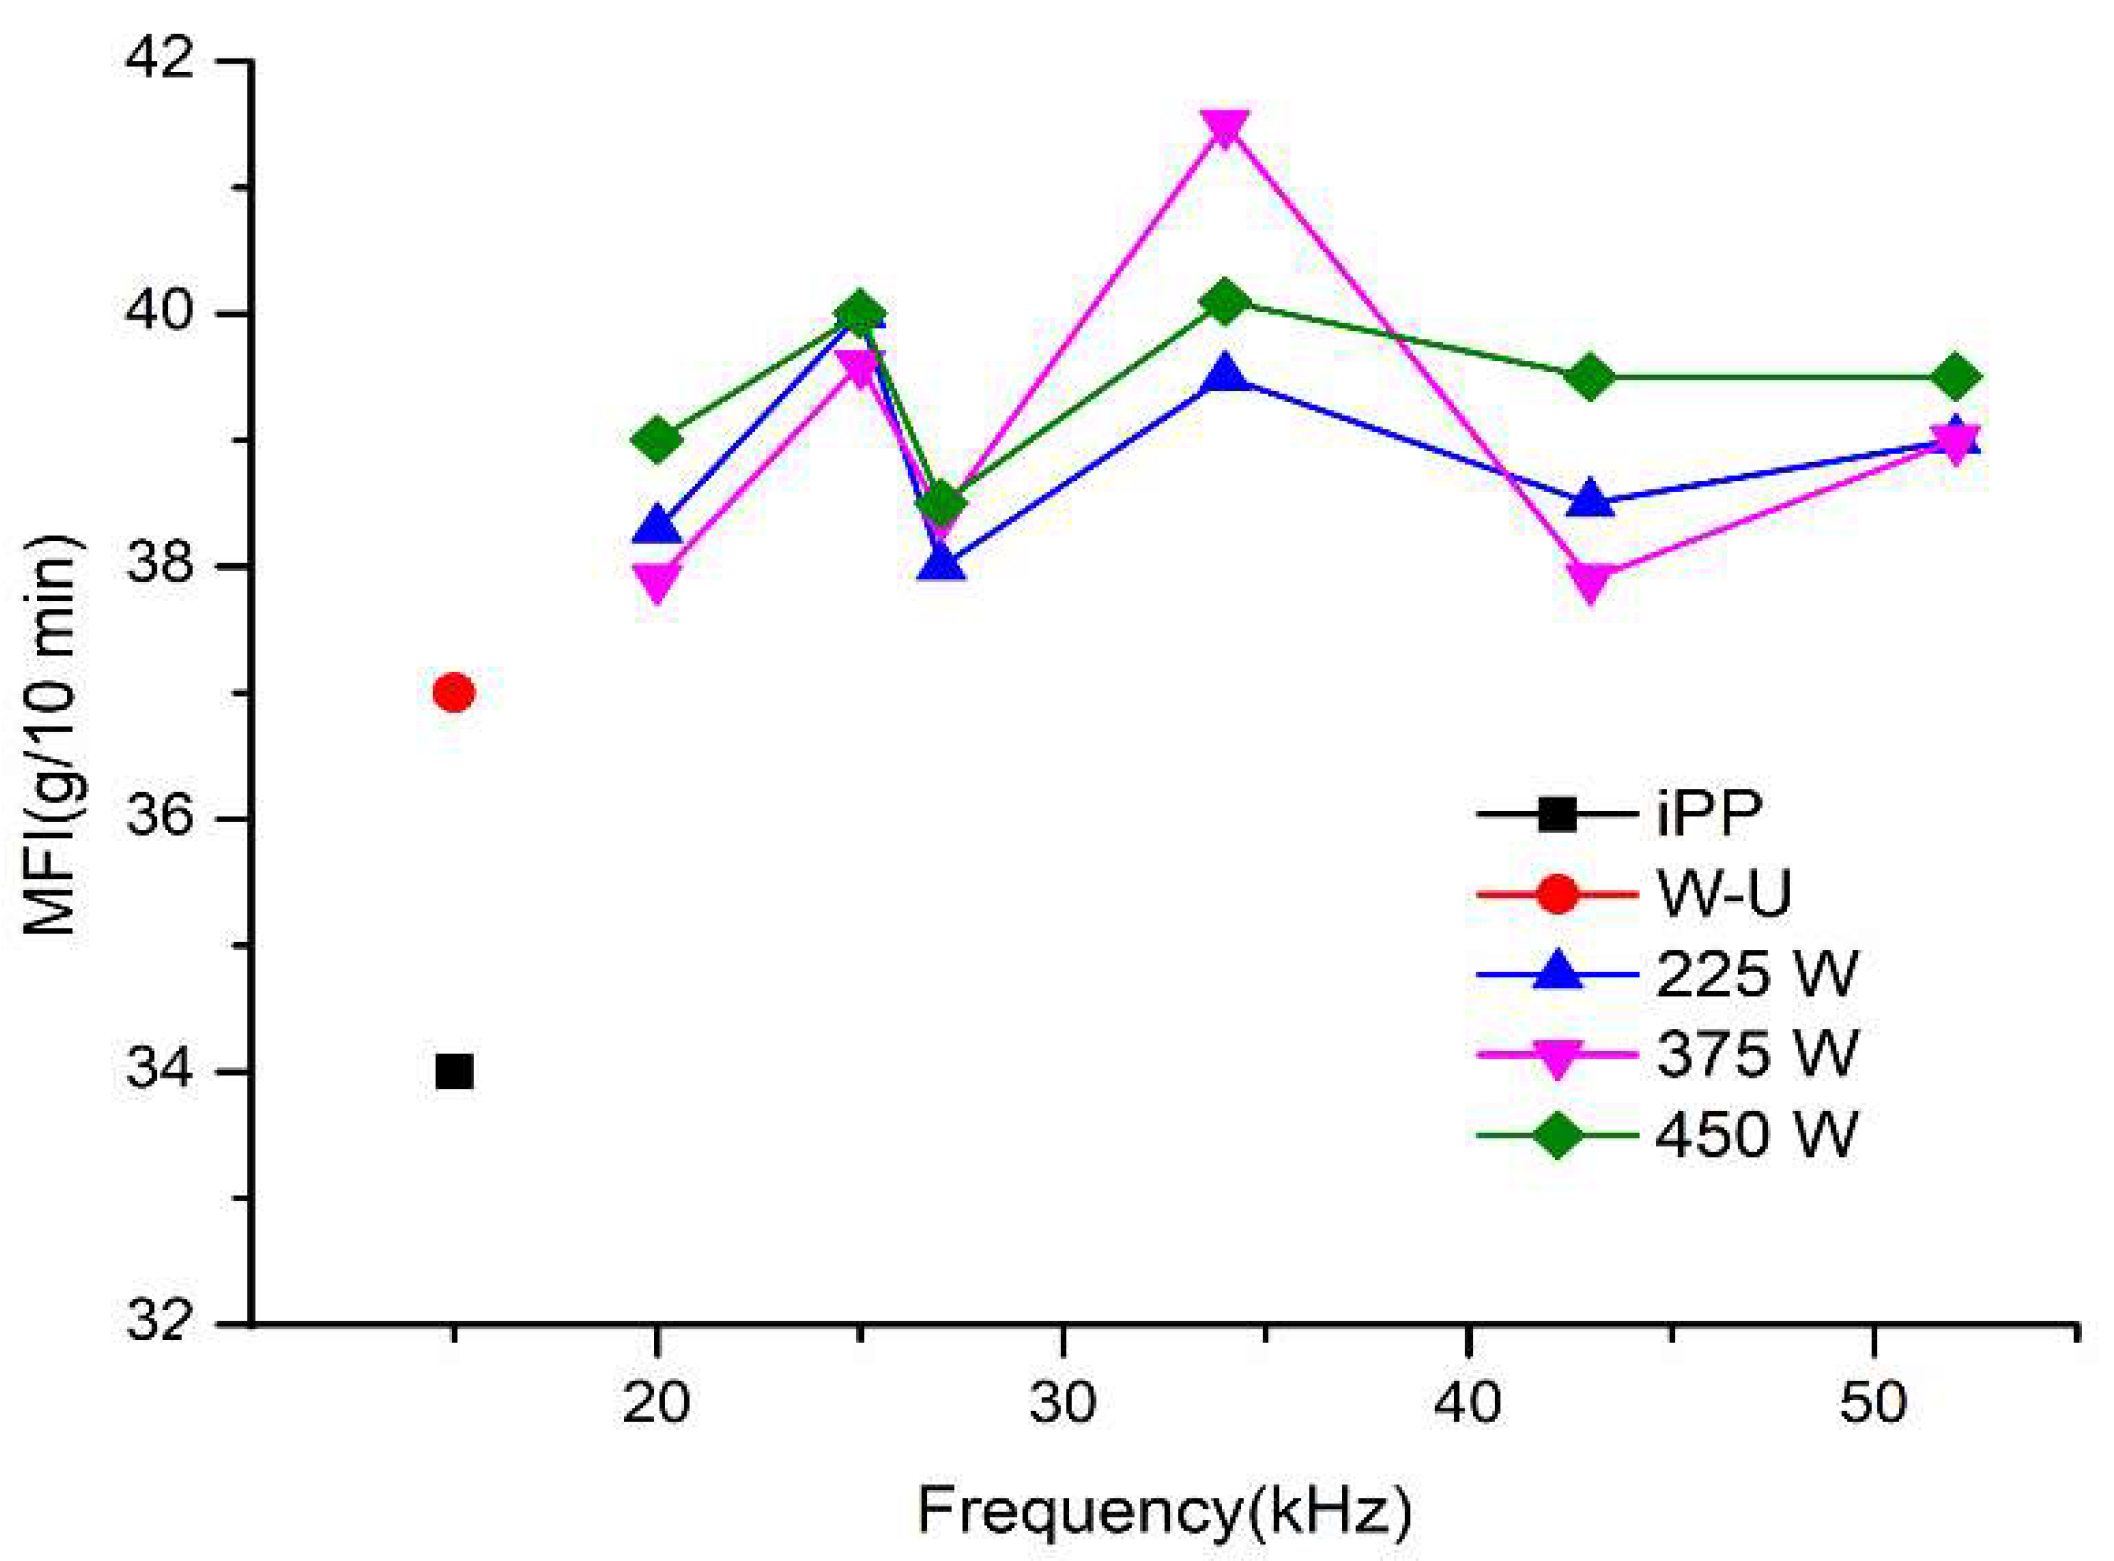
Figure 6.
Capillary rheometry for samples processed under different conditions.
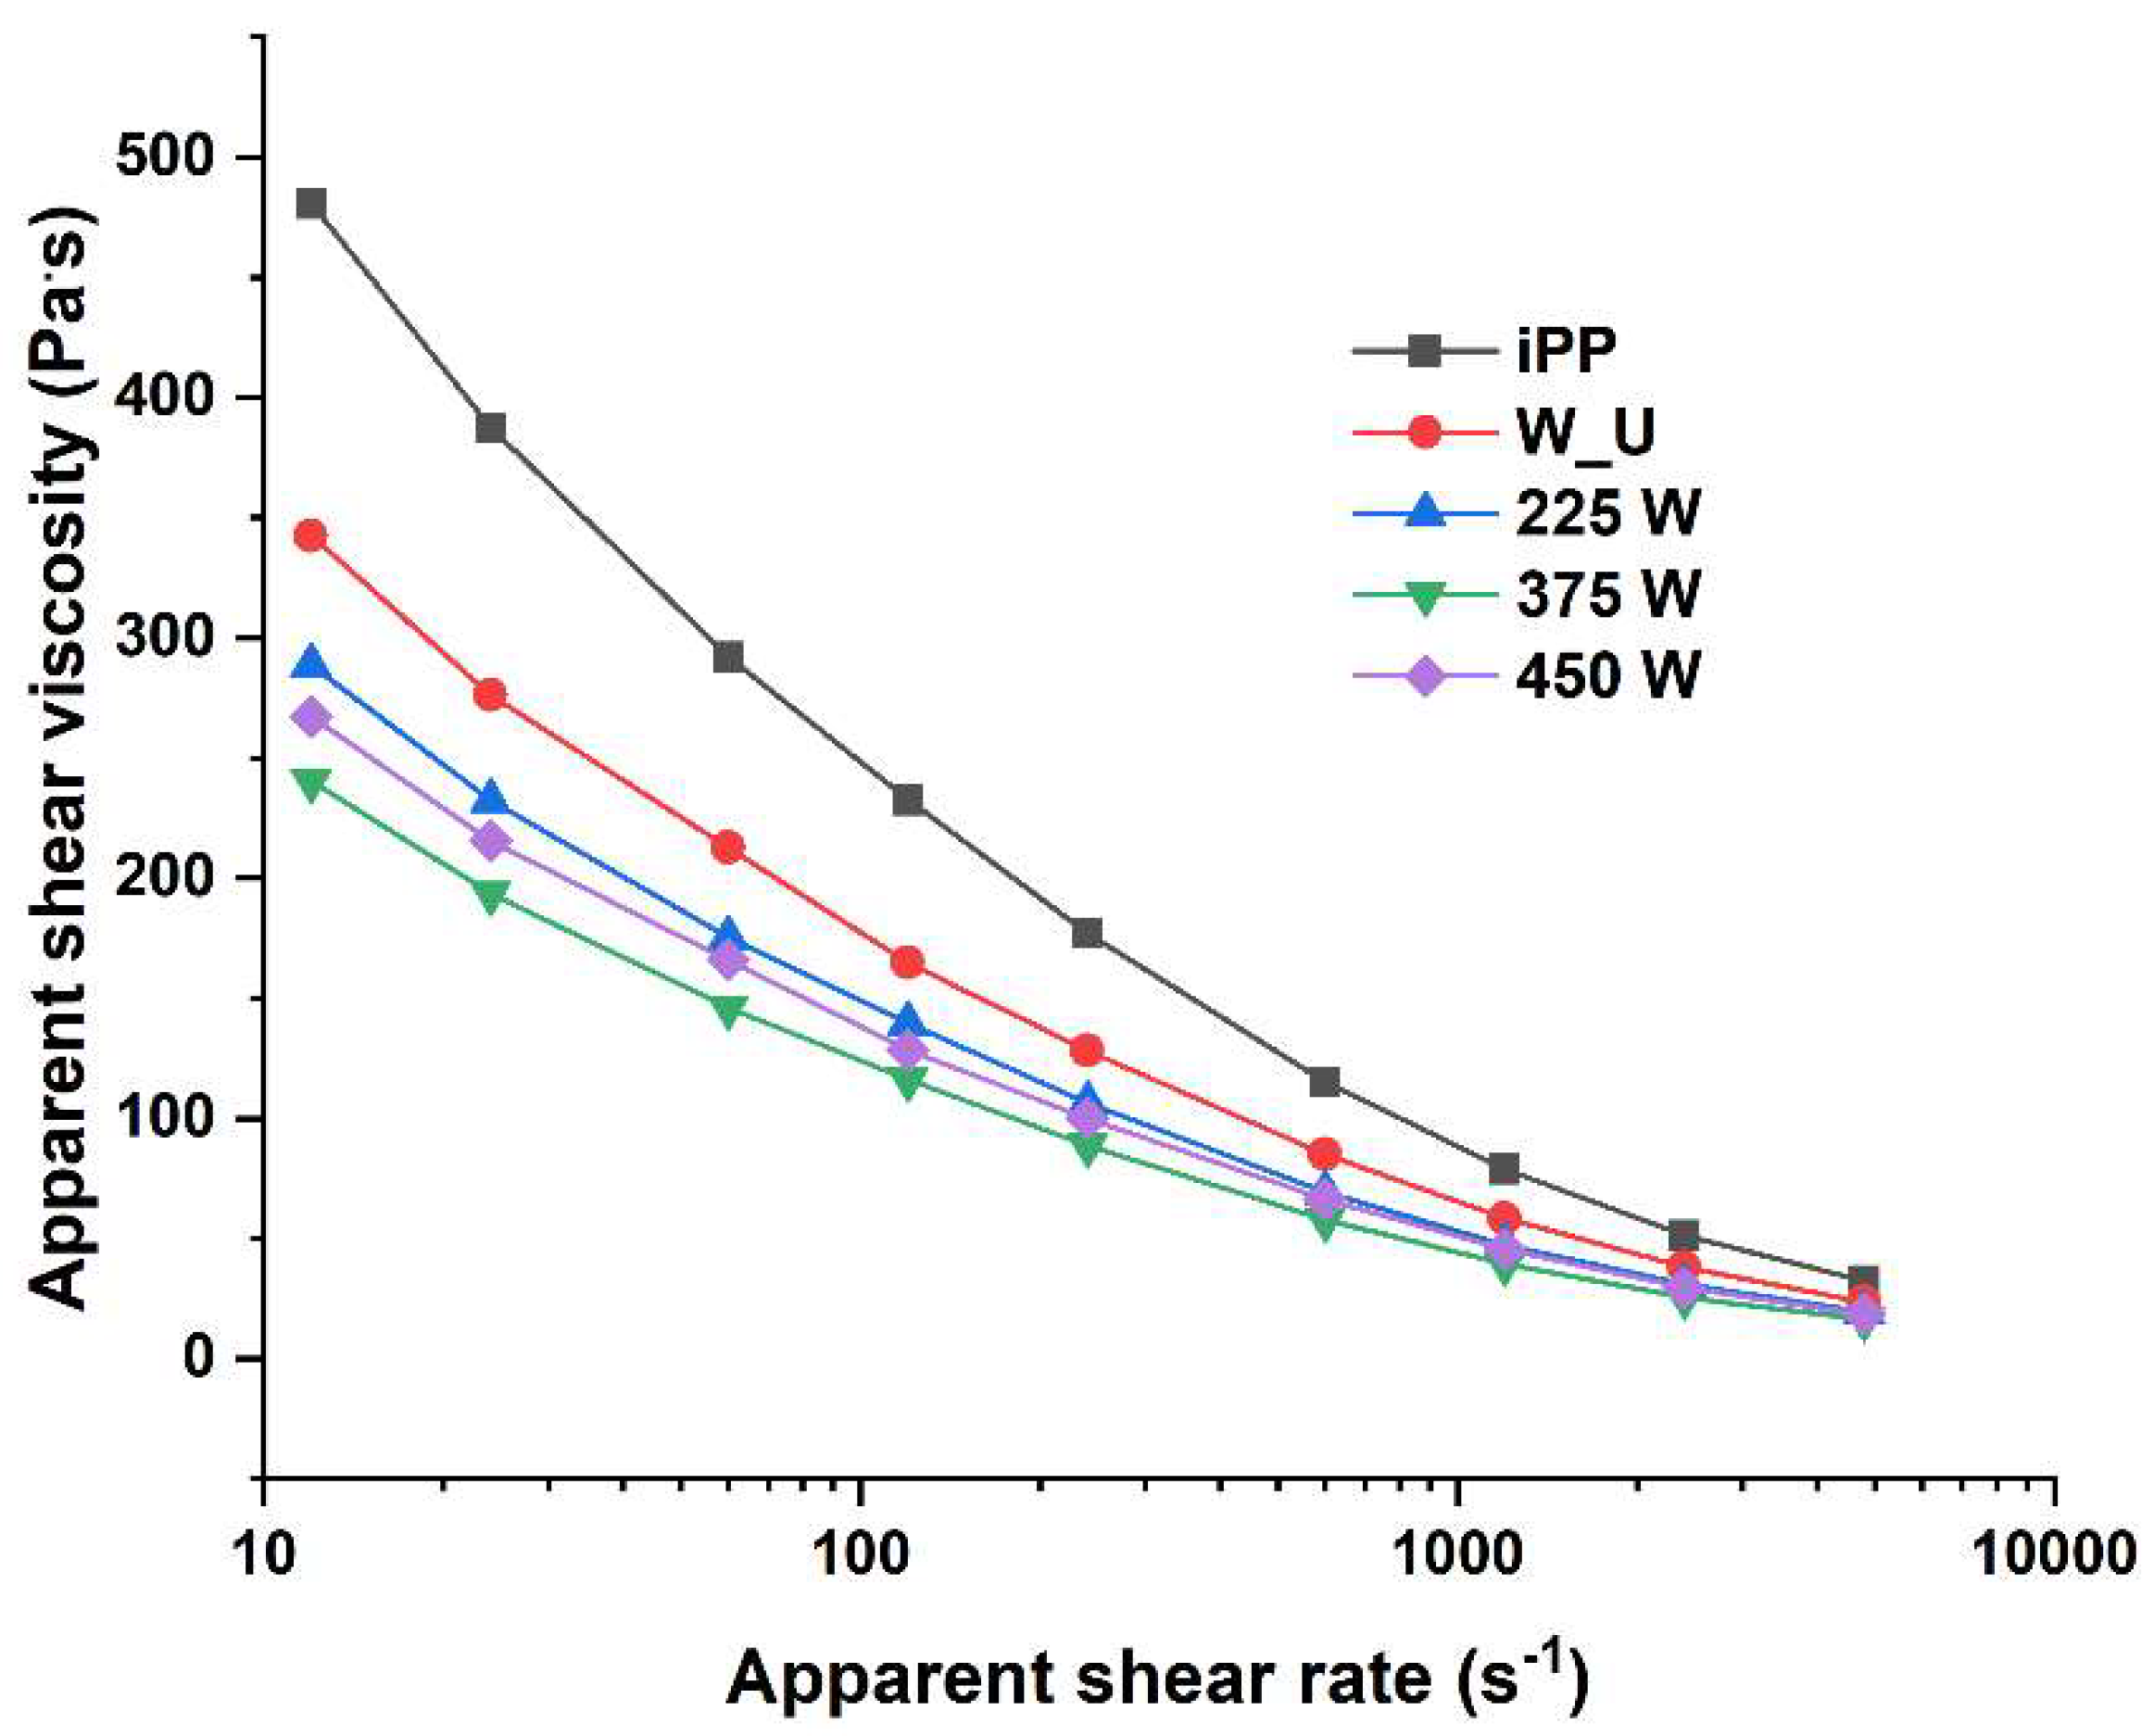
Figure 7.
Diagram of the proposed mechanism of the effect of ultrasonic waves during the ultrasound-assisted melt extrusion process.
Figure 7.
Diagram of the proposed mechanism of the effect of ultrasonic waves during the ultrasound-assisted melt extrusion process.
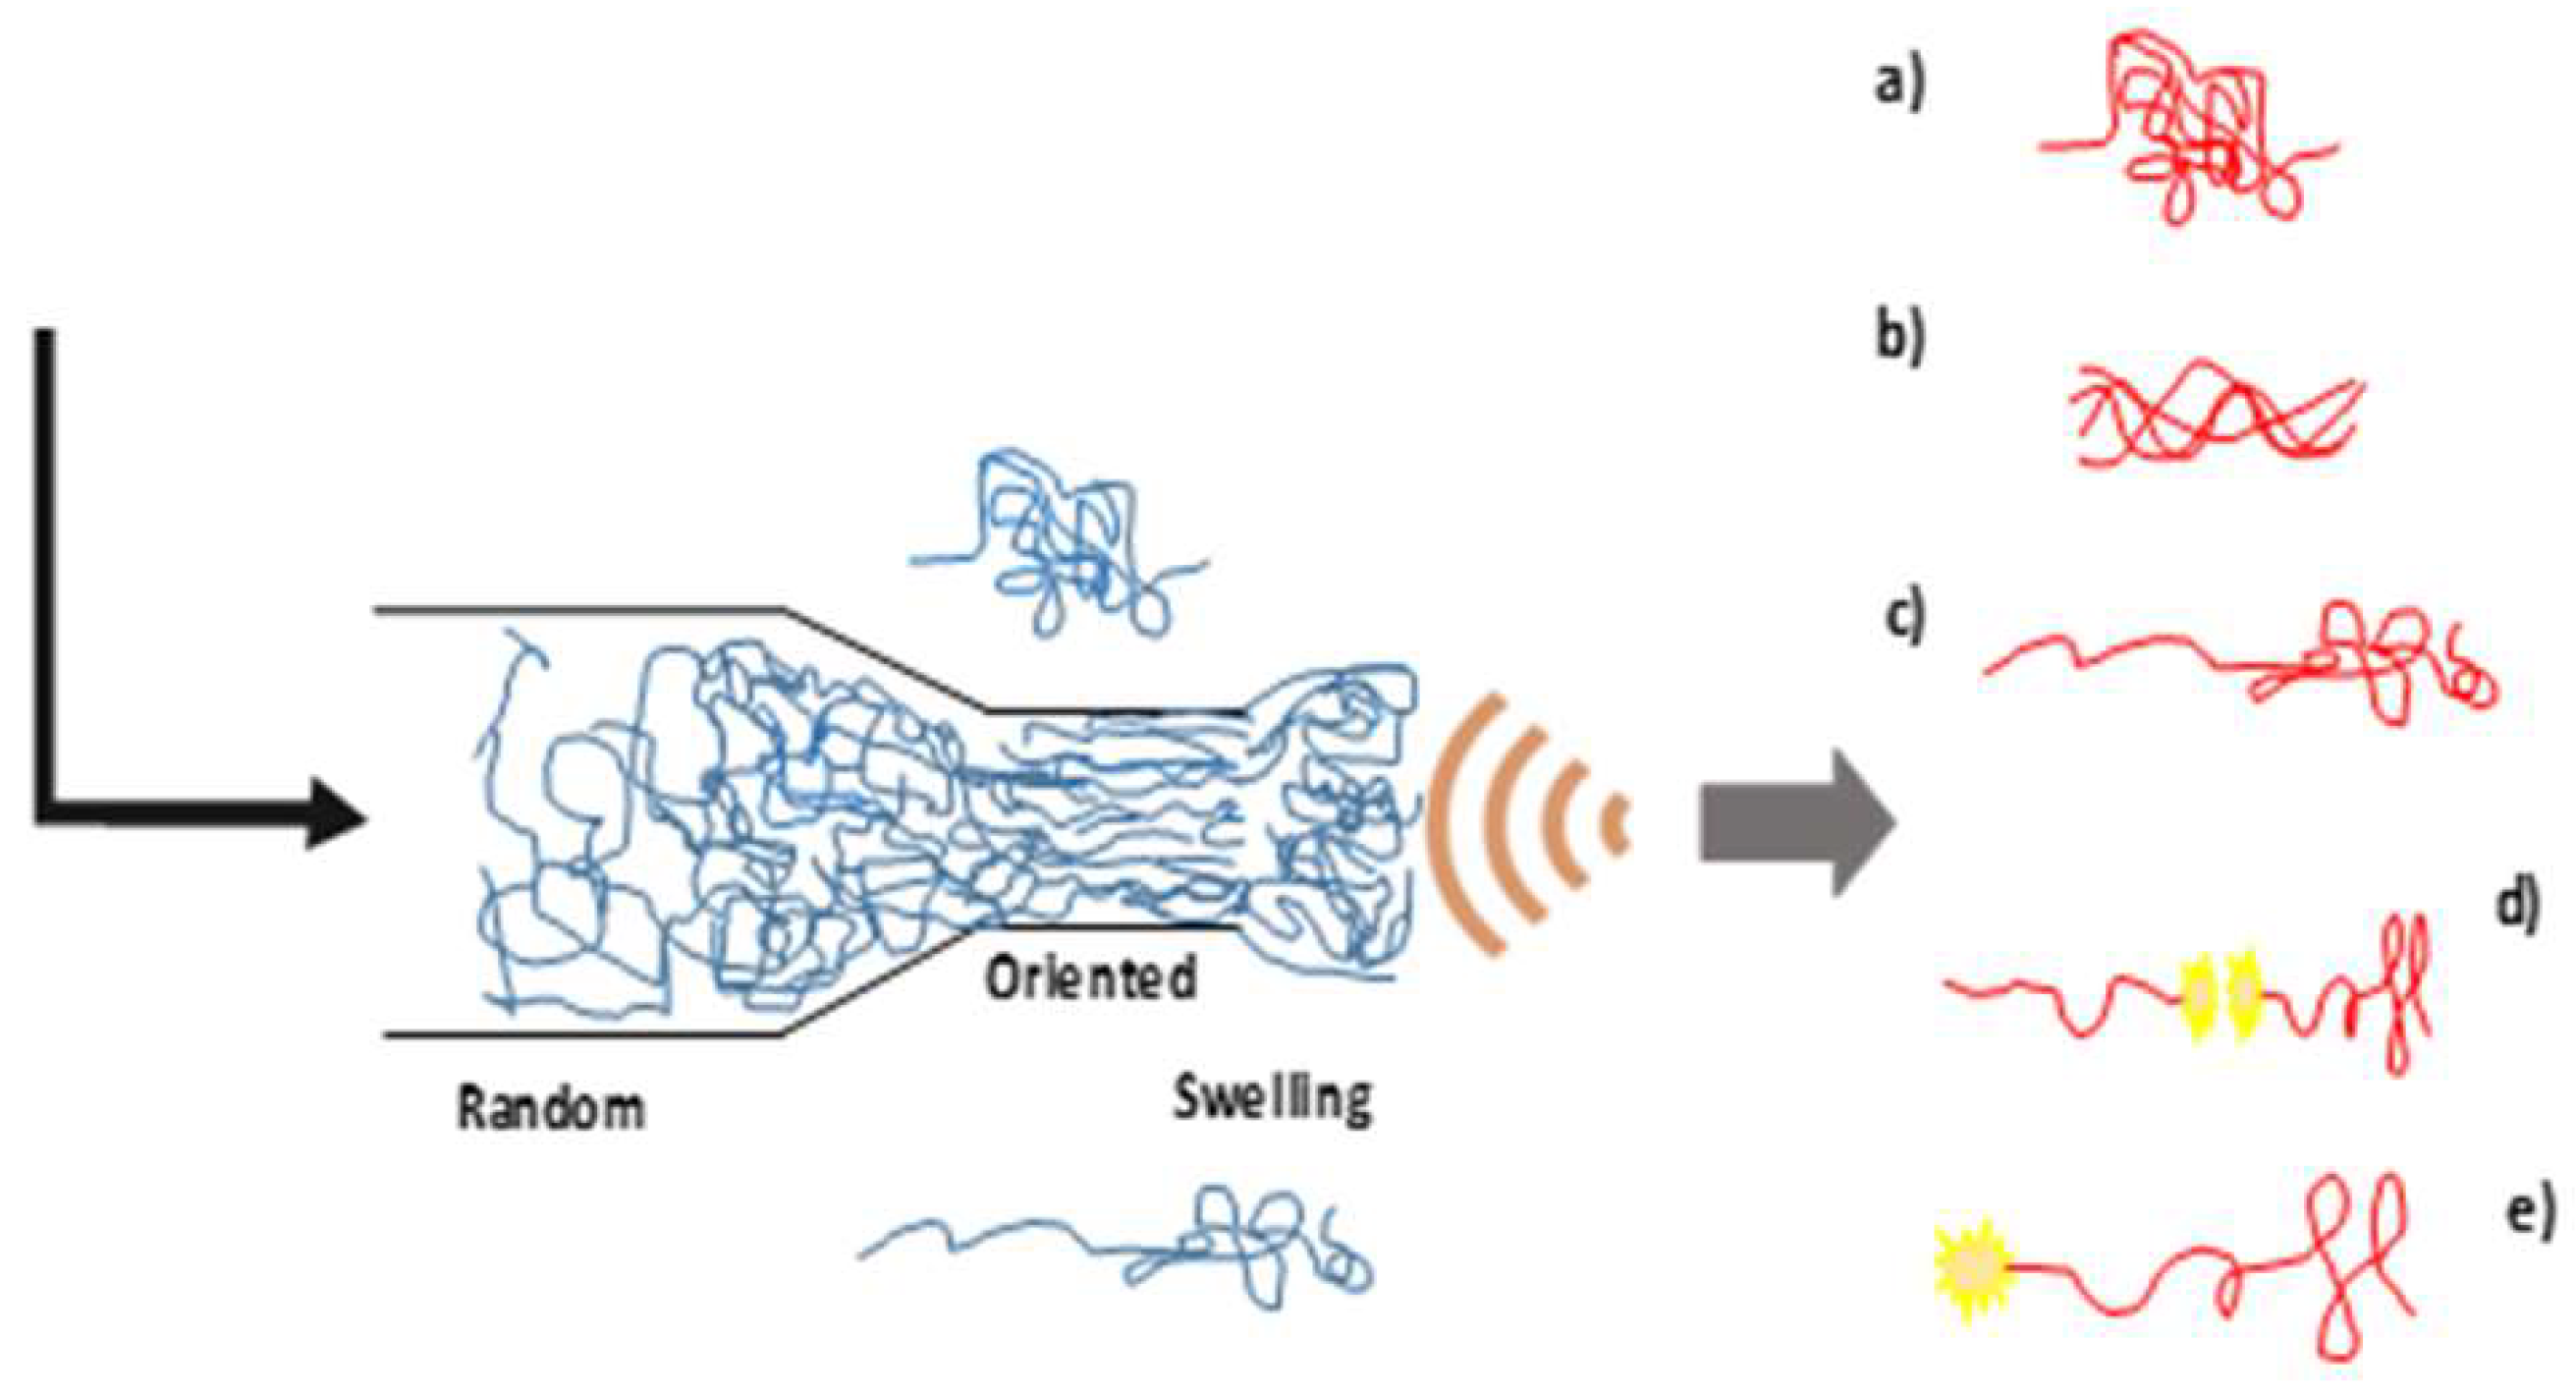

Table 1.
Values of the period, maximum voltage, maximum current, and phase shift under different conditions.
Table 1.
Values of the period, maximum voltage, maximum current, and phase shift under different conditions.
| Power (W) | Frequency (kHz) | Period (s) | Vmax (mV) | Imax (mV) | Phase shift (°) |
| W_U | - | - | - | - | - |
| 225 | 20 | 5.0 x 10⁻⁵ | 1.6 | 3.2 | 133 |
| 25 | 4.0 x 10⁻⁵ | 1.2 | 3.8 | 0 | |
| 27 | 3.7 x 10⁻⁵ | 1.2 | 3.0 | 144 | |
| 34 | 2.9 x 10⁻⁵ | 0.5 | 4.6 | 75 | |
| 43 | 2.3 x 10⁻⁵ | 0.8 | 2.6 | 121 | |
| 52 | 1.9 x 10⁻⁵ | 0.7 | 2.2 | 151 | |
| 375 | 20 | 5.0 x 10⁻⁵ | 2.2 | 5.0 | 132 |
| 25 | 4.0 x 10⁻⁵ | 2.0 | 8.2 | 29 | |
| 27 | 3.7 x 10⁻⁵ | 2.2 | 5.5 | 139 | |
| 34 | 2.9 x 10⁻⁵ | 1.2 | 7.8 | 13 | |
| 43 | 2.3 x 10⁻⁵ | 1.6 | 4.7 | 108 | |
| 52 | 1.9 x 10⁻⁵ | 1.8 | 4.5 | 180 | |
| 450 | 20 | 5.0 x 10⁻⁵ | 2.4 | 5.6 | 134 |
| 25 | 4.0 x 10⁻⁵ | 2.0 | 8.8 | 35 | |
| 27 | 3.7 x 10⁻⁵ | 2.5 | 5.9 | 139 | |
| 34 | 2.9 x 10⁻⁵ | 0.9 | 11.6 | 2 | |
| 43 | 2.3 x 10⁻⁵ | 1.9 | 6.3 | 114 | |
| 52 | 1.9 x 10⁻⁵ | 1.4 | 5.4 | 155 |
Table 2.
The molecular weight of the samples processed under different conditions.
| Power (W) | Frequency (kHz) |
Mw x 10-4 (g/g-mol) |
Mn x 10-4 (g/g-mol) |
Mw/Mn (dimensionless) |
| W_U | - | 17.48 | 6.70 | 2.6 |
| 225 | 20 | 16.80 | 6.34 | 2.6 |
| 25 | 16.58 | 5.10 | 3.2 | |
| 27 | 17.06 | 6.01 | 2.8 | |
| 34 | 16.98 | 5.62 | 3.0 | |
| 43 | 16.84 | 5.33 | 3.2 | |
| 52 | 16.72 | 5.83 | 2.9 | |
| 375 | 20 | 17.16 | 5.97 | 2.9 |
| 25 | 16.82 | 5.45 | 3.1 | |
| 27 | 17.57 | 5.71 | 3.1 | |
| 34 | 17.84 | 4.86 | 3.7 | |
| 43 | 16.68 | 5.01 | 3.3 | |
| 52 | 16.70 | 5.26 | 3.2 | |
| 450 | 20 | 16.74 | 6.08 | 2.8 |
| 25 | 16.76 | 5.97 | 2.8 | |
| 27 | 17.02 | 5.22 | 3.3 | |
| 34 | 17.00 | 6.35 | 2.7 | |
| 43 | 16.66 | 5.58 | 3.0 | |
| 52 | 16.86 | 4.91 | 3.4 |
Disclaimer/Publisher’s Note: The statements, opinions and data contained in all publications are solely those of the individual author(s) and contributor(s) and not of MDPI and/or the editor(s). MDPI and/or the editor(s) disclaim responsibility for any injury to people or property resulting from any ideas, methods, instructions or products referred to in the content. |
© 2025 by the authors. Licensee MDPI, Basel, Switzerland. This article is an open access article distributed under the terms and conditions of the Creative Commons Attribution (CC BY) license (http://creativecommons.org/licenses/by/4.0/).
Copyright: This open access article is published under a Creative Commons CC BY 4.0 license, which permit the free download, distribution, and reuse, provided that the author and preprint are cited in any reuse.


