Submitted:
31 March 2025
Posted:
31 March 2025
You are already at the latest version
Abstract
The Bundelkhand granodiorite (BG) constitutes the bulk of the granitoid complex in the Bundelkhand Craton and preserves the imprints of its evolution from magmatic to protracted hydrothermal stage as deduced from petrography. Hornblende thermobarometry and plagioclase – hornblende thermometry furnish pressure temperature ranges of 1.48 – 5.97 kbar and 523.6℃ – 724.2C whereas Ti-content in biotite furnishes a temperature range of 489℃ to 669℃. A very broad temperature history is retrieved from biotite-apatite pairs which vary from 824℃ – 394℃. Magmatic epidote preserves its primary texture and furnishes temperature as high as 573 °C while the hydrothermally altered grains furnish temperatures down to 160 °C. Chlorite thermometry furnishes a temperature range of ~217℃ to 340℃ by using the semi-empirical formulations. A near similar range of temperatures (95 ℃ to 400 ℃) have been obtained from fluid inclusion microthermometry. The residual and late-stage fluid in BG is dominantly a low saline aqueous fluid (~0 to 5 wt% NaCl eq) with a broader salinity value of ~0 to 21.06 wt% NaCl eq. with restricted occurrences of H2O-CO2/CO2 fluid. The aqueous-carbonic inclusions represent a high-temperature fluid > 330℃ corresponding to a pressure of 2.6kb which is correlated to the lower pressure value from hornblende barometry. Laser Raman microspectrometry reveals many silicate, oxide, and carbonate daughter / captive phases in the aqueous-carbonic inclusions. Thus, the Bundelkhand granodiorite preserves imprints of fluid activity at high temperatures corresponding to the initial stage of exsolution of CO2-charged fluid, to lower temperatures as a result of cooling, mixing with meteoric fluid that caused variations in salinity and prolonged internal evolution of the late-stage fluid. The fluid characteristics in BG domain is strikingly similar to that in the giant quartz reefs (Rout et al., 2022) even to the extent of identical solid phase bearing inclusions. Simulation of crystallization evolution of hydrous BG magma from liquidus temperature (~800 °C) and pressure of 3.5 kilo bars to 400 °C and 1500 bars was attempted. The results broadly reproduced the sequence of crystallization of primary minerals of observed chemistry and indicated high water content of the residual melt after 60% crystallization that quite explains the late-stage fluid activity. A broad contemporaneity of crystallization of quartz in BG (both matrix and veins) and formation of giant quartz reef from the same late-stage fluid can thus be surmised.
Keywords:
Granodiorite
; Thermobarometry
; Fluid Inclusions
; Raman spectra
; PELE simulation
1. Introduction
Granitoids are the results of crust-mantle interactions at variable scales in diverse tectono-magmatic regimes [1]. Once formed, the granitic magma ascends through the crust before its final arrest within the crust, dictated by the rheological contrast of the magma and the surrounding [2,3]. The P-T path of evolution of the felsic hydrous magma is expected to be imprinted in mineral phases formed from the early magmatic stages and later through exsolution of the magmatic volatile phase and late-stage hydrothermal activity at lower P-T conditions, manifest deuteric alterations of the primary minerals and precipitation of secondary minerals from the hydrothermal fluid evident from fluid inclusions.
The Bundelkhand craton (BC) occupies the North-Central part of the Indian sub-continent, bound by latitude 24° 34' N to 26° 30' N and longitudes 77° 30' E to 81° 51' E. BC and is largely constituted of a granitoid complex in which the pink-to-grey granodiorite (or Bundelkhand granodiorite: BG) is the dominant unit along with subordinate leucogranite and its variants, minor aplitic dikes and quartz vein networks [4]. The granitoid complex has been studied by various workers addressing geochemical and geochronological aspects [5,6,7,8,9,10,11,12]. However, there is a dearth of information on the evolution of the late-stage fluid to deduce the post-emplacement hydrothermal processes, that is crucial to the origin of the ‘giant quartz reef’ system that is a significant post-BG phenomenon [4 and references therein]. Reconstruction of evolution of BG necessitates retrieval of magmatic, magmatic-hydrothermal transition and post-magmatic hydrothermal stages from appropriate mineral assemblages, that is lacking so far. Besides, there has been no attempt to characterize late-stage fluid from fluid inclusions. The present study intends to bridge these two important knowledge gaps as regards to evolution of BG. Further, we also attempt to examine the genetic link between BG and the giant quartz reef system using available information on fluid characteristics in the latter [4].
Numerous studies [5,6,7,8,9,10,11,12] unequivocally establish the geochemical characteristics of the Bundelkhand Granitoid to be post-Archaean calc-alkaline, with distinct variations in potassium content, and classify it as meta-aluminous to per-aluminous. Geochronological evidence indicates that the emplacement of K-rich calc-alkaline Bundelkhand granitoid occurred within a narrow time frame of approximately 30 million years, between 2.57 and 2.54 billion years ago [11]. Chouhan et al. [12] and Sensarma et al. [13] furnished some mineral chemistry data and deduced the P-T condition of emplacement of K-rich Bundelkhand granitoid. The present study focuses on the crystal-melt-fluid system of BG, emphasizing the mineral chemistry of the constituent minerals that likely formed during different stages of its evolution, along with their textures and associated chemical parameters. This approach aims to clarify the late-stage evolution of fluids within the system. The mineral chemistry of both primary and secondary phases has been utilized to support findings from fluid inclusion studies. This study does not include any bulk chemical characterization of BG, as these data are already available and not central to the issues being discussed.
2. Geological Background
The Bundelkhand Craton (BC) consists of rocks of Archaean to Palaeoproterozoic age and is overlain by the Late Palaeoproterozoic (2.0–1.8 Ga) sedimentary sequence of Bijawar and Gwalior Group in the northwestern, south and southeastern extremities as shown in Figure 1. The Bundelkhand granodiorite is surrounded by Meso-Neoproterozoic (1.1–1.0 Ga) Vindhyan basin all along the periphery except in the northern side that is covered by Gangetic alluvium of Quaternary age. The central part of BC constitutes the Bundelkhand Gneissic Complex (BGC) followed by Bundelkhand Metasedimentary and Metavolcanic rocks (BMM), Bundelkhand granitoids, and the Madaura (or Madawara) ultramafic complex. BC, in large part, is dissected by the ‘giant quartz reef system’ comprising 20 major quartz reefs and innumerable minor ones, constituting approximately 10 percent of the area of the craton [4 and references therein]. The craton is also dissected by mafic dykes that cut across all older litho units including the giant quartz reefs as shown in Figure 1.
The exposed Bundelkhand Craton, covering an area of 26,000 square kilometers, is primarily characterized by a granitoid complex, predominantly composed of granodiorite. This granodiorite, referred to as |Bundelkhand Granodiorite (BG) varies in color from grey to pink and contains differing amounts of pink K-feldspar. Radiometric dating by various workers assigns an age of ~2530 Ma [6,10,11,14]. Various minor intrusions in the form of felsic units, pegmatitic and quartz veins are also other noticeable features of BC [11]. Although BG is least affected by deformation in comparison to other older units like BGC and BMM, brittle shear fractures and ductile shear zones are often observed [13 and references therein]. Roday et al. [15] visualized the emplacement of the Bundelkhand Granitoids as due to diapiric rise in a pseudoplastic state, occurring within the dynamic environment of a collision-related volcanic setting [5,6,11,16].
Subordinate to the Bundelkhand Granitoids, the quartz reefs constitute the next most voluminous litho units standing as ridges in the BC with a dominant trend of NNE-SSW to NE-SW. Rout et al. [4] surmised a shallow crustal source of the fluid for their formation and speculated it to be the late-stage fluid of BG that evolved internally within it. Pati et al. [17] reported an age of 1.9–2.0 Ga (K-Ar dating) for quartz reef whereas Slabunov et al. [18] inferred a relatively younger age of approximately 1.8 to 1.9Ga with the help of SHRIMP dating of zircons from giant quartz reefs. Notably, these quartz reefs are intersected by NW-SE mafic dykes, demonstrating that the formation of the reefs predates the intrusive mafic dykes [19]. Recent works on the mafic dykes exhibit a broad variation in geochronology, with an age range from 2.15 to 1.8Ga as reported by Slabunov et al. [18] and subsequent researchers.
3. Materials and Methods
Field work was carried out in BC and representative samples of BG were collected across the entire body to have the maximum possible coverage.
Petrography of BG was carried out on 50 thin sections to understand primary and secondary textures, representing the pristine magmatic crystallization and late-stage alterations. Appropriate mineral/mineral assemblages from 15 polished thin sections of BG were selected for Electron Probe Micro Analysis, carried out at two different laboratories. Analyses were carried out with a CAMECA SX FIVE instrument housed in the National facility at Dept. of Geology (Center of Advanced Study), Institute of Science, Banaras Hindu University (BHU) and a CAMECA SX FIVE instrument at the Central Research Facility, Indian Institute of Technology (Indian School of Mines), Dhanbad, India. A LEICA- EM ACE 200 instrument was used to coat a 20nm thin layer of carbon on the polished thin section before electron probe micro analyses to accelerate conductivity. Matrix corrections of the raw data were carried out using the ZAF procedure. In both cases Natural mineral standards were used for routine calibration and quantification. The precision of the analysis is better than 1% for major trace elements oxides from the repeated analysis of standards.
The main aim of such analyses is to understand the chemistry of minerals constituting BG to trace the physicochemical parameters during the primary magmatic and late hydrothermal stages. Hence, minerals such as plagioclase, K-feldspar, hornblende, biotite, apatite, epidote, garnet, muscovite, sphene, chlorite, and magnetite are analyzed in the current work. Multiple grains of each of the minerals were analyzed.
Fluid inclusion studies were carried out on doubly polished wafers of BG and quartz veins in BG with thickness usually varying from 200 to 300 µm. Inclusion petrography was done before microthermometry to understand their nature, association, and mode of occurrences with the help of a Leica DM 4500 petrological microscope. A total of twenty-four wafers (21 from BG, 3-quartz veins in BG) were used for fluid inclusions study. Fluid inclusions were studied in matrix quartz in BG and the late-stage quartz veins/stringers as a results of late-stage fluid activity in BG. The population of fluid inclusions and the nature of their distribution in wafers were deciphered by observing them at varying magnifications. Fluid inclusion microthermometry was carried out with the help of a THMSG 600 hot-cold stage attached to a Leica DM 2500 petrological microscope with a 50x long-distance working objective. The experimental details of the fluid inclusion study are as detailed in [4]. The interpretations of freezing data for aqueous inclusions were made with the help of standard equations for the freezing curve of the H2O-NaCl system whereas the standard P-V-T-X relationships in H2O-NaCl, H2O-CO2-NaCl, and CO2-CH4 systems were used for computation of fluid densities and construction of isochores. All calculations were done using the FLINC software [20].
Raman Microspectrometric studies were carried out at the Research School of Earth Sciences, Australian National University. A Renishaw inVia Reflex Spectrometer System equipped with a standard confocal microscope was used for Raman spectral analysis. A Renishaw diode-pumped solid-state laser provided 532 nm laser excitation with 5 mW power at the sample. A 2400 grooves/mm grating was used giving a spectral resolution of 0.5 cm-1. Single Raman spectra were obtained using a 5-second integration time with 10 accumulations and a 100x Leica microscope objective, which focused the beam to a spot size of 1 µm. Wave number calibration was carried out using an internal silicon standard and was performed as an automated procedure using the Wire version 4.2 software.
Two-dimensional Raman mapping was carried out using the StreamLineHR™ mode. The maps were produced by rastering the region of interest in 5 µm steps and recording a Raman spectrum at each step with a 1-second integration time and 1 accumulation. Maps of different minerals were produced by plotting the intensity of definitive Raman bands for each mineral at each step. These were then displayed as colored maps using the Wire software.
4. Field Features
Small to large outcrops of BG are uniformly distributed all over the Craton showing variable degrees of alteration. They are leucocratic to mesocratic with inequigranular and holocrystalline nature. The pink variant of BG is prevalent with occasional occurrences of the grey-type. BG is dominantly coarse-grained and shows hypidiomorphic texture. K-feldspar (Figure 2a) and quartz of variable grain sizes are commonly seen as megacrysts in them. Mafic minerals occur as fine to medium-grained sometimes as coarse to very coarse-grained nature. Patches of epidote are commonly observed.
BG is devoid of any mesoscopic structure. However, alternate bands of felsic and mafic minerals adjacent to the Bundelkhand Tectonic Zone (BTZ) occasionally show poor to well-developed NE-SW foliation (Fig 2b). In addition to slip surfaces, mylonitic grey granite in a quarry section close to Kabrai (north-eastern part) exhibits sigmoidal porphyroclast showing sense of shear to E-W with slip lineation N85⁰ dipping 87⁰ towards north. Occasional specs of sulfide minerals (molybdenite?) are observed in BG in close proximity to the BTZ. Sparse copper sulfide (mostly oxidized on the surface) and molybdenite are observed in BG near the Raksha Shear Zone (RSZ) area as reported by Pati et al. [9]. Aplite veins are also seen in BG (Figure 2c). Presence of pegmatites and quartz to quartzo-feldspathic veins indicate late-stage fluid activity in BG (Figure 2d and e) [22,23]. Often minor faults are seen to displace such veins as well as zones of ductile shearing associated with BG (Figure 2d). Occasionally, parallel joints or fault planes are also observed in BG. Occurrences of mafic enclaves are quite common in BG. Granite outcrops are better observed in the proximity of the resistant quartz reefs (Fig.2f). In such cases, they are significantly altered, friable, and foliated (Figure 2g).
5. Petrography
The Bundelkhand granodiorite (BG) exhibits an inequigranular texture, with granularity ranging from medium to coarse-grained. It primarily consists of quartz, K-feldspar, and plagioclase feldspar, with notable presence of hornblende and biotite. Additionally, less than 1% modal percentage of accessory phases includes epidote, chlorite, titanite, apatite, allanite, and zircon. Restricted occurrences of bleached mica and garnet are seen in a few samples. Both iron oxide and iron sulfide appear as fine to medium-grained opaque minerals with varying habits.
Subhedral to euhedral plagioclase is typically unzoned. It primarily occurs as megacrysts and exhibits varying degrees of saussuritization. Patches of quartz, biotite, clinozoisite, and chlorite are often observed to be in close association with plagioclase. Unaltered grains retain their lamellar twinning. K-feldspar is dominantly microcline, with perthitic intergrowth (Figure 3a) observable in the forms of patchy perthite, or flame perthite. In contrast to the fresh appearance of the host K-feldspar, the plagioclase within these perthitic intergrowths appears turbid (finely altered) that is more akin to patchy perthite due to deuteric alteration [24,25]. In some instances, both plagioclase and K-feldspar grains exhibit kinks, and criss-cross fractures, with the fracture spaces filled by fine-grained quartzo-feldspathic materials and other secondary phases viz., epidote, chlorite, sericite. A narrow zone of intense granulation of K-feldspar resulting in mineral fish-like structure is often observed which suggest at least one episode of shearing in BG. The sign of dissolution and precipitation can be marked in the thin sections at variable scales with serrated margins and subgrain formation of quartz.
Quartz occurs as anhedral aggregates that exhibit sweeping or undulose extinction. It is mostly interstitial to the early formed mineral phases and is typically coarse-grained except when it appears as veins that traverse the matrix. Serrated margins, grain boundary migration, and subgrain formation (Figure 3b) are some of the notable features in them depicting dissolution - reprecipitation and recrystallization signature.
Hornblende is commonly coarse-grained indicating its early crystallization whereas biotite displays variable grain size depicting both primary as well as secondary origin. Hornblende displays pleochroism from light green to dark green (Figure 3c) as well as from straw yellow to dark green - the various pleochroic shades may be ascribed to variation in Ti content [26]. Biotite also displays variable degrees of pleochroism such as faint brown to dark brown or dark green, and sometimes exhibits combinations of these colors. The presence of biotite along the fringe or cleavage plane of hornblende depicts retrogression reactions of hornblende in the presence of fluid (Figure 3d). Such biotite grains are relatively smaller in size and are devoid of any deformation whereas the coarser grains show signs of deformation in terms of kinks/bent cleavage planes, and bird’s eye extinction (Figure 3e). Incipient to complete chloritization in the form of pseudomorph of biotite is observed with grey and purplish interference color (Figure 3e) which is sometimes associated with needles of rutile (release of Ti) and fluorite (release of F) on the cleavage spaces and also secondary titanite. In a couple of samples, the biotite of anhedral to subhedral habit (30 to 800μ) is observed to have been completely bleached to a colorless appearance. While it lacks distinct bodily pleochroism, a faint brownish hue and strong relief are visible along its borders and cleavage planes, as shown in Figure 3(f). Additionally, it exhibits a second-order interference color similar to that of white mica. Occasionally, it shows kinks over cleavage planes and displays cat's eye extinction with fine-grained aggregates of white mica surrounding its edges.
There is primary as well as secondary titanite. Titanite along with epidote and chlorite are the breakdown/alteration product of both hornblende and biotite (Figs. 3c and d). Apatite mostly occurs in its typical euhedral habit as basal, oblique or prismatic sections. Apatite grains often display a fractured nature. Zircon is also observed as inclusions within biotite/hornblende as well as within the quartzofeldspathic matrix with its primary magmatic oscillatory zoning. Magnetite occurs as a common alteration product in the form of fine specks in hornblende (Figure 3g) and other mafic assemblages as seen in figure 3(h). It is also seen at the core of titanite grains. Euhedral to subhedral grains of magnetite (Figure 4a) frequently display martitization, characterized by fine lines and irregular patches. Such magnetite grains are associated with disseminated fine-grained iron sulfide. Additionally, subhedral to euhedral grains of pyrite can be observed along with fine-grained magnetite. Pyrite rimmed by goethite and rare chalcopyrite are also found dispersed within the quartzo-feldspathic matrix. The presence of goethite, along with network of reddish-brown stains, indicates subsequent fluid activity.
Epidote is found in various mineral assemblages, displaying different textural characteristics that indicate both magmatic and hydrothermal origins. It is often zoned with an allanite core (Fig 4b). Epidote is more frequently observed to be completely or partially enclosed in biotite (Fig 4c) showing resorbed margin. Epidote is often found in association with quartzofeldspathic matrix exhibiting resorbed margins of variable extent (Figure 4d and e). Micro veins containing fine-grained epidote are definitive indications of late hydrothermal fluid activity.
Garnet is faint brown in color, sub rounded to crudely hexagonal in habit with size varying from 50-100µ (Figure 4f). These are unzoned and commonly fractured. Fine aggregates of mica showing barely any pleochroism found along the garnet edges without any chloritic alterations. In some of them, quartz inclusions of 5-20 µ are also seen. These are restricted in occurrences.
6. Mineral Chemistry
Plagioclase feldspar in BG is mostly albitic to oligoclase in nature with XAb varying from 0.73 to 0.99. while XOr varies from 0.002 to 0.06. and XAn varies from 0.005 to 0.26. Alkali feldspar furnished a XAb value of 0.02 to 0.1 and XOr value of 0.89 to 0.97. The anorthitic component in the alkali feldspar is negligible that varies from 0 to 0.002 (Figure 5a).
Hornblende is of calcic amphibole type with Na value 0.0 to 0.44 apfu and Ca value in the range of 1.31 to 1.95 apfu. They show both magnesian and ferroan affinity with a broad variation in Mg# from 0.24 to 0.64 with a dominant spread over 0.48 to 0.58 as seen in figure 5(b). The total aluminium content in them varies from 0.80 to 2.01 apfu with Al IV and Al VI occupancy of 0.0 – 0.42 and 0.61– 1.96 apfu, respectively. Almost all the hornblende analyses indicate igneous origin as shown in the figure. 5(c) [27]. All the calculations of hornblende in the current work is done with Yavuz [28].
Biotite has undergone variable degrees of chloritization. Thus, the data were filtered out according to the compositional range given by Deer et al. [29] and were interpreted with the help of Mica+ [30]. The analysed biotite spots (n=32) furnished a range in Al IV and Al VI from 1.09 to 1.23 apfu and 0.55 to 0.60 apfu respectively with a broad Mg# value of 0.34 to 0.64 (Figure 7d). Biotite from BG are all re-equilibrated primary biotite (Figure 5e) [31] and the data are distributed in the field II and III of de Albuquerque [32], which means they are neither accompanied by other ferromagnesian minerals nor coexisting with muscovite (Figure 5f). It mostly shows a calc-alkaline affinity of orogenic suites in the ternary diagram of Al2O3–FeOtot–MgO [33] with minor deviations.
Structural formulae of bleached mica were calculated on the base of 11 anhydrous oxygen using the Excel sheet of Verdecchia et al. [34]. The apfu value of Si in bleached mica varies from 2.93 to 3.24 with Al and total alkali content 2.40 – 2.87 and 0.78 – 0.97, respectively. The obtained XMg (i.e., Mg/Mg+Fe) values vary between 0.09 and 0.46. According to Speer [35] the data points show compositional variations from primary (I) to late-post magmatic (II) type (Figure 6a). The variation in the chemical composition can be marked with the substitution vector as indicated by the arrow in the figure. 6(b) and (c)
The stoichiometry calculation of apatite was done with reference to Ketcham [36] as per 25 oxygen equivalents. Apatite in BG has CaO values in from the range of 51.29 to 57.89 wt% and P2O5 values from 39.15 to 43.46 wt%. The F-content in them varies from 2.4 to 6.4 wt% whereas Cl range from 0.0 to 0.34wt%. According to Piccoli and Candela [37], apatite with F- content up to 3.76wt% is generally fluor-apatite which is most commonly seen in apatite of igneous origin. MnO-concentration in such apatite varies from 0.0 to 0.23 (except one value showing 0.33 wt%). The data points of apatite mostly suggest its non-ore bearing type [37], although both the fields are overlapping as shown in Figure 6 (d).
The crystal-chemical formula of titanite (based on 20-oxygen.) suggests Ca in the range from 3.77 to 4.01 apfu, Al= 0.18 to 0.37 apfu, Fe= 0.13 to 0.23 apfu and Ti= 3.51 to 3.86 apfu. All the spot analyses show XAl= Al/(Al+Ti+Fe3+) < 0.25; indicating that they are not high-aluminium titanite [38].
The chlorite data were retrieved based on 14-oxygen with the help of the WinCcac program [39]. The analyzed chlorites are dominantly classified as chamosite followed by some clinochlore [40] (Figure 6e and f). The total tetrahedral occupancy (apfu) is found to be full i.e., 4 whereas it varies from 5.8 to 5.9 with very few analyses showing full occupancy for octahedral site. Some of the chlorite analyses were found to be contaminated by their host which is supported by Na2O+K2O+CaO > 0.5 wt% [34]. Such data points are discarded while interpreting the chlorite dataset. The rest of the analysis suggests Si values 2.5 to 3.0 apfu, Al values 2.0 to 2.9 and XMg = Mg/(Mg+Fe) is 0.25- 0.65.
Epidote usually forms a solid solution between pistacite and clinozoisite. In the present case, the pistacite content [Ps=Fe3+/(Fe3++Al)] shows a broad range from 12 to 33 with TiO2=0.000 to 0.338 wt%. Sensarma et al. [13] reported a higher Ps-value of 0.24 to 0.37 in BG and reported them to be of magmatic origin. An attempt has been made to understand the broad variation of Ps-content in the current work by segregating them into each group based on texture and the mineral assemblages as discussed in the petrography section. The Ps-content in subhedral to anhedral epidote which is partially or completely enclosed by a biotite grain varies from 0.26 to 0.33 (n=15; except one, 0.20) whereas resorbed epidote with subhedral to anhedral nature associated with plagioclase feldspar furnished a Ps mole fraction of 0.19 to 0.29 (n=9). The prismatic epidote associated with quartz furnished a narrow variation in Ps- content i.e, 0.26 to 0.29 (n=4) whereas a broader value of 0.21 to 0.30 (n=14, except one Ps=0.12) is observed for epidote associated with iron sulphide minerals. The Ps-content in epidote veins varies from 0.19 to 0.27 (n=9). Although, textural study suggests the magmatic nature of some epidote groups, the broad range in Ps-content puts some equivocal constraints. For a magmatic epidote, it is highly desirable that the Ps-content be between 0.25 and 0.29 [41] and the TiO2 value be less than 0.2 weight percent [42].The above chemical constraints in terms of Ps and TiO2 were also supported by Sial et al. [43] and Galindo et al. [44] in their study of high K-calc-alkaline plutons. However, Sial et al. [45] reported some broad values (Ps= 0.21 to 0.29) for high-K calc-alkaline pluton. They also observed variation in Ps-content for different textured epidote. Moreover, Zen and Hammarstrom [46] and Brasilino et al. [47] give emphasis to some textural criteria while distinguish magmatic epidotes from secondary epidotes. They are euhedral to subhedral habit, twinning and strong compositional zoning, allanite rich core, crystallization after hornblende and before or contemporaneous with biotite, in some cases embayed where in contact with feldspar grain, wormy contacts (almost myrmekititic) and the lack of alteration of biotite to chlorite and fresh appearance of plagioclase.
A total of 37 spot analyses were performed on different grains of garnet restricted to only two samples of BG. The mineral chemistry data is interpreted in terms of pyrope- almandine- spessartine solid solution end members of garnet. They vary from 2.15 to 3.42, 48.53 to 54.99 and 41.88 to 48.51 mol%, respectively. Garnet of this study is reported very small fraction of grossular content which range from 0.36 to 1.21 mol%. According to [48] the normal variation of spessartine content in garnet from granite is 36% whereas it is 47% when garnet is from Pegmatites. Hence, the high proportion of spessartine in the present case also point to typical nature of granitic rocks.
The analysed iron oxides are found to be mostly magnetite followed by ilmenite with some titano-magnetite. The FeO-content varies from 38.74 to 93.86wt% with TiO2 and MnO-content in the range of 0.0 to 57.73wt% and 0.0 to 9.75wt% respectively. None of the magnetite analysis turned up to total as 100 wt% after repeated analysis whereas ilmenite does. The similar issues were also encountered in the dataset provided by [13]. In their analysis, FeO-content varies from 39.01 to 95.24wt% with TiO2 and MnO-content in the range of 0.0 to 47.90 wt% and 0.0 to 3.46 wt% respectively. According to Smith [49], the analyzed magnetite is a solid solution between magnetite–maghemite which in turn, is unable to accommodate the excess Fe2O3 component in it. This solid solution reaction is an indication of sub-solidus oxidation [50]. It is observed that some of the analyzed ilmenite grains were showing relatively higher value of MnO in comparison to other i.e., 1.0 to 9.75wt%. This could be due to the formation of solid solution of ilmenite with geikielite (MgTiO3) and pyrophanite (MnTiO3), which indicate that these minerals can substitute for each other in the crystal structure.
7. Results: Retrieval of Physicochemical Environment
7.1. Mineral Thermobarometry
Pairs of coexisting plagioclase and alkali feldspar in BG were used for estimation of temperature following Benisek et al. [51]. The range of pressure as estimated from Al in hornblende barometer of Schmidt [52] was used here. Results show a variation of 456.0 to 642 ℃ (avg=525.7 ℃; ±σ=68.7℃) and 567.9 to 813.7℃ (avg= 664.6℃; ±σ=87.2℃) for albite and orthoclase component in them, respectively. The non-overlapping nature of such data points (Figure 7a) indicates their retrograde resetting in response to slow cooling. This is also corroborated by the relatively lower value of orthoclase component in plagioclase to that of albite content in K-feldspar.
Figure 7.
(a) Scatter plot of TAb vs TOr in feldspar pair [51] where TAb and TOr represent temperature for albitic and orthoclase component respectively; (b) Scatter plot of Ti vs [Mg/(Mg+Fe)] for biotite with temperature isotherms [61]; (c) Scatter plot of Temperature vs Pistacite content (Ps) in epidote; (d) variation of temperature in chlorite using the empirical formulation as shown in the legend and (e) analyzed biotite has shown oxygen fugacity between QFM and NNO [71].
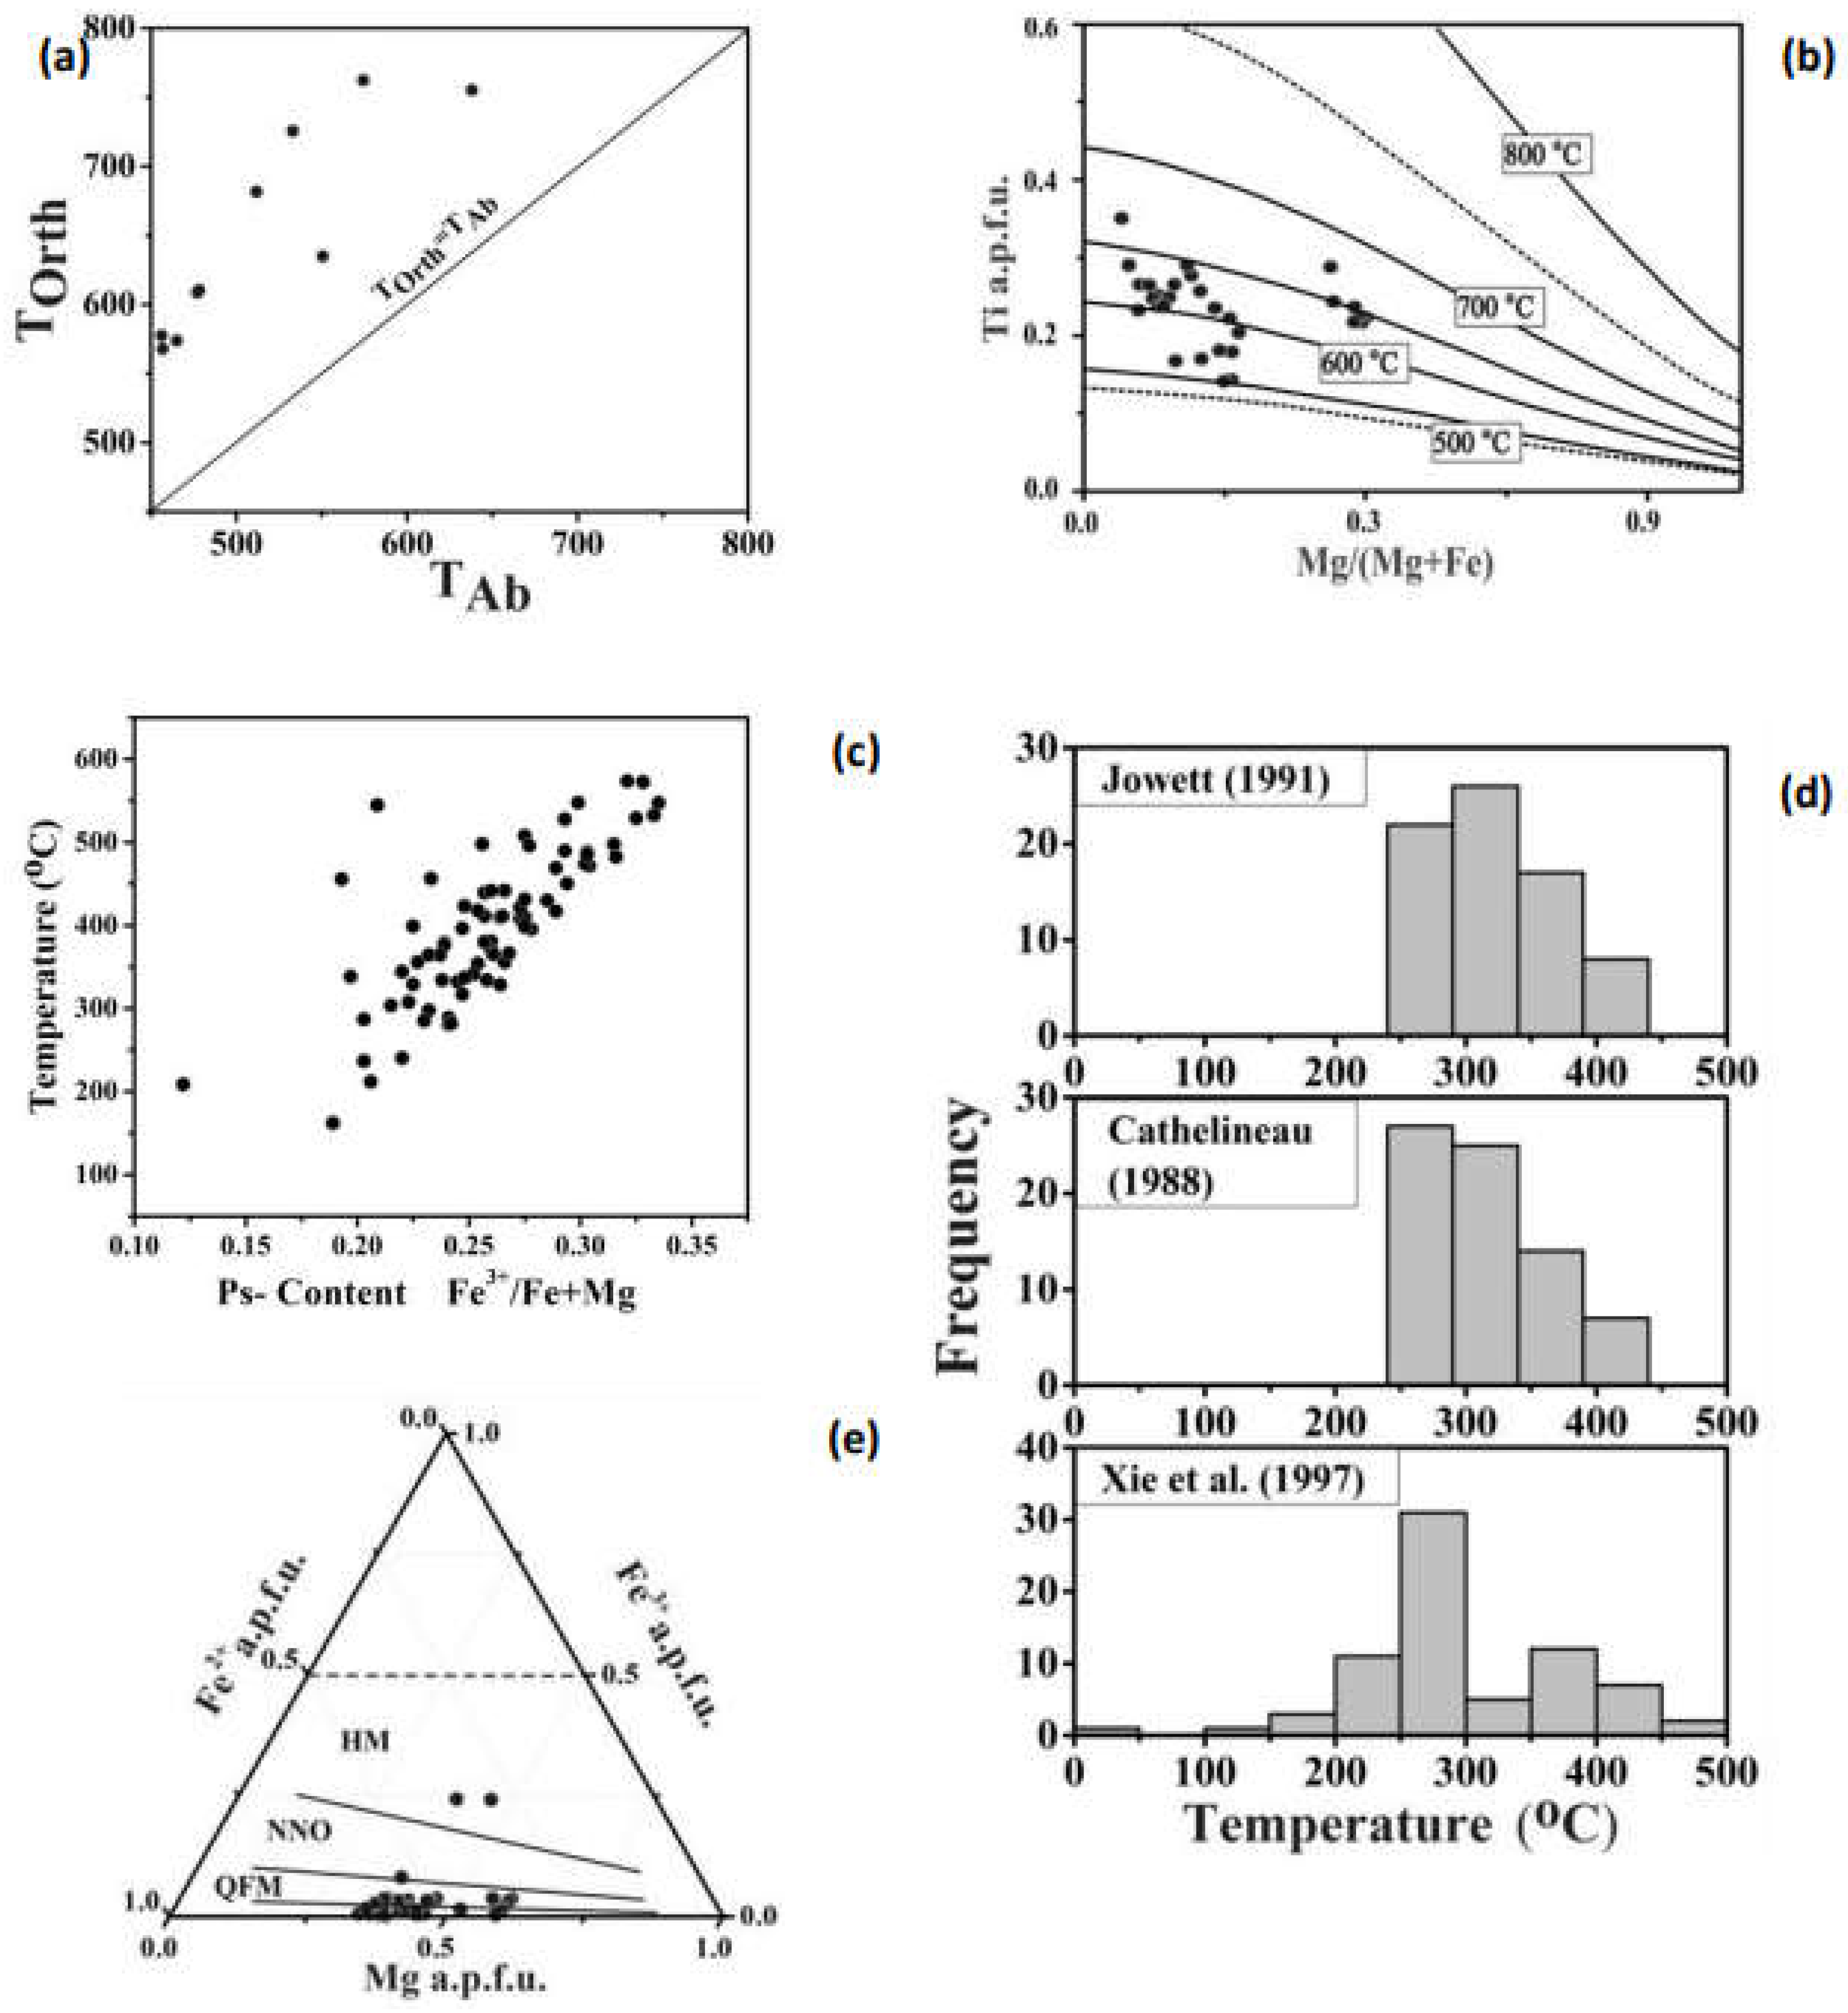
Figure 8.
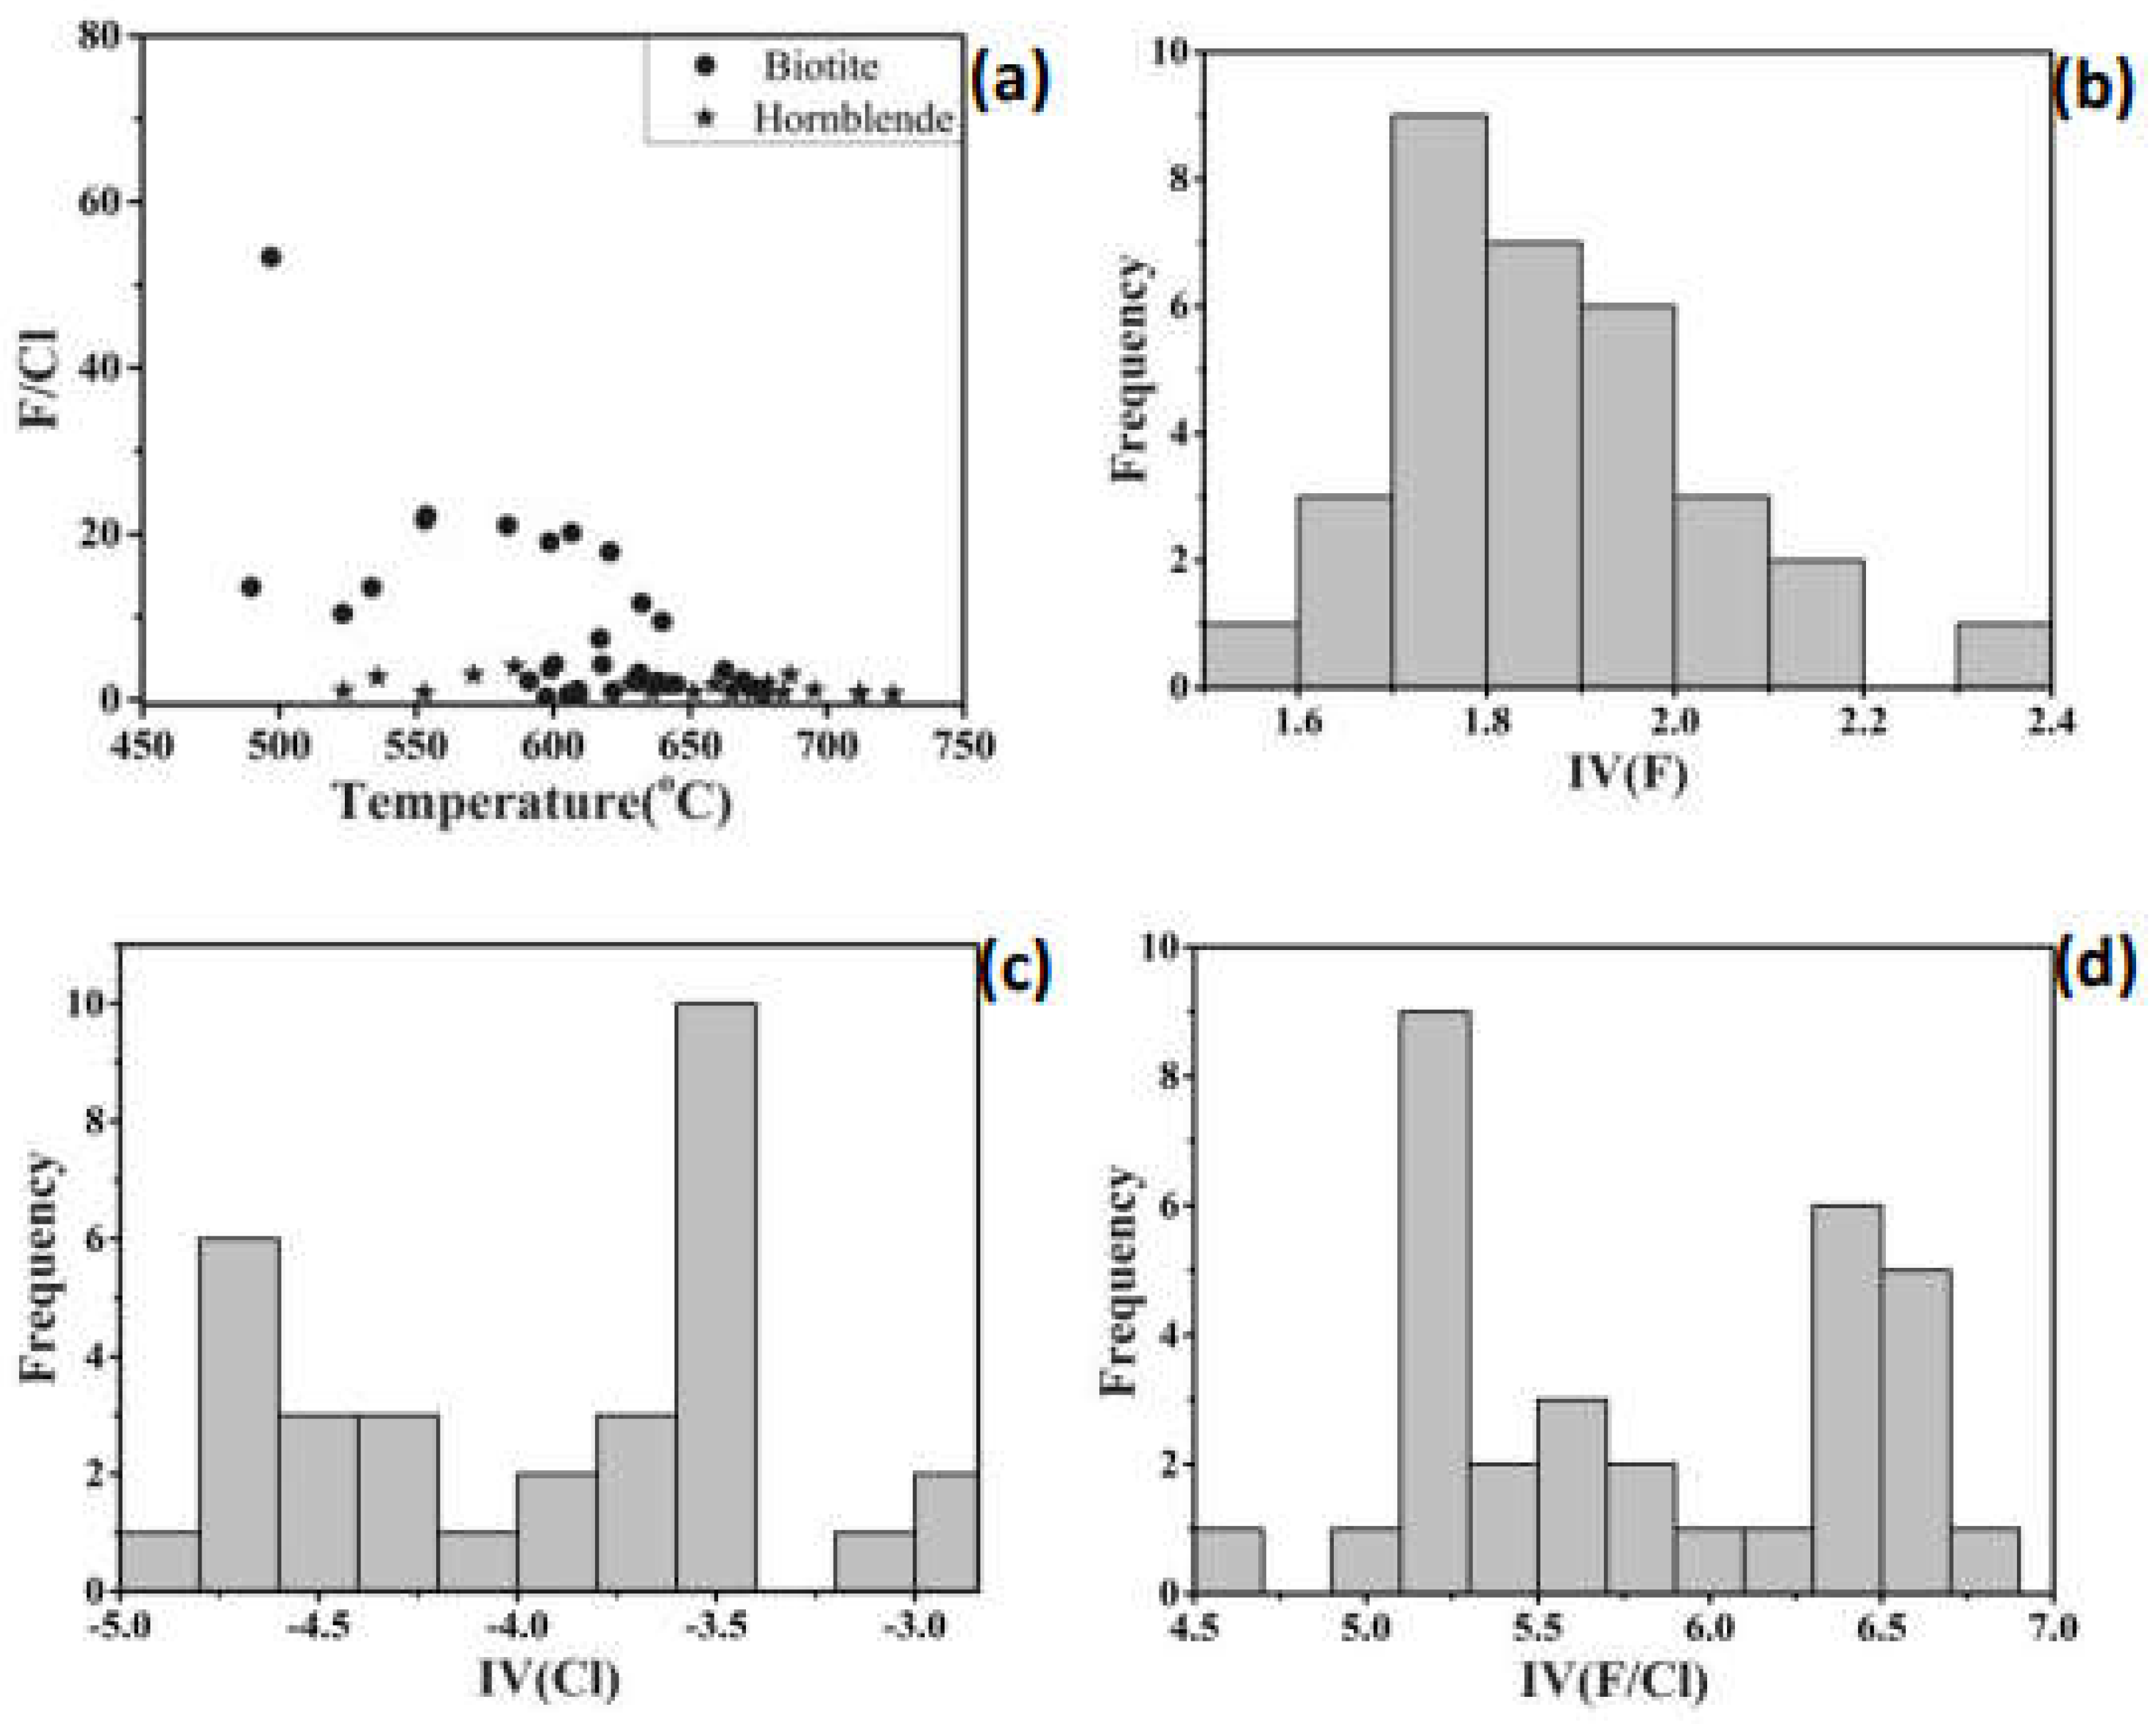
(a) Bivariate plot showing variation of molar F and Cl ratio in hornblende and biotite; Distribution of data points showing variation of (b) IV(F); (c) IV(Cl) and (d) IV(F/Cl) in biotite.
Figure 8.
(a) Bivariate plot showing variation of molar F and Cl ratio in hornblende and biotite; Distribution of data points showing variation of (b) IV(F); (c) IV(Cl) and (d) IV(F/Cl) in biotite.
Pressures estimated from composition of hornblende from BG are tabulated in Table-1 using formulations suggested by various workers. Although sample wise variations are almost similar in all the formulations for BG, the equation of Schmidt [52] furnished relatively higher value in many instances. A broad variation in emplacement pressure from 0.56 to 5.9 kb was observed for BG by using formulations of Johnson and Rutherford [53] and from 1.48 to 5.97 kb by using Schmidt [52] respectively. However, the stabilization of hornblende would require a minimum of > ~1 kb pressure in a typical granitic system [54]. Hence, the output from Schmidt [52] formulation is more acceptable than that of Johnson and Rutherford [53] for BG. These pressure values were considered as per the specification given by Anderson and Smith [55] in the context of control of temperature and magma composition over pressure as suggested by Putrika [56]. In comparison to this, Sensarma et al. [13] reported a higher pressure range of 5 to 9 kilobar for those samples with T > 800℃ and 6 to 7.5kilobar to that of T < 800℃. A few of the analyses from southern part of the terrane also furnished lower pressure value of ~2 to 3kbar.
Ti in hornblende thermometry (57) has been used where titanite or ilmenite occurs as an equilibrium mineral phase, that furnishes a temperature range from 577℃ to 727 ℃ with average 654 ± 50.4 ℃. Plagioclase -hornblende thermometry on the basis of AlIV-A site coupling in amphibole [58] has also been attempted. Before using the thermometer, the dataset was checked with the calibration values provided by Holland and Blundy [59]. Since the formulation is pressure dependent, the P-values calculated with the help of Schmidt [52] as well as Anderson and Smith [55] were considered as a starting point during each iteration. However, most of the data have [Fe3+/ (Fe3+ + Fe2+)] < 0.25 which are outside the calibration range given by Anderson and Smith [55]. Hence, very few calculations could be done using such method. All the calculations are done with Microsoft excel spreadsheet ‘Plagioclase-Hornblende-

Table 1.
Sample wise variation of estimated pressure and temperature after hornblende mineral analysis (EPMA) with the help of various formulation such as P1: Hammerstrom and Zen (1986), P2: Johnson and Rutherford (1989), P3: Hollister et al. (1987), P4: Schmidt (1992), T1 and T2: plagioclase and hornblende thermometer of Holland and Blundy (1994) by utilizing pressure values of Schmidt (1992) and Anderson and Smith (1995) respectively and T3: titanium concentration in hornblende by Otten (1984).
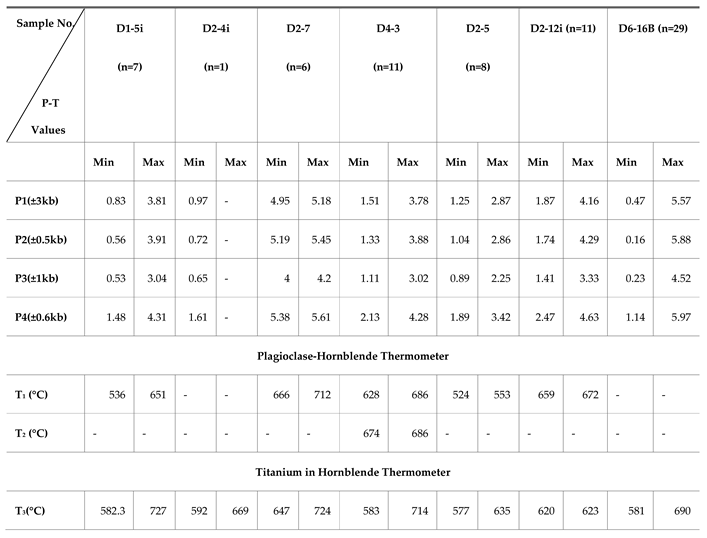 |
Thermobarometry’ by Anderson et al. [60] and the resultant temperature varies from 523.6℃ – 724.2℃ with average 650.2℃ (±1σ= 54.8℃) which is within the validation field of Holland and Blundy [59].
According to Henry et al. [61] Ti content in biotite is used to estimate temperature of the rock in which they occur provided they should have XMg= 0.275 – 1.000 and Ti= 0.04 – 0.60 apfu. In view of the variable degree of chloritization, biotite is expected to lose Ti and Ba on its rims and along the bands parallel to cleavage planes with the advancement of subsolidus cooling. Hence, the analyzed biotite grains were crosschecked with the aforementioned compositional range before the calculations. The calculated temperature values vary from 489 to 669 ℃ which is well within the calibration range provided by them i.e., 480 to 800 ℃. These data are nearly conformable with the temperature range inferred from the re-equilibrated biotite of Sensarma et al. [13] which is 550 ℃ to 600℃. However, they have reported a temperature value of ~750℃ for primary biotite. Most of the biotite in our study plot between the contours of 600℃ – 650 ℃ in Ti (apfu) vs Mg/(Mg+Fe) diagram (Figure 7b) with very few points near 500 ℃ isotherm. Precision of such geothermometer is about ±24 ℃ at the lower range and ±12℃ for the higher temperature range. Additionally, co- occurrence of biotite and apatite is also considered for estimation of temperature on the basis of F-OH exchange [62]. Although such occurrences are very common in BG, variable degree of chloritization will always introduce an unknown degree of uncertainty. Moreover, the analyzed apatite grains gave more than 2 apfu value for F-content in most of the analysis. Thus, the ambiguity arises whether they are the result of substitution reaction and/or the effect of F migration towards the beam [63]. Hence, they are discarded from further calculation which ended with very few data points (n=5) that are amenable to apatite-biotite thermometry and are restricted to only one sample. The calculated temperature varies broadly from ~ 394 to 824℃ with average 612.9±170.6℃. The Ti-biotite thermometer in the same sample furnished a narrow temperature range from ~629℃ – 669 ℃ (n=8). The formulation which is used here is pressure dependent and thus, the pressure values calculated from Al-content in hornblende [52] is utilized in such juncture.
Utilizing the solid solution model of Bird and Helgeson [64], an attempt has been made to calculate temperature from epidote compositions on the basis of Al-Fe exchange in the octahedral site. A broad range from ~161℃ to 573 ℃ (Figure 7c) is obtained using the above formulation (calibration value of 5kb at 600℃). All these data points are within the TiO2 value <0.2wt%. Epidote which is fully or partially enclosed within biotite suggest a temperature range from 450℃ to 573℃ and those associated with plagioclase with resorbed outline suggest a temperature interval of 395℃ to 455℃. The precise details are given in the table: 2. No epidote analyses were available in association with the analyzed biotite for a comparative study.
Table 2.
Temperature variation in Epidote with different textures and mineral associations using the solid solution model of Bird and Helgeson (1980) along with the corresponding pistacite variation in them.
Table 2.
Temperature variation in Epidote with different textures and mineral associations using the solid solution model of Bird and Helgeson (1980) along with the corresponding pistacite variation in them.
| Epidote + Mineral assemblage | Texture of Epidote | Pistacite Content |
Temperature (℃) | Remark |
|---|---|---|---|---|
|
Biotite |
Fully enclosed grains (n=13) |
0.26-0.33 | 450.2 - 573.6 (one 334.1) |
Ps=0.26 → T=334.1℃ Ps=0.27–0.29→T=450.2–547.7℃ Ps=0.29–0.33→ T=471.6–573.6℃ |
| partially enclosed grains (n=3) |
0.26 - 0.27 (one Ps=0.20) |
441.7 - 497.9 (one 286.9) |
Ps=0.20 → T=287 ℃ Ps=0.26–0.27→T=441.7℃–497.9℃ |
|
|
Plagioclase |
subhedral and resorbed outline (n=2) | 0.19 and 0.29 | 455 and 603.8 | Ps=0.29 → T=603.8 ℃ is outside the calibration value. |
| irregular type (n=7) |
0.23-0.27 | 328.4- 456.2 | ||
| Quartz | elongated prismatic crystals (n=4) |
0.26-0.29 | 355.8 – 416.8 | |
| Opaque | Fe- sulphide (n=14) |
0.21-0.30 (one Ps=0.12) |
332.4 - 474 (one T=208.7) |
Ps=0.12 → T=208.7 ℃ Ps=0.21 → T=211.9 ℃ Ps=0.23 –0.25→T=297.6–337℃ Ps=0.26– 0.30→T=365.1– 441.4℃ |
| Plagioclase or Quartz-feldspar | solution channel or fracture filling material (n=9) |
0.19 – 0.27 | 161.8 to 366 | Ps <0.25 (0.19-0.24) → T=161.8 -303.5 (n=7) Ps = 0.25-0.29 → T=317– 366 °C (n=2) |
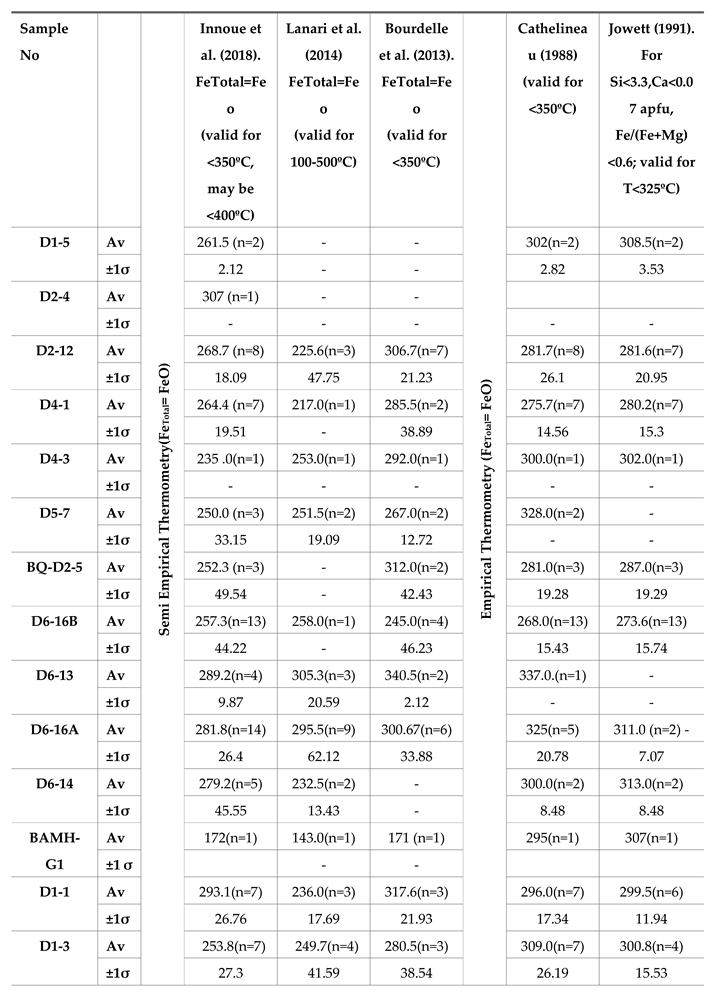
Considering the variations in mineral composition of chlorite due to multi-component solid solution, many approaches have been made to develop a suitable geothermometer. The temperature data as calculated by using the empirical formulations [65,66] displayed a consistent variation. The overall range is from 268 to 337 ℃. In contrast to above, the empirical formulation as proposed by Xie et al. [67] furnished a broader range of temperature ~167 to 475℃ with clustering of data points mostly around 200 to 400℃ (Figure 7d). In case of semi-empirical thermometer with Fe Total = FeO [68,69,70], the temperature value is varied from 217 to 340 ℃ except one sample with comparatively lower temperature values viz., 143 to 172 Thus, the temperature data as obtained from the empirical formulations [65,66] and semi-empirical thermometer with Fe Total = FeO [68,69,70], are well correlated and also come under the calibration range provided by respective workers (see Table-3). All the calculations were done with the help of Excel sheet of Verdecchia et al. [34].
Since chlorite in BG is undoubtedly of late-hydrothermal origin (both alteration of preexisting biotite / amphibole and as vein precipitates / patches), the temperature estimations derived from its mineral chemistry may also provide some information regarding the thermal regime of the late-stage fluid. Even, the temperature variation as exhibited by epidote occurred as fracture filling material (considered as late crystallized phase) is reported an overlapping range of ~236℃ to 366℃ (except one showing 161℃) with the above chlorite thermometry data (~217℃ to 340℃). For a crude comparison chlorite present in association with the epidote is considered here to comprehend more about the temperature of residual fluid, although less data are available for such pairs. Three of such data points associated with epidote (enclosed in biotite), suggest a much lower temperature value [~264℃ to 320℃: 65 and 66 and ~ 258℃ to 324℃: 68, 69] in contrast to the epidote temperature data (~334℃ to 529℃) whereas in one instance, chlorite shared a similar temperature variation of ~318℃ to 321℃ with epidote (coexist with opaque) which is ~334℃. Thus, it appears that the temperature of late-stage fluid that is prevailing within BG may be ~ 217°C to 340°C.
7.2. Oxygen Fugacity
According to Anderson and Smith [55], the oxygen fugacity indicated through mafic silicate minerals can be qualitatively comprehended by using the Fe/(Fe+Mg) ratio. The ratio depicts a decrease in value with respect to the increase in oxygen fugacity condition. In the present case, the ratio in hornblende varies from 0.36 to 0.76 (avg= 0.52, ±σ 0.075) thereby indicative of variable oxygen fugacity which broadly varies from low to high during the evolution of BG. The oxygen fugacity varied predominantly between QFM and NNO as per the formulations of Wones and Eugster [71] (Figure 7e) rarely above HM buffer.
Table 3.
Sample wise variation of estimated temperature after chlorite mineral analyses in the BG.
 |
Miles et al. [72] proposed Mn-content in apatite as an indicator of oxygen fugacity in silicic magma. They inferred that Mn-content in apatite varies linearly and negatively with the log fO2, although uncertainties involving their partitioning in apatite are there with respect to the redox state as well as other physicochemical parameters. Nevertheless, the empirical evidence associated with natural sample show consistent result to this tool. The present data suggest a broad variation of log fO2 values of -15.38 (+ 1.5) to -9.75 (+ 0.45) corresponding to the range of Mn concentration in apatite. Some values are higher than expected at temperatures corresponding to apatite and higher than what is deduced from biotite implying a more oxidized condition of BG magma. The association of titanite with magnetite and quartz (assuming quartz to be common phase in granite) in the present study suggest fO2 slightly higher than QFM buffer [73]. Such redox condition is also consistent with the redox state as revealed by biotite of BG as can be seen in figure. 7 (e).
7.3. Volatiles in BG
Water Content
The formulation provided by Holtz et al. [74] for a rhyolitic melt of 800°C was taken into consideration in order to comprehend the water solubility in BG at its emplacement condition. The efficiency of the model can be achieved within a pressure interval of 0.3 to 8 kb. The pressure estimated using the equation of Schmidt [52] was used for computation of initial water content of BG. A value in the range of 5.25 to 10.78 wt% (except at an instance, 11.17 wt%) was obtained for BG.
Halogen Content
The F/Cl value in biotite and hornblende was examined in relation to Ti in biotite and related hornblende-plagioclase geothermometers. Since, these two geothermometers are the best available at this moment to understand the solidus to sub-solidus conditions, accordingly, the variation in halogen concentration can be as seen in Figure 8(a). Despite being significantly preferred over the hornblende and biotite for integrating both F and Cl, apatite was not considered in the current context due to the lack of suitable number of temperature estimates for it. Furthermore, apatite is an accessory phase and comes early in crystallization sequence for a granitic magma that results in only a slight change in the bulk halogen concentration [75,76]. As far as hornblende and biotite are concerned, hornblende has a poor preference for F, while biotite can account up to 75% of the F budget in the granitic domain. In contrast to this mineralogical constraint for F budget, Cl concentration is mostly controlled by the rock's composition [75]. Thus, the significant fluctuation in F/Cl in biotite in BG (Figure 8a) may be attributed to the crystallization of biotite and hornblende, respectively. Even at this point the crystallization of feldspar and quartz will raise the F-content in the residual melt, partially mitigating the effect of biotite. The evolution of volatiles in biotite is susceptible to the magmatic-hydrothermal transition because of its increased sensitivity to changes in the physico-chemical environment [62, 76, 77, 78 and references therein].
According to Munoz [77], the presence of halogens in the biotite structure, helps to constrain the halogen activity in the fluid in equilibrium, although the sole and direct utilization of their concentration is not recommended. This is due to the fact that the halogen contents in biotite structure is a function of temperature, relative fugacities of the halogens in the fluid or magma and cation composition of the biotite, specifically the Xphl. Hence, Munoz [77] introduced halogen intercept values such as F(IV), Cl(IV) and IV(F/Cl) in order to accommodate the Fe-F and Mg-Cl avoidance rule. The IV(F) values show nearly homogeneous distribution from 1.5 to 2.0 with very few in the range of 2.0 to 2.5 (Figure 8b). However, the IV(Cl) values of biotite show at least two different clusters (Figure 8c) primarily based on Cl% contents. The distribution of IV(F/Cl) (Figure 8d) is also consistent with Cl(IV) thereby suggesting re-equilibration of biotite by later fluid. It is important to note that IV(F/Cl) is invariant to the uncertainties involved in the hydroxyl occupancy and is directly associated with the relative fugacities of HF and HCl in the fluid or melt. Hence, this parameter is more dependable than that of IV(F) and IV(Cl) [30,79]. Since, IV(F) and IV(Cl) are inversely proportional to the XF and XCl values, respectively, smaller values imply higher activity of halogen contents in fluid [77]. In the present study, negative values of IV(Cl) and positive values of IV(F) are well evident in all the analyses. Hence, the higher negative values will correspond to higher enrichment in chlorine in the fluid. Such relationship between Cl and F could be ascribed to higher affinity of Cl for the fluid phase than that of solid (mineral) in comparison to F in effect to fluid ingression [75,80].
According to Zhu and Sverjensky [62], biotite formed under similar physicochemical environment show linear trend on binary plots considering the parameters as shown in Figure. 9(a), (b), (c) and (d). Although some crude linear trend is evident in the present case, the dispersion of data points due to variation in XCl/XOH and XF/XOH values. Hence, the composition of fluid which was associated with the biotite during their formation or re-equilibration was modified on interaction of late-stage hydrothermal fluid which must have different temperature as well as composition. This can be depicted with sub-solidus exchange reaction which is common in BG as evident by pronounced chloritization of biotite and sassuritization of plagioclases. In order to understand fugacity ratios of fluid associated with biotite, the formulations of Munoz [81] were used. Since the calculation requires a temperature value, the average temperature of the chlorite geothermometer was used in the current work and the resultant values are shown in figure. 9 (e) and (f). The log(fHF/fHCl)fluid exhibit positive linear correlation with log(fH2O/fHCl)fluid (Figure 9e) whereas plots of log(fH2O/fHF)fluid vs log(fH2O/fHCl)fluid is more dispersed (Figure 9f).
8. Late- Stage Fluid Characteristics in BG
In order to visualize the scenario of evolution of BG, it is essential to understand the late stage fluid characteristics during its course of evolution. To achieve this goal, fluid inclusion study in matrix quartz of BG and the late-stage fluid associated with them as quartz veins / stringers were considered. A total of twenty-four wafers were used for fluid inclusions study, out of which 21 samples are from the granodiorite and 3 are representative quartz veins.
8.1. Fluid Inclusion Petrography
Petrographic features suggest that BG was least affected by deformation compared to other litho-units of the craton. Under such situation as demonstrated by Tarantola et al. [82], fluid inclusions in the matrix quartz of BG are likely to preserve their pristine compositional characteristics. Keeping the possible effect of later deformation in mind, care has been taken while choosing the fluid inclusion population for microthermometric analyses by restricting their sizes to moderately small (~5 to 15µ) with least distortion in shape. Thus, a reasonable assumption can be made with respect to the salinity and temperature characteristics. In the absence of cathodoluminescence (CL) images, discriminating fluid inclusion populations into discrete episodes of fluid entrapment into different FIAs [83,84] would be misleading. Instead, we aim to comprehend the broad P-T history of evolving BG by comparing the matrix quartz which represents the first fluid event, with that of quartz veins, which are likely to be overlapping with release of fluids in discrete amounts to incipient fracture to form the veins. Therefore, in order to understand the various pulses of fluid activity covering all possible categories of fluid inclusions, features such as their occurrence in a random three-dimensional framework in a space away from healed fractures (henceforth simply referred to as "random three-dimension") and distribution in healed fractures as trail-bound inclusions, each with the tentatively identified compositional type, were analyzed in host quartz. Although we have concentrated on those that occur randomly in three dimensions in the host quartz and meet the requirements for primary inclusions [85], we do not assume that they were trapped at the same time or under the same fluid P-T-X state. Even though all of these inclusions may not have been trapped simultaneously, but rather at different times in recrystallized domains (although undeformed), the scenario with shifting fluid features in terms of temperature and salinity distribution of data is expected to furnish the spectrum of fluid activity over time rather than at any instant of time. To compare with the main population that occurs "randomly in three dimensions," we have taken into consideration a small representative population of inclusions in healed cracks (trail bound).
Types of Inclusions
Based on the appearance of fluid inclusions at room temperature along with their heating and freezing behavior, a total of six compositional types of inclusions were recognized and a summary of which is given below.
Type-I: Aqueous Biphase (L+V)
This type is the most dominant in the matrix quartz and vein quartz samples. They range in sizes from <2-30μ (average 5 to 15μ) with regular (elliptical, oval rectangular, negative crystal) and irregular shapes. In case of matrix quartz, the trail bound nature of inclusions outnumber the inclusions in clusters (Figure 10a). It was difficult to ascertain the primary or secondary nature of these trails due to the presence of dark color minerals (like ferromagnesian minerals) in contact with quartz. These are also seen in association with all other types of fluid inclusions.
In case of vein quartz, the cluster mode of occurrence of Type-I inclusions is dominantly seen over inclusion trails (Figure 11a). These inclusions are seen in association with other type of inclusions with respect to their availability in a sample.
Type-II: Pure Carbonic
These are seen both as monophase and biphase (Figure 10b) nature at room temperature with size varying from <2 to 10μ. These are mostly oval to elliptical in shape. Exclusive occurrence as cluster is seen along with association with Type-I (Figure 10j) and Type-IV inclusions. In few instances, the Type-II inclusions of matrix quartz were marked with a bright white like solid phases in the inclusion cavity (Figure 10c).
Type-III: Mixed-Pure Carbonic
In a few of the samples, frequent occurrence of carbonic inclusions is observed as enclosed within another phase that has the appearance of glassy type material which has a faint outline of transparent to colored-translucent mass. Carbonic liquid (± vapor bubble) is either at the centre or marginal (Figure 10d) to the fluid inclusion cavity. Size of such inclusions varies from <10 to 30 μ with dominantly elliptical to oval and variable irregular shape. Such inclusions are also marked in one of the quartz vein samples (Figure 11d and e), where they either occur isolated or in association with Type-I inclusions. Such associations of carbonic liquid inclusions with solid are rarely reported in BG or in the quartz veins and are very characteristic of samples of BG studied in the present work.
Type- IV: Aqueous Carbonic
The occurrence of such inclusions is less and restricted to a few of the samples only, occasionally outnumbering (matrix quartz in sample D6-12) the Type-I inclusions of BG and one sample of vein quartz. They occur dominantly as clusters with Type-I (Figure 10e), sometimes with Type-II and in rare cases, with the both along the trail in the matrix quartz as well as vein quartz (Figure 11k) of BG. Isolated occurrences of such inclusions are also seen infrequently. They vary in size from <2 to 20 μ (mostly 5 to 10 μ) with oval to elliptical in outline. They occur both as biphase and triphase nature at room temperature condition. The volume fraction of carbonic phase seemed to be much higher leaving behind LCO2 as thin film. This creates problem in distinguishing them from Type-I inclusions to some extent. Similar to Type-II inclusions, these inclusions are also seen with a bright solid phase in matrix quartz (Figure 10f) and quartz-in-quartz domains (Figure 11i).
Type-V: Aqueous Polyphase
Solid phases of variable shape and sizes such as cubic, rhombohedral, prismatic, globular occasionally trigonal and columnar shape are seen in matrix quartz (Figure 10h) whereas the solid crystal is dominantly prismatic in nature in case of vein quartz in BG (Figure 11g and h). The inclusion size varies from < 5μ to 20μ in both cases. Solid phases occupying more than the half of the portion of fluid inclusion cavity are seen in both the domains as in figure. 10(i) and figure 11(l) and (m) which often tend to consist of more than one solid phase indicating their possible captive nature. However, their recurrence is quite common in the fluid inclusion assemblages. Type-VI: Unusual inclusion Type
This type is more or less similar to type-V inclusions described earlier in the ‘giant quartz reef system’ [4] but less frequent in the samples of BG. This type with single or multiple tiny entities executing pseudo-Brownian movement, often giving an effervescence-type behavior are quite less in number rather many variations in nature of type-VI inclusions are observed – the movement of the suspended particles is feeble and observed only with a slight increase in temperature, making it difficult to distinguish them from type-V inclusions. Moreover, inclusions exhibiting colored aqueous liquid (viz. brown or green color) or sometimes colored phases in the fluid inclusion cavity are comparatively more frequent (Figure 9l) than that of effervescence-type of Rout et al [4]. Although these inclusions behave as like type-I inclusions, but they were categorized under unusual type in the current work. They are seen in association with Type-I inclusions in both clusters and trails. Isolated occurrence of these inclusions is observed occasionally. Type-VI inclusions are relatively less frequent in the quartz veins (Figure 11n). Occasionally, the aqueous liquid is colored as shown in figure. 11(f).
8.2. Fluid Inclusion Microthermometry
A total of 543 fluid inclusions in matrix quartz of BG and 83 fluid inclusions from its associated quartz veins have been studied and their details are given below.
The majority of inclusions in both matrix and vein quartz in BG is the Type-I inclusions. The temperature of first melting in case of matrix quartz shows a broad range from -53 ℃ to -21 ℃ indicating presence of cations like Mg, Ca, K along with Na in the aqueous fluid. The salinity values obtained from their final ice melting temperature ranges from ~0 to 26.85 wt% NaCl eq. Such variations in salinity value are consistent in both trail and non- trail bound inclusions (Fig.12a) along with the dominance of low saline (0 to 2 wt% NaCl eq.) data over moderate to higher saline values. Similar situation prevails in type I inclusions of vein quartz hosted in BG in which salinity values varies from ~0 to 21.06 wt% NaCl eq. which cluster around 0 to 2 wt% NaCl eq. The temperature of homogenization varies from 94.8℃ to 399.8℃ (cluster around 120℃ to 300℃) and 73.2℃ to 357.3℃ (clustering around 130℃ to 280℃) in non-trail bound and trail bound inclusions, respectively (Figure 12b). This results in a density distribution of 0.507 to 1.136 g/cc in non-trail bound and 0.602 to 1.177 g/cc in trail bound type- I inclusions in matrix quartz. Even the broad range of temperature of homogenization in vein quartz is also marked which vary from 139℃ to 360℃ with comparatively narrow clusters of 150℃ to 220℃.
The density values of such inclusions are ranged from 0.57 to 1.069 g/cc (Figure 12c). All Type-I inclusions homogenized into liquid phase with a lone instance of critical homogenization. The Tm,CO2 value in Type-II inclusions is consistently close to the triple point of CO2 (-56.6℃) indicating undetectable concentrations of other gaseous species. The homogenization temperatures of these inclusions (Th,CO2) span a broad range from -7.6℃ to 31℃ with clusters around 25℃ to 30℃ (Figure 12d). The density of such inclusions varies from 0.513 to 0.971 g/cc which clusters around 0.6 to 0.8 g/cc (Figure 12e). However, Th,CO2 in Type III inclusions show a narrow range from 21.2℃ to 30.2℃ with density of carbonic phase varies from 0.586 to 0.761g/cc. In both cases homogenization is essentially into the liquid phase. The bright phases present within the carbonic liquid do not show any tendency of dissolution on heating possibly due to extremely slow kinetics since they are non-chloride solid phases. These solid phases in carbonic inclusions are more likely to be captive although occurrence of such inclusions is quite frequent. The similar near pure nature of CO2 is also marked in Type-IV inclusions in both matrix and vein quartz in BG (Figure 12d). The temperature of melting of clathrate in these inclusions varies from -7.1℃ to 6.9℃. The temperature of partial homogenization of carbonic phase (Th,CO2) ranges from 17.3℃ to 30.7℃ with the mode of homogenization being liquid in most cases and critical in some. Temperature of total homogenization (TTot) could be recorded for only four of the Type-IV inclusions, rest of them decrepitated before total homogenization. Out of the four type IV inclusions which furnished TTot, two homogenized to aqueous phase at 328.7℃ and 356.2℃; one into carbonic phase at 399.3℃ and another one in the verge of carbonic phase homogenization at around 600℃(since the machine could not go beyond 600℃). Out of these four, Tm,Clath could be recorded precisely in case of only two inclusions i.e. the one that homogenized at 329℃ and another 600℃. Since the complete homogenization could not be noted in the latter case, only a single type-IV inclusion data could be used for barometry (estimation of minimum pressure). The clathrate melting temperature gave a salinity of 9.84 wt% NaCl eq. A pressure of 2.6 kb was obtained using the MRK equation of state [86,87] following the computation scheme outlined by Panigrahi and Mookherjee [88] that also resulted in a density of 0.97 g/cc having XCO2 of 0.07 corresponding to the temperature of total homogenization. It may be noted that this pressure corresponds to the minimum pressure of entrapment. However, since some of the decrepitated inclusions were approaching homogenization to carbonic phase, entrapment close to the solvus in the approximated ternary system seems possible and the pressure estimated could be close to the pressure of entrapment.
None of the Type-V inclusions led to dissolution of solid phases present within the inclusion cavity. However, the disappearance of vapor bubble took place in a temperature interval of about 131.7 – 330.5℃. No distinct behavior or phase changes could be marked for the vibrating phase present in Type-VI inclusion to the freezing except that the movement gets arrested with the lowing of temperature. With the increase in temperature, the movement becomes relatively vigorous making it difficult to visualize the vapor bubble disappearance. Only on one instance, it is seen that the random movement of other phase got stopped in response to heating which is at 429 ℃. In other cases, partial homogenization is achieved with the temperature interval of 177.4℃ to 296.8℃. The density, calculated from the partial homogenization varies from 0.713 to 0.9 g/cc. The microthermometry data derived from each of colored inclusion such as green, faint greenish and brown is given in Table. 4.
8.3. Laser Raman Microspectrometry
Raman microspectrometry of some of the Type-I inclusions report water peak with a broader hump which indicate the low saline nature of the aqueous fluid [89,90,91]. In view of the occurrence of various compositional types of fluid inclusions containing various solid phases and coloration of aqueous liquid with non-responsive attitude during microthermometry, LRM was carried out to characterize the usual and the unusual inclusion types in BG domain. In reference to occurrence of solid like phases within the inclusion cavity as revealed from fluid inclusion petrography, the focus has been given to the Type-III and Type-V inclusions. Many silicate minerals such as mica/biotite, albite/anorthoclase, titanite along with carbonate and hydroxide such as calcite and edenite, respectively within the inclusion cavity of matrix quartz in BG could be detected from Raman microspectrometry (Figure 13a to e). The carbonic phase in Type-II and IV is devoid of any peaks other than CO2 as shown in Figure 14(a), (b) and (c). Presence of calcite in Type- IV inclusions is indicated from its Raman shift peak as shown in Figure 14(a). Raman Microspectrometry in quartz vein samples also indicate presence of silicate minerals such as pectolite, anorthoclase. Presence of carbonate minerals like burbankite [(Na, Ca)3(Sr, Ba, Ce)3(CO3)5; it is an accessory mineral in carbonatite] or could be some organic compound, oxide pseudobrookite (is an iron titanium oxide Fe2TiO5) as can be seen in Figure. 15(a) and (c). Rarely, presence of glass is also detected within the aqueous part of the inclusion cavity (Figure 15b). One of the type- VI inclusions present in vein quartz (Figure 11n) was considered for such study which did not show any characteristic peak except a broad hump for water (Figure 15d). Some representative Raman peaks and maps of fluid inclusions in vein quartz are also given in Figure 16.
Table 4.
Table showing the retrieve microthermometry data for some coloured inclusion.
| Coloured Inclusion | Tfm (°C) |
Tm (°C) |
Th (°C) |
Salinity (wt% NaCl eq.) |
Density (g/cc) |
|---|---|---|---|---|---|
| Green | NA | -16.6 | 118.5 | 20.12 | 1.091 |
| Faint-greenish | NA | -0.6 | 239.2 | 1.05 | 0.82 |
| Brown | NA | -1.8 | 209.7 | 3.05 | 0.877 |
8.4. Fluid Evolution
Attempts have been made to retrieve the trapping temperature and pressure from the co-existing Type-I and Type-II inclusions assuming they are coeval. However, only two such pairs could be identified in matrix quartz in BG and P-T value as determined from the intersecting isochores method [92] are 220℃ / 850 bars and 270℃/ 1560 bars (Figure 12f). Such estimation for P-T corresponds to immiscible region in the H2O-CO2-NaCl system which depicts a fluctuating fluid pressure possibly between purely lithostatic to intermediate conditions (~3 to 4 kilometer) whereas a Type-IV inclusion furnishes a pressure of 2.6 kb which corresponds to a depth of about 8 kilo meters and miscible regime of the aqueous-carbonic fluid. Moreover, the above pressure value (2.6 kb) is well correlated with the minimum pressure estimation done from hornblende barometry. These Type- IV inclusions possibly represent the earliest stage of fluid exsolution from BG which exhumed to shallower depth (indicated from pressures obtained from the intersecting isochores) and underwent brittle deformation.
Figure 14.
(a) Clear solid identified as calcite by bands at 282, 712 and 1087 cm-1 . Other bands are from host quartz; (b) No solids detected apart from quartz. CO2 identified by band at 1282 cm-1and (c) Raman map showing calcite and CO2, identified by band at 1086 cm-1 and band at 1282 cm-1 respectively. The corresponding peaks are shown in (d).
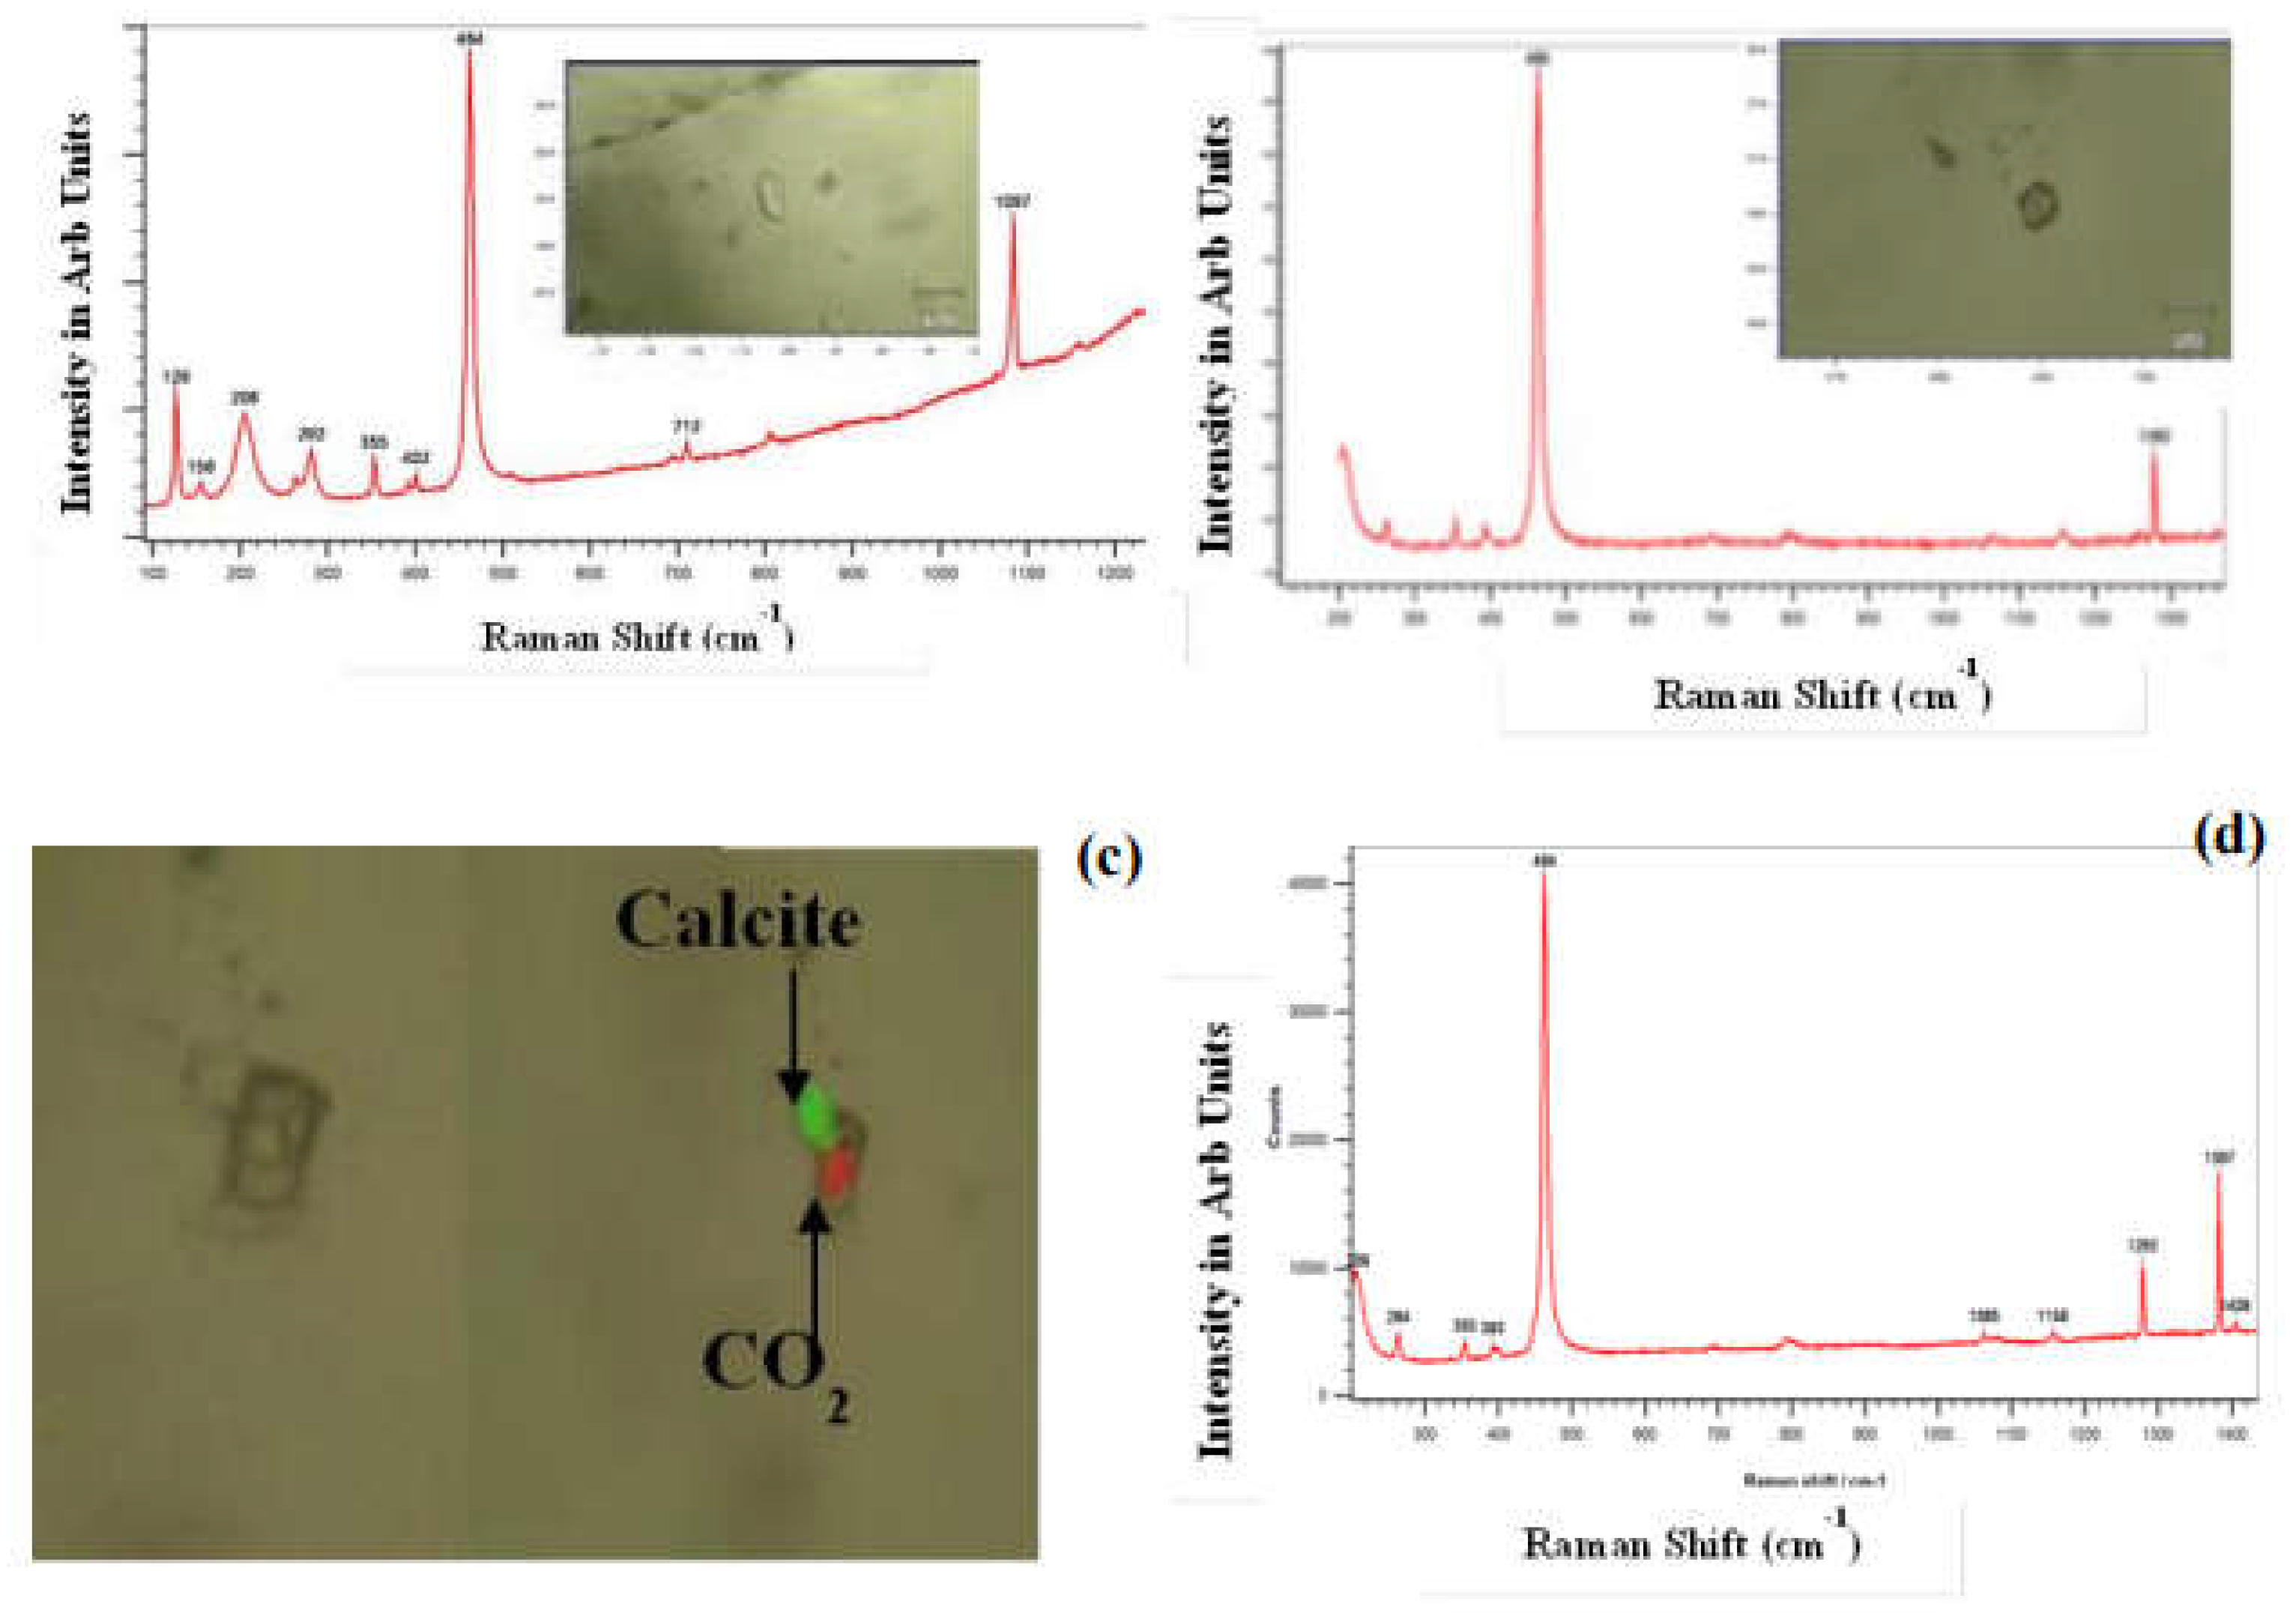
Figure 15.
(a) Pectolite identified by strong band at 650 cm-1 and OH band (not shown) and Anorthoclase identified by bands at 285 and 512 cm-1 ; (b) Broad bands at 232, 335 and 655 cm-1 indicate an identified glassy mineral; (c) Unidentified band at 1192 cm1 , possibly organic compound or member of Burbankite mineral group and Pseudobrookite identified by weak band at 695 cm-1 and (d) Inclusion which show no peak for moving phase however broad water peak can be marked.
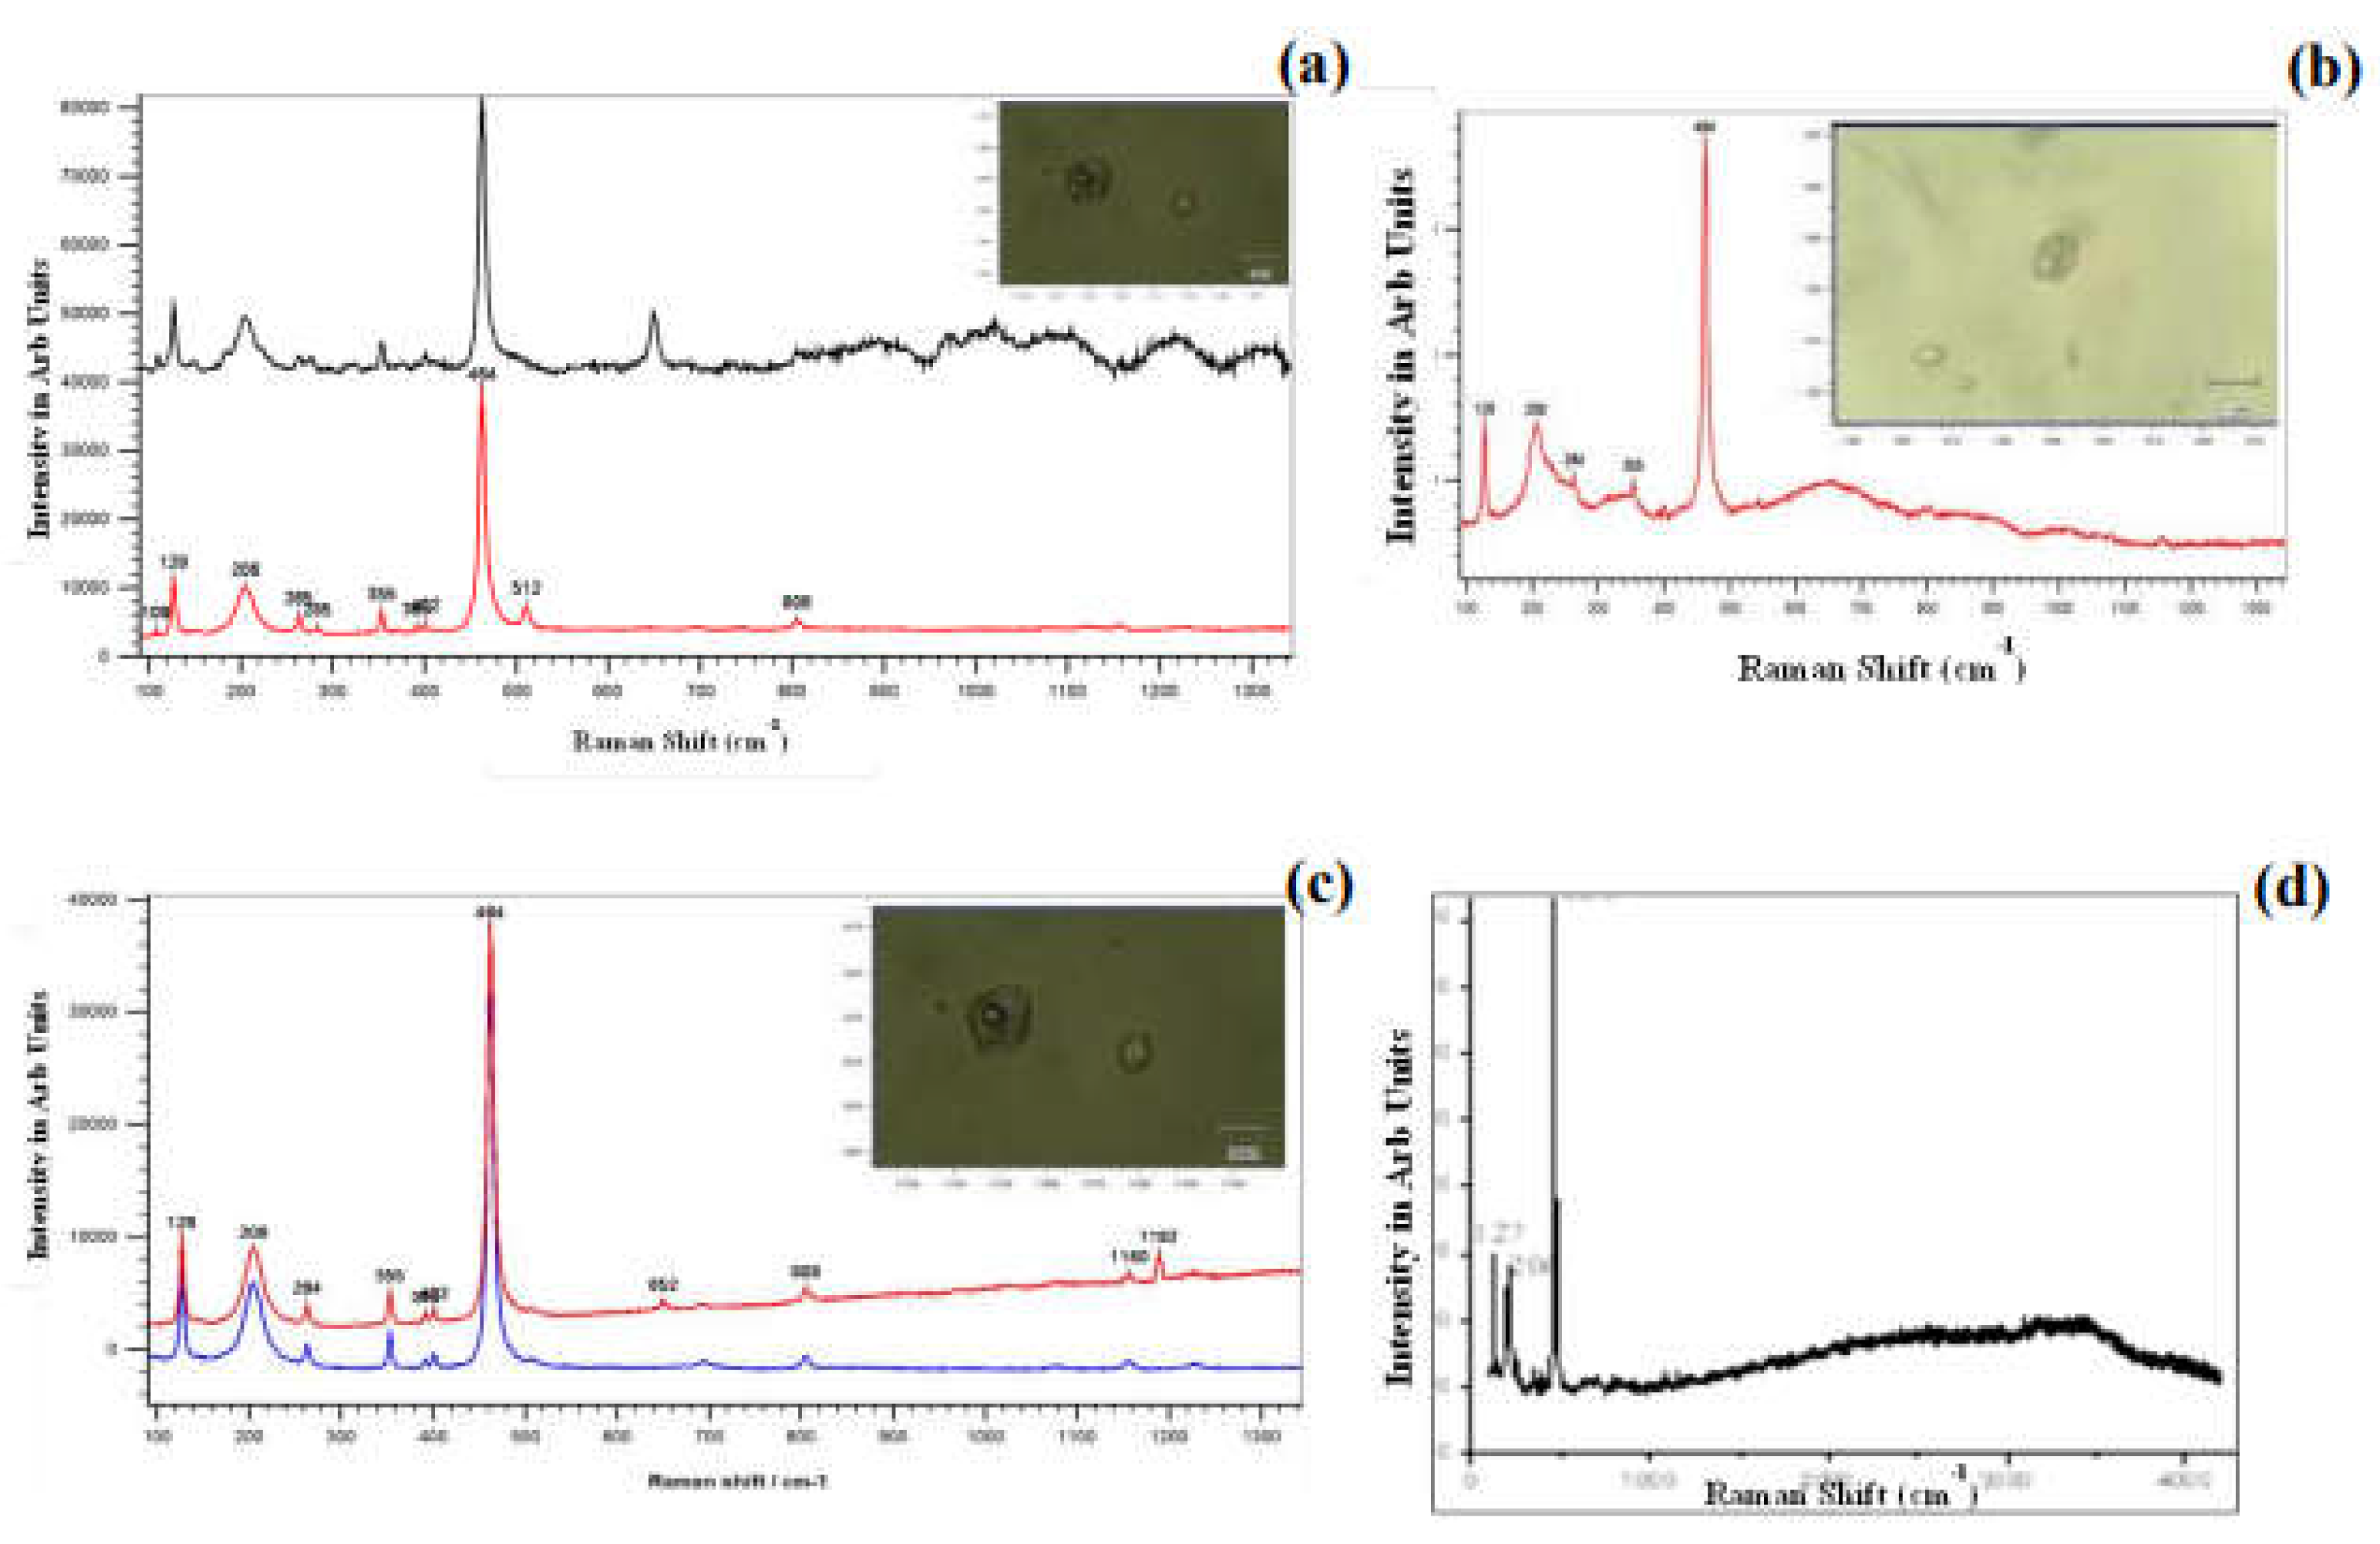
Figure 16.
(a) Green area = 1086 cm-1 band of calcite and Red area = 1285 cm-1 ` band of CO2 (b) CO2 detected in the vapour phase as indicated by peaks at 1283 and 1387 cm-1 . (c) Calcite identified by peaks at 282, 712 and 1086 cm-1 (d) CH4 detected by weak band at 2915 cm-1 in vapour phase(e) Calcite identified by bands at 282, 712 and 1086 cm-1 .
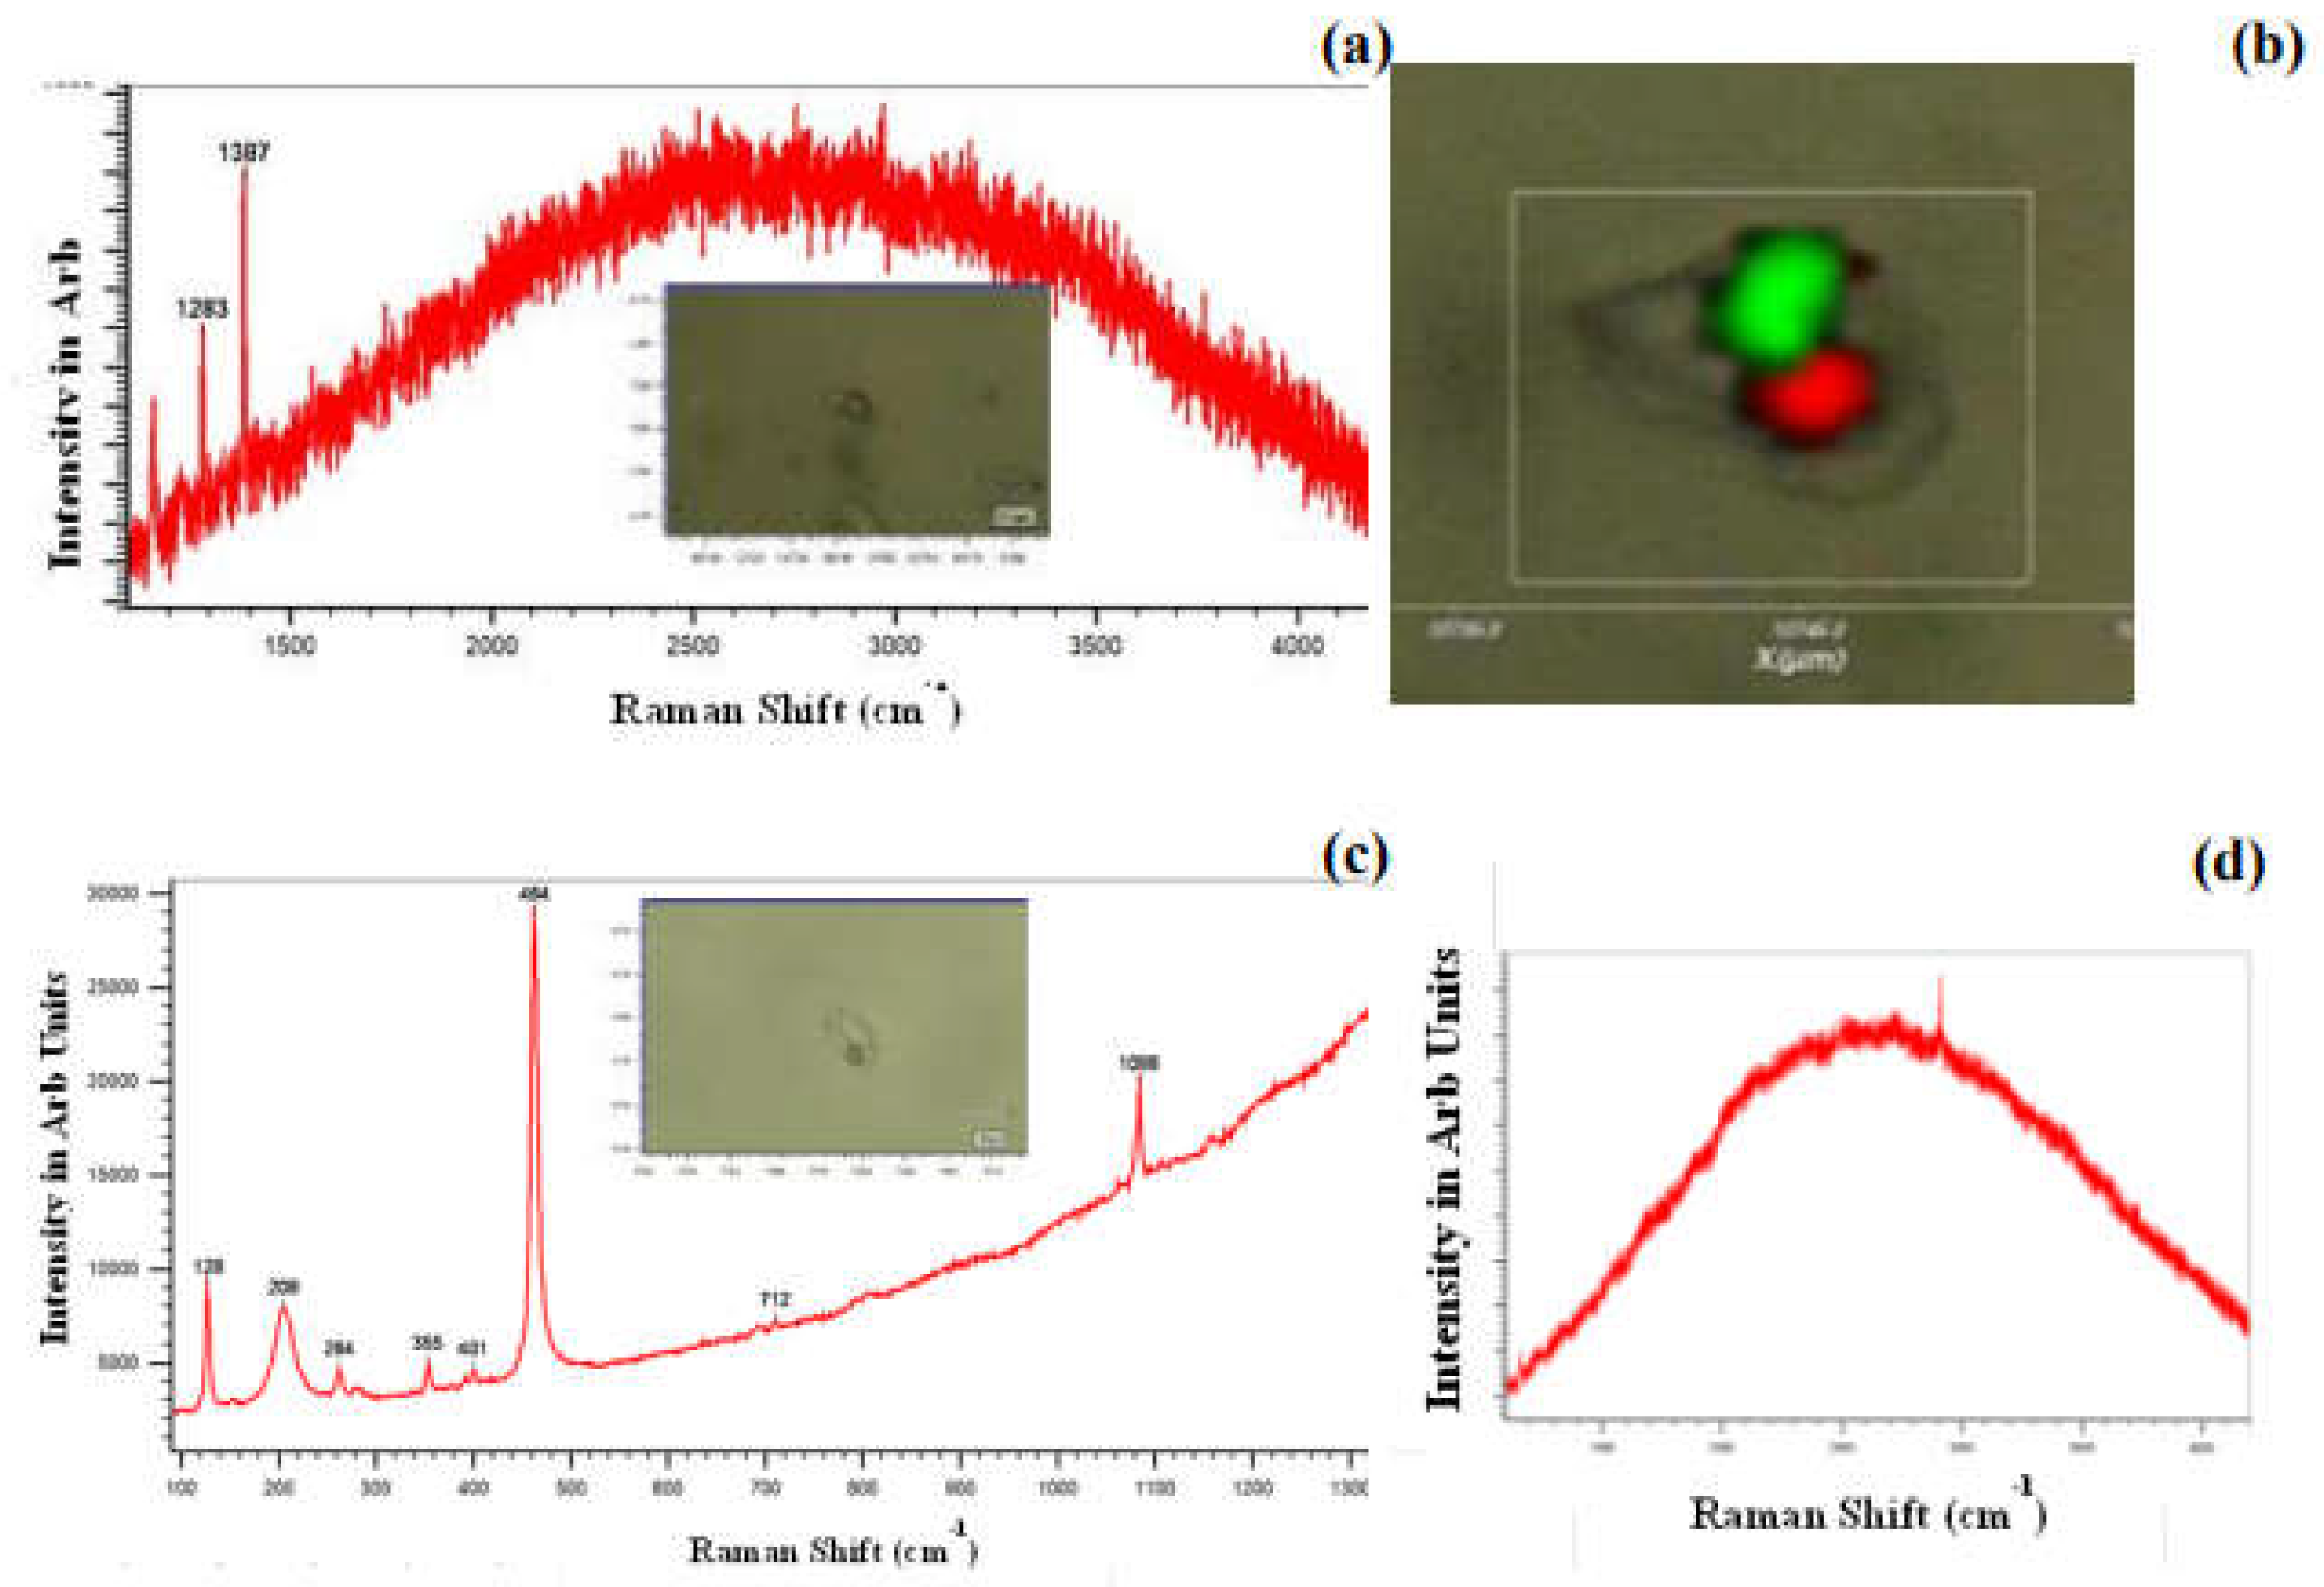
Figure 17.
Bivariate plot between Th (ᵒC) vs salinity (wt % NaCl eq) showing distribution of type I inclusions in various domain of matrix quartz (legend shown) and vein quartz associated with Bundelkhand Granitoid.
Figure 17.
Bivariate plot between Th (ᵒC) vs salinity (wt % NaCl eq) showing distribution of type I inclusions in various domain of matrix quartz (legend shown) and vein quartz associated with Bundelkhand Granitoid.
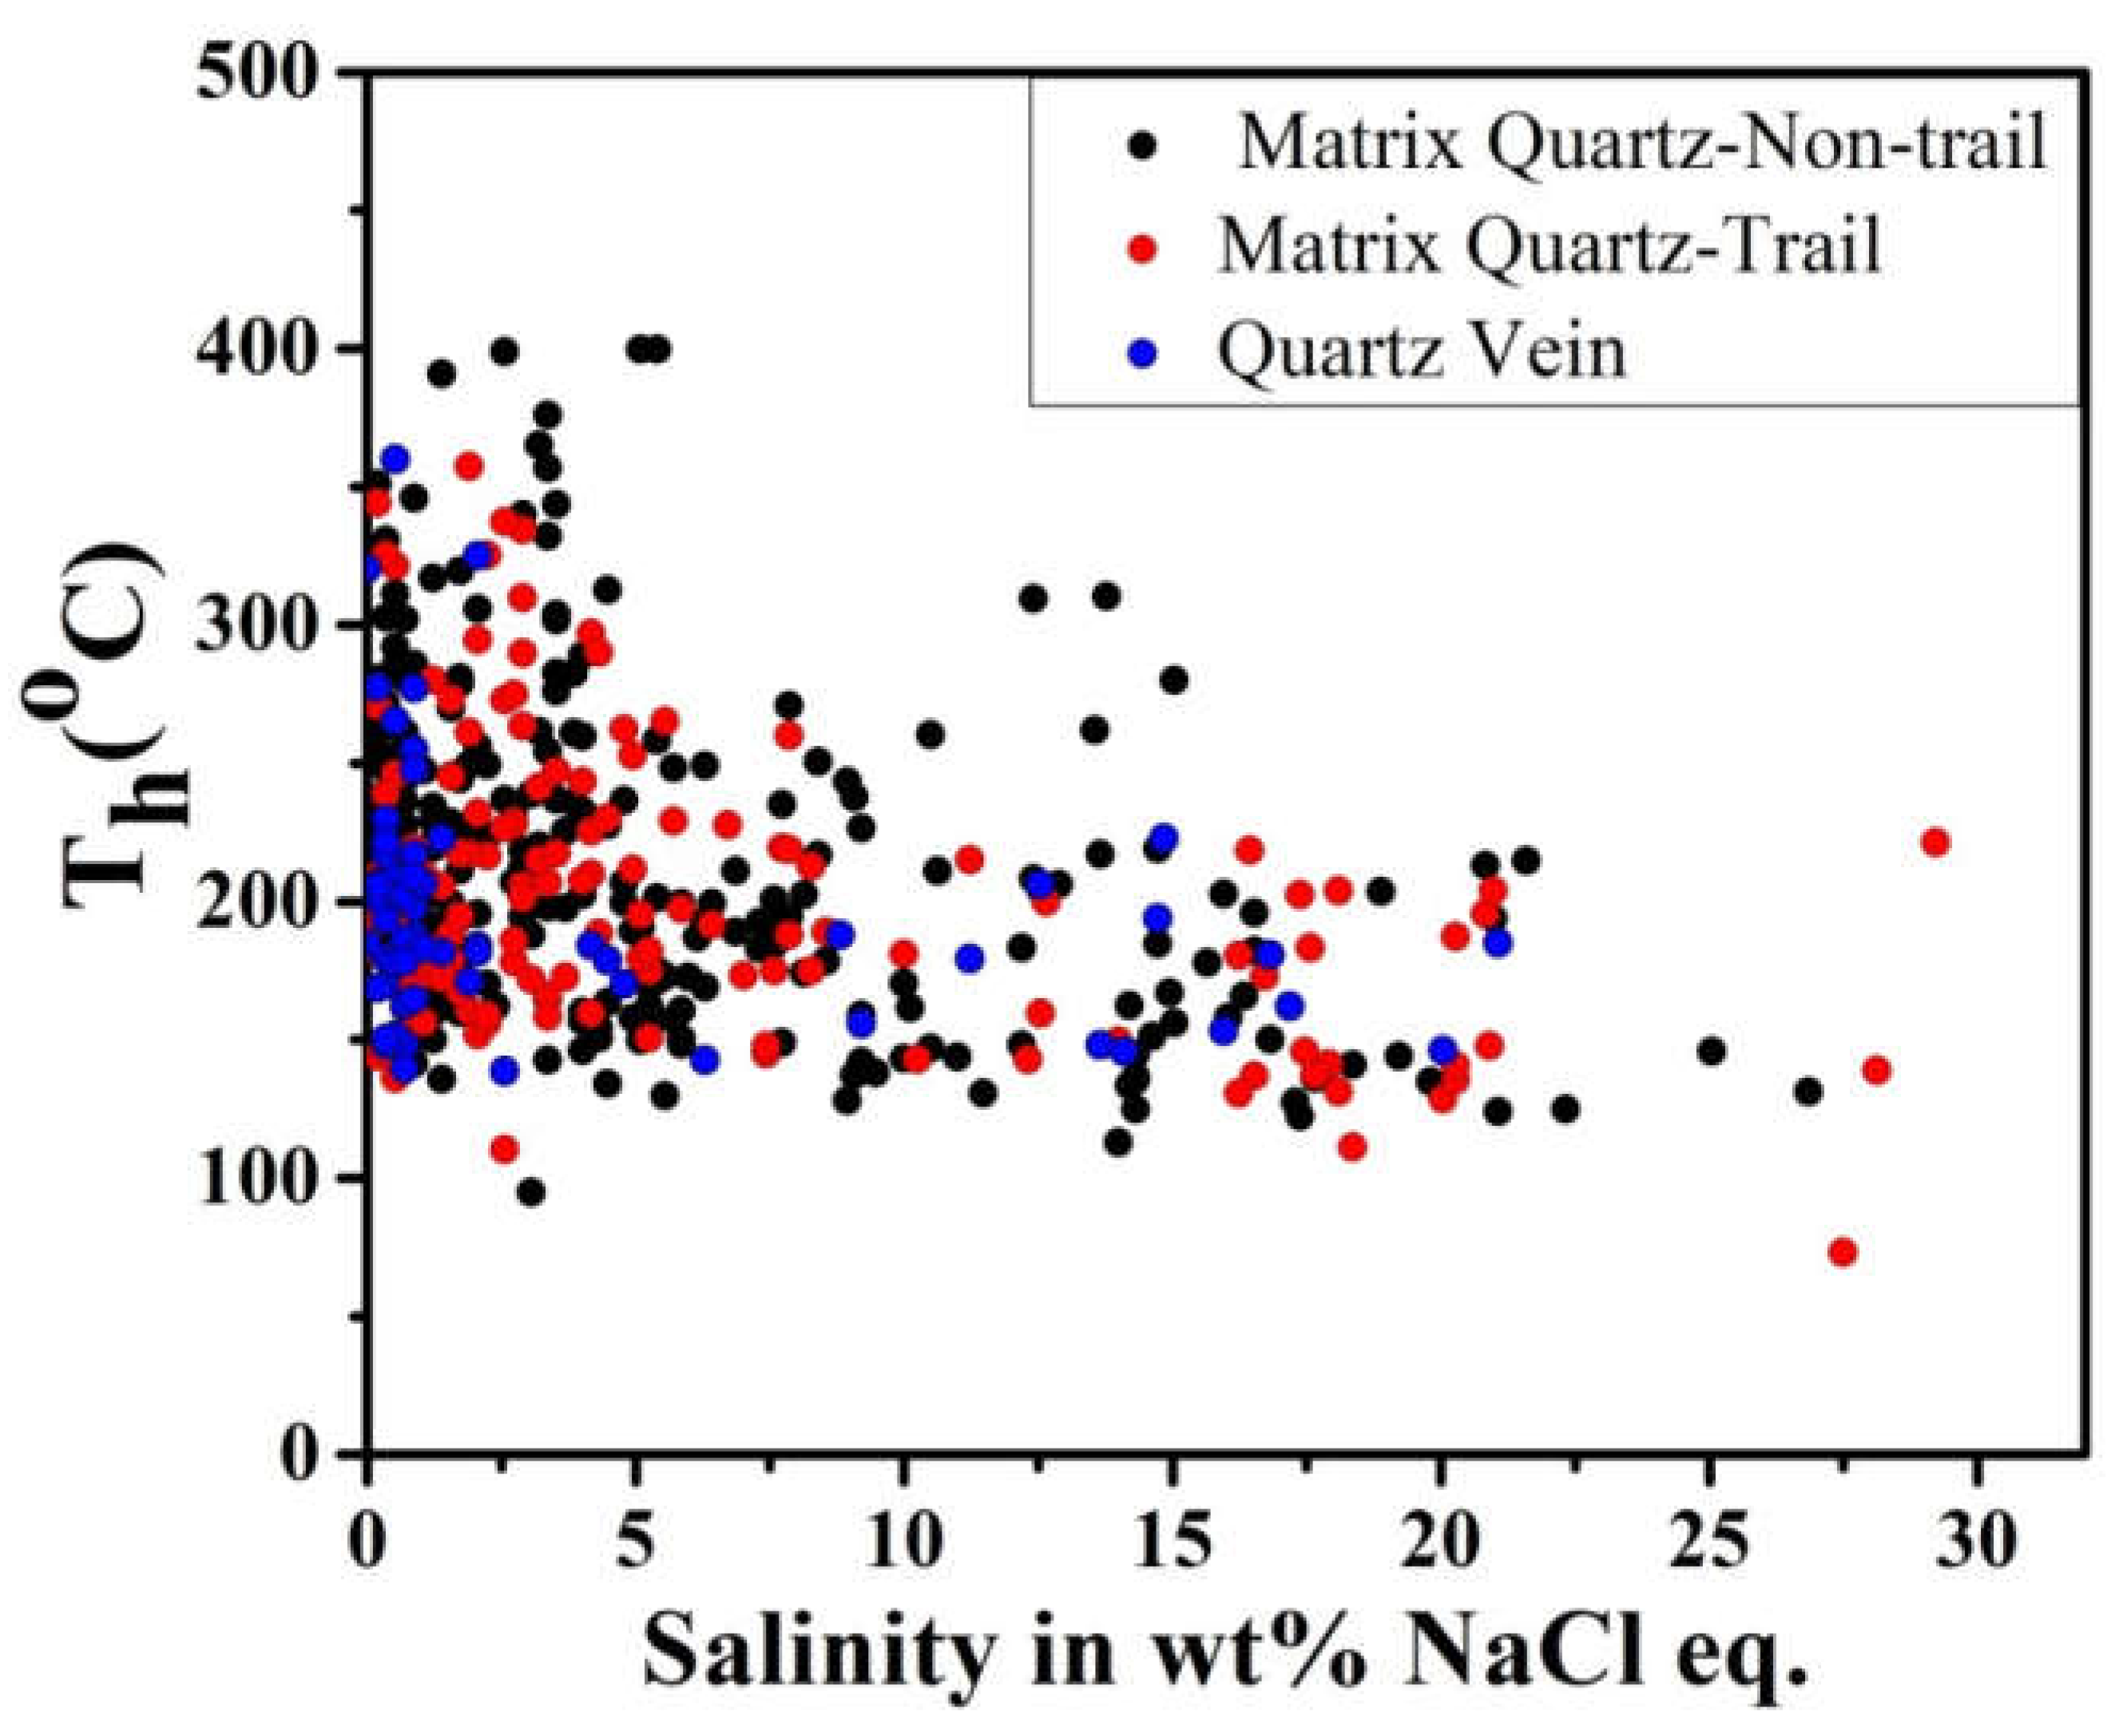
The distributions of data points in temperature versus salinity plot (Figure 17) indicate a dominant mixing trend parallel to the temperature axis. It may be noted that such fluid evolution diagram remains incomplete since data of the carbonic and aqueous-carbonic inclusions cannot be included on such a plot. In addition to that aqueous-carbonic inclusions represent the higher temperature range in the thermal spectrum. Besides, temperatures of homogenization are not pressure corrected and only give a tentative picture. Within these limitations, a mixing trend with two fluid components – one a low salinity and low temperature meteoric fluid and a moderate salinity and higher temperature fluid component could be identified. The consistency in the trend can also be marked in all domains as shown in the legend. Moreover, it is also observed that the low-salinity (~5wt% NaCl eq.) fluid has a considerable spread in temperature up to ~400℃ possibly ascribed to a transient heating of the fluid during its evolution in BG. Alternatively, this high temperature fluid of low salinity could also represent the earliest phase of exsolved fluid from the BG magma. Thus, a close look at the fluid evolution diagram (Figure 17) indicates interplay of three different fluids: (i) a low temperature- low-saline (LTLS), (ii) high temperature- low-saline (HTLS) and (iii) moderate-temperature and moderately high-saline (MTMS) fluids. The LTLS fluid in all probabilities is a meteoric fluid. The MTMS fluid in BG is interpreted to be the late-stage fluid that evolved internally within BG with incursion of meteoric water. HTLS fluid with CO2 in BG is a definitive magmatic component and may represent an early fraction of the fluid exsolved from the granitic magma with the initiation of quartz crystallization. The low salinity is expected since a higher concentration of CO2 would lower solubility of salts. The immiscibility is also evident by the association of Type-I, II and IV inclusions though they are rare or restricted in occurrences. In such instances, there is a greater possibility that the partitioning of the solutes present in aqueous-carbonic fluid will be in its aqueous component rather than the carbonic counterpart. This, in turn, can also increase the salinity in the aqueous fluid.
8.5. Significance of Type V and VI Inclusions
Microthermometry on solid phases bearing inclusions as well as unusual type inclusions failed to provide information related to temperature as well as their salinity. Raman spectra of many such solid phases suggest that they are silicate and carbonate minerals or rarely oxide. One possible origin for these phases could be their captive nature indicating presence as suspended mineral particles in the fluid precipitating quartz, while the fluid was evolving in a closed system. The captive phases in these inclusions (Type-III and VI) are not different from the secondary mineral phases in BG, hence, are explainable. In contrast to this, the recurrence of such phases in fluid inclusion assemblages could also suggest the possible presence of silicothermal fluid (K2O-CO2-SiO2-H2O system of Wilkinson et al. [93] in BG from which they might have precipitated as daughter crystals with decrease in P-T condition. According to Wilkinson et al. [93], a silica rich (~90 wt% SiO2) fluid can coexist with a supercritical, alkaline, aqueous-carbonic fluid in which immiscibility can be achieved in P-T conditions of <200MPa and 300℃ to >750℃, respectively. In the present context the Type-III inclusions in matrix quartz in BG is very much similar to the inclusions reported by them. These inclusions are also seen to co-exist with Type-I (aqueous biphase) and Type-IV inclusions (aqueous-carbonic). Thus, the aforementioned assemblage could owe their origin due to heterogeneous entrapment suggesting immiscibility in the late stage fluid that evolved in BG. Many workers also inferred occurrence of siliceous fluid along with aqueous fluid at a variable P-T condition such as Morey and Fleischer [95] who suggested a moderate temperature (340℃–500℃) and a low pressures value of 20–40 MPa in the system K2O-SiO2-H2O. If, at all, they represent the above KCSH system, they can be vital in reference to the huge mobilization of silica in such shallow crustal domain without the demand of staggering amount of fluid.
Another possibility could be that they might represent the primary silicate gel as reported by Thomas and Davidson [94]. According to them, gel inclusions have resemblance with the fluid inclusions with a shrinkage bubble and the larger volume fraction (50 to 100%) of which is occupied with the solid materials. Essentially, they can be visualized with micrometer sized granular mass, primarily quartz grains which may form irregular clusters after the accretions of aforementioned granular masses. Besides feldspar, FeOOH and cristobalite do occur within it leaving the remaining portion of fluid inclusion cavity occupied by alkali-carbonate bearing aqueous solution and a vapor bubble. Thus, quartz, feldspar and calcite constitute some common solid phases in them. Likewise, BG has also some notable occurrence of calcite-bearing aqueous-carbonic inclusions along with other silicate phases like albite. Thomas and Davidson [94] suggested their probable formation in a colloidal state which may act as an useful link for the formation of giant quartz reef in the BC.
9. Modeling of Crystallization Evolution of BG
In order to model the crystallization evolution of BG, the pressure estimated from hornblende was considered with an approximate value of 3.5 kb. At this condition, the liquidus temperature was calculated corresponding to each bulk composition. The temperature varies from ~1017 to 1135℃. At this P-T condition, water saturation was calculated to be 7.68 to 8.94 wt%. The water solubility as calculated with the help of Holtz et al. [74]’s formulation varies broadly from 4.53 to 11.17 wt%. The bulk geochemical data were then normalized to 100% with respect to the estimated water saturation values from PELE and the liquidus temperature was re-calculated with respect to water saturated condition which suggests a value of ~754℃ to 967℃. This temperature is very much similar to the apatite saturation and zircon saturation temperatures which are ~809℃ to 966 ℃ and 852℃ to 977 ℃, respectively (utilizing the Kaur et al. [10] database). According to Puziewicz [96] there could be a temperature difference of 100℃ to 200 ℃ in the crystallization of a anhydrous and hydrous granitic melt. Usually, water unsaturated granitic melt crystallizes at 900℃ to 850 ℃. In that respect, the liquidus temperature as estimated from computer modelling of BG with water saturated condition seemed appropriate. Simulation of crystallization from liquidus temperature to a P-T value of 400 ℃ and 1500 bars (guided by data obtained from mineral chemistry and fluid inclusions) was done. The output furnished saturated phases commonly as biotite, titanite, plagioclase and alkali feldspar. The output file of simulation of crystallization evolution is furnished as Supplementary Data (Supplementary Data1.docx). The results indicate about 60% solidification with matching chemistry of plagioclase. A water content as high as 16 % is indicated at this stage which might suggest the onset of magmatic-hydrothermal transition and formation of some early quartz with ‘silicothermal’ [93] fluid and explains the entrapment of the unusual solid-bearing inclusions.
10. Discussion
The dominance of very coarse to medium grained nature of BG suggests their emplacement in a range of depths from deeper to intermediate levels in the crust which is supported by the pressure data obtained using the hornblende barometer [52] that is >1 kilobar to ~6 kilobar. Since hornblende is not uniformly abundant in BG, a clear picture of variation of pressure in space could not be obtained which would have otherwise indicated different crustal level of exposure of the pluton. In all, BG originated at great depth (~18km/6kb) from which the crystallization was initiated progressively through mid to shallow crustal (~8–10km/1–2kb) condition. During this long stretch, the crystallization history from magmatic temperature to its sub-solidus condition can be retrieved through various geothermometers that depicts various stages of its evolutionary history. According to Naney [97], magmatic biotite most likely crystallizes or equilibrates at approximately 680 ℃ (near-solidus temperature) and remains stable up to complete crystallization of the rock Thus, the three different temperatures range of apatite-biotite thermometry in a sample may corroborate to three different events of thermal history in BG during its evolution. The higher temperature (~823℃) may be indicative of minimum magmatic temperature for BG. This is due to the fact that apatite comes first in the crystallizing sequence in felsic magma approximately around 900℃ – 924℃ [98,99] thereby establishing the equilibrium relationship with the enclosing biotite and the said temperature seems plausible. Since all the biotite analyses plot in the field of re-equilibrated biotite [31] mostly close to the primary biotite field, the Ti-thermometry in them may suggest re-equilibration near to the solidus after the solidification of BG. This coincides with the median temperature range of biotite-apatite geothermometer (671℃ – 685℃). Thus, the lower thermal signature (393.6℃ – 489.6℃) of apatite-biotite pair implies that there might have some later modification to the equilibration in response to the later fluid activity [79] although this geothermometer is less prone to sub-solidus re-equilibration compared to carbonates and oxides [100].
Combining the present petrographic study and mineral chemical analysis of epidote, some fully or partially enclosed epidote within biotite and hornblende, association with felsic minerals such as plagioclase with resorbed outlines can be presumed to be of magmatic origin although there is difference of opinion [45,47,101] in establishing their magmatic nature. It implies that BG must have experienced a rapid ascent to avoid complete resorption of mEp. Hence, diking is more appropriate mechanism of their emplacement rather than diapirism [102]. Appearance of mEp in a granitic magma at moderate to higher pressure (6 to 8 kb) is very much dependent on the composition and emplacement condition of the granitic magma [45,97]. The experimental study of Schmidt and Thompson [103] on epidote in calc-alkaline magma at H2O saturation and fO2 of NNO buffer condition depicts a minimum of 5 kb pressure within the stability field of epidote in tonalitic magma. At higher oxygen fugacity condition such as HM buffer, the stability field is widened up to 3 kb. Resemblance of such pressure range to the present hornblende barometry data and broad oxygen fugacity is in support of mEp transport in BG.
Our observations and data do not corroborate the hypothesis of interplay of hot (~900 °C) mantle-derived fluid resulting in filling of mesoscale fracture network in pink K-feldspar megacrysts with melanocratic veins, as proposed by Sensarma et al [104], based on the high FeO content of K-feldspar. The K-feldspar megacrysts preserve their triclinicity and unlikely to have been infiltrated by such high temperature fluid. According to Teiber et al. [75] and Słaby and Domańska-Siuda [105], mantle supplements are usually rich in Cl and interaction of even a small volume of mantle derived material will enhance the Cl-concentration in the system. However, there is no significant variation in F/Cl ratio in hornblende (Figure 8a). Although, some fluctuation in F/Cl ratios were seen in biotite, they were not substantial and that too indicate increase in F/Cl which should have been the reverse if they would have interacted with such a high-temperature (950℃) mantle derived melt/fluid. Moreover, such reddening is a usual feature seen in Proterozoic granites worldwide such as granitic terranes in Bastar and Eastern Dharwar cartons [88,106] where pink granites are ubiquitous and localized reddening of K-feldspar is observed wherever there is intense fluid activity (often with mineralization) without any spatial influence of mafic dykes. Putnis et al. [107] and Plümper and Putnis [108] also supported the occurrence of sub-microscopic inclusions of hematite in the alkali feldspar to be the main reason behind reddening in such Proterozoic granites as like Sensarma et al. [104]. However, according to them, hematite inclusion in feldspar could have variable origin such as both could have co-precipitation from granitic melt or could be the result of solid state exsolution from Fe3+-bearing solid solution or could be the manifestation of external introduction of Fe-bearing fluids to the crystallizing granite. It is also considered that sub-solidus deuteric reactions in the presence of fluid is another factor which causes brick red coloration in Pre-Cambrian granites as suggested by Plümper and Putnis [108]. Further, Colleps et al. [109] reported a long-term low-temperature evolution of the ~2.5–3.3 Ga Bundelkhand Craton and the surrounding ~0.9–1.7 Ga Vindhyan basin in central India. Petrography of BG also support a pervasive alteration in BG rather any structure-controlled alteration which is well marked with variable degrees of sericitization of plagioclase, chloritization of hornblende and biotite. The occurrence of specks of magnetite within hornblende as a distinct rim as well as fine grained quartz and titanite (petrography section) can be referred here which indicates deuteric alteration of hornblende, possibly in a more oxidizing fluid. The similar and wide range of Ps-content in most of the textural categories of epidote of thecurrent study might be due to a broad disparity in fO2 condition in the system [45,47].
The estimation of water content using the formulation of Holtz et al. [74] furnished variable water saturation (5.25 to 10.78wt %) for BG during its evolution with hornblende as a crystalizing phase. The importance of initial water content on the occurrence of equilibrium assemblages in magma can be furnished from the experimental work of Naney [97]. He proposed a paragenetic sequence of orthopyroxene, biotite, clinopyroxene, orthopyroxene (resorbed), plagioclase, alkali feldspar, clinopyroxene (resorbed) and quartz for a granitic magma at 5 wt% H2O and 2 kb pressure. On the other hand, he inferred that an augitic clinopyroxene crystallized from an anhydrous bulk granitic composition replaced by hornblende when changed to granodioritic composition. This might be another alternate perspective to think upon the commencement of normative pyroxene for BG in CIPW normative calculations without any modal pyroxene or olivine in them whereas Sensarma et al. [13] linked this normative pyroxene to the green color mafic veins of variable scales dispersed within BG. On the other hand, presence of hornblende in a granodioritic system suggests a minimum of 4 to 2.5wt% of H2O-content for its stability at the pressure value of 2 to 8 kb, respectively.
Fluid inclusion data are reported with the dominance of low salinity fluid (0-5wt% NaCl equivalent) in the matrix as well as in vein quartz which is well observable within a broad span of temperature of ~100℃ to 400℃. The overall fluid characteristics as depicted in the fluid evolution diagram provide a qualitative picture for the evolution of fluid in BG. Although, high temperature and CO2 bearing fluid are reported from the fluid inclusion study, they do not compare well with the metamorphic fluid as reported in granite greenstone terrane [110]. Although carbonic fluid is present, their restricted presence in some of the sample as well as lack of CH4 favors a magmatic fluid over metamorphic one. Besides, the prevailing action of meteoric fluid which can be visualized as mixing trend in the fluid evolution diagram suggest an internal evolution of fluid within the BG domain. Hence, the present work mostly visualizes an internally evolved fluid within BG instead of its pristine magmatic nature [88,111,112]. While Allan and Yardley [111] ascribed the incursion of meteoric fluid for the pervasive deuteric alteration in the granitoids, Reed et al. [112] demonstrated that a single magmatic fluid can also evolve to LSLT condition after a prolonged fluid-rock interaction. In either of the cases, fluid of such moderate temperature-salinity characteristics is quite likely to have been sourced from a granitoid, representing a late-stage pervasive fluid in intergranular spaces or a fluid resulting from mixing of a late-magmatic fluid with meteoric fluid in network of fractures. The occurrence of almost every kind of inclusion in both the matrix quartz and the quartz veins/stringer of BG, in conjunction with the involvement of a moderate salinity-moderate temperature (MSMT) fluid, strengthens the hypothesis that similar fluid types were involved during their formation. Moreover, such similarity can be achieved when a comparison is made with the fluid characteristics of quartz reef and associated quartz veins [4] with the present fluid inclusion work in the matrix quartz of BG (host of quartz reef) as well as associated quartz veins. Rout et al [4] also reported presence of similar varieties of fluid inclusion types like in the BG regime except Type- III inclusions which is a rare situation in the quartz reef domain. Furthermore, the fluid evolution diagram has a striking resemblance with each other as if a mirror image in a first instance. Nevertheless, the disparities among them such as prevalence of effervescence inclusions in the quartz reef domain and dominance of Type-III inclusions along with comparatively more carbonic inclusions in the BG regime are well explainable in references to the ambient physico-chemical environment of evolution. Thus, the precipitation of matrix quartz of BG as well as associated quartz veins and origin of quartz reefs as well as the sub-ordinate quartz veins represent the same fluid encircling within BG and the meteoric incursion which is continuously evolving with the interaction of BG. They all owe their formation during the protracted period of crystallization of BG.
11. Conclusions
The Bundelkhand granodiorite, like many other early-Proterozoic granitoids in the Indian shield preserves imprints of crystallization evolution from magmatic temperatures and pressures (in excess of 900 ℃ and mid-crustal pressures) down to low temperature deuteric hydrothermal stages. The spectrum of mineral assemblages is from apatite, hornblende, plagioclase, magmatic epidote through biotite and late epidote, chlorite. This gradual decrease in pressure-temperature conditions is in general agreement with the fluid evolution down to low-temperatures and pressures registered in fluid inclusions. Two stages of immiscibility are reported here from the fluid inclusion assemblages: one with Type-I, III and IV inclusions and second with Type-I, II and IV inclusions although they are rare or restricted in occurrences. Even though precise quantitative modelling has not been possible, results of modelling exercises indicate that the water content of the residual melt could increase to nearly double the value with 60% crystallization without much of crystallization of quartz retaining alkali metals in significant proportion. Modelling has only been possible down to 1500 bars and 400 ℃ and such a residual water charged melt is likely to have the identity of ‘silicothermal’ fluid (that was trapped in quartz crystallizing at that stage), that was later transformed to an aqueous framework precipitating K-feldspar megacrysts, the bulk of the matrix quartz, chloritic alteration of biotite as well as precipitation of late chlorite-epidote veins. Intermittent incursion of meteoric fluid would have resulted in further evolution of the BG’s fluid internally that was the most likely source for the giant quartz reefs on major fracture zones [4].
Supplementary Materials
There is no supplementary materials for this manuscript. EPMA data can be shared on request.
Author Contributions
DR carried out fieldwork, prepared samples, did mineral analysis and fluid inclusion microthermometry and took major role in preparing the manuscript. JKP introduced the Bundelkhand problem, JKP and MKP guided in fieldwork and supervised in all subsequent stages of the work. TPM carried out all LRM work and interpreted results. JKP, MKP and TPM contributed in preparation of the final version of the manuscript before submission.
Acknowledgements
DR acknowledges the host Institute for financial assistance in the form of Research Assistantship during the tenure of her doctoral program and the host Department. DR also acknowledges Dinesh Pandit and Anil Champati for their help during the EPMA work in BHU, India and IIT (ISM) Dhanbad respectively. The work presented here is a part of the Doctoral Thesis of DR. TPM acknowledges that this work has been made possible by access to the Raman Lab at the ACT node of the Australian National Fabrication Facility (ANFF – ACT). MKP acknowledges support from the Department of Science & Technology, Government of India and Ministry of Earth Science, Government of India for past funding for the equipment support for Fluid Inclusion work and the host Institute for extending financial support for the computational facilities.
Conflicts of Interest
The authors declare that there is no conflict of interest in regard to publication of this paper.
References
- Dey, S.; Moyen, J.F. Archean granitoids of India: windows into early Earth tectonics–an introduction. Geological Society, London, Special Publications 2020, 489, 1–13. [Google Scholar] [CrossRef]
- Vigneresse, J.L. Control of granite emplacement by regional deformation. Tectonophysics 1995, 249, 173–186. [Google Scholar] [CrossRef]
- Petford, N.; Cruden, A. R. , McCaffrey, K. J. W., & Vigneresse, J. L. Granite magma formation, transport and emplacement in the Earth’s crust. Nature 2000, 408, 669–673. [Google Scholar]
- Rout, D.; Panigrahi, M. K. , Mernagh, T. P., & Pati, J. K. Origin of the Paleoproterozoic “Giant Quartz Reef” System in the Bundelkhand Craton, India: Constraints from Fluid Inclusion Microthermometry, Raman Spectroscopy, and Geochemical Modelling. Lithosphere 2022, 2022 (Special 8), 3899542. [Google Scholar]
- Rahman, A.; Zainuddin, S.M. Bundelkhand granites: an example of collisionrelated Precambrian magmatism and its relevance to the evolution of the Central Indian Shield. Journal of Geology 1993, 101, 413–419. [Google Scholar] [CrossRef]
- Mondal, M.E. A. , Goswami, J. N., Deomurari, M. P., & Sharma, K. K. Ion microprobe 207Pb/206Pb ages of zircons from the Bundelkhand massif, northern India: Implications for crustal evolution of the Bundelkhand-Aravalli protocontinent. Precambrian Research 2002, 117, 85–100. [Google Scholar]
- Menon, R.; Kumar, P. S. , Reddy, G. K., & Srinivasan, R. Radiogenic heat production of Late Archaean Bundelkhand granite and some Proterozoic gneisses and granitoids of central India. Current Science-Banglore- 2003, 85, 634–638. [Google Scholar]
- Mohan, M. R. , Singh, S. P., Santosh, M., Siddiqui, M. A., & Balaram, V. TTG suite from the Bundelkhand Craton, Central India: Geochemistry, petrogenesis and implications for Archean crustal evolution. Journal of Asian Earth Sciences 2012, 58, 38–50. [Google Scholar]
- Pati, J. K. , Panigrahi, M. K., & Chakarborty, M. Granite-hosted molybdenite mineralization from Archean Bundelkhand Craton-molybdenite characterization, host rock mineralogy, petrology, and fluid inclusion characteristics of MO-bearing quartz. Journal of Earth System Science 2014, 123, 943–958. [Google Scholar]
- Kaur, P.; Zeh, A.; Chaudhri, N.; Eliyas, N. Unravelling the record of Archaean crustal evolution of the Bundelkhand Craton, northern India using U–Pb zircon– monazite ages, Lu–Hf isotope systematics, and whole-rock geochemistry of granitoids. Precambrian Research 2016, 281, 384–413. [Google Scholar] [CrossRef]
- Joshi, K. B. , Bhattacharjee, J., Rai, G., Halla, J., Ahmad, T., Kurhila, M., Heilimo, E., & Choudhary, A. K. The diversification of granitoids and plate tectonic implications at the archaean-Proterozoic boundary in the bundelkhand Craton, Central India. Geological Society, London, Special Publications 2017, 449, 123–157. [Google Scholar]
- Chauhan, H.; Saikia, A.; Ahmad, T. Episodic crustal growth in the Bundelkhand Craton of central India shield: Constraints from petrogenesis of the tonalite– trondhjemite–granodiorite gneisses and K-rich granites of Bundelkhand tectonic zone. Journal of Earth System Science 2018, 127, 44. [Google Scholar] [CrossRef]
- Sensarma, S.; Matin, A.; Paul, D.; Madhesiya, A. K. , & Sarkar, G. Evolution of a crustal-scale silicic to intermediate tectono-magmatic system: The ~ 2600–2300 Ma Bundelkhand granitoid, India. Precambrian Research 2021, 352, 105951. [Google Scholar]
- Verma, S. K. , Verma, S. P., Oliveira, E. P., Singh, V. K., & Moreno, J. A. LA- FICP-MS zircon U-Pb geochronology of granitic rocks from the central Bundelkhand greenstone complex, Bundelkhand Craton, India. Journal of Asian Earth Sciences 2016, 118, 125–137. [Google Scholar]
- Roday, P. P. , Diwan, P., & Singh, S. A kinematic model of emplacement of quartz reefs and subsequent deformation patterns in the central Indian Bundelkhand batholith. Proceedings of the Indian Academy of Sciences - Earth and PlanetarySciences 1995, 104, 465–488. [Google Scholar]
- Mondal, M.E. A. , Sharma, K. K., Rahman, A., & Goswami, J. N. Ion microprobe 207Pb/206Pb zircon ages for gneiss-granitoid rocks from Bundelkhand massif: Evidence for Archaean components. Current Science 1998, 70–75. [Google Scholar]
- Pati, J.K. Study of granitoid mylonites and reef/vein quartz in parts of Bundelkhand Granitoid Complex (BGC). Rec. Geol. Surv. India 1999, 131, 95–96. [Google Scholar]
- Slabunov, A. I. , & Singh, V. K. Giant quartz veins of the Bundelkhand craton, Indian shield: new geological data and U-Th-Pb age. Minerals 2022, 12, 168. [Google Scholar]
- Pati, J. K. , Patel, S. C., Pruseth, K. L., Malviya, V. P., Arima, M., Raju, S., Pati, P., & Prakash, K. Geology and geochemistry of giant quartz veins from the Bundelkhand Craton, central India and their implications. Journal of Earth System Science 2007, 116, 497–510. [Google Scholar]
- Panigrahi, M.K. and Acharya, S. S. A Microsoft EXCEL 2007 and MS Visual BASIC Macro Based Software Package for Computation of Density and Isochores of Fluid Inclusions. Proceedings ACROFI-III and TBG-XIV Novosibirsk. 2010, 160–161. [Google Scholar]
- Boudreau, A.E. PELE-a version of the MELTS software program for the PC platform. Computers and Geosciences 1999, 25, 201–203. [Google Scholar] [CrossRef]
- Basu, A.K. Role of the Bundelkhand Granite Massif and the Son-Narmada megafault in Precambrian crustal evolution and tectonism in Central and Western India. Journal of the Geological Society of India 2007, 70, 745–770. [Google Scholar]
- Pati, J.K. Evolution of Bundelkhand Craton. Episodes Journal of International Geoscience 2020, 43, 69–87. [Google Scholar] [CrossRef]
- Worden, R.H., ; ; Walker, F.D.L.; Parsons, I.; Brown, W.L. Development of microporosity, diffusion channels and deuteric coarsening in perthitic alkali feldspars; 1990. [Google Scholar]
- Kroll, H.; Evangelakakis, C.; Voll, G. Two-feldspar geothermometry: a review and revision for slowly cooled rocks. Contributions to Mineralogy and Petrology 1993, 114, 510–518. [Google Scholar] [CrossRef]
- Otten, M.T. The origin of brown hornblende in the Artfjället gabbro and dolerites. Contributions to Mineralogy and Petrology 1984, 86, 189–199. [Google Scholar] [CrossRef]
- Fleet, M.E.; Barnett, R.L. Al iv/Al vi partitioning in calciferous amphiboles from the Frood Mine, Sudbury, Ontario. Can. Mineral. 1978, 16, 527–532. [Google Scholar]
- Yavuz, F. WinAmphcal: A Windows program for the IMA-04 amphibole classification. Geochemistry, Geophysics, Geosystems 2007, 8. [Google Scholar] [CrossRef]
- Deer, W.A.; Howie, R.A.; Zussman, J. An introduction of the rock-forming minerals; London: Longman Group Limited, 1979. [Google Scholar]
- Yavuz, F. Evaluating micas in petrologic and metallogenic aspect: Part IIApplications using the computer program Mica+. Computers and Geosciences 2003, 29, 1215–1228. [Google Scholar] [CrossRef]
- Nachit, H.; Razafimahefa, N.; Stussi, J.M. & Carron, J. P. Composition chimique des biotites et typologie magmatique des granitoids. Comtes Rendus Hebdomadaires de I’ Academie des Sciences 1985, 301, 813–818. [Google Scholar]
- de Alquerque, C.A.R. Geochemistry of biotite from granitic rocks, northern Portugal. Geochimica et Cosmochimica Acta 1973, 37, 1779–1802. [Google Scholar] [CrossRef]
- Abdel-Rahman, A.F.M. Nature of biotites from alkaline, calc-alkaline, and peraluminous magmas. Journal of Petrology 1994, 35, 525–541. [Google Scholar] [CrossRef]
- Verdecchia, S. O. , Collo, G., Zandomeni, P. S., Wunderlin, C., & Fehrmann, M. Crystallochemical indexes and geothermobarometric calculations as a multiproxy approach to P-T condition of the low-grade metamorphism: The case of the San Luis Formation, Eastern Sierras Pampeanas of Argentina. Lithos 2019, 324-325, 385–401. [Google Scholar]
- Speer, J.A. Micas in igneous rocks. In: Bailey, S.W. (ed), Reviews in Mineralogy,Micas. Mineralogical Society of America 1984, 229–356. [Google Scholar]
- Ketcham, R.A. Technical Note: Calculation of stoichiometry from EMP data for apatite and other phases with mixing on monovalent anion sites. American Mineralogist 2015, 100, 1620–1623. [Google Scholar] [CrossRef]
- Piccoli, P.M. and Candela, P. A. Apatite in Igneous Systems. In: Phosphates- Geochemical, Geobiological and Materials Importance. Rev. Min. Geochem. 2002, 48, 255–292. [Google Scholar] [CrossRef]
- Oberti, R.; Smith, D.C.; Rossi, G.; Caucia, F. The crystal-chemistry of high-aluminum titanites. European Journal of Mineralogy 1981, 777–792. [Google Scholar]
- Yavuz, F.; Kumral, M.; Karakaya, N.; Karakaya, M. T. , & Yildirim, D. K. A Windows program for chlorite calculation and classification. Computers andGeosciences 2015, 81, 101–113. [Google Scholar]
- Ciesielczuk, J.M. Chlorite of hydrothermal origin formed in the Strzelin and Borów granites (Fore-Sudetic Block, Poland). Geological Quarterly 2012, 56, 333–344. [Google Scholar] [CrossRef]
- Tulloch, A.J. Secondary Ca–Al silicates as low-grade alteration products of granitoid biotite. Contributions to Mineralogy and Petrology 1979, 69, 105–117. [Google Scholar] [CrossRef]
- Evans, B.W.; Vance, J.A. Epidote phenocrysts in dacitic dikes, Boulder county, Colorado. Contributions to Mineralogy and Petrology 1987, 96, 178–185. [Google Scholar] [CrossRef]
- Sial, A. N. , Toselli, A. J., Saavedra, J., Parada, M. A., & Ferreira, V. P. Emplacement, petrological and magnetic susceptibility characteristics of diverse magmatic epidote-bearing granitoid rocks in Brazil, Argentina and Chile. Lithos 1999, 46, 367–392. [Google Scholar]
- Galindo, A.C.; Dall'Agnol, R.; Lafon, J.M.; Teixeira, N.P. Evolution of Brasiliano-age granitoid types in a shear-zone environment, Umarizal–Caraubas region, Rio Grande do Norte, northeast Brazil. Journal of South American Earth Sciences 1995, 8, 79–95. [Google Scholar] [CrossRef]
- Sial, A. N. , Vasconcelos, P. M., Ferreira, V. P., Pessoa, R. R., Brasilino, R. G., & MoraisNeto, J. M. Geochronological and mineralogical constraints on depth of emplacement and ascencion rates of epidote-bearing magmas from northeastern Brazil. Lithos 2008, 105, 225–238. [Google Scholar]
- Zen, E.-A.n.; Hammarstrom, J.M. Magmatic epidote and its petrologic significance. Geology 1984, 12, 515–518. [Google Scholar] [CrossRef]
- Brasilino, R. G. , Sial, A. N., Ferreira, V. P., & Pimentel, M. M. Bulk rock and mineral chemistries and ascent rates of high-K calc-alkalic epidote-bearing magmas, Northeastern Brazil. Lithos 2011, 127, 441–454. [Google Scholar]
- Wright, W.I. The composition and occurrence of garnets. American Mineralogist:Journal of Earth and Planetary Materials 1938, 23, 436–449. [Google Scholar]
- Smith, D.J. From slab to sinter: The magmatic-hydrothermal system of Savo Volcano, Solomon Islands.(unpublished). Ph. D. thesis, University of Leicester, 2008; 261p. [Google Scholar]
- Haggerty, S.E. Oxidation of opaque mineral oxides in basalts. In Oxide Minerals. Reviews in Mineralogy; Rumble, D., III, Ed.; 1976. [Google Scholar]
- Benisek, A.; Kroll, H.; Cemic, L. New developments in two-feldspar thermometry. American Mineralogist 2004, 89, 1496–1504. [Google Scholar] [CrossRef]
- Schmidt, M.W. Amphibole composition in tonalite as a function of pressure: an experimental calibration of the Al-in-hornblende barometer. Contributions to Mineralogy and Petrology 1992, 110, 304–310. [Google Scholar] [CrossRef]
- Johnson, M. C. , & Rutherford, M. J. Experimental calibration of the aluminum-inhornblende geobarometer with application of Long Valley caldera (California) volcanic rocks. Geology 1989, 17, 837–841. [Google Scholar]
- Ague, J.J. Thermodynamic calculation of emplacement pressures for batholithic rocks, California: Implications for the aluminum-in-hornblende barometer. Geology 1997, 25, 563–566. [Google Scholar] [CrossRef]
- Anderson, J. L. , & Smith, D. R. The effects of temperature and fO₂ on the Al-inhornblende barometer. American Mineralogist 1995, 80, 549–559. [Google Scholar]
- Putirka, K. Amphibole thermometers and barometers for igneous systems and some implications for eruption mechanisms of felsic magmas at arc volcanoes. American Mineralogist 2016, 101, 841–858. [Google Scholar] [CrossRef]
- Otten, M.T. The origin of brown hornblende in the Artfjället gabbro and dolerites. Contributions to Mineralogy and Petrology 1984, 86, 189–199. [Google Scholar] [CrossRef]
- Blundy, J. D. , & Holland, T. J. B. Calcic amphibole equilibria and a new amphibole-plagioclase geothermometer. Contributions to Mineralogy and Petrology 1990, 104, 208–224. [Google Scholar]
- Holland, T.; Blundy, J. Non-ideal interactions in calcic amphiboles and their bearing on amphibole-plagioclase thermometry. Contributions to Mineralogy and Petrology 1994, 116, 433–447. [Google Scholar] [CrossRef]
- Anderson, J. L. , Barth, A. P., Wooden, J. L., & Mazdab, F. Thermometers and thermobarometers in granitic systems. Reviews in Mineralogy and Geochemistry 2008, 69, 121–142. [Google Scholar]
- Henry, D. J. , Guidotti, C. V., & Thomson, J. A. The Ti-saturation surface for low to- medium pressure metapelitic biotites: Implications for geothermometry and Tisubstitution mechanisms. American Mineralogist 2005, 90, 316–328. [Google Scholar]
- Zhu, C.; Sverjensky, D.A. F-Cl-OH partitioning between biotite and apatite. Geochimica et Cosmochimica Acta 1992, 56, 3435–3467. [Google Scholar] [CrossRef]
- Bath, A. B. , Walshe, J. L., Cloutier, J., Verrall, M., Cleverley, J. S., Pownceby, M. I., Macrae, C. M., Wilson, N. C., Tunjic, J., Nortje, G. S., & Robinson, P. Biotite and apatite as tools for tracking pathways of oxidized fluids in the Archean East Repulse gold deposit, Australia. Economic Geology 2013, 108, 667–690. [Google Scholar]
- Bird, D. K. , & Helgeson, H. C. Chemical interaction of aqueous solutions with epidote – feldspar mineral assemblages in geologic systems. I: Thermodynamic analysis of phase relations in the system CaO-FeO-Fe2O3-Al2O3-SiO2-H2O-CO2. Am. J. Sci. 1980, 280, 907–941. [Google Scholar]
- Cathelineau, M. Cation site occupancy in chlorites and illites as a function of temperature. Clay Minerals 1988, 23, 471–485. [Google Scholar] [CrossRef]
- Jowett, E.C. Fitting iron and magnesium into the hydrothermal chlorite geothermometer. GAC/MAC/SEG Joint Annual Meeting, Program with Abstracts 16. Toronto, 27-29 May 1991. [Google Scholar]
- Xie, X.; Byerly, G. R. , & Ferrell, R. E. IIb trioctahedral chlorite from the Barberton greenstone belt: Crystal structure and rock composition constraints with implications to geothermometry. Contributions to Mineralogy and Petrology 1997, 126, 275–291. [Google Scholar]
- Bourdelle, F.; Parra, T.; Beyssac, O.; Chopin, C.; Vidal, O. Clay minerals as geothermometer: A comparative study based on high spatial resolution analyses of illite and chlorite in Gulf Coast sandstones (Texas, U.S.A.). American Mineralogist 2013, 98, 914–926. [Google Scholar] [CrossRef]
- Lanari, P.; Wagner, T.; Vidal, O. A thermodynamic model for di-trioctahedral chlorite from experimental and natural data in the system MgO-FeO-Al2O3-SiO2-H2O: Applications to P-T sections and geothermometry. Contributions to Mineralogy and Petrology 2014, 167, 1–19. [Google Scholar] [CrossRef]
- Inoue, A.; Inoué, S.; Utada, M. Application of chlorite thermometry to estimation of formation temperature and redox conditions. Clay Minerals 2018, 53, 143–158. [Google Scholar] [CrossRef]
- Wones, D.R. & Eugster, H. P. Stability of biotite: experiment, theory, and application. American Mineralogist: Journal of Earth and Planetary Materials 1965, 50, 1228–1272. [Google Scholar]
- Miles, A. J. , Graham, C. M., Hawkesworth, C. J., Gillespie, M. R., Hinton, R. W., & Bromiley, G. D. Apatite: A new redox proxy for silicic magmas? Geochimica et Cosmochimica Acta 2014, 132, 101–119. [Google Scholar]
- Wones, D.R. Significance of the assemblage titanite+magneite+quartz in granitic rocks. Am. Mineral. 1989, 74, 744–749. [Google Scholar]
- Holtz F, Johannes W, Tamic N, & Behrens H (). Maximum and minimum water contents of granitic melts generated in the crust: A reevaluation and implications. Lithos 2001, 56, 1–14.
- Teiber, H.; Marks, M.A. W. , Wenzel, T., Siebel, W., Altherr, R., & Markl, G. The distribution of halogens (F, Cl, Br) in granitoid rocks. Chemical Geology 2014, 374-375, 92–109. [Google Scholar]
- Słaby, E.; Domańska-Siuda, J. Origin and evolution of volatiles in the Central Europe late Variscan granitoids, using the example of the Strzegom-Sobótka Massif, SW Poland. Mineralogy and Petrology 2019, 113, 119–134. [Google Scholar]
- Munoz, J.L. F-OH and Cl-OH exchange in micas with applications to hydrothermal ore deposits. Reviews in Mineralogy and Geochemistry 1984, 13, 469–493. [Google Scholar]
- Zhu, C.; Sverjensky, D.A. Partitioning of F-Cl-OH between minerals and hydrothermal fluids. Geochimica et Cosmochimica Acta 1991, 55, 1837–1858. [Google Scholar] [CrossRef]
- Loferski, P. J. , & Ayuso, R. A. Petrography and mineral chemistry of the composite Deboullie pluton, northern Maine, U.S.A.: Implications for the genesis of Cu-Mo mineralization. Chemical Geology 1995, 123, 89–105. [Google Scholar]
- Parsapoor, A.; Khalili, M.; Tepley, F.; Maghami, M. Mineral chemistry and isotopic composition of magmatic, re-equilibrated and hydrothermal biotites from Darreh-Zar porphyry copper deposit, Kerman (Southeast of Iran). Ore GeologyReviews 2015, 66, 200–218. [Google Scholar] [CrossRef]
- Munoz, J.L. Calculation of HF and HCl fugacities from biotite compositions: revised equations. Geological Society of America, Abstracts with Programs 1992, 26, 221. [Google Scholar]
- Tarantola, A.; Diamond, L.W. & Stu¨nitz H. Modification of fluid inclusions in quartz by deviatoric stress I: experimentally induced changes in inclusion shapes and microstructures. Contributions to Mineraloy and Petrology 2010, 160, 825–843. [Google Scholar]
- Chi, G. and Lu, H. Validation and representation of fluid inclusion microthermometric data using the fluid inclusion assemblage (FIA) concept. Acta Petrologica Sinica 2008, 9, 1945–1953. [Google Scholar]
- Chi, G.; Diamond, L.W.L. H. , Lai, J. and Chu, H. Common problems and pitfalls in fluid inclusion study: a review and discussion. Minerals 2021, 11, 7. [Google Scholar] [CrossRef]
- Shepherd, T.J.; Rankin, A.H.; Alderton, D.H.M. A practical guide to fluid inclusion studies; Glasgow: Blackie, 1985; 239 p. [Google Scholar]
- Bowers, T.S. Pressure-volume-temperature properties of H2O-CO2 fluids. Rock Physics and Phase Relations: A Handbook of Physical Constants, AGU Ref. Shelf 1995, 3, 45–72. [Google Scholar]
- Parry, W.T. Estimation of X CO2, P, and fluid inclusion volume from fluid inclusion temperature measurements in the system NaCl-CO2 H2O. Economic Geology 1986, 81, 1009–1013. [Google Scholar] [CrossRef]
- Panigrahi, M. K. , & Mookherjee, A. The Malanjkhand copper (+ molybdenum) deposit, India: Mineralization from a low-temperature ore-fluid of granitoid affiliation. Mineralium Deposita 1997, 32, 133–148. [Google Scholar]
- Mernagh, T.P. & Wilde, A.R. The use of the laser Raman microprobe for the determination of salinity in fluid inclusions. Geochimica et Cosmochimica Acta 1989, 53, 765–771. [Google Scholar]
- Dubessy, J.; Lhomme, T.; Boiron, M.-C. &Rull, F. Determination of chlorinity in aqueous fluids using Raman spectroscopy of the stretching band of water at room temperature: Application to fluid inclusions. Applied Spectroscopy 2002, 56, 99–106. [Google Scholar]
- Frezzotti, M. L. , Tecce, F., & Casagli, A. Raman spectroscopy for fluid inclusion analysis. Journal of Geochemical Exploration 2012, 112, 1–20. [Google Scholar]
- Roedder, E. & Bodnar, R. J. Geologic pressure determination from fluid inclusion studies. Annual Reviews of Earth and Planetary Sciences 1980, 8, 263–301. [Google Scholar]
- Wilkinson, J. J. , Nolan, J., & Rankin, A. H. Silicothermal fluid: A novel medium for mass transport in the lithosphere. Geology 1996, 24, 1059–1062. [Google Scholar]
- Thomas, R.; Davidson, P. Evidence of a water-rich silica gel state during the formation of a simple pegmatite. Mineralogical Magazine 2012, 76, 2785–2801. [Google Scholar] [CrossRef]
- Morey, G. W. , & Fleischer, M. Equilibrium between vapor and liquid phases in the system CO2-H2O-K2O-SiO2. Geological Society of America Bulletin 1940, 51, 1035–1058. [Google Scholar]
- Puziewicz, J.; Johannes, W. Experimental study of a biotite-bearing granitic system under water-saturated and water-undersaturated conditions. Contributions toMineralogy and Petrology 1990, 104, 397–406. [Google Scholar] [CrossRef]
- Naney, M.T. Phase equilibria of rock-forming ferromagnesian silicates in granitic systems. American Journal of Science 1983, 283(10), 993–1033. [Google Scholar] [CrossRef]
- Webster, J. D. , Tappen, C. M., & Mandeville, C. W. Partitioning behavior of chlorine and fluorine in the system apatite–melt–fluid. II: Felsic silicate systems at 200 MPa. Geochimica et Cosmochimica Acta 2009, 73, 559–581. [Google Scholar]
- Słaby, E.; Martin, H.; Hamada, M.; Śmigielski, M.; Domonik, A.; Götze, J.; Hoefs, J.; Hałas, S.; Simon, K.; Devidal, J.L.; Moyen, J.F.; Jayananda, M. Evidence in Archaean alkali feldspar megacrysts for high-temperature interaction with mantle fluids. Journal of Petrology 2012, 53, 67–98. [Google Scholar] [CrossRef]
- Bath, A. B. , Walshe, J. L., Cloutier, J., Verrall, M., Cleverley, J. S., Pownceby, M. I., Macrae, C. M., Wilson, N. C., Tunjic, J., Nortje, G. S., & Robinson, P. Biotite and apatite as tools for tracking pathways of oxidized fluids in the Archean East Repulse gold deposit, Australia. Economic Geology 2013, 108, 667–690. [Google Scholar]
- Schmidt, M. W. , & Poli, S. Magmatic epidote. Reviews in Mineralogy and Geochemistry 2004, 56, 399–430. [Google Scholar]
- Brandon, A. D. , Creaser, R. A., & Chacko, T. Constraints on rates of granitic magma transport from epidote dissolution kinetics. Science 1996, 271, 1845–1848. [Google Scholar]
- Schmidt, M. W. , & Thompson, A. B. Epidote in calc-alkaline magmas: An experimental study of stability, phase relationships, and the role of epidote in magmatic evolution. American Mineralogist.
- Sensarma, S.; Matin, A.; Paul, D.; Patra, A.; Madhesiya, A. K. , & Sarkar, G. Reddening of ~2.5 Ga granitoid by high-temperature fluid linked to mafic dyke swarm in the Bundelkhand Craton, north central India. Geological Journal 2018, 53, 1338–1353. [Google Scholar]
- Słaby, E.; Domańska-Siuda, J. Origin and evolution of volatiles in the Central Europe late Variscan granitoids, using the example of the Strzegom-Sobótka Massif, SW Poland. Mineralogy and Petrology 2019, 113, 119–134. [Google Scholar]
- Bhattacharya, S. Granitic magmatism late-stage fluid activity vis-à-vis gold mineralization in schist belts in parts of the Eastern Dharwar Craton India (unpublished) Ph, D. Thesis, Indian Institute of Technology, Kharagpur 2014, 197p.
- Putnis, A.; Hinrichs, R.; Putnis, C. V. , Golla-Schindler, U., & Collins, L. G. Hematite in porous red-clouded feldspars: Evidence of large-scale crustal fluid-rock interaction. Lithos.
- Plümper, O.; Putnis, A. The complex hydrothermal history of granitic rocks: Multiple feldspar replacement reactions under subsolidus conditions. Journal of Petrology 2009, 50, 967–987. [Google Scholar] [CrossRef]
- Colleps, C. L. , McKenzie, N. R., Guenthner, W. R., Sharma, M., & Stockli, D. F. Low-temperature thermochronometric insight into the long-term burial and erosional evolution of the Bundelkhand Craton of central India. European Geosciences Union General Assembly, Vienna, Austria. 2019, 21, 12108. [Google Scholar]
- Bhattacharya, S.; Panigrahi, M.K. Heterogeneity in fluid characteristics in the Ramagiri–Penakacherla sector of the Eastern Dharwar Craton: implications to gold metallogeny. Russian Geology and Geophysics 2011, 52, 1436–1447. [Google Scholar] [CrossRef]
- Allan, M. M. , & Yardley, B. W. D. Tracking meteoric infiltration into a magmatic hydrothermal system: A cathodoluminescence, oxygen isotope and trace element study of quartz from Mt. Leyshon, Australia. Chemical Geology 2007, 240, 343–360. [Google Scholar]
- Reed, M.; Rusk, B.; Palandri, J. The Butte magmatic-hydrothermal system: One fluid yields all alteration and veins. Economic Geology 2013, 108, 1379–1396. [Google Scholar] [CrossRef]
Figure 1.
Geological map of Bundelkhand Craton. The quartz reefs (yellow streaks and lines) are traced from Google Earth Map and overlaid on the above map (modified after Bhattacharya and Singh, 2013 and Pati et al, 2014). The inset shows Bundelkhand Craton on the map of India. Abbreviations - K: Karera, Jh: Jhansi, Ba: Babina, Mou: Mouranipur, Mb: Mahoba, L: Lalitpur, Md: Madwara, Ch: Chhatarpur, RSZ: Raksha Shear Zone and BTZ: Bundelkhand Tectonic Zone.
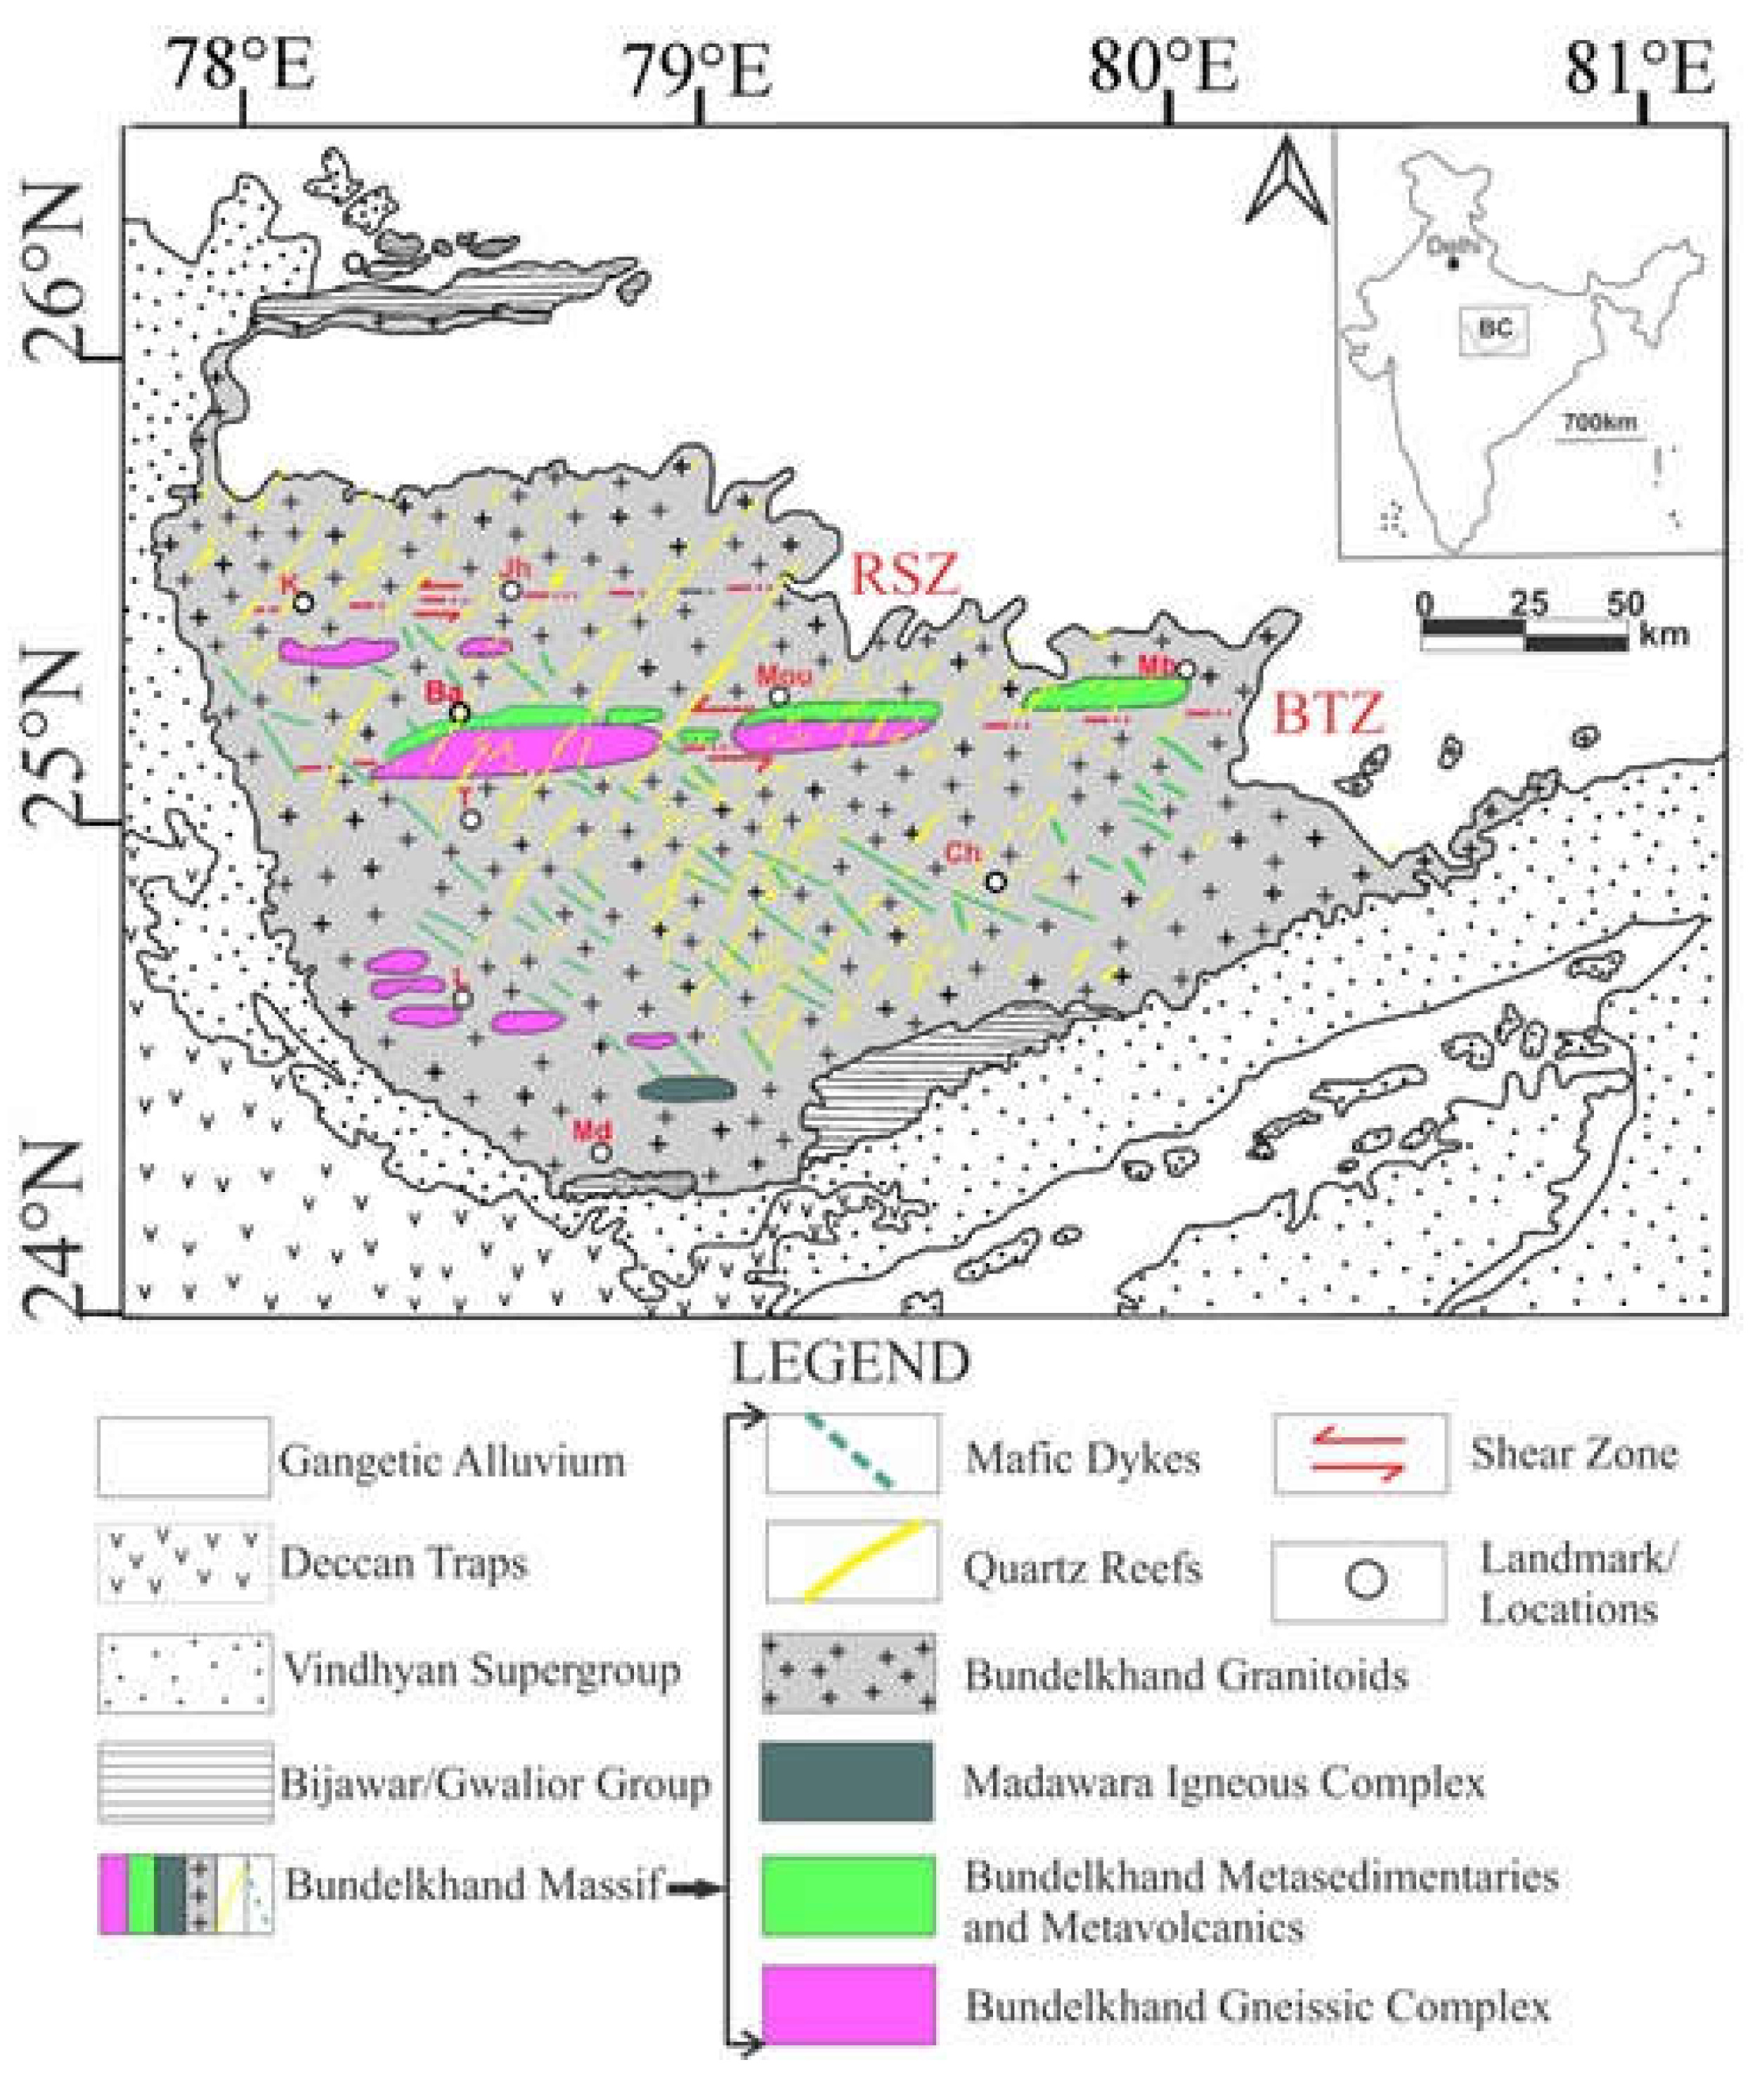
Figure 2.
Field photographs showing (a) leucocratic appearance of BG with megacrysts of euhedral K-feldspar; (b) augen shaped K-feldspar imparting faint gneissosity in BG; (c) aplitic vein in BG; (d) deformed quartz vein in BG; (e) pegmatite associated with BG; (f) association of quartz reef and BG in field and (g) altered and friable nature of the same granodiorite as shown in (f) with advancement towards the quartz reef.
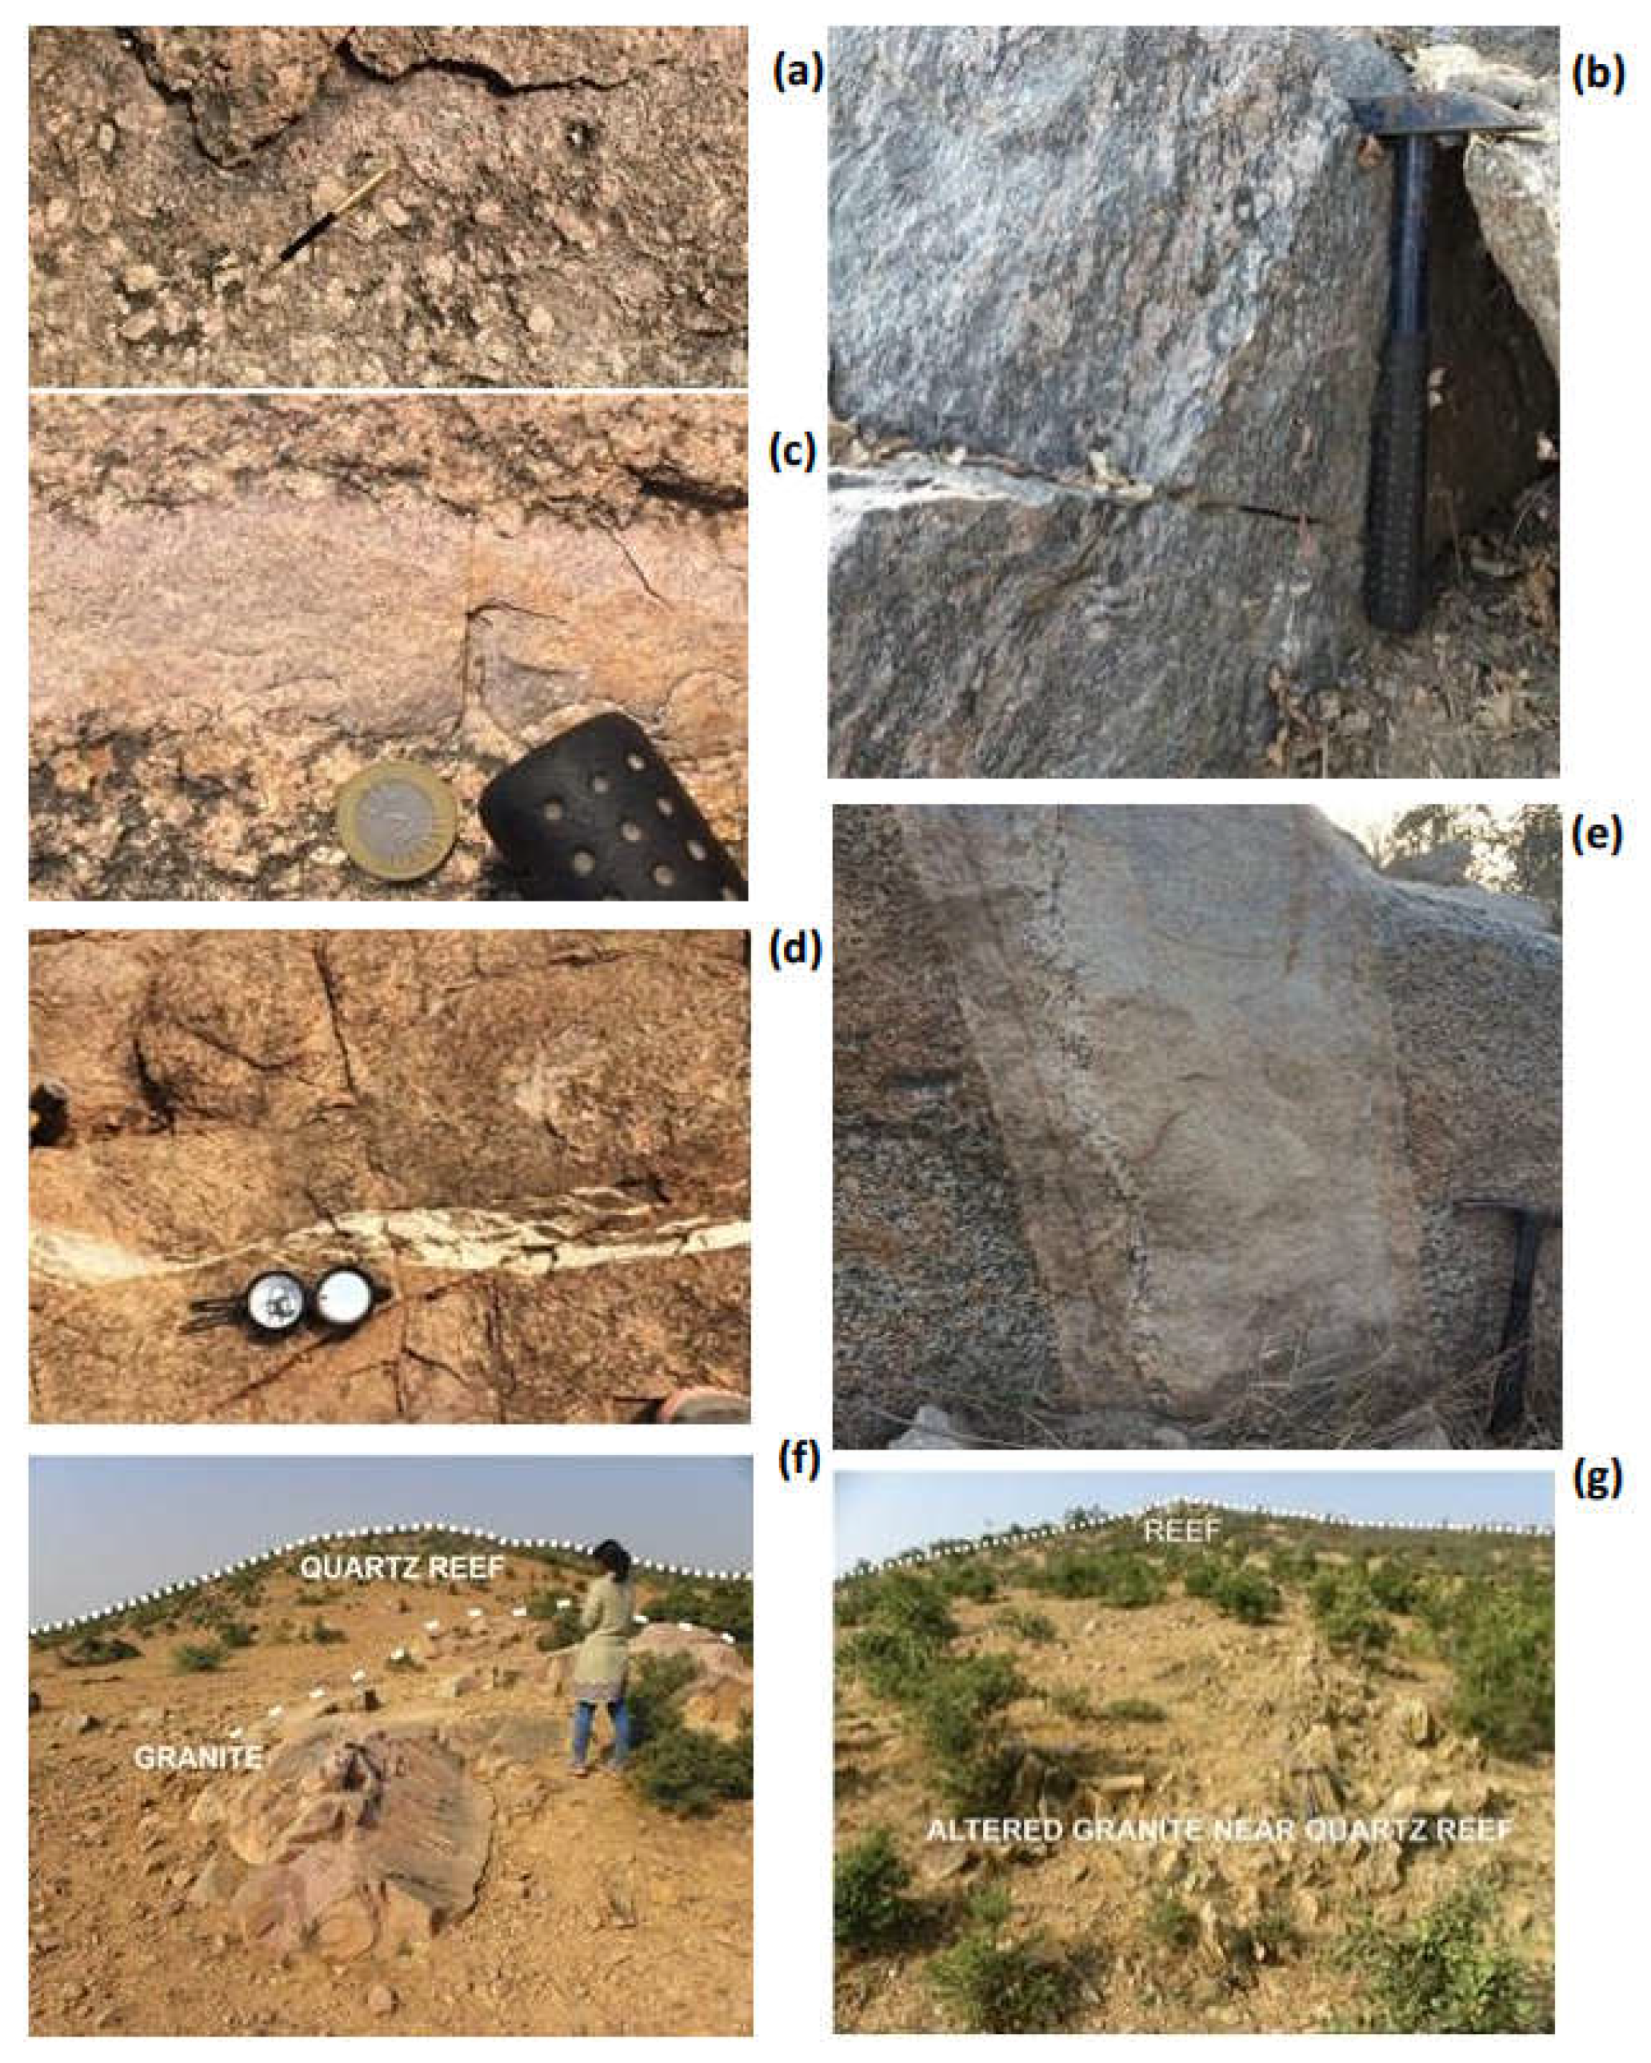
Figure 3.
Photomicrographs showing (a) perthitic exsolution with Na-metasomatism; (b) quartz grain showing kink bending and sub grain formation; (c) magmatic hornblende with different color of pleochroic shades; (d) altered biotite along the fringe of hornblende grain; (e) chloritization in biotite with bend cleavage planes; (f) bleached biotite (green color along the cleavage planes is notable); (g) hornblende showing specks of magnetite with a corroded core and (h) irregular patches of opaque in mafic assemblage as alteration product. Kfs: K-feldspar; Qtz: quartz; Ep: epidote; Plag: plagioclase; Hbl: hornblende; Z: zircon; Bte: biotite, Ap: apatite; Sph: sphene; Opq: opaque; Alla:allanite.
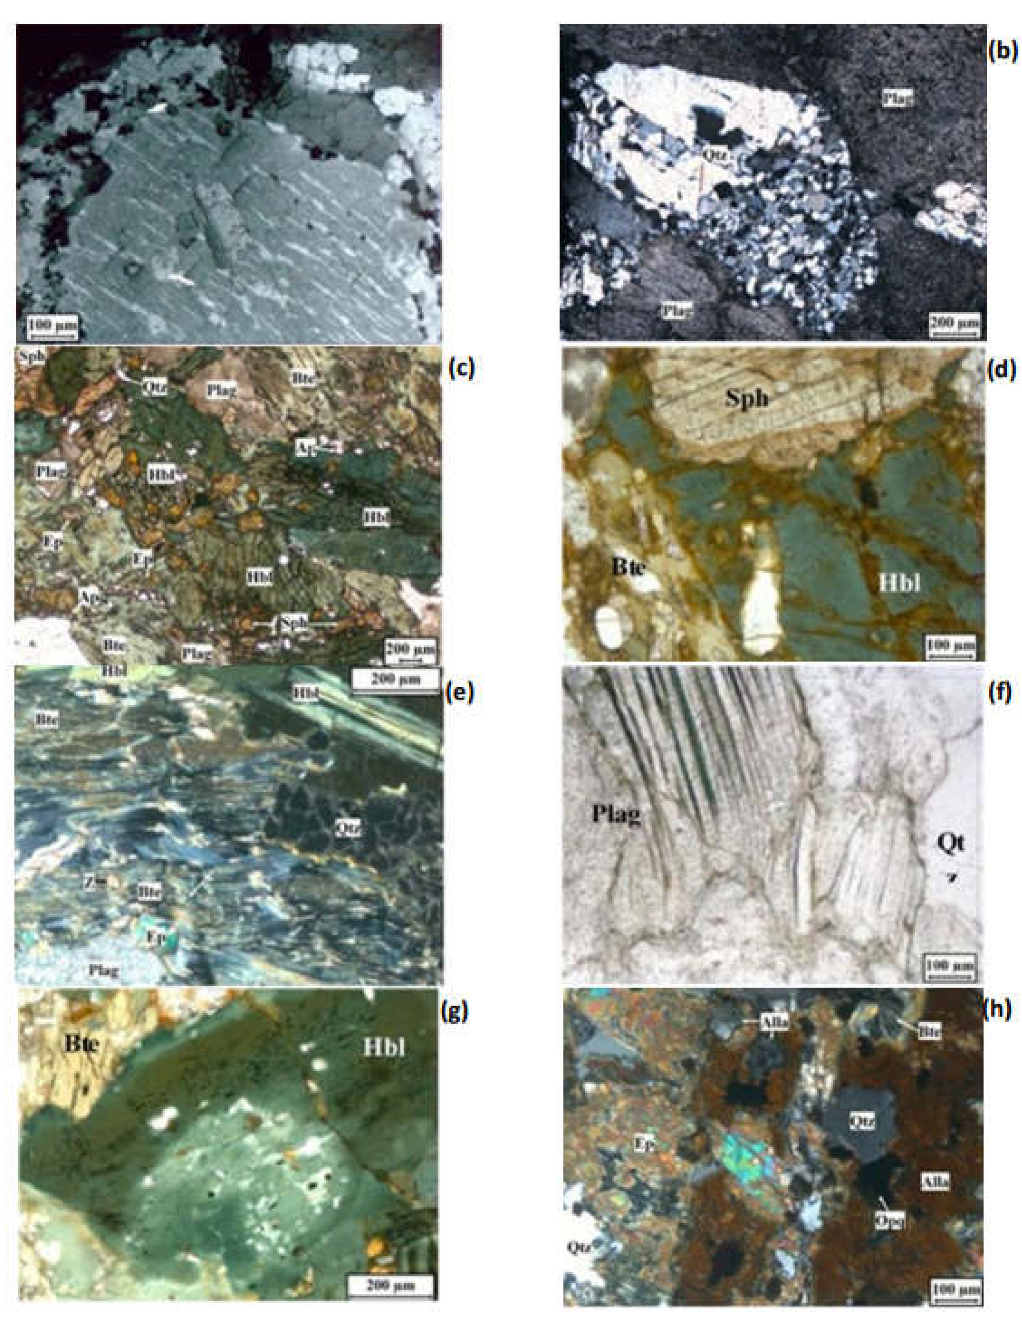
Figure 4.
Photomicrographs showing (a) magmatic magnetite; (b) epidote coexist with biotite and hornblende; (c) resorbed epidote within biotite which depicts its magmatic origin; (d) resorbed epidote coexist with plagioclase; (e); columnar epidote coexist with quartz and (f) circular to oval grains of garnet. Mgt: magnetite; Chl: chlorite; Kfs: K-feldspar; Hbl: hornblende; Bte: biotite; Qtz: quartz; Ep: epidote, Grt:gamet.
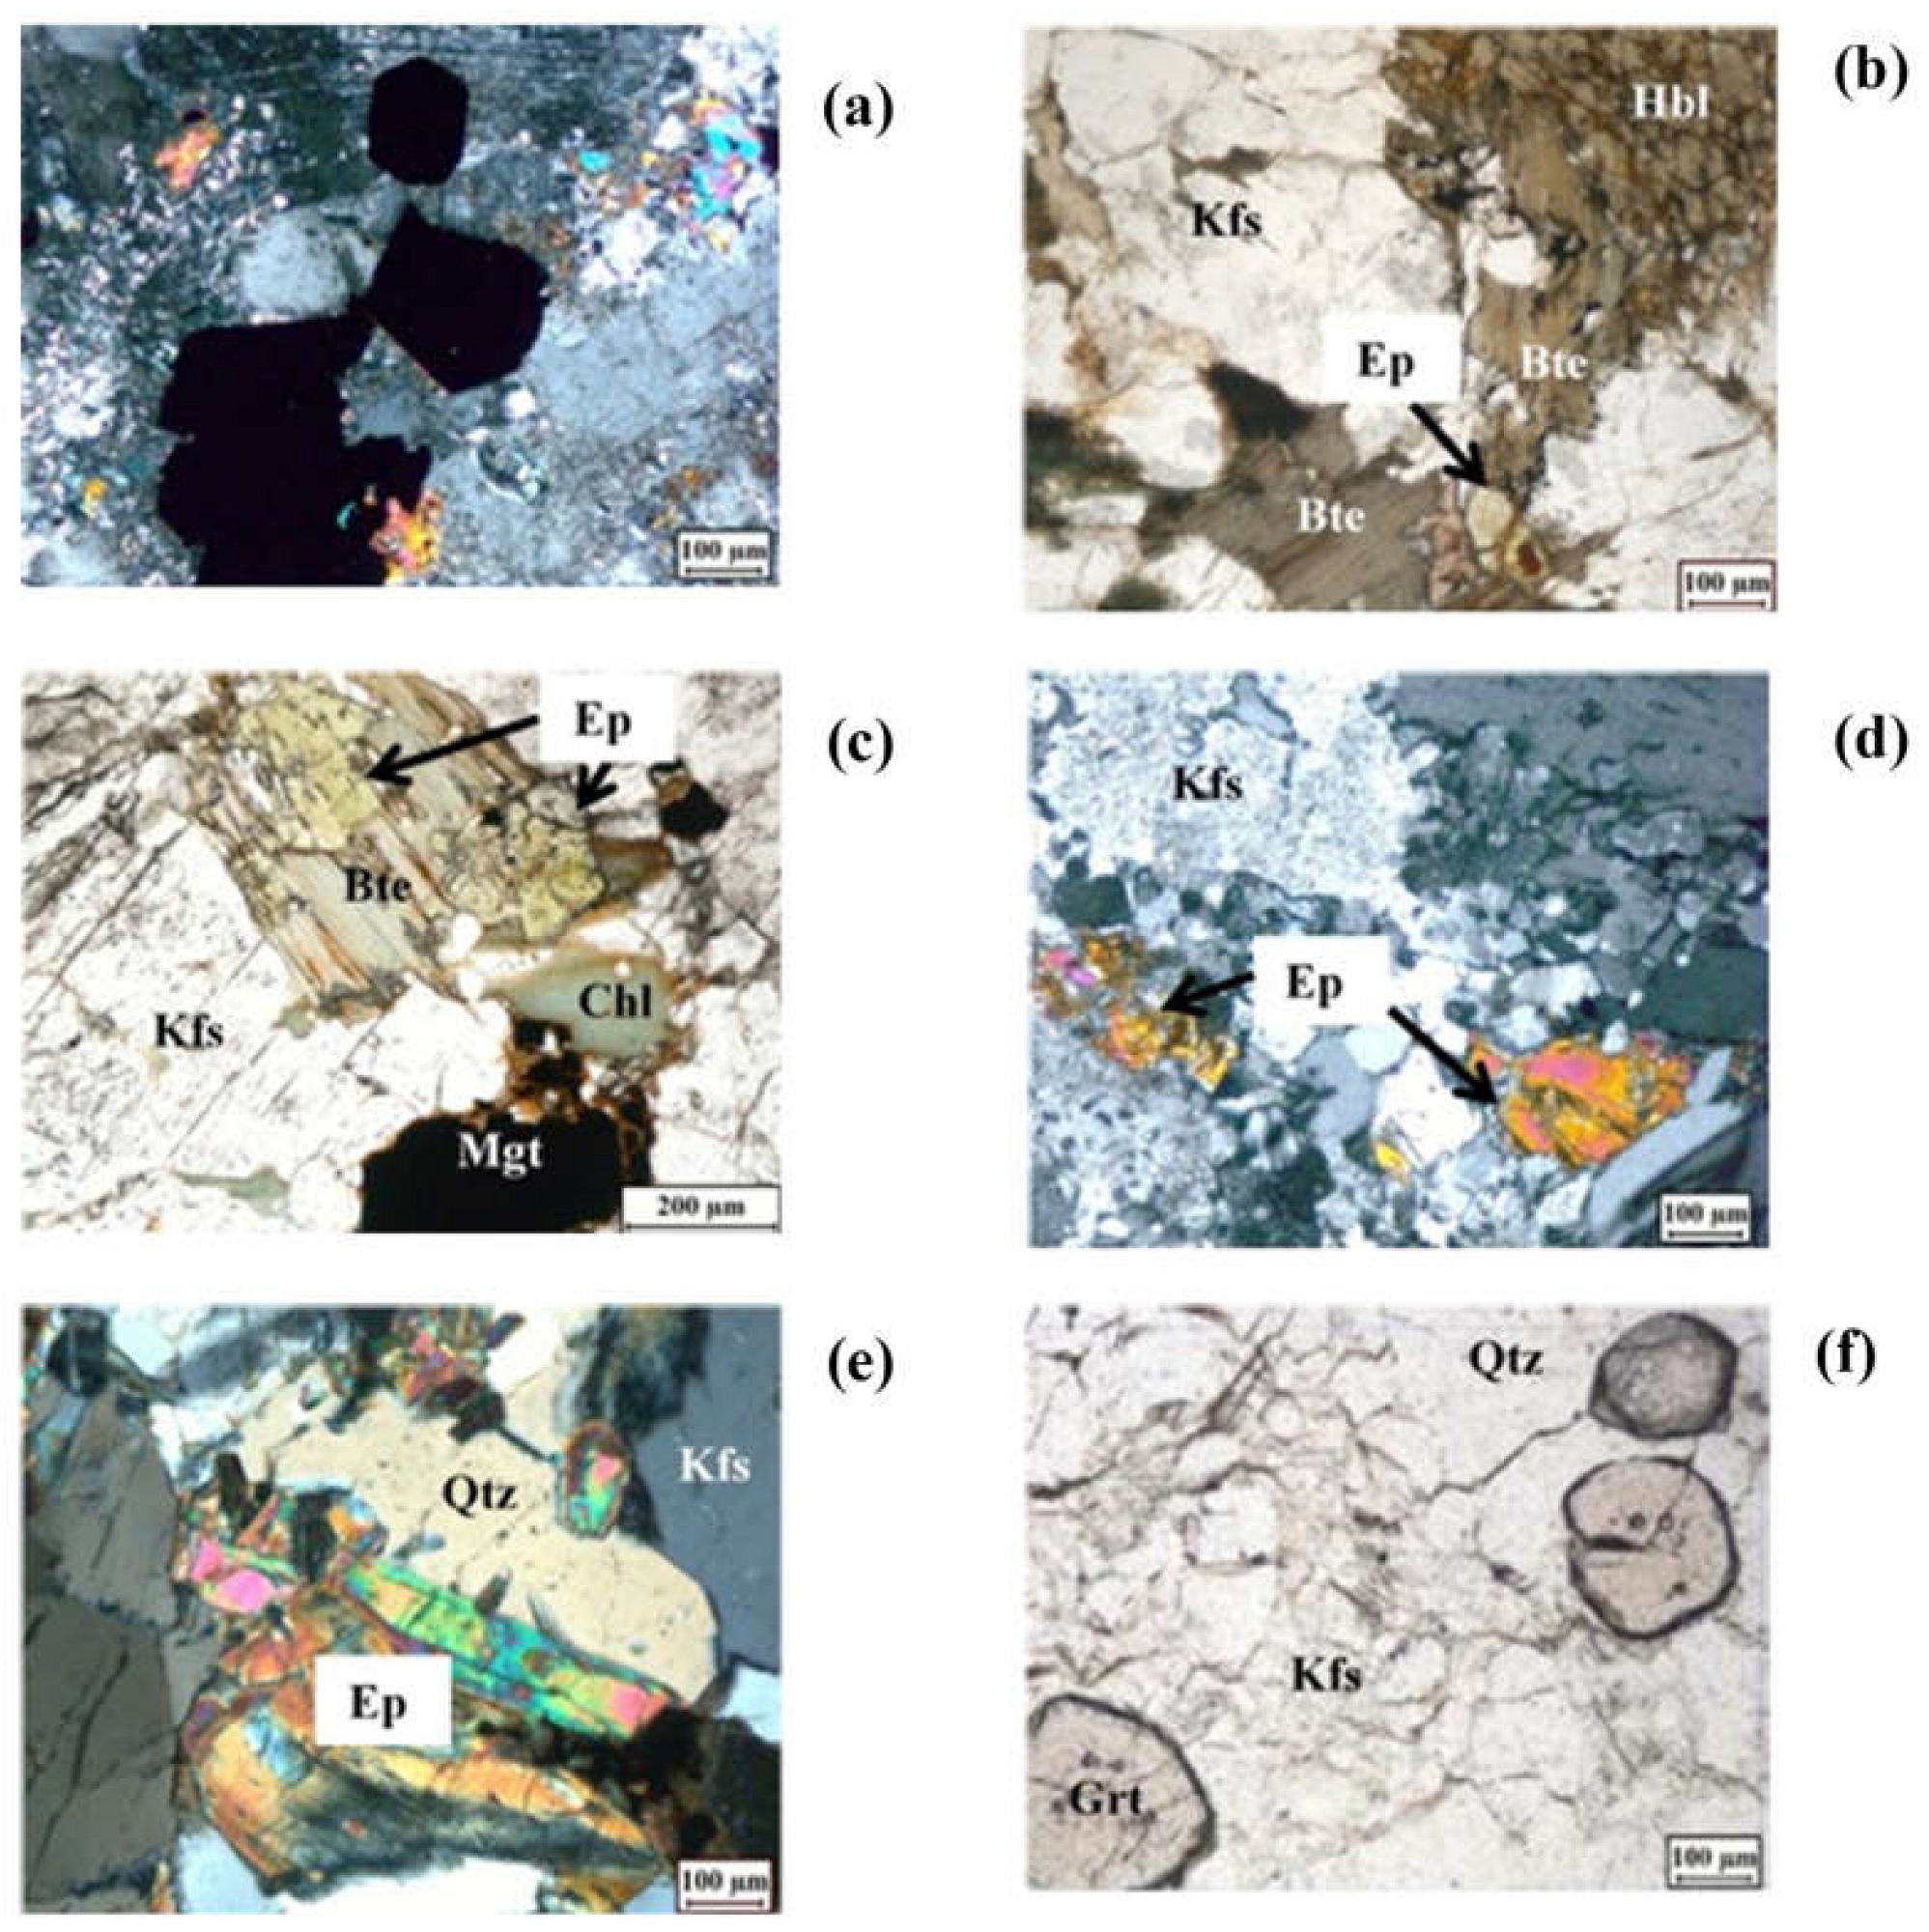
Figure 5.
(a) Distribution of feldspar analyses in ternary diagram showing plagioclase series and alkali feldspar [29]; (b) classification of calcic amphibole [28]; (c) scatter plot showing igneous origin of hornbende [27], (d) Classification diagram of biotite [35]; (e) biotite showing re equilibrated primary nature in diagram FeOtotal-TiO2-MgO [31] and (f) Ternary plot (Al2O3–FeOtot– MgO) of mica samples [32] where I: biotite co-existing with amphibole, II: biotite unaccompanied by other ferromagnesian minerals, III: biotite co-existing with muscovite and IV: biotite co-existing with aluminosilicates.
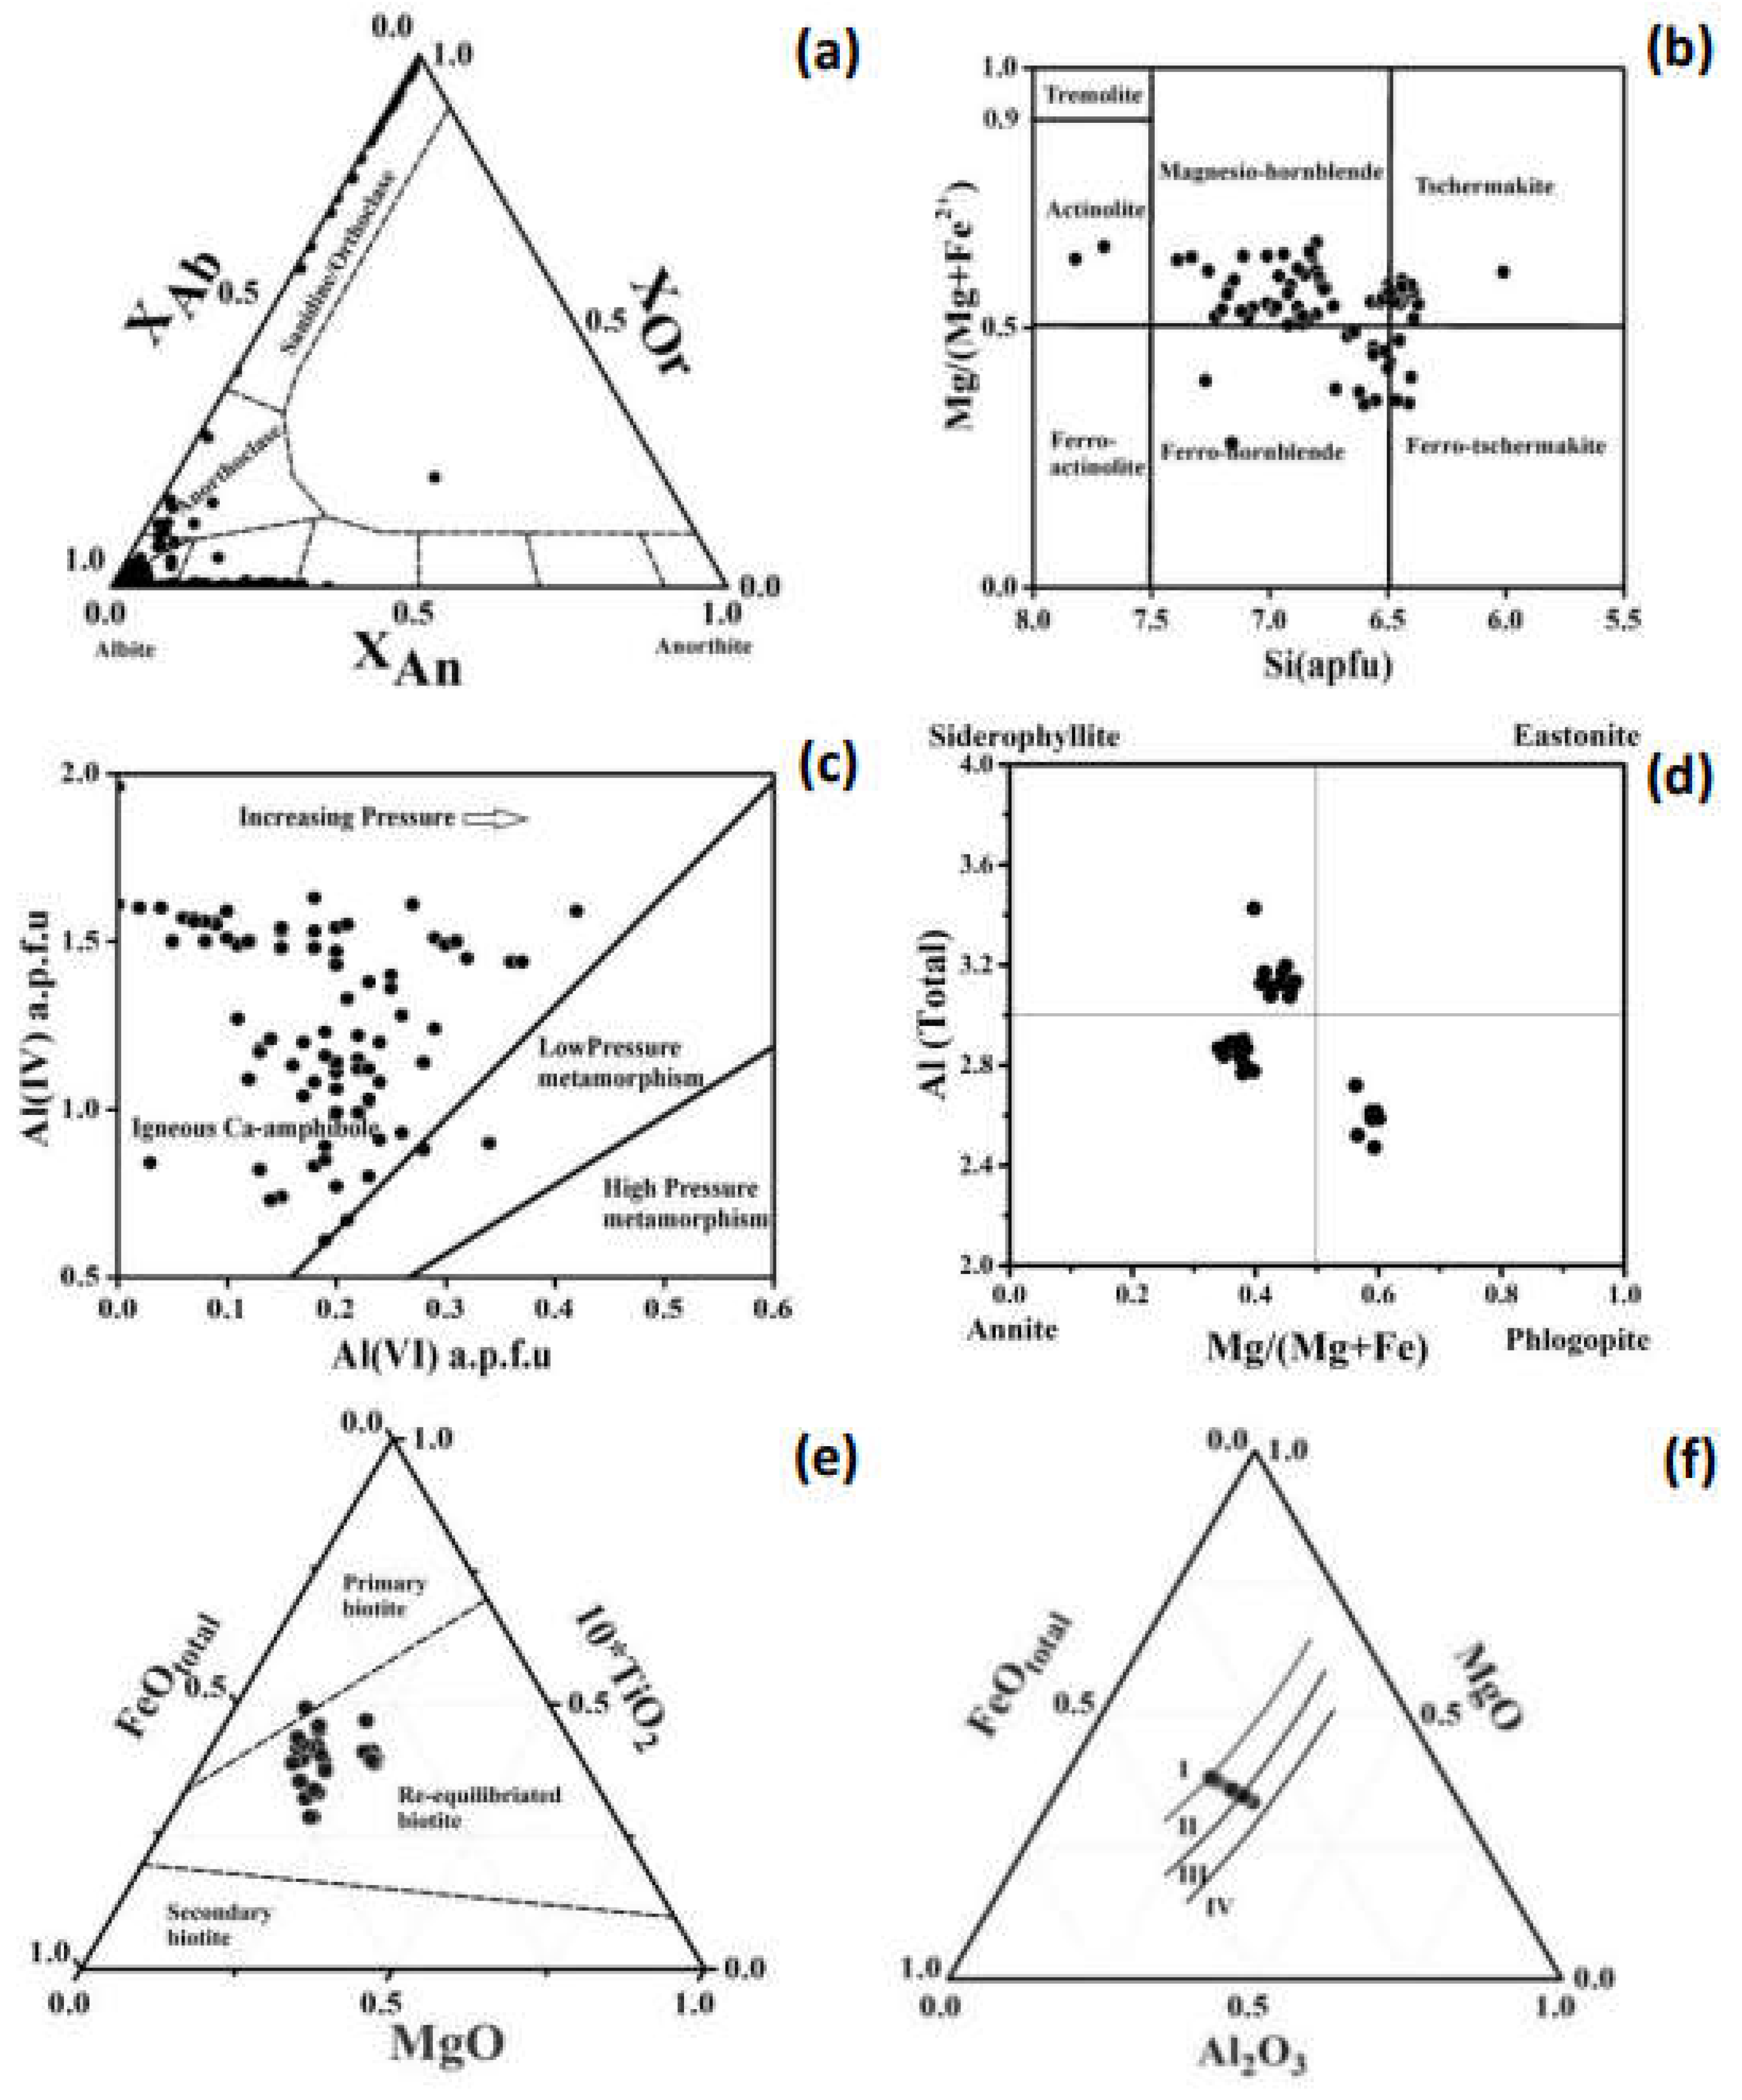
Figure 6.
: (a) compositional variations in muscovite in TiO2-FeO-MgO diagram [35] where the abbreviations suggest I:Primary, II: Late-Post magmatic and III: Hydrothermal muscovite; (b) and (c) chemical composition of white mica in BG. Arrows suggesting different substitution vector [34 and reference therein]; (d) Apatite classification diagram [37]; (e) and (f) Chlorite classification diagram with the help of WinCcac [39].
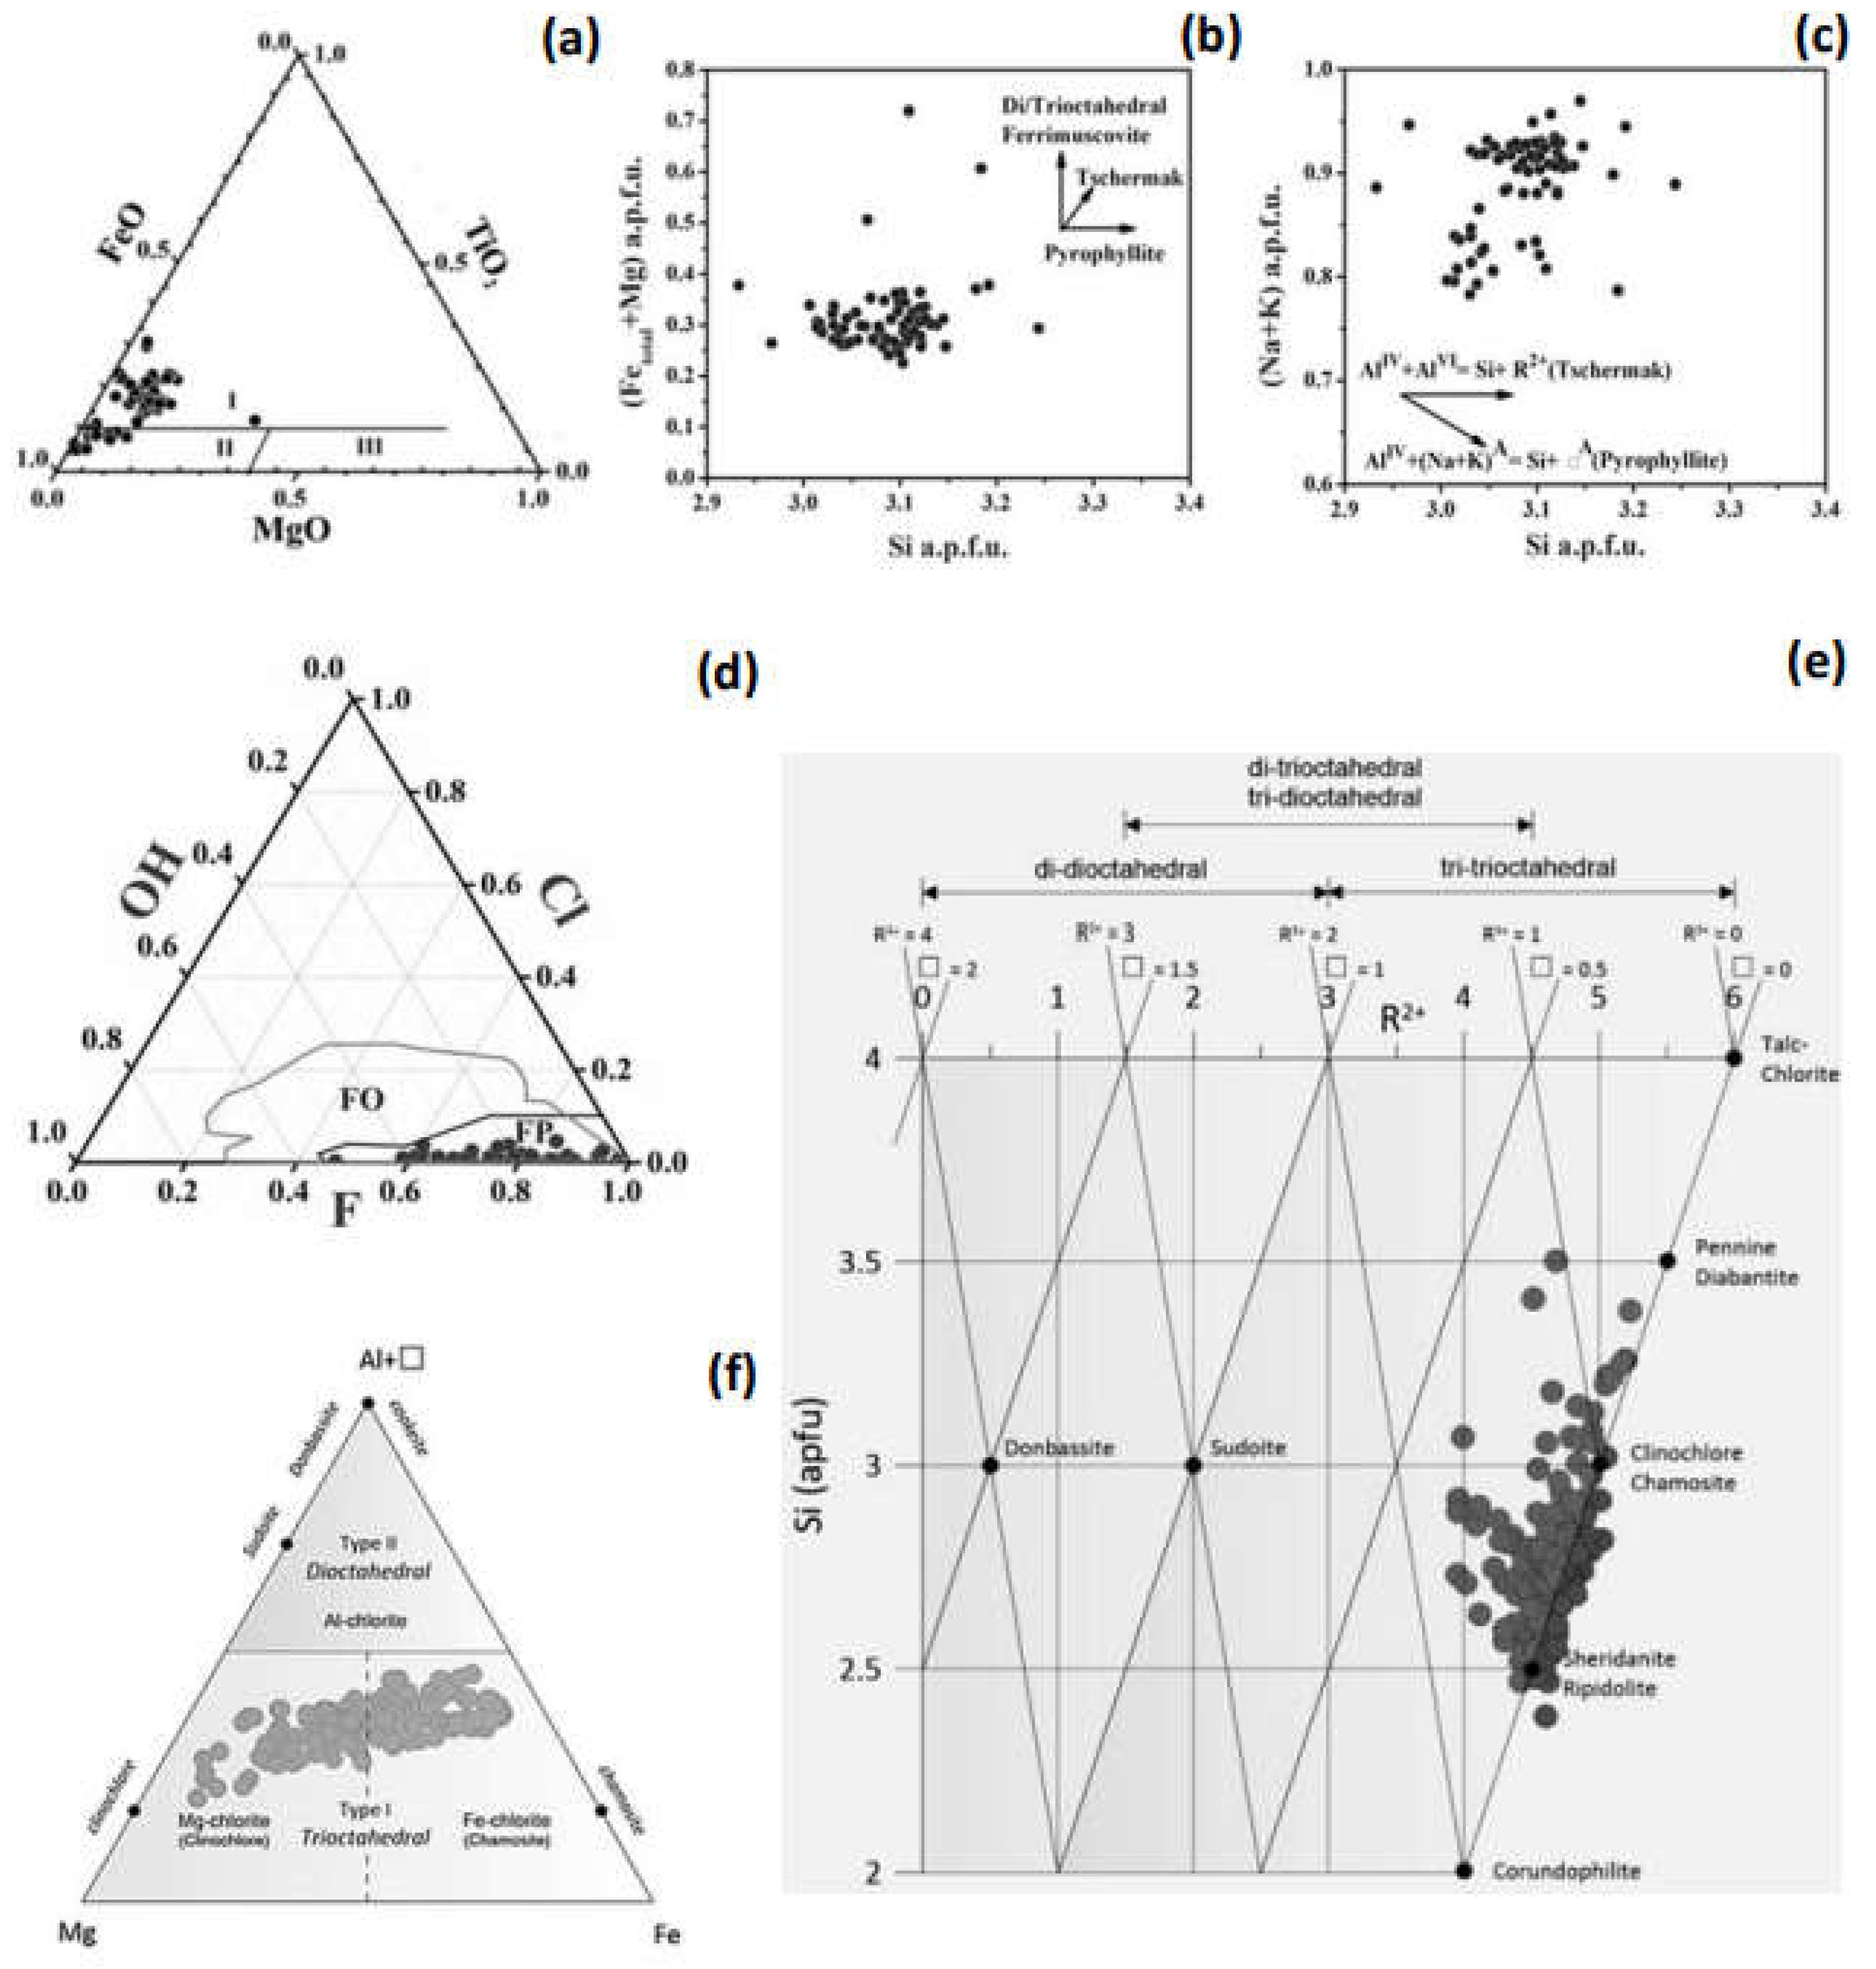
Figure 9.
Distribution of data points showing variation of (a) binary distribution between log(XCl/XOH) vs XMg, (b) log(XF/XOH) vs XMg ,(c) log(XCl/XF) vs XMg , (d) log(XF/XOH) vs XFe (e) log(fHF/fHCl)fluid vs log(fH2O/fHCl)fluid and (f) log(fH2O/fHF)fluid vs log(fH2O/fHCl)fluid in biotite.
Figure 9.
Distribution of data points showing variation of (a) binary distribution between log(XCl/XOH) vs XMg, (b) log(XF/XOH) vs XMg ,(c) log(XCl/XF) vs XMg , (d) log(XF/XOH) vs XFe (e) log(fHF/fHCl)fluid vs log(fH2O/fHCl)fluid and (f) log(fH2O/fHF)fluid vs log(fH2O/fHCl)fluid in biotite.
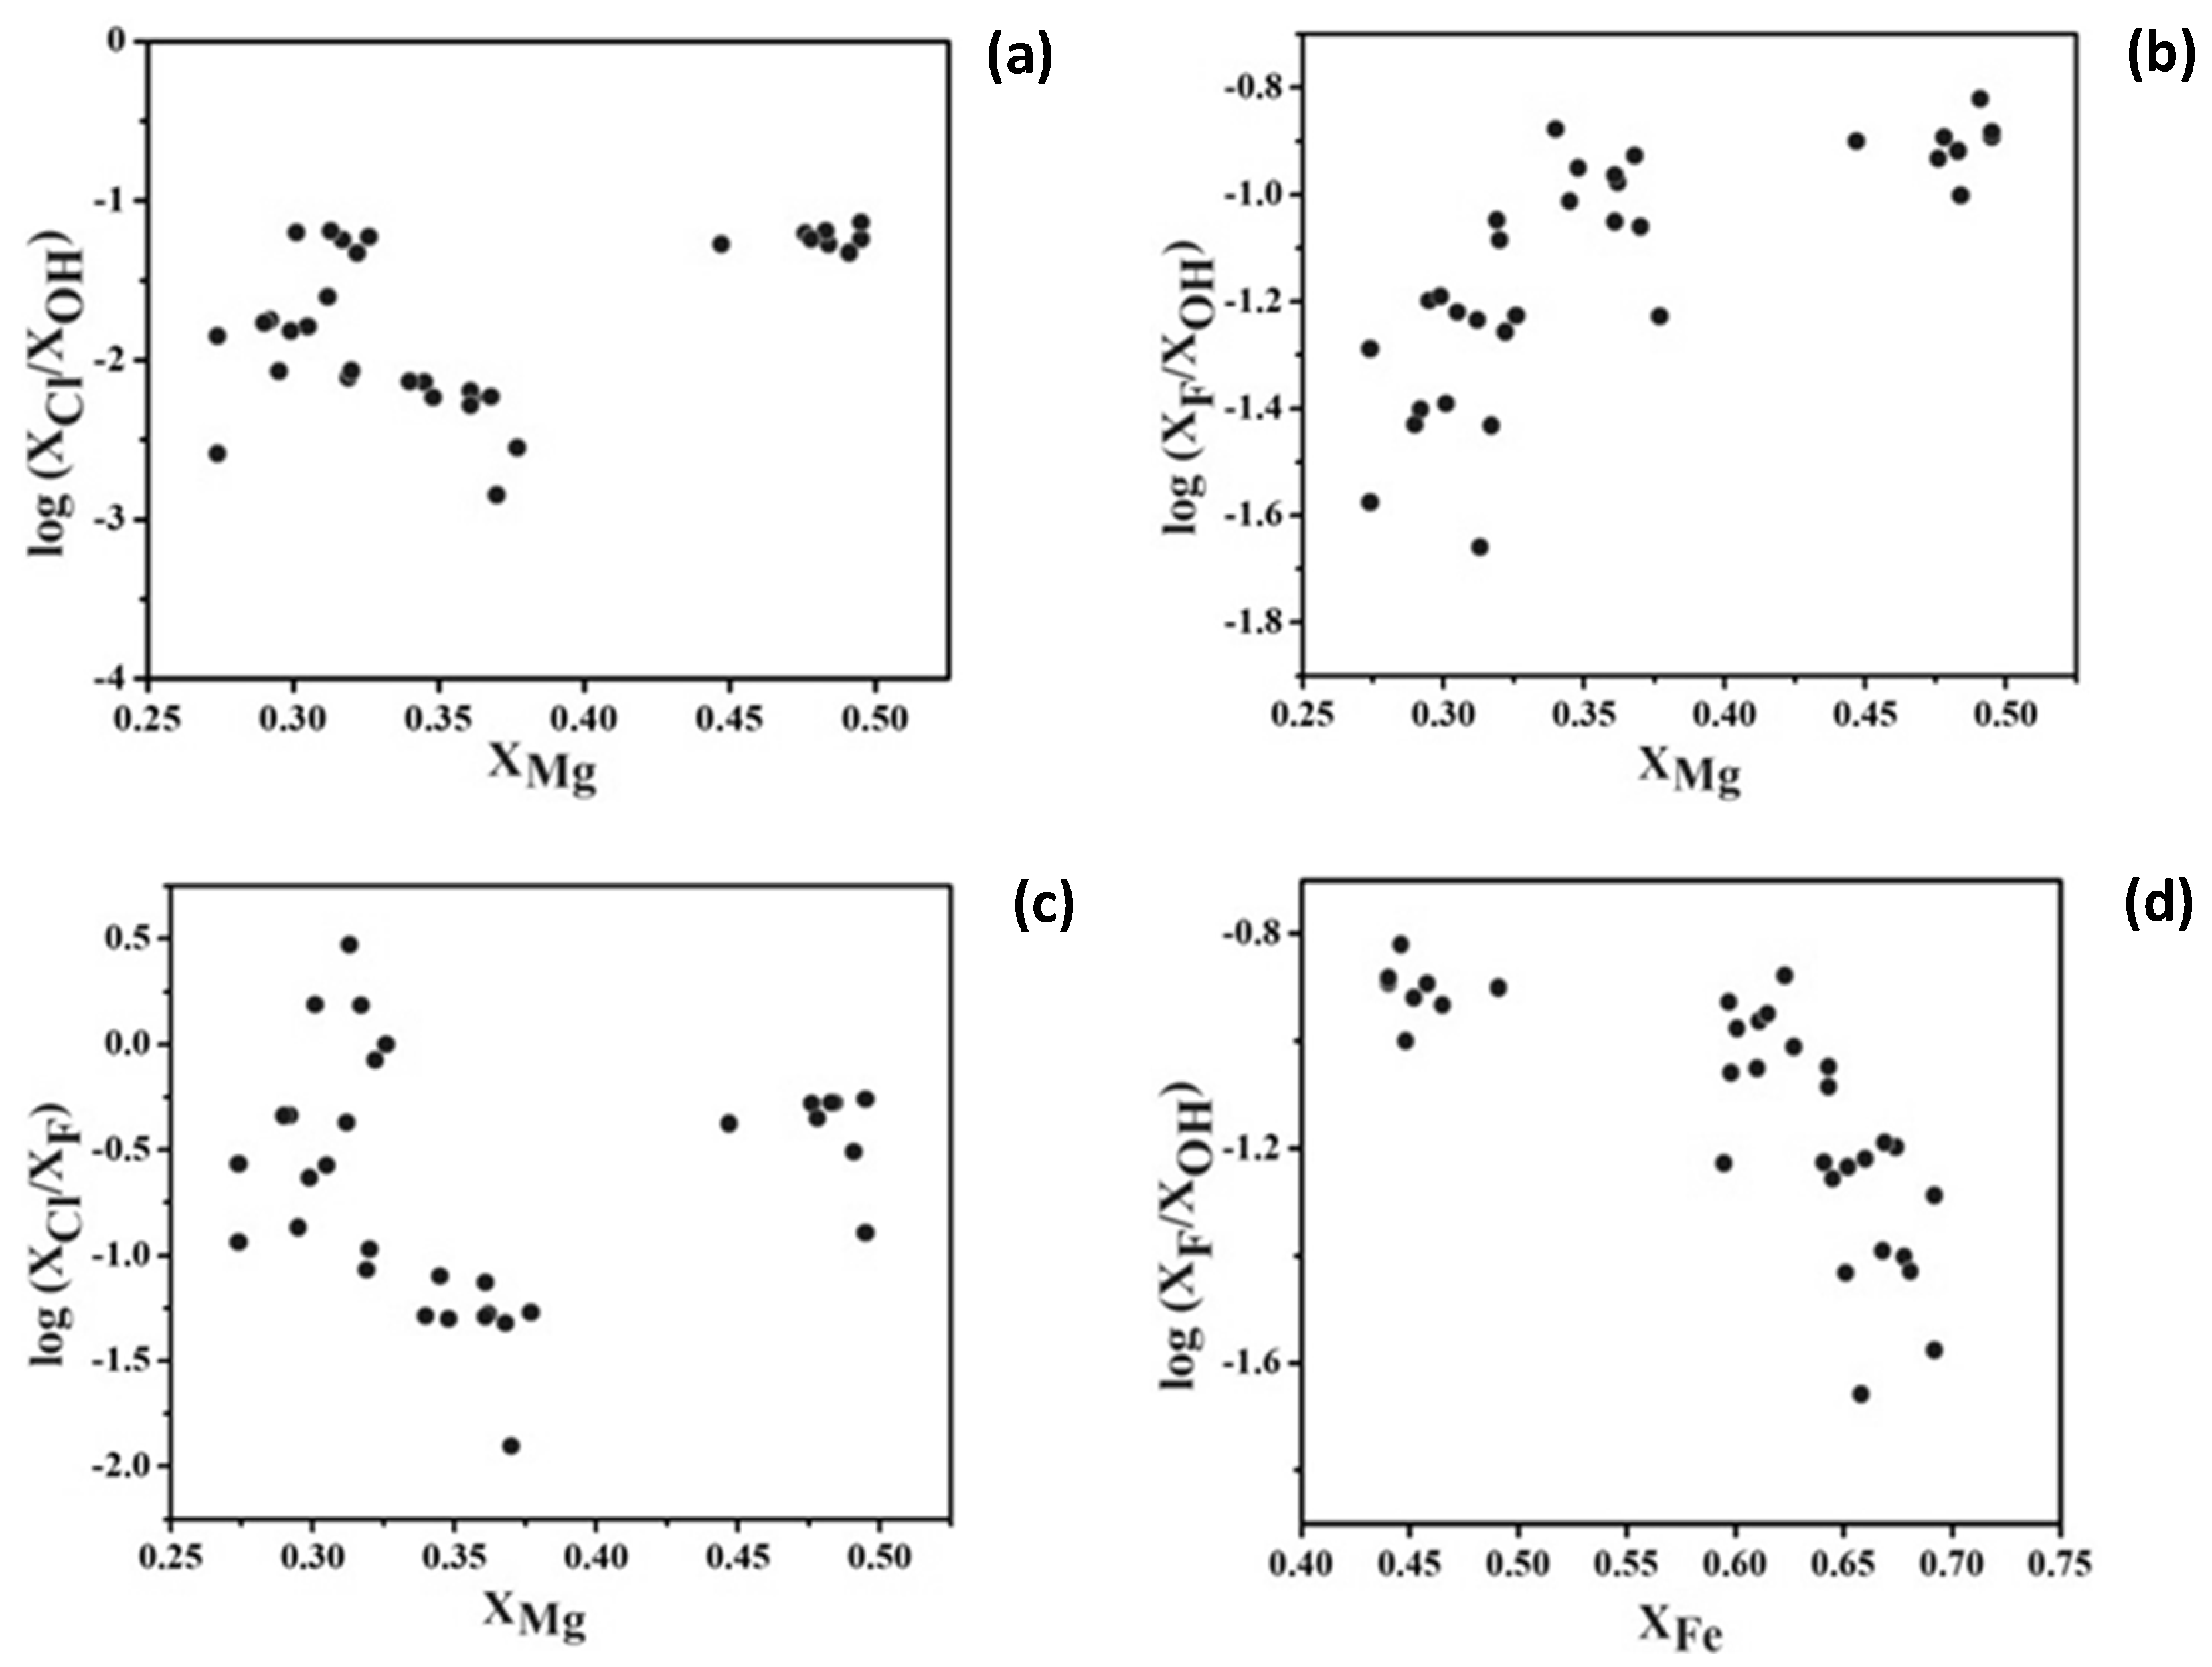
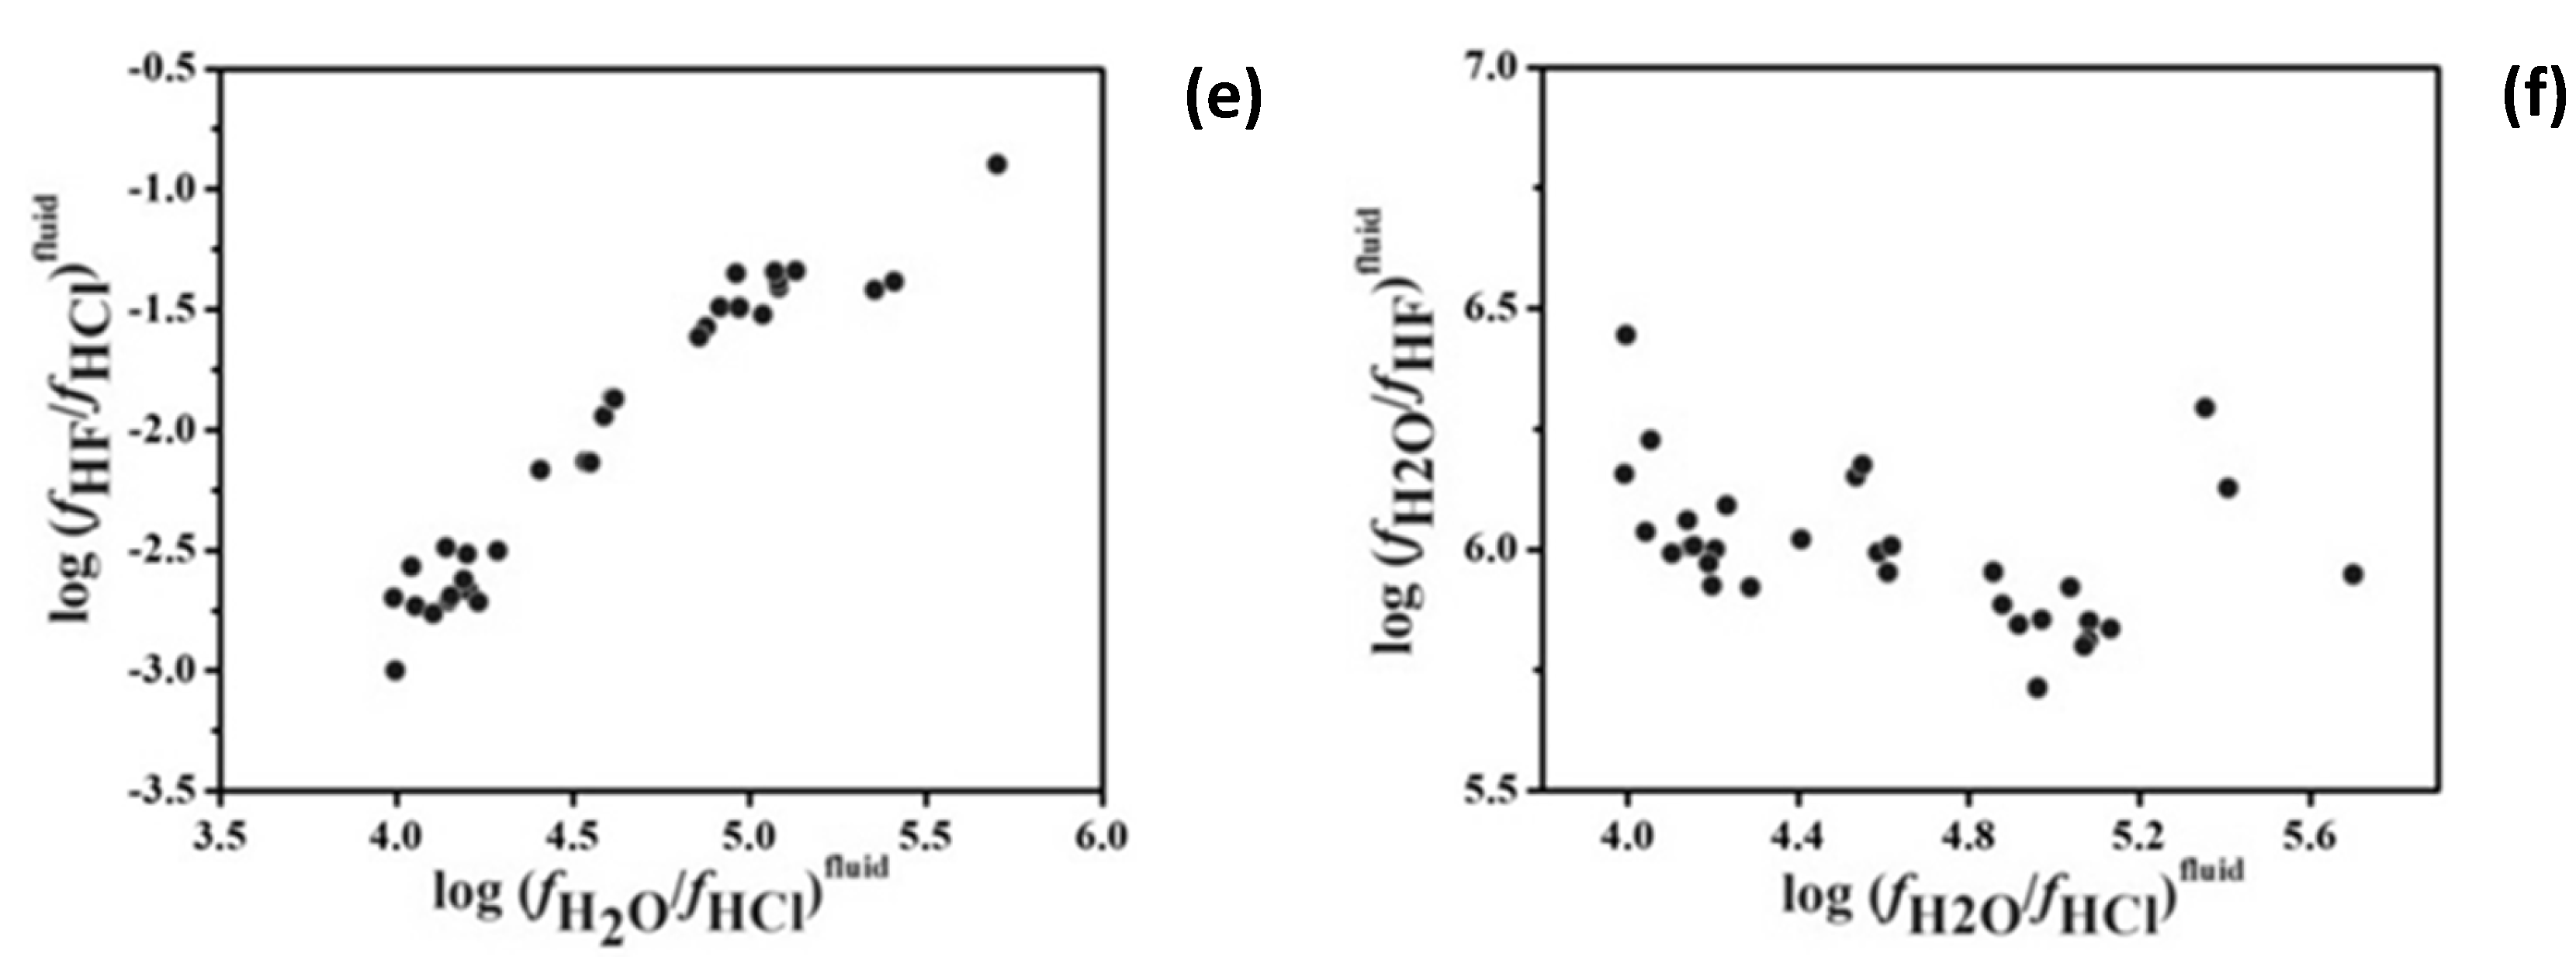
Figure 10.
Photomicrographs showing fluid inclusions of (a) aqueous biphase (Type- I); (b) pure carbonic (Type- II); (c) Type- II with a solid phase; (d) mixed-car bonic inclusion (Type III) with or without solid phases; (e) aqueous-carbonic (Type-IV) in triphase condition; (f) Type-IV with a solid phase; (g) association of Type-I and Type-IV inclusion; (h) polyphase inclusion (Type-V) with various shaped solid phases (denoted as XL); (i) some brighter solid phases in fluid inclusion cavity with variable phase ratio; (j) association of Type- I and Type II inclusion; (k) association of Type-I, Type-II and Type-IV inclusions and (l) colored inclusion in matrix quartz of granite.
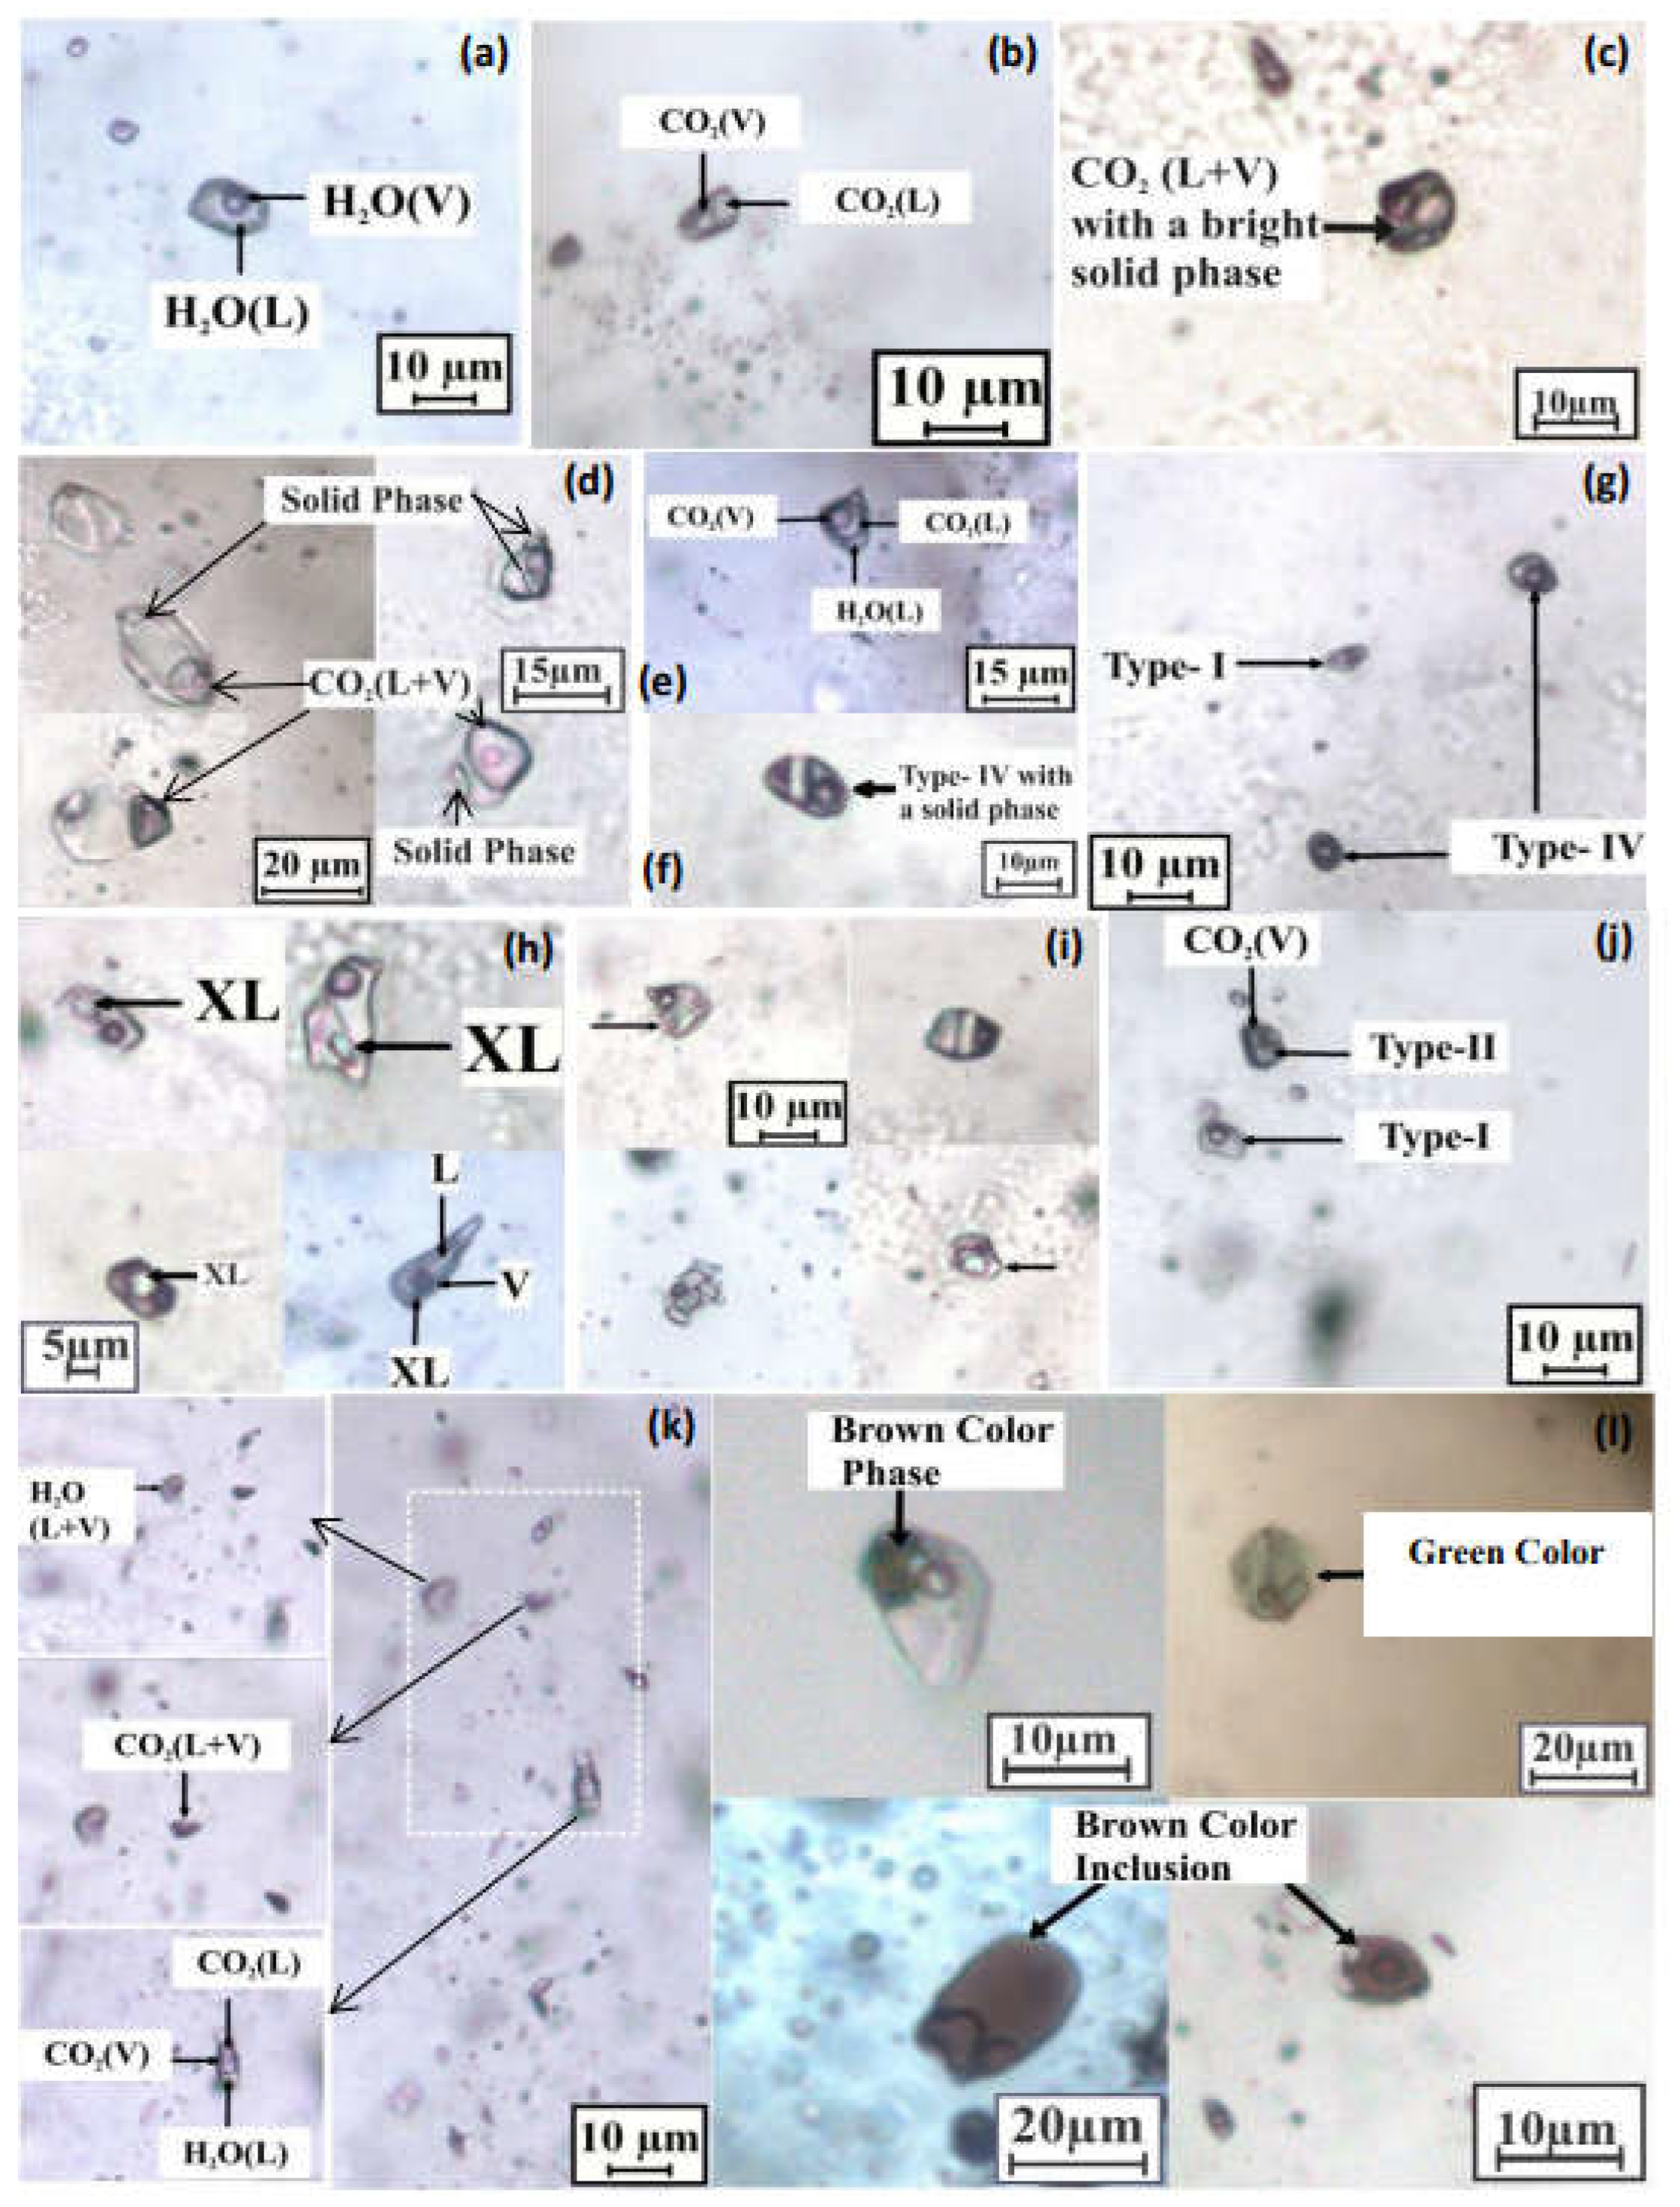
Figure 11.
Photomicrographs showing fluid inclusions of (a) type I (aqueous biphase); (b) association of type II (pure carbonic) and type IV (aqueous-carbonic); (c) association of type I and type IV; (d) type III (mixed-carbonic); (e) type-III with a solid phase denoted as XL; (f) thin channel of aqueous fluid within faint greenish material; (g) and (h) type V (aqueous polyphase) with a columnar and a cubic crystal (XL) respectively; (i) type IV with a bright globular like phase; (j) association of type IV with and without a solid phase and type I along a trail;(k) association of type I, type II and type IV; (l) and (m) unusual solid like phases in the inclusion cavity and (n) type VI with a moving phase in the quartz vein hosted in the BG.
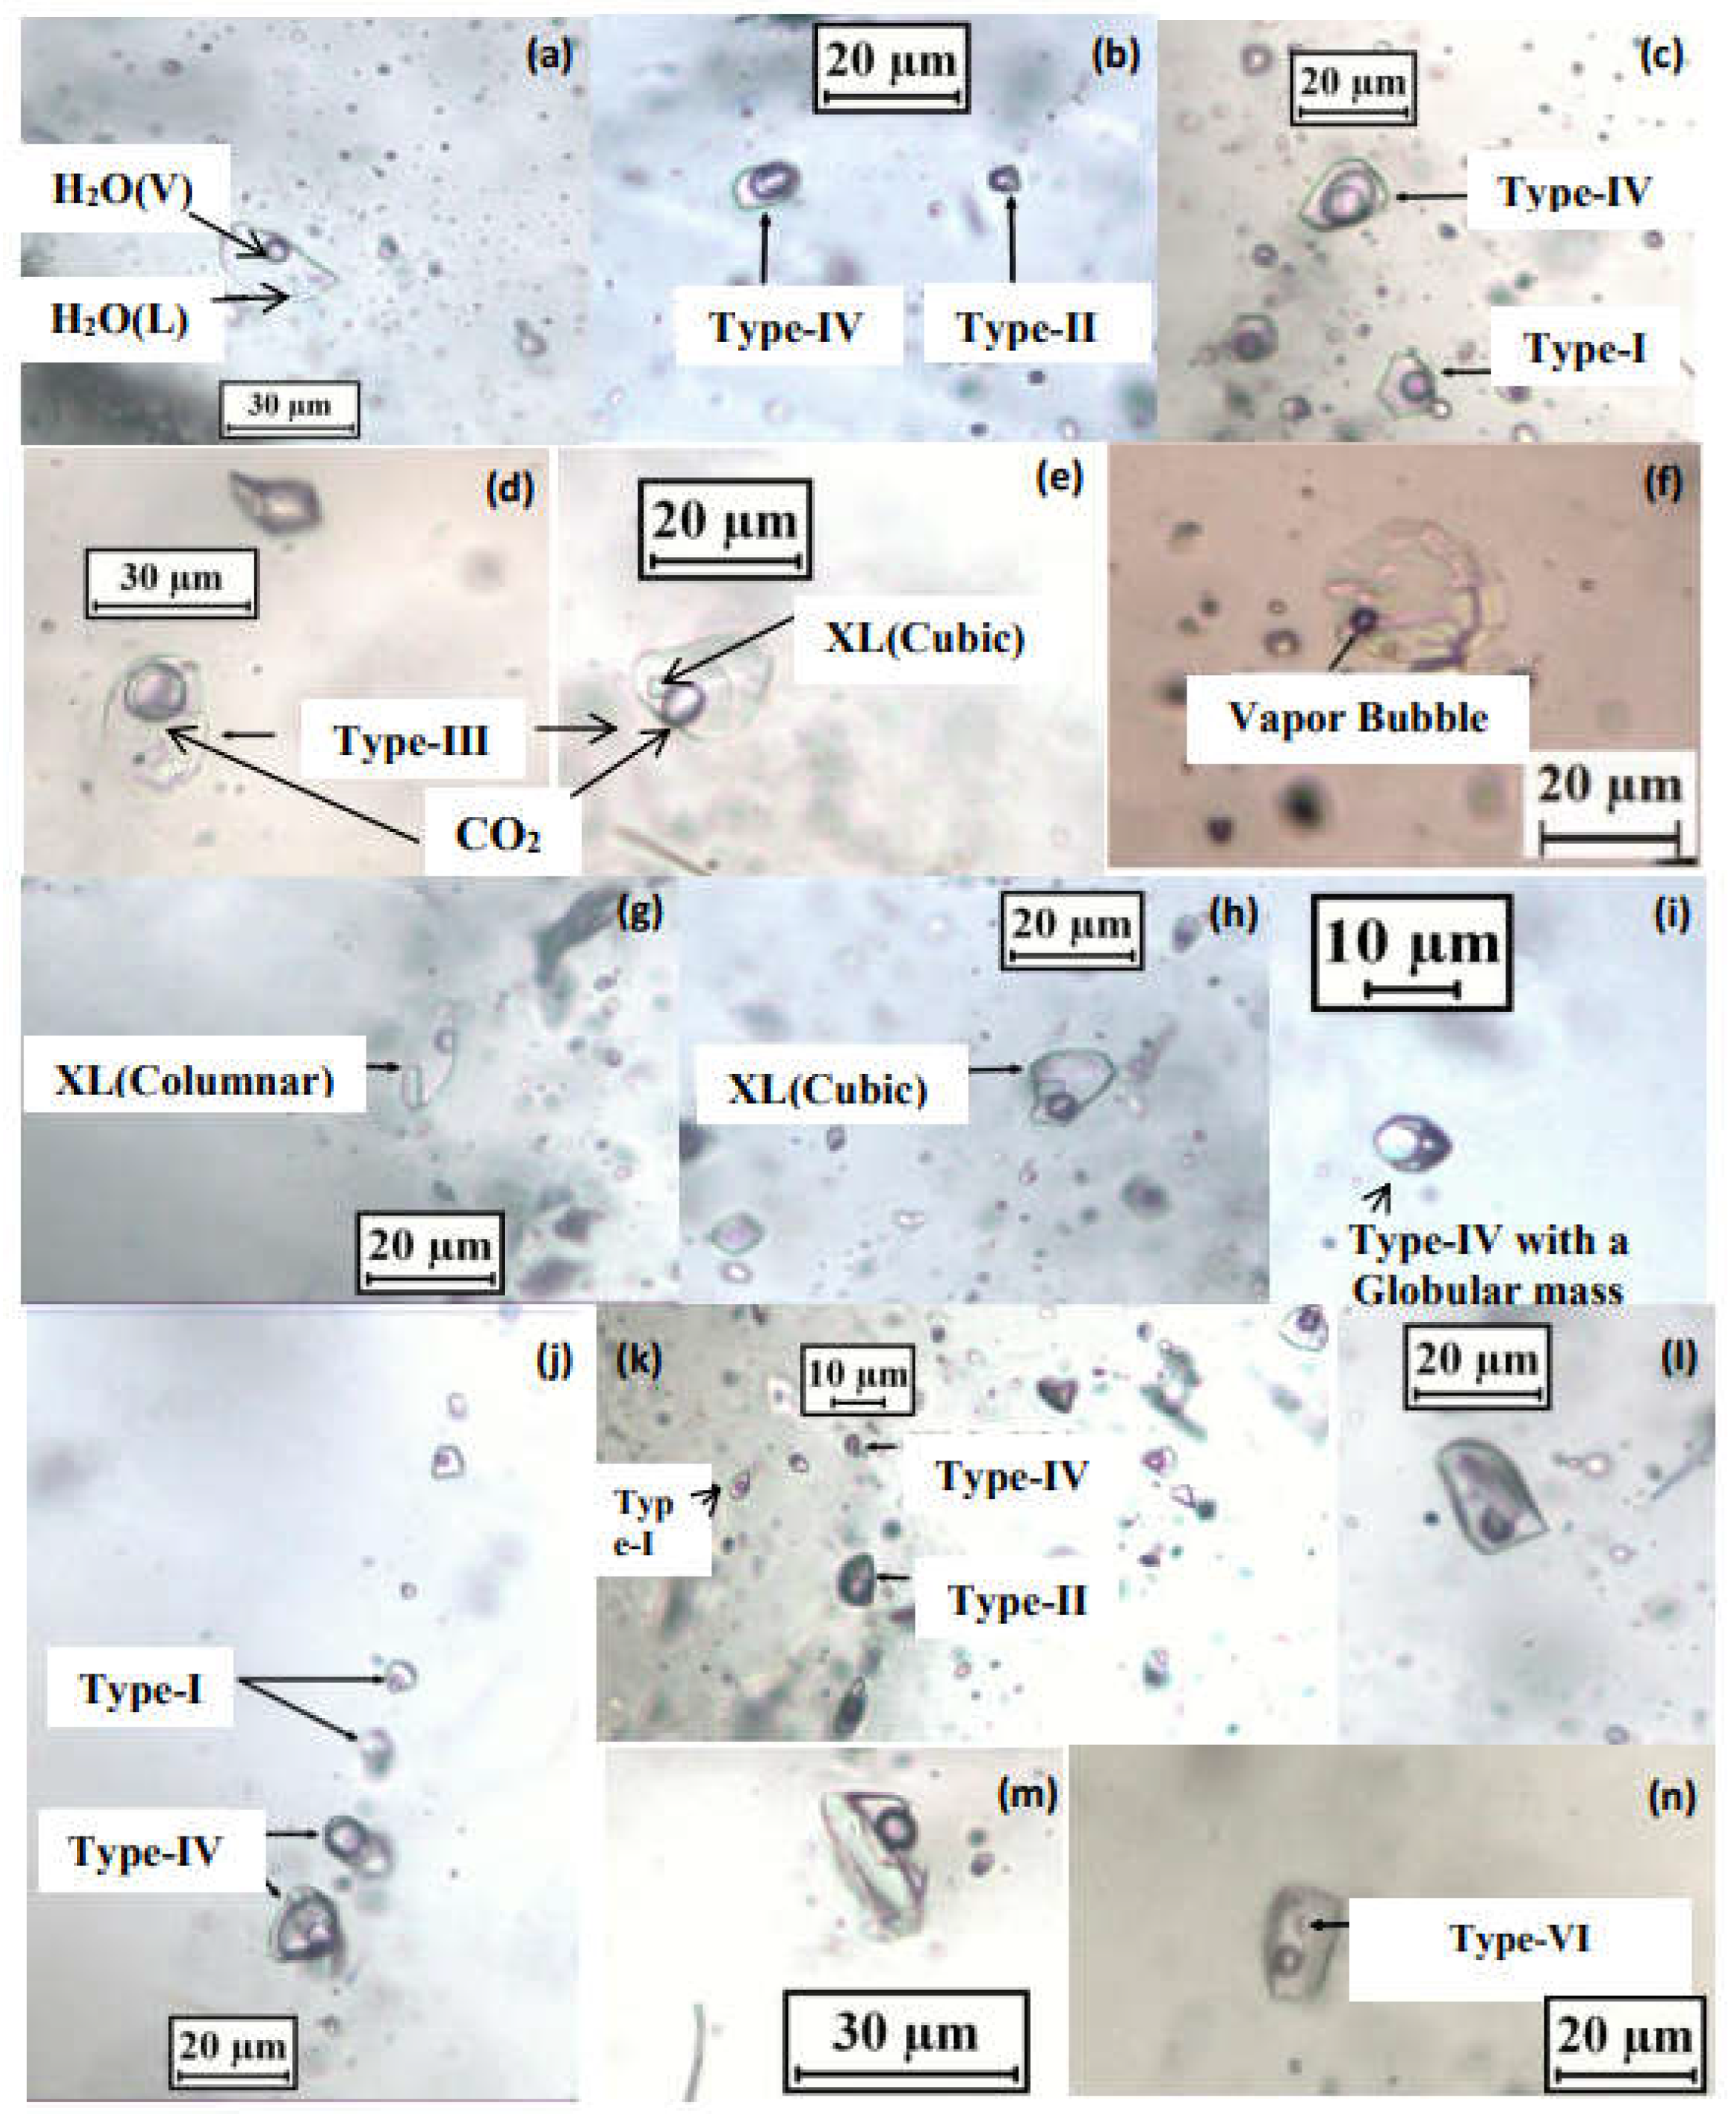
Figure 12.
Histogram showing (a) salinity (wt% NaCl eq.); (b) Th (°C) and (c) density (g/cc) in type I inclusion of matrix quartz (trail and non-trail bound inclusion) and vein quartz hosted in the BG; (d) Th,CO2 (°C) of type II, III and IV inclusion in matrix quartz and vein quartz hosted in the BG; (e) density (g/cc) in type II inclusion of matrix quartz and (f) isochore intersection in coeval type I and type II inclusion in matrix quartz deciphering P-T condition 220-270 °C /850- 1560 bar.
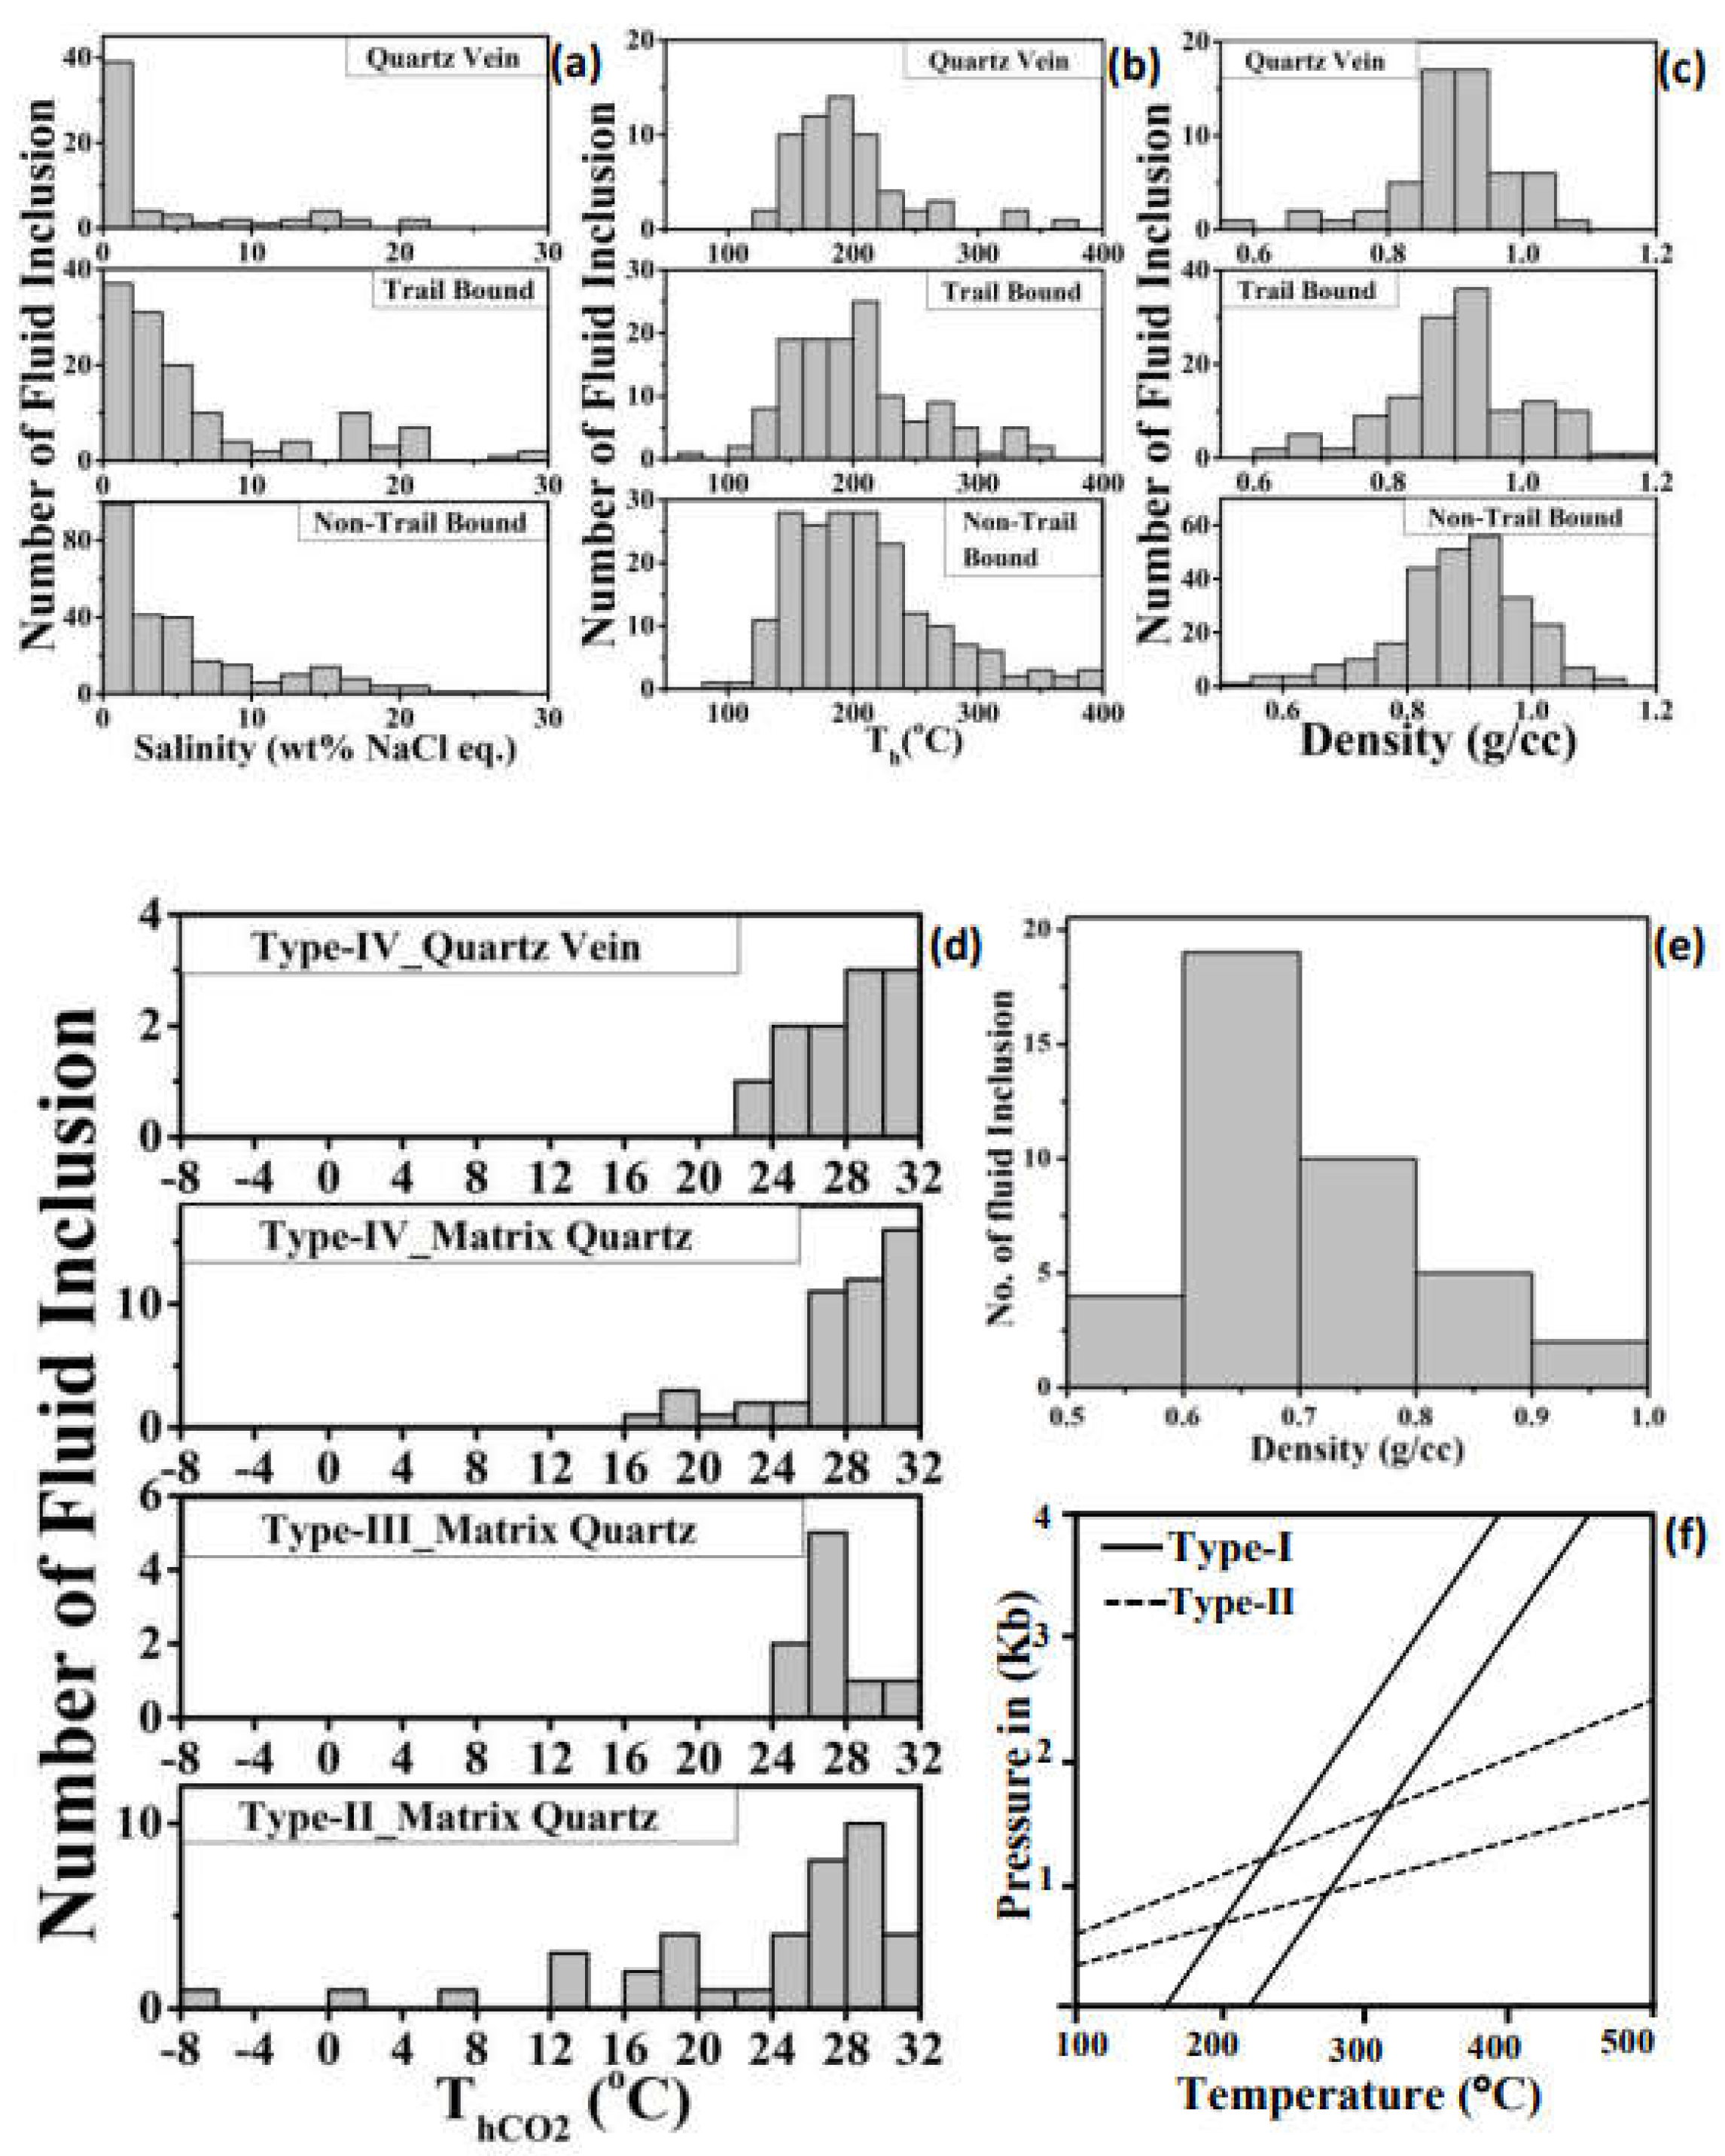
Figure 13.
(a) Brown solid– Weak peaks at 545 and 776 cm-1 indicate possible biotite. Clear phase not identified; (b) Clear solid identified as titanite by peak at 600 cm-1 ; (c) Clear solid identified as albite by peaks at 480 and 507 cm-1 ; (d) Green solid identified as edenite by bands at 543, 675 and 1021 cm-1 and (e) i_ Green solid identified as edenite by bands at 523, 672 cm-1 (e) ii_ Clear solid identified as calcite by bands at 292 and 1088 cm-1.
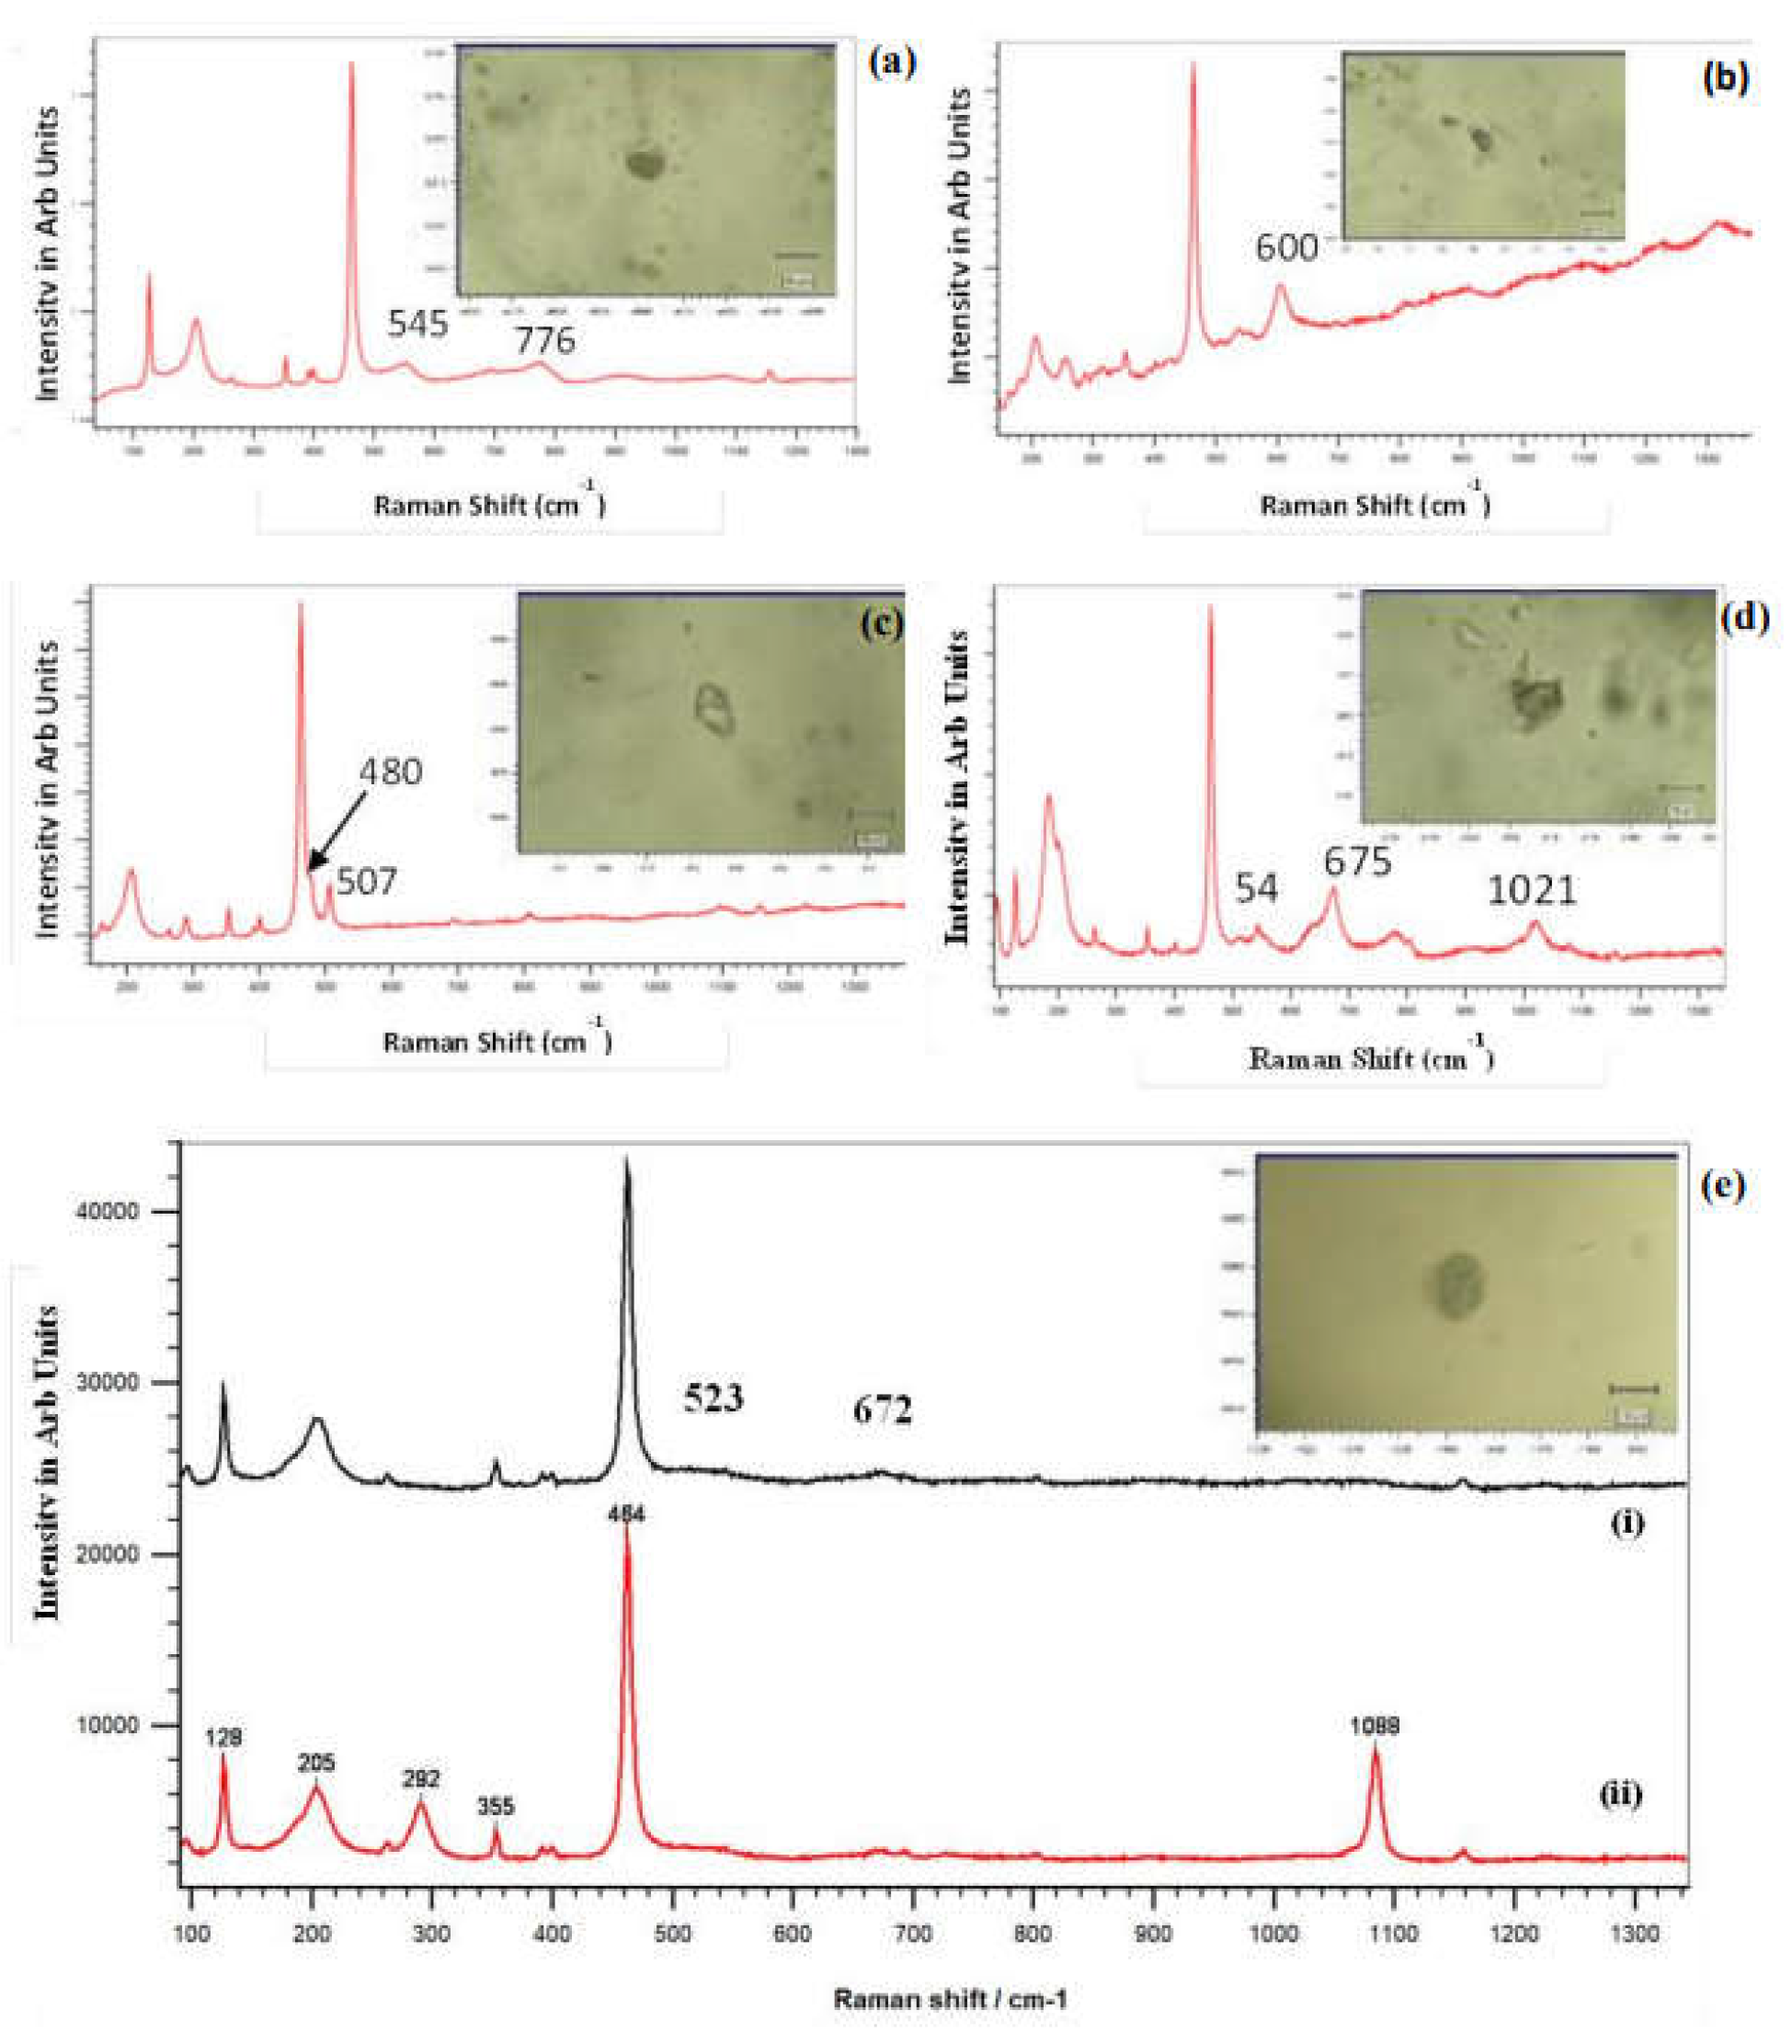
Disclaimer/Publisher’s Note: The statements, opinions and data contained in all publications are solely those of the individual author(s) and contributor(s) and not of MDPI and/or the editor(s). MDPI and/or the editor(s) disclaim responsibility for any injury to people or property resulting from any ideas, methods, instructions or products referred to in the content. |
© 2025 by the authors. Licensee MDPI, Basel, Switzerland. This article is an open access article distributed under the terms and conditions of the Creative Commons Attribution (CC BY) license (http://creativecommons.org/licenses/by/4.0/).
Copyright: This open access article is published under a Creative Commons CC BY 4.0 license, which permit the free download, distribution, and reuse, provided that the author and preprint are cited in any reuse.


