
Submitted:
31 March 2025
Posted:
01 April 2025
You are already at the latest version
Abstract
Experimental studies of steam and CO2-assited allothermal gasification of the original wet (moisture α=70%) and partly dried pig manure (PM) with α=45% and 15% are conducted on a laboratory-scale flow-through gasifier equipped with cyclones to capture fly ash particles. The high-temperature (~2000 °C) gasifying agent (GA) is generated by a pulsed-detonation gun operating on the stoichiometric natural gas (NG) – oxygen mixture. The dry off-gas obtained from the original wet PM typically contains 33–41 vol.% CO2, 34–40 vol.% CO, 17–22 vol.% H2, 2.5–4.0 vol.% CH4, and 0–2.5 vol.% CxHy with propane being the highest registered (less than 0.1%) hydrocarbon in CxHy, i.e., there is no tar as a gasification by-product. The reduction of feedstock moisture allows for reducing the yield of CO2 to 25% and increasing the yields of CO, H2, and CH4 to 45%, 25% and 5%, respectively. The size of solid residue particles taken from the cyclones ranges from 0.5 to 12 μm. The mass of solid residue is somewhat larger than the ash content in the dry PM due to the premature escape of partly gasified PM particles from the flow reactor. The results of experiments in terms of the off-gas temperature and composition agree satisfactorily with the results of thermodynamic calculations if one takes heat losses into account. In the existing version of the laboratory-scale setup, only about 33% of the thermal energy of the high-temperature GA is utilized for PM gasification, while the rest 67% is transferred to the coolant and environment. At these conditions, gasification of 1 kg of dry PM with the use of 1 kg of stoichiometric NG-oxygen mixture results in the production of 1.91 kg of combustible off-gas diluted with 25 vol.% CO2. To improve the energy efficiency of the gasification process, it is recommended to apply proper thermal insulation and heat recovery. To increase the yield of combustible gas, it is recommended to use the continuous supply of feedstock from a feeder and to improve mixing of PM and GA. To increase the carbon conversion efficiency, special measures must be taken to prevent premature entrainment of PM particles.
Keywords:
pig manure
; gasification
; steam
; carbon dioxide
; pulsed detonation gun
1. Introduction
One of the prerequisites for the strict legislation regarding livestock by-products in many countries is the fact that the accumulated volume of livestock waste (manure and droppings) drastically increases. Thus, the annual increase in the amount of livestock waste in Russia is approximately 100 million tons, and its significant portion is uncontrollably removed to fields or stored on unequipped land plots leading to environmental pollution. Of all livestock waste, PM is the most environmentally hazardous, since it contains significant concentrations of toxic compounds like ammonia, hydrogen sulfide, mercaptan, etc. [1], and technologies for its processing in large volumes are currently lacking [2]. There are a number of modern methods for PM processing, namely: biochemical methods of accelerated composting [3,4], fertilizer production [5,6], anaerobic fermentation [7,8], etc., as well as thermochemical methods of direct combustion [9,10,11,12], pyrolysis [13,14,15], hydrothermal conversion (liquefaction [16], carbonization [17], and gasification with supercritical water [18,19]), and gasification [15,20,21,22,23].
In contrast to biochemical methods with long processing times (weeks) and complex control, thermochemical methods are based on relatively fast processes of thermolysis and conversion with the destruction of pathogens [24], a significant reduction in the volume of feedstock, and the production of useful products – thermal energy, biogas or syngas (a mixture of H2, CO, light hydrocarbons, and CO2), liquid biofuel and a solid residue with an increased concentration of nutrients (phosphorus, potassium, etc.) [25] and with high porosity, which can be used both as a fertilizer and as a sorbent for heavy metals and organic pollutants [26]. The use of thermochemical methods for processing PM is usually complicated by its high humidity and ash content, which requires additional separation and drying operations.
Direct combustion of PM in grate furnaces or in fluidized bed reactors is considered one of the promising ways of its utilization for energy production and reduction of greenhouse gas emissions [27,28], however, cleaning of flue gases from harmful emissions, including furans and dioxins, makes this method expensive.
Pyrolysis of PM or its compost requires a large amount of energy, which is usually obtained by burning the PM itself or another organic feedstock. Pyrolysis is usually accompanied by the formation of three types of products: pyrolysis oil (60-75 wt.%), char (15-25 wt.%) and biogas (10-20 wt.%) [29]. Pyrolysis oil is an acidic mixture (pH from 2.5 to 3.5) of water (up to 30 wt.%) and oxygen-containing hydrocarbons (acids, alcohols, aldehydes, ketones, aromatic compounds, phenols, and sugars – more than 200 chemical substances in total) with different molecular weights [30,31]. After water separation, the higher heating value of the pyrolysis oil obtained from PM and from PM compost reaches 28.5 [32] and 31.2 MJ/kg [33], respectively, which is significantly higher than that of the pyrolysis oil obtained from sawdust (23.9 MJ/kg) [33]. To produce biofuel from such pyrolysis oil, a multi-stage process of catalytic hydrotreating under high pressure is used [34]. The resulting biofuel possesses increased corrosive activity, and the production of syngas from such biofuel using steam reforming is difficult due to coking and catalyst poisoning [35]. The char obtained during PM pyrolysis has a high content of P, N and S and low pH and EC values [36].
Hydrothermal methods use water or steam at very high pressures, which limit their wide application. Thus, hydrothermal liquefaction (depolymerization) of solid organic compounds contained in PM uses water at pressures of 10–25 MPa and temperatures of 550–640 K, and produces biofuel (the main product) with the heating value close to crude oil, and by-products in the form of gas and solid residue. Hydrothermal carbonization of PM uses a catalyst and an oxygen-deficient environment based on water/steam at pressures of up to 10 MPa and temperatures of 720–840 K, and produces biogas rich in hydrogen and biofuel rich in phenol, nitrogen, and aromatics. Catalytic/noncatalytic gasification of PM with supercritical water (pressure above 22.1 MPa, temperature above 650 K), which possesses increased solubility of organic substances, produces high-quality syngas, and an aqueous solution of residual organic substances (phenols, substituted phenols, carbocyclic and N-heterocyclic compounds, benzene, substituted benzenes, etc.).
For PM gasification, a gasifying agent (GA) (air, steam, carbon dioxide) is used at high temperatures (above 800 K) and atmospheric pressure, so that under conditions of insufficient or complete absence of free oxygen, the organic compounds contained in the PM are converted into syngas or producer gas, which can be used to produce chemicals (hydrogen, ammonia, methanol, etc.) or burned in boilers, gas piston, and gas turbine units. The PM gasification process is more energetically efficient than the pyrolysis process [37], although the biofuel obtained by pyrolysis is more energy-intensive than syngas or producer gas obtained by gasification: the higher heating value of syngas is 15–20 MJ/Nm3 [20,38]. It is also important to note that the use of steam and carbon dioxide as GAs has a number of advantages. Firstly, steam and CO2 consist only of H/O and C/O atoms, respectively, and, therefore, the resulting syngas is not diluted with other gases. Secondly, gasification of waste with H2O/CO2 requires significantly less GA due to their high enthalpy values. Thirdly, in the absence of free oxygen, the resulting syngas does not contain such toxic compounds as furans and dioxins [39], which facilitates its purification operations. Fourthly, the amount of hydrogen obtained during steam gasification of waste is several times greater than during air gasification. Fifthly, CO2 as a component of GA can be obtained in the form of flue gases from thermal power plants and power plants, which will reduce greenhouse gas emissions and reduce the carbon footprint.
In terms of its potential capabilities, gasification is considered the most promising thermochemical method of PM processing, however, the disadvantages of existing low-temperature (up to 1200 K) technologies – low carbon conversion, high content of condensable hydrocarbons (tars) in the off-gas, and the need to utilize tars and chars – limit its use on an industrial scale. An alternative to low-temperature gasification is high-temperature gasification, which is carried out at GA temperatures above 1500 K. At such high temperatures, the gasification products are high-quality and environmentally friendly syngas and mineral residue in the form of safe slag.
The most well-known high-temperature methods are allothermal electric-arc [40] and microwave [41] plasma gasification. In electric-arc gasification reactors, the GA passing through the electric discharge plasma takes on a temperature of ~10,000 K and reacts with waste at a temperature of 1500–2000 K, converting it into syngas and slag. In microwave gasification reactors, the feedstock is heated by absorbing high-frequency (several GHz) electromagnetic radiation, and gasification reactions occur in distributed “microplasma” centers at temperatures up to ~5000 K. Despite a number of advantages, plasma gasification technologies have disadvantages that limit their widespread use: they require a huge amount of electricity and special refractory materials.
We have proposed another allothermal method of high-temperature gasification – the detonation gun method [42] – which has been successfully applied to the disposal of a number of organic wastes [43,44,45,46]. In this method, the high-temperature GA is generated in a pulsed detonation gun (PDG) and is a mixture of steam and carbon dioxide with a temperature above 1500–2000 K, i.e. with the temperature of the GA in the electric-arc plasma gasification method. However, unlike plasma gasification, our method does not require a huge amount of electricity and special refractory materials. The objective of this work is to apply this method to the gasification of PM.
2. Materials and Methods
2.1. Main Feedstock
The original wet PM is used as the main feedstock (Figure 1a). The solid fraction of the PM is composed of particles of various shapes with an average size of ~1 mm. The size of the particles of the bedding material inclusions is 10-50 mm (Figure 1b). The density of the original PM samples varies from 600 to 1250 kg/m3. Drying on a hot surface shows that the moisture content of the original wet PM varies from 67 to 74 wt.%, i.e., on average 70 wt.%. Figure 1b and Figure 1c show the appearance of the PM after drying.
Table 1 presents the results of elemental CHNS analysis of two samples of the PM, carried out on an automatic CHNS/O PE 2400 Series II analyzer (Perkin Elmer, USA). The measurement accuracy is 0.30% abs. The mass fractions of water in samples #1 and #2 are 62.8% and 73.8%. The average contents of carbon, oxygen, and hydrogen in the dry PM are 45.7%, 37.7%, and 5.8%, respectively. The hydrogen content is approximately equal to its content in cellulose (C6H10O5)n, whereas the contents of C and O deviate upward and downward compared to cellulose (in cellulose, the contents of C, O, and H are 44.44%, 49.34% and 6.22%). Figure 2 shows the IR spectra of cellulose and two samples of the PM obtained on an IRTracer-100 spectrometer (Shimadzu, Japan) for comparison, with the IR spectrum of cellulose taken from the spectrometer database. There is a great similarity between the IR spectra. This means that the feedstock contains bedding material rich in cellulose (e.g., sawdust). In addition to C, O, and H, the feedstock contains nitrogen and sulfur, i.e., it contains nitrogen- and sulfur-containing compounds. Ash content is 8%–9%
Figure 3 shows the results of elemental X-ray fluorescence analysis of the PM performed on an ARL PERFORM’X spectrometer (Thermo Fisher Scientific Inc., USA; X-ray tube power 2500 W). The mass fraction of elements with an atomic mass greater than 11 in the feedstock is 6.8%. The mineral components in the feedstock are mainly represented by compounds of Si, Ca, P, Mg, K, S, Na, Cl, Al, and Fe.
Table 2 presents the results of calorimetric measurements of the higher heating value of the PM, performed in an ABK-1V bomb calorimeter (Russia). The sample of the PM was burned wrapped in a 20-μm thick terylene film in the form of a bag tied with a thread. The bag was placed in the crucible of the calorimetric bomb, the thread was tied to the ignition wire. The specific heat of combustion of the film was 22790 J/g. Without the film, it was impossible to burn the sample of the PM due to its high moisture. In Table 2, is the sample mass, is the film mass; is the thread mass, is the mass of water formed in the bomb crucible, is the mass of the solid residue in the crucible; snd is the higher heating value determined by the formula:
where is the heat equivalent of the calorimeter; is the temperature rise in the experiment; is the heat of combustion of the film; is the heat of combustion of the thread; is the ignition energy. The average higher heating value of the feedstock is approximately 5.8 MJ/kg.
Table 3 shows the dependence of the mass of the PM sample on the drying time at room temperature, where the mass of the dry PM sample is designated as . It is evident that the sample stops losing mass after approximately two days (48 hours).
The dried sample of the PM was burned in a calorimetric bomb without a film. To increase the sample mass (representativeness of the sample), a bomb with two crucibles located at different heights in the bomb cavity was used. The thermal equivalent of the calorimeter with such a bomb was determined in separate measurements and turned out to be the same as with one crucible, if one takes into account and introduces a correction for the difference in the heat capacities of the crucibles and fittings. The results of measurements performed with air-dry samples of the PM are given in Table 4 as #1 and #2. Additional drying of the air-dry sample in vacuum (pressure 0.5 mm Hg) for 16 hours led to a decrease in the sample mass by approximately 0.3%. The results of burning this sample in a calorimetric bomb are presented in Table 4 as #3. In Table 4, is the lower heating value determined by the formula:
Thus, the values = 16.5 MJ/kg and = 14.6 MJ/kg can be used to estimate the higher and lower heating values of an air-dry sample of the PM.
2.2. Other Types of Feedstock Used in the Study
In addition to the PM, coffee grounds (waste from coffee machines) with a moisture content of 80% and wood sawdust with a moisture content of 15% were used in the experiments for comparison. Table 5 and Table 6 show the elemental compositions of these wastes, taken from the literature. Comparison with Table 1 shows that the elemental compositions of all three types of feedstocks are quite close and differ mainly in ash content: the ash content of the PM (8.6%) is significantly higher than the ash content of coffee grounds (2.2%) and wood sawdust (0.5%).
2.3. Gasifying Agent
Table 7 shows the composition of natural gas (NG) used as a fuel in the PDG.
The products of pulsed detonation of the stoichiometric NG-oxygen mixture (fuel–to–oxygen equivalence ratio 1.0) are used as the GA. Since methane is the major component of NG, the latter can be reliably represented as pure methane in thermodynamic calculations. Thus, the calculated Chapman–Jouguet (CJ) detonation velocity in the stoichiometric methane-oxygen mixture is 2380 m/s (Mach number 6.74). The temperature, pressure, and density of the detonation products in the CJ state are 3700 K, 2.94 MPa, and 2 kg/m3, respectively. The temperature of the detonation products expanded to the initial pressure 0.1 MPa is 2853 K (2580 °C). The thermodynamic calculation was performed using the SDToolbox [49] and Cantera [50] codes. Table 8 shows the calculated composition of the detonation products of such a mixture, expanded to an initial pressure of 0.1 MPa and cooled to a characteristic temperature of 2000 K (this composition does not change when the products are cooled to lower temperatures).
2.4. Experimental Setup and Measuring Techniques
Figure 4 shows the schematic of the experimental setup. The main elements of the setup are a PDG, a vertical flow reactor, a cleaning system, and an off-gas burner. The PDG is a cylindrical tube with an internal diameter of 50 mm, a length of 600 mm, connected to a splitter tube with an internal diameter of 40 mm and a total length of 900 mm, and equipped with a mixing and ignition device (MID) and a cooling jacket. The detonation velocity in the PDG is determined using two ionization probes (IPs) located at a distance of 250 mm from each other. The operation frequency of the PDG is 0.7–1 Hz. With this frequency, the high-speed and high-temperature GA generated by the PDG is injected to the flow reactor (see a dashed red arrow in Figure 4).
The flow reactor is a 50-liter tank made from a standard gas cylinder. Compared to [46], the reactor is equipped with an upper hatch for loading feedstock and a flange for connecting the PDG (Figure 5a), so that the PDG is connected tangentially to the flow reactor at its bottom through a splitter tube (Figure 5b). The tube for removing the gasification products (a mixture of the off-gas, solid residue particles, and unreacted steam) comes out of the upper flange of the flow reactor. The gasification products continuously flow out of the reactor through the central tube with a diameter of 15 mm, exiting through the upper flange (the red solid arrow in Figure 4). The tube is deepened into the flow reactor by 300 mm relative to the upper flange.
Feedstock can be loaded into the flow reactor in two ways: (1) in batches through the upper hatch and (2) continuously through the lower hatch of the reactor, shown in Figure 5b. The first method of feedstock loading is taken as the basic one. It allows studying the influence of the batch mass, feedstock moisture, and the initial temperature of the reactor walls on the parameters of the gasification process. The disadvantage of this method of feedstock loading is the impossibility of determining and controlling the rate of feedstock consumption during the gasification process. With this loading method, the average rate of feedstock consumption can be determined only indirectly by dividing the mass of the loaded feedstock by the duration of the gasification process. For continuous feeding of feedstock, a special piston hydraulic feeder with a volume of 3 L was designed and manufactured. The operation principle of the feeder is similar to that of a concrete pump. Such a feeder ensures the feed rate of feedstock that is weakly dependent on external factors.
The composition of the off-gas is monitored by a flow-through gas analyzer MRU Syngas (Germany), which records volume concentrations of H2, CO, CO2, CH4, O2, and N2. The gas analyzer does not have selectivity for combustible hydrocarbons other than CH4, therefore the total volume fraction of CxHy compounds is presented as the volume fraction of N2. The error in measuring volume fractions by this gas analyzer is estimated at 5%. Data on the gas composition is displayed on the screen and recorded in the memory unit of the gas analyzer. It should be noted that, for better cleaning, the gas passes through a bubbler – a container filled with diesel fuel before being fed to the gas analyzer. For more accurate determination of the off-gas composition, including the composition of CxHy compounds in it, we also take samples for chromatographic analysis on a Chromatec-Crystal 2000 gas chromatograph (Russia). In this case, in order to check the effect of bubbling on the gas composition, the gas is sampled both before entering the bubbler and after leaving the bubbler.
A pressure sensor and two thermocouples measuring the average gas temperature in the flow reactor and the temperature of the reactor wall are installed in the upper part of the flow reactor. Thus, the composition of the off-gas, the pressure in the flow reactor, and the gas and wall temperatures in the upper part of the flow reactor are continuously recorded in each experiment.
The process of feedstock gasification is accompanied by the entrainment of feedstock mass from the flow reactor in the form of small solid particles, and the degree of carbon conversion in such particles can vary within a wide range. The cleaning system of the gasification products consists of two cyclones separated by the gas cooling system, and a diffusion burner with a pilot flame for burning the off-gas in air and visually monitoring the operation process intensity. The off-gas first passes through a 5-liter "dry" cyclone, where solid particles are screened out, then enters the gas cooling system, followed by a 2-liter "wet" cyclone for collecting condensate. After each experiment, all solid residues are removed from the cyclones, and the solid residue from the "wet" cyclone undergoes a drying procedure. The solid residue is then subjected to elemental CHNS analysis on a CHNS/O PE 2400 Series II automatic analyzer (Perkin Elmer, USA), X-ray fluorescence analysis on an ARL PERFORM’X spectrometer (Thermo Fisher Scientific Inc., USA), synchronous thermal analysis (DSC + TGA) on an STA ZCT-1 device (JING YI GAO KE, China), calorimetric analysis in an ABK-1V bomb calorimeter (Russia), and granulometric analysis by wet laser diffraction on an Analysette22 device (Fritsch, Germany) in the presence of a surfactant during ultrasonic treatment (50 W).
The concentration of H2O in the off-gas is estimated by the mass of the condensate extracted from the “wet” cyclone. The composition of the condensate is measured using a set of devices including a Trace-1310 gas chromatograph and an ISQ mass spectrometric detector. Extraction of the components contained in the condensate is carried out by adding 4 mL of diethyl ether to 4 mL of the sample.
2.5. Experimental Methodology
The feedstock is fed into the reactor either in batches or continuously. In the former case, a batch of feedstock weighing 0.5–1.0 kg is loaded into the flow reactor before the start of experiment. Then the registration system, the off-gas cooling system, and all PDG systems are started. Thereafter the cyclic operation of the PDG is started at a given frequency. The feedstock gasification process consists of two stages – the stage of heating and evaporation of the contained moisture and the stage of gasification of the dried mass. The end of the first stage is determined by the temperature in the flow reactor and by the absence/presence of combustion of the off-gas in the diffusion burner. The cessation of combustion of the off-gas in the diffusion burner conditionally means the end of the gasification process. The average temperature of the upper part of the flow reactor reaches 250–350 °C by the end of the gasification process of the loaded feedstock batch. It should be noted that gasification reactions in the reactor mainly occur at local instantaneous temperatures of the GA above 2000 °C rather than at the gas temperature measured by the thermocouple. In a number of experiments, the flow reactor is preheated (without feedstock loading) to a wall temperature of 170–300 °C. Batches of PM with different moisture are loaded into the flow reactor: original (~70%), medium (~45%), and low (~15%).
It is obvious that the option of feedstock-batch gasification is not optimal: due to the low initial temperature and the large mass of a feedstock batch compared to the mass of the supplied GA, the gasification process is accompanied by gradual heating of the entire batch of feedstock and, therefore, occurs at a lower average temperature than with a continuous supply of feedstock. As noted above, gasification reactions in any case occur at local instantaneous temperatures of the expanding detonation products of the NG-oxygen mixture at a level of 2000 °C and higher, however, due to the spatial distribution of feedstock particles in the flow reactor and their nonuniform interaction with GA jets, only a part of the feedstock is exposed to such high temperatures.
Continuous feedstock supply using the piston feeder with a volumetric flow rate of 0.5–3.3 mL/s is carried out either into a cold reactor or into a reactor preheated (without feedstock supply) to a wall temperature of 400 °C. The latter allows increasing the average temperature in the reactor and improving the uniformity of the interaction of feedstock particles with the supersonic jets of the GA. The average temperature of the upper part of the flow reactor wall reaches 400 °C. In order to reduce energy costs for heating and evaporating feedstock moisture, the piston feeder filled with loose and wet feedstock first squeezes some water from the feedstock and reduces the density by almost a factor of 3 (from 0.7 to 0.25 g/mL) before feeding the feedstock into the flow reactor.
2.6. Measurement Examples
Examples of some typical measurements made during the operation of the experimental setup are presented below. Figure 6 shows an example of recording gas temperature and the wall temperature of the reactor in its upper part in the experiment with loading a 1-kg batch of PM (70% moisture) through the upper hatch. The process of PM gasification can be divided into two characteristic stages: the stage of heating and evaporating water contained in the PM, and the stage of gasification of the dried PM. The first stage obviously corresponds to the time interval T1, since the gas temperature reaches a plateau of 100 °C and does not rise above for some time. The second stage conditionally corresponds to the time interval T2 until the flame in the burner is quenched. In this experiment, 380 s and 450 s, and the total duration of the gasification process 830 s. At the end of the gasification process, the temperature is 30–40 °C higher than .
The primary experimental data on the off-gas composition are the time dependencies of the volume fractions of gas components measured by the flow-through gas analyzer. It should be noted that the time it takes for the gas analyzer readings to reach steady-state values for different gases depends on many factors: the type of sensor; the type of liquid used in the purification columns; the uniformity of the conversion process; etc. The minimum time it takes for the recorded signals to reach steady-state values is ~300 s. It is difficult to ensure that the concentrations reach steady-state values for all experimental conditions. Therefore, it was often necessary to conduct several experiments and compare the results obtained under the same or similar conditions. Figure 7 shows an example of records of the flow-through gas analyzer (left scale) and gas and wall temperatures in the upper part of the flow reactor (right scale) in an experiment with loading a 1-kg batch of wet PM into the reactor. The total operation time is about 1100 s (taking into account the mode entry), the duration of the water heating and evaporation stage is about 250 s, the duration of the gasification stage is about 600 s. At the end of the gasification process, the dry off-gas contains 21 vol.% H2, 40 vol.% CO, 32 vol.% CO2, 5 vol.% CH4, 2 vol.% CxHy and 0 vol.% O2, i.e. the off-gas consists of 68% combustible gas. The average gas temperature and wall temperature in the upper part of the flow reactor reach 190–220 °С.
Figure 8 shows a photograph of the solid residue extracted from the "dry" cyclone in an experiment with PM gasification. The composition and mass of the solid residue extracted from the cyclones are used to assess the feedstock gasification efficiency.
2.7. Thermodynamic Calculation
Figure 9 schematically shows the thermodynamic model of the dry PM gasification process. In this model, fuel (methane) and oxidizer (oxygen) are fed into the PDG, mix with each other, and fill the tube. Then, after ignition, the detonation wave runs through the mixture at a very high velocity and converts the fresh mixture into the detonation products consisting mainly of steam and carbon dioxide compressed to high pressure and heated to high temperature. After the detonation wave enters the flow reactor, the detonation products expand to 0.1 MPa and are cooled to ~2580 °C. The dry PM fed into the flow reactor is subjected to thermal, mechanical, and chemical action of a dense (density of ~2 kg/m3) jet of detonation products, and is converted into the off-gas. The off-gas continuously flows out of the reactor and is directed to a customer after cooling.
Table 9 shows the average statistical composition of litter-free PM [51]. If one assumes [52] that the composition of the organic matter in Table 9 is close to the composition of humus, which mainly contains humic acid (~30 wt.%), fulvic acid (~40 wt.%), and humin (~30 wt.%), then the approximate elemental composition of the model litter-free PM is presented in Table 10. It follows from Table 1 and Table 10 that, in comparison with the model composition of dry PM, the presence of bedding material in the original PM leads, on the one hand, to an increase in the contents of carbon from 37.7 to 45.7%, hydrogen from 3.4 to 5.8% and oxygen from 32.3 to 37.7% and, on the other hand, to a decrease in the content of nitrogen from 5.1 to 1.6%.
The calculations are carried out using the method described in detail in [53] for an adiabatic system, i.e., heat losses to the environment are not taken into account. It is assumed that the GA is represented by the products of ideal detonation of the stoichiometric methane–oxygen mixture expanded to a pressure of 0.1 MPa. Mixing of the feedstock with the GA is considered instantaneous, homogeneous, and complete. The condensed phase in the gasification products is represented by graphite.
3. Results
3.1. Calculated Chemical Composition of Gasification Products
Thermodynamic calculations show that 0.3 kg of GA should be used for gasification of 1 kg of dry PM, i.e., the optimal theoretical PM/GA mass ratio is 3.4. At > 3.4, the yield of solid carbon (graphite) increases (up to 20 vol.% at a gasification temperature of 1000 K and up to 10–12 vol.% at a gasification temperature above 1200 K). The removal of solid carbon will require additional technological operations to purify the gasification products and to obtain a high-quality syngas. In addition, due to the formation of a condensed phase, the volume fractions of the main components of the off-gas (H2 and CO) decrease, i.e., the mass of the off-gas obtained from 1 kg of PM decreases. At < 3.4, the volume fractions of steam and carbon dioxide in the off-gas increase, thus reducing the mass of the dry off-gas and worsening its heating value due to the high content of carbon dioxide.
Table 11 shows the calculated compositions of the off-gas at gasification temperatures of 1000, 1200, 1500, and 2000 K, and a pressure of 0.1 MPa. According to the calculation, at a gasification temperature above 1500 K, the off-gas contains only CO, H2, and N2 (nitrogen is contained in the model composition of the PM).
3.2. Measured Composition of Gasification Products
Table 12 presents the results of experiments conducted with the PM, as well as (for comparison) the results of the experiments on the gasification of coffee grounds (experiment #1) and wood sawdust (experiments #17 and #18). Here is the operation frequency of the PDG; is the mass of the original (wet) feedstock; is the moisture content of the feedstock; is the mass of dry matter in the feedstock; is the mass of the solid residue after gasification; T1 is the duration of the stage of heating and evaporating feedstock moisture; T2 is the duration of the gasification stage of the dried feedstock; is the total duration of the feedstock gasification process; is the mass flow rate of feedstock when supplied continuously from the feeder; and is the temperature of the reactor wall. In addition, the table shows the measured composition of the dry off-gas in terms of CO2, CO, H2, CH4, CxHy, and O2 volume fractions as well as volumetric and mass lower heating values of the dry off-gas.
The typical composition of the dry off-gas produced by gasification of the original wet (70%) PM: 33–41 vol.% CO2, 34–40 vol.% CO, 17–22 vol.% H2, 2.5–4.0 vol.% CH4, and 0–2.5 vol.% CxHy (Figure 10). A decrease in the yield of CO2 leads to an increase in the yields of CO and H2. The yields of hydrocarbons CH4 and CxHy remain approximately unchanged.
During gasification of dried PM (15%), the content of CO2 decreases to 26–32 vol.%, and the maximum contents of CO, H2, and CH4 increase to 45, 25, and 4.5 vol.%, respectively, i.e., the produced dry off-gas can contain up to 75% combustible gas. It is interesting that the compositions of the off-gas produced by gasification of the PM, coffee grounds, and sawdust turned out to be quite close to each other. To verify this, it is sufficient to compare the results of experiments #1 and #2, as well as experiments #18 and #19. The lower heating value of the produced off-gas is 7–12 MJ/kg.
Analysis of the data in Table 12 shows that, for fixed PM mass and moisture, an increase in the operation frequency of the PDG leads to a reduction in the total gasification time (cf. experiments #3, #4, and #9 with experiment #5). An increase in the PM moisture, all other conditions being equal, leads to a decrease in the maximum temperature of the reactor wall (cf. experiments #19 and #20). An increase in the mass of the PM batch loaded into the flow reactor, all other conditions being equal, leads to a decrease in the maximum temperature of the reactor wall (cf. experiments #11 and #20). All these observations are consistent with the expected trends. The data in Table 12 allows one to determine the effect of the various factors, like feedstock type, the method of feeding the feedstock into the flow reactor, the initial temperature of the reactor walls, etc. on the composition of the produced off-gas. These effects are discussed in the following subsections.
3.3. Effect of the Feedstock Type on the Composition of the Produced Dry Off-Gas
Additional experiments on gasification of coffee grounds (moisture 80%) and wood sawdust (15%) were conducted to see differences in the gasification of the original wet PM (70%) and thermally dried PM (15%). The experiments were conducted with batch loading of feedstock into the flow reactor. It is noteworthy that the coffee grounds possess a moisture comparable to that of the original wet PM, and the wood sawdust possesses a moisture similar to that of the thermally dried PM.
Figure 11a compares the measured dependencies of the volume fractions of CO, H2, CH4, and CxHy on the volume fraction of CO2 in the dry off-gas produced by gasification of the original wet PM (circles) and wet coffee grounds (triangles), whereas Figure 11b compares similar dependences for the dry off-gas produced by gasification of dried PM (diamonds) and sawdust (crosses). Different types of feedstocks which mainly differ in ash content (see Section 2.2), show similar compositions of the dry off-gas at close values of feedstock moisture. By reducing the moisture, it is possible to increase the yields of CO, H2, and CH4 to 45%, 25%, and 5%, respectively, and to decrease the yield of CO2 to 25%. Thus, it can be expected that the gasification method under study allows processing different types of feedstocks without stopping the line and switching to other settings.
70%) and wet coffee grounds (80%), and (b) dried PM (15%) and sawdust (15%).
3.4. Effect of the Feedstock Feeding Method and the Initial Temperature of Reactor Walls on the Dry Off-Gas Composition
As an alternative to the basic method of feedstock loading, we have also developed and applied a hydraulic piston-driven feeder, which ensures a controllable constant linear speed of piston movement and feedstock supply into the flow reactor. It was expected that gradual feeding would lead to improved mixing of the feedstock with GA and, consequently, to an increase in the carbon conversion efficiency and in the yields of CO and H2, and a decrease in the yield of CO2. However, due to technical difficulties that arose, any noticeable increase in the yields of CO and H2 and a decrease in the yield of CO2 have not yet been achieved. Therefore, only preliminary results obtained with gradual feedstock feeding are presented here.
During the gasification process, the flow reactor was heated either to a relatively low temperature (200 °С) or to a temperature of 400–500 °С. Figure 12 compares the compositions of the dry off-gas produced with one-time loading of a weighed feedstock batch (squares) and with the gradual feed of feedstock (diamonds) into the flow reactor, with the feedstock (PM) possessing different moisture (from 70% to 15%). The filled diamonds and squares in Figure 12 correspond to a reactor wall temperature of 400–500 °С, and the unfilled symbols correspond to a reactor wall temperature of 200 °С. It is evident that with the gradual feedstock feeding method, the composition of the produced off-gas is somewhat worse than with the one-time batch loading method. Work to improve the piston feeder is ongoing. As for the effect of the initial reactor temperature on the composition of the produced off-gas, an increase in this temperature leads, as expected, to an increase in the yields of CO and H2 and a decrease in the yield of CO2, i.e., the off-gas quality is improved.
3.5. Effect of Feedstock Moisture on the Yield of Solid Residue
According to Table 12, the mass of solid residue extracted from the "dry" and "wet" cyclones is 10%-17% of the mass of dry PM at an original moisture of 70%. When the PM moisture is decreased to 15%, the mass of solid residue increases to 20%-30%. This means that the dried PM is more easily carried away from the flow reactor than the original wet PM, which is also consistent with common sense.
In order for the PM to undergo complete gasification in the flow reactor, special measures must be taken to prevent premature carryover of the feedstock: the residence time of feedstock particles in the flow reactor must be somehow increased. This can be achieved by using intermediate volumes between the PDG and the flow reactor or by using cascades of flow reactors.
3.6. Mass Balances
In experiments ##3, 4, 5, 9, and 13 it was possible to determine quite accurately the mass ratios between the evaporated water, gasified dry feedstock, and supplied GA. Table 13 shows the total mass of feedstock batch ; the feedstock moisture ; the mass of water in the feedstock batch ; the mass of dry matter in the feedstock batch ; as well as the mass flow rates of oxygen and NG and ; and the calculated ratios of the mass of water to the mass of consumed NG /; the mass of dry matter in the feedstock to the mass of consumed NG /; and the mass of the consumed combustible mixture () to the mass of the feedstock batch /. The final ratio / shows that 1.52 and 1.35 kg of GA are required for 1 kg of the wet PM with 70% and 45%, respectively. Extrapolation of these results to dry PM with 0% gives the experimental PM/GA mass ratio 1, i.e., 1 kg of GA is required for the gasification of 1 kg of dry PM. If one avoids premature carryover of the feedstock, then the gasification process results in the production of 1.91 kg of combustible gas (taking into account the ash content of approximately 9% in the dry PM). Thus, the experimental value of the PM/GA mass ratio turned out to be approximately 3.4 times less than the theoretical value: 3.4.
3.7. Clarified Chemical Composition of the Off-Gas
In experiments ##9, 10, 11, and 12 (see Table 12), in parallel with recording the composition of the produced off-gas with the MRU VARIO Plus flow-through gas analyzer, we collected gas samples for chromatographic analysis on a Chromatec-Crystal 2000 gas chromatograph. Table 14 compares the volume fractions of gas components measured with the flow gas analyzer and on chromatographs (marked with an asterisk *). Chromatographic samples in experiments #9 and #10 were collected after the gases passed through the bubbler, and in experiments #11 and #12 – before entering the bubbler. It turned out that bubbling does not affect much the off-gas composition.
The comparison of instrument readings indicates that the volume fractions of CO and H2 obtained on gas chromatograph differ from the readings of the flow-through gas analyzer by an average of –3% (abs.) for CO and by +5% (abs.) for H2. Unlike the flow-through gas analyzer, which registers only methane and registers all other hydrocarbons CxHy as N2, the gas chromatograph provides the full composition of hydrocarbons CxHy. The highest registered hydrocarbon is seen to be propane. Its content does not exceed 0.1%. In addition to propane, the produced off-gas contains small amounts of ethylene and ethane. The total fraction of all registered hydrocarbons, including methane, does not exceed 5%. Thus, the dry off-gas contains no hydrocarbons higher than propane, including condensable gases and tars.
3.8. Elemental Composition and Oxidative Stability of the Solid Residue
Table 15 shows the elemental composition of the samples of solid residue extracted from the “dry” and “wet” cyclones (after drying) in experiments #9 and #10 with the PM of different moisture. The consumption of GA in these experiments was 1.82 g/s and 1.4 g/s, respectively, and the mass and moisture content of the feedstock were 1000 g ( 70%) and 450 g (15%), respectively. The elemental composition of the solid residue shows that the original wet PM undergoes deeper conversion than the dried PM, since, firstly, the carbon content in the solid residue of the gasified original wet PM is 30% versus 42% in the solid residue of the gasified dried PM; secondly, the ash mass after gasification of the original wet PM is 60% versus 47%; and, thirdly, the ash content calculated for dry matter in the case of the original wet PM is a factor of 3 lower than that of the dried PM (see Table 12). In terms of the carbon conversion efficiency (CCE), which is the ratio of the carbon in the off-gas to the carbon fed to the flow reactor with the PM and GA, CCE = 0.99 in experiment #9 and CCE = 0.67 in experiment #10. In the former case, the high value of CCE may be caused by gradual and layer-by-layer involvement of the original wet PM in the gasification process. In the latter case, the low value of CCE may be caused by the entrainment of large volumes of the dried PM in the shock-induced flow of the GA due to the elevated flowability and lighter particles of the dried PM, which can lead to the enhanced premature outflow of the particles from the flow reactor. Nevertheless, the lower heating value of the off-gas produced by gasification of dried PM appears to be larger than that of the wet PM (see Table 12). To eliminate these multidirectional effects, it is probably necessary to use a continuous feed of PM into the flow reactor rather than its batch loading.
Figure 13a compares mean mass fractions of the various elements in the original dried PM with those in solid residue extracted from the “dry” cyclone and solid residue extracted from the “wet” cyclone (after drying the condensate) in experiments ##2, 5, and 6. The mass fractions are measured using X-ray fluorescence on an ARL PERFORM’X spectrometer (Thermo Fisher Scientific Inc., USA). The typical (insignificant) differences in the corresponding mass fractions in different experiments are shown in Figure 13b in terms of the phosphorus contents. The elemental compositions of the dry solid residues in both cyclones are seen to be approximately the same. Keeping in mind that the mass of the solid residue in these experiments is a factor of 6–7 less than the dry mass of the PM batches undergoing gasification (see Table 12), one can see that the absolute contents of some elements in the solid residue are about the same as in the original feedstock, whereas the absolute contents of other elements in the solid residue are considerably lower than in the original feedstock. Thus, on the one hand, the relative contents of Ca, P, Al, and Mn in the dry PM are about 0.7, 0.5, 0.06, and 0.01 wt.%, respectively, whereas their relative contents in the solid residue are about 4, 3, 0.4, and 0.07 wt.%, i.e., a factor of 6–7 larger. On the other hand, the relative contents of Si, Mg, Na, and Cl in the dry PM are about 1.2, 0.4, 0.2, and 0.1 wt.%, respectively, whereas their relative contents in the solid residue are about 3.5, 1.2, 0.4, and 0.2 wt.%, i.e., only a factor of 2–3 larger. The relative content of S is about the same (0.3 wt.%) in both the original dry PM and in the solid residue. This could mean that the elements like Si, Mg, S, Na, and Cl partly escape from the cleaning system with the gas phase and/or leave the system with condensate. A considerable increase in the content of Fe and decrease in the content of V in the solid residue compared to their contents in the original PM are the issues for further research.
The oxidative stability of the solid residue was measured by synchronous thermal analysis (DSC+TGA) on an STA ZCT-1 device (JING YI GAO KE, China). Samples of the solid residue weighing 4.8 (sample #1) and 5.2 mg (sample #2) were placed in a ceramic crucible and heated in air from 50 to 950 °C at a heating rate of 10 °C/min. The thermokinetic curves shown in Figure 14 reveal one peak of mass drop with a value of 36.1% (Figure 14a) and 52.9% (Figure 14b). As can be seen from the derivative showing the degree of conversion, several processes of destruction of blocks or adjacent sections of macromolecules occur in the corresponding temperature ranges of 317–420 °C and 311–419 °C, including processes affecting the heat capacity of the samples. The shift in the initial section of such processes may be due to differences in the chemical composition of the studied samples.
3.9. Granulometric Analysis of the Solid Residue
Figure 15 compares the measured particle size distributions (PSDs) of solid residues extracted from the “dry” and “wet” cyclones in experiments ##3, 6, 7, 9, and 10 (see Table 12). The PSDs are measured by wet laser diffraction on an Analysette22 device (Fritsch, Germany) in the presence of a surfactant during ultrasonic treatment (50 W). The solid particles possess sizes ranging from 0.5 to 12 μm, and the PSDs are seen to be virtually independent of the experimental conditions.
3.10. Composition of the Liquid Condensate
It was expected that with the basic method of feedstock loading into the flow reactor (one-time batch loading through the upper hatch), when part of the time of the entire gasification process (period T1 in Figure 6) was allocated for moisture heating and evaporation, the processes of feedstock heating and its low-temperature conversion (pyrolysis) into various intermediate products, including toxic by-products of pyrolysis, occurred simultaneously. To verify this, a qualitative chromatograph-mass-spectrometric analysis of the liquid pyrolysis/gasification products of the PM, extracted after the experiment from the "wet" cyclone, was carried out. The condensate was analyzed using a set of devices including a Trace-1310 gas chromatograph and an ISQ mass-spectrometric detector. Separation was carried out on a TR-5MS quartz capillary column 15 m long and 0.32 mm internal diameter with a stationary phase of 5% phenyl – 95% methylpolysiloxane, film thickness 0.25 μm. The column temperature was increased from 40 °C (3 min) to 120 °C at a rate of 5 °C/min, then to 300 °C at a rate of 15 °C/min, and then kept at a constant final temperature for 5 min. The injector temperature was 220 °C. The injected sample volume was 1 μL (the mode with flow division at a ratio of 1:40 was used). The mass spectra were recorded using electron impact ionization with an energy of 70 eV and a scanning range of 35-600 amu. The scanning rate was 0.3 scan/s.
Extraction of the components was performed by adding 4 mL of diethyl ether to 4 mL of the sample. The solvent and sample were well mixed by shaking for 10 min. After separation of the organic solvent – sample layers, the extract formed on top was separated and filtered through a layer of anhydrous sodium sulfate on a paper filter. The extraction was repeated twice using a fresh portion of the solvent. The combined extracts were concentrated on a rotary evaporator in vacuum at room temperature to a volume of 1–2 mL.
Derivatization was carried out by silylation using the silylating agent N,O-bis(trimethylsilyl)-trifluoroacetamide (BSTFA). First, 200 μL of concentrated diethyl ether extract were dried to dryness at 50 °C, then 20 μL of BSTFA were added to the dried sample and silylated at 50 °C for 15 min, and then 200 μL of hexane were added and analyzed by GC-MS according to the method described above.
Figure 16 shows the total ion current chromatograms of (a) a diethyl ether extract and (b) a hexane extract of trimethylsilyl derivatives of CH pyrolysis/gasification products.
The following pyrolysis/gasification products were identified in the sample (Figure 16a):
- Main compounds (the most intense peaks on the chromatogram): phenol (emission time 7.49 min) and coniferyl alcohol (23.17 min);
- Major compounds: toluene (1.77 min), propionic acid (1.96 min), furaldehyde (2.99 min), furfuryl alcohol (3.80 min), dimethylbenzene isomer (4.29 min), methyl phenol isomers (9.46 min and 10.14 min), dihydroxy benzene isomer (13.95 min), coumaran (14.23 min), syringol (17.58 min), vanillin (18.77 min), acetovanillone (20.46 min), syringyl aldehyde (22.48 min), dihydroxymethylguaiacol (22.58 min);
- Minor compounds: ethylphenol isomers (12.71 min and 12.78 min), methylguaiacol (13.20 min), hydroxybenzaldehyde isomer (18.29 min), acetosyringol (23.12 min).
Compounds characteristic of lignin pyrolysis products were identified in the PM pyrolysis/gasification products: methylguaiacol, syringol, acetovanillone, vanillin, and others. It can be assumed that the PM pyrolysis/gasification products also contain other compounds typical of lignin pyrolysis products: various acids and alcohols, which were not detected because the stationary phase of the TR-5MS capillary column used in GC-MS analysis was weakly polar and was not suitable for analyzing such highly polar compounds as alcohols and acids, especially linear and low-molecular ones.
After derivatization, the following products were identified as trimethylsilyl ethers (Figure 16b):
- Acids: C5 oxyacid with a molecular weight of 116 (2.15 min), propionic acid (2.34 min), methylpropionic acid (3.04 min), butanoic acid (4.33 min), methylbutanoic acid isomers (4.76 min and 5.71 min), valeric acid (7.08 min), C6 acid with a molecular weight of 116 (7.83 min), caproic acid (9.92 min), benzoic acid (14.71 min), hydrocinnamic acid (19.17 min);
- Furan derivatives: furfuryl alcohol (7.62 min), coumaran (14.18 min). Phenols: phenol (9.16 min), methylphenol isomer (11.39 min, 11.75 min and 12.03 min), dihydroxybenzene monoester isomer (13.44 min), guaiacol (14.22 min), ethylphenol isomer (14.49 min), dihydroxybenzene diester isomer (16.70 min), hydroxybenzaldehyde (18.00 min), dimethoxyphenol (18.88 min), hydroxyacetophenone (20.16 min), vanillin (21.11 min);
- Alcohols: benzyl alcohol (12.14 min).
Analysis and identification of silyl derivatives also showed that the pyrolysis/gasification products of PM are similar to the pyrolysis products of lignin.
Thus, to avoid the formation of toxic pyrolysis/gasification products in the resulting condensate, the feedstock must be fed into the preheated reactor continuously. For the given values of the GA flow rate and average gas residence time in the reactor, the feedstock flow rate must ensure complete conversion of all carbon contained therein.
4. Discussion
When comparing the measurement results with the results of thermodynamic calculations, it is necessary to take several factors into account that can significantly affect the comparison. Firstly, the feedstock moisture in the experiments was 15%–70%, while the moisture was taken zero (0) in the calculations. Secondly, no special measures were taken to reduce heat losses during setup operation in the experiments, while the operation process was considered adiabatic in the calculations. Thirdly, the measured detonation velocity in the PDG was lower than its thermodynamic value (the real detonation velocity was 2100±100 m/s instead of 2380 m/s), which affected the temperature and composition of the detonation products expanded to a pressure of 0.1 MPa. Fourthly, the elemental composition of the real dried PM differed from the elemental composition of the model PM used in the calculations due to the presence of a bedding material rich in cellulose in the real PM. Finally, mixing of the GA with a batch of condensed-phase feedstock in the experiments takes a finite time, required for feedstock heating and thermal decomposition, and is characterized by spatial nonuniformity, whereas their instantaneous and uniform mixing at the molecular level (in the gas phase) is assumed in the calculations.
Let us estimate the effect of feedstock moisture and heat losses (the first two of the five listed factors) on the thermal efficiency of the PM gasification process using experiments #9 and #13 in Table 12 as examples. On the one hand, in experiment #9, 1.84 MJ are required to heat and evaporate the water contained in 1 kg of feedstock with a moisture of 70%. On the other hand, in experiment #9, when the PDG was operating at a frequency of 0.63 Hz, 114 g of NG were consumed during the first stage of the gasification process (heating and evaporation of water) lasted T1 = 380 s, which corresponds to 5.7 MJ, that is a factor of ~3 more than was required for the first stage. This is explained by energy losses on heating the reactor walls and cooling jackets. In a similar experiment #13, 72 g of NG were consumed for heating and evaporating the water contained in 1 kg of the feedstock with a moisture of 45% (450 g or 1.185 MJ) during the first stage of the gasification process lasted T1 = 260 s, which corresponds to 3.57 MJ, which is also a factor of ~3 more than required for the first stage. Thus, in both experiments, the relative energy losses to the environment at the first stage of the gasification process were about 67% regardless of the feedstock moisture (70% or 45%). It is reasonable to assume that approximately the same heat losses are characteristic of dry PM gasification. Consequently, only 33% of the thermal energy of the GA was consumed for the gasification of dry PM (its phase and chemical transformations) in the flow reactor, while the remaining 67% of the thermal energy of the GA was spent on heating the reactor walls, the coolant of the PDG cooling systems, and the produced off-gas. If one takes the real thermal efficiency of the gasification process (about 33%) into account, then a theoretical estimate for the optimal dry PM/GA mass ratio of 3.4 gives for the real value 0,33 1. This is the value of that was obtained by extrapolating the experimental values of at 70% ( 1.52) and 45% ( 1.35) to 0 (see Section 3.6 “Mass balances”).
Compared with the influence of the first two factors, the influence of the third of the named factors – the reduced detonation velocity in the experiments – can apparently be considered relatively weak, as a decrease in the detonation velocity by 12% will lead to a decrease in the GA temperature by less than 20%, i.e., the temperature will decrease from the ideal value of 2853 K (2580 °C) to ~2280 K (~2000 °C) and still will be very high.
Let us consider the influence of the fourth of the mentioned factors, that is the difference in the compositions of the real dry PM and the model PM used in the thermodynamic calculations. Despite the differences in the elemental compositions of the real and model feedstock, the lower heating value of the real wet PM (5.8 MJ/kg) turned out to be close in value to the model feedstock of the same moisture (5.76 MJ/kg). Considering that the yields of the main components of the produced dry off-gas depend weakly on the feedstock type (see Section 3.3), it can be assumed that the differences in the compositions of the real and model feedstock have little effect on the obtained results.
Finally, let us consider the possible influence of the fifth of the above factors, that is the finite time and spatial nonuniformity of mixing of the GA with the PM. Table 16 compares the calculated (equilibrium) and measured compositions of the dry off-gas at a gasification temperature of 1000 K and a gasification pressure of 0.1 MPa. For the sake of comparison, the last line shows the mole fractions of CO2, CO, and H2 in the expanded detonation products (GA) leaving the flow reactor in the absence of feedstock supply (steam is assumed to be condensed).
Comparison of the measured concentrations of CO2, CO, and H2 in the produced dry off-gas with their values in the GA clearly indicates that reactions of CO and H2 formation do occur in the flow reactor, since the volume fractions of these components in the GA were close to zero. The calculation generally correctly predicts the CO content in the produced dry off-gas. However, the CO2 content in the experiment is a factor of 2–3 higher, and the H2 content is a factor of 2–3 lower than predicted by the calculation. The components CO and H2 are formed in reactions:
where C is the carbon contained in the PM. On the one hand, the endothermic effect of reaction (II) is greater than that of reaction (I), and the H2O content in the GA is a factor of 2 greater than that of CO2 (see Table 8). Therefore, the rate of reaction (II) may be significantly lower than that of reaction (I), especially at relatively low GA temperatures caused by the first two factors mentioned above, namely, heat losses on moisture evaporation and into the environment. In other words, the CO2 entering the reactor as part of the GA (about 33 vol.%) may not react with the feedstock and exit the reactor together with the produced off-gas. This factor may explain the increased CO2 content in the produced off-gas at the final equilibrium temperature of 1000 K. The reduced hydrogen yield in the experiment may be associated with a significant nonuniformity in the heterogeneous reaction (I) in the reactor. Therefore, in order for the composition of the produced off-gas to approach the calculated thermodynamic composition, it is necessary to improve mixing of feedstock and GA and increase the average temperature in the reactor.
C + H2O = CO + H2
C + CO2 = CO + CO
CO + H2O = CO2 + H2
Thus, the analysis shows that the experimental results are in reasonable agreement with the results of thermodynamic calculations, if one takes into account the heat losses for heating the reactor walls, the coolant of the PDG cooling system, and the produced off-gas. The experimental PM/GA mass ratio of 1 can be considered reliable, i.e. 1 kg of GA is required for the gasification of 1 kg of dry PM, and as a result of gasification, 1.91 kg of combustible off-gas is obtained (taking into account the ash content of dry PM approximately equal to 9%).
5. Conclusions
Experimental studies on the gasification of the original (moisture 70%) and dried pig manure with moisture 45% and 15% are conducted in the laboratory setup that implements the new method of allothermal high-temperature gasification of organic wastes. The following key results are obtained:
- (1)
- typical composition of the dry off-gas produced by gasification of the original wet ( 70%) PM is: 33–41 vol.% CO2, 34–40 vol.% CO, 17–22 vol.% H2, 2.5–4.0 vol.% CH4, and 0–2.5 vol.% CxHy. There are no hydrocarbons higher than propane, including condensable gases and tars, in the dry off-gas. The reduction of feedstock moisture allows increasing the yields of CO, H2, and CH4 to 45%, 25% and 5%, respectively, and decreasing the yield of CO2 to 25%, i.e., the produced dry off-gas can contain up to 75% combustible gas. The CCE of the original wet PM is 99%, whereas the CCE of the dried PM is 67% due to the enhanced premature outflow of feedstock particles from the flow reactor. The particles of solid residue extracted from the cyclones have sizes ranging from 0.5 to 12 μm, and the particle size distributions are virtually independent of the experimental conditions. The absolute contents of some elements (Ca, P, Al, and Mn) in the solid residue are about the same as in the original PM, whereas the absolute contents of other elements (Si, Mg, S, Na, and Cl) in the solid residue are considerably lower than in the original PM, indicating that the latter elements partly escape from the cleaning system with the gas phase and/or leave the system with condensate.
- (2)
- The experimental results are in reasonable agreement with the results of thermodynamic calculations, if one takes into account the heat losses for heating the reactor walls, the coolant of the PDG cooling system, and the produced off-gas.
- (3)
- In the existing version of the experimental setup, about 67% of the thermal energy of high-temperature detonation products is spent on heating the reactor walls, the coolant of the PDG cooling system, and the produced off-gas, and only 33% is spent on the PM gasification process. To increase the energy efficiency of the gasification process, it is necessary to thermally insulate the setup and provide heat recovery. To increase the yield of the combustible off-gas, it is necessary to provide a controlled continuous supply of PM by a feeder and improve mixing of PM and GA. To increase the carbon conversion efficiency, it is necessary to take special measures for preventing the premature entrainment of PM by increasing the residence time of feedstock particles in the flow reactor.
- (4)
- The optimal measured value of the dry PM/GA mass ratio for the existing version of the experimental setup is 1: for the gasification of 1 kg of dry PM, 1 kg of stoichiometric NG-oxygen mixture is required, and as a result of gasification, 1.91 kg of combustible off-gas diluted with 25–30 vol.% carbon dioxide is produced.
- (5)
- The composition of the dry off-gas produced by gasification of PM, coffee grounds, and sawdust with close values of moisture is approximately the same. Consequently, it can be expected that the gasification method under study allows processing various types of feedstocks without stopping the line and switching to other settings.
- (6)
- To avoid the formation of toxic pyrolysis/gasification products in the produced condensate, the PM must be fed continuously into the preheated reactor. For the given values of the GA flow rate and average residence time in the flow reactor, the rate of PM supply must ensure complete conversion of carbon contained in the feedstock. This will be the objective of future research.
Author Contributions
Conceptualization, S.M.F.; methodology, S.M.F. and V.A.S.; software, K.A.A.; formal analysis, S.M.F., V.A.S., I.A.S., and A.S.S.; investigation, V.A.S., I.A.S., A.S.S., R.A.A., A.B.V., A.V.I., Ya.O.I., E.V.K., Yu.A.G., N.D.B., T.V.D.; resources, S.M.F. and V.Ya.P.; data curation, F.S.F. and A.S.S.; writing—original draft preparation, S.M.F. and V.A.S.; writing—review and editing, S.M.F.; supervision, S.M.F.; project administration, S.M.F. and V.Ya.P.; funding acquisition, S.M.F. All authors have read and agreed to the published version of the manuscript.
Funding
This research received no external funding.
Institutional Review Board Statement
Not applicable.
Informed Consent Statement
Not applicable.
Data Availability Statement
The data will be available on request.
Conflicts of Interest
The authors declare no conflicts of interest.
Abbreviations
The following abbreviations are used in this manuscript:
| CCE | Carbon conversion efficiency |
| CJ | Chapman – Jouguet |
| GA | Gasifying agent |
| IP | Ionization probe |
| IR | Infra-red |
| MID | mixing and ignition device |
| NG | Natural gas |
| PDG | Pulsed detonation gun |
| PM | Pig manure |
| PSD | particle size distribution |
References
- Merzlaya, G.E.; Shchegoleva, I.V.; Leonov, M.V. Use of pig manure for fertilizing agricultural crops. Prosp. Pig Breeding: Theory Pract. 2012, 6, 3–9. [Google Scholar]
- Kapustin, V.P.; Uimenov, A.V. Recycling of livestock and poultry waste. Iss. Mod. Sci. Pract. Vernadsky Univ. 2007, 2, 23–26. [Google Scholar]
- Shalavina, E.V.; Bryukhanov, A.Yu.; Vasiliev, E.V.; Uvarov, R.A.; Valge, A.M. Biofermentation of organic waste from a pig-breeding complex in a drum-type installation. Agricult. Sci. 2020, 339, 51–56. [Google Scholar]
- Bernal, M.P.; Alburquerque, J.A.; Moral, R. Composting of animal manures and chemical criteria for compost maturity assessment. A review. Bioresour. Technol. 2009, 100, 5444–5453. [Google Scholar] [CrossRef] [PubMed]
- Shubin, A.S.; Syrchina, N.V. Processing of fresh pig manure into organomineral fertilizers. Quest. Sci. 2017, 22–26. [Google Scholar]
- Li, S.; Zou, D.; Li, L.; Wu, L.; Liu, F.; Zeng, X.; Wang, H.; Zhu, Y.; Xiao, Z. Evolution of heavy metals during thermal treatment of manure: a critical review and outlooks. Chemosphere 2020, 247, 125962. [Google Scholar] [CrossRef]
- Gaifullin, I.Kh.; Ziganshin, B.G.; Shornikov, A.V.; Ivanov, B.L.; Zinnatullina, A.N. Theoretical aspects of the process of biogas production during anaerobic fermentation of organic waste. Eng. Techn. Animal Husbandry 2024, 14, 90–95. [Google Scholar]
- Liang, Y. A critical review of challenges faced by converting food waste to bioenergy through anaerobic digestion and hydrothermal liquefaction. Waste Biomass Valoriz. 2021, 1–16. [Google Scholar] [CrossRef]
- Du, M.; Liu, S.; Sun, J.; Jin, H.; Chen, Y.; Guo, L. Clean conversion of pig manure via supercritical water gasification: Hydrogen-enriched syngas generation, mechanisms analysis, and environmental impacts. J. Clean. Prod. 2023, 420, 138455. [Google Scholar] [CrossRef]
- Babaei, K.; Bozorg, A.; Tavasoli, A. Hydrogen-rich gas production through supercritical water gasification of chicken manure over activated carbon/ceria-based nickel catalysts. J. Anal. Appl. Pyrol. 2021, 159, 105318. [Google Scholar] [CrossRef]
- Moeller, H.B.; Jensen, H.S.; Tobiasen, L.; Hansen, M.N. Heavy metal and phosphorus content of fractions from manure treatment and incineration. Environm. Techn. 2007, 28, 1403–1418. [Google Scholar] [CrossRef] [PubMed]
- Gebreegziabher, T.; Oyedun, A.; Yu, Z.; Maojian, W.; Yi, Z.; Jin, L.; Hui, C. Biomass drying for an integrated power plant: effective utilization of waste heat. Comput. Aided Chem. Eng. 2014, 33, 1555–1560. [Google Scholar]
- Ro, K.; Libra, J.; Bae, S.; Berge, N.; Flora, J.; Pecenka, R. Combustion behavior of animal-manure-based hydrochar and pyrochar. ACS Sustain. Chem. Eng. 2019, 7, 470–478. [Google Scholar] [CrossRef]
- Szulc, W.; Rutkowska, B.; Gawroński, S.; Wszelaczyńska, E. Possibilities of using organic waste after biological and physical processing—an overview. Processes 2021, 9, 1501. [Google Scholar] [CrossRef]
- Kumar, A.; Jones, D.; Hanna, M. Thermochemical biomass gasification: a review of the current status of the technology. Energies 2009, 2, 556–581. [Google Scholar] [CrossRef]
- Islam, M.N.; Park, J.H. A short review on hydrothermal liquefaction of livestock manure and a chance for Korea to advance swine manure to bio-oil technology. J. Mater. Cycles Waste Manag. 2018, 20, 1–9. [Google Scholar] [CrossRef]
- Zhou, S.; Liang, H.; Han, L.; Huang, G.; Yang, Z. The influence of manure feedstock, slow pyrolysis, and hydrothermal temperature on manure thermochemical and combustion properties. Waste Manag. 2019, 88, 85–95. [Google Scholar] [CrossRef]
- Spiridonova, A.V.; Druzyanova, V.P.; Osmonov, O.M.; Tarabukina, O.K.; Sivtseva, Zh.G. Pyrolysis technology is a promising method for utilizing solid dried manure. Far East. Agrar. Bull. 2022, 1, 143–150. [Google Scholar] [CrossRef]
- Su, G.; Ong, H.C.; Mohd Zulkifli, N.W. Valorization of animal manure via pyrolysis for bioenergy: a review. J. Clean Prod. 2022, 343, 130965. [Google Scholar] [CrossRef]
- McKendry, P. Energy production from biomass (part 3): gasification technologies. Bioresour. Technol. 2022, 83, 55–63. [Google Scholar] [CrossRef]
- Basu, P. Biomass Gasification and Pyrolysis: Practical Design and Theory. Academic Press, New York, 2010.
- Lombardi, L.; Carnevale, E.; Corti, A. A review of technologies and performances of thermal treatment systems for energy recovery from waste. Waste Manag. 2015, 37, 26–44. [Google Scholar] [CrossRef] [PubMed]
- Zhang, S.; Huang, F.; Morishita, K.; Takarada, T. Hydrogen production from manure by low temperature gasification. 2009 Asia-Pacific Power and Energy Engineering Conference 2009. [CrossRef]
- Vamvuka, D.; Sfakiotakis, S.; Pantelaki, O. Evaluation of gaseous and solid products from the pyrolysis of waste biomass blends for energetic and environmental applications. Fuel 2019, 236, 574–582. [Google Scholar] [CrossRef]
- Sharara, M.A.; Sadaka, S.S. Opportunities and barriers to bioenergy conversion techniques and their potential implementation on swine manure. Energies 2018, 11, 957. [Google Scholar] [CrossRef]
- Zhang, X.; Mao, X.; Pi, L.; Wu, T.; Hu, Y. Adsorptive and capacitive properties of the activated carbons derived from pig manure residues. J. Environ. Chem. Eng. 2019, 7, 103066. [Google Scholar] [CrossRef]
- Park, M.H.; Kumar, S.; Ra, C. Solid waste from swine wastewater as a fuel source for heat production. Asian-Aust. J. Anim. Sci. 2012, 25, 1627–1633. [Google Scholar] [CrossRef]
- Wu, H.; Hanna, M.A.; Jones, D.D. Life cycle assessment of greenhouse gas emissions of feedlot manure management practices: Land application versus gasification. Biomass Bioenergy 2013, 54, 260–266. [Google Scholar] [CrossRef]
- Mohan, D.; Pittman, C.U.; Steele, P.H. Pyrolysis of wood/biomass for bio-oil: A critical review. Energy Fuels 2006, 20, 848–889. [Google Scholar] [CrossRef]
- He, B.J.; Zhang, Y.; Yin, Y.; Funk, T.L.; Riskowski, G. Preliminary characterization of raw oil products from the thermochemical conversion of swine manure. Trans. ASAE 2001, 44, 1865–1871. [Google Scholar]
- Mullen, C.A.; Boateng, A.A. Chemical composition of bio-oils produced by fast pyrolysis of two energy crops. Energy Fuels 2008, 22, 2104–2109. [Google Scholar] [CrossRef]
- Azuara, M.; Kersten, S.R.; Kootstra, A.M.J. Recycling phosphorus by fast pyrolysis of pig manure: concentration and extraction of phosphorus combined with the formation of value-added pyrolysis products. Biomass Bioenergy 2013, 49, 171–180. [Google Scholar] [CrossRef]
- Cao, J.; Xiao, X.; Zhang, S.; Zhao, X.; Sato, K.; Ogawa, Y.; Wei, X.Y.; Takarada, T. Preparation and characterization of bio-oils from internally circulating fluidized-bed pyrolyses of municipal, livestock, and wood waste. Bioresour. Technol. 2011, 102, 2009–2015. [Google Scholar] [CrossRef] [PubMed]
- Elliott, D.C. Historical developments in hydroprocessing bio-oils. Energy Fuels 2007, 21, 1792–1815. [Google Scholar] [CrossRef]
- Cantrell, K.B.; Hunt, P.G.; Uchimiya, M.; Novak, J.M.; Ro, K.S. Impact of pyrolysis temperature and manure source on physicochemical characteristics of biochar. Bioresour. Technol. 2012, 107, 419–428. [Google Scholar] [CrossRef]
- Takanabe, K.; Aika, K.; Seshan, K.; Lefferts, L. Sustainable hydrogen from bio-oil—Steam reforming of acetic acid as a model oxygenate. J. Catal. 2004, 227, 101–108. [Google Scholar] [CrossRef]
- Burra, K.G.; Hussein, M.S.; Amano, R.S.; Gupta, A.K. Syngas evolutionary behavior during chicken manure pyrolysis and air gasification. Appl. Energy 2016, 181, 408–415. [Google Scholar] [CrossRef]
- Lombardi, L.; Carnevale, E.; Corti, A. A review of technologies and performances of thermal treatment systems for energy recovery from waste. Waste Manag. 2015, 37, 26–44. [Google Scholar] [CrossRef] [PubMed]
- Maric, J.; Berdugo Vilches, T.; Pissot, S.; Cañete Vela, I.; Gyllenhammar, M.; Seemann, M. Emissions of dioxins and furans during steam gasification of Automotive Shredder residue; experiences from the Chalmers 2–4-MW indirect gasifier. Waste Manag. 2020, 102, 114–121. [Google Scholar] [CrossRef]
- Messerle, V.E.; Ustimenko, A.B.; Lavrichshev, O.A.; Nugman, M.K. The gasification and pyrolysis of biomass using a plasma system. Energies 2024, 17, 5594. [Google Scholar] [CrossRef]
- Rosyadi, I.; Suyitno, S.; Ilyas, A.X.; Faishal, A.; Budiono, A.; Yusuf, M. Producing hydrogen-rich syngas via microwave heating and co-gasification: a systematic review. Biofuel Res. J. 2022, 33, 1573–1591. [Google Scholar] [CrossRef]
- Frolov, S.M.; Smetanyuk, V.A.; Avdeev, K.A.; Nabatnikov, S.A. Method for obtaining highly overheated steam and detonation steam generator device (options). Patent of Russian Federation No. 2686138 dated 24.04.2019.
- Frolov, S.M.; Silantiev, A.S.; Sadykov, I.A.; Smetanyuk, V.A.; Frolov, F.S.; Hasiak, J.K.; Dudareva, T.V.; Bekeshev, V.G.; Grishin, M.V.; Golubev, E.K.; Baimukhambetova, D.; Popkova, V.Y.; Vezentsev, A.I.; Razdobarin, A.E.; Yapryntsev, M.N.; Sokolovskiy, P.V. Composition and textural characteristics of char powders produced by thermomechanical processing of sunflower seed husks. Powders 2023, 2, 624–638. [Google Scholar] [CrossRef]
- Frolov, S.M.; Silantiev, A.S.; Sadykov, I.A.; Smetanyuk, V.A.; Frolov, F.S.; Hasiak, J.K.; Vorob’ev, A.B.; Inozemtsev, A.V.; Inozemtsev, J.O. Gasification of waste machine oil by the ultra-superheated mixture of steam and carbon dioxide. Waste 2023, 1, 515–531. [Google Scholar] [CrossRef]
- Frolov, S.M. Organic waste gasification by ultra-superheated steam. Energies 2023, 16, 219. [Google Scholar] [CrossRef]
- Frolov, S.M.; Smetanyuk, V.A.; Sadykov, I.A.; Silantiev, A.S.; Frolov, F.S.; Popkova, V.Y.; Hasiak, J.K.; Buyanovskaya, A.G.; Takazova, R.U.; Dudareva, T.V.; Bekeshev, V.G.; Vorobyov, A.B.; Inozemtsev, A.V.; Inozemtsev, J.O. High-temperature steam- and CO2-assisted gasification of oil sludge and petcoke. Clean Technologies 2025, 7, 17. [Google Scholar] [CrossRef]
- Gubin, A.V.; Larionov, K.B.; Gerasimov, R.D.; Pak, A.Ya. Obtaining char from coffee cake as a feedstock for the synthesis of silicon carbide. Int. J. Appl. Fund. Res. 2022, 12, 75–81. [Google Scholar]
- Zaychenko, V.M.; Lavrenov, V.A.; Faleeva, Yu.M. Study of slow pyrolysis of lignin, hemicellulose, cellulose and the effect of their interaction in plant biomass. Chem. Solid Fuels 2023, 6, 66–74. [Google Scholar] [CrossRef]
- SDToolBox – Numerical tools for shock and detonation wave modeling. https://shepherd.caltechedu/SDT (accessed on March 13, 2025).
- Goodwin, D.G.; Moffat, H.K.; Schoegl, I.; Speth, R.L.; Weber, B.W. Cantera: An object-oriented software toolkit for chemical kinetics, thermodynamics, and transport processes. https://www.cantera.org, 2023. Version 3.0.0. (accessed on March 13, 2025). [CrossRef]
- Eskov, A.I.; Novikov, M.N.; Lukin, S.M. Reference book on the production and use of organic fertilizers. Publ. House Russ. Acad. Agricul. Sci., Moscow, 2001, 495 p. https://eco-profi.info/index.php/othod/sostav/15-1310040203013.html.
- Shigabaeva, G.N. Elemental composition and content of functional groups of humic substances of soils and peats of different origin. Bull. Tyumen State Univ., Ecology 2014, 12, 45–53. [Google Scholar]
- Avdeev, K.A.; Silantiev, A.S.; Smetanyuk, V.A.; Piletsky, V.G.; Frolov, F.S.; Frolov, S.M. Conditions for self-feeding of pulsed detonation guns with energy gas during gasification of brown coals by detonation products. Gorenie Vzryv 2024, 17, 95–104. [Google Scholar] [CrossRef]
Figure 1.
Photographs of the PM: (a) original feedstock, (b) and (c) feedstock dried on a hot surface.
Figure 1.
Photographs of the PM: (a) original feedstock, (b) and (c) feedstock dried on a hot surface.
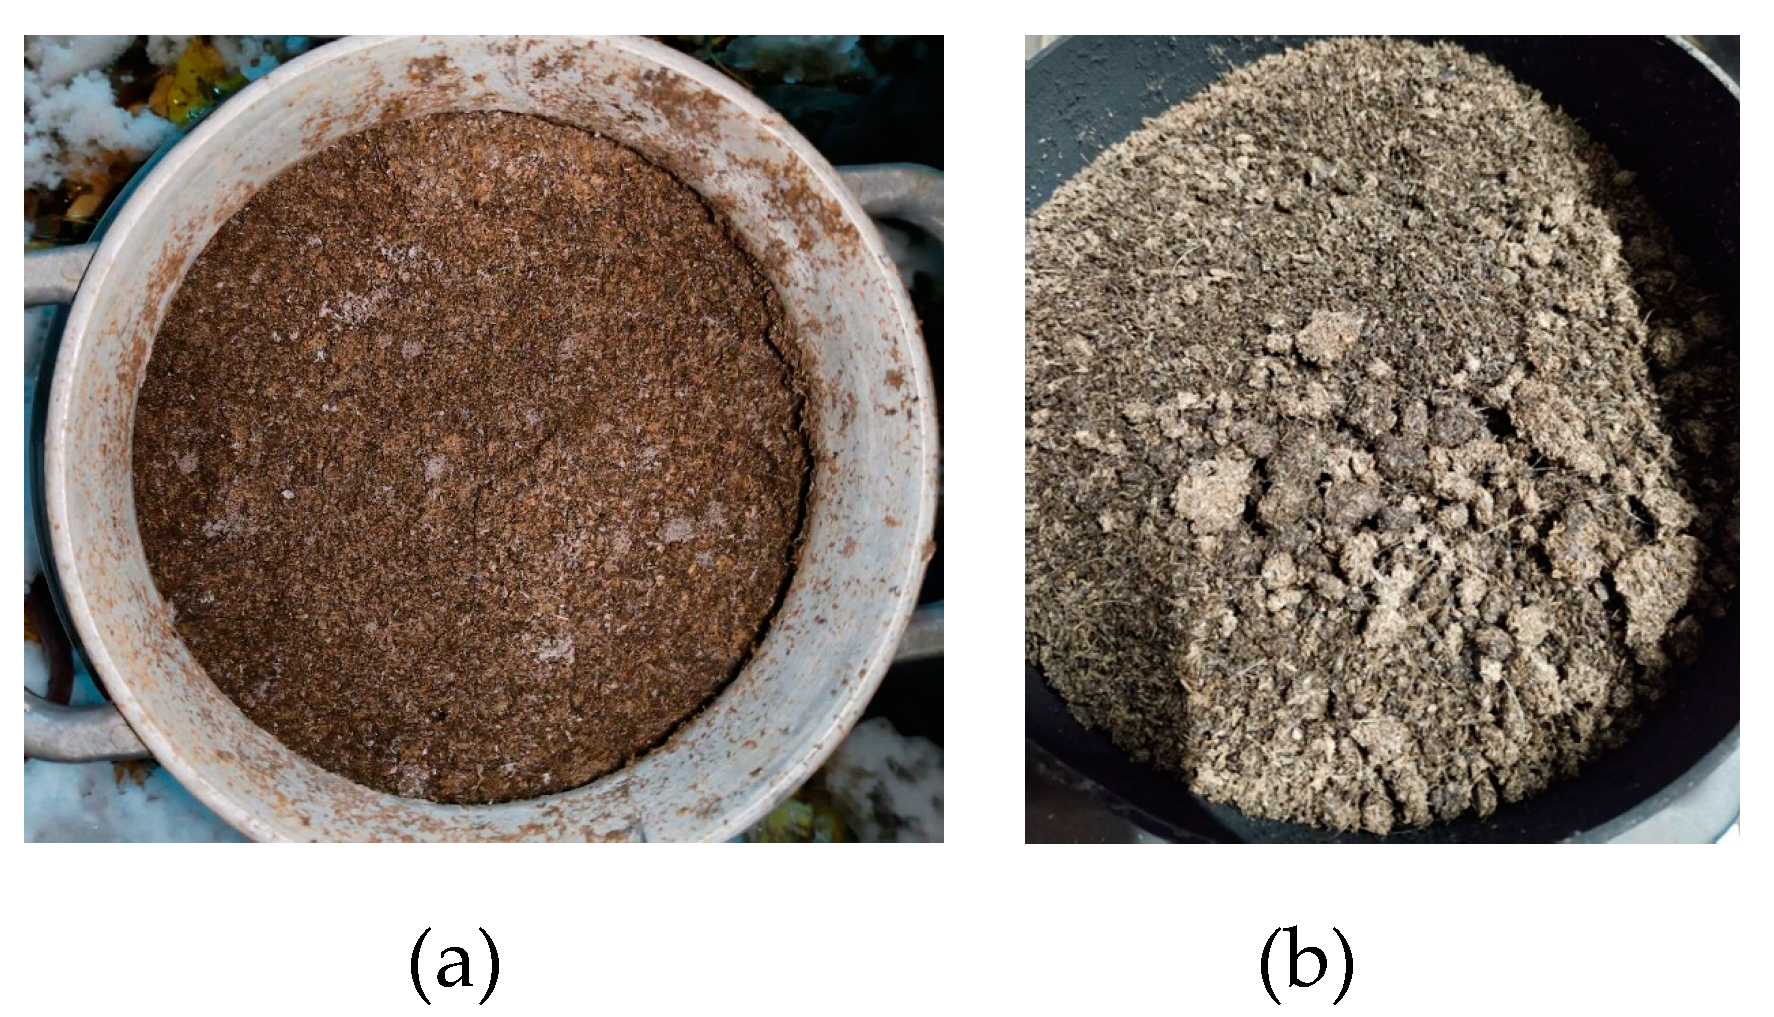
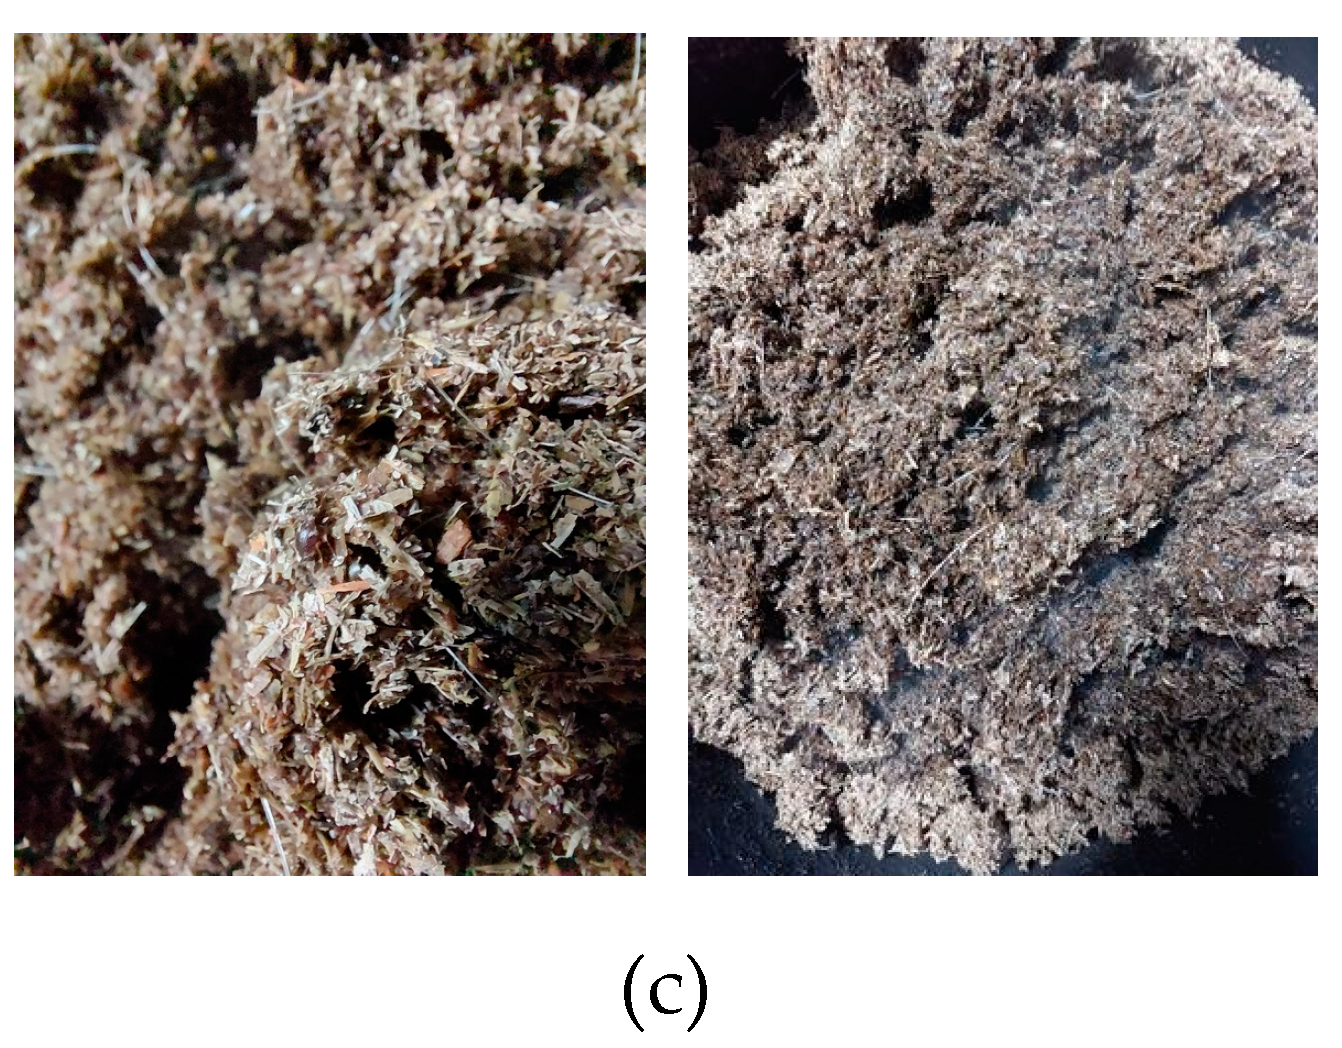
Figure 2.
IR spectra of cellulose (a) and two samples of the original PM: sample #1 (b) and sample #2 (c).
Figure 2.
IR spectra of cellulose (a) and two samples of the original PM: sample #1 (b) and sample #2 (c).
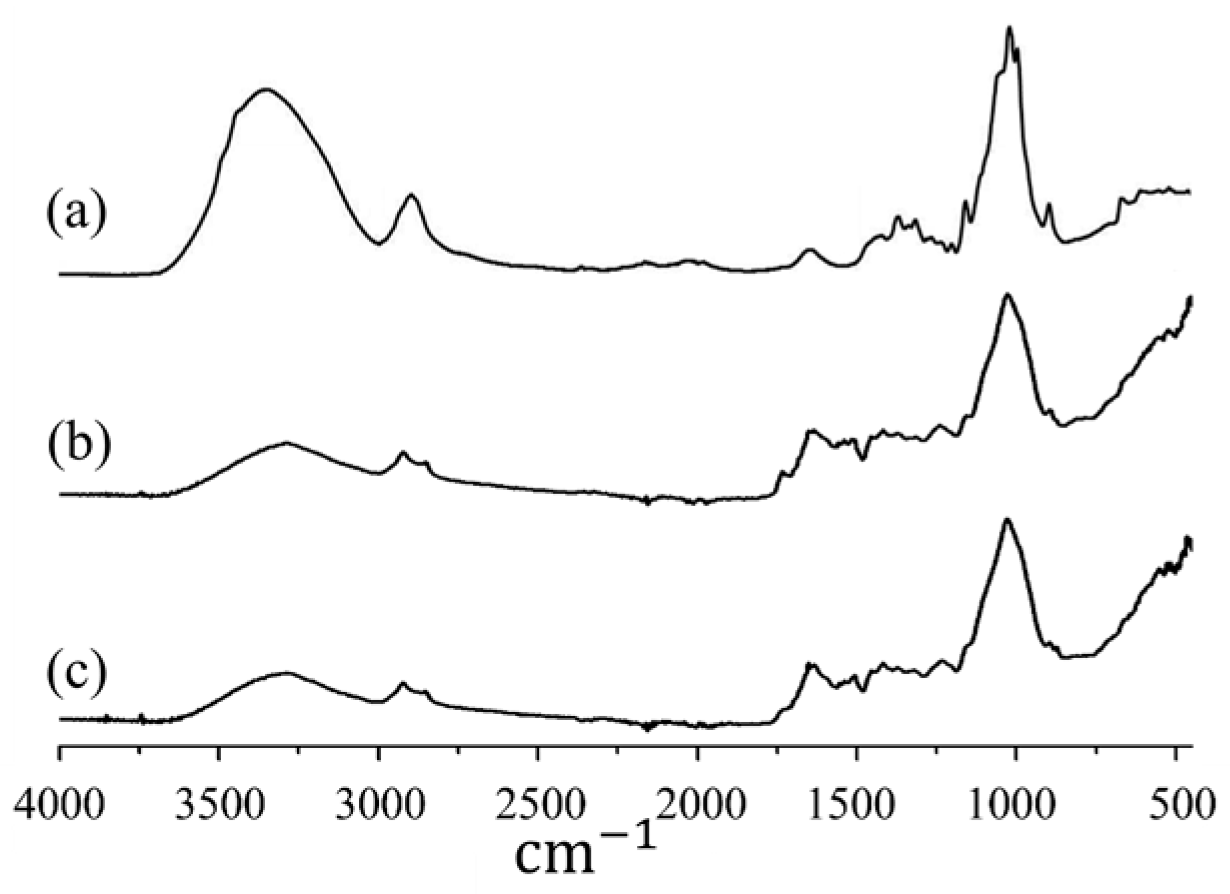
Figure 3.
Mass fractions of elements in the PM.
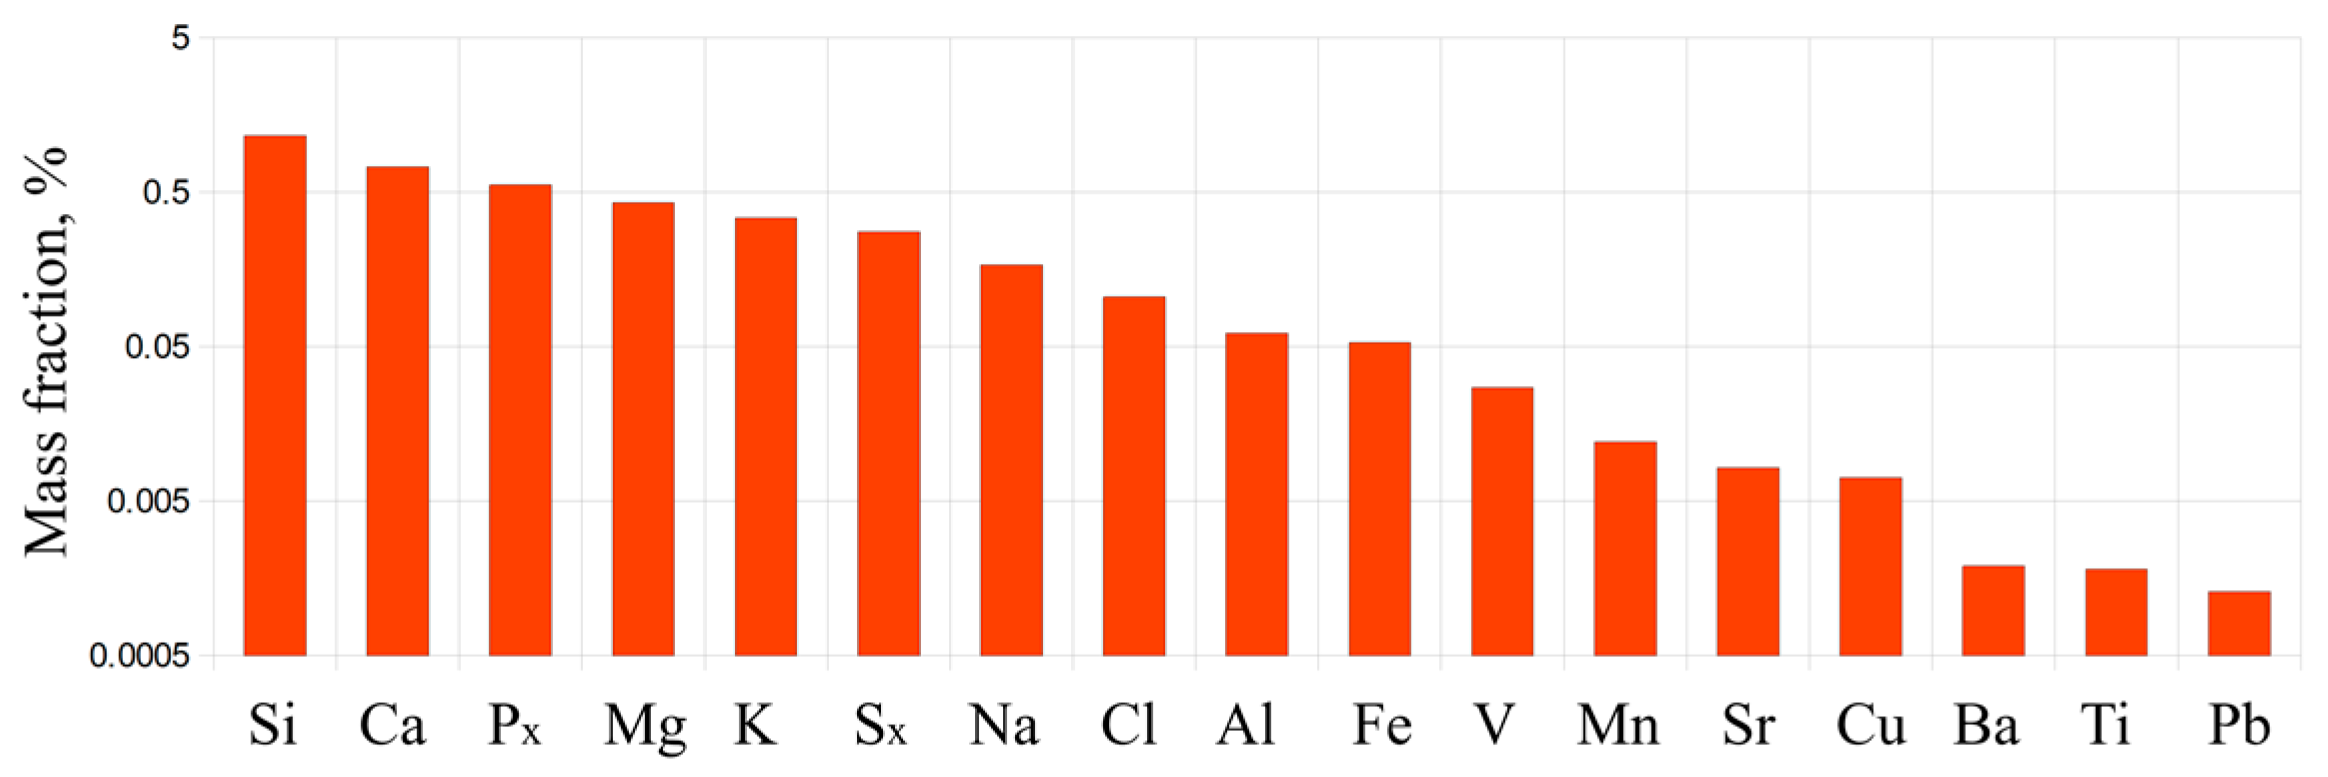
Figure 4.
Schematic of the experimental setup.
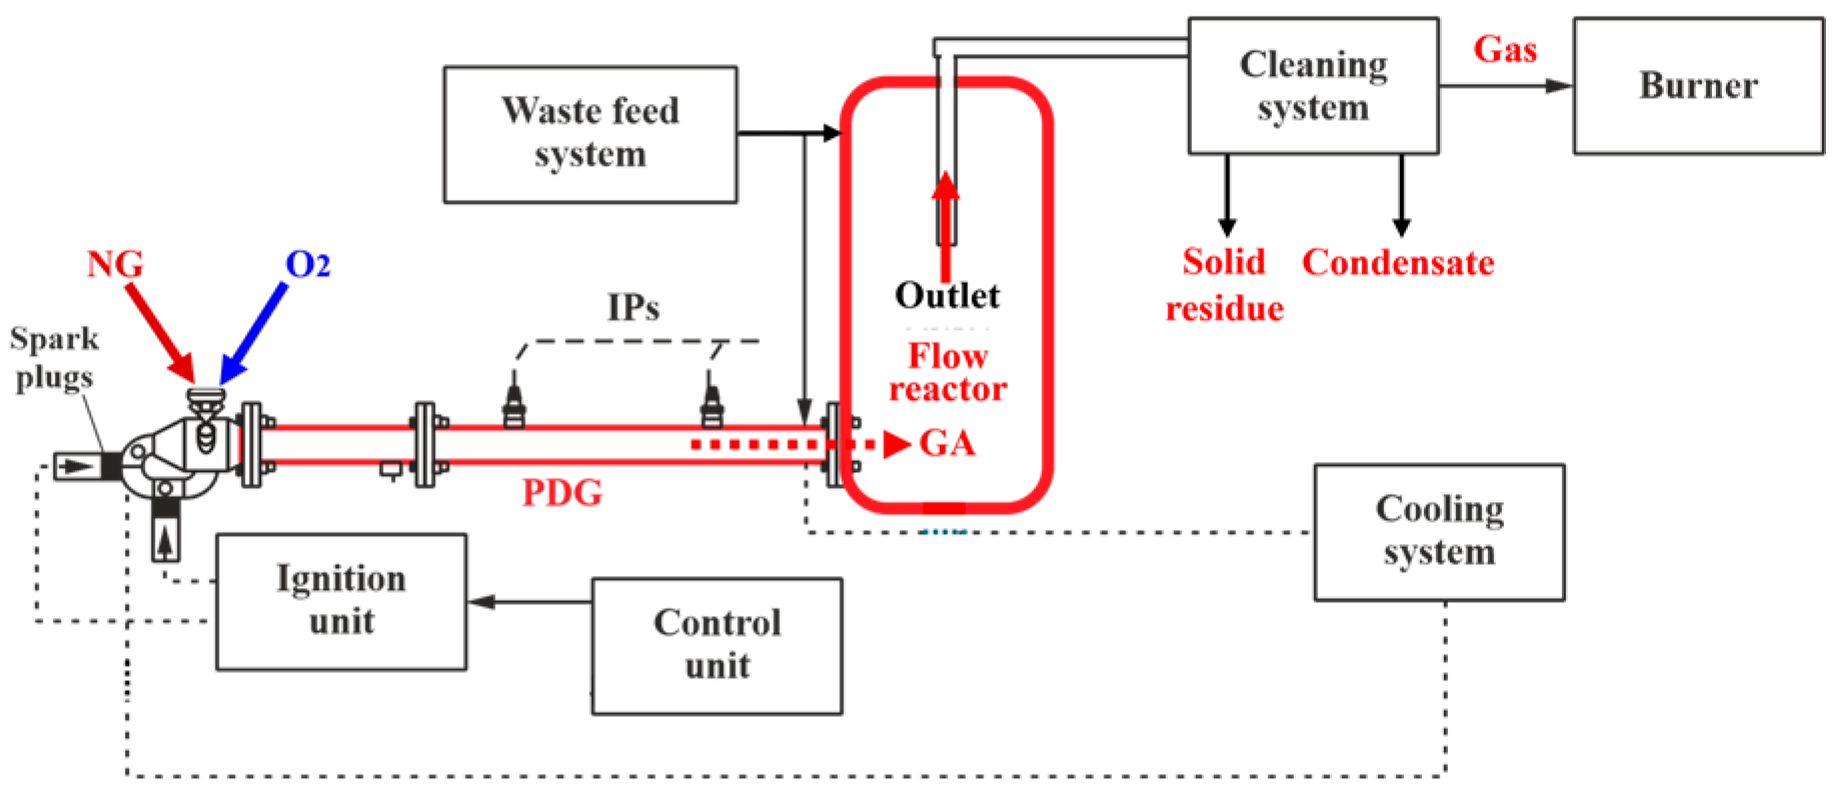
Figure 5.
Schematic of the flow reactor with a hatch at the top and bottom flanges for connecting a splitter tube (a) and a photograph of the flow reactor with a lower hatch for continuous feedstock supply and the splitter tube of the PDG (b).
Figure 5.
Schematic of the flow reactor with a hatch at the top and bottom flanges for connecting a splitter tube (a) and a photograph of the flow reactor with a lower hatch for continuous feedstock supply and the splitter tube of the PDG (b).
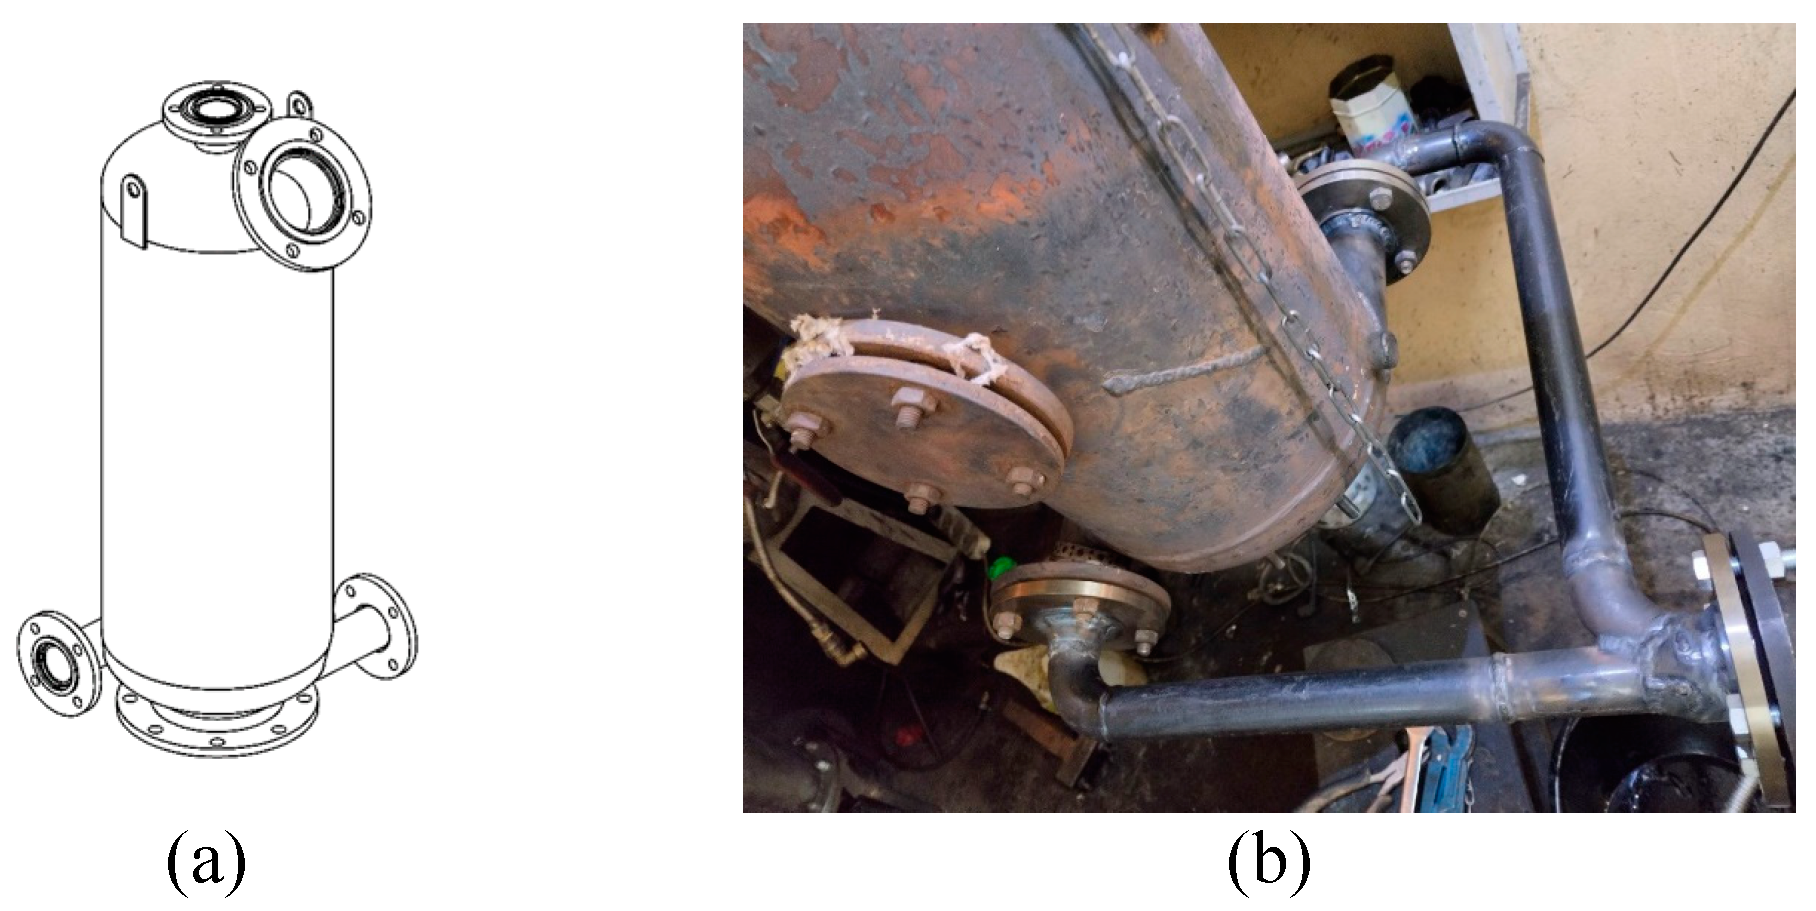
Figure 6.
The example of gas and wall temperature records in the upper part of the flow reactor with two stages of wet PM gasification: T1 – water evaporation stage, T2 – gasification stage.
Figure 6.
The example of gas and wall temperature records in the upper part of the flow reactor with two stages of wet PM gasification: T1 – water evaporation stage, T2 – gasification stage.
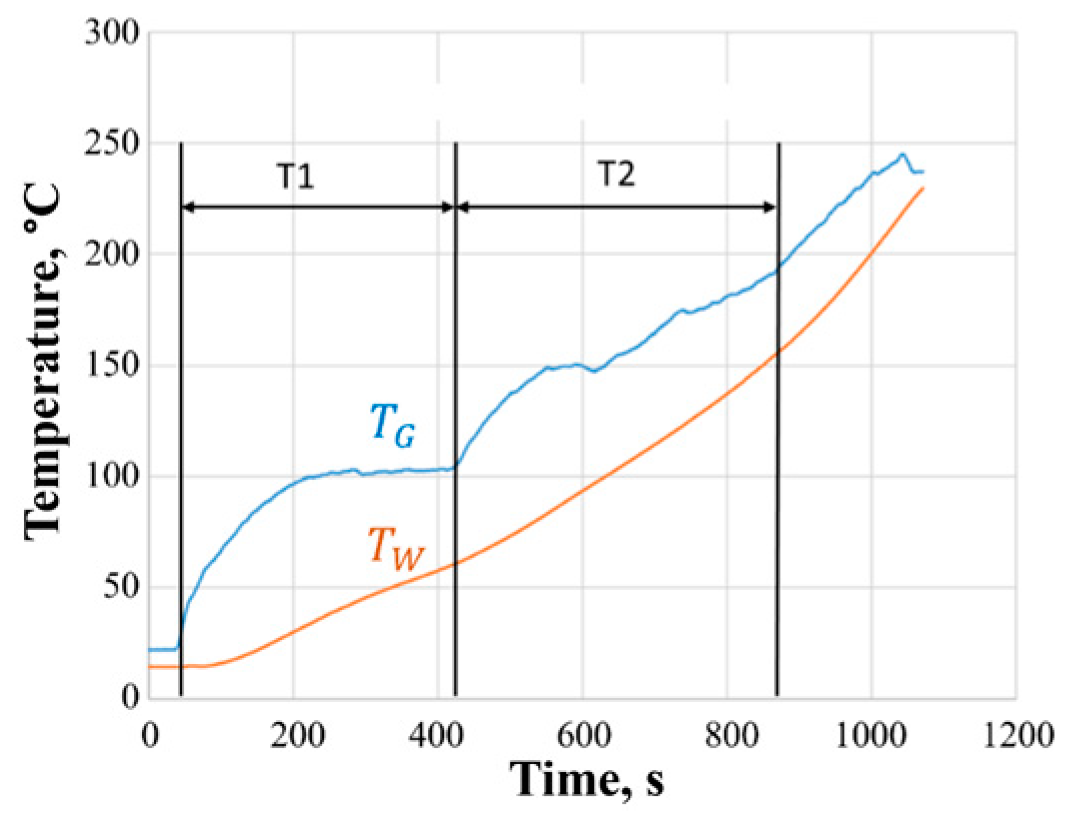
Figure 7.
The example of records of the flow-through gas analyzer (left scale) and gas and wall temperatures in the upper part of the flow reactor (right scale) in an experiment with loading a 1-kg batch of wet PM into the flow reactor.
Figure 7.
The example of records of the flow-through gas analyzer (left scale) and gas and wall temperatures in the upper part of the flow reactor (right scale) in an experiment with loading a 1-kg batch of wet PM into the flow reactor.
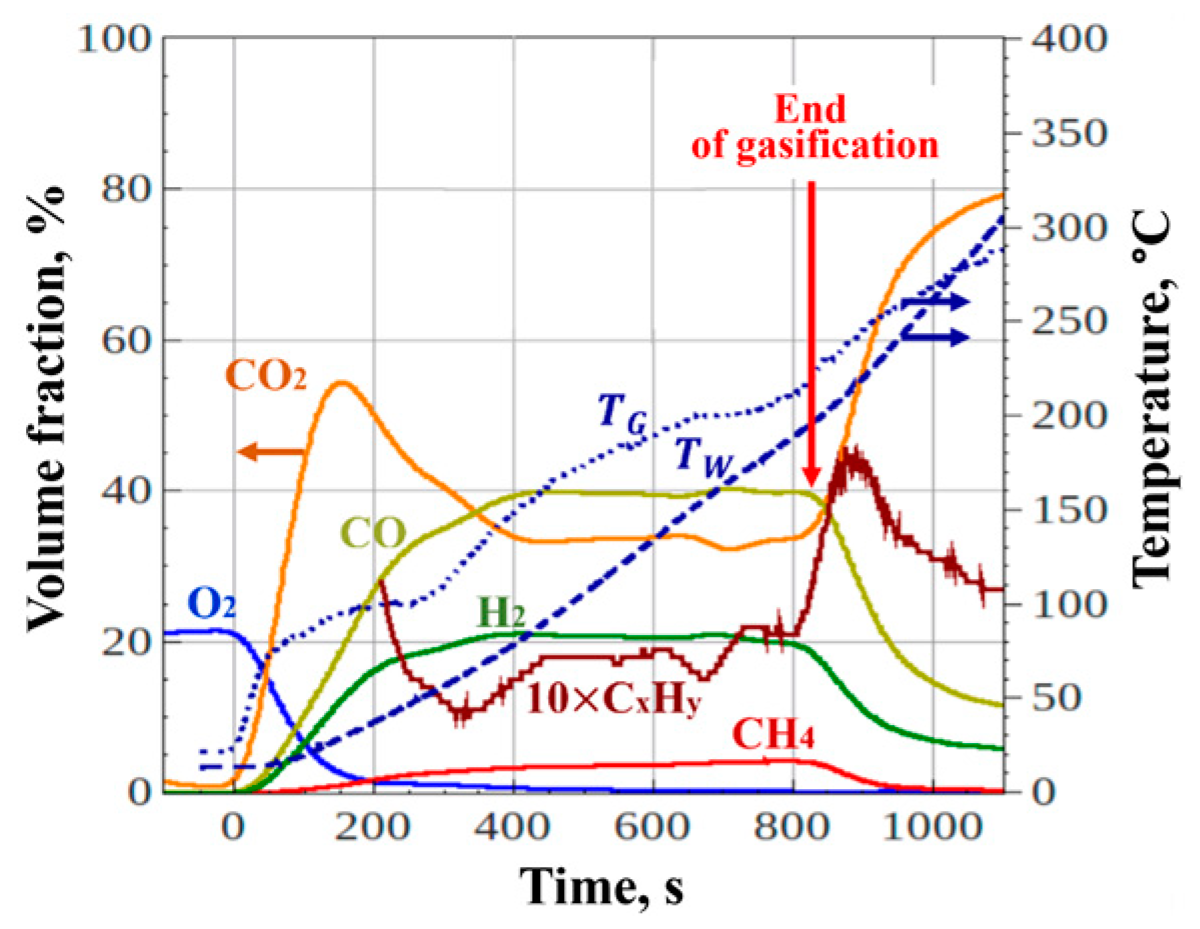
Figure 8.
The photograph of the solid residue removed from the “dry” cyclone.
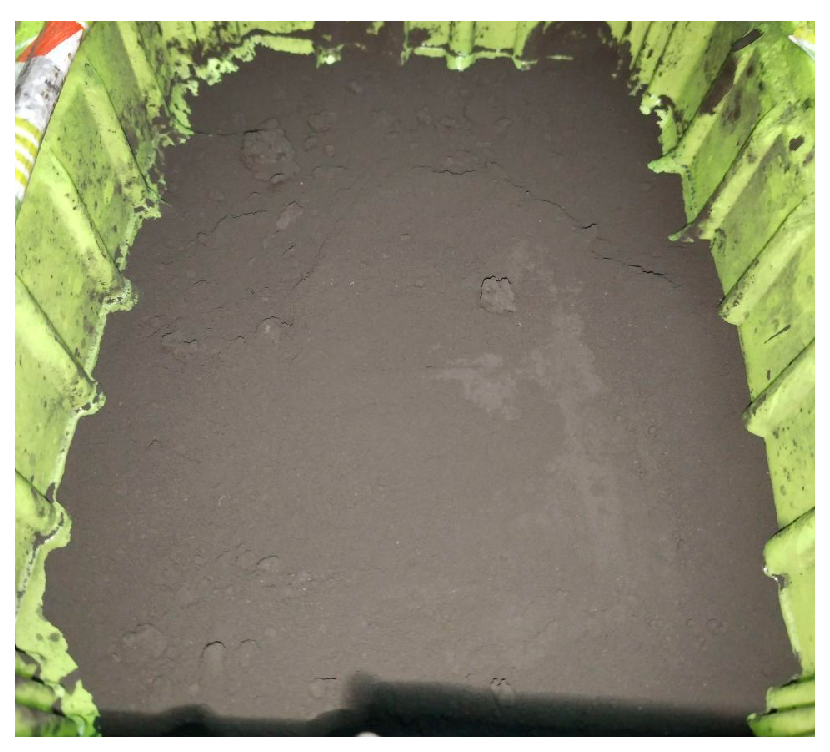
Figure 9.
The model of the PM gasification process with feedstock supply to the flow reactor.
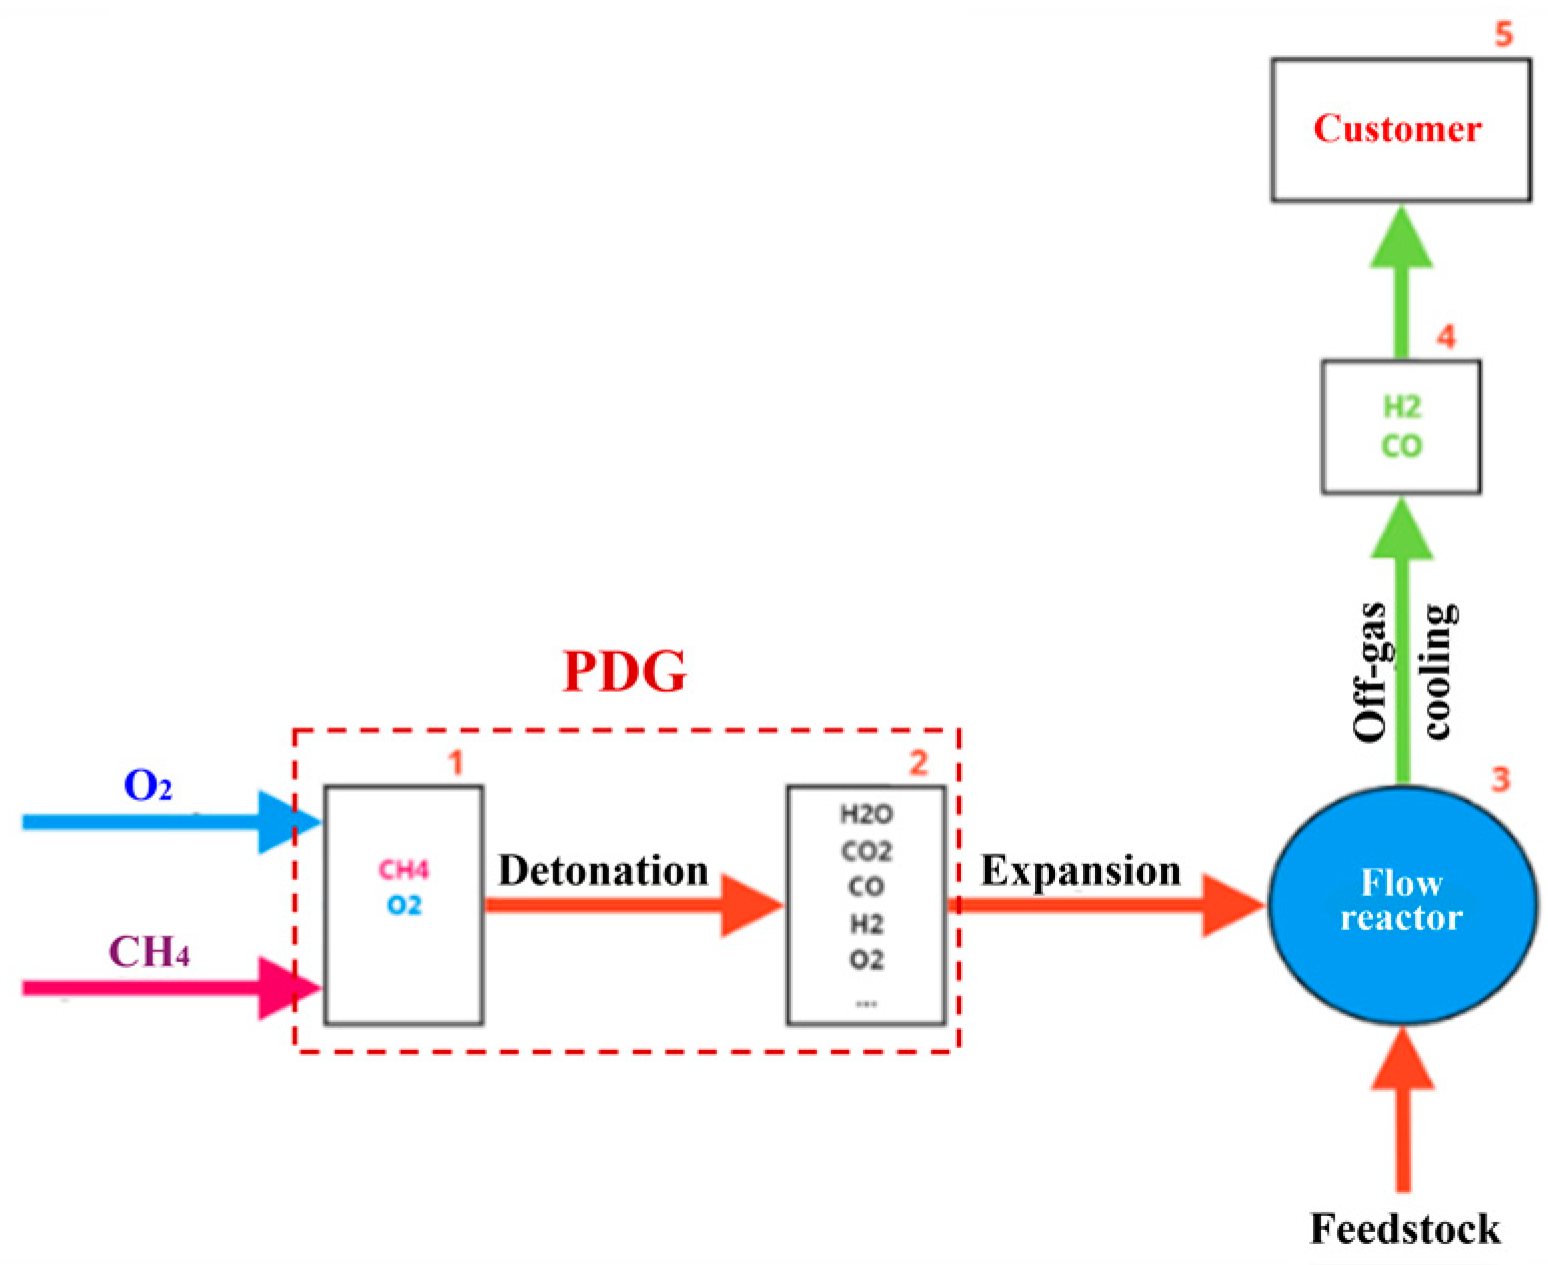
Figure 10.
Compositions of the dry off-gas produced by gasification of the original wet PM (moisture 70%) with batch loading of feedstock into the flow reactor at different gasification conditions; the numbers above the columns are the numbers of experiments in Table 12.
Figure 10.
Compositions of the dry off-gas produced by gasification of the original wet PM (moisture 70%) with batch loading of feedstock into the flow reactor at different gasification conditions; the numbers above the columns are the numbers of experiments in Table 12.
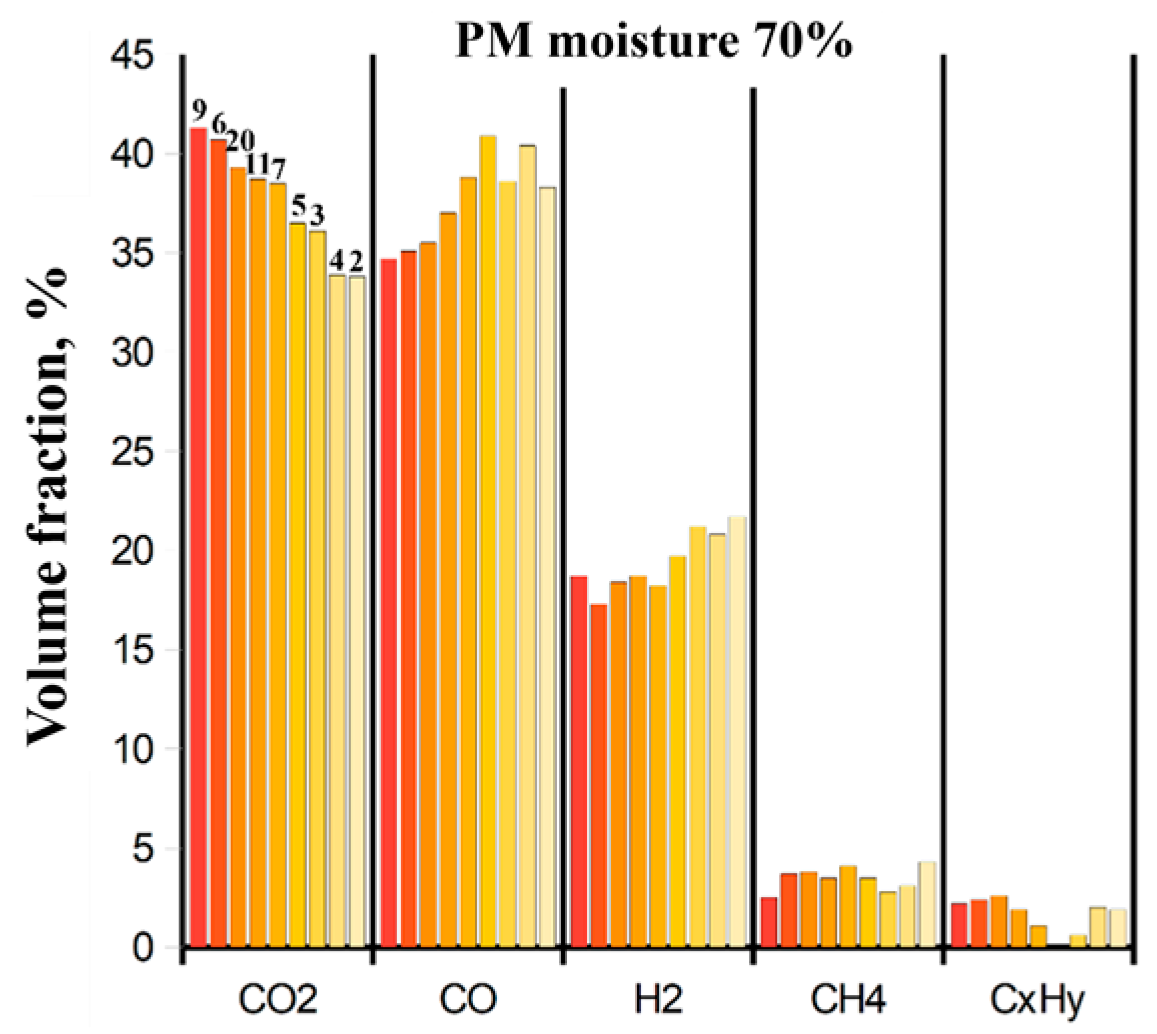
Figure 11.
Measured dependencies of CO, H2, CH4, and CxHy volume fractions on the volume fraction of CO2 in the dry off-gas produced by gasification of: (a) original wet PM (
Figure 11.
Measured dependencies of CO, H2, CH4, and CxHy volume fractions on the volume fraction of CO2 in the dry off-gas produced by gasification of: (a) original wet PM (

Figure 12.
Measured dependencies of CO, H2, CH4, and CxHy volume fractions on the volume fraction of CO2 in the off-gas produced by PM gasification at one-time loading of a weighed feedstock batch (squares) and with gradual feedstock feeding (diamonds) into the flow reactor; the feedstock possesses different moisture contents (from 70% to 15%, see Table 12).
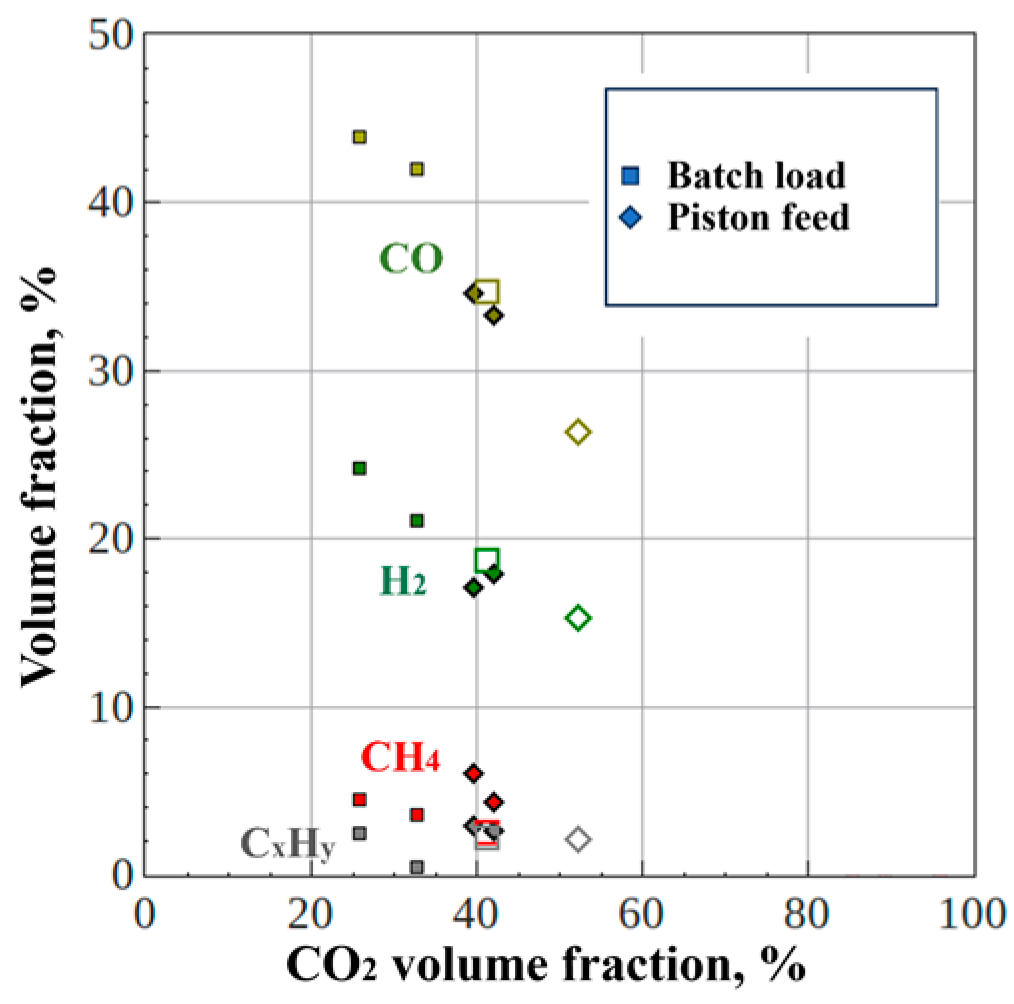
Figure 13.
(a) Mean mass fractions of elements in the dried feedstock (red, 1), in the solid residue extracted from the “dry” cyclone (yellow, 2), and in the solid residue extracted from the “wet” cyclone (after drying, blue, 3), and (b) mass fractions of phosphorus in the solid residue extracted from the “dry” cyclone in experiments ##2, 5, and 6.
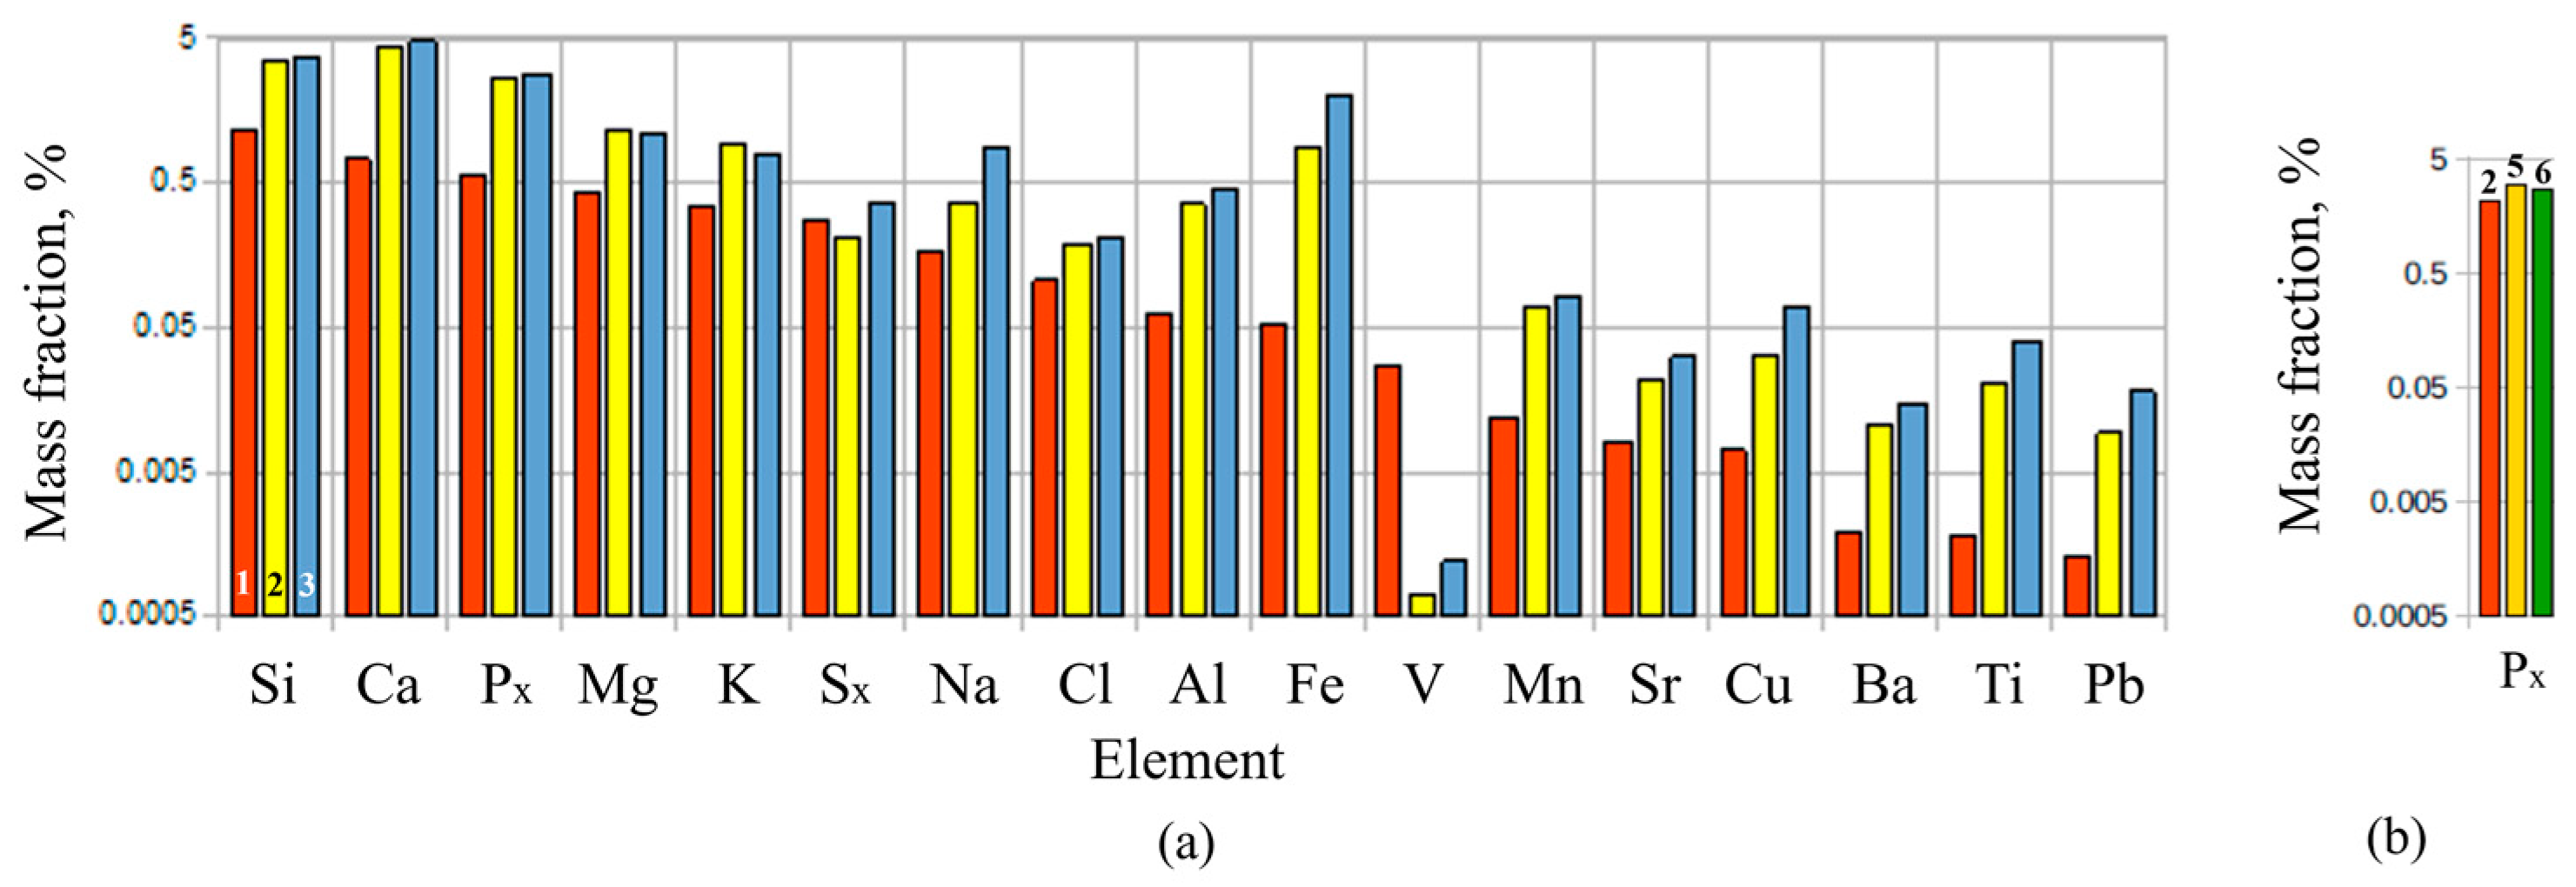
Figure 14.
Oxidative stability of the solid residue measured by synchronous thermal analysis: (a) sample #1, (b) sample #2.
Figure 14.
Oxidative stability of the solid residue measured by synchronous thermal analysis: (a) sample #1, (b) sample #2.
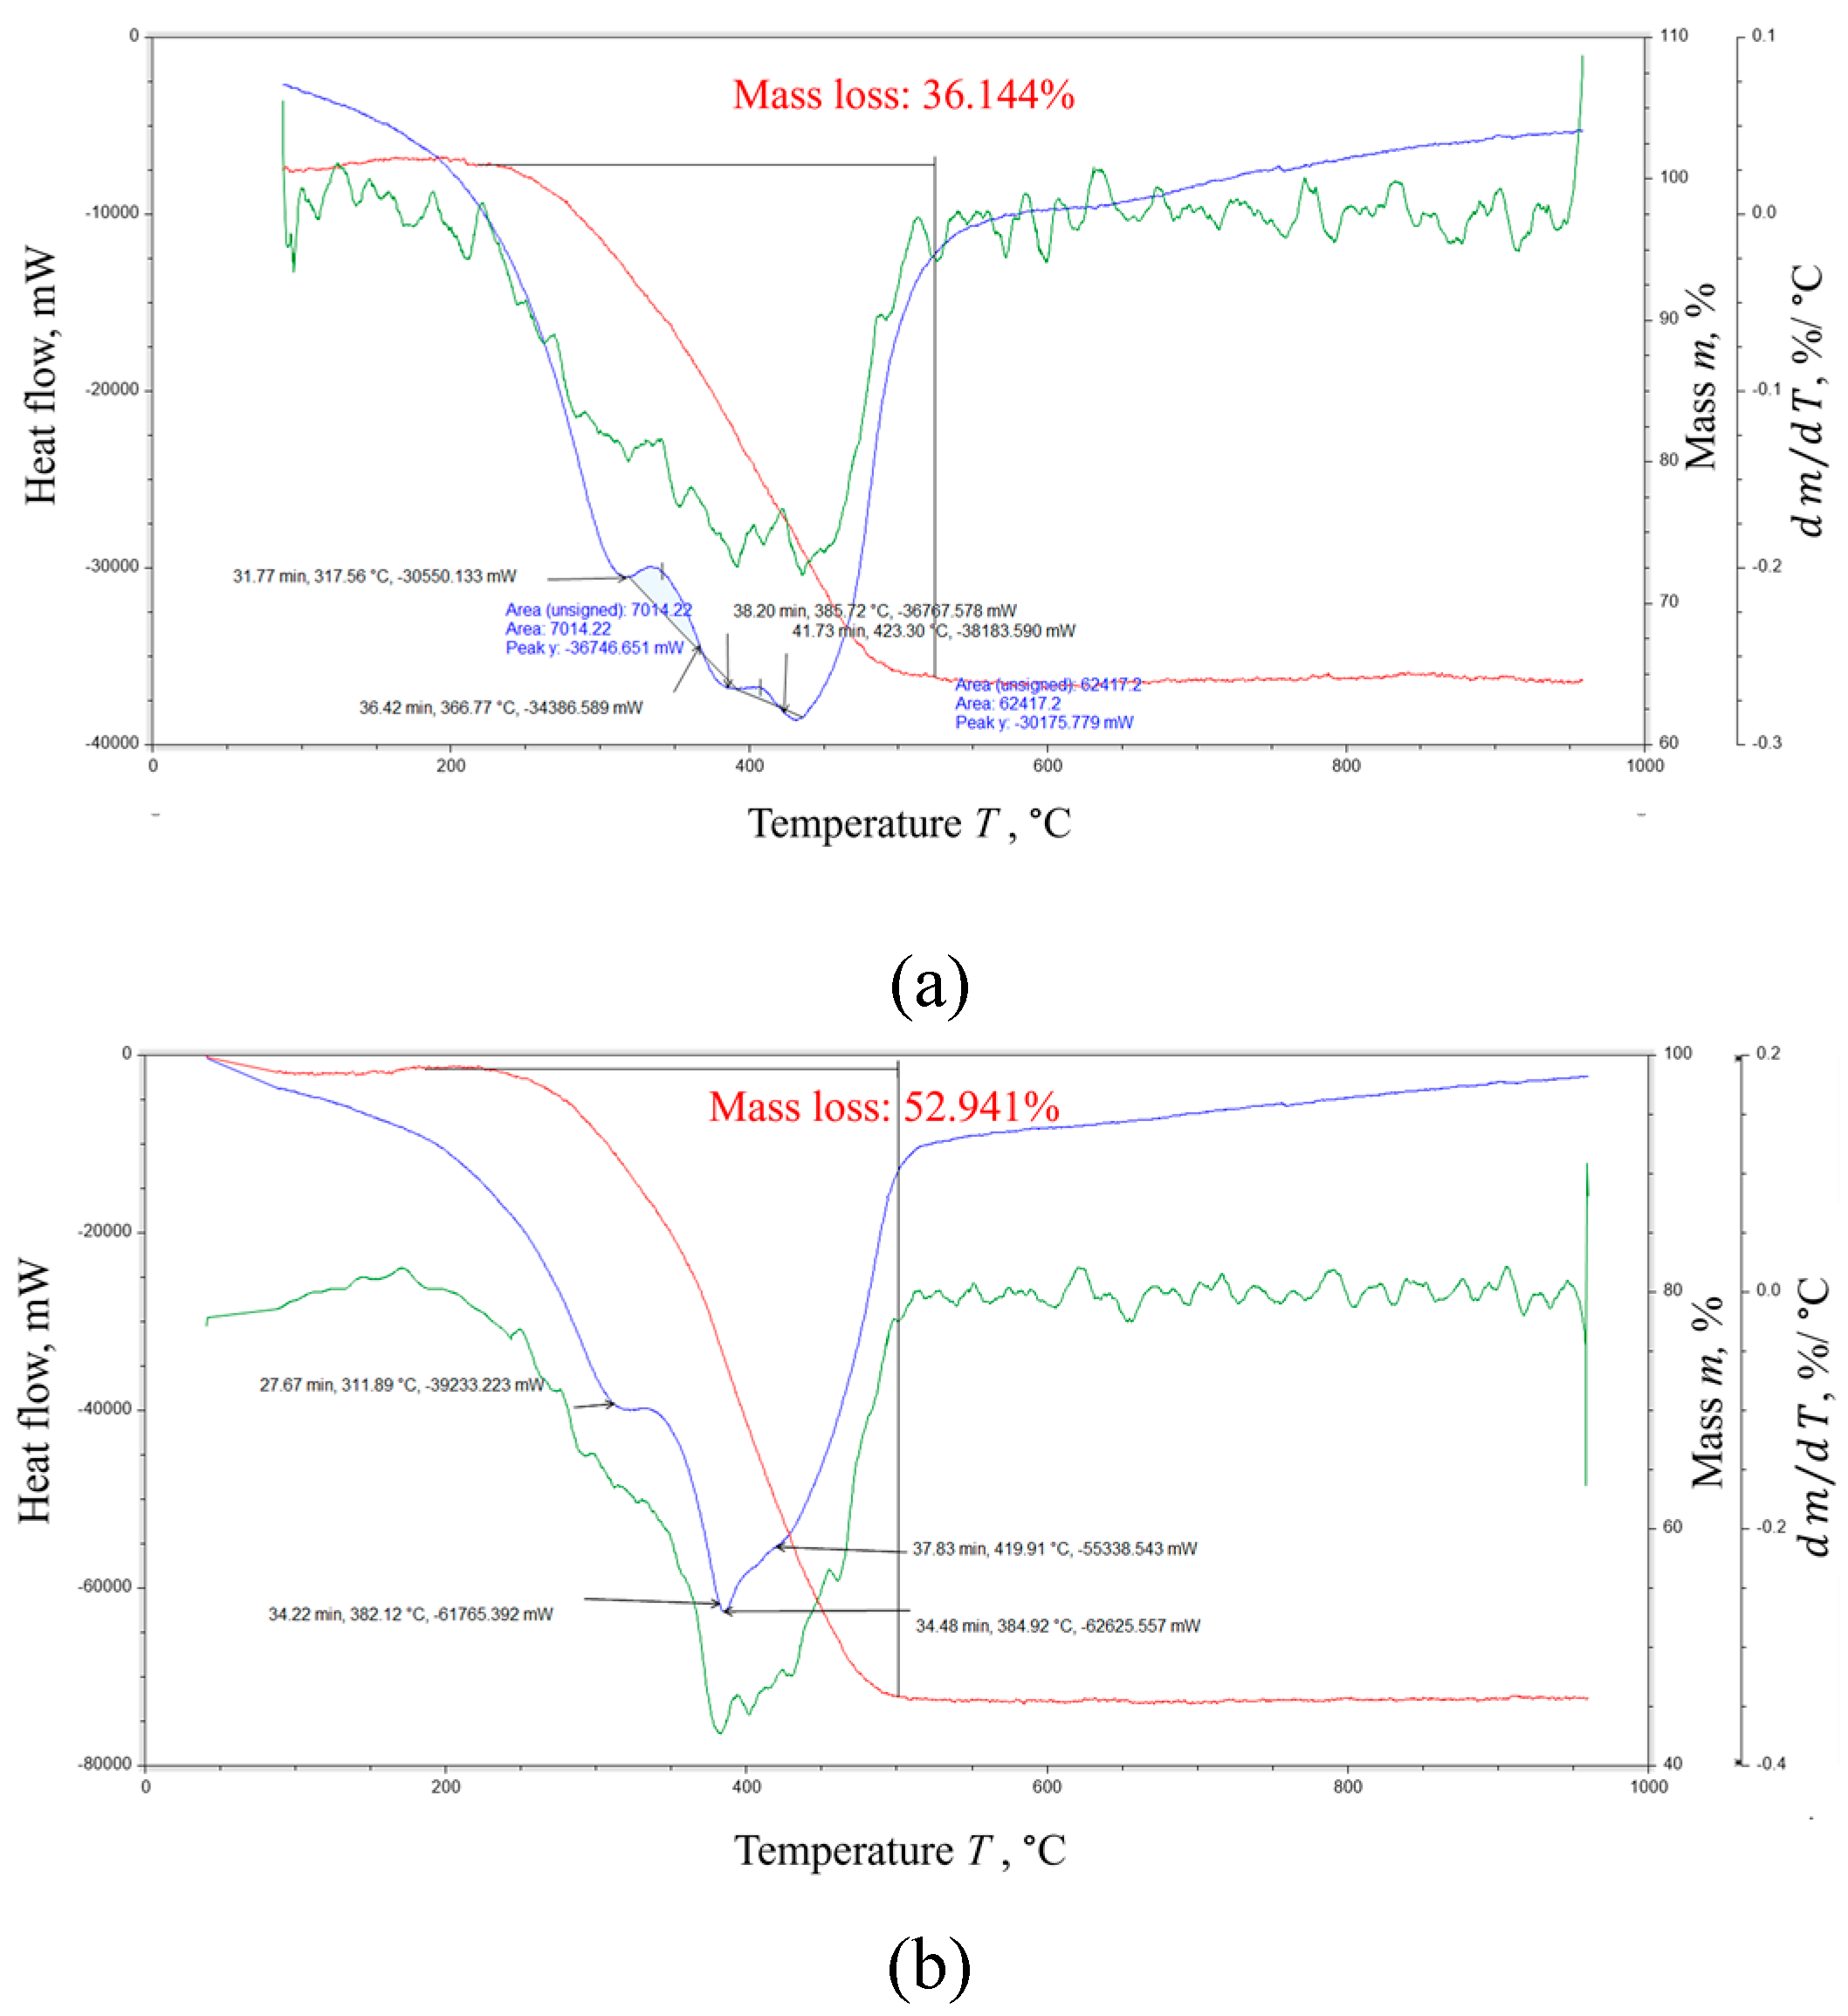
Figure 15.
Particle size distributions of solid residue (94 – experiment #3+#6, 96 – #3; 98 – #6; 99 – #7; 100 – #9; 101 – #10).
Figure 15.
Particle size distributions of solid residue (94 – experiment #3+#6, 96 – #3; 98 – #6; 99 – #7; 100 – #9; 101 – #10).
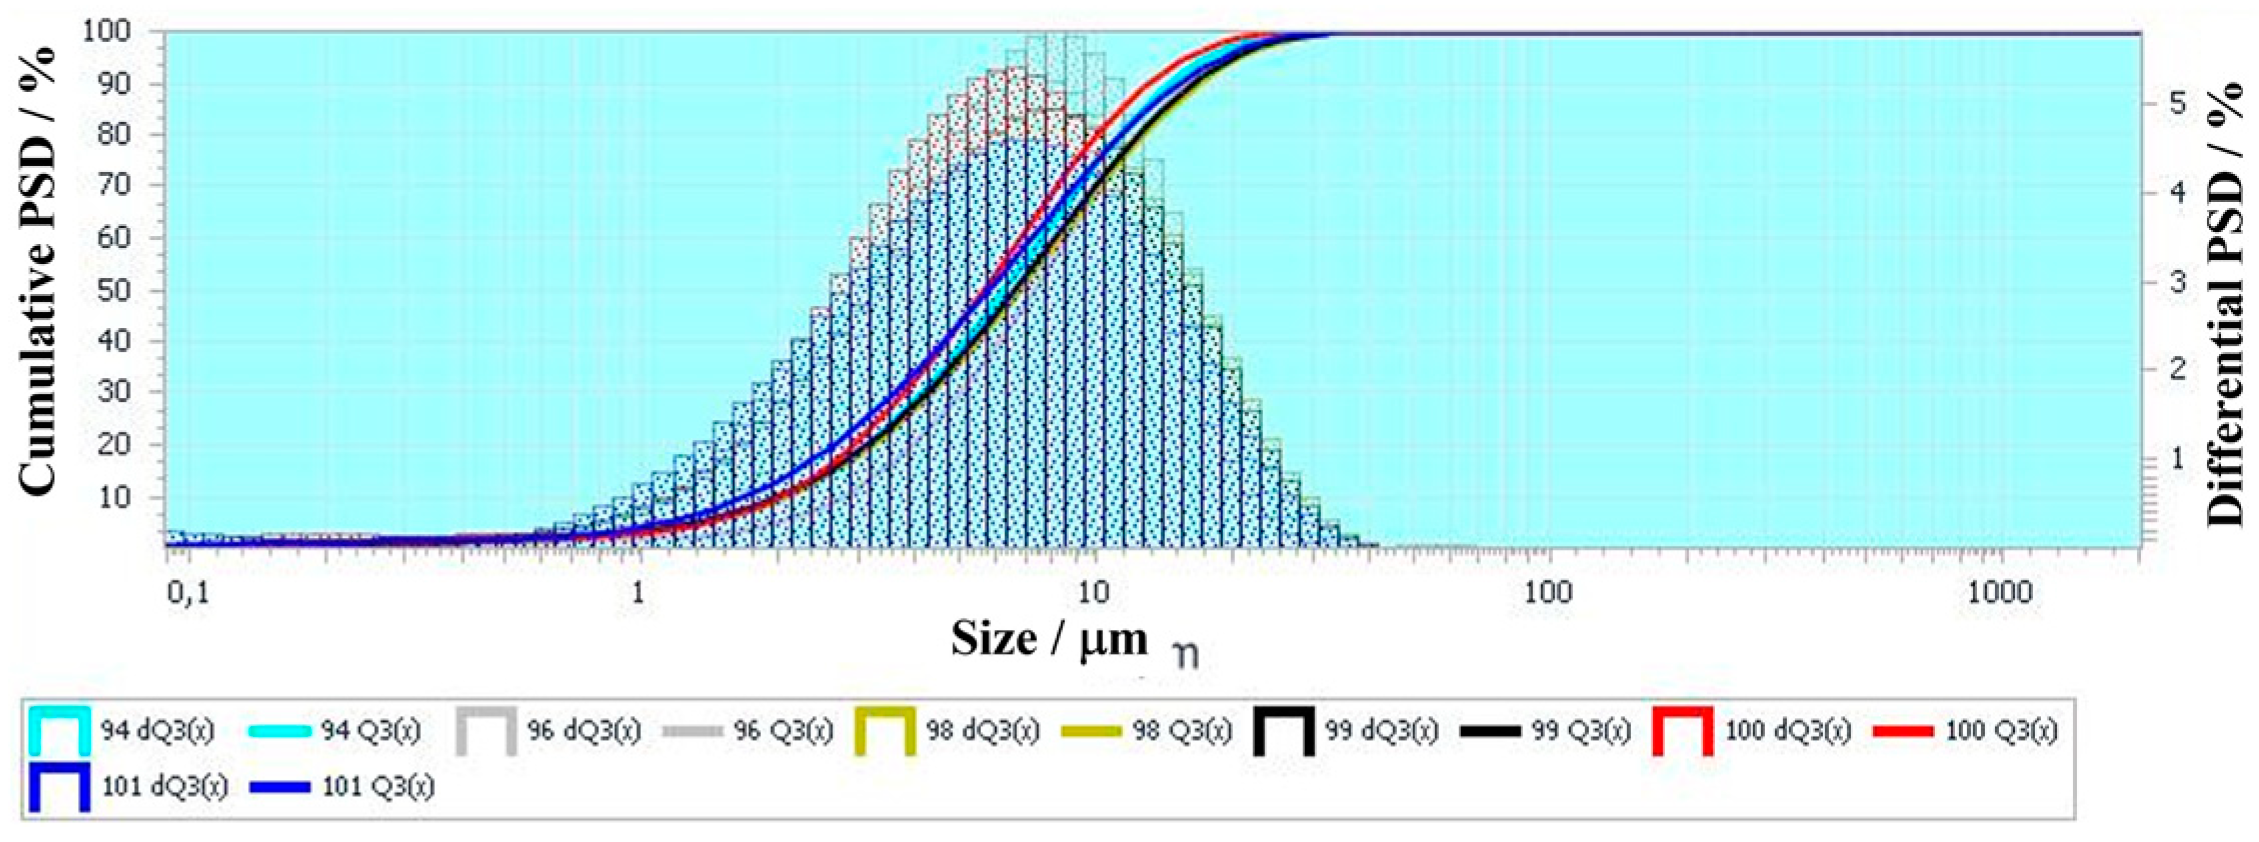
Figure 16.
Total ion current chromatograms of (a) diethyl ether extract and (b) hexane extract of trimethylsilyl derivatives in the condensate of PM gasification products.
Figure 16.
Total ion current chromatograms of (a) diethyl ether extract and (b) hexane extract of trimethylsilyl derivatives in the condensate of PM gasification products.
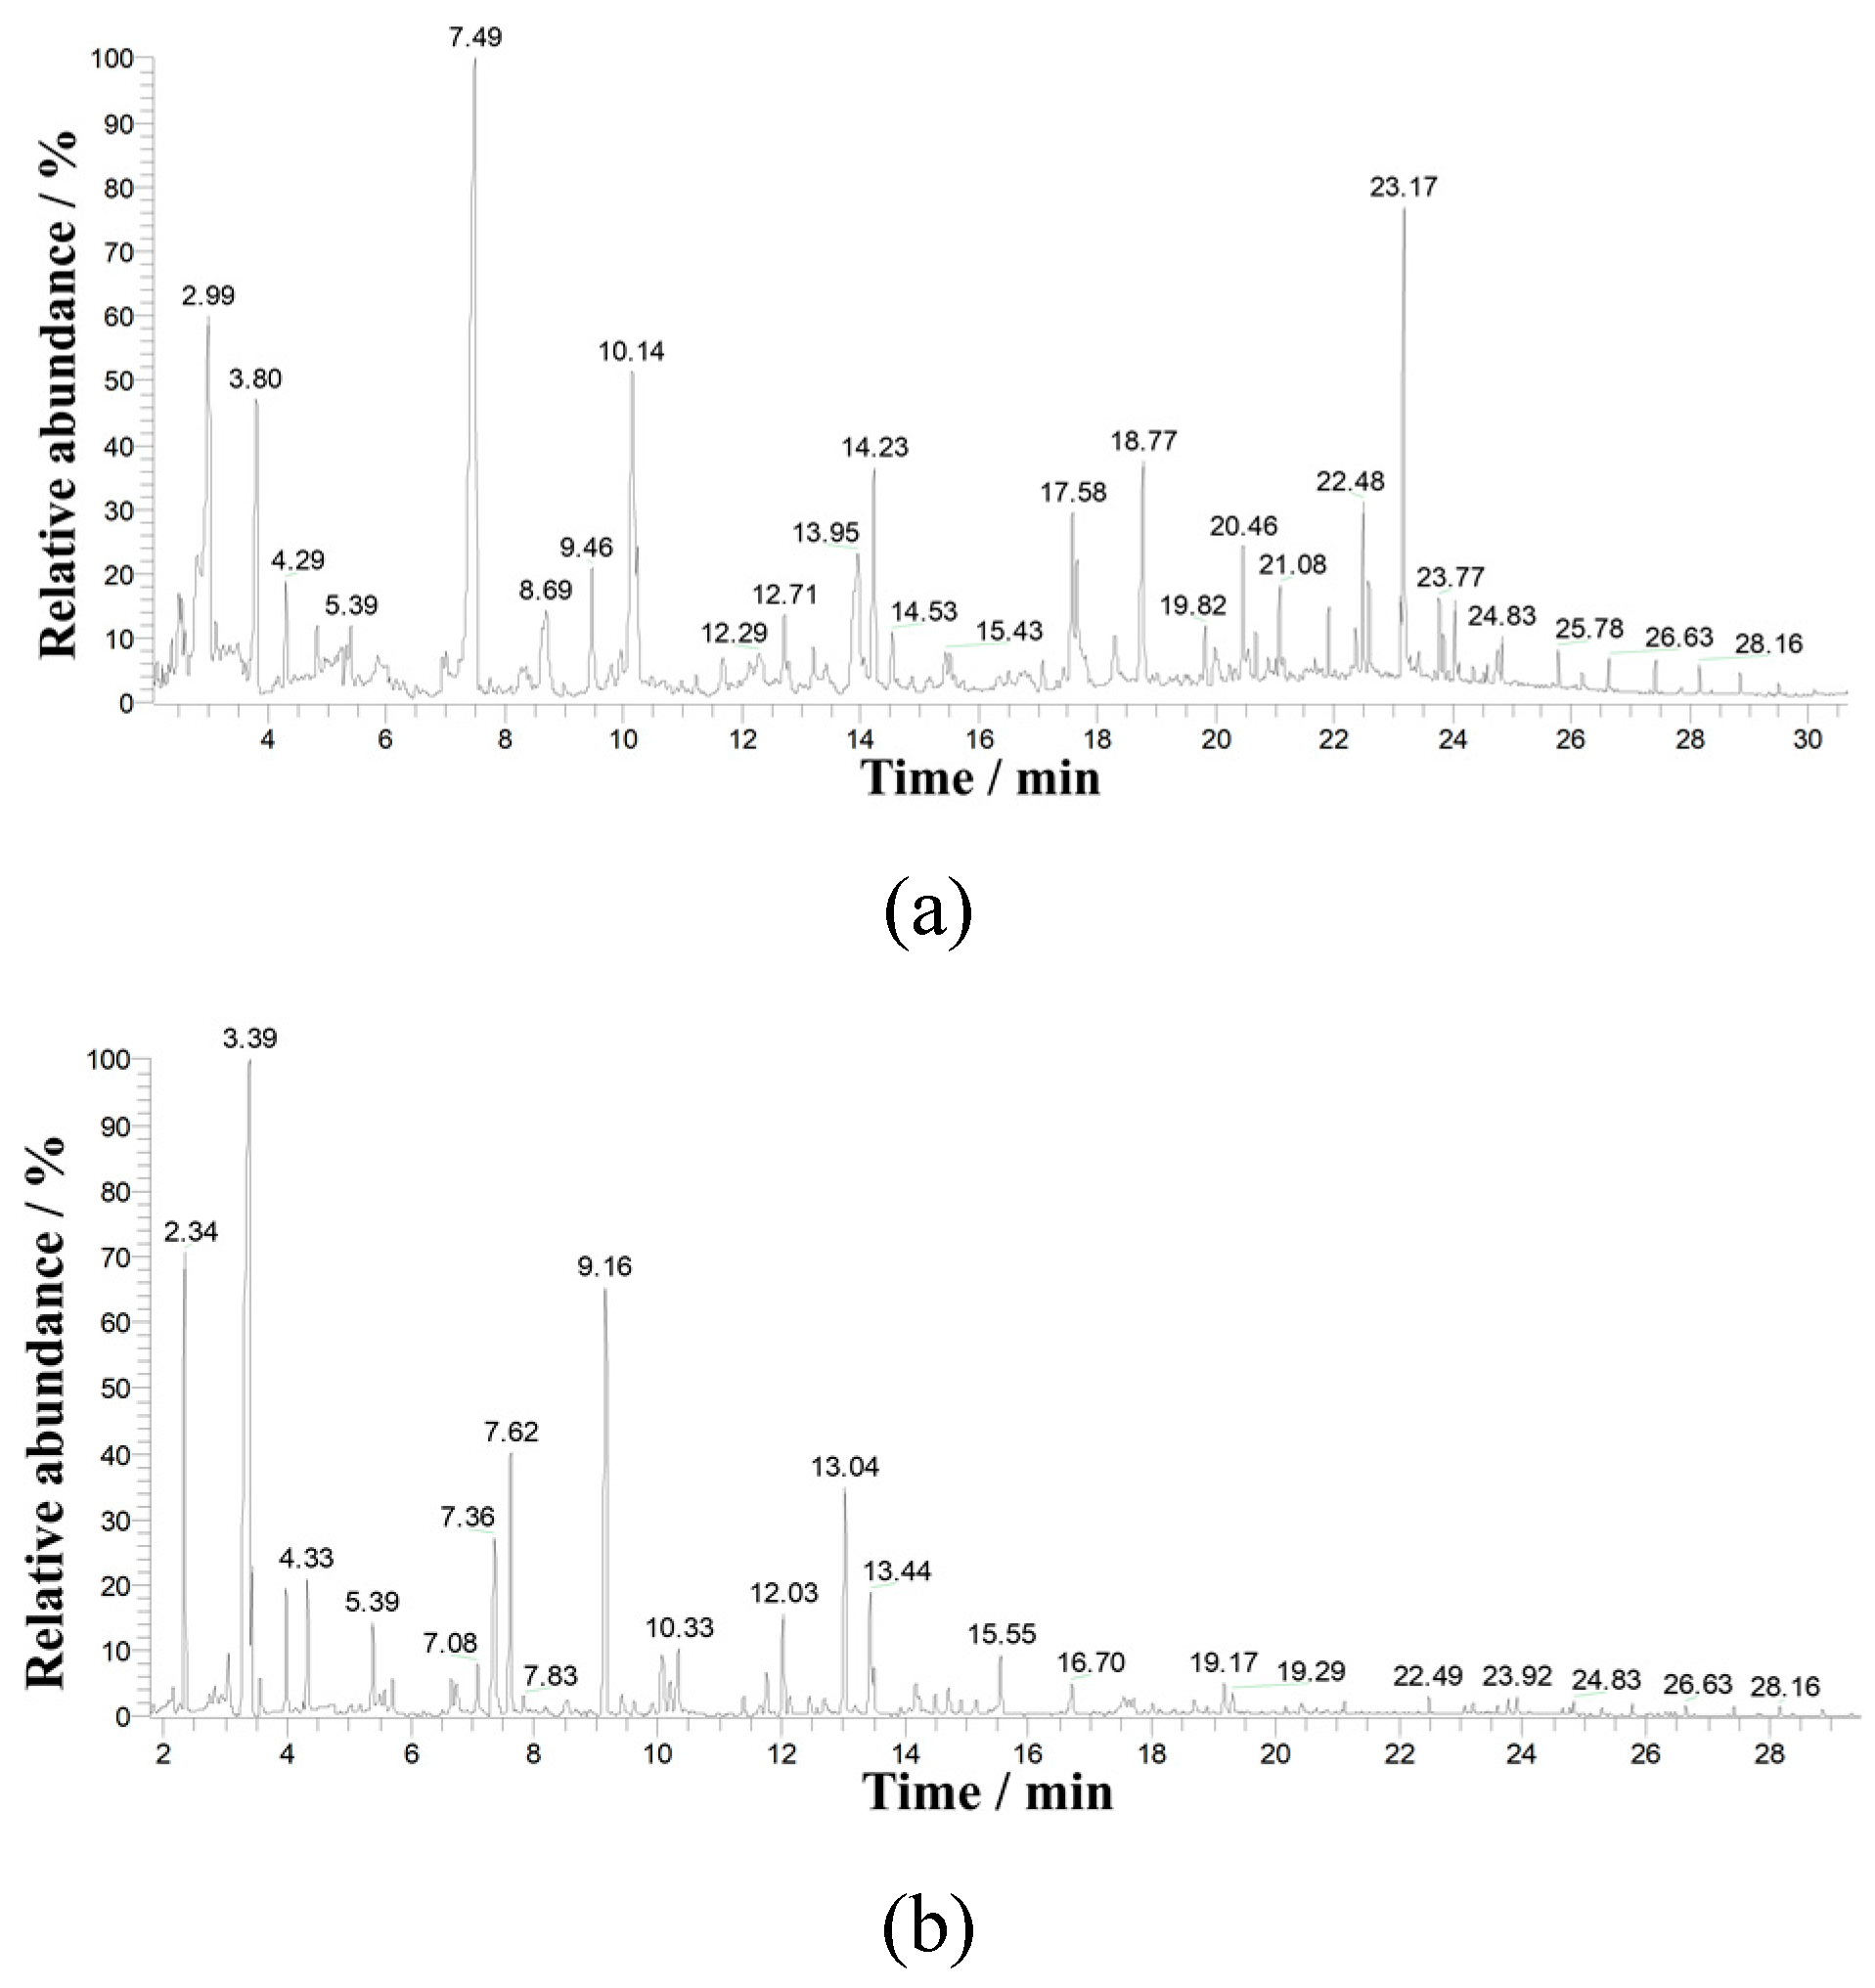

Table 1.
Results of elemental CHNS analysis of the dry PM.
| Sample # | C wt.% |
H wt.% |
N wt.% |
S wt.% |
Ash wt.% |
Σel. wt.% |
O,% (100%- Σel.,%) |
| 1 | 44.98 | 5.90 | 1.40 | 0.66 | 8.33 | 61.27 | 38.73 |
| 2 | 46.43 | 5.66 | 1.88 | 0.51 | 8.82 | 63.30 | 36.70 |
| average | 45.71 | 5.78 | 1.64 | 0.59 | 8.58 | 62.30 | 37.72 |
Table 2.
Results of calorimetric measurements of the higher heating value of the PM.
| Sample# |
g |
g |
g |
g |
g |
kJ/g |
|
| 1 | 2.77380 | 0.24002 | 0.00780 | 2.70 | 0.14 | 97 | 5.64 |
| 2 | 3.08128 | 0.23941 | 0.00637 | 2.97 | 0.16 | 96 | 5.88 |
Table 3.
Dependence of the mass of the PM sample on the drying time at room temperature.
| , g | 77.46 | 34.59 | 28.30 | 28.24 |
| , hour | 0 | 27 | 48 | 52 |
| 2.74 | 1.22 | 1.002 | 1 |
Table 4.
Results of calorimetric measurements of the higher heating value of the dried PM.
| Sample # |
g |
kJ/g |
g (%) |
g (%) |
kJ/g |
| 1 | 1.560345 | 16.53 | 0.07146 (4,6%) | 1.20 (77) | 14.6 |
| 2 | 1.615495 | 16.48 | 0.074685 (4,6%) | 1.24 (77) | 14.6 |
| 3 | 1.694625 | 16.75 | 0.06724 (4%) | 1.20 (71) | 15.0 |
Table 5.
The elemental composition of dry coffee grounds [47].
Table 5.
The elemental composition of dry coffee grounds [47].
| C wt.% |
H wt.% |
N wt.% |
S wt.% |
Ash wt.% |
O wt.% |
| 48.5 | 7.2 | 2.2 | 0.2 | 1.2 | 40.7 |
Table 6.
The elemental composition of wood sawdust [48].
Table 6.
The elemental composition of wood sawdust [48].
| C wt.% |
H wt.% |
N wt.% |
Ash wt.% |
O wt.% |
| 48.78 | 5.85 | 0.11 | 0.54 | 44.72 |
Table 7.
The composition of NG.
| Substance | CH4 | C2H6 | C3H8 | C4H10 | N2 |
| Content, vol.% | 96.1 | 2.1 | 0.6 | 0.2 | 1.0 |
Table 8.
The calculated composition of detonation products of the stoichiometric methane-oxygen mixture expanded to 0.1 MPa.
Table 8.
The calculated composition of detonation products of the stoichiometric methane-oxygen mixture expanded to 0.1 MPa.
| Substance | Н2О | СО2 | СО | Н2 |
| Content, vol.% | 65.9 | 32.5 | 0.66 | 0.39 |
Table 9.
The average statistical composition of the PM [51].
Table 9.
The average statistical composition of the PM [51].
| Organic matter, wt.% | N, wt.% | Ash, wt.% | μ*, kg/kmol |
| 76.1 | 2.41 | 21.5 | 15 |
μ is the molecular mass.
Table 10.
The model composition of the PM.
| С, wt.% | Н, wt.% | N, wt.% | O, wt.% | Ash, wt.% |
| 37.7 | 3.4 | 5.1 | 32.3 | 21.5 |
Table 11.
Calculated compositions of the off-gas obtained from the PM at gasification temperatures of 1000, 1200, 1500, and 2000 K, and a gasification pressure of 0.1 MPa.
Table 11.
Calculated compositions of the off-gas obtained from the PM at gasification temperatures of 1000, 1200, 1500, and 2000 K, and a gasification pressure of 0.1 MPa.
| Temperature, K |
СО2, vol.% |
СО, vol.% |
H2, vol.% |
N2, vol.% |
| 1000 | 10 | 45 | 41 | 4 |
| 1200 | 0.5 | 56 | 40 | 3.5 |
| 1500 | 0 | 57 | 40 | 3 |
| 2000 | 0 | 57 | 40 | 3 |
Table 12.
Summary data for all conducted experiments.
| Exp.# | Waste | ν Hz |
g |
% |
g |
g |
s |
s |
s |
g/s |
°C |
СО2 % |
СО % |
Н2 % |
СН4 % |
СхНy** % |
O2 % |
MJ/m3 |
MJ/kg |
|
| 1 | Coffee | 0.78 | 1500 | 85 | 225 | 25 | 11.1 | 300 | 480 | 780 | - | 230 | 37.3 | 35.2 | 20.4 | 5.6 | 2.9 | 0 | 10.7 | 10.4 |
| 2 | PM | 0.78 | 1500 | 70 | 450 | 80 | 17.8 | 300 | 720 | 1020 | - | 260 | 33.8 | 38.3 | 21.7 | 4.3 | 1.9 | 0 | 10.0 | 9.5 |
| 3 | PM | 0.63 | 1000 | 70 | 300 | 50 | 16.7 | 300 | 520 | 820 | - | 300 | 36.1 | 38.6 | 21.2 | 2.8 | 0.6 | 0 | 8.6 | 7.7 |
| 4 | PM | 0.63 | 1000 | 70 | 300 | 50 | 16.7 | 240 | 600 | 840 | - | 210 | 33.9 | 40.4 | 20.8 | 3.1 | 2 | 0 | 9.8 | 9.6 |
| 5 | PM | 1 | 1000 | 70 | 300 | 49 | 16.3 | 160 | 380 | 540 | - | 220 | 36.5 | 40.9 | 19.7 | 3.5 | 0 | 0 | 8.5 | 7.5 |
| 6* | PM | 1 | 1000 | 70 | 300 | 44 | 14.7 | - | 420 | 420 | - | 350 | 40.7 | 35.1 | 17.3 | 3.7 | 2.4 | 0 | 9.3 | 9.3 |
| 7* | PM | 1 | 2000 | 70 | 600 | 72 | 12.0 | - | 720 | 720 | - | 330 | 38.5 | 38.8 | 18.2 | 4.1 | 1.1 | 0 | 8.3 | 7.3 |
| 8 | PM | 0.77 | 800 | 15 | 680 | 220 | 32.4 | 130 | 1200 | 1330 | - | 320 | 32.7 | 42.1 | 21.1 | 3.6 | 0.5 | 0 | 9.2 | 8.3 |
| 9 | PM | 0.63 | 1000 | 70 | 300 | 20 | 6.7 | 380 | 450 | 830 | - | 210 | 41.3 | 34.7 | 18.7 | 2.5 | 2.2 | 0 | 8.8 | 8.8 |
| 10* | PM | 0.50 | 450 | 15 | 425 | 80 | 20.9 | 290 | 300 | 590 | - | 230 | 32.4 | 41.4 | 20 | 3.6 | 2.5 | 0 | 10.3 | 10.4 |
| 11 | PM | 0.63 | 1000 | 70 | 300 | 30 | 10.0 | - | 660 | 660 | - | 220 | 38.7 | 37 | 18.7 | 3.5 | 1.9 | 0.3 | 8.9 | 9.7 |
| 12 | PM | 0.77 | 1000 | 45 | 550 | 90 | 16.4 | - | 600 | 600 | - | 250 | 34.7 | 39.3 | 19.4 | 4 | 2.5 | 0.2 | 9.7 | 10.5 |
| 13 | PM | 0.63 | 1000 | 45 | 550 | 90 | 16.4 | 260 | 600 | 860 | - | 240 | 34 | 39.6 | 20.6 | 3.7 | 1.9 | 0.3 | 9.5 | 10.4 |
| 14* | PM | 0.63 | 2000 | 70 | 600 | - | - | - | 600 | 600 | 3.3 | 170 | 52.2 | 26.4 | 15.3 | 2.1 | 2.1 | 2.1 | 6.8 | 7.4 |
| 15* | PM | 0.63 | 650 | 15 | 617.5 | 66 | 10.7 | - | 980 | 980 | 0.62 | 460 | 42 | 33.3 | 17.9 | 4.3 | 2.6 | 0 | 9.0 | 9.8 |
| 16 | PM | 0.63 | 650 | 15 | 617.5 | 62 | 10 | - | 1000 | 1000 | 0.62 | 390 | 39.5 | 34.6 | 17.1 | 6 | 2.9 | 0 | 9.8 | 10.8 |
| 17 | Sawdust | 0.63 | 600 | 15 | 570 | 70 | 12.3 | - | 880 | 880 | 0.50 | 360 | 35.7 | 39.4 | 17.7 | 5.2 | 1.9 | 0 | 9.7 | 10.6 |
| 18 | Sawdust | 0.63 | 400 | 15 | 380 | 110 | 29 | - | 250 | 250 | - | 340 | 24.1 | 45 | 24.5 | 4.1 | 1.8 | 0 | 10.7 | 11.8 |
| 19 | PM | 0.63 | 500 | 15 | 475 | 134 | 28.2 | - | 280 | 280 | - | 400 | 25.7 | 44 | 24.2 | 4.5 | 2.5 | 0 | 11.0 | 12.1 |
| 20 | PM | 0.63 | 500 | 70 | 150 | 20 | 13.3 | - | 260 | 260 | - | 370 | 39.3 | 35.5 | 18.4 | 3.8 | 2.6 | 0 | 9.1 | 9.9 |
* Preheating of the reactor; **The heat of combustion for CxHy is taken equal 70 MJ/m3, density 1.6 kg/m3.
Table 13.
Mass balances of PM drying and gasification processes.
| Exp.# |
g |
% |
g |
g |
g/s |
g/s |
/ | / | / |
| 3 | 1000 | 70 | 700 | 300 | 1.5 | 0.33 | 7.07 | 1.75 | 1.49 |
| 4 | 1000 | 70 | 700 | 300 | 1.5 | 0.33 | 8.84 | 1.52 | 1.54 |
| 5 | 1000 | 70 | 700 | 300 | 2.25 | 0.53 | 8.25 | 1.49 | 1.49 |
| 9 | 1000 | 70 | 700 | 300 | 1.52 | 0.3 | 6.14 | 2.22 | 1.52 |
| 13 | 1000 | 45 | 450 | 550 | 1.29 | 0.273 | 6.34 | 3.36 | 1.35 |
Table 14.
Comparison of compositions of the dry off-gas produced by PM gasification, measured with the flow-through gas analyzer and the gas chromatograph (marked with an asterisk *) in several experiments.
Table 14.
Comparison of compositions of the dry off-gas produced by PM gasification, measured with the flow-through gas analyzer and the gas chromatograph (marked with an asterisk *) in several experiments.
| Exp.# | СО2 vol.% |
СО vol.% |
Н2 vol.% |
СН4 vol.% |
СхНy vol.% |
N2 vol.% |
C2H4 vol.% |
C2H6 vol.% |
C3H8 vol.% |
| 9 | 41.3 | 34.7 | 18.7 | 2.5 | 2.2 | - | - | - | - |
| 9* | 40.5 | 31.6 | 23.3 | 1.4 | - | 1.7 | 0.52 | 0.86 | 0.03 |
| 10 | 32.4 | 41.4 | 20 | 3.6 | 2.5 | - | - | - | - |
| 10* | 28.3 | 39.5 | 26.1 | 1.9 | - | 2.0 | 0.84 | 1.34 | 0.05 |
| 11 | 38.7 | 37 | 18.7 | 3.5 | 1.9 | - | - | - | - |
| 11* | 37.8 | 33.2 | 24.1 | 1.8 | - | 0.97 | 0.76 | 1.08 | 0.07 |
| 12 | 34.7 | 39.3 | 19.4 | 4 | 2.5 | - | - | - | - |
| 12* | 34.5 | 35.6 | 24.4 | 2.1 | - | 0.79 | 1.03 | 1.47 | 0.1 |
Table 15.
Elemental composition of the solid residue.
| Exp.# |
mg |
C wt.% |
H wt.% |
N wt.% |
Ash wt.% |
Σel. wt.% |
O wt.% (100%- Σel.,%) |
| 9 | 5.494 | 29.60 | 1.63 | 1.64 | 59.63 | 92.50 | 7.50 |
| 10 | 3.788 | 42.13 | 1.98 | 2.12 | 46.78 | 93.01 | 6.99 |
Table 16.
Comparison of calculated (equilibrium) and measured compositions of the dry off-gas at a gasification temperature of 1000 K and a gasification pressure of 0.1 MPa.
Table 16.
Comparison of calculated (equilibrium) and measured compositions of the dry off-gas at a gasification temperature of 1000 K and a gasification pressure of 0.1 MPa.
| Description | СО2, vol.% |
СО, vol.% |
H2, vol.% |
СH4, vol.% |
СxHy, vol.% |
N2, vol.% |
| Calculation () | 10 | 45 | 41 | - | - | 4 |
| Exp. #8 () | 32.7 | 42.1 | 21.1 | 3.6 | 0.5 | - |
| Exp. #10 () | 32.4 | 41.4 | 20 | 3.6 | 2.5 | - |
| Exp. #15 () | 42 | 33.3 | 17.9 | 4.3 | 2.6 | - |
| Exp. #16 () | 39.5 | 34.6 | 17.1 | 6.0 | 2.9 | - |
| Exp. #19 () | 25.7 | 44 | 24.2 | 4.5 | 2.5 | - |
| GA | ~100 | 0 | 0 | 0 | 0 | 0 |
Disclaimer/Publisher’s Note: The statements, opinions and data contained in all publications are solely those of the individual author(s) and contributor(s) and not of MDPI and/or the editor(s). MDPI and/or the editor(s) disclaim responsibility for any injury to people or property resulting from any ideas, methods, instructions or products referred to in the content. |
© 2025 by the authors. Licensee MDPI, Basel, Switzerland. This article is an open access article distributed under the terms and conditions of the Creative Commons Attribution (CC BY) license (http://creativecommons.org/licenses/by/4.0/).
Copyright: This open access article is published under a Creative Commons CC BY 4.0 license, which permit the free download, distribution, and reuse, provided that the author and preprint are cited in any reuse.


