
Submitted:
31 March 2025
Posted:
08 April 2025
You are already at the latest version
Abstract
The 8.19M ha Northern Rockies Ecoregion (NRE) of western Montana, northeastern Washington, and northern Idaho, USA, includes the 159,822 Yaak River Watershed (YRW) in northwest Montana, a proposed climate refugium. Regional climate projections show the NRE heating up, experiencing reduced summer precipitation, lowered spring snowpack, and increased wildfires, especially under a very high emissions pathway. Large-scale conservation proposals have stalled for decades, in part, due to the lack of an integrated approach to conservation target setting (e.g., 30% protected by 2030, 50% by 2050) that simultaneously addresses climate change planning and especially wildfire risk reduction. We conducted a comprehensive ecoregional conservation assessment that showed overall protection levels were quite low in the NRE (2.2% in GAP 1 or 2) and even lower in the YRW (1% of national forests, the USDA Forest Service manages most of the area). Approximately 32% of NRE forests are mature but only 2.4% is protected (GAP 1 or 2) with just 0.25% of mature forests protected within the YRW. Of the 8 focal forest species examined, habitat protection for all of them were well-below conservation targets with only wolverine (Gulo gulo) meeting the targets if roadless areas were better protected. Most (~75%) Forest Service fuel reduction treatments were >1 km from structures despite congressional funds aimed at the wildland-urban interface/intermix. Increased roadless area protections would close the lower bound (30%) conservation target for most ecosystem types, mature forests, and focal species but fall short of higher targets. We recommend coupling conservation targets with strategic investments in fuel reductions aimed at the innermost buffer around structures, while reducing logging and roadbuilding in priority areas.
Keywords:
climate refugia
; conifer forests
; Northern Rockies
; protected areas
1. Introduction
The 8.19M ha Northern Rockies Ecoregion (NRE) [1] is a northwest-southeast oriented montane landscape north of the Snake River Basin in Idaho, extending into western Montana and northeastern Washington, USA. The NRE is fully contained within World Wildlife Fund’s North Central Rockies Forest Ecoregion #30, ranked as bioregionally outstanding and vulnerable; however, the WWF ecoregion crosses into southeastern British Columbia and extreme southwestern corner of Alberta [2]. NatureServe [3] defined the area as the Northern Rocky Mountain Dry-Mesic Montane Mixed Conifer Forest that contains all the NRE but also overlaps with inland British Columbia. The conservation group, One Earth [4], placed the NRE into its Northern Rockies Conifer Forests (NA 13) that straddles Central British Columbia and western Alberta. Importantly, the USDA Forest Service’s ecological unit M333 (Northern Rocky Mountain Forest-Steppe-Coniferous Forest-Alpine Meadow) [5] is almost entirely (~95%) within the NRE, which provides opportunities to engage in large-scale conservation with the largest landowner.
While elevations in this portion of the Rockies are generally lower than in the Southern Rockies [6], vertical zonation in the NRE results in high levels of beta diversity with plant and animal communities (i.e., life zones; see [7]) transitioning from foothill grassland and shrublands to conifer forests at mid- to upper elevations and alpine areas at mountaintops. Notably, the NRE supports a full suite of large carnivores (e.g., grizzly bear Ursus arctos horribilis, gray wolf Canis lupus), many rare and endemic plants (e.g., [8]), and several species of conservation concern at risk from anthropogenic habitat loss (e.g., [7]).
Temperature increases and changes in precipitation in the NRE have thus far resulted in glacial retreat and declining summer stream flows [9]. Increased drought stress on forests [10], including more wildfires [11] and climate-driven bark beetle (Coleoptera) outbreaks [12] are growing concerns. If managers are going to effectively conserve biodiversity under these challenging conditions, climate change strategies need to integrate principles of conservation biology (i.e., reserve design, connectivity, focal species conservation) with adaptive management that provides species and ecosystems with the best potential for persistence [6,13,14,15].
Adaptation strategies also need to identify specific traits that potentially confer resistance and/or resilience to climate-induced natural disturbances [16]. An example is genetic adaptations of conifers that ostensibly resist mountain pine beetle (Dendroctonus ponderosae) outbreaks [12]. Additionally, it is important to protect and restore landscape connectivity to support climate-induced wildlife movements [13], and to identify biophysical properties of areas that may act as climate refugia [17,18]. Old-growth forests generally have refugia properties because they provide cooler and moister conditions than surrounding logged areas [19] and they may also function as wildfire refugia [20]. Slope position (e.g., north-facing), elevation (e.g., upper elevation), and associated climatic gradients (e.g., high precipitation on windward slopes) also may present refugia [17]. Notably, conservation groups [21] have proposed specific areas within the Yaak River Watershed (YRW) in northwestern Montana as climate refugia within the NRE because the watershed contains intact landscapes that may function as corridors for wildlife movements and old-growth forests. However, the conservation importance of refugia within the NRE generally and YRW specifically have not been sufficiently mapped or described. There is an urgent need to do so given that several adjoining timber sales and road building projects are concentrated in the YRW within an area known as Black Ram (NW Yaak) [22] (Figure S1) that is thought to provide refugium characteristics.
Large-scale conservation proposals such as 30 x 30 (30% protected by 2030) and 50 x 50 (50% by 2050) have been adopted globally and regionally to stem the loss of biodiversity from anthropogenic disturbances especially in a rapidly changing climate [23,24]. In the Northern Rockies this includes the cross-border Yellowstone to Yukon Conservation (Y2Y) Initiative [25] and the Northern Rockies Ecosystem Protection Act (NREPA. S.1276) [26]. One Earth called for protecting >60% of the Northern Rockies Conifer Forests to achieve broad-scale representation targets [4], while others have been calling for 100% protection of mature and old-growth forests on federal lands [27].
Our objective was to conduct a multi-scaled ecoregional conservation assessment (ECA) for the NRE that incorporates conservation target setting (e.g., 30, 50, 100%) for both the NRE and the YRW. Our work is informed by similar ECAs for the Mogollon Highlands [14] and the Southern Rockies [6]. In these studies, we evaluated conservation targets at two spatial scales (ecoregion and proposed refugium), which revealed important distinctions by way of context. It is also necessary to demonstrate the compatibility of large-scale conservation proposals in relation to effective wildfire-risk reduction for communities living within the wildland-urban interface/intermix (WUI) [28] and for general climate change planning. This integration step is especially relevant given that many conservation proposals have stalled for decades (e.g., NREPA), in part, over concerns about ‘active management’ aimed at mitigating wildfires and insect outbreaks primarily through logging and road building.
ECAs are built on fundamental principles of conservation biology that include biophysical and focal species target setting [29] conducted at multiple scales [6,14]. Correspondingly, we selected 8 focal species that reflect priority habitats (e.g., mature/old-growth forests) and have conservation status as state or federal species of concern such as the Northern Goshawk (Accipter gentilis), Boreal Owl (Aegolius funerus), Great Gray Owl (Strix nebulosi), fisher (Pekania pennanti), and American marten (Martes americana). Grizzly bear, Canada lynx (Lynx canadensis), and wolverine (Gulo gulo) were also selected because of their federal listing status (threatened) and they have landscape connectivity needs. Finally, we examined the degree of overlap in habitat suitability of focal species in setting multi-species conservation targets. As with the two previously published ECAs (Mogollon Highlands, Southern Rockies, [6,14]), our approach may be exportable to other ecoregions facing similar challenges that could benefit by integrating protection targets with wildfire risk reduction and climate change planning.
2. Materials and Methods
2.1. Study Area
As in DellaSala et al. [6,14], we used the U.S. Environmental Protection Agency Level III ecoregional classifications to map the NRE [30] (Figure 1). The study area boundary was confirmed by regional experts during a September 2024 workshop and the importance of the YRW further identified as a potential refugium by workshop experts.
The NRE was glaciated during the Pleistocene until around 11,400-years BP [31]. The ecoregion contains 38 HUC-8 watersheds, one of which is the YRW (Table S1). While we analyzed the entire ecoregion regarding the conservation targets, we zoomed in to only the 159,822 ha YRW due to requests from conservation groups that are proposing the area as refugium for protection and because litigation has suspended logging in the Black Ram portion of the YRW while the agency prepares an environmental impact statement [22].
The western portion of the NRE generally has a Pacific maritime climate with drier-continental influences in the east [32]. The region’s montane-topographical differences result in windward deposits of precipitation and leeward drier and continental conditions. For example, in the Montana portion of the NRE, the annual precipitation ranges from <18 mm in lowlands and southerly areas to >90 mm in upper, leeward facing slopes [33]. Further information on the climate and fire regimes of the NRE is available through the Joint Fire Science Program Fire Science Brief [32].
2.2. Mapping Methods
We clipped all spatial datasets to the study area and re-projected to a CONUS Albers projection (EPSG:5070) using QGIS version 3.36 [34] (Figure 2). To reduce processing time, we converted any vector datasets to 30-m raster datasets aligned with LANDFIRE (2022, LF 2.3.0) rasters. These and any datasets that were originally rasters were clipped, reprojected, and aligned so that all raster datasets had the same parameters except for pixel values. Using Python 3.12 [35], we then combined all the rasters into a stacked virtual raster and calculated the area for each unique combination of stacked pixel values. Data were stored in a SQLite database where each combination of pixel values could be parsed and filtered as needed. This approach allowed us to easily combine over 20 rasters representing different metrics such as surface ownership, vegetation type, forest structure class, etc. This also allowed us to extract Gap Analysis Project (GAP) Status Code information at both the NRE and YRW scale across different metrics and combination of metrics using SQL queries via the sqlite3 [36] and pandas [37] libraries in Python. The only exception to this approach was our analysis involving USDA Forest Service fuel reduction activities and WUI distribution, which was conducted using geospatial tools entirely within QGIS (see below).
2.3. Land Ownership and GAP Status
We used surface landowner data from the U.S. Geological Survey (USGS) Protected Areas Database, PAD-US 4.0 (PAD) to assess levels of protection at the two spatial scales and for focal species habitat. We grouped ownership polygons into 13 landowner categories (Figure 1 some groups combined). We also included national forest boundaries where necessary that were obtained from the USDA Forest Service Enterprise Data Warehouse as described in DellaSala et al. [6,14].
Similarly to DellaSala et al. [6,14] we extracted USGS Gap Analysis Project (GAP) status codes 1-4 from the PAD. GAP status codes are assigned based on degrees of protection, with GAP 1 (permanent protection, e.g., designated wilderness and national parks) and GAP 2 (maintained primarily in natural state, e.g., national monuments and wildlife refuges) having the highest protection vs. GAP 3 (extractive use) and GAP 4 (private lands with no protections) (see [38]). We also obtained the USDA Forest Service Inventoried Roadless Area (IRA) dataset from the national dataset for IRAs as applied in Montana and Washington (2001 Roadless Area Conservation Rule) and in Idaho (2008 Idaho Roadless Area Rule) from the PAD. Despite differences between the national and Idaho conservation rules, we considered both types of IRAs to have enhanced protection beyond what is typical for GAP 3 status and therefore assigned them a GAP status of 2.5 (also see [6,14]. Because the PAD includes multiple datasets with areas potentially overlaid by multiple GAP statuses, we intersected overlapping polygons and retained the highest level of protection for any given area before rasterizing the dataset. However, we ensured that private inholdings surrounded by Wild and Scenic River corridors, Wilderness areas, and other protected areas were not assigned a GAP status lower than GAP4 unless the inholdings themselves are specially protected by a non-governmental entity according to the PAD.
We obtained proposed Wilderness areas included in the NREPA that overlapped with the NRE (1.18M ha). We created a separate GAP status dataset with Wilderness adjustments that assume NREPA becomes law. We then calculated the GAP status distribution across the NRE and YRW under this scenario.
2.4. Existing Vegetation Types
A description of the vegetation and forest types within the NRE is summarized in the Northern Rockies Fire Science Network [39] and in Weber [40]. In general, conifer forests, the primary vegetation target of our ECA, include Rocky Mountain Douglas-fir (Pseudotsuga menziesii var. glauca), subalpine fir (Abies lasiocarpa), Engelmann spruce (Picea engelmannii) western larch (Larix occidentalis), lodgepole pine (Pinus contorta subsp. latifolia), and ponderosa pine (Pinus ponderosa) with elements of Pacific maritime species present in western redcedar (Thuja plicata), western hemlock (Tsuga heterophylla), mountain hemlock (Tsuga mertensiana), and grand fir (Abies grandis).
For Existing Vegetation Types (EVT), we accessed LANDFIRE (2023, LF 2.4.0), which represents the current distribution of terrestrial ecological systems as developed by NatureServe for the western hemisphere. There are over 61 EVT represented in the NRE, 44 of which occur in the YRW (Table S3). To simplify our EVT analyses, we grouped EVT into 15 broader categories that represent consolidated forest types, shrubland, grassland, and other land covers. This allowed us to also focus on the forest types preferred by our focal species, including ponderosa, dry-mesic mixed conifer, mesic mixed conifer, lodgepole pine, subalpine, western larch, and quaking aspen (Populus tremuloides). While the NRE is dominated by dry-mesic mixed conifer (27.7%) and mesic mixed conifer (27.3%), the YRW is dominated by mesic mixed conifer (46.8%) and subalpine (22%).
2.5. Forest Structural Maturity Classes
We obtained forest maturity data for the NRE and YRW from DellaSala et al. [29], who delineated mature and old-growth (MOG) forest distribution at 30-m resolution across the conterminous United States (Table S4). We grouped the nine forest structure classes in the dataset into three broad maturity classes: young, intermediate, and mature forests. As in DellaSala et al. [6], we screened areas that burned at high severity (> 75% tree mortality) relatively recently due to the DellaSala et al. [29] dataset being constructed from proxies (tree height, canopy cover, and aboveground biomass) that were collected several years prior. We collected relativized delta normalized burn ratio (RdNBR) data from the Monitoring Trends in Burn Severity dataset for wildfires that occurred within the study area from 2012 to 2022. For wildfires that occurred in 2023 (which at the time of our analysis were not in the MTBS database), we used fire severity data from the four-class composite burn index (CBI-4) in the USDA Forest Service’s Rapid Assessment of Vegetation Condition after Wildfire (RAVG) database. Any 30-m pixels within our study area that burned at high severity between 2012 and 2023, or which were classified as “unprocessed” (primarily due to cloud cover or the Landsat 7 Scan Line Corrector error according to these datasets, were not assigned one of the three broad forest maturity classes.
We combined these forest maturity data with our EVT data to examine the proportion of each forest type that is mature and then the proportion of mature stands within each EVT type that is protected (with and without IRAs included). We conducted this analysis at both the NRE and YRW scale.
2.6. Focal Wildlife Species Habitat Suitability
We obtained 30-m resolution habitat suitability data for all focal species except grizzly bear from the 2001 GAP dataset. While these habitat suitability data are older, they are largely based on relatively stable biophysical conditions. We conducted a GAP representation analysis for all species separately (Table S5, S6), but we grouped forest carnivores (Canada lynx, American marten, fisher, and wolverine) and birds (Boreal Owl, Great Gray Owl, and Northern Goshawk) together in tables and maps, and conducted a representation analysis for areas where all or most species’ suitable habitat overlapped. For forest carnivores, we did this for areas where all four species overlapped as well as where just Canada lynx, American marten, and fisher overlapped as the extent of wolverine habitat is much more limited at both the NRE and YRW scale and we did not want to limit such an overlap analysis to the more specialized high elevation and cirque habitat used by wolverine. For birds, we analyzed the overlap of suitable habitat for all three focal species. We combined habitat suitability levels (e.g. winter only, summer and winter) in the 2001 GAP dataset into binary suitable or unsuitable levels for our analysis.
Unlike DellaSala et al. [6], for focal species habitat, we chose not to censor areas that burned at high severity since the GAP habitat suitability datasets were created due to the limited spatial extent of high severity fire in their habitats (2.6% to 9.7% with an average of 3.9% overlap with suitable habitat across the 8 species). And while there is a paucity of studies that have examined occupancy or habitat selection and use within high severity patches by species such as wolverine and Boreal Owl, the scientific literature is mixed on the extent of high severity fire impacts to other species both spatially and temporally [41,42]. For example, some studies have found that fisher utilize forests recently burned at high severity [43,44] while others have found no clear patterns in use of such areas [42] or that fisher avoid areas burned at higher severity [45].
For grizzly bear, we conducted a GAP representation analysis using the denning suitability habitat dataset created by Bader and Sieracki [46]. This dataset was created using 364 verified den sites across northern Idaho and western Montana and modeling with several continuous environmental variables such as snow accumulation and depth, elevation, aspect, slope, distance to roads, and EVT. Denning habitat suitability was predicted at 10-m resolution across our study area and categorized as low, medium, and high suitability. We resampled these denning habitat suitability data to 30-m resolution to match our other raster datasets before stacking in the virtual raster.
2.7. Fire, Wildland-Urban Interface, and Mechanical Fuel Treatments
Similarly to DellaSala et al. [6], we extracted low, medium, and high-density wildland-urban interface and intermix (six categories total) geospatial data, representing WUI distribution as of 2020, from the dataset produced by Radeloff et al. [28]. We then clipped the extracted WUI data to the NRE and rasterized the vector using the same methods as described above for the PAD and other vector datasets to be incorporated into the stacked virtual raster.
From the USDA Forest Service’s Forest Activities Tracking System (FACTS) hazardous fuels dataset, we extracted all fuel reduction activity polygons with a treatment type of chipping, crushing, mastication/mowing, broadcast burn, jackpot burn, machine pile burn, or mechanical thinning completed over the previous 20 years from 2005 to 2024. We did not incorporate activity polygons from the timber harvest or timber stand improvement datasets within FACTS as those do not necessarily represent USDA Forest Service activities aimed at wildfire mitigation. The hazardous fuels dataset also includes precommercial thinning or commercial thinning entries, and many of those same polygons are also in the other datasets within FACTS. We clipped all activity polygons meeting the above criteria to the NRE and grouped them into three primary categories: 1) chipping, crushing, and mastication, 2) prescribed fire (which includes pile burning), and 3) thinning. We dissolved the polygons by category and then created another dataset where all polygons were dissolved regardless of category, which gave us the total treatment footprint. We did this because some areas received multiple overlapping treatments (e.g. thinned in one year and then burned in another year) and we wanted to spatially analyze the data both by treatment category and by the overall treatment footprint.
To determine where treatments were implemented in spatial relation to WUI distribution, we separately clipped our dissolved WUI categories to the NRE but with a 1,000 m buffer applied. This ensured that any areas within the NRE but adjacent to WUI located immediately outside of the NRE boundary was considered. We created four multi-ring buffers at 250 m intervals (250, 500, 750, and 1,000) around this dissolved WUI layer. We then intersected our three dissolved fuel treatment layers as well as the total treatment footprint layer with these WUI buffers to calculate the area of fuel treatments that occur in proximity to WUI.
As an additional estimate of the proximity of USDA Forest Service fuel treatments to structures, we obtained geospatial data for all structures located within the NRE as well as within 1 km of the ecoregion boundary from the Microsoft U.S. Building Footprints dataset [47], which has been used by others in mapping WUI [48]. This dataset contains polygons matching each structure on the landscape detected from high resolution satellite imagery and which has a 99% precision rate and a recall of 94% based on a 15,000-building evaluation dataset. Because the dataset contains thousands of polygons, we derived centroids from all polygons to use in the remaining steps to reduce processing time. We applied a 1-km buffer to all structure (e.g. homes, commercial buildings, recreation facilities) centroids, dissolved the buffer, and clipped it to the NRE. We then calculated the proportion of the total fuel treatment footprint that was either within or beyond 1-km from a structure centroid. The NRE contains various forest treatments within the WUI, buffer zones, structures (e.g., Figure 3).
2.8. Climate Change Analysis
All climate and hydrology projection data used in our study are based on two phases of the Coupled Model Intercomparison Project: Phases 5 and 6 (CMIP5; CMIP6) [49,50] output. The CMIP5 modeling effort established common future climate scenarios, called representative concentration pathways (RCPs), for which each global climate model (GCM) was forced to determine how future climate conditions may change. The CMIP6 modeling effort updated these to shared socio-economic pathways (SSPs) that are roughly comparable to RCPs except they have socio-political narratives attached to each scenario. Here, we assess two scenarios for the CMIP5 metrics and two scenarios for the CMIP6 metrics: RCP 4.5 and RCP 8.5, and SSP245 and SSP585. Because RCP 4.5 and SSP245 have less greenhouse gas emissions than RCP 8.5 and SSP585, we refer to the former scenarios as “intermediate” and the latter as “very high” future climate change scenarios in accordance with nomenclature used in the national climate reports IPCC AR5 [51] and IPCC AR6 [52]
The GCM projection output from the CMIP models has a coarse resolution, typically greater 1° latitude x 1° longitude, and as a result does not provide relevant information on regional scales. To make these projections more relevant at regional scales, these GCM projections have been “downscaled” to a finer resolution through several methods. The two methods used to downscale the data included in this study are statistical downscaling, which uses statistical methods to interpolate data to a finer scale, and dynamical downscaling, which uses a finer resolution regional climate model that is forced by the larger global climate model output. The LOCA2 dataset, which we use to assess several of the climate indicators in this study, is a statistically downscaled dataset that uses observations to downscale and bias-correct the global climate model projections from the CMIP6 modeling efforts. The LOCA2 method matches large-scale atmospheric patterns in the global climate model output and observations to the observed conditions on the ground to bias-correct the global climate model data. We use a dataset of hydrologic projections, referred to as the RMJOC-II dataset, to better understand snowpack and winter precipitation changes in the NRE. This dataset uses two statistically downscaled GCM projection datasets based on the CMIP5 models, MACAv2-Livneh and the bias-correction and spatial disaggregation (BCSD) dataset, to run two different hydrology models: the Variable Infiltration Capacity (VIC) model and the Precipitation and Runoff Modeling System (PRMS). It also includes four different calibrations of these hydrologic models to create a suite of hydrologic simulations. Finally, we used output from the MC2 regional vegetation model forced by CMIP5 projection data from [53] to better understand current wildfire conditions in the NRE and how this is projected to change in the future. We use the CMIP6-based climate projection data (LOCA2) for all temperature and precipitation metrics, and the CMIP5-based climate projection data otherwise (RMJOC-II and MC2) due to the lack of publicly available dynamically downscaled CMIP6 hydrologic and wildfire-focused datasets. The climate metrics evaluated, datasets used to calculate them, and the climate impacts they indicate can be found in Table S7.
3. Results
3.1. Landownerships and Conservation Targets
Overall protection levels for the NRE across landownerships are quite low, with only 2.2% in GAP 1 or 2 and 16.1% in IRA+ (Figure 4, Table S8). The predominant (44.5%) landowner is the USDA Forest Service followed by private landowners (33.3%), tribal (14%), state (6.8%), and other jurisdictions (Table S8). The four major landowners comprised 98.6% of all ownerships in the NRE, and all 4 of them were well below the lower bound conservation target of 30% (Figure 4, Table S8). Only 2.8% of national forests (USDA Forest Service) within the NRE is protected (GAP 1 and 2), though the addition of stronger protections for IRAs (i.e., herein IRA+) would bring this total to 33.9% protected, which still leaves a substantial gap to reach 50% protected. If the NREPA becomes law, the proportion of the NRE in GAP 1 or 2 would increase to 16.2% or 17% if IRA+ are included.
By contrast, the YRW is almost entirely owned by the USDA Forest Service (96.5%), with minor private and local government ownership (Table S8). Only 1% of national forests in the YRW is protected; however, IRA+ would approach the lower bound target at 28.1% (Table S8). In the YRW, the passage of NREPA would increase the lands protected to 29.2% with no change if IRA+ are included given they already are in NREPA. The minimal differences in the proportion of land considered protected under the NREPA scenario regardless of whether IRAs are included is because the legislation would primarily convert IRAs to designated Wilderness (GAP 1).
3.2. Existing Vegetation Types and Conservation Targets
Protection levels were generally low across the five most abundant EVT that comprise 81% of the NRE (Table 1). Only 1.4% and 2.2% of dry-mesic mixed conifer and mesic mixed conifer, respectively, are protected. IRA+ would increase protections to 10.3% and 21.5%, still well below the 30% target. While less abundant (only 6.4% of the NRE), ponderosa pine had similarly low levels of protection at 1.4% and a minimal increase to 3.1% with IRA+. Nonforest EVT such as shrubland also have low levels of protection (2.5% currently protected, 13.5% in IRA+). Conversely, higher elevation EVT such as subalpine (comprised of subalpine spruce-fir and subalpine woodland and parkland) and unvegetated or sparse (alpine, snow and ice) would increase to >40% protected with IRA+. In fact, subalpine spruce-fir, which is the fifth most abundant EVT category, was the only one in the NRE that meets both conservation targets if IRA+ are included (53.8%).
For the YRW, the five most abundant EVT categories comprise 95% of the total area, and all have even lower levels of protection, with only 0.1% and 2.7% of mesic mixed conifer and subalpine, respectively, protected (Table 1). IRA+ would increase protection to 19.4% and 55.2%, respectively. Lodgepole pine would similarly increase from 0.2% protected to 42% protected with IRA+ and dry-mesic mixed conifer would increase from 0.2% to 22.1%, again demonstrating that lower elevation forests are generally less protected than those at higher elevations. Interestingly, shrubland protections in the YRW would increase from 7.9% to 47.2% with IRA+, although this EVT category only accounts for 2.6% of the total area. Likewise, the other types either did not meet the targets or had small areas (e.g., sparse). Notably, important EVT such as riparian and wetland are below conservation targets regardless of whether IRA+ is included.
3.3. Mature Forests and Conservation Targets
Approximately 32% of forests in the NRE is considered structurally mature [27] but with similarly low levels of protection (Table 2, Figure S2). None of the mature forest types in the NRE are meeting any of the conservation targets (< 5% protected); however, including IRA+ would bring lodgepole pine and subalpine mature forests to > 50% protected. Interestingly, ponderosa pine has the lowest levels of mature forest protection regardless of whether IRA+ is included.
The dominant type of mature forest in the YRW is mesic mixed conifer, yet almost none of it is protected unless IRA+ is included (0.2% vs 24%). This is the case with most mature forest types in the YRW that only have protection levels of ≤ 0.5% (Table 2). As in the NRE, mature lodgepole pine and subalpine are the only forests that meet the 50% target, but only if IRA+ is included.
3.4. Focal Mammal Species Habitat Suitability and Conservation Targets
Except for wolverine, focal forest carnivores have abundant suitable habitat in the NRE and the YRW (see Figure S3-8, Table 3). Canada lynx has the largest distribution of suitable habitat across the NRE (4.58M ha), but only 2.7% is protected (Table 3). IRA+ would increase protection to 24.5% in the NRE, which is still well short of both conserva-tion targets, and 30.7% in the YRW. American marten and fisher habitat mostly overlaps, with all fisher suitable habitat also suitable for American marten, although there is an additional 849,900 ha of American marten habitat that is not considered suitable for fisher. Both species’ suitable habitat levels have similar amounts of protection, with 2.7% to 3% protected for fisher and American marten, respectively. The inclusion of IRAs brings these levels to 31.2% and 30% with a large gap to 50%.
Only 1% of suitable habitat for each focal mammal carnivore species in the YRW is protected, but again, inclusion of IRA+ would increase protection to 31.5% and 33.9% for fisher and American marten, respectively. In contrast, wolverine suitable habitat is confined to high elevation areas and only covers ~179,000 ha across the NRE with 7,873 ha in the YRW. However, protection levels for wolverine habitat are greater than other forest carnivores, with 10.1% and 11.6% protected in the NRE and YRW, respectively. IRA+ substantially increases protection to 70.9% and 74.9%, in the NRE and YRW, respectively, generally meeting both conservation targets for this species.
There are ~1.7M ha suitable for Canada lynx, fisher, and American marten across the NRE and 77,823 ha in the YRW (Table 3). Without increased protections for IRAs, the area suitable for all three species is only 2.9% and 1% protected in the NRE and YRW, respectively. IRA+ would increase protection to 34.5% and 32.7% in the NRE and YRW, respectively, but fall below the 50% target. Where all four forest carnivore species have overlapping suitable habitat (> 89,000 ha in the NRE and > 4,000 ha in the YRW), protection levels are generally greater, especially with IRA+ included (> 70% at both scales).
The three tiers of suitable denning habitat for grizzly bear all have protection levels that fail to meet either conservation target unless IRA+ is included. There is >2M ha of suitable grizzly bear denning habitat across the NRE, 62.3% of which is considered low suitability while 8.7% is considered high suitability. Areas considered higher suitability are generally more protected (13.7% in high vs 2.7% in low), but only 4.6% of all suitable denning habitat is protected (Table 3). IRA+ would increase this to 47% across the NRE, which is close to meeting upper bound conservation targets. These patterns are similar in the YRW, where there are 65,680 ha of suitable grizzly bear habitat (8.6% of which is considered high suitability). And while all suitable denning habitat is only 2.2% protected in the YRW, IRA+ would increase this to >55%, meeting conservation targets.
3.5. Focal Avian Species Habitat Suitability and Conservation Targets
Between 4.0M and 5.6M ha across the NRE and >130,000 ha in the YRW is suitable habitat for Boreal Owl, Great Gray Owl, and Northern Goshawk (see Figure S9-12, Table 3). All three species have similarly low levels of suitable habitat protection (2.4 to 3.1% in the NRE and around 1% in the YRW). IRA+ would increase protection levels to ~20% in the NRE and 31% in the YRW. Across the entire ecoregion, Boreal Owl stands the most to gain by enhanced IRA protections (23.7%) but would still fall short of conservation targets.
All three species have substantial amounts of overlapping suitable habitat as well. However, only 3% of the 3.3M ha in the NRE that are suitable for the focal avian species is protected (Table 3). IRA+ would increase protection levels of overlapping suitable habitat to 25.5%, which is still below the targets. Most of the habitat suitable for any one focal avian species in the YRW is also suitable for the other two species (Table S6). Less than 1% of this overlapping habitat in the YRW is protected, but IRA+ would meet the 30% target by increasing protection levels to 34%.
3.6. Wildland Urban Interface and Fuel Treatments
Most (77.2%) of the 584,739 ha of WUI in the NRE is classified as low density intermix, which has the lowest housing density of any of the six WUI classes (Figure 5). Notably, development is concentrated around the Spokane, Washington metropolitan area, the U.S. Route 95 corridor in Idaho, and the Kalispell area in Montana. Less than 1.3% of all WUI in the NRE is classified as high density interface or intermix. Interestingly, there is only 2,582 ha of WUI in the YRW, 99.8% of this is classified as low density intermix. There also are at least 574,277 structures within the NRE and only 795 structures within the YRW.
Most of the USDA Forest Service fuel treatment activities in the NRE and YRW include prescribed fires (which includes pile burning) and thinning (including commercial operations), with some chipping, crushing, and mastication in the NRE and a nominal amount in the YRW (Figure 6 and Table S9). Nearly 83% of the total treatment footprint in the NRE is beyond 1 km from WUI. In comparison, more of the total treatment footprint in the YRW is between 250 m and 1 km from any WUI type, with 65.5% >1 km from WUI. This is due largely to more prescribed fire within closerS7 proximity to WUI areas within the YRW. At both spatial scales, 74.5% to 78.5% of thinning treatments are >1 km from WUI.
When considering proximity of fuel treatments to structures in general, regardless of WUI classification, nearly 75% of the total treatment footprint (all types) is >1 km from a structure across the NRE. Interestingly, 65.5% of the total treatment footprint is >1 km from structures in the YRW, which is the same as when WUI buffers are used, likely due to the relatively small number of structures within the watershed and because they are all generally in areas classified as WUI.
3.7. Historical vs. Projected Climate Change Under the Intermediate vs. Very High Emissions Scenarios
The severity of climate-related impacts that the NRE and YRW is projected to experience depends, in part, on greenhouse gas emissions over the coming decades. However, the climate related impacts in the near-term (through the 2040-2059 period) are relatively similar for both the intermediate and very high climate scenarios (Figure 7). Under the intermediate emissions scenario (SSP2-45), the projected change in growing degree days shows an increase in the NRE, mainly at lower elevations. The YRW largely maintains its climate refugium conditions until the 2040-2069 period. Thereafter, the projected increase in growing degree days for both the ecoregion and watershed accelerates under the very high emissions scenario (SSP5-85, Figure 7, Table 4). Notably, by the 2070-2099 period, the model median change in growing degree days for the very high scenario is nearly twice the change for the intermediate scenario.
Other temperature-based climate indicators show similar behavior in the intermediate and very high climate scenarios for the NRE. Median summer maximum temperature is projected to increase steadily, and in a spatially consistent manner, under both the intermediate and very high future climate scenarios, with more increase in the very high climate scenario towards the end of the century (2070-2099) (Figure 8). The two future scenarios again diverge in the 2040-2069 period, with the intermediate scenario projecting a model median increase of 3.0°C and the very high scenario projecting an increase of 4.2°C (Table 4). Summer maximum temperatures can be an important indicator of heat stress on a refugium. More frequent and severe heat places more stress on the ecosystem of the NRE. The YRW; however, maintains its refugium conditions for longer periods under both scenarios compared to the NRE writ-large (Figure 8, also see Figure S14).
Total summer precipitation is projected to decline throughout the NRE in both future climate scenarios (Figure 8). The intermediate and very high climate scenarios project similar decreases for the 2010-2039 but diverge in their expected change for later in the century, with the higher scenario projecting more summer precipitation decrease in the 2040-2069 and 2070-2099 periods throughout the NRE. The change in total summer precipitation can indicate the amount of water readily available for a local refugium during times of heat stress. Though the YRW is projected to experience less reduction in total summer precipitation than the surrounding areas in the NRE, refugia properties are still expected to decline by the late century due to this projected reduction in summer precipitation. By the 2070-2099 period, the model median change in total summer precipitation is projected to be -24% under the very high climate scenario and -18% under the intermediate climate scenario. The model results for summer precipitation vary in their signs of change, which indicates lower confidence in these results. However, slight variations in summer precipitation and could have implications for the survivability of organisms that are sensitive to these changes, such as temperate rainforest lichens that occur in the wetter areas.
Winter precipitation in the NRE has been predominately snowfall. With future warming, that is expected to shift for the two climate scenarios, summarized to the 8-digit hydrologic unit codes that overlap the NRE (Figure 10). The dominant winter precipitation for the YRW also historically has been snow, and surface-water runoff typically peaks in the spring and summer in accordance with peak snowmelt for this part of the NRE (Figure 9). Under both the intermediate (RCP 4.5) and very high (RCP 8.5) scenarios, snow is projected to remain consistent until the 2070-2099 period, when projections for the YRW show more mixed rain-snow dominance. The shift to more rain in winter increases risks for winter flooding and leads to less water available as snowmelt in the spring and early summer. Such changes can impact the local refugium in the YRW by increasing risks for flooding in the winter and decreasing the availability of water in the spring and early summer.
Importantly, the combination of increasing temperatures (Figure 7,8) and precipitation changes (Figure 9, 10) are expected to contribute to an increase in wildfire susceptibility throughout the century in the NRE (Figure 11). This risk is projected to increase mostly in the western and southwestern sections of the NRE, with the YRW being largely spared in the 2020-2049 and 2040-2069 periods regardless of future scenario. Refugia properties are expected to be maintained through the late century due to the small projected change in wildfire susceptibility for the YRW, even under the high climate scenario (RCP 8.5)
4. Discussion
4.1. Representation Targets for EVT, Focal Species, Mature Forests
The ECA generally shows how little is protected across the 8.19M ha Northern Rockies Ecoregion and the 159,822-ha proposed climate refugium of the Yaak River Watershed for most of the EVT, mature forests, and focal species. While there are scale differences between the Southern Rockies Ecoregion-Santa Fe Subregion [6] and the Northern Rockies Ecoregion-Yaak River Watershed, the pattern of poor 30% and 50% conservation target performance at the ecoregional scale and much worse performance at finer-scales was repeated. Like the Southern Rockies ECA, elevating roadless area protections through legislation (e.g., NREPA) and administrative measures (e.g., national monument designations) would contribute important additions to many of the targets but would still fall short for most others. For instance, mature forests and low elevation forests are important habitat for most of the focal species but are not represented in protected areas nor would they meet the 100% target without the exclusion of commercial logging and road building that is already proposed in the ecoregion, particularly in the Black Ram area of the YRW. Our analysis points to the need for greatly stepped-up protections regionwide in preparation for advancing climate change impacts.
Also, as in the southern Rockies, protected areas were skewed toward upper elevation EVT comprised of subalpine spruce-fir and subalpine woodland and parkland and unvegetated or sparse (alpine, snow and ice) that would, in part, benefit focal species like wolverine but that do not add much for low-mid elevation focal forest birds and forest carnivores. Ponderosa pine and dry and mesic forests are used by most of the focal species in our study area, but levels of protection were in the single digits and even lower than in the southern Rockies [6].
While there are differences among species in the selection of habitat at territorial or home range scales, the degree of overlap in habitat suitability allowed us to generally assess how much suitable habitat is protected for the collection of focal species. With the inclusion of IRA+, only the wolverine met the conservation targets but even within these areas recreational activities might render them less protective for wolverine due to snowmobile access and heli-skiing [54]. Additionally, wide-ranging species like grizzly bear require intact areas free of roads and logging to reduce human-caused mortality and provide connected landscapes free of barriers to bear movements [55]. Thus, maintaining intact areas would reduce these pressures and provide least resistance travel corridors for genetic exchange among metapopulations. Habitat security for this focal species can also be better provided by strategically closing and obliterating roads in high grizzly bear habitat suitability areas [56] at the scale of the ecoregion and watershed.
For the forest carnivores (American marten, fisher, lynx) and focal birds (goshawk, boreal owl, great gray owl), IRA+ along with changes to forestry practices within mature forests that prohibit commercial logging and road building would likely benefit them in the long run [29]. Mature forests have high conservation value with prior analysis calling for 100% of these forests on federal lands [29]. The NRE has ~32% of its forests in the structurally mature category compared with the larger Southern Rockies ecoregion that has just ~19% in this structure class [6]. While both ecoregions did not meet the mature forest targets, the Southern Rockies by contrast had 21.5% protected vs. the NRE where all 7 mature EVT had only 2.4% protected while the YRW had only 0.25% protected. IRA+ would mainly boost lodgepole pine and subalpine mature forest protection levels to the 50% target but fall short of the national target of 100%. This is particularly the case given the climate refugium proposal in the YRW relies on protection of mature forests; yet these forests are threatened by multiple USDA Forest Service logging projects and road building, especially within the Black Ram area (Figure S1).
4.2. Wildfires and the Wildland-Urban Interface
While the USDA Forest Service is the major landowner across the NRE, many homes intersect national forests and the agency is involved in fire-risk reduction measures which, in a large part (based on congressional funding) are supposed to target the WUI. However, our analysis shows that >75% of the total treatment footprint in the NRE is beyond 1 km from structures. In comparison, more of the total treatment footprint in the YRW is 250 m to 1 km from any WUI type, with 65.5% >1 km from WUI. At both spatial scales, ~3/4 of all thinning treatments are >1 km from WUI. While there are many justifications given for mechanical thinning in forests, the agency continues to conduct fuel treatments at consid-erable distances from the WUI as was also the case in the Mogollon Highlands [14] and Southern Rockies [6].
4.3. Climate Change and Refugia
The severity of climate-related impacts in both the NRE and YRW depends in a large part on greenhouse gas emissions as the world increasingly approaches biosphere-atmosphere tipping points [57]. However, the climate-related impacts in the near-term (through about 2050) are relatively similar between the intermediate and very high climate scenarios. We did find that the YRW maintains its refugium properties for longer periods relative to the larger ecoregion but even the YRW may lose its presumed refugium properties by late century under the very high emissions scenario due to unprecedented increases in summer temperature, declining snowpack, and increased wildfire susceptibility (although less than the NRE). Thus, while the NRE in general and the YRW in particular both have important areas worthy of protection, the degree at which both places continue to function – protected areas or otherwise – will depend increasingly on the emissions pathway along with land-use practices. Importantly, global carbon dioxide emissions from fossil fuel consumption alone rose again in 2023, reaching record levels as the world remains dangerously on course to exceed the 1.5° C increase [58].
While we did not examine the specific refugium features of the YRW that may provide “hang time” for maintaining its extant biodiversity in a rapidly changing climate, the area has many of the general properties thought to be important, including north-facing slopes, high elevation forests, roadless areas, and mature forests. We recommend field-based measurements in these areas to tease out specific biophysical features involved in refugium properties. Additionally, refugia are more likely to function in places with little anthropogenic stressors [59]. In the case of both the NRE and YRW, the relatively higher representation of subalpine forests with IRA+ might make important contributions as upper elevation refugia. Simultaneously, the addition of new protected areas focused on mature forests, focal species habitat, and increased IRA protections could be coupled strategically with WUI management closest to structures within a more focused 0-250 m structure buffer rather than broadcasting treatments at distances >1 km from structures. This change in fuel management approach is urgently needed given the increasing exposure of rural communities to wildfire risks and the unique opportunities to achieve scale in the YRW given the relatively lower housing densities. Other scientists also have been calling for a paradigm shift in wildfire management that puts more of the focus on structure risk reduction [60,61].
5. Conclusions
We were surprised by the very low levels of protection in the NRE compared to the Southern Rockies and especially in priority conservation areas like the YRW proposed climate refugium. High conservation value habitat types like mature forests of all types also performed poorly and further logging and roadbuilding in these areas (e.g., Black Ram and related projects in Figure S1) would degrade suitable habitat for each of the focal forest carnivores and avian species that depend on them.
When combined, the Southern (1.85M ha) and Northern Rockies (2.76M ha) ecoregion have substantial mature forests that could be conserved at even larger scales (i.e., across the USA Rockies); yet, neither region has met even the lower targets, and the USDA Forest Service recently withdrew plans to manage national forests to conserve mature forests due to changes in administrations (President Biden to President Trump). Importantly, while NREPA would cover significant portions of both ecoregions in new protections, there remain significant gaps in mature forest coverages, and NREPA has not passed in Congress since its introduction in 1993. Given our (DDS) experience in testifying at congressional hearings on forest planning issues in general, a key factor blocking passage of NREPA, as well as national roadless legislation, wilderness bills, national monument designations and mature forest protections has been concerns for wildfires spilling into urban areas.
Thus, a key recommendation of our study is the USDA Forest Service could support conservation targets in priority areas, while it concentrates fuel reduction treatments within a narrow WUI buffer nearest homes. However, as we have now found in three ecoregions [6, 14, this one] and others have found more broadly [62], the agency has concentrated thinning and burning treatments at considerable distances from structures even though most of its fuel reduction funds are supposed to target the WUI nearest homes. Focusing treatments close to homes [63], might reduce some of the resistance to new protected area proposals by demonstrating to communities and Congress that investments in fuel reduction can strategically target the highest priority areas for human safety. Fuel reduction treatments for other reasons (forest management) could also target areas where conservation values are not as compromised by aggressive treatments or needed because of their important refugia properties [64,65].
Global climate change warnings by numerous scientists [57] provide a solid scientific justification for large-scale protection proposals like 30 x 30, 50 x 50, and 100% targets [66]. Thus, there is an urgent need to rapidly scale up protection efforts and concentrate wildfire risk reduction on human safety, while society transitions to clean, renewable energy. The importance of protected areas especially concentrated in refugia would likely provide “hang time” for species to adapt to the emerging novel climate and avoid irreplaceable losses to both nature and people if aggressive forest management (logging, road building) continues apace against the backdrop of a rapidly changing climate. Notably, there are limitations in how much nature can provide as refugia depending on the degree of human activities and severity of anthropogenic climate change in the coming decades.
Supplementary Materials
The following supporting information can be downloaded at the website of this paper posted on Preprints.org. Table S1: HUC8 watersheds within the Northern Rockies Ecoregion; Table S2: GIS Data Sources used in the Northern Rockies Ecoregion assessment; Table S3: Existing vegetation (EVT) categories within the Northern Rockies Ecoregion; Table S4: Forest structure classes, including mature within the Northern Rockies Ecoregion and Yaak River Watershed; Table S5: Focal forest carnivore habitat suitability and GAP status within the Northern Rockies Ecoregion and Yaak River Watershed; Table S6: Focal bird species habitat suitability and GAP status within the Northern Rockies Ecoregion and Yaak River Watershed; Table S7: Climate data sources used in the Northern Rockies Ecoregion Conservation Assessment; Table S8: Landownerships and GAP status within the Northern Rockies Ecoregion and Yaak River Watershed; Table S9: USDA Forest Service fuel reduction treatments within the Northern Rockies Ecoregion and Yaak River Watershed; Figure S1: USDA Forest Service timber sales within the Yaak River Watershed showing the proposed Black Ram refugium at risk. ; Figure S2: Forest maturity within the Northern Rockies Ecoregion and Yaak River Watershed insert; Figure S3: Focal forest carnivore habitat within the Northern Rockies Ecoregion and Yaak River Watershed insert.; Figure S4: Canada lynx suitable habitat within the Northern Rockies Ecoregion and Yaak River Watershed; S5: American marten suitable habitat within the Northern Rockies Ecoregion and Yaak River Watershed S6: Fisher suitable habitat within the Northern Rockies Ecoregion and Yaak River Watershed; Figure S7: Wolverine suitable habitat within the Northern Rockies Ecoregion and Yaak River Watershed; Figure S8: Grizzly bear denning habitat suitability within the Northern Rockies Ecoregion and Yaak River Watershed; Figure S9: Focal avian suitable habitat within the Northern Rockies Ecoregion and Yaak River Watershed; Figure S10: Boreal owl suitable habitat within the Northern Rockies Ecoregion and Yaak River Watershed; Figure 11: Great gray owl suitable habitat within the Northern Rockies Ecoregion and Yaak River Watershed; Figure S12: Northern goshawk suitable habitat within the Northern Rockies Ecoregion and Yaak River Watershed; Figure S13: Model median growing degree-days for historical and model median projected change for the Yaak River Watershed; Figure S14: Model median historical mean summer temperature and model median projected change for the Yaak River Watershed; Figure S15: Model median historical total summer precipitation and model median projected change for the Yaak River Watershed; Figure S16: Average historical and future likelihood of climate and fuel conditions being conducive for wildfire in the Yaak River Watershed.
Author Contributions
DDS led the conceptualization, formal analysis, writing, and fund raising for the project. KA was involved in manuscript preparation and workshop organizing. BB conducted all spatial and GIS analyses, including interpretation of the results and writing. MR conducted climate downscaling and writing. DS was involved in manuscript preparation and interpretation of results.
Funding
Funding for this project was provided to DDS by the Yaak Valley Forest Council that had no say in the development of the design or interpretation of the findings.
Data Availability Statement
As noted, supplemental material can be downloaded on databasin.
Acknowledgments
We thank the Yaak Valley Forest Council for funding this project and the experts that attended the ecoregional conservation assessment workshop to refine the mapping.
Conflicts of Interest
The authors declare no conflicts of interest. No funder had any role in this project other than providing funding.
References
- Omernik, J.M. Ecoregions of the Conterminous United States. Ann. Assoc. Am. Geogr. 1987, 77, 118–125. [Google Scholar] [CrossRef]
- Ricketts, T.H.; Dinerstein, E.; Olson, D.M.; Loucks, C.J.; Eichbaum, W.; Latham, J. Terrestrial Ecoregions of North America: A Conservation Assessment; Island Press: Washington, DC, 1999. [Google Scholar]
- NatureServe. Northern Rocky Mountain Dry-Mesic Montane Mixed Conifer Forest. Available online: https://explorer.natureserve.org/Taxon/ELEMENT_GLOBAL.2.722868/Northern_Rocky_Mountain_Dry-Mesic_Montane_Mixed_Conifer_Forest (accessed on 25 January 2025).
- One Earth. Northern Rockies Conifer Forests. Available online: https://www.oneearth.org/ecoregions/northern-rockies-conifer-forests/ (accessed on 5 November 2024).
- Potter, K.M.; Conkling, B.L. Forest Health Monitoring: National Status, Trends, and Analysis 2022; U.S. Department of Agriculture, Forest Service, Southern Research Station: Asheville, NC, 2023. [Google Scholar]
- DellaSala, D.A.; Africanis, K.; Baker, B.C.; Koopman, M. An Ecoregional Conservation Assessment for the Southern Rocky Mountains Ecoregion and Santa Fe Subregion, Wyoming to New Mexico, USA. Land 2024, 13, 1432. [Google Scholar] [CrossRef]
- Montana Natural Heritage Program. Species of Concern: Fish. Available online: https://mtnhp.org/SpeciesOfConcern/?AorP=a&OpenFolders=S&Species=Fish (accessed on 2 November 2024).
- Lesica, P. Conserving Globally Rare Plants on Lands Administered by the Dillon Office of the Bureau of Land Management; Montana Natural Heritage Program, USDI Bureau of Land Management: Helena, Montana, 2003. [Google Scholar]
- Luce, C.H. Effects of Climate Change on Snowpack, Glaciers, and Water Resources in the Northern Rockies; U.S. Department of Agriculture, Forest Service, Rocky Mountain Research Station: Fort Collins, Colorado, 2018. [Google Scholar]
- Keane, R.E.; Mahalovich, M.F.; Bollenbacher, B.L.; Manning, M.E.; Loehman, R.A.; Jain, T.B. Effects of Climate Change on Forest Vegetation in the Northern Rockies. In Climate Change and Rocky Mountain Ecosystems. Advances in Global Change Research; Halofsky, J., Peterson, D., Eds.; Springer: Cham, Switzerland, 2018. [Google Scholar]
- Carter, V.A.; Power, M.J.; Lundeen, Z.J.; Morris, J.L.; Petersen, K.L.; Brunelle, A.; Six, D. L.; Cunningham, V. C. A 1500-Year Synthesis of Wildfire Activity Stratified by Elevation from the U.S. Rocky Mountains. Quat. Int. 2018, 488, 107–119. [Google Scholar] [CrossRef]
- Six, D.L.; Vergobbi, C.; Cutter, M. Are Survivors Different? Genetic-Based Selection of Trees by Mountain Pine Beetle During a Climate Change-Driven Outbreak in a High-Elevation Pine Forest. Front. Plant Sci. 2018, 9, 993. [Google Scholar] [CrossRef]
- Hannah, L.E. Climate Change, Connectivity, and Conservation Success. Conserv. Biol. 2011, 25, 1139–1142. [Google Scholar] [CrossRef]
- DellaSala, D.A.; Kuchy, A.L.; Koopman, M.; Menke. An Ecoregional Conservation Assessment for Forests and Woodlands of the Mogollon Highlands Ecoregion, Northcentral Arizona and Southwestern New Mexico, USA. Land 2023, 12, 2112. [Google Scholar] [CrossRef]
- Hilty, J.A.; Chester, C.C.; Wright, P.A.; Zenkewich, K. Uniting Hearts and Lands: Advancing Conservation and Restoration Across the Yellowstone to Yukon Region. Front. Conserv. Sci. 2024, 4, 1264460. [Google Scholar] [CrossRef]
- Keppel, G. ; others Refugia: Identifying and Understanding Safe Havens for Biodiversity Under Climate Change. Glob. Ecol. Biogeogr. 2012, 21, 393–404. [Google Scholar] [CrossRef]
- Olson, D.; DellaSala, D.A.; Noss, R. F.; Strittholt, J. R.; Koopman, M. E.; Allnut, T. F. Climate Change Refugia for Biodiversity in the Klamath-Siskiyou Ecoregion. Nat. Areas J. 2012, 32, 65–74. [Google Scholar] [CrossRef]
- Rilling, C.M. Global Change Refugia Could Shelter Species from Multiple Threats. Nat. Rev. Biodivers. 2025, 1, 10–11. [Google Scholar] [CrossRef]
- Frey, S.J.K.; Hadley, A.S.; Johnson, S.L.; Schultze, M.; Jones, J.A.; Betts, M.G. Spatial Models Reveal the Microclimatic Buffering Capacity of Old-Growth Forests. Sci. Adv. 2016, 2, e1501392. [Google Scholar] [CrossRef] [PubMed]
- Lesmeister, D.B.; Sovern, S. G.; Davis, R. J.; Bell, D. M.; Gregory, M. J.; Vogeler, J. C. Mixed-Severity Wildfire and Habitat of an Old-Forest Obligate. Ecosphere 2019, 10, 1–22. [Google Scholar] [CrossRef]
- Yaak Valley Forest Council Climate Refuge Program. Available online: https://yaakvalley.org/programs/climate-refuge-program/#:~:text=The%20Yaak%20Valley%20Forest%20Council,the%20effects%20of%20climate%20change (accessed on 2 November 2024).
- USDA-FS. Black Ram (Northwest Yaak). Available online: https://www.fs.usda.gov/project/?project=52784 (accessed on 17 January 2025).
- Noss, R.F.; Dobson, A. P.; Baldwin, R.; Beier, P.; Davis, C. R.; DellaSala, D. A.; Locke, H.; Nowak, K.; Lopez, R.; Reining, C.; et al. Bolder Thinking for Conservation. Conserv. Biol. 2012, 26, 1–4. [Google Scholar] [CrossRef]
- Dinerstein, E.; Olson, D.; Joshi, A.; Vynne, C.; Burgess, N. D.; Wikramanayake, E.; Hahn, N.; Palminteri, S.; Hedao, P.; Noss, R.; et al. An Ecoregion-Based Approach to Protecting Half the Terrestrial Realm. BioScience 2017, 67, 534–545. [Google Scholar] [CrossRef]
- Chester, C.C.; Hilty, J.A. The Yellowstone to Yukon Conservation Initiative as an Adaptive Response to Climate Change. In Handbook of Climate Change and Biodiversity; Leal Filho, W., Barbir, J., Preziosi, R., Eds.; Climate Change Management; Springer: Cham, Switzerland, 2019; Preziosi, R., Eds.; pp. 179–193. [Google Scholar]
- Congress, U.S. Senate Bill 1276: Northern Rockies Ecosystem Protection Act. Available online: https://www.congress.gov/bill/117th-congress/senate-bill/1276/text (accessed on 5 November 2024).
- DellaSala, D.A.; Mackey, B.; Norman, P.; Campbell, C.; Comer, P.J.; Kormos, C.F.; Keith, H.; Rogers, B. Mature and Old-Growth Forests Contribute to Large-Scale Conservation Targets in the Conterminous United States. Frontiers 2022, 5. [Google Scholar] [CrossRef]
- Radeloff, V.; Helmers, D.P.; Mockrin, M.H.; Carlson, A.R.; Hawbraker, T.J.; Martinuzzi, S. The 1990–2020 Wildland-Urban Interface of the Conterminous United States—Geospatial Data, 4th Ed.; Forest Service Research Data Archive 2023.
- Nicholson, E.; Lindenmayer, K. F.; Possingham, H. P. Testing the Focal Species Approach to Making Conservation Decisions for Species Persistence. Divers. Distrib. 2013, 19, 530–540. [Google Scholar] [CrossRef]
- Sleeter, B.M.; Wilson, T.S.; Acevedo, W. (Eds.) Status and Trends of Land Change in the Western United States—1973 to 2000; U.S. Geological Survey Professional Paper 1794–A; U.S. Geological Survey: Reston, VA, USA, 2012; Available online: http://pubs.usgs.gov/pp/1794/a/ (accessed on 25 March 2025).
- Taylor, P.; Stoffberg, S.; Monadjem, A.; Schoeman, M.C.; Bayliss, J.; Cotterill, F.P. Four New Bat Species (Rhinolophus Hildebrandtii Complex) Reflect Plio-Pleistocene Divergence of Dwarfs and Giants across an Afromontane Archipelago. PLoS ONE 2012, 7, e41744. [Google Scholar] [CrossRef]
- Clark, R. Climate and Fire in the Northern Rockies: Past, Present, and Future. Jt. Fire Sci. Program Fire Sci. Brief 2009, 1–6. [Google Scholar]
- Frankson, R.; Kunkel, K.E.; Champion, S.M.; Easterling, D.R.; Jencso, K. Montana State Climate Summary 2022; NOAA/NESDIS: Silver Spring, MD, 2022; p. 5. [Google Scholar]
- QGIS Development Team. QGIS: A Free and Open Source Geographic Information System, Version 3.34; QGIS Association. Available online: http://www.qgis.org (accessed on 25 March 2025).
- Python Software Foundation. Python 3.12.0 Release Notes. Available online: https://www.python.org/downloads/release/python-3120/ (accessed on 25 March 2025).
- Python Software Foundation Python SQLite3 Database API. Available online: https://docs.python.org/3/library/sqlite3.html (accessed on 17 January 2025).
- Pandas Development Team Python Data Analysis Library. Available online: https://pandas.pydata.org/ (accessed on 17 January 2025).
- U.S. Geological Survey (USGS) GAP Status Code Assignment. Available online: https://www.usgs.gov/media/files/gap-status-code-assignment (accessed on 17 January 2025).
- Northern Rockies Fire Science Network. Northern Rockies Ecosystem Descriptions. Available online: https://www.nrfirescience.org/sites/default/files/documents/EcosystemDescriptions.pdf (accessed on 17 January 2025).
- Weber, W.A. Rocky Mountain Flora; Colorado Associated University Press: Boulder, Colorado, 1976. [Google Scholar]
- Fontaine, J.B.; Kennedy, P.L. Meta-Analysis of Avian and Small-Mammal Response to Fire Severity and Fire Surrogate Treatments in U.S. Fire-Prone Forests. Ecol. Appl. 2012, 22, 1547–1561. [Google Scholar] [CrossRef]
- Volkmann, L.A.; Hodges, K.E. Effects of Burn Severity and Postfire Salvage Logging on Carnivore Communities in Montane Forests. J. Mammal. 2024, 105, 390–403. [Google Scholar] [CrossRef]
- Hanson, C.T. Habitat Use of Pacific Fishers in a Heterogeneous Post-Fire and Unburned Forest Landscape on the Kern Plateau, Sierra Nevada, California. Open For. Sci. J. 2013, 6, 24–30. [Google Scholar] [CrossRef]
- Hanson, C.T. Use of Higher Severity Fire Areas by Female Pacific Fishers on the Kern Plateau, Sierra Nevada, California, USA. Wildl. Soc. Bull. 2015, 39, 497–502. [Google Scholar] [CrossRef]
- Thompson, C.; Smith, H.; Wasser, S.; Purcell, K. Fisher Use of Postfire Landscapes: Implications for Habitat Connectivity and Restoration. West. North American Nat. 2021, 81, 225–242. [Google Scholar] [CrossRef]
- Bader, M.; Sieracki, P. Grizzly Bear Denning Habitat and Demographic Connectivity in Northern Idaho and Western Montana. Northwest. Nat. 2022, 103, 209–225. [Google Scholar] [CrossRef]
- Microsoft. Microsoft U.S. Building Footprints. Available online: https://github.com/microsoft/USBuildingFootprints (accessed on 12 March 2025).
- Huang, Y.; Jin, Y. Aerial Imagery-Based Building Footprint Detection with an Integrated Deep Learning Framework: Applications for Fine Scale Wildland–Urban Interface Mapping. Remote Sens. 2022, 14, 3622. [Google Scholar] [CrossRef]
- Taylor, K.E.; Stouffer, R.J.; Meehl, G.A. An Overview of CMIP5 and the Experiment Design. Bull Amer Meteor Soc 2012, 93, 485–498. [Google Scholar] [CrossRef]
- Eyrung, V.; Bony, S.; Meehl, G.A.; Senior, C.A.; Stouffer, R.J.; Taylor, K.E. Overview of the Coupled Model Intercomparison Project Phase 6 (CMIP6) Experimental Design and Organization. Geosci Model Dev 2016, 9. [Google Scholar] [CrossRef]
- Intergovernmental Panel on Climate Change Climate Change 2013: The Physical Science Basis. Contribution of Working Group I to the Fifth Assessment Report of the Intergovernmental Panel on Climate Change; Stocker, Qin, D., Plattner, G.K., Tignor, M., Allen, S.K., Boschung, J., Nauels, A., Xia, Y., Bex, V., Midgley, P.M., Eds.; Cambridge University Press: Cambridge, United Kingdom, and New York, NY, USA, 2013. [Google Scholar]
- Intergovernmental Panel on Climate Chang Climate Change 2023: Synthesis Report. Contribution of Working Groups I, II and III to the Sixth Assessment Report of the Intergovernmental Panel on Climate Change; IPCC: Geneva, Switzerland, 2023. [Google Scholar]
- Sheehan, T.; Bachelet, D.; Ferschweiler, K. Projected Major Fire and Vegetation Changes in the Pacific Northwest of the Conterminous United States under Selected CMIP5 Climate Futures. Ecol Model 2015, 317, 16–29. [Google Scholar] [CrossRef]
- Heinemeyer, K.; Squires, J.; Hebblewhite, M.; O’Keefe, J.J.; Holbrook, J.D.; Copeland, J. Wolverines in Winter: Indirect Habitat Loss and Functional Responses to Backcountry Recreation. Ecosphere 2019, 10, e02611. [Google Scholar] [CrossRef]
- Summerfield, B.; Johnson, W.; Roberts, D. Trends in Road Development and Access Management in the Cabinet–Yaak and Selkirk Grizzly Bear Recovery Zones. Ursus 2004, 15, 115–122. [Google Scholar] [CrossRef]
- Proctor, M.F.; Nielsen, S.E.; Kasworm, W.F.; Servheen, C.; Radandt, T.G.; Machutchon, A.G.; Boyce, M.S. Grizzly Bear Connectivity Mapping in the Canada–United States Trans-Border Region. J. Wildl. Manag. 2015, 79, 544–558. [Google Scholar] [CrossRef]
- Ripple, W.J.; Wolf, C.; Gregg, J.W.; Rockström, J.; Mann, M.E.; Oreskes, N.; Lenton, T.M. The 2024 State of the Climate Report: Perilous Times on Planet Earth. BioScience 2024, 74, 812–824. [Google Scholar] [CrossRef]
- Friedlingstein, P.; O’Sullivan, M.; Jones, M.W.; Andrew, R.M.; Bakker, D.C.E.; Hauck, J.; Landschützer, P.; Le Quéré, C. Global Carbon Budget 2023. Earth Syst. Sci. Data 2023, 15, 5301–5369. [Google Scholar] [CrossRef]
- Michalak, J.L.; Lawler, J.J.; Roberts, D.R.; Carroll, C. Distribution and Protection of Climatic Refugia in North America. Conserv. Biol. 2018, 32, 1414–1425. [Google Scholar] [CrossRef]
- Calkin, D.E.; Barrett, K.; Cohen, J.D.; Finney, M.A.; Pyne, S.J.; Quarles, S.L. Wildland-Urban Fire Disasters Aren’t Actually a Wildfire Problem. PNAS 2023, 120, e2315797120. [Google Scholar] [CrossRef] [PubMed]
- Cohen, J. Preventing Disaster: Home Ignitability in the Wildland-Urban Interface. J. For. 2000, 98, 15–21. [Google Scholar] [CrossRef]
- Schoennagel, T.; Balch, J.K.; Brenkert-Smith, H.; Dennison, P.E.; Harvey, B.J.; Krawchuk, M.A.; Mietkiewicz, N.; Morgan, P.; Moritz, M.A.; Rasker, R.; et al. Adapt to More Wildfire in Western North American Forests as Climate Changes. Proc. Natl. Acad. Sci. 2017, 114, 4582–4590. [Google Scholar] [CrossRef] [PubMed]
- Calkin, D.E.; Barrett, K.; Cohen, J.D.; Finney, M.A.; Pyne, S.J.; Quarles, S.L. Wildland-Urban Fire Disasters Aren’t Actually a Wildfire Problem. Proc. Natl. Acad. Sci. 2023, 120, e2315797120. [Google Scholar] [CrossRef]
- Lesmeister, D.B.; Sovern, S.G.; Davis, R.J.; Bell, D.M.; Gregory, M.J.; Vogeler, J.C. Mixed-severity Wildfire and Habitat of an Old-forest Obligate. Ecosphere 2019, 10, e02696. [Google Scholar] [CrossRef]
- DellaSala, D.A.; Baker, B.C.; Hanson, C.T.; Ruediger, L.; Baker, W. Have Western USA Fire Suppression and Megafire Active Management Approaches Become a Contemporary Sisyphus? Biol. Conserv. 2022, 268, 109499. [Google Scholar] [CrossRef]
- Dinerstein, E.; Joshi, A.R.; Hahn, N.R.; Lee, A.T.L.; Vynne, C.; Burkart, K.; Asner, G.P.; Beckham, C.; Ceballos, G.; Cuthbert, R.; et al. Conservation Imperatives: Securing the Last Unprotected Terrestrial Sites Harboring Irreplaceable Biodiversity. Front. Sci. 2024, 2, 1349350. [Google Scholar] [CrossRef]
Figure 1.
Land ownerships of the Northern Rockies Ecoregion with a zoom in on the Yaak River Watershed, a proposed climate refugium.
Figure 1.
Land ownerships of the Northern Rockies Ecoregion with a zoom in on the Yaak River Watershed, a proposed climate refugium.
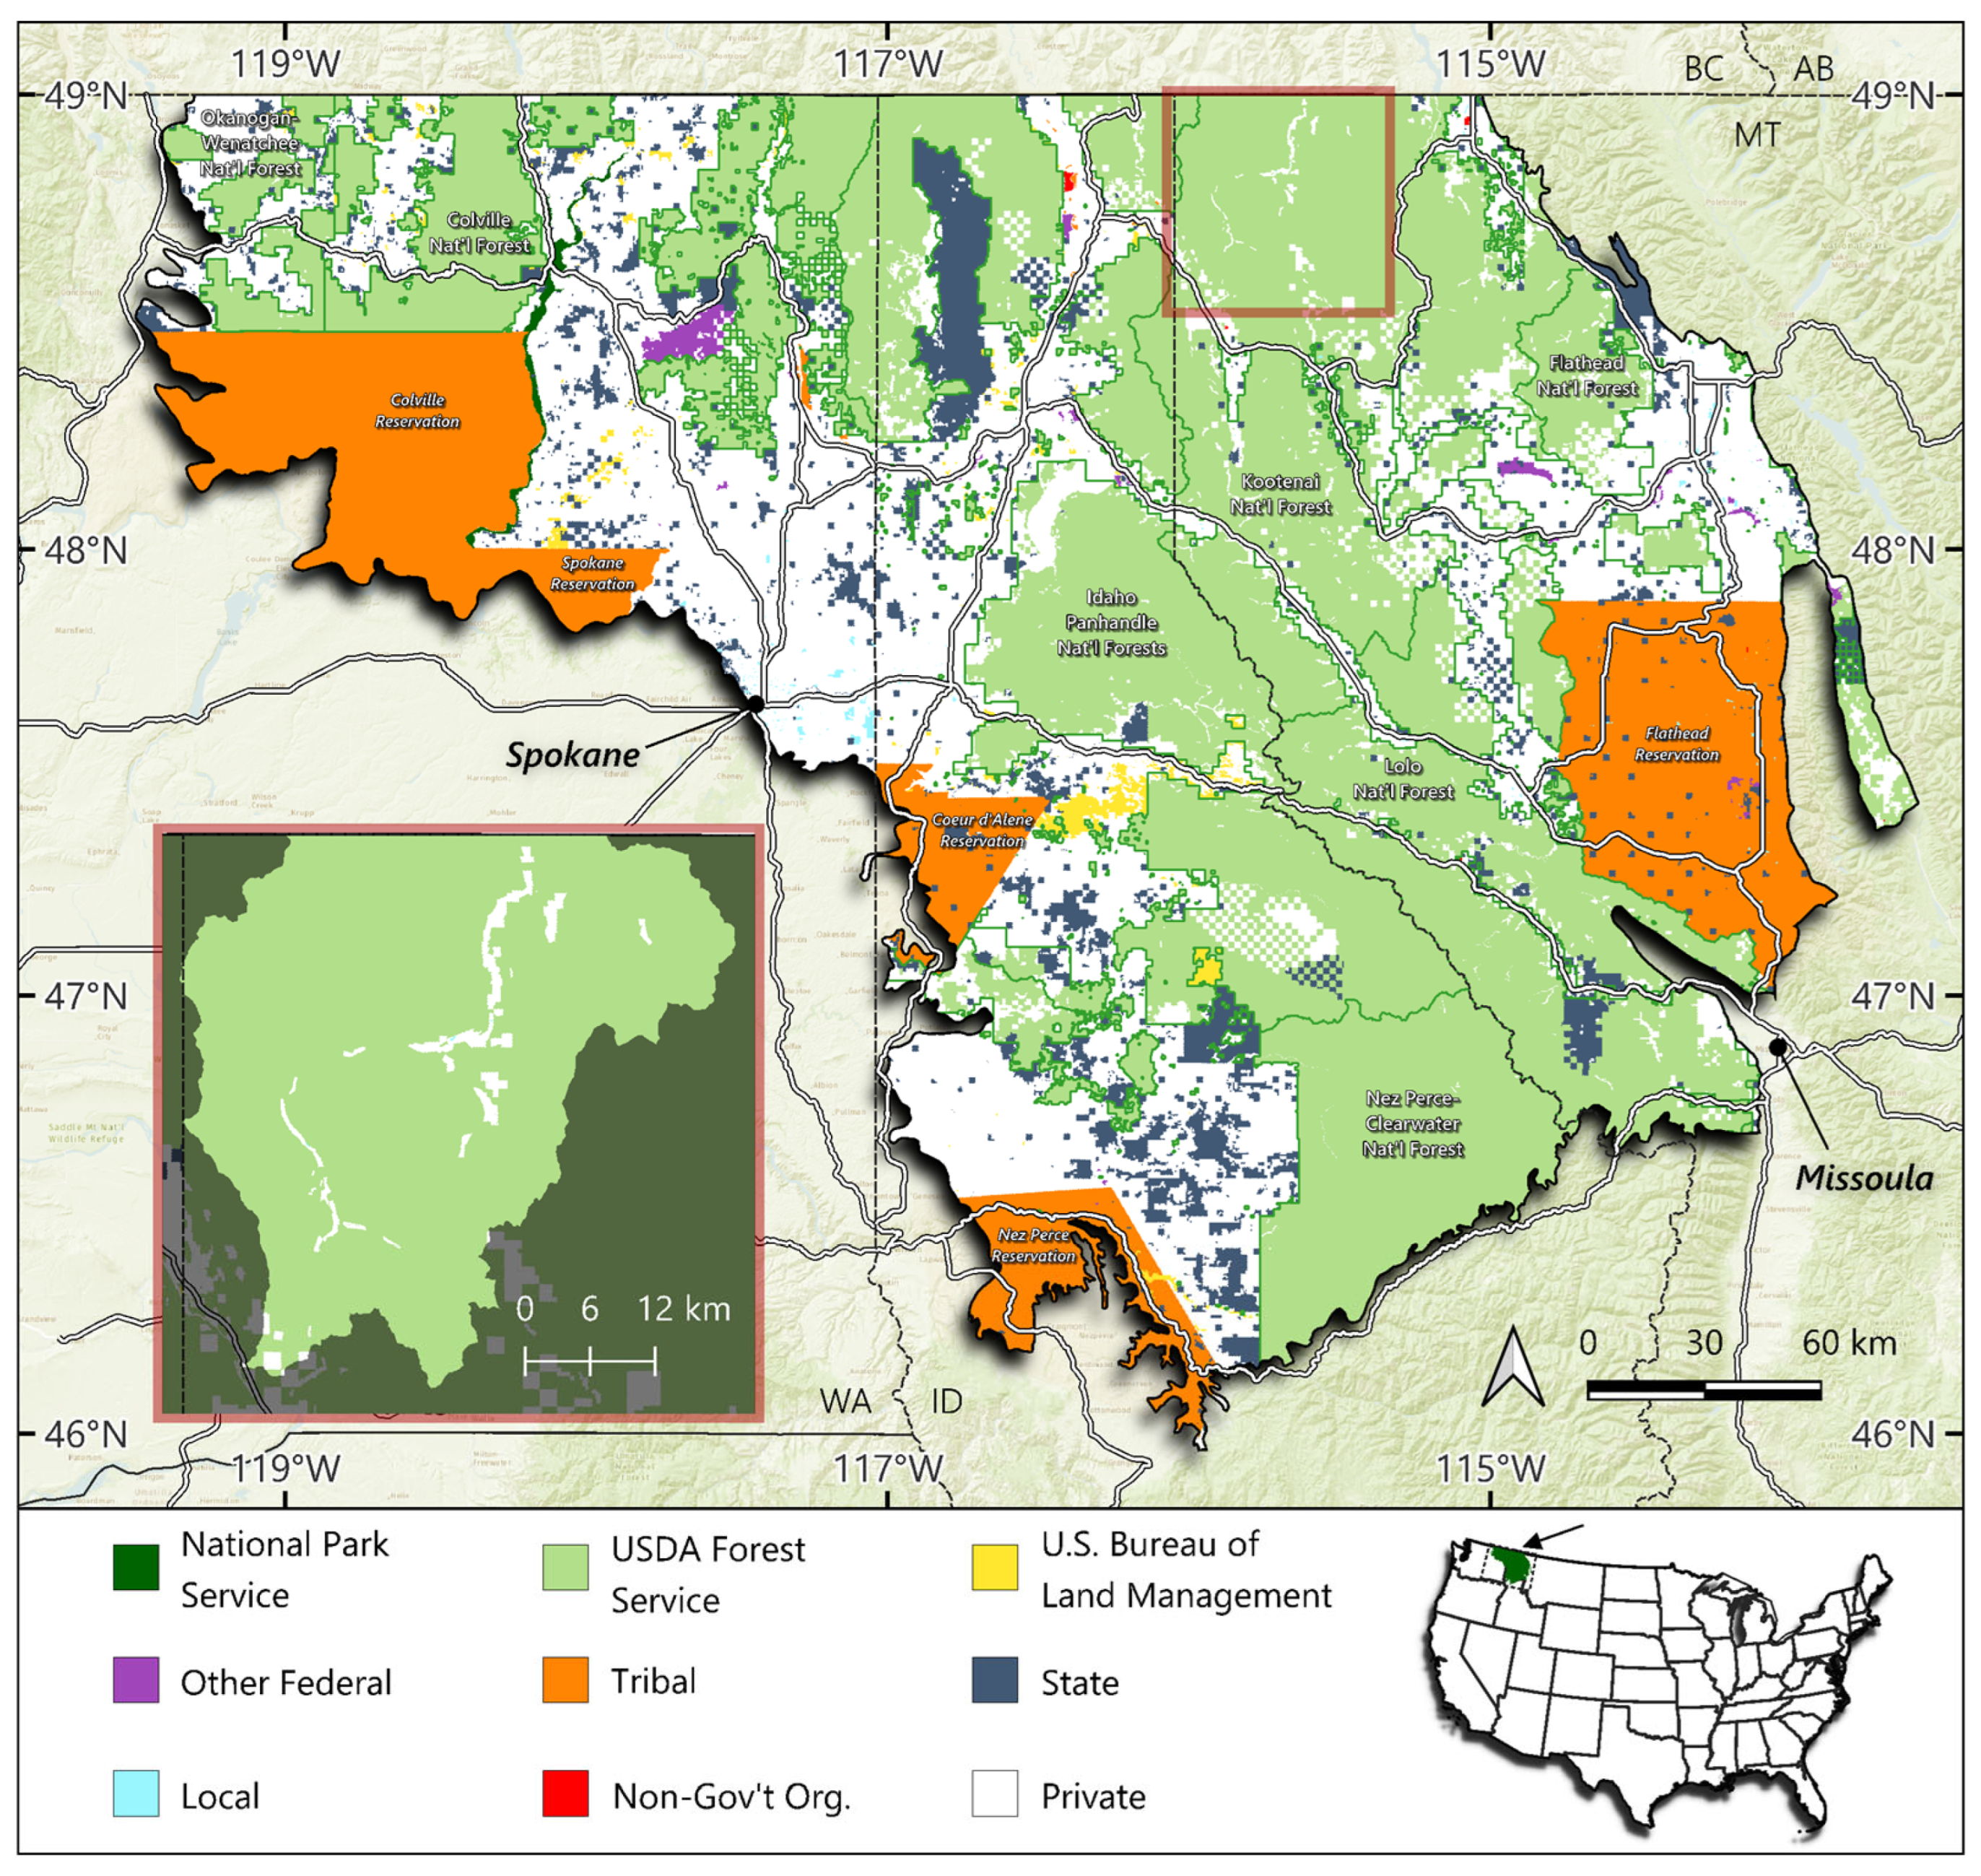
Figure 2.
Flowchart depicting the process of rasterizing datasets (if required), stacking them in virtual raster, converting the data in the multiband virtual raster into the SQLite database, and parsing the information. Each cell or pixel in the virtual raster contains multiple bands, with each band corresponding to a different dataset (e.g. habitat suitability, vegetation type). All this information is ultimately stored in the SQLite database for analysis and datasets identified in Table S2.
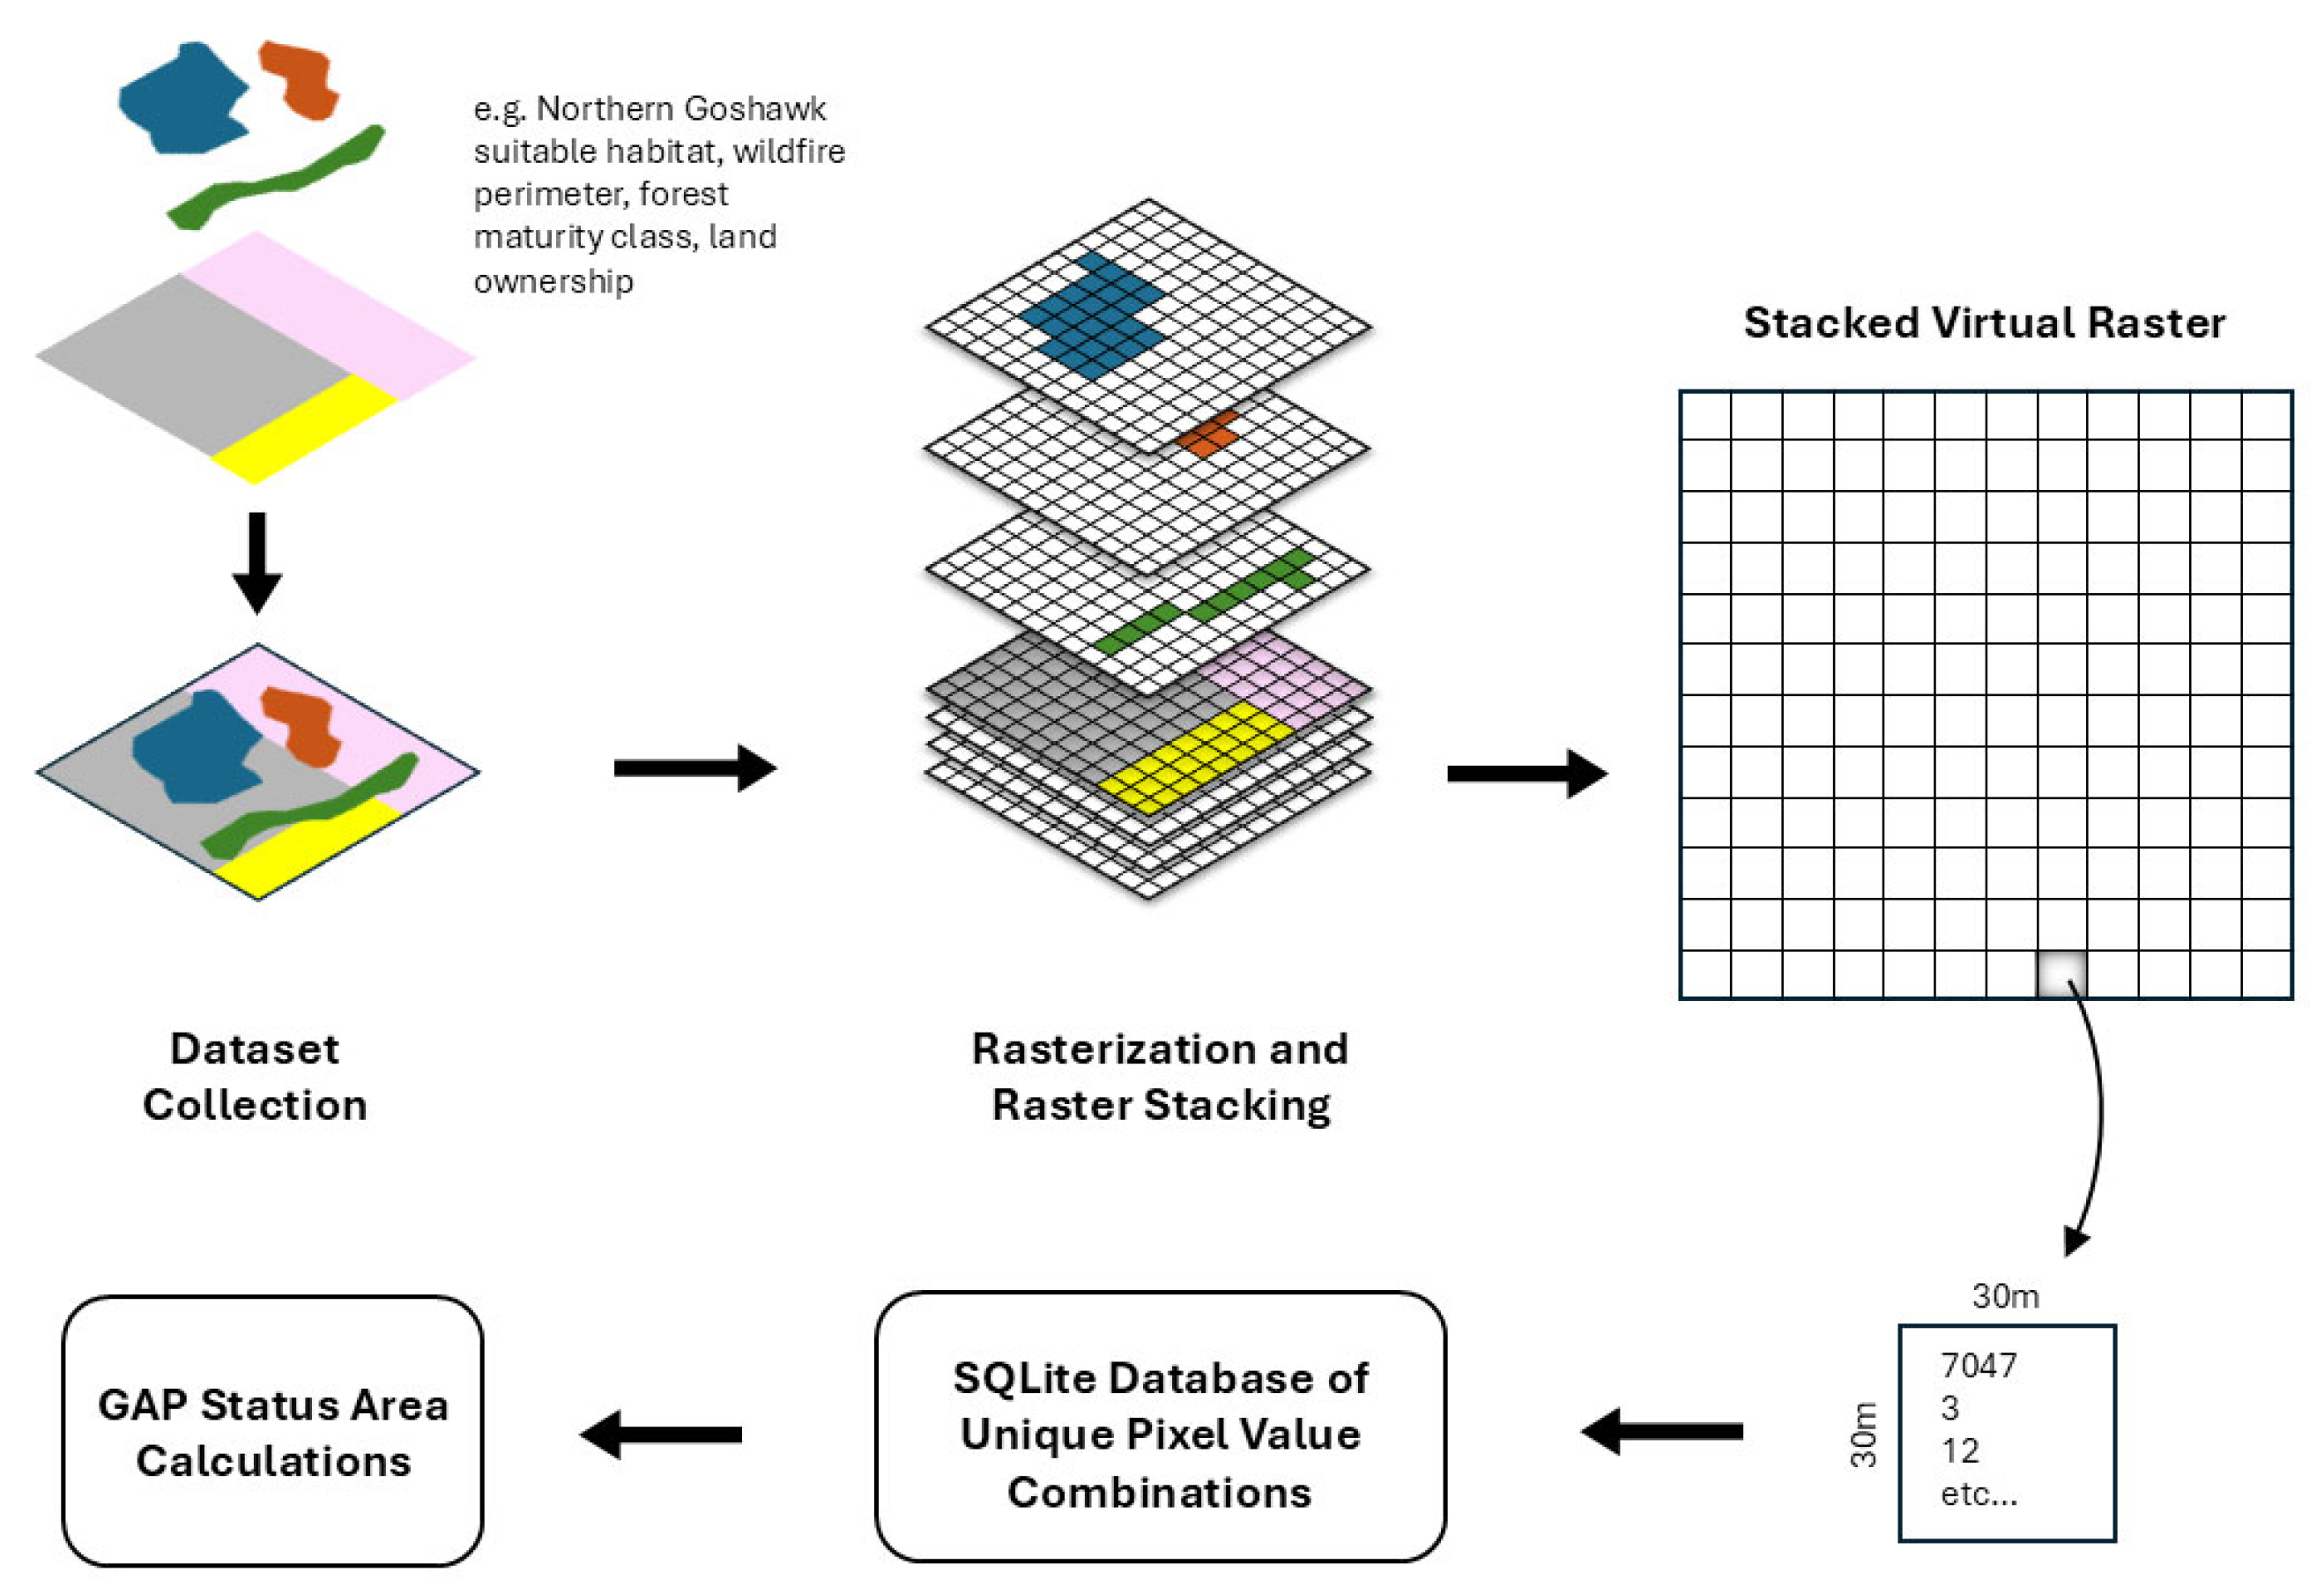
Figure 3.
Example area within the NRE showing data layers used for the analysis of fuel treatment proximity to WUI and structures. Note that the individual WUI buffer zones (250 m intervals) are only shown where they overlap national forest.
Figure 3.
Example area within the NRE showing data layers used for the analysis of fuel treatment proximity to WUI and structures. Note that the individual WUI buffer zones (250 m intervals) are only shown where they overlap national forest.
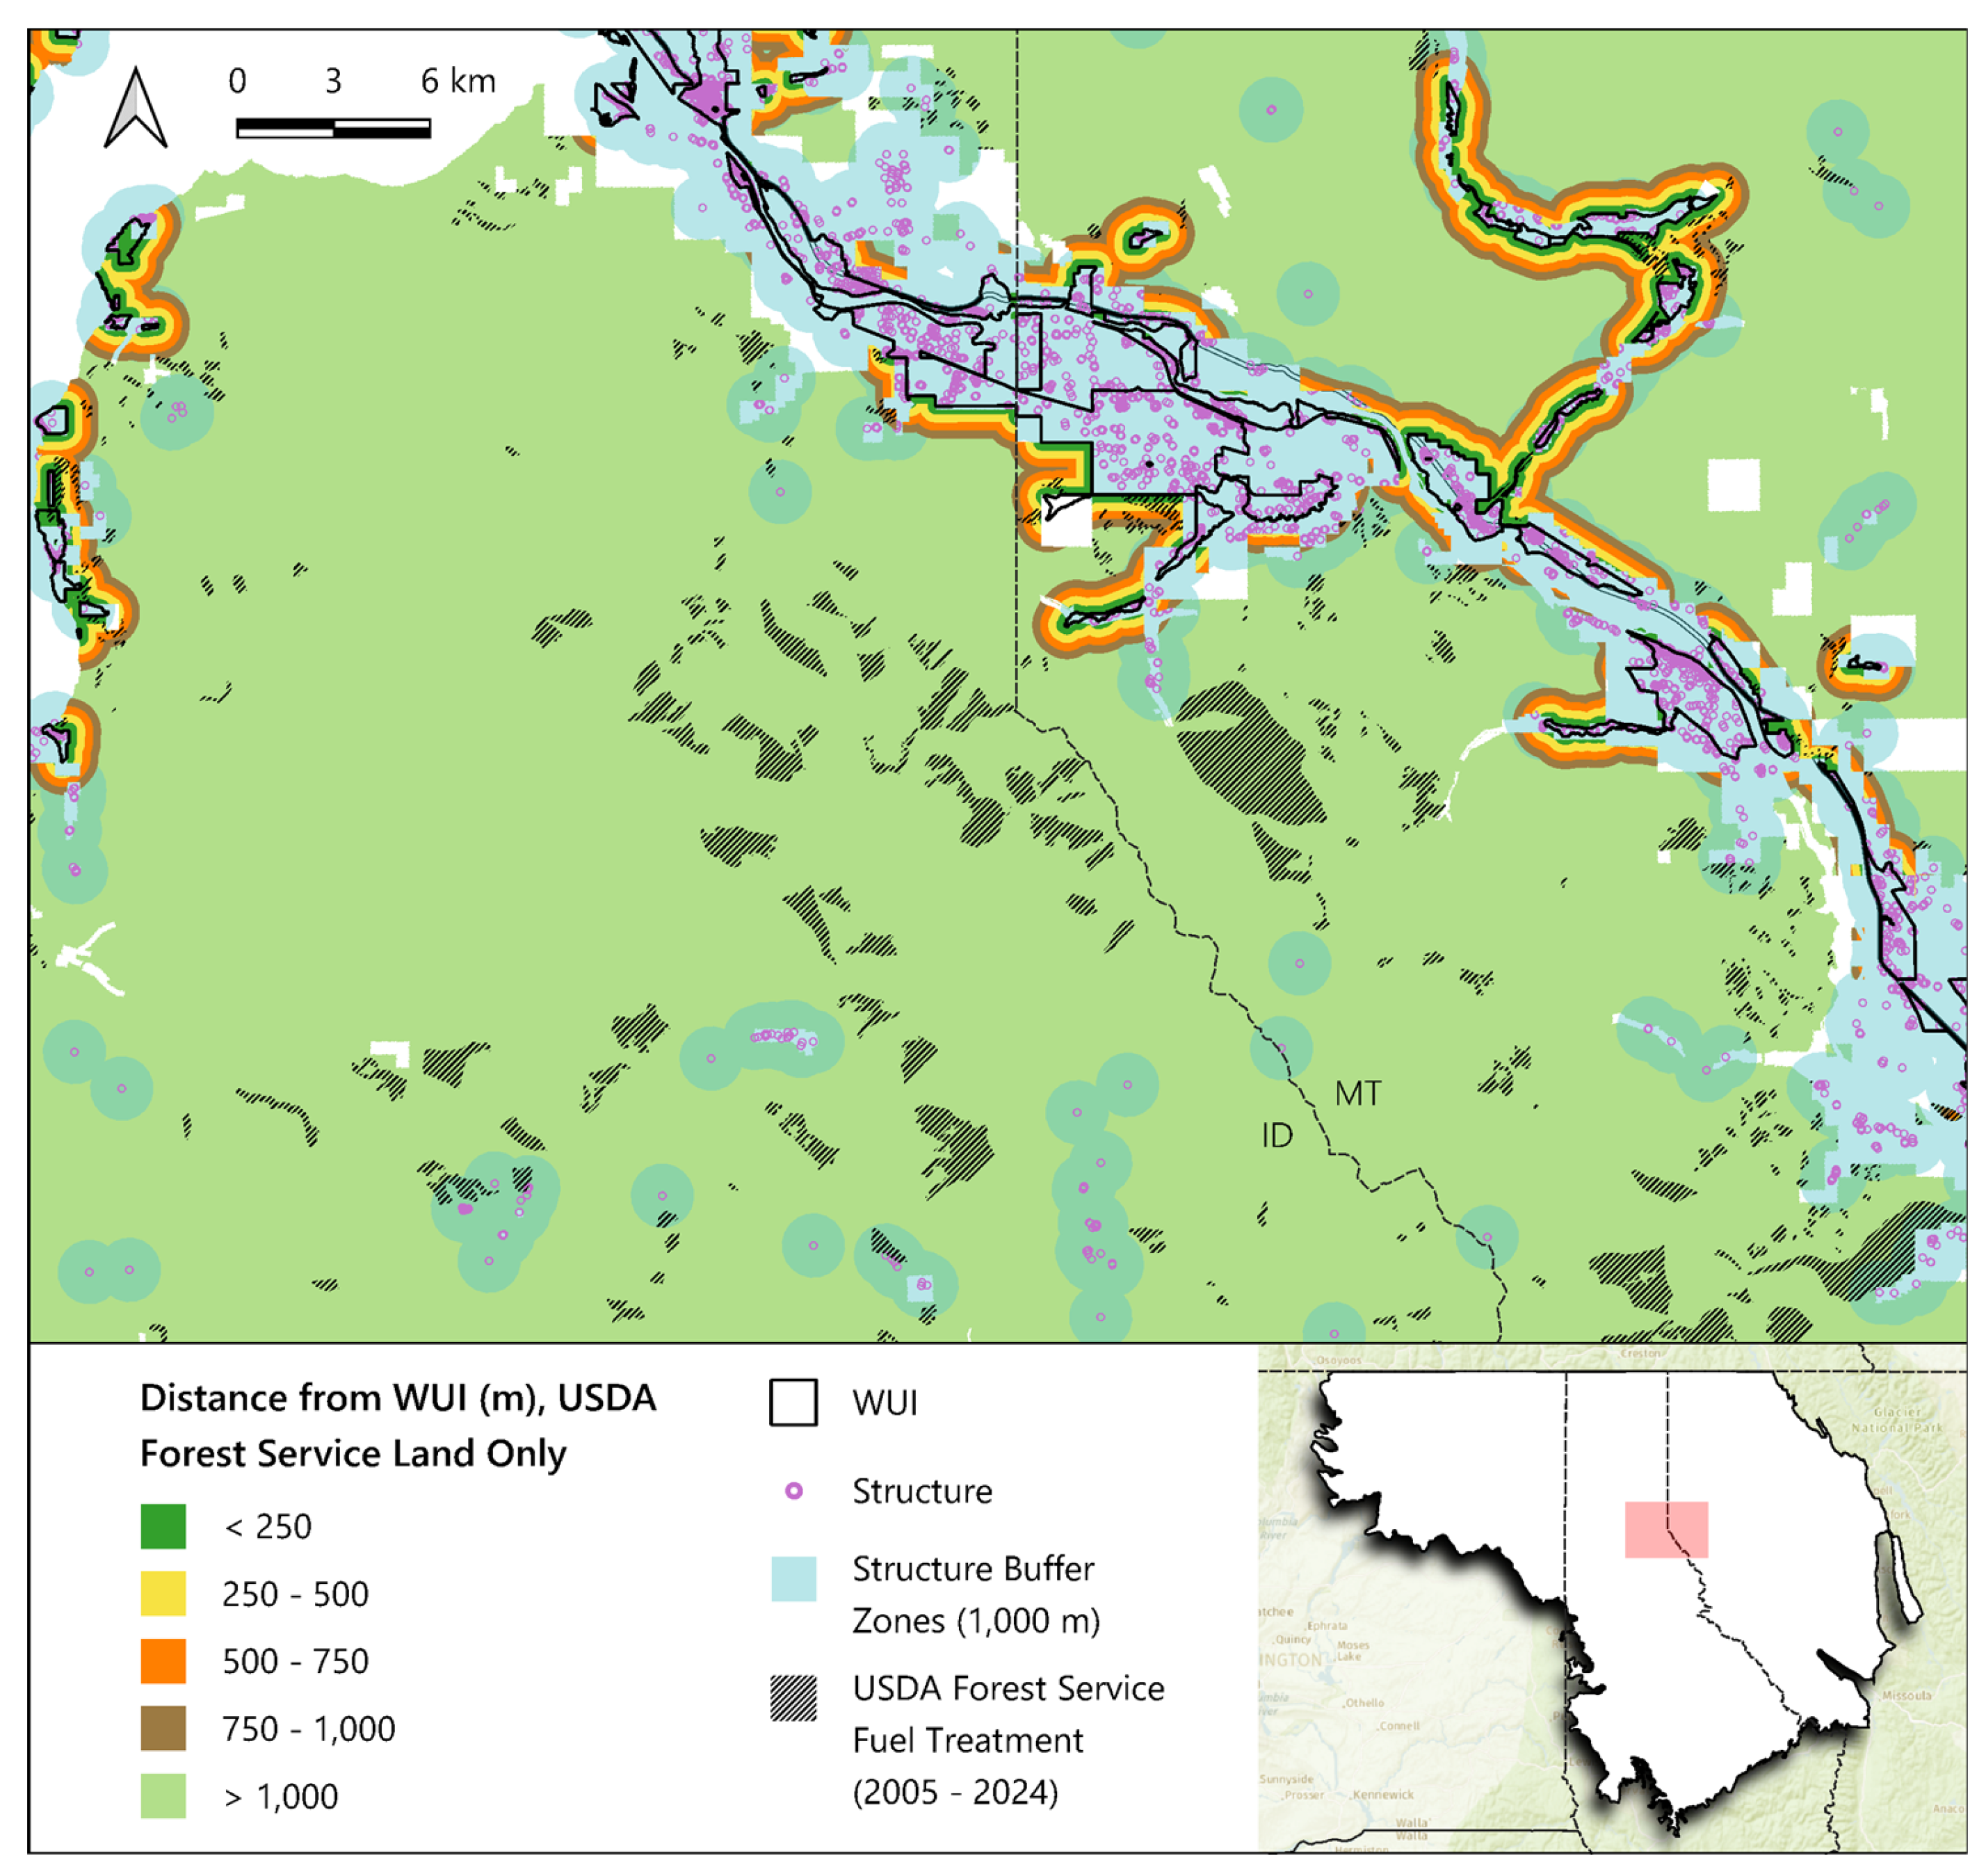
Figure 4.
GAP status distribution across the Northern Rockies Ecoregion and Yaak River Watershed insert.
Figure 4.
GAP status distribution across the Northern Rockies Ecoregion and Yaak River Watershed insert.
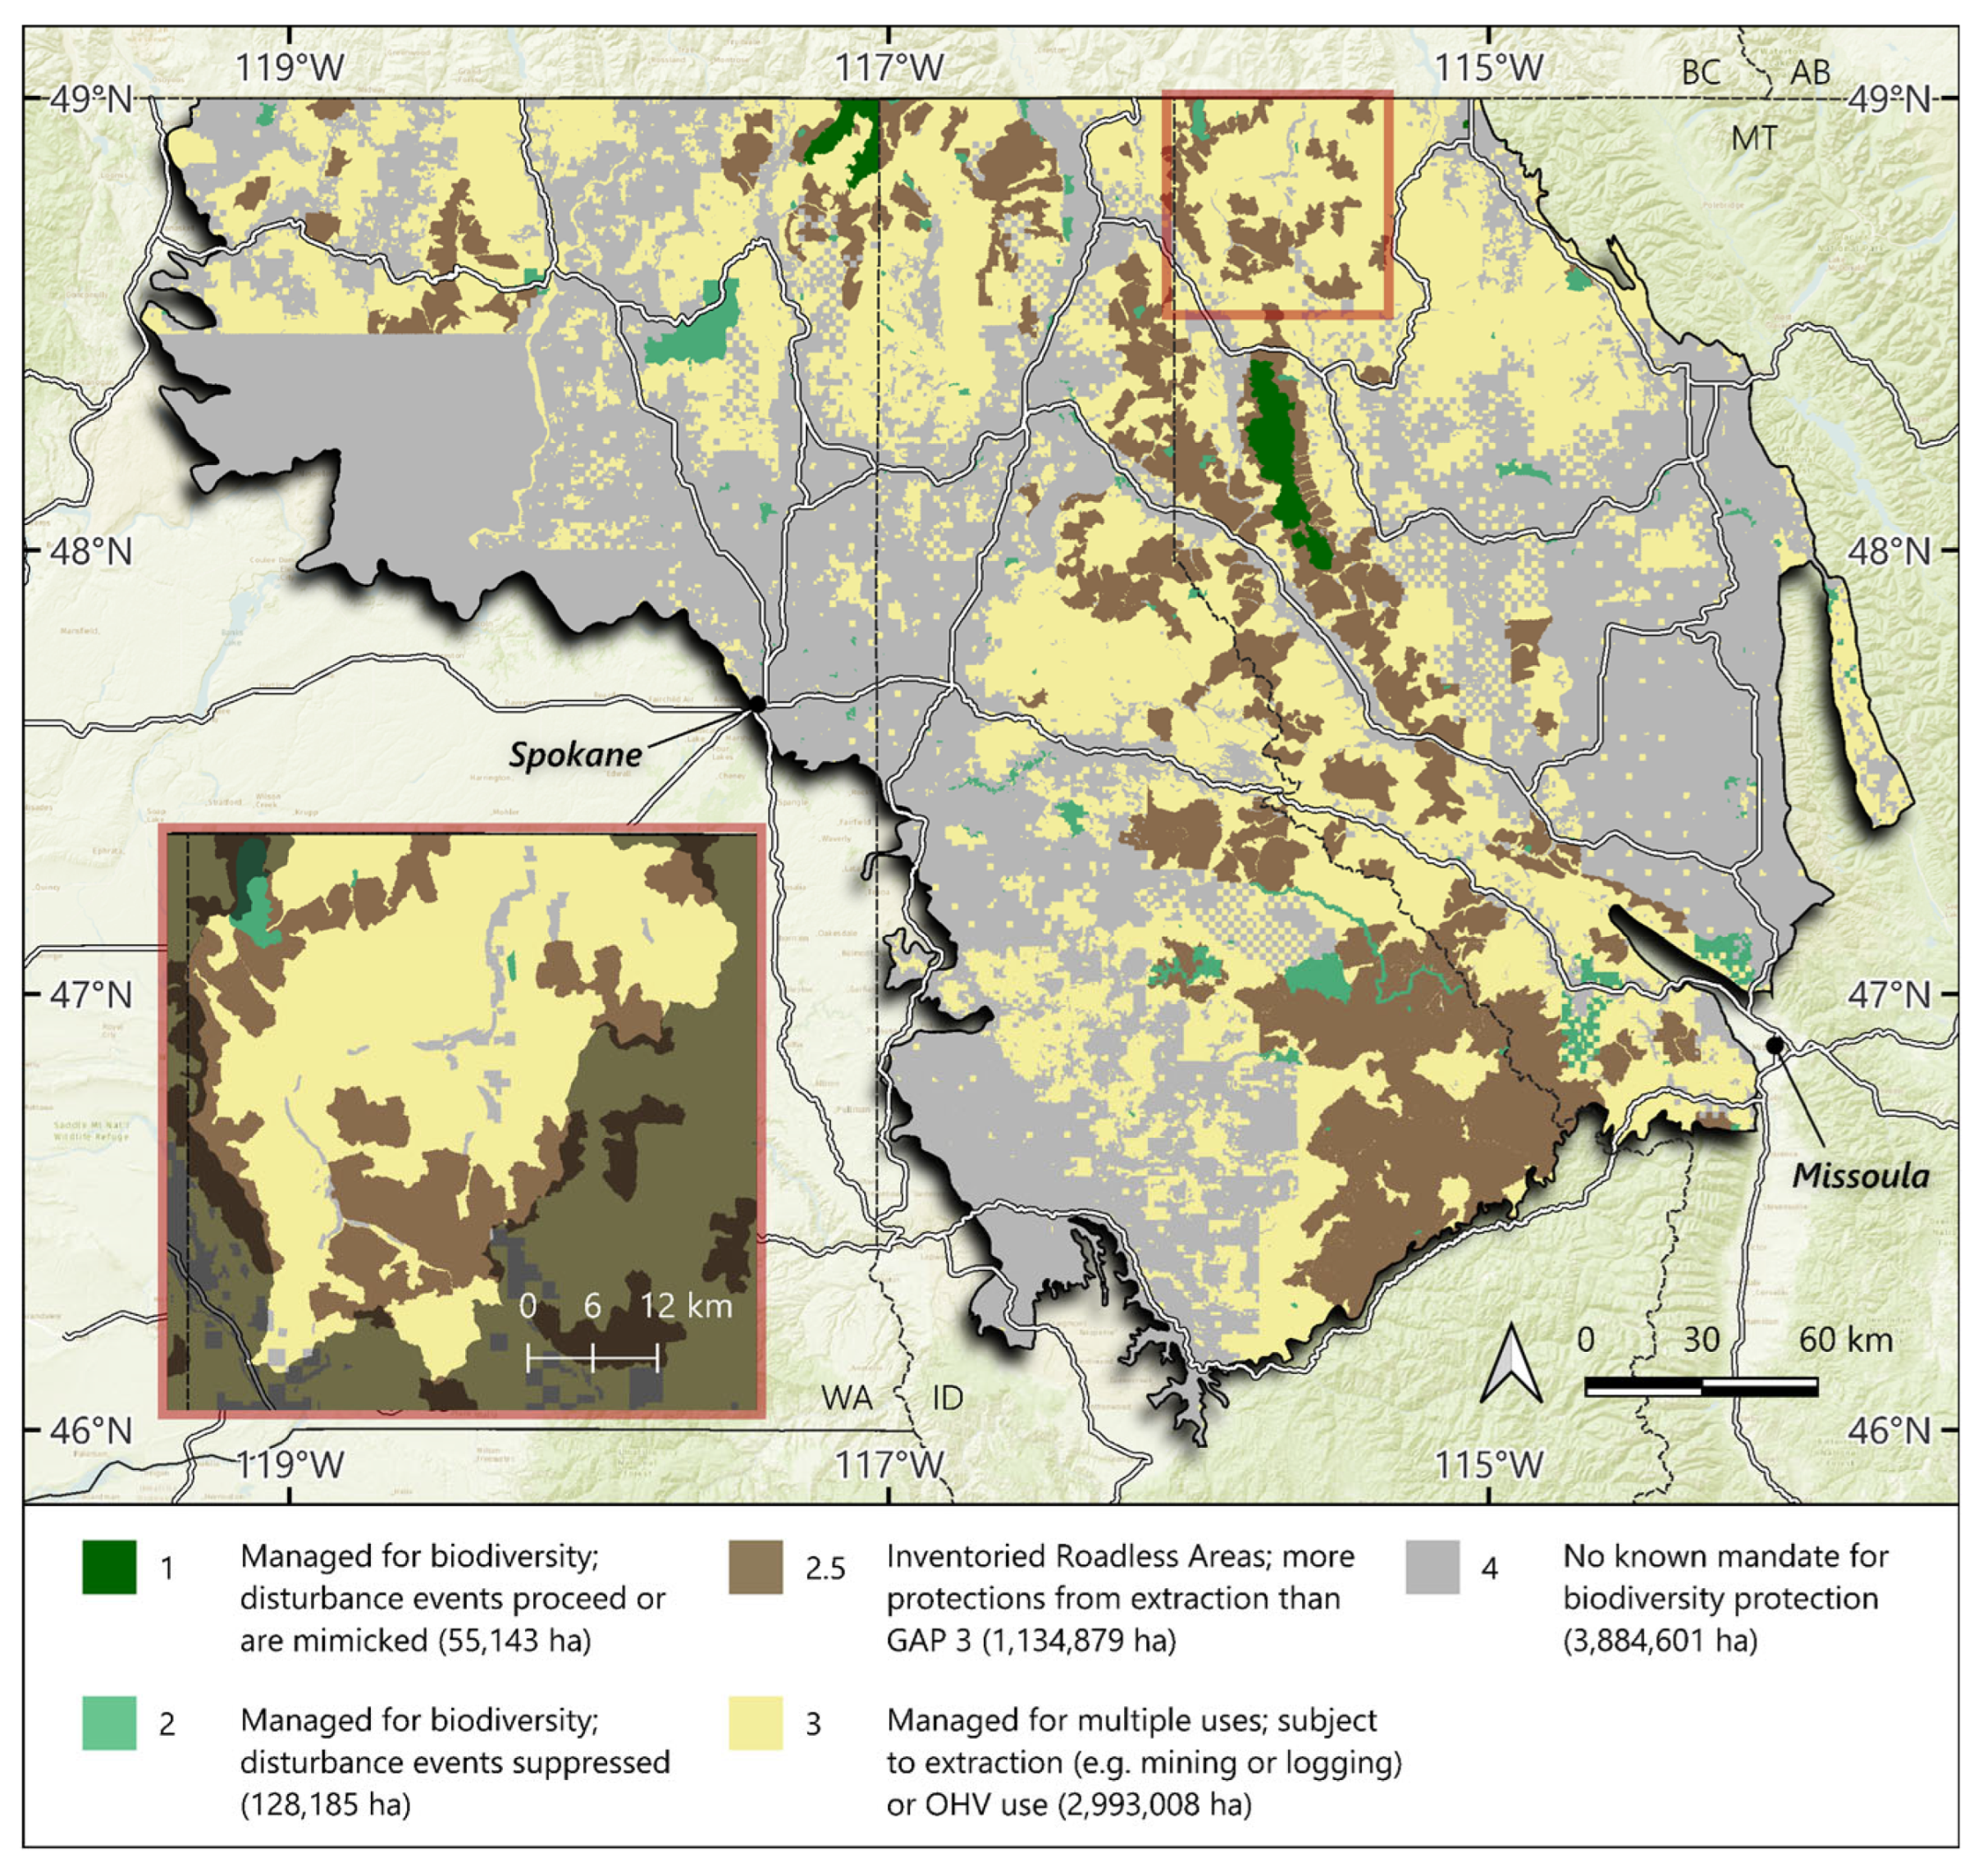
Figure 5.
Distribution of Wildland Urban Interface (WUI) classes, 1-km WUI buffer zone, and USDA Forest Service fuel treatments across the Northern Rockies Ecoregion and Yaak River Watershed (insert).
Figure 5.
Distribution of Wildland Urban Interface (WUI) classes, 1-km WUI buffer zone, and USDA Forest Service fuel treatments across the Northern Rockies Ecoregion and Yaak River Watershed (insert).
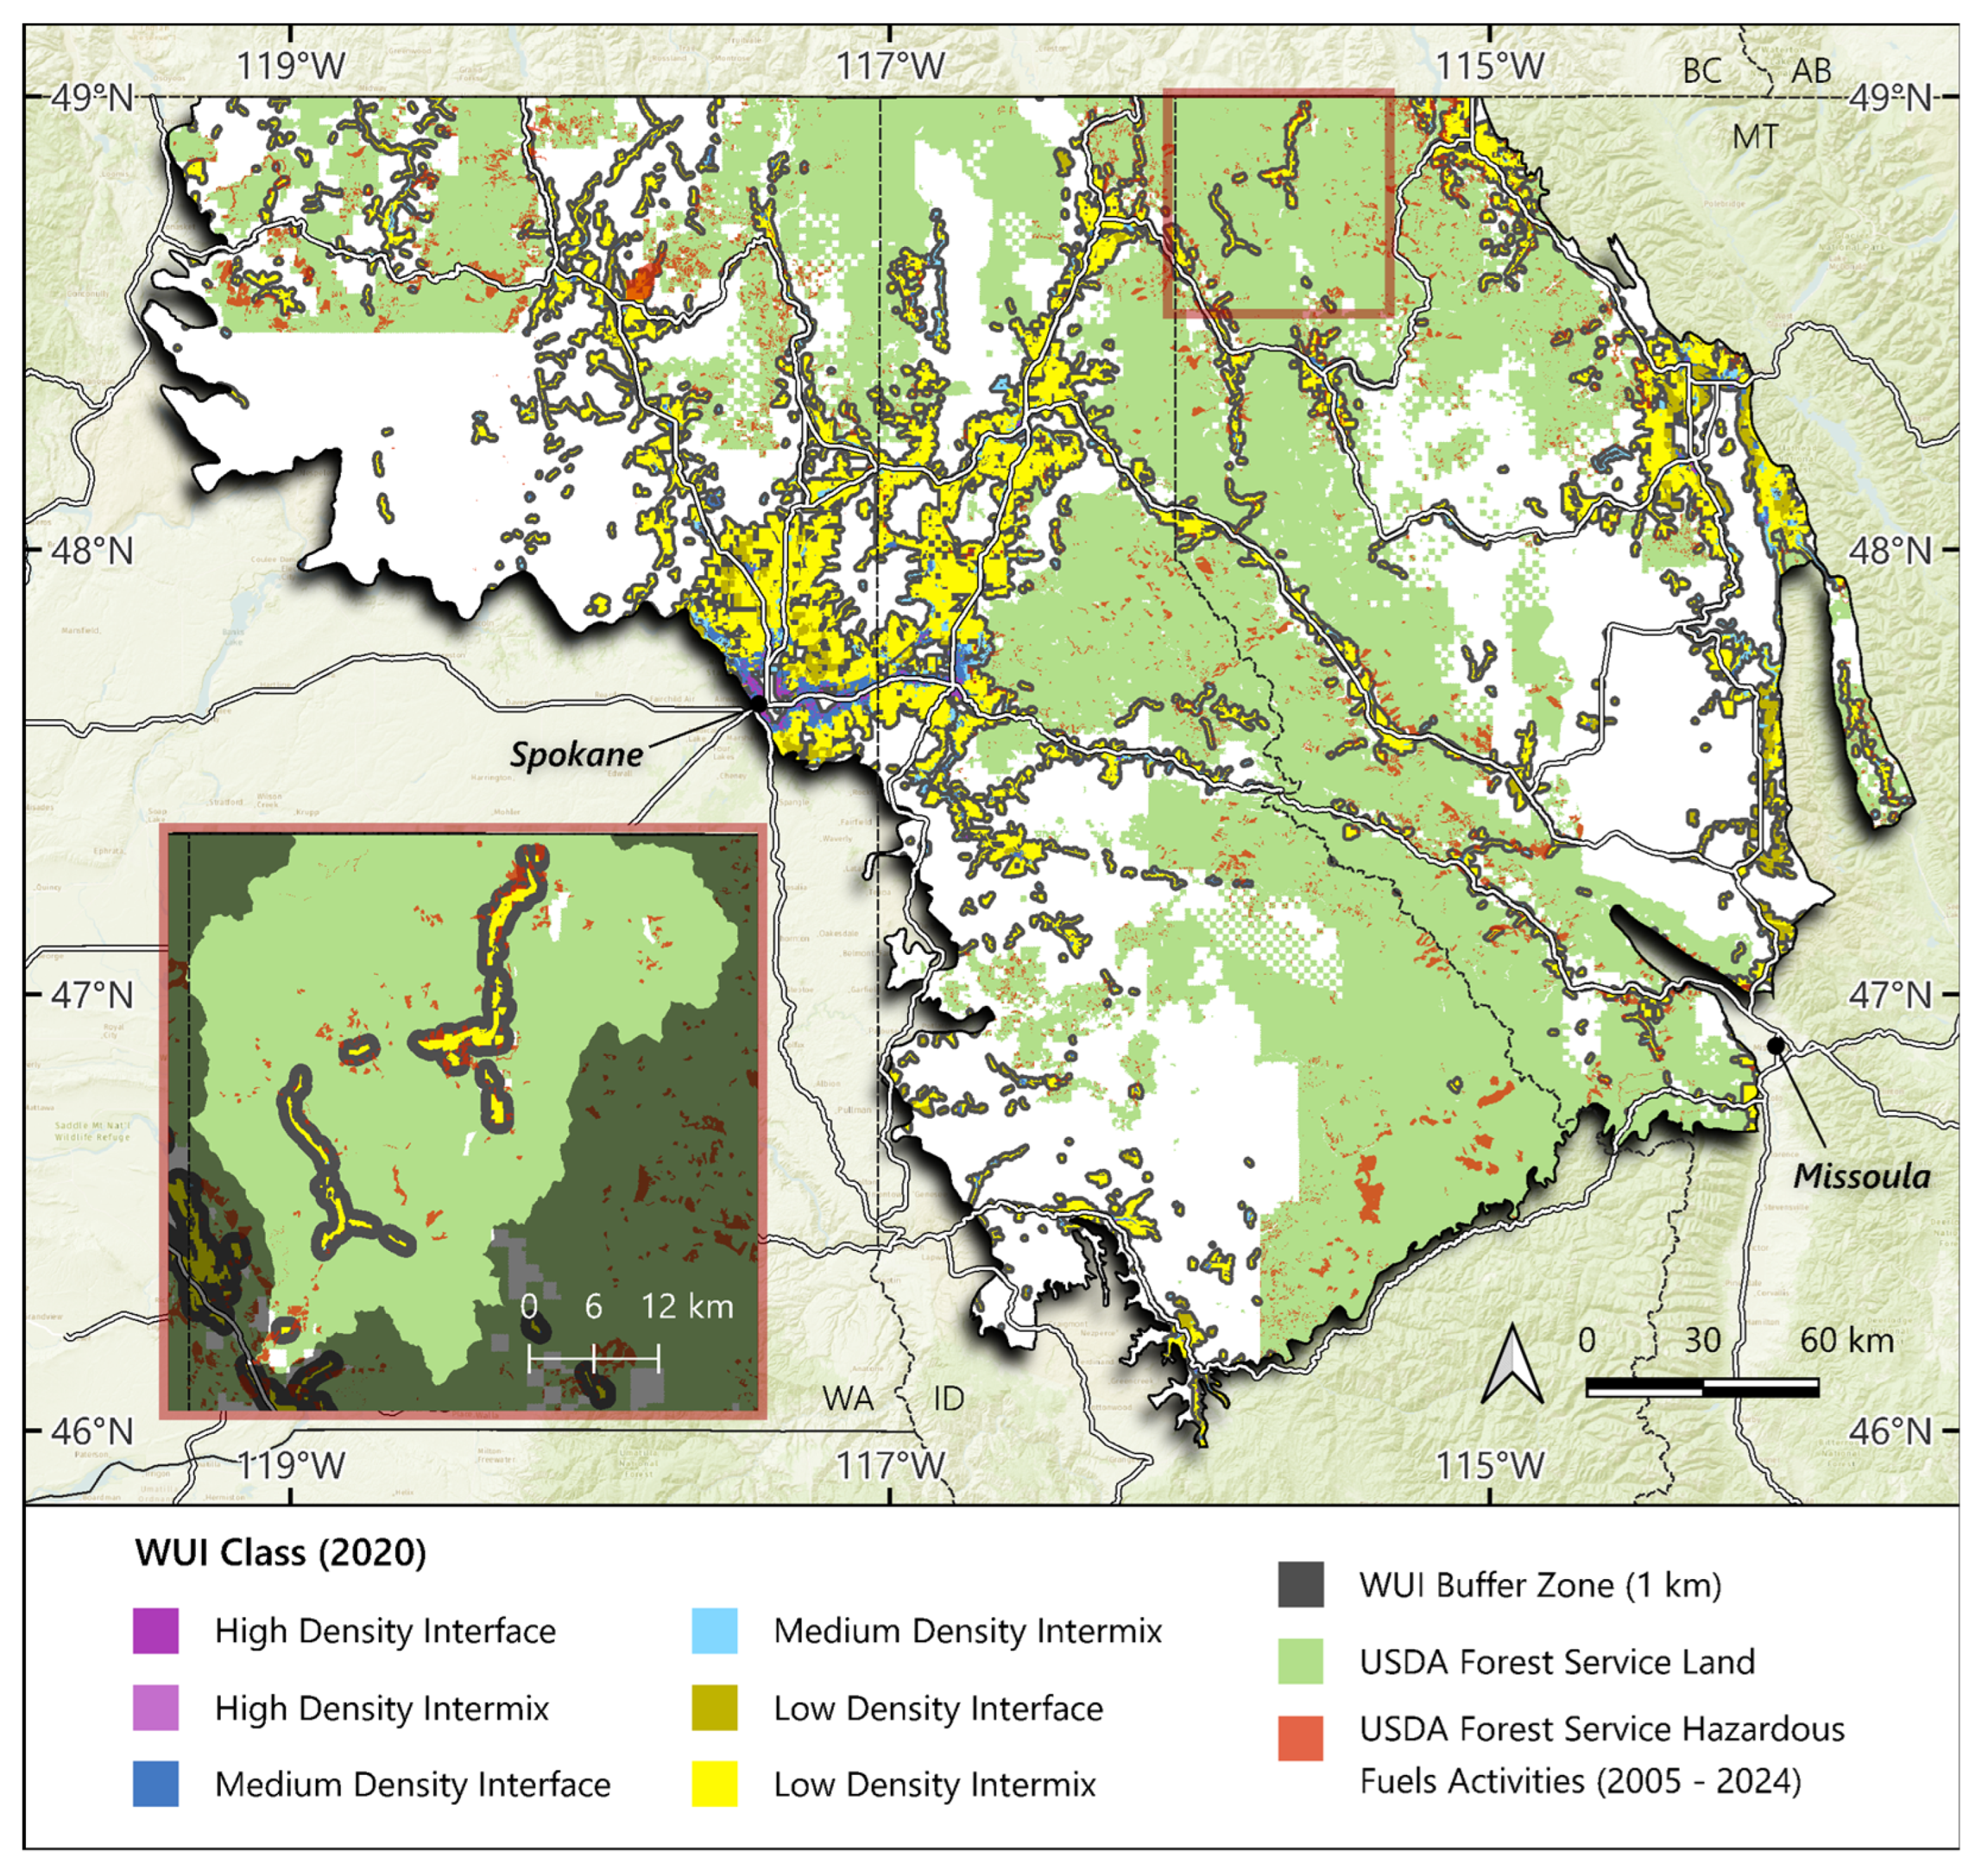
Figure 6.
USDA Forest Service fuel treatment types and total treatment footprint relative to their proximity to WUI.
Figure 6.
USDA Forest Service fuel treatment types and total treatment footprint relative to their proximity to WUI.
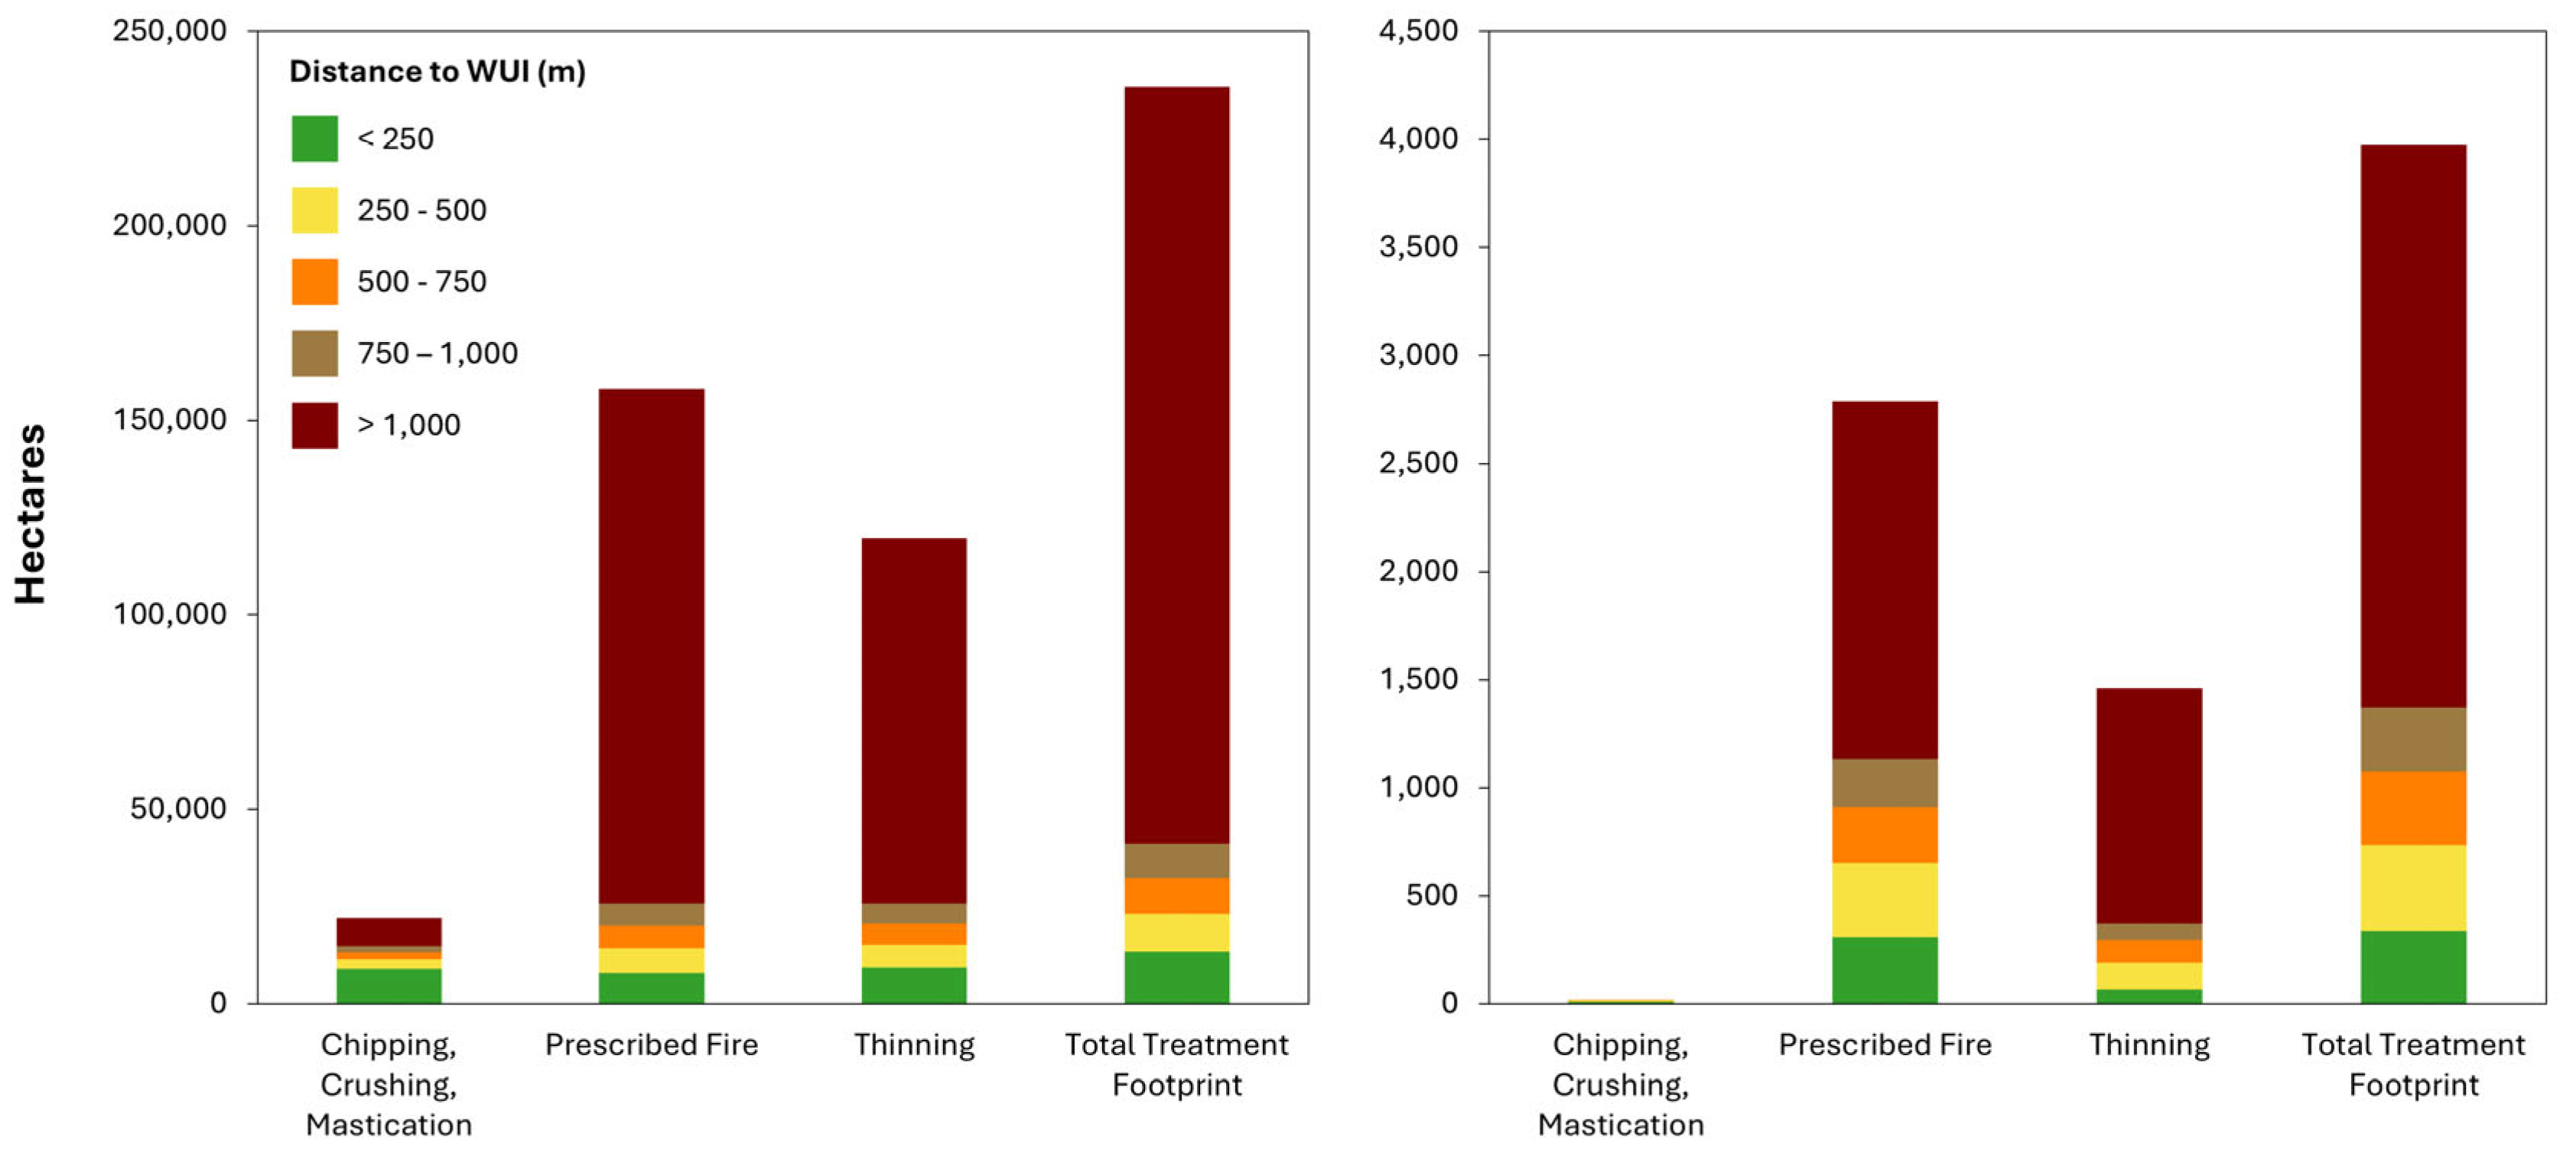
Figure 7.
Model median growing degree-days for historical (1950-2010) and model median projected change for the 2010-2039, 2040-2069, and 2070-2099 periods relative to the historical values under the intermediate (SSP2-45) and very high (SSP5-85) emissions scenario for the Northern Rockies ecoregion and the Yaak River Watershed insert (outline in black, also see Figure S13). Growing degree-days is defined as the total number of annual degree-days above 10°C and is an indicator of heat accumulation and heat availability for plant growth.
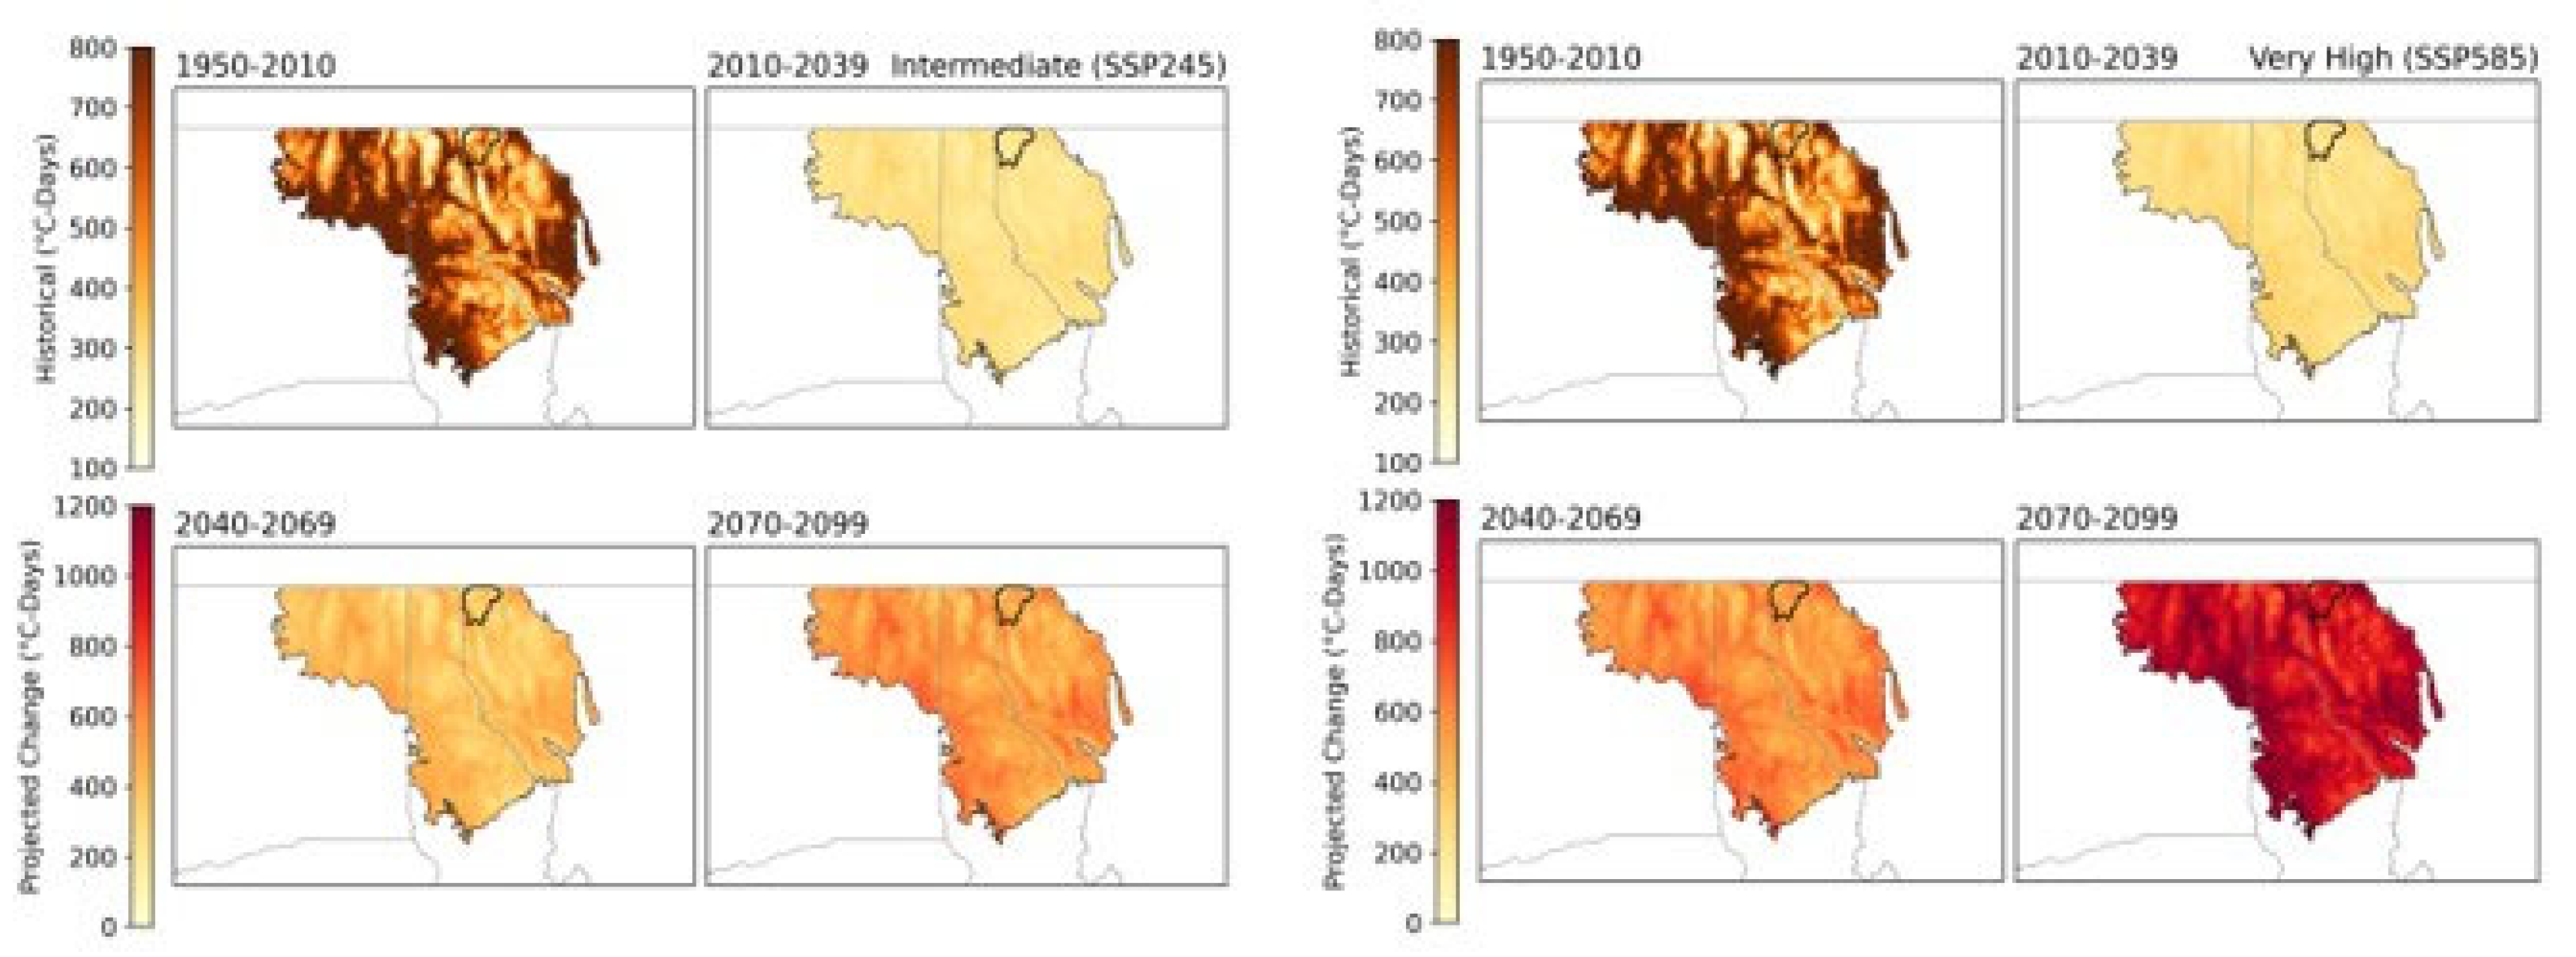
Figure 8.
Model median historical (1950-2010) mean summer (JJA) maximum temperature and model median projected change in mean summer maximum temperature for time periods 2010-2039, 2040-2069 and 2070-2099 relative to the historical period under the lower (SSP2-45) and higher (SSP5-85) emissions scenario for the Northern Rockies Ecoregion, including the Yaak River Watershed insert (outlined in black, also see Figure S14).
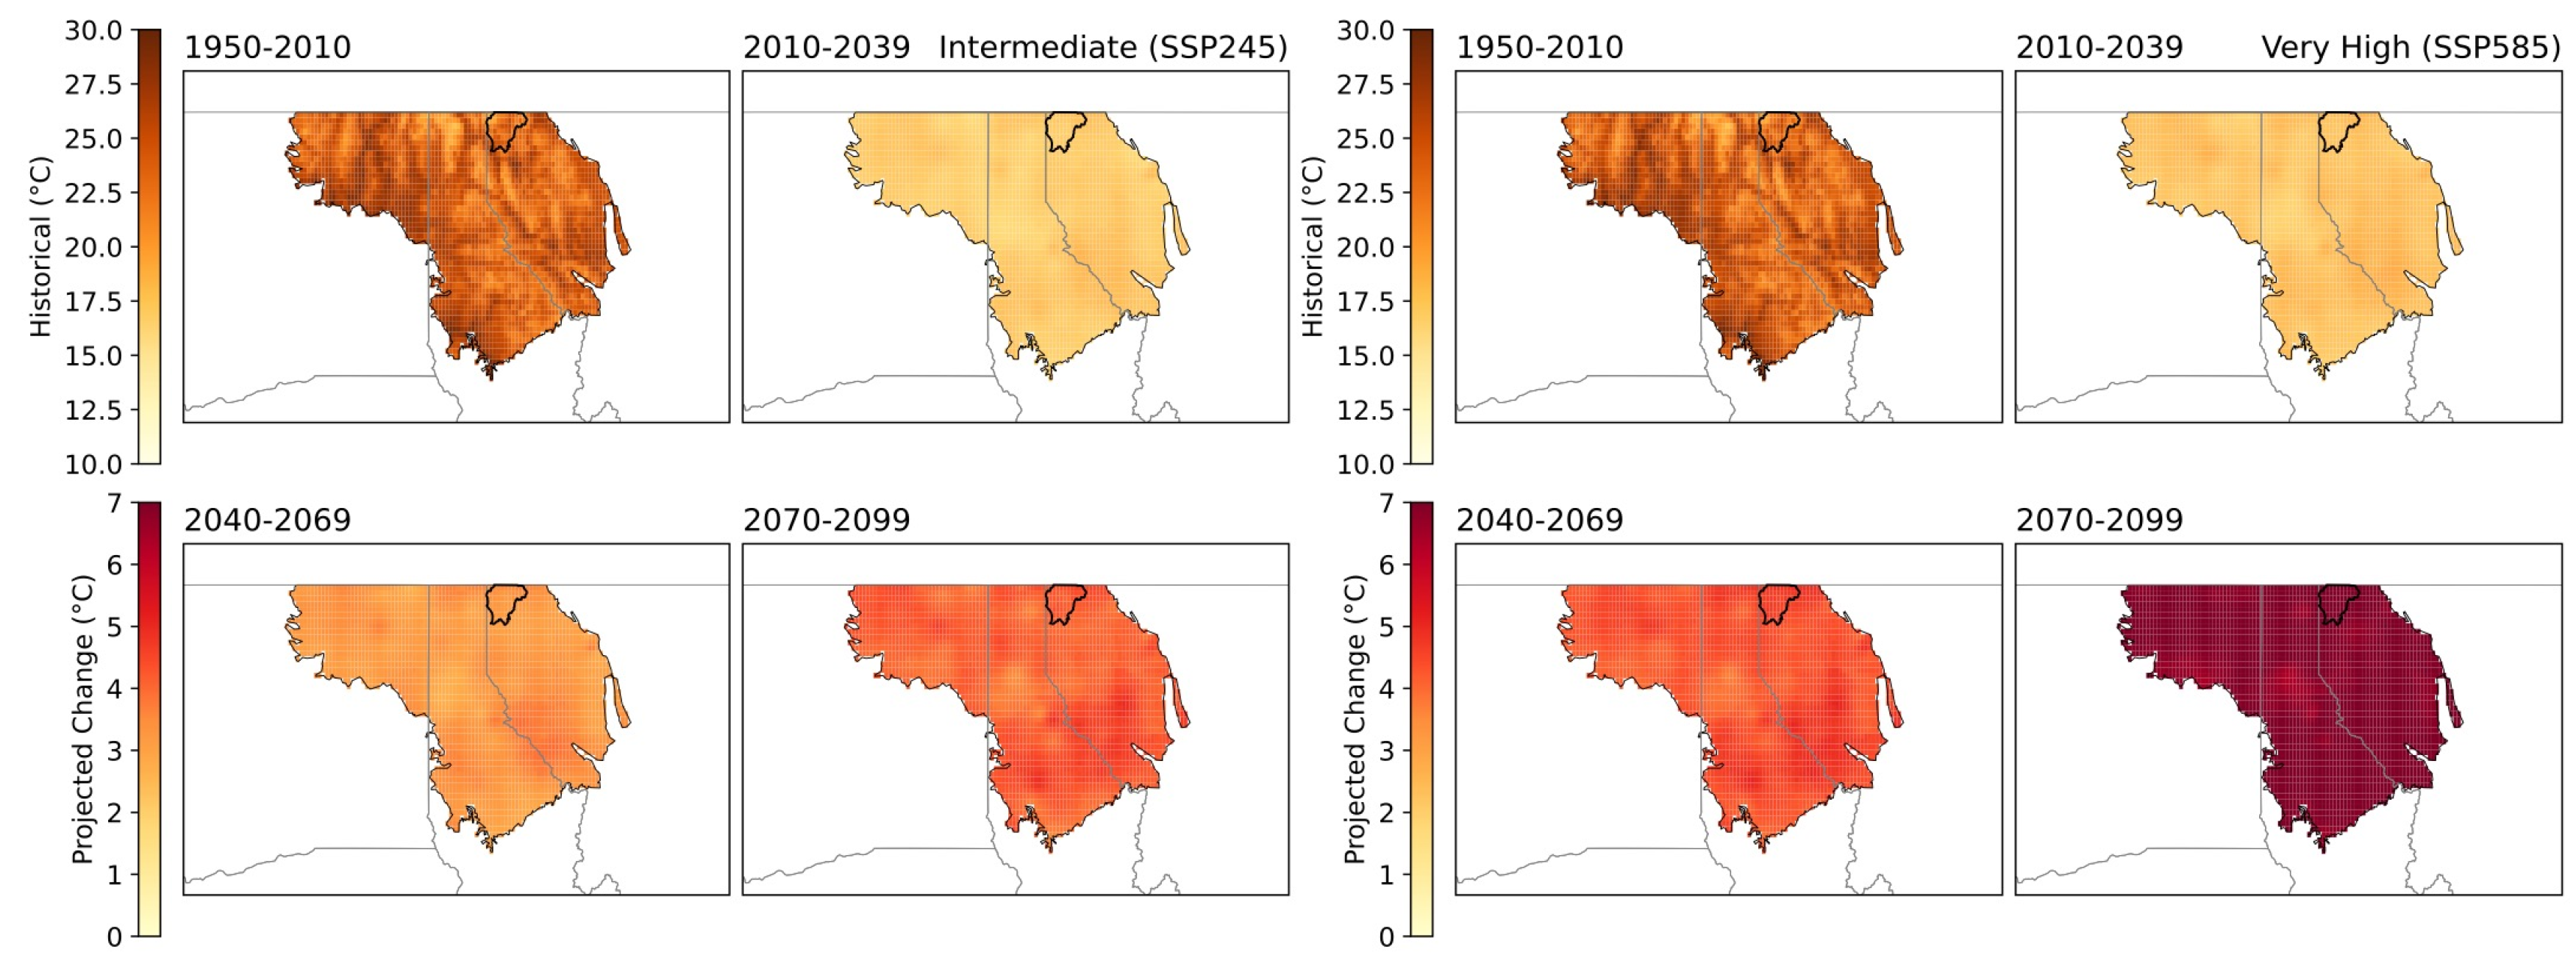
Figure 9.
Model median historical (1950-2010) total summer (JJA) precipitation and model median projected change in total summer precipitation for time periods 2010-2039, 2040-2069 and 2070-2099 relative to the historical period under the intermediate (SSP2-45) and very high (SSP5-85) emissions scenario for the Northern Rockies Ecoregion, including the Yaak River Watershed insert (outlined in black, also see Figure S15).
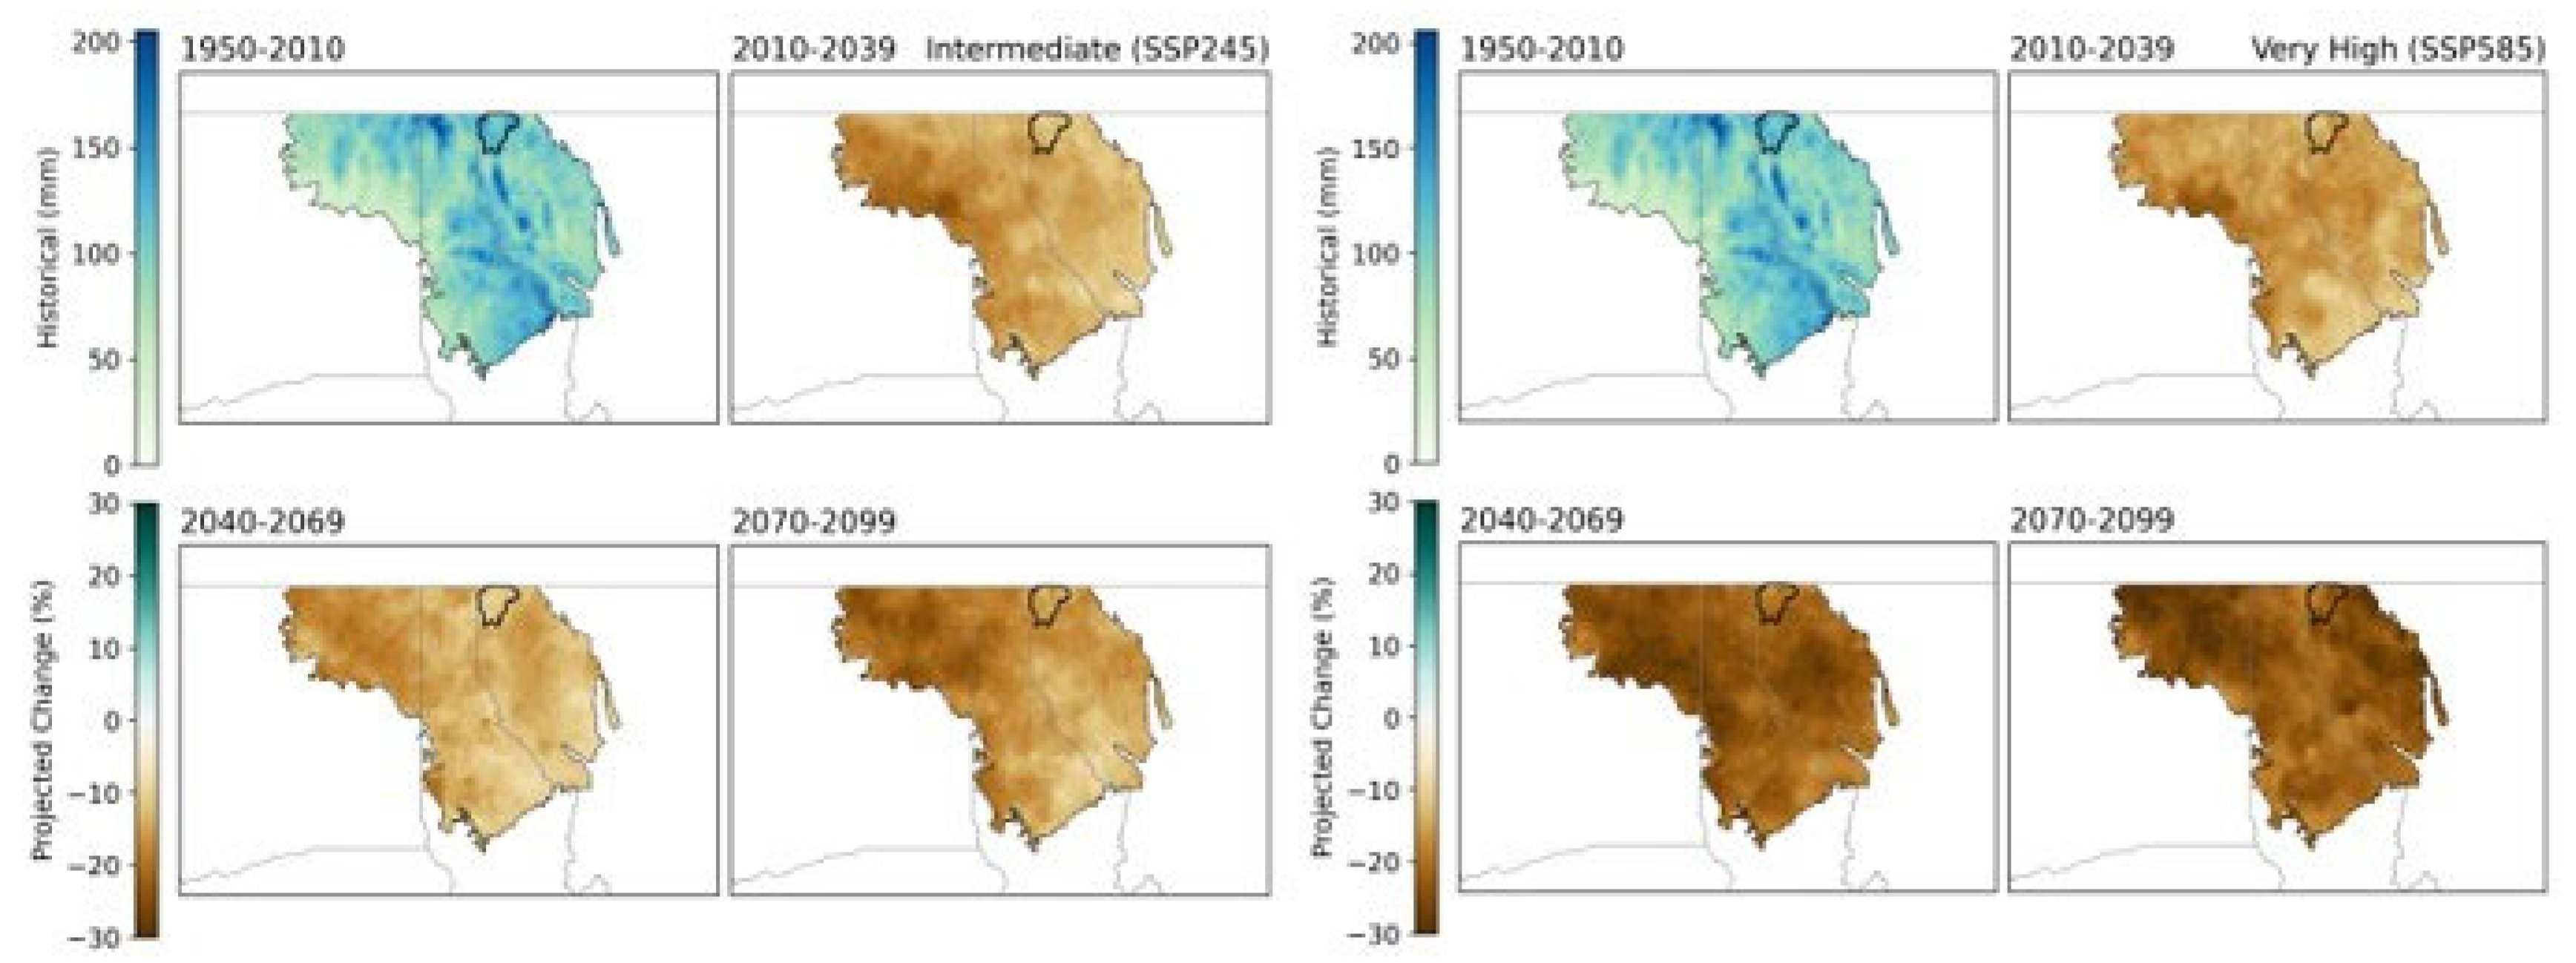
Figure 10.
Model median basin behavior, or dominant winter precipitation type, for the historical period (1950-2010) and the model median projected basin behavior for the 2020-2049, 2040-2069, and 2070-2099 periods under the intermediate (RCP 4.5) and very high (RCP 8.5) climate scenario for the Northern Rockies Ecoregion, including the Yaak River Watershed insert (outlined in bold). Results are summarized to the HUC8s. Basin behavior is defined as the ratio of annual peak snow-water equivalent to total October-March precipitation and is an indicator of peak streamflow timing, dominant precipitation type that falls during winter, and potential low water supply from streamflow in the summer.
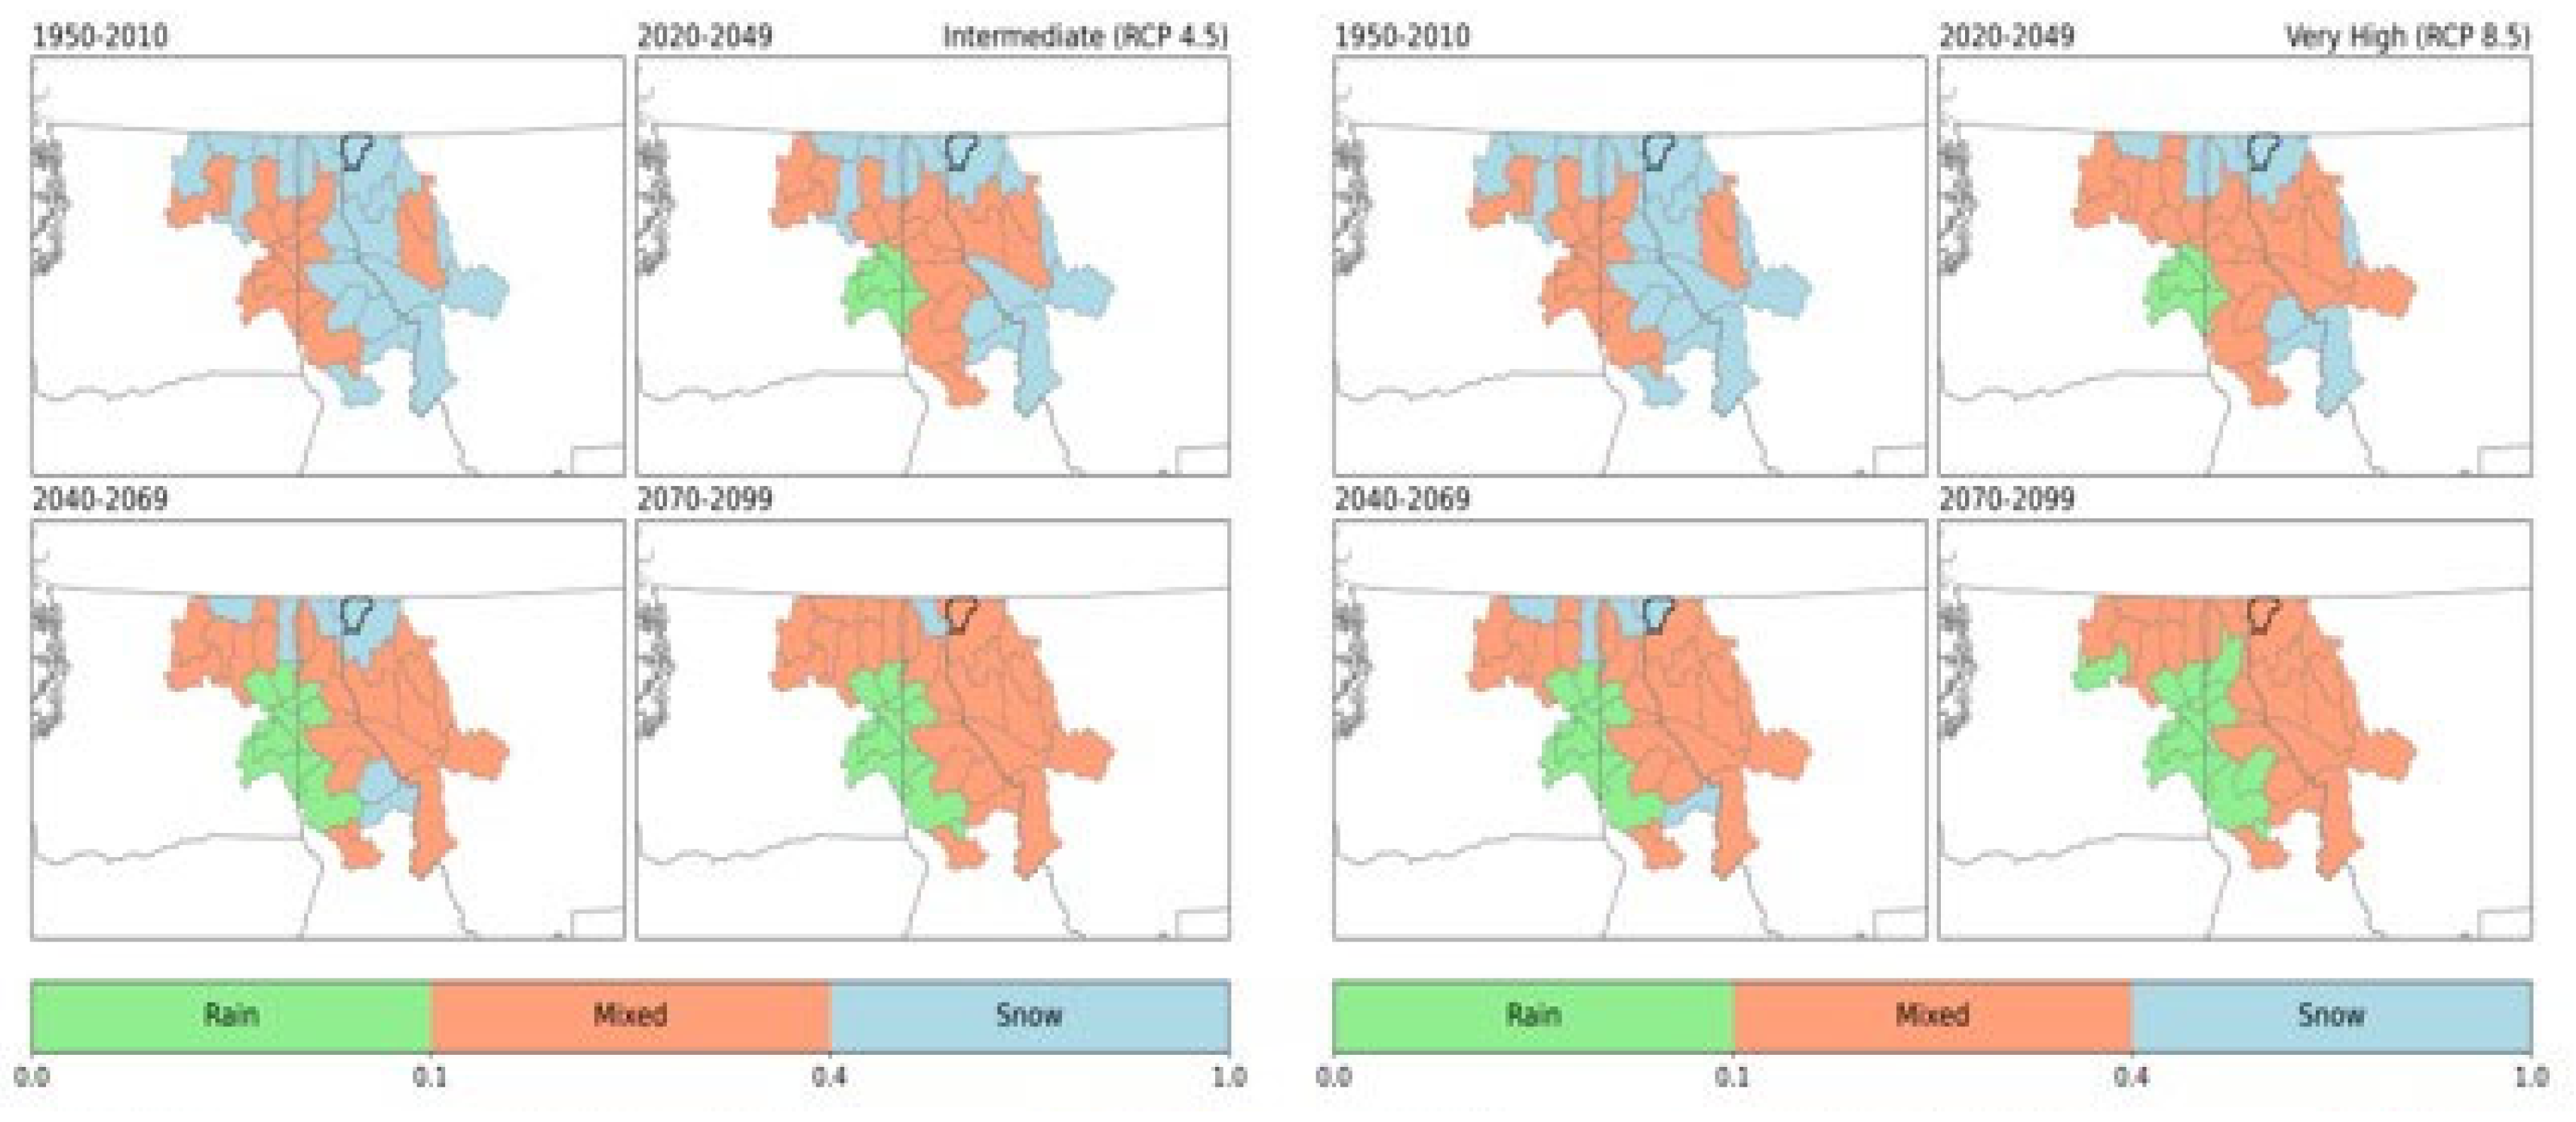
Figure 11.
The average historical (1950-2010) and future likelihood of climate and fuel conditions being conducive for wildfire for the 2020-2049, 2040-2069, and 2070-2099 periods under both the intermediate (RCP 4.5) and very high (RCP 8.5) climate change scenarios for the Northern Rockies Ecoregion and the Yaak River Watershed insert (outline in black, also see Figure S16). These projections assume the fire suppression efforts are implemented in the future. We define the wildfire likelihood as the proportion of years within each year range with climate and fuel conditions being conducive for wildfire.
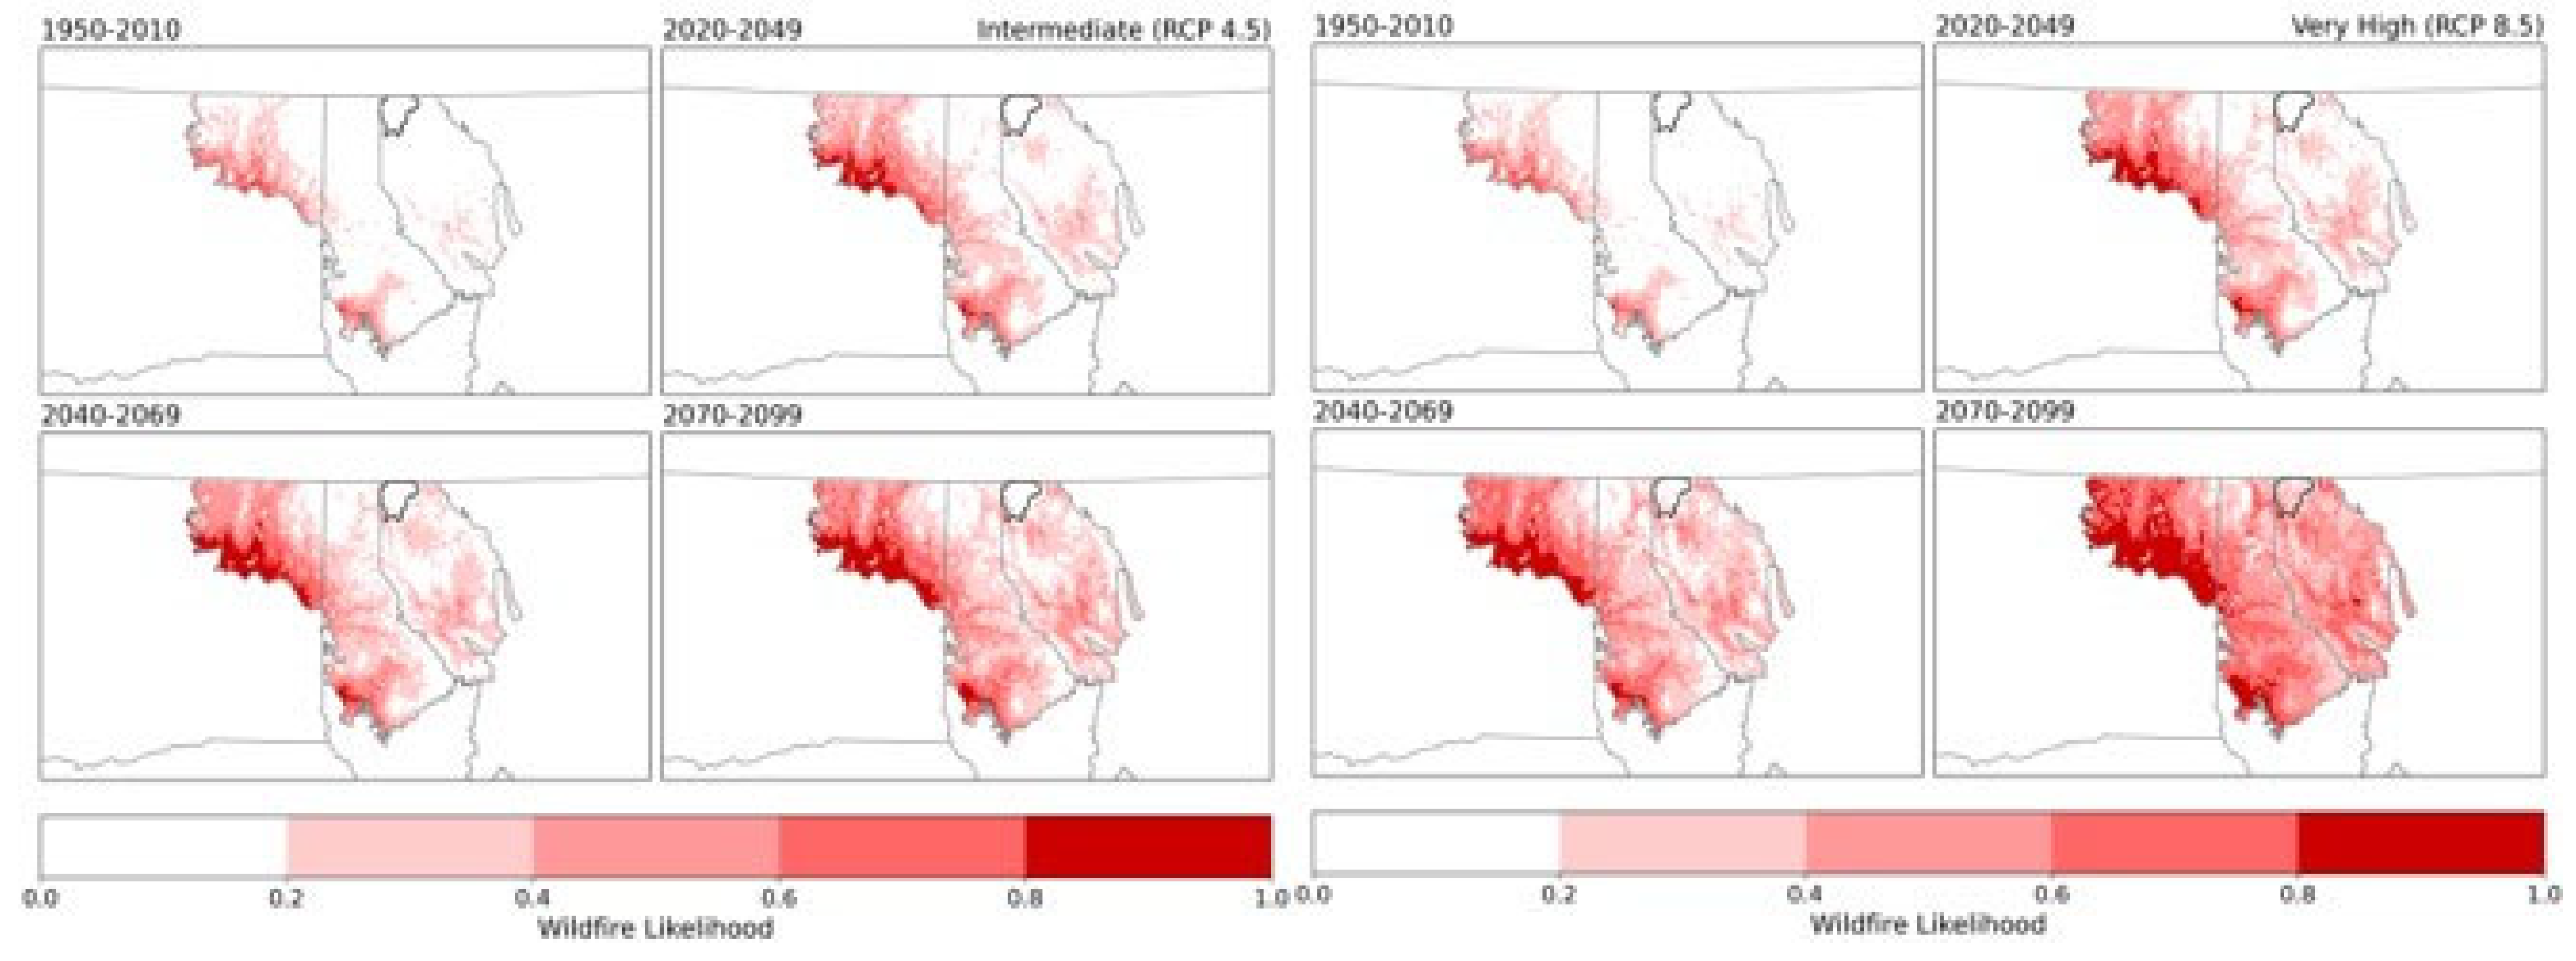

Table 1.
Existing Vegetation Types (EVT) distribution across the Northern Rockies Ecoregion (NRE) and Yaak River Watershed (YRW). Note: we used only the specific EVT from LANDFIRE grouped into broader categories as discussed in the methods. Protected refers to GAP 1 and 2 only. IRA+ is GAP status 2.5 as noted.
| EVT Category | NRE | YRW | ||
|---|---|---|---|---|
| Protected | IRA+ | Protected | IRA+ | |
| Agricultural & Developed | 7,905 | 8,452 | 0 | 3 |
| (1.0) | (1.1) | (0.0) | (0.2) | |
| Aspen | 11 | 25 | 0 | 0 |
| (1.5) | (3.2) | (0.0) | (0.0) | |
| Dry-Mesic Mixed Conifer | 31,218 | 232,763 | 55 | 6,981 |
| (1.4) | (10.3) | (0.2) | (22.1) | |
| Grassland | 4,988 | 23,621 | 41 | 417 |
| (1.6) | (7.8) | (3.0) | (30.4) | |
| Lodgepole Pine | 7,636 | 101,244 | 11 | 2,612 |
| (3.2) | (42.8) | (0.2) | (42.0) | |
| Mesic Mixed Conifer | 48,518 | 482,055 | 105 | 14,494 |
| (2.2) | (21.5) | (0.1) | (19.4) | |
| Open Water | 4,323 | 6,156 | 16 | 35 |
| (2.0) | (2.9) | (3.9) | (8.3) | |
| Other Conifer | 51 | 366 | 0 | 3 |
| (0.4) | (3.0) | (0.0) | (7.4) | |
| Ponderosa Pine | 7,145 | 16,176 | 0 | 74 |
| (1.4) | (3.1) | (0.0) | (8.7) | |
| Riparian | 4,583 | 10,655 | 53 | 258 |
| (2.8) | (6.5) | (2.0) | (9.9) | |
| Shrubland | 19,588 | 106,346 | 327 | 1,958 |
| (2.5) | (13.5) | (7.9) | (47.2) | |
| Subalpine | 37,923 | 303,413 | 962 | 19,407 |
| (6.7) | (53.8) | (2.7) | (55.2) | |
| Unvegetated or Sparse | 5,902 | 20,788 | 70 | 254 |
| (11.6) | (40.8) | (17.8) | (64.9) | |
| Western Larch | 427 | 2,849 | 0 | 101 |
| (1.5) | (9.9) | (0.0) | (18.8) | |
| Wetland | 3,109 | 3,297 | 2 | 5 |
| (12.5) | (13.3) | (0.8) | (1.7) | |
| Total ha | 183,327 | 1,318,207 | 1,642 | 46,601 |
| (% of total region area) | (2.2) | (16.1) | (1.0) | (29.2) |
Table 2.
Protection levels (GAP 1, 2, IRA+) of mature forests (which includes old growth) across the Northern Rockies Ecoregion (NRE) and Yaak River Watershed (YRW) by forest EVT categories. Forest maturity data were obtained from DellaSala et al. 2022 [27].
Table 2.
Protection levels (GAP 1, 2, IRA+) of mature forests (which includes old growth) across the Northern Rockies Ecoregion (NRE) and Yaak River Watershed (YRW) by forest EVT categories. Forest maturity data were obtained from DellaSala et al. 2022 [27].
| NRE | |||||
| Forest Type (EVT) | Total (ha) | Mature (ha) | Mature (%) | Protected Mature (%) | +IRA Mature (%) |
| Aspen | 782 | 136 | 17.4 | 0.9 | 1.5 |
| Dry-Mesic Mixed Conifer | 2,269,618 | 530,783 | 23.4 | 1.4 | 13.9 |
| Lodgepole Pine | 236,792 | 33,282 | 14.1 | 3.3 | 55.4 |
| Mesic Mixed Conifer | 2,239,953 | 1,087,398 | 48.5 | 2.8 | 27.8 |
| Ponderosa Pine | 527,108 | 57,266 | 10.9 | 0.8 | 1.4 |
| Subalpine | 563,920 | 139,982 | 24.8 | 4.6 | 53.7 |
| Western Larch | 28,797 | 3,095 | 10.7 | 1.5 | 18.4 |
| All Types | 5,866,971 | 1,851,943 | 31.6 | 2.4 | 25.5 |
| YRW | |||||
| Aspen | 0 | 0 | 0.0 | 0.0 | 0.0 |
| Dry-Mesic Mixed Conifer | 31,582 | 5,963 | 18.9 | 0.5 | 23.9 |
| Lodgepole Pine | 6,216 | 1,093 | 17.6 | 0.2 | 49.1 |
| Mesic Mixed Conifer | 74,810 | 33,457 | 44.7 | 0.2 | 24.0 |
| Ponderosa Pine | 853 | 16 | 1.8 | 0.0 | 2.9 |
| Subalpine | 35,182 | 5,262 | 15.0 | 0.2 | 51.9 |
| Western Larch | 537 | 16 | 3.0 | 0.0 | 34.3 |
| All Types | 149,180 | 45,806 | 30.7 | 0.25 | 27.8 |
Table 3.
GAP status of suitable habitat for the 8 focal wildlife species within the Northern Rockies Ecoregion (NRE) and Yaak River Watershed (YRW). Suitable habitats for all other species were from the 2001 GAP Habitat Suitability dataset. For forest carnivore and avian species, only GAP status of overlapping suitable habitat is shown. See Table S5, S6 for GAP status for individual species.
| NRE | ||||||
| Habitat Suitability | GAP ha | Total ha | ||||
| (%) | ||||||
| 1 | 2 | 2.5 | 3 | 4 | ||
| Canada Lynx, Fisher, and Marten Overlap | 23,717 | 25,954 | 539,087 | 875,208 | 244,819 | 1,708,784 |
| (1.4) | (1.5) | (31.5) | (51.2) | (14.3) | ||
| All Forest Carnivore Species Overlap | 5,063 | 2,718 | 55,478 | 20,758 | 5,363 | 89,379 |
| (5.7) | (3.0) | (62.1) | (23.2) | (6.0) | ||
| All Avian Species Overlap | 34,843 | 63,968 | 751,436 | 1,574,110 | 909,914 | 3,334,271 |
| (1.0) | (1.9) | (22.5) | (47.2) | (27.3) | ||
| Grizzly Bear Denning | ||||||
| Low | 10,394 | 23,447 | 404,046 | 629,870 | 201,745 | 1,269,502 |
| (0.8) | (1.8) | (31.8) | (49.6) | (15.9) | ||
| Medium | 21,919 | 13,964 | 349,485 | 174,816 | 32,895 | 593,079 |
| (3.7) | (2.4) | (58.9) | (29.5) | (5.5) | ||
| High | 19,681 | 4,540 | 111,827 | 34,327 | 6,198 | 176,572 |
| (11.1) | (2.6) | (63.3) | (19.4) | (3.5) | ||
| YRW | ||||||
| Canada Lynx, Fisher, and Marten Overlap | 0 | 787 | 24,680 | 51,815 | 542 | 77,823 |
| (0.0) | (1.0) | (31.7) | (66.6) | (0.7) | ||
| All Forest Carnivore Species Overlap | 0 | 552 | 2,492 | 1,033 | 0 | 4,076 |
| (0.0) | (13.5) | (61.1) | (25.3) | (0.0) | ||
| All Avian Species Overlap | 0 | 1,084 | 38,666 | 75,025 | 1,979 | 116,755 |
| (0.0) | (0.9) | (33.1) | (64.3) | (1.7) | ||
| Grizzly Bear Denning | ||||||
| Low | 0 | 142 | 17,824 | 22,424 | 80 | 40,471 |
| (0.0) | (0.4) | (44.0) | (55.4) | (0.2) | ||
| Medium | 0 | 717 | 13,167 | 5,574 | 105 | 19,563 |
| (0.0) | (3.7) | (67.3) | (28.5) | (0.5) | ||
| High | 0 | 561 | 3,942 | 1,134 | 10 | 5,647 |
| (0.0) | (9.9) | (69.8) | (20.1) | (0.2) | ||
Table 4.
NRE-average model median growing degree-days, summer mean temperature, and summer precipitation for historical (1950-2010) and model median projected change for the 2010-2039, 2040-2069, and 2070-2099 periods relative to the historical values under the intermediate (SSP2-45) and very high (SSP5-85) emissions scenario. Growing degree-days is defined as the total number of annual degree-days above 10°C and is an indicator of heat accumulation and heat availability for plant growth.
| Metric & Scenario | 1950-2010 | 2010-2039 | 2040-2069 | 2070-2099 |
| Growing Degree Days (Intermediate) |
637°C-days (553 to 670) |
+227°C-days (162 to 557) |
+391°C-days (267 to 809) |
+548°C-days (324 to 886) |
| Growing Degree Days (Very High) |
637°C-days (553 to 670) |
+264°C -days (141 to 572) |
+590°C-days (381 to 988) |
+1021°C-days (+603 to 1656) |
| Summer Mean Temperature (Intermediate) | 15.2°C (14.4 to 15.4) |
+1.9°C (1.1 to 4.0) |
+3.0°C (1.8 to 5.7) |
+4.0°C (2.3 to 6.2) |
| Summer Mean Temperature (Very High) | 15.2°C (14.4 to 15.4) |
+2.1°C (1.1 to 4.3) |
+4.2°C (2.8 to 6.8) |
+6.9°C (4.1 to 10.3) |
| Summer Precipitation (Intermediate) |
99mm (91 to 109) |
-16% (-27 to +7) |
-13% (-33 to -3) |
-18% (-43 to +10) |
| Summer Precipitation (Very High) |
102mm (91 to 109) |
-17% (-35 to +11) |
-24% (-49 to +6) |
-24% (-59 to +42) |
Disclaimer/Publisher’s Note: The statements, opinions and data contained in all publications are solely those of the individual author(s) and contributor(s) and not of MDPI and/or the editor(s). MDPI and/or the editor(s) disclaim responsibility for any injury to people or property resulting from any ideas, methods, instructions or products referred to in the content. |
© 2025 by the authors. Licensee MDPI, Basel, Switzerland. This article is an open access article distributed under the terms and conditions of the Creative Commons Attribution (CC BY) license (http://creativecommons.org/licenses/by/4.0/).
Copyright: This open access article is published under a Creative Commons CC BY 4.0 license, which permit the free download, distribution, and reuse, provided that the author and preprint are cited in any reuse.


