
Submitted:
31 March 2025
Posted:
01 April 2025
You are already at the latest version
Abstract
This research investigates the adsorption potential of four types of absorbents produced from agro-industrial waste (grape pomace - GP, tree pruning - TP, sugarcane bagasse - SB and eucalyptus sawdust - ES) for the uptake of Methylene Blue (MB) dye from aqueous solution. A kinetic model based on a hybrid-order rate equation was fitted to experimental data. The result showed that from the biochars obtained in dry torrefaction at 300 ºC - 60 min, BGP-300 presented the highest mass yield (58.84%) and energy yield (69.56%), followed by the BTP-300 > BES-300 > BSB-300. Adsorption studies showed that BGP-300 had a better performance in the uptake of MB, with removal efficiency (R_e) of 96.5% and adsorption capacity at equilibrium (q_e) of 9.3 mg g-1, followed by tree pruning biochar (BTP-300), R_eof 65.0% and q_eof 5.3 mg g-1. Whereas eucalyptus sawdust (BES-300) and sugarcane bagasse (BSB-300) biochar did not provide significant removal of MB. Adsorption kinetic is best described by second order rate with R² varying from 0.75 to 0.96. Desorption studies show a low concentration released to the solution, indicating that adsorption may occur physically. Therefore, this research provides comprehensive insights into the adsorption characteristics of different biochar, emphasizing the potential of BGP-300 and BTP-300 as effective for MB uptake from aqueous solution.
Keywords:
adsorption
; thiazine dye
; grape pomace
; tree pruning
; kinetic modelling
1. Introduction
Increasing environmental challenges, along with rising fuel costs and diminishing oil reserves, have generated a need to develop sustainable solutions to manage waste and recover bioresources for conversion into value-added products [1]. In this context, biomass has recently gained significant interest in the sustainable production of fuels and chemicals owing to its abundance, renewability, chemical composition, and sustainable characteristics [2]. Worldwide, 181.5 billion tons of lignin-rich biomass, such as wood and crop waste, are generated annually, demonstrating the resource’s availability [2].
Most thermochemical conversion technologies (e.g., gasification, rapid pyrolysis, microwave pyrolysis) are carried out at higher temperatures (>300 °C) and require higher initial energy input [3]. In contrast, low-temperature torrefaction technology can achieve biochar (carbon-rich porous material) production with high yield and low energy intake. Compared to raw biomass, torrefaction biochar has higher calorific value, carbon content, hydrophobicity and grindability [2,3]. Additionally, the torrefaction condensate is useful as a pesticide, herbicide, and pest prevention for plant protection [4].
Torrefaction is a mild pyrolysis process which is applicable for producing solid biofuel, commonly known as hydrochar or biochar. The process involves treating biomass at relatively low temperatures (200–300 °C) for less than 30 min in an O2-free environment (often using inert gas) under atmospheric pressure. During torrefaction, the feedstock undergoes various transformation reactions, such as polymerization, decomposition, and carbonization [2]. The weight loss of biomass is around 30% due to the degradation of hemicellulose content in the temperature range of 200––300 °C [2,5]. This enhancement is beneficial for long-term storage or long-distance transportation.
Originally, torrefied biomass was thought to be useful for energy purposes. However, recent studies have demonstrated the use of biochar as an effective adsorbent of contaminants from water [2,3,6,7,8,9,10]. Its porous structure and significant specific surface area provide an ideal environment for the adsorption and fixation of these contaminants, thereby reducing their adverse effects on aquatic ecosystems. Biochar has fewer pores than biochar produced at higher temperatures, but it comprehends more oxygen-containing functional groups [3]. Additionally, the sources of feedstock used for biochar production are extensive and complex, and it is known to influence the quality of the biochar produced. Recent studies have demonstrated the use of diverse torrefied feedstock in the removal of contaminants from aqueous solutions, such as the use of kiwi branches [9] and bamboo shoot shell [7] biochar for the removal of hexavalent chromium; bamboo [8] biochar for the removal of lead; rapeseed [11], seaweed [11], white wood [11], camellia shell [12], microalgal [6] biochar for the removal of colorant methylene blue (MB); and microalgal [6] biochar for the removal of colorant Congo red.
Among the contaminants, dyes stand out as they are emerging contaminants, i.e., a large group of chemicals discovered in the environment due to regular human activities such as domestic, agricultural, and industrial processes [13]. Dye contamination in wastewater of textile industries is a crucial environmental concern. A variety of dyes and additives are widely used in industrial applications including textiles, food, paint, paper, printing, carpet, rubber, leather treatment, wool, and personal care products [3]. It is estimated that over 10,000 varieties of both natural and synthetic dyes are produced annually, with a global output of over 7 × 10⁵ tons per year [3]. The chemical complexity, stability, and recalcitrance of untreated dye effluents make them one of the leading sources of causing breathing difficulties, irregular heartbeats, skin rashes, dizziness, cancer and other allergic reactions [14,15,16]. Dyes present in water sources can pose challenges for conventional water treatment processes, as they may not be effectively removed by common treatment methods. Therefore, necessary treatments are required to ensure the safe discharge of wastewater into the environment.
Up to date, limited literature on the adsorption of dye removal using agro-industrial waste derived from the torrefaction conversion process is available. Therefore, this study aims to address such a research gap by evaluating the removal of emerging contaminant using four different types of torrefied agro-industrial waste (grape pomace, tree pruning, sugarcane bagasse and eucalyptus sawdust) by batch adsorption of cationic colorant methylene blue (MB), one of the major thiazine dyes.
2. Materials and Methods
2.1. Biomass
Four different types of feedstocks were used to produce biochar: grape bagasse, tree pruning, sugarcane bagasse and eucalyptus sawdust.
The grape pomace used in this study is from a winery in the northeastern region of Brazil. The grape pomace residue was stored in polyethylene bags and transported under refrigeration to prevent sample fermentation. As received, the material was air-dried and homogenized.
The tree pruning residues were collected from the pruning of mango (Mangifera indica) and pitanga (Eugenia uniflora) trees on the Lorena School of Engineering campus, University of Sao Paulo. The pruning residues were sun-dried and grounded in a knife mill with a 9 mm sieve.
Sugarcane bagasse was obtained from a sugar and alcohol plant from southeastern region of Brazil. Sugarcane bagasse was provided wet, air-dried and homogenized for this work.
The eucalyptus sawdust was supplied by a sawmill in the Paraíba Valley Region, in the interior of the state of São Paulo, already dry and powdered.
2.2. Biochar Production
The dry torrefaction, thermochemical conversion known as mild pyrolysis, was carried out on a laboratory scale in a reactor with a processing capacity of 350 g per batch, this quantity was variable according to the apparent density of the biomass. The raw waste was dried at 105 ºC for 24 hours, before the process, to standardize the samples (Table 1). The reaction occurred in an inert nitrogen atmosphere at 300 ºC (most severe temperature of the torrefaction process [14,15,16]), with heating rate of 5 ºC/min and residence time of 60 minutes. The biochar produced was named after the feedstock used in the process followed by temperature of the thermochemical process: biochar grape pomace (BGP-300), biochar tree pruning (BTP-300), biochar sugarcane bagasse (BSB-300) and biochar eucalyptus sawdust (BES-300) (Table 1).
2.3. Physical and Chemical Properties of Biochar and Feedstocks
The mass yield (YM) and energy yield (YE) were obtained according to Bridgeman et al. (2008) [17] using Equations (1) and (2).
The moisture content (MC) (ASTM D3173 [18]), ash (ASTM D3174 [19]), volatile matter (VM) and fixed carbon (FC) (ASTM D3175 [20]) are part of the immediate analysis that determines the characteristics of the biochar.
The higher heating value (HHV) was calculated according to Parikh (2005) [21] from the immediate analysis of the material, according to Equation (3).
2.4. Preparation of Adsorbent and MB Solution
For the experimental procedures, the samples were disintegrated with a knife mill and sieved to achieve a target size of particles 0.6 - 1.2 mm in diameter (Table 1).
MB solution was prepared in laboratory prior to adsorption analysis using distilled water and MB analytical grade (Synth®). The natural pH of the solution was determined to be 6.0. The absorbance was determined using UV–VIS (model K37-UVVIS from KASVI) and a quartz container with 10.0 mm optical path.
2.5. Adsorption Studies
Batch tests were performed on an orbital shaker to determine the influence of time, initial dye concentration during sorption studies and adsorbent type (BGP-300, BTP-300, BSB-300 and BES-300). The tests were carried out at room temperature (30 °C), using 125 mL Erlenmeyer flasks with 50 mL of MB solution (40 and 120 mg L-1, real wastewater MB concentration [22] and a drastic scenario considering more concentrated wastewater, respectively) and 0.5 g of adsorbent (previously reported as an ideal portion of adsorbent and solution volume [23]). The system was shaken on an orbital shaker at 100 rpm frequency and aliquots were taken at 0, 1, 5, 15, 30, 60, 90, 120, 300, 480 and 1440 min for concentration determination. At 1440 min equilibrium was considered to be reached.
For the concentration determination, an aliquot was taken from the Erlenmeyer flasks for MB absorbance determining using UV-VIS (model K37-UVVIS from KASVI) and a quartz cuvette with an optical path length of 10.0 mm.
The removal efficiency (), and adsorption capacity at time t, (mg g-1), were calculated using Equations (4) and (5), respectively.
Where and are the initial dye concentration (mg L-1) and dye concentration at time t (mg L-1), respectively; is the volume of the dye solution (L); and is the biochar mass (g). When t = 1440 min, it was obtained , and , concentration, adsorption capacity and removal efficiency at equilibrium, respectively.
2.6. Kinetic Modelling
The adsorption kinetics considered in this work consisted of a hybrid-order rate equation, as described by Liu and Shen (2008) [24].
Where is the coverage fraction at time t; is the adsorption capacity at time t (mg g-1); is the maximum adsorption capacity (mg g-1); is the pseudo-first order rate constant (s-1); and is the pseudo-second order rate constant (s-1).
The following assumptions were considered in the model:
- Homogeneous liquid phase;
- Isothermal process;
- No reactions occur.
Equation (3) was numerically solved in Scilab by the algorithm ode.
2.7. Desorption Studies
The adsorbents resulting from the adsorption studies were filtered and air-dried for desorption studies. Desorption was conducted in 125 mL Erlenmeyers, 50 mL of distilled water and adsorbent (0.50 g ± 0.02 g). The system was kept under agitation for 24 h, at room temperature (30 °C) and shaking speed of 100 rpm [25]. Absorbance was determined using UV–VIS (model K37-UVVIS from KASVI), as described previously. Results of the desorption studies were analyzed by dye concentration in the solution.
3. Results and Discussions
3.1. Solid Yield and Energy Properties of Biochar
The biochar obtained solids yields ranging from 58.84 to 44.10% and energy yields from 69.56 to 64.15%, in the sequence BGP-300 > BTP-300 > BES-300 > BSB-300 and a higher calorific value on average of 23.66 MJ kg-1, with BSB-300 and BES-300 presenting the highest HHV of 24.27 MJ kg-1 and 24.32 MJ kg-1 respectively (Figure 1).
The solid yield of biochar is affected by the temperature followed by the time of the thermochemical process [26]. The higher the temperature and residence time, the lower the solid yield of the biochar obtained, due to the degradation of carbohydrates. The samples studied at the same temperature and time presented different mass yields, due to differences in their compositions (cellulose, hemicellulose and lignin), with hemicellulose being the fraction that undergoes the most degradation, followed by part of the cellulose [26].
The ultimate analysis and heat value of torrefied samples were shown in Table 2. Dry torrefaction converts biomass into biochar with lower moisture content and volatile material compared to the raw sample. This is due to the reduction of hydroxyl groups, making the material hydrophobic, increasing the carbon content and calorific value [10]. The fixed carbon content of the biochar ranged from 44.50 to 52.03%. BSB-300 presented the highest fixed carbon concentration, 52.03%, that is 3.7 times more than SB raw. In addition, the ash content of the biochar was higher in BGP-300 and BSB-300, 9.98 and 9.79% respectively. This accumulation of ash content in the biochar is due to the degradation of the biomass.
3.2. Adsorption Studies
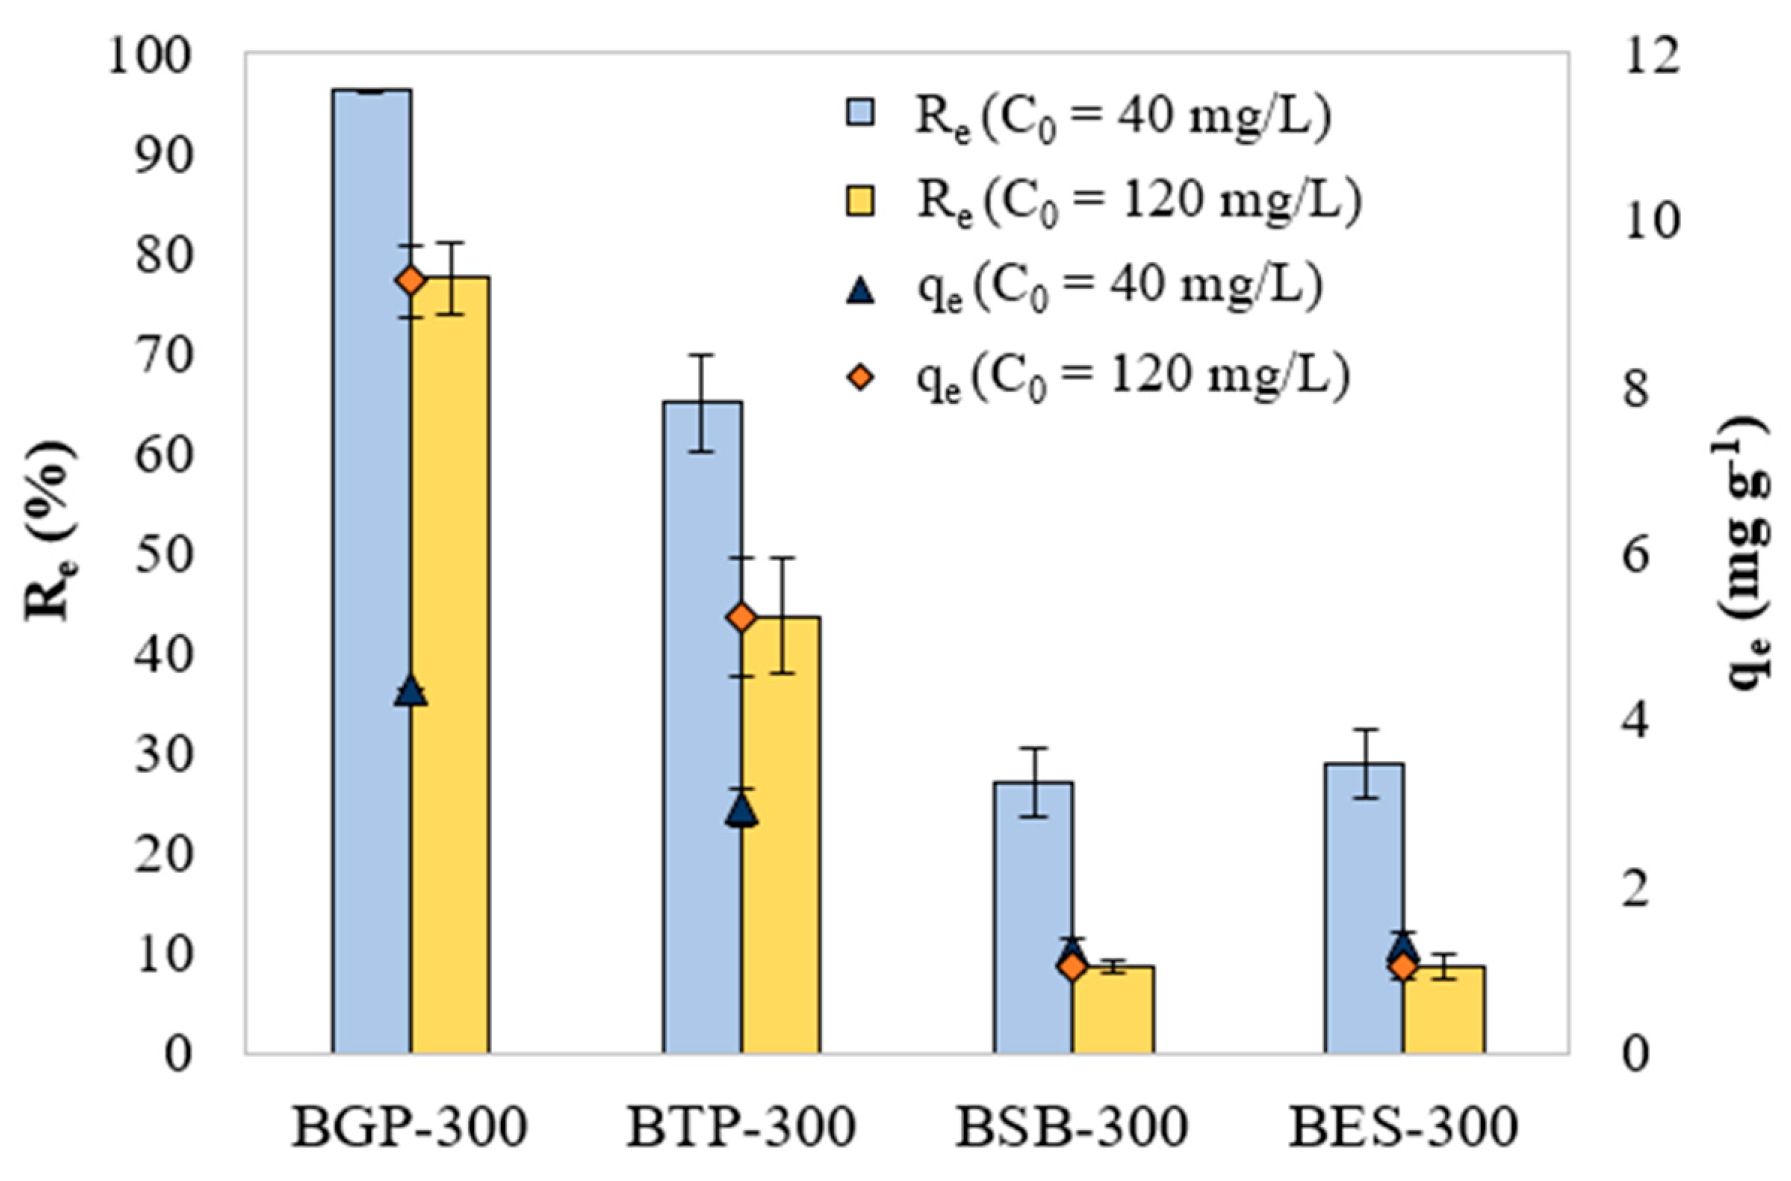
Figure 1 displays the effect of initial dye concentration (40 and 120 mg L-1) and different biochar in the adsorption efficiency and adsorption capacity. Increasing the initial concentration of MB resulted in a reduction in the and an increase in the . Whereas reducing particle diameter resulted in an increase of and .
The highest removal efficiency was obtained using samples BGP-300 (96.5%) and BTP-300 (65.0%) and initial dye concentration of 40 mg L-1. Therefore, these samples were selected for kinetic modelling. Samples BSB-300 and BES-300 did not provide significant removal efficiency of MB. For the tested concentrations, removal efficiency and adsorption capacity obeyed the following order for the biochar tested: BGP-300 > BTP-300 > BSB-300 ≈ BES-300.
Figure 2.
Effect of initial MB concentration on BGP-300, BTP-300, BSB-300 and BES-300 and
3.3. Kinetic Model
The model predictions were compared to the experimental data acquired in the present study. The results are shown in Figure 3.
Figure 3 shows that the hybrid-order adsorption model provides good predictions for the cases studied herein. The R2 values obtained from these fittings range from 0.89 to 0.96 for all runs, except for BGP-300 in the solution containing 120 mg L−1 MB, where R2 = 0.75. Specifically for this run, the experimental profile exhibits a steeper adsorption slope, which is associated with the high adsorption capacity of this material, further enhanced by the concentrated medium used in this condition.
This behavior may be influenced by an error, as microparticles of the adsorbent could have been carried along with the sample, leading to additional adsorption between sample withdrawal and analysis, thereby increasing qt. Since this error is time-dependent (affecting the x-axis), R2 may not accurately reflect the goodness of fit for BGP-300 in the 120 mg L−1 MB solution.
In all cases, the equilibrium data lies above the model predictions, particularly at higher initial MB concentrations. Additionally, up to 420 min, the experimental profile appears close to the equilibrium plateau. Beyond this point, the adsorption rate increases slightly until the final measurement, especially for the 120 mg L−1 MB cases. This phenomenon can be attributed to the hydrophobicity of biochar [2,3], which leads to its gradual immersion in the MB solution during the process, as it was initially introduced in a dry state. This gradual immersion likely results in a variable contact surface area over time, increasing as the process progresses.
The final point of each experimental profile was considered as , with .
Table 3 shows that the second-order kinetic constant () prevails over the first-order constant (). As the initial MB concentration increases from 40 to 120 mg L−1, increases while decreases for both materials. These modeling results highlight the significance of each kinetic order’s contribution to the adsorption process. In other words, the hybrid-order model proves useful by eliminating the need to apply different modeling approaches for each adsorbate concentration.
Recent studies have reported biochar production from grape pomace under temperature range from 300 to 750 °C for the adsorption of lead [27] and cymoxanil [28]. In these studies, it was verified that lower temperatures (300-550 °C) yielded in a more efficient biochar for adsorption, probably due to the presence of hydrophilic polar functional groups (hydroxyl, carbonyl, carboxyl groups) on the surface of the adsorbent [28]. Additionally, pseudo-second order kinetics best described the adsorption process of lead and cymoxanil onto grape pomace biochar, as verified with MB in this study. However, no studies using grape pomace biochar for the adsorption of MB were found in the literature.
3.4. Desorption Studies
Desorption studies are shown in Figure 4. Desorption of MB increased with higher initial concentration; the desorption rate is an indicative that the adsorption process may occur physically. From the tested materials, BGP-300 presented a higher removal efficiency and lower rates of desorption, an ideal combination if the material was to be used as an adsorbent and reused post-adsorption.
5. Conclusions
This study investigated the adsorption capability of four different types of agro-industrial waste biochar.
BGP-300 produced in dry torrefaction showed higher solids yield of 58.84%, energy yield of 69,56%, while the studied residues showed a higher calorific value on average of 23.66 MJ kg-1. Adsorption studies reveal that initial concentration, time and biochar feedstock affected the removal efficiency and adsorption capacity.
Removal efficiency and adsorption capacity obeyed the following order for the biochar tested: BGP-300 > BTP-300 > BSB-300 ≈ BES-300.
As a conclusion, the BGP-300 and BTP-300 tested can be used for the removal of MB from aqueous solutions and promotion of circular economy.
Author Contributions
Conceptualization, M. C. K.; E. L. R.; and V. G. S. R.; methodology, M. C. K.; L. G. de A.; and E. L. R.; formal analysis, M. C. K.; L. G. de A.; V. G. S. R.; and E. L. R.; investigation, M. C. K.; L. G. de A.; V. G. S. R.; and E. L. R.; resources, M. C. K.; L. G. de A.; V. G. S. R.; and E. L. R.; data curation, M. C. K.; L. G. de A.; V. G. S. R.; and E. L. R.; writing—original draft preparation, M. C. K., L. G. de A. and E. L. R.; writing—review and editing, M. C. K.; L. G. de A.; V. G. S. R.; and E. L. R.; visualization, M. C. K.; E. L. R.; and V. G. S. R.; supervision, , M. C. K.; L. G. de A.; V. G. S. R.; and E. L. R.; project administration, M. C. K.; funding acquisition, M. C. K.; V. G. S. R.; and E. L. R. All authors have read and agreed to the published version of the manuscript.
Funding
This research was funded by Conselho Nacional de Desenvolvimento Científico e Tecnológico (CNPq) grant number 403924/2021-9.
Institutional Review Board
Not applicable.
Informed Consent Statement
Not applicable.
Data Availability Statement
Data is contained within the article.
Conflicts of Interest
The authors declare no conflicts of interest.
Abbreviations
The following abbreviations are used in this manuscript:
| BGP | Biochar grape pomace |
| BTP | Biochar tree pruning |
| BES | Biochar eucalyptus sawdust |
| BSB | Biochar sugarcane bagasse |
| . | Adsorption capacity at equilibrium |
| Adsorption efficiency at equilibrium |
References
- Singh, R.; Goyal, A.; Sinha, S. Global insights into biochar: Production, sustainable applications, and market dynamics. Biomass Bioenergy 2025, 194, 107663. [Google Scholar] [CrossRef]
- Yadav, N.; Yadav, G.; Bakthavachalam, V.; Potturaja, L.; Roy, J.K.; Elumalai, S. Agro-industrial residue torrefaction to bio-coal: Its physico-chemical characterization and potential applications in energy and environmental protection. Bioresour Technol 2025, 418, 131948. [Google Scholar] [CrossRef]
- Lin, S.L.; Zhang, H.; Chen, W.H.; Song, M.; Kwon, E.E. Low-temperature biochar production from torrefaction for wastewater treatment: A review. Bioresour Technol 2023, 387, 129588. [Google Scholar] [CrossRef]
- Cahyanti, M.N.; Doddapaneni, T.R.K.C.; Kikas, T. Biomass torrefaction: An overview on process parameters, economic and environmental aspects and recent advancements. Bioresour Technol 2020, 301, 122737. [Google Scholar] [CrossRef] [PubMed]
- Romão, E.L.; Conte, R.A. ENERGY GAINS OF Eucalyptus BY TORREFACTION PROCESS. Ciencia, vol. 2021, no. 23, pp. 3–4, [Online]. Available online: https://orcid.org/0000-0003-3376-3584.
- Yu, K.L.; et al. Adsorptive removal of cationic methylene blue and anionic Congo red dyes using wet-torrefied microalgal biochar: Equilibrium, kinetic and mechanism modeling. Environmental Pollution 2021, 272, 115986. [Google Scholar] [CrossRef]
- Hu, H.; Zhang, J.; Wang, T.; Wang, P. Adsorption of toxic metal ion in agricultural wastewater by torrefaction biochar from bamboo shoot shell. J Clean Prod 2022, 338, 130558. [Google Scholar] [CrossRef]
- Shen, Y.; Guo, J.Z.; Bai, L.Q.; Chen, X.Q.; Li, B. High effective adsorption of Pb(II) from solution by biochar derived from torrefaction of ammonium persulphate pretreated bamboo. Bioresour Technol 2021, 323, 124616. [Google Scholar] [CrossRef] [PubMed]
- Bian, P.; Shao, Q. Efficient adsorption of hexavalent chromium in water by torrefaction biochar from lignin-rich kiwifruit branches: The combination of experiment, 2D-COS and DFT calculation. Int J Biol Macromol 2024, 273, 133116. [Google Scholar] [CrossRef]
- Gan, Y.Y.; et al. Torrefaction of microalgal biochar as potential coal fuel and application as bio-adsorbent. Energy Convers Manag 2018, 165, 152–162. [Google Scholar] [CrossRef]
- Güleç, F.; Williams, O.; Kostas, E.T.; Samson, A.; Stevens, L.A.; Lester, E. A comprehensive comparative study on methylene blue removal from aqueous solution using biochars produced from rapeseed, whitewood, and seaweed via different thermal conversion technologies. Fuel 2022, 330, 125428. [Google Scholar] [CrossRef]
- Tu, R.; et al. The fuel properties and adsorption capacities of torrefied camellia shell obtained via different steam-torrefaction reactors. Energy 2022, 238, 121969. [Google Scholar] [CrossRef]
- Puri, M.; Gandhi, K.; Kumar, M.S. Emerging environmental contaminants: A global perspective on policies and regulations. J Environ Manage 2023, 332, 117344. [Google Scholar] [CrossRef] [PubMed]
- Al-Tohamy, R.; et al. A critical review on the treatment of dye-containing wastewater: Ecotoxicological and health concerns of textile dyes and possible remediation approaches for environmental safety. Ecotoxicol Environ Saf 2022, 231, 113160. [Google Scholar] [CrossRef] [PubMed]
- Ciğeroğlu, Z.; El Messaoudi, N.; Şenol, Z.M.; Başkan, G.; Georgin, J.; Gubernat, S. Clay-based nanomaterials and their adsorptive removal efficiency for dyes and antibiotics: A review. Materials Today Sustainability 2024, 26, 100735. [Google Scholar] [CrossRef]
- Tripathi, M.; et al. Recent Strategies for the Remediation of Textile Dyes from Wastewater: A Systematic Review. Nov. 01, 2023, Multidisciplinary Digital Publishing Institute (MDPI). [CrossRef]
- Bridgeman, T.G.; Jones, J.M.; Shield, I.; Williams, P.T. Torrefaction of reed canary grass, wheat straw and willow to enhance solid fuel qualities and combustion properties. Fuel 2008, 87, 844–856. [Google Scholar] [CrossRef]
- AMERICAN SOCIETY FOR TESTING AND MATERIAL, ‘ ASTM. D3173-12: Test Method for Moisture in the Analysis Sample of Coal and Coke form Coal’, 2018.
- AMERICAN SOCIETY FOR TESTING AND MATERIAL, ‘ASTM. D3174-12: Test Method for Ash in the Analysis Sample of Coal and Coke form Coal’, 2018.
- AMERICAN SOCIETY FOR TESTING AND MATERIAL, ‘ASTM. D3175-18: Test Method for Volatile Matter in the Analysis Sample of Coal and Coke form Coal’.
- Parikh, J.; Channiwala, S.A.; Ghosal, G.K. A correlation for calculating HHV from proximate analysis of solid fuels. Fuel 2005, 84, 487–494. [Google Scholar] [CrossRef]
- Rajendran, J.; Panneerselvam, A.; Ramasamy, S.; Palanisamy, P. Methylene blue and methyl orange removal from wastewater by magnetic adsorbent based on activated carbon synthesised from watermelon shell. Desalination Water Treat 2024, 317, 100040. [Google Scholar] [CrossRef]
- Kasemodel, M.C.; Romão, E.L.; Bueno, T.; Papa, R. Adsorption of methylene blue on babassu coconut (Orbignya speciosa) mesocarp commercial biochar. International Journal of Environmental Science and Technology 2024, 21, 1671–1682. [Google Scholar] [CrossRef]
- Liu, Y.; Shen, L. From Langmuir kinetics to first- and second-order rate equations for adsorption. Langmuir 2008, 24, 11625–11630. [Google Scholar] [CrossRef]
- Lima, J.Z.; Nauerth, I.M.R.; da Silva, E.F.; Pejon, O.J.; Rodrigues, V.G.S. Competitive sorption and desorption of cadmium, lead, and zinc onto peat, compost, and biochar. J Environ Manage 2023, 344, 118515. [Google Scholar] [CrossRef]
- Yang, H.; Yan, R.; Chen, H.; Lee, D.H.; Zheng, C. Characteristics of hemicellulose, cellulose and lignin pyrolysis. Fuel 2007, 86, 1781–1788. [Google Scholar] [CrossRef]
- Jin, Q.; et al. Grape pomace and its secondary waste management: Biochar production for a broad range of lead (Pb) removal from water. Environ Res 2020, 186, 109442. [Google Scholar] [CrossRef] [PubMed]
- Yoon, J.Y.; et al. Assessment of adsorptive behaviors and properties of grape pomace-derived biochar as adsorbent for removal of cymoxanil pesticide. Environ Technol Innov 2021, 21, 101242. [Google Scholar] [CrossRef]
Figure 1.
Solids, energy yield and high heating value of biochar obtained from dry torrefaction in 300 ºC - 60 min.
Figure 1.
Solids, energy yield and high heating value of biochar obtained from dry torrefaction in 300 ºC - 60 min.
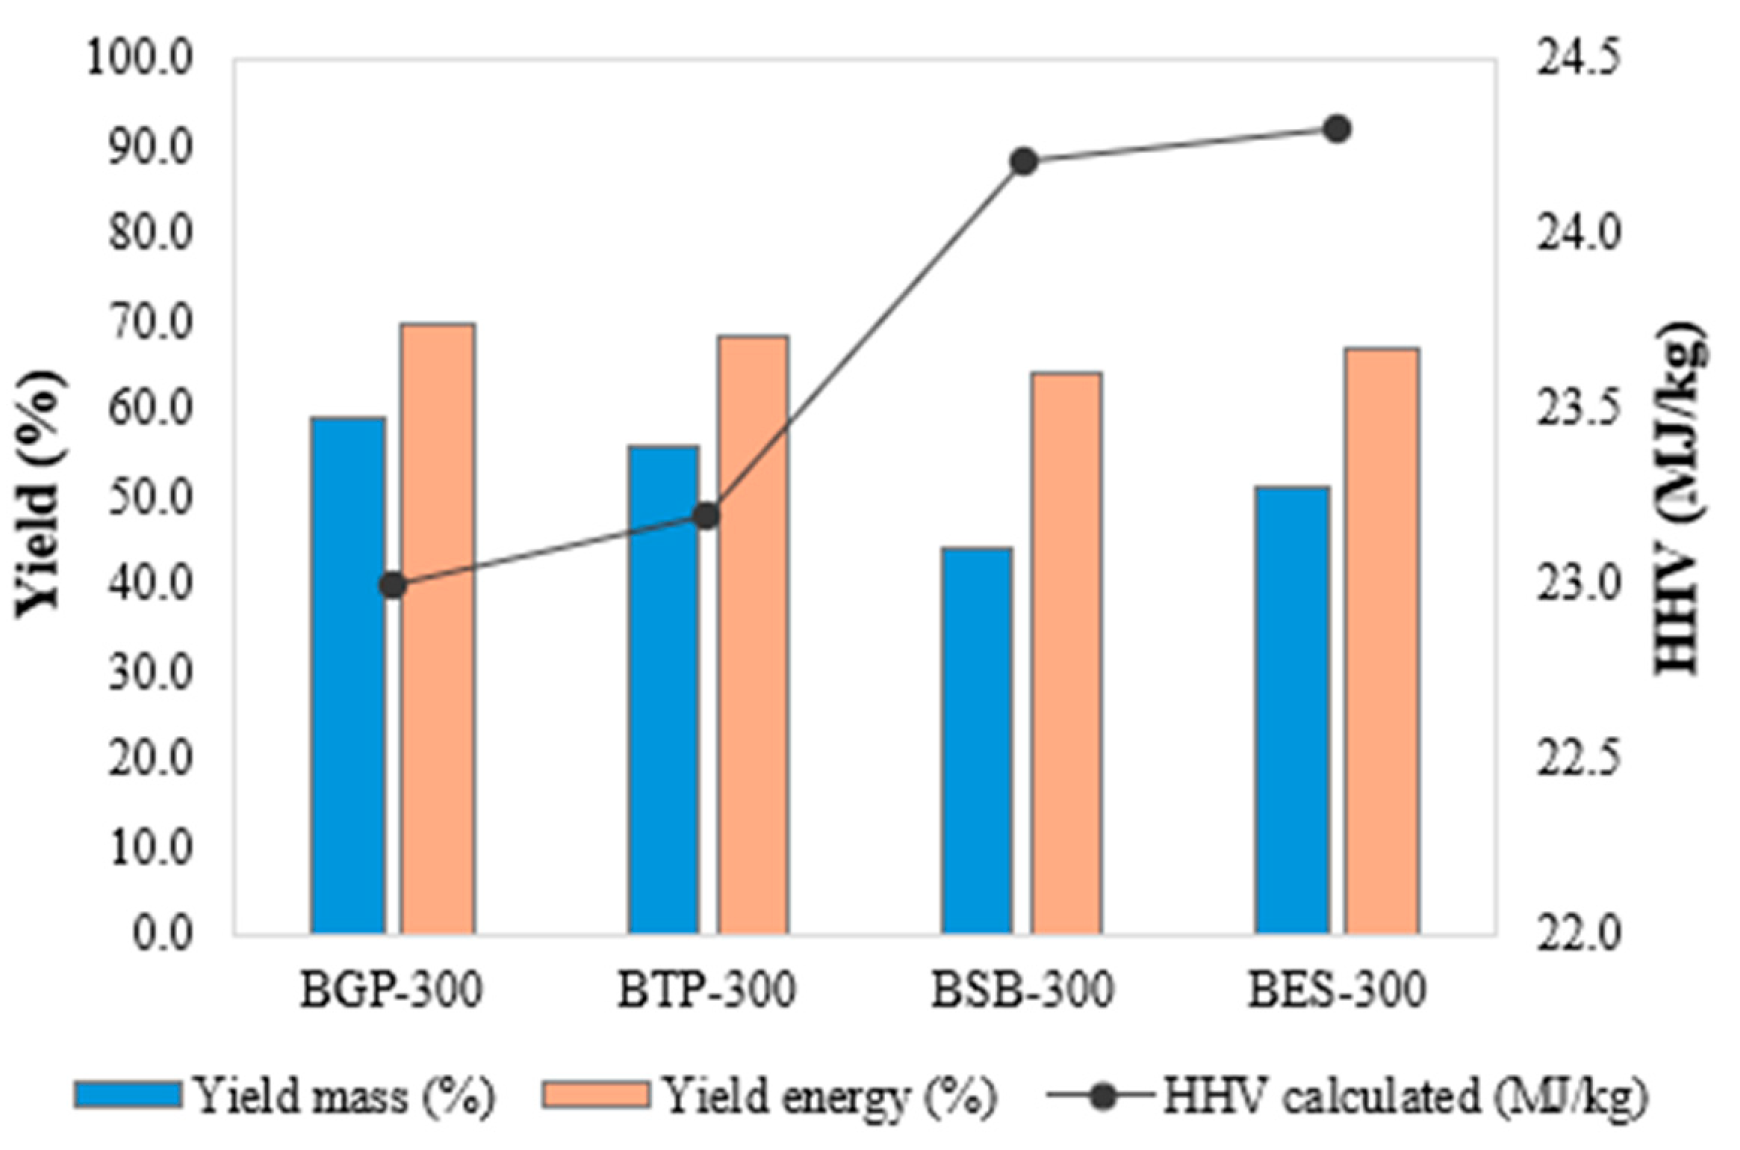
Figure 3.
Modeling results. EXP: Experimental data; MOD: Model predictions for samples (a) BGP-300 and (b) BTP-300.
Figure 3.
Modeling results. EXP: Experimental data; MOD: Model predictions for samples (a) BGP-300 and (b) BTP-300.
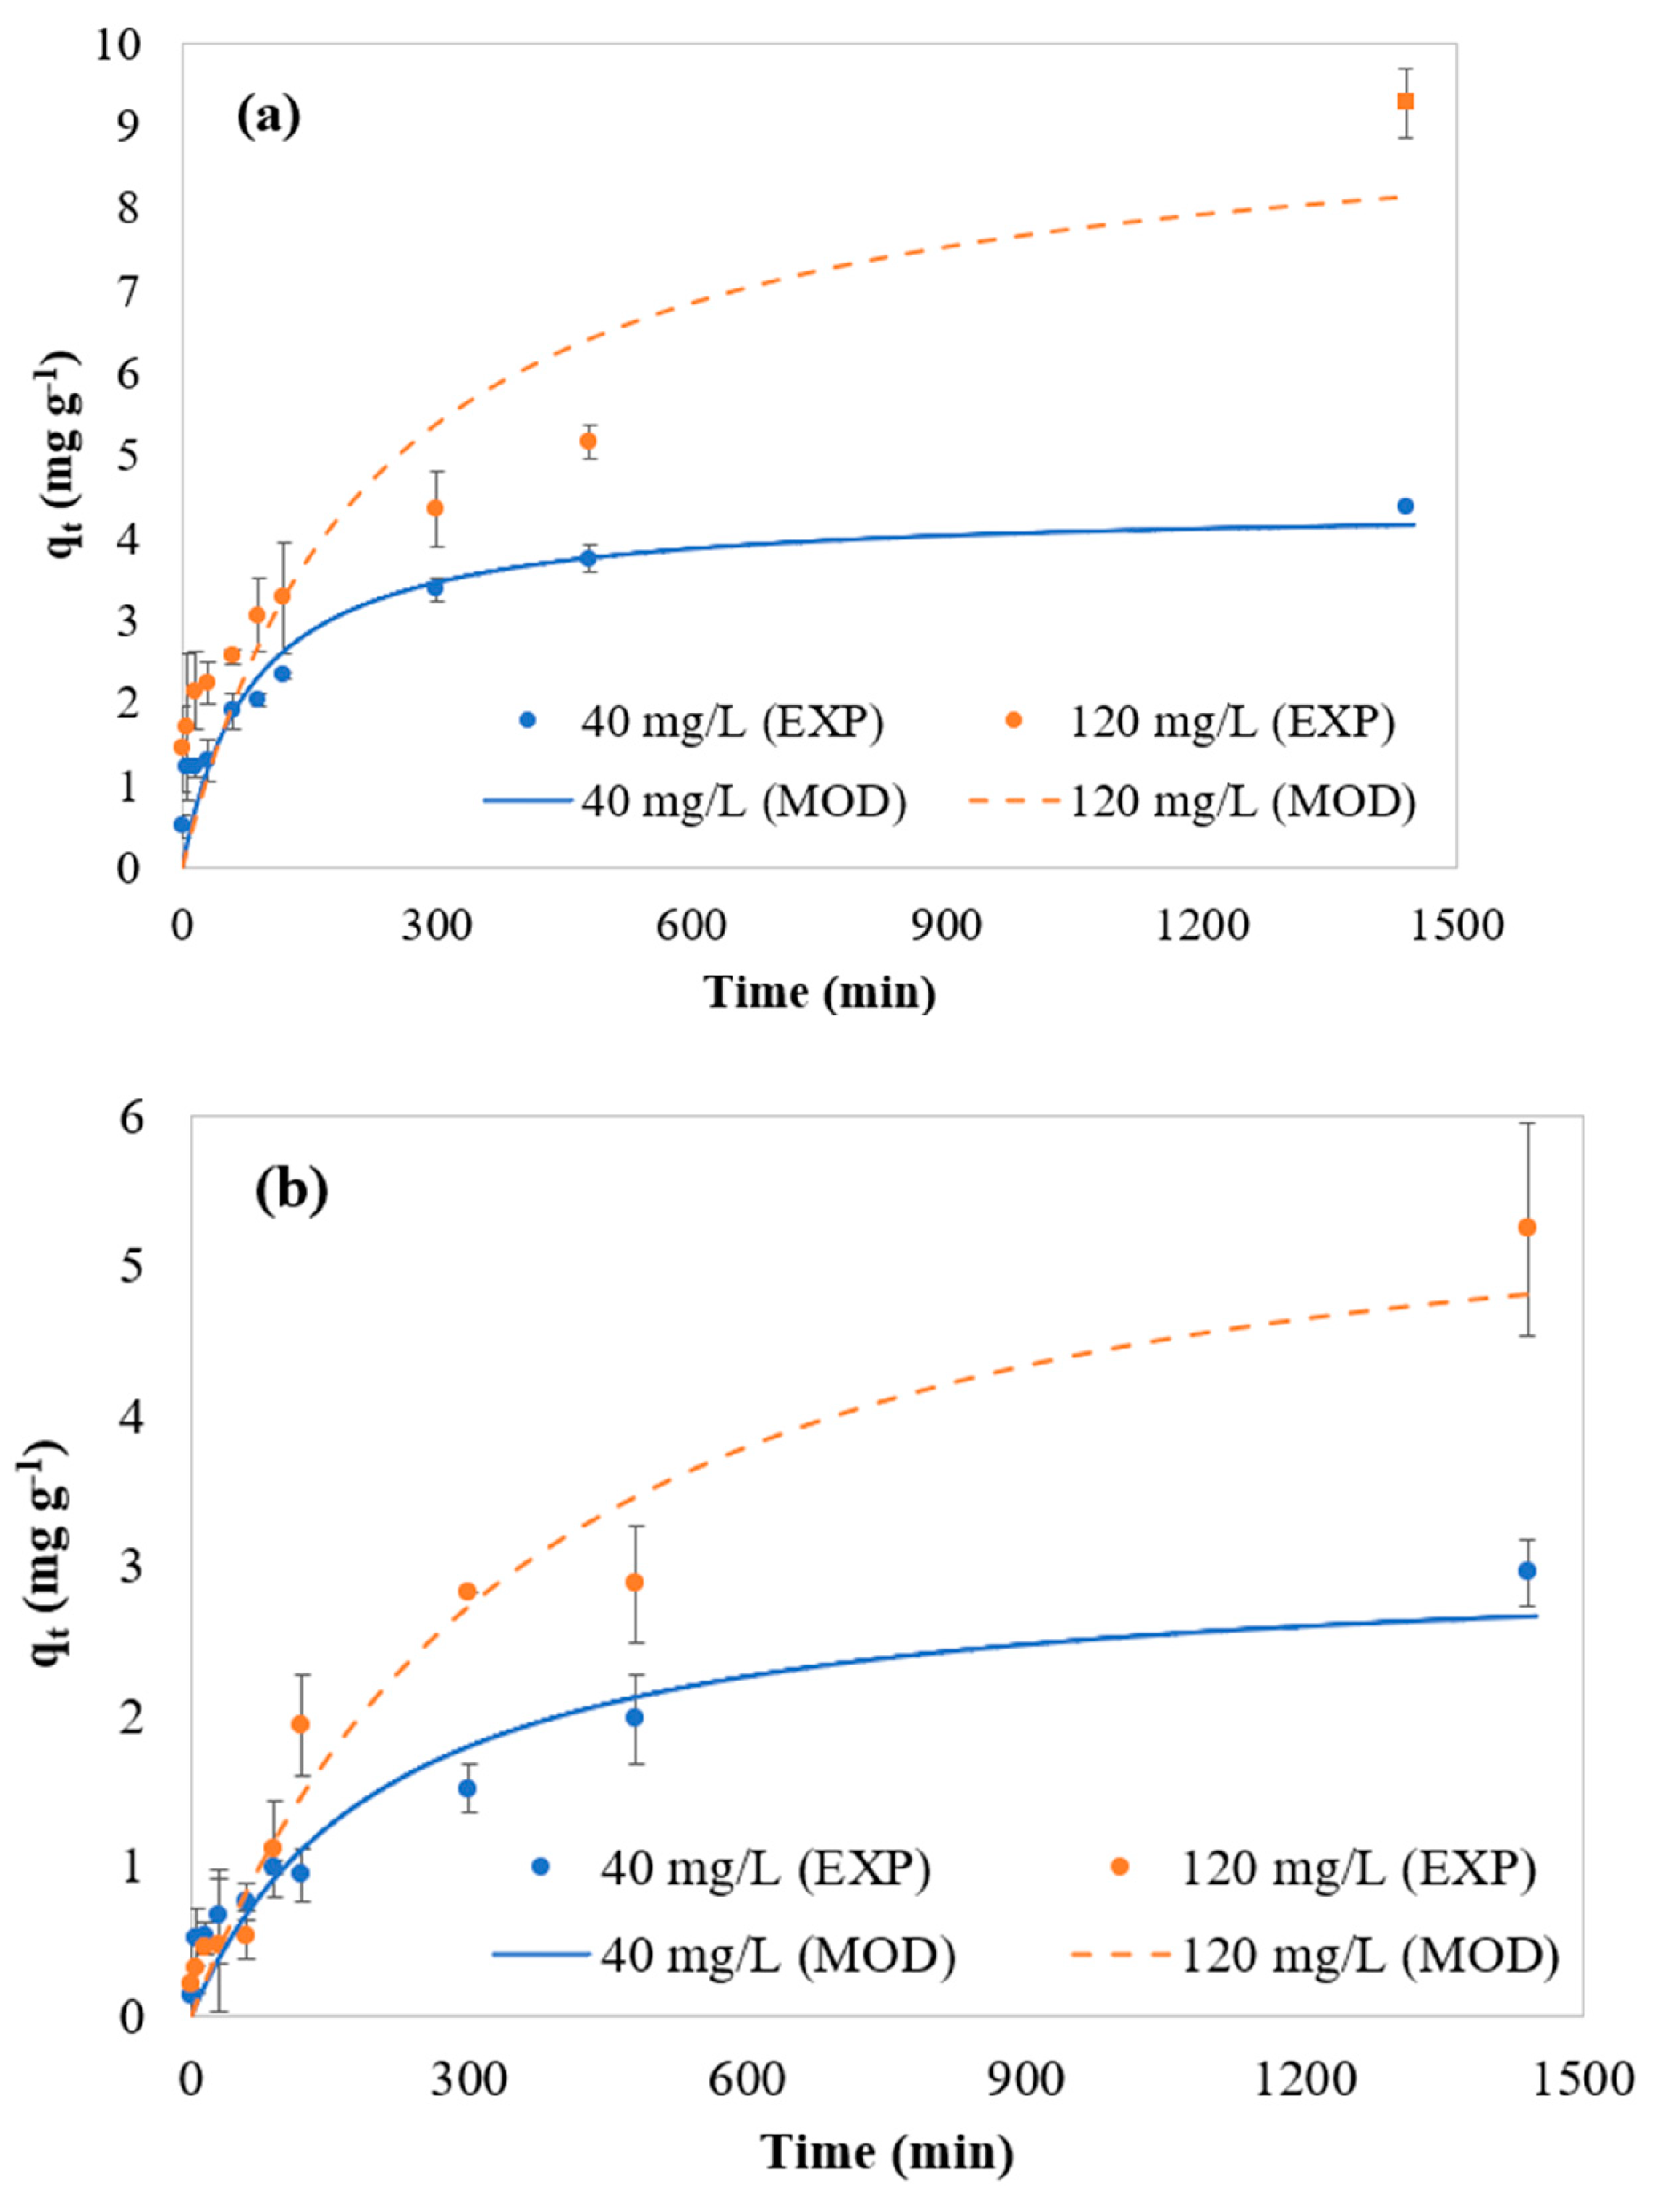
Figure 4.
Desorption results varying initial MB concentration on BGP-300 and BTP-300.
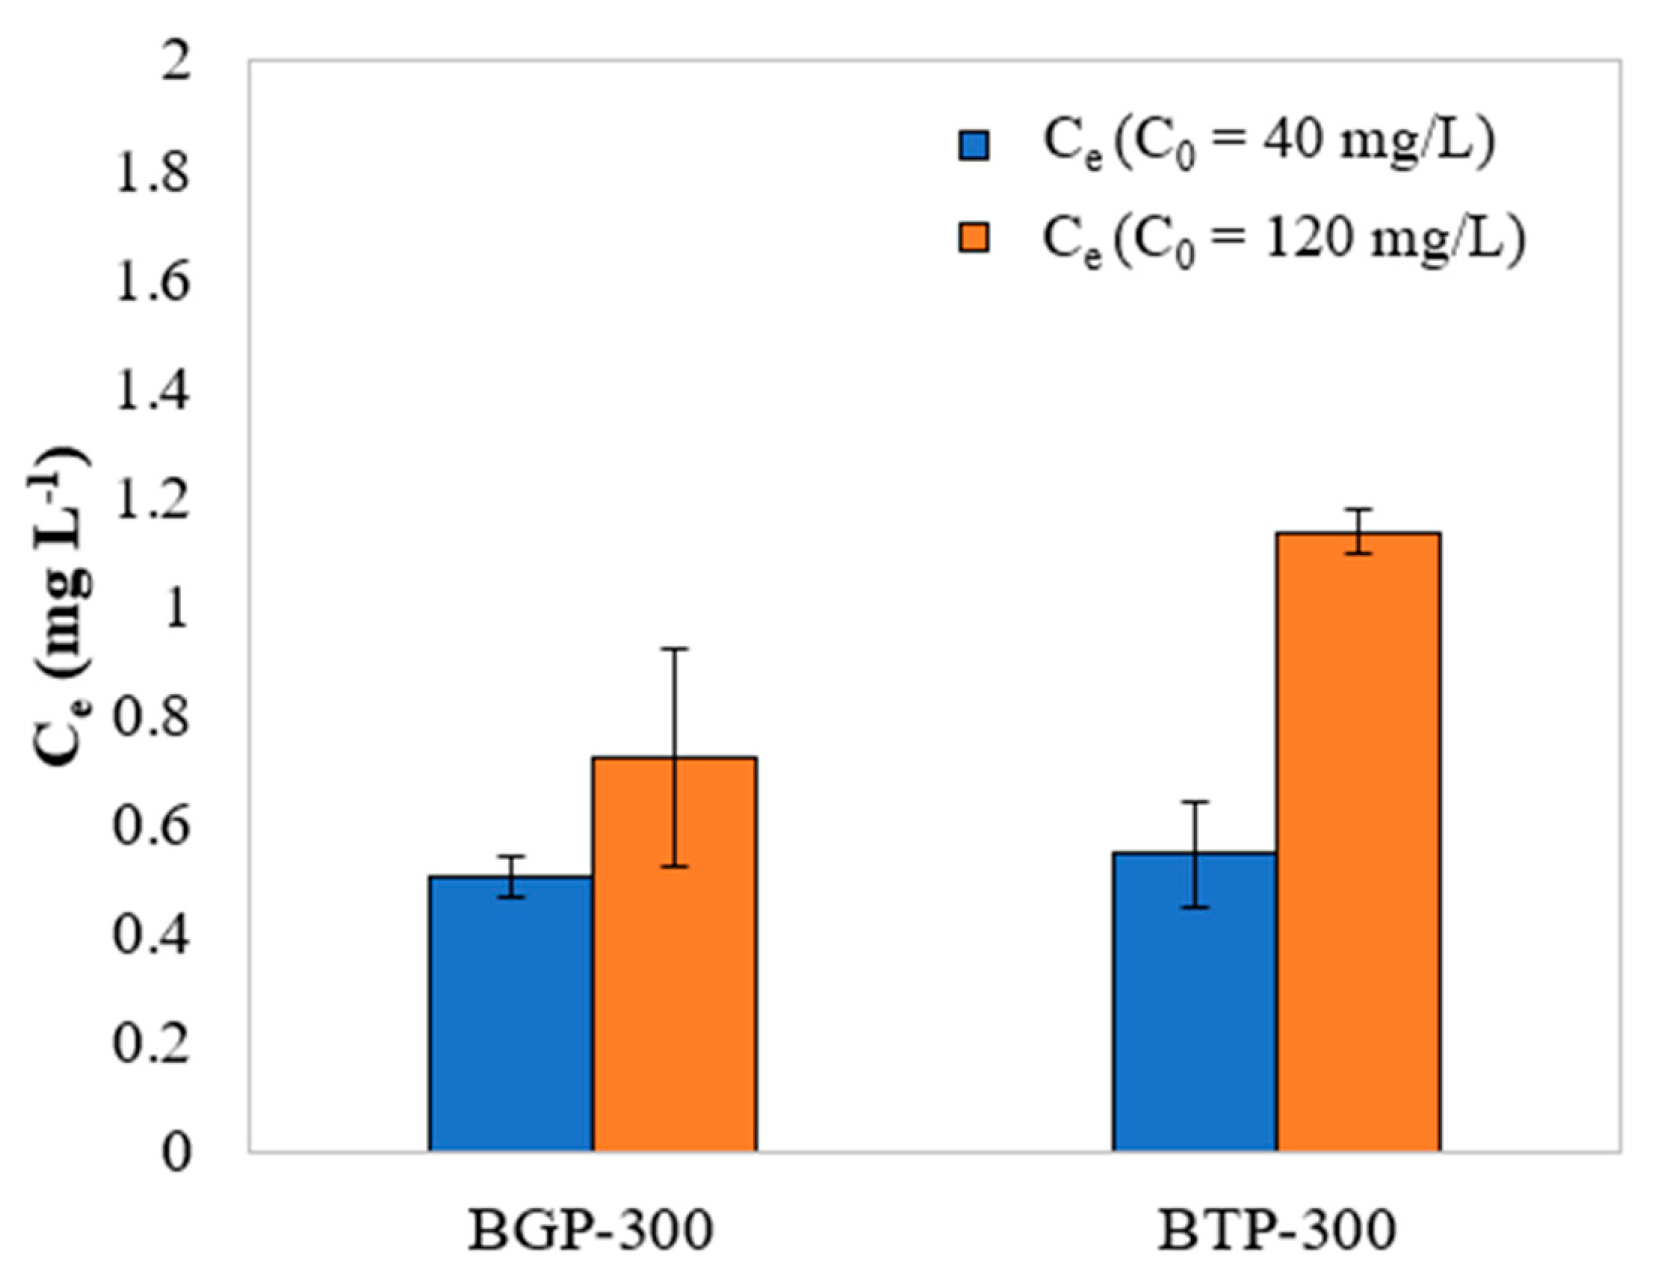

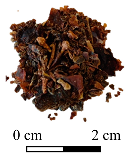
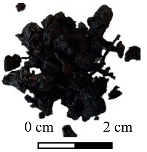
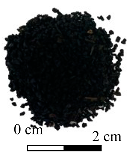
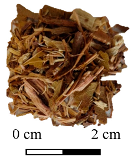
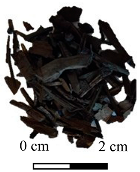
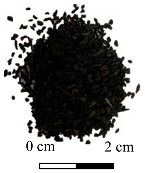
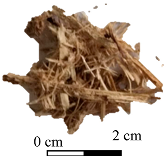
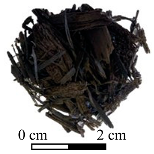
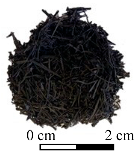
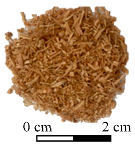
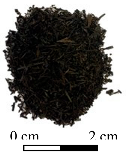
Table 1.
Illustrative comparison of the feedstocks and biochar obtained from the torrefaction of grape pomace, tree pruning, sugarcane bagasse and eucalyptus sawdust and biochar sieved for adsorption studies.
Table 1.
Illustrative comparison of the feedstocks and biochar obtained from the torrefaction of grape pomace, tree pruning, sugarcane bagasse and eucalyptus sawdust and biochar sieved for adsorption studies.
| Feedstock | Biochar | Biochar sieved (0.6 -1.2 mm) |
|---|---|---|
| Grape pomace | ||
 |
 |
 |
| Tree pruning | ||
 |
 |
 |
| Sugarcane bagasse | ||
 |
 |
 |
| Eucalyptus sawdust | ||
 |
 |
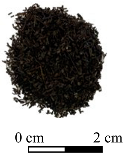 |
Table 2.
Comparison of ultimate analysis and heat value of feedstock and biochar.
| Sample | Moisture content (%) | Volatile matter (%) | Fixed carbon (%) |
Ash content (%) | High heat value (MJ kg-1) |
|---|---|---|---|---|---|
| GP raw | 8.59 | 70.36 | 23.82 | 5.81 | 19.35 |
| BGP-300 | 5.24 | 44.91 | 45.10 | 9.98 | 22.87 |
| TP raw | 10.11 | 75.36 | 20.70 | 3.94 | 19.04 |
| BTP-300 | 4.33 | 45.74 | 45.61 | 8.64 | 23.19 |
| SB raw | 6.32 | 75.61 | 14.08 | 10.30 | 16.69 |
| BSB-300 | 2.02 | 38.17 | 52.03 | 9.79 | 24.27 |
| ES raw | 8.46 | 84.91 | 14.99 | 0.09 | 18.54 |
| BES-300 | 3.47 | 55.12 | 44.50 | 0.38 | 24.33 |
Table 3.
Kinetic parameters of adsorption of MB onto BGP-300 and BTP-300.
| MB initial concentration |
BGP-300 | BTP-300 | ||
|---|---|---|---|---|
| 40 mg L-1 | 120 mg L-1 | 40 mg L-1 | 120 mg L-1 | |
| (min-1) | 1.43 x 10⁻⁵ | 1.24 x 10⁻⁴ | 3.32 x 10⁻⁴ | 1.14 x 10⁻³ |
| (min-1) | 1.24 x 10⁻² | 4.42 x 10⁻³ | 4.59 x 10⁻³ | 1.91 x 10⁻³ |
| R2 | 0.90 | 0.75 | 0.96 | 0.89 |
Disclaimer/Publisher’s Note: The statements, opinions and data contained in all publications are solely those of the individual author(s) and contributor(s) and not of MDPI and/or the editor(s). MDPI and/or the editor(s) disclaim responsibility for any injury to people or property resulting from any ideas, methods, instructions or products referred to in the content. |
© 2025 by the authors. Licensee MDPI, Basel, Switzerland. This article is an open access article distributed under the terms and conditions of the Creative Commons Attribution (CC BY) license (http://creativecommons.org/licenses/by/4.0/).
Copyright: This open access article is published under a Creative Commons CC BY 4.0 license, which permit the free download, distribution, and reuse, provided that the author and preprint are cited in any reuse.


