
Submitted:
01 April 2025
Posted:
02 April 2025
You are already at the latest version
Abstract
Background/Objectives: Metabolites produced by gut microbiota play an important role in the crosstalk between gut and other organs. Although HYA (10-hydroxy-cis-12-octadecenoic acid), a linoleic acid metabolite produced by lactic acid bacteria represented by Lactobacillus, has been shown to exert physiological effects such as metabolic improvement and anti-inflammation in the host, its direct action on adipose tissue and the mechanism remains unknown. Methods: The effect of HYA administration on adipocyte size in mice fed a high fat diet was examined. In 3T3-L1 mature adipocytes treated with HYA, the amount of intracellular lipid droplets was evaluated by oil-red O staining, gene expression by real-time qPCR, phosphorylation of AMP-activated protein kinase (AMPK) by immunoblotting, and intracellular Ca²+ concentration with calcium imaging. Results: Administration of HYA, but not linoleic acid, to obese mice fed a high-fat diet significantly reduced adipocyte size. To investigate whether the inhibition of adipocyte hypertrophy by HYA is a direct effect on adipocytes, 3T3-L1 adipocytes were treated with HYA, which significantly decreased the amount of intracellular lipid droplets in these cells. Gene expression analysis by real-time PCR showed decreased expression of genes related to lipogenesis such as FAS and ACC1, and increased expression of CPT1A, which is involved in fatty acid oxidation. Mechanistically, HYA was found to activate AMPK in adipocytes by increasing intracellular Ca²+ concentration. Conclusions: HYA suppresses adipocyte hypertrophy by activating AMPK in adipocytes. HYA may be a potential therapeutic for obesity and related metabolic disorders.
Keywords:
HYA
; AMPK
; adipocytes
1. Introduction
Obesity is exploding worldwide and has become a major medical and social challenge. Obesity induces systemic insulin resistance, which leads to metabolic diseases including type 2 diabetes, dyslipidemia, hypertension, and cardiovascular diseases [1,2,3]. Recent studies have also shown that obesity is associated with an increased risk of many types of cancer [4,5]. Obesity is caused by changes in energy balance resulting from overnutrition and lack of exercise in addition to genetic factors. Although diet and exercise therapy are important for improving this pathological condition, it is often difficult to achieve sufficient weight loss and to maintain the weight loss for a long period of time through diet and exercise therapy. As obese population is expected to continue to increase worldwide, it is necessary to develop new preventive and therapeutic methods for obesity.
Adipose tissue plays a pivotal role in the regulation of systemic metabolism by regulating inter-organ crosstalk between adipose tissue and other organs through energy delivery in response to changes in energy status, such as fasting and feeding, and by regulating the production of adipokines including adiponectin and leptin [6,7]. On the other hand, a number of studies have shown that overnutrition and lack of exercise induce dynamic changes in adipose tissue, such as adipocyte hypertrophy followed by infiltration of inflammatory cells represented by macrophages, increase in inflammatory cytokines/chemokines and decrease in adiponectin, and insulin resistance in adipocytes [8,9,10,11]. These changes in adipose tissue cause dysfunction of this tissue, which leads to the development of metabolic disorders. Since adipocyte hypertrophy is the initial trigger for adipose tissue dysfunction, the regulation of adipocyte hypertrophy may contribute to the development of preventive and therapeutic strategies for obesity and obesity-related metabolic diseases.
Recent studies have revealed that metabolites produced by gut microbiota play an important role in the crosstalk between gut and other organs [12,13,14]. 10-hydroxy-cis-12-octadecenoic acid (HYA) is produced when linoleic acid is hydrated by an enzyme CLA-HY, which is possessed by lactic acid bacteria represented by Lactobacillus [15]. Given that the amount of linoleic acid metabolites, including HYA, is extremely low in the tissues of germ-free mice compared to specific pathogen-free mice, these metabolites are thought to be produced mainly by gut microbiota [15]. HYA exerts anti-inflammatory effects, such as improvement of intestinal epithelial barrier damage in dextran sulfate sodium-induced mouse colitis and ameliorating atopic dermatitis in NC/nga mice [16,17]. HYA has also been shown to suppress obesity in mice fed a high-fat diet and to improve glucose metabolism through GPR40- or GPR120-mediated GLP-1 secretion [18]. Furthermore, Nanthirudjanar et al. showed that HYA reduces lipid accumulation in hepatocytes [19], and we have recently reported that HYA ameliorates liver fibrosis in a mouse model of metabolic dysfunction-associated steatohepatitis (MASH) by inhibiting the TGF-β pathway in hepatic stellate cells [20]. Thus, HYA exerts its effects through several mechanisms, including anti-inflammatory, anti-obesity, and metabolism improvement. However, the direct effects of HYA on adipocytes are unknown. In this study, we investigated the direct effects of HYA on adipocytes and the mechanism underlying these effects.
2. Materials and Methods
2.1. Animal Study
Male 5-week-old C57BL/6J mice were obtained from CLEA Japan (Tokyo, Japan) and fed standard chow (MF, Oriental Yeast, Tokyo, Japan) for 5 days to acclimate. To generate an obese model, mice were fed a high-fat diet (HFD32, CLEA Japan) for 6 weeks. Subsequently, mice were divided into three groups and fed a high-fat diet supplemented or not with 1% HYA (Noster Inc., Kyoto, Japan) or LA for an additional 5 weeks. During the experimental period, mice had free access to tap water and food, and were housed at 21° to 25°C under a 12-hour light/12-hour dark cycle in the animal facility at University of Shizuoka and Kobe University Graduate School of Medicine. After 5 weeks, mice were euthanized under 2% isoflurane (VIATRIS, Tokyo, Japan) anesthesia (airflow, 1.5 L/ min), and then epididymal white adipose tissues were rapidly collected. All animal experiments were approved by and conducted in accordance with the animal ethics committees of University of Shizuoka (No. 215326) and Kobe University Graduate School of Medicine (No. P171006).
2.2. Histological Analysis
The tissue was fixed with 10% neutral buffered formalin and embedded in paraffin. The tissue sections were stained with hematoxylin and eosin (H&E). H&E images were captured using BZ-X800 microscope (KEYENCE, Osaka, Japan) at 100 × magnification.
2.3. Cell Culture
3T3-L1 pre-adipocytes were maintained in maintenance medium (high-glucose Dulbecco’s modified Eagle’s medium (DMEM) containing 10% fetal bovine serum, 100 units/mL penicillin, and 100 μg/mL streptomycin) at 37 °C in a humidified atmosphere of 5% CO2. To induce differentiation into mature adipocytes, 100% confluent cells were maintained for 2 days before being switched to differentiation medium (maintenance medium supplemented 10 μg/mL insulin, 1 μM dexamethasone, and 500 μM 3-isobutyl-1-methylxanthine). After 2 days, the medium was replaced with maintenance medium containing 10 μg/mL insulin for an additional 2 days. Subsequently, the medium was replaced with fresh maintenance medium every other day for an additional 4 days.
2.4. Oil Red O Staining
Differentiated 3T3-L1 adipocytes treated with HYA or LA (final concentration 30 or 100 μM) for 48 hours were stained with Oil red O as described previously [21]. Briefly, the cells were washed with PBS and fixed with 10% neutral buffered formalin for 1 hour at room temperature. After two washes with PBS, the cells were stained with the Oil red O solution in 60% isopropanol for 7 min. The stained adipocytes were washed with PBS and observed under a microscope. Oil red O was quantified using BZ-X800 analyzer software (KEYENCE).
2.5. RT-qPCR Analysis
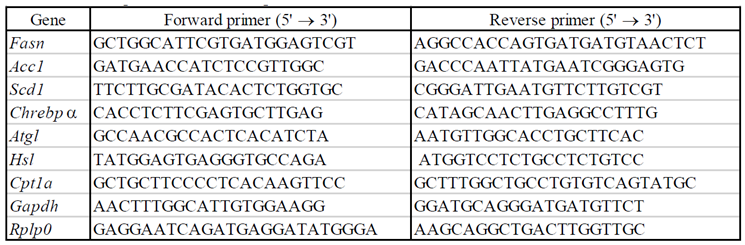
Total RNA was extracted from adipocytes treated with HYA or LA (final concentration 30 or 100 μM) for 48 hours using the RNeasy Lipid Tissue Mini Kit (Qiagen, Venlo, the Netherlands). For reverse transcription (RT) and quantitative polymerase chain reaction (qPCR) analysis, the isolated RNA was subjected to RT using Prime Script RT Master Mix (Takara Bio, Shiga, Japan) and the resulting cDNA was subjected to qPCR analysis using TB Green Premix Ex Taq Ⅱ (Takara Bio, Shiga, Japan) in a Thermal Cycler Dice Real Time System III (Takara Bio, Shiga, Japan). Relative mRNA abundance was determined by the standard curve method and normalized to the amount of Rplp0 mRNA. The sequences of the PCR primers are provided in Table 1.
2.6. Immunoblot Analysis
Immunoblot analysis was performed as described previously [22]. In brief, cells were lysed in lysis buffer (20 mM Tris-HCl [pH 7.5], 150 mM NaCl, 2 mM EDTA, 1% Nonidet P-40, 10% glycerol) supplemented with protease and phosphatase inhibitors. The lysates were subjected to SDS-polyacrylamide gel electrophoresis, and the separated proteins were transferred onto a nitrocellulose membrane. For immunoblot analysis, the membrane was blocked with 5% skim milk for 1 hour at room temperature and incubated overnight at 4 °C with antibodies to total (#5832) or phosphorylated forms (#2535) of AMPK and to total (#3676) or phosphorylated forms (#11818) of ACC1 (Cell Signaling Technology, Beverly, MA). The membrane was incubated with an appropriate secondary antibody (Promega, Madison, WI) for 1 h at room temperature and visualized using FUSION SOLOS Imaging System (Vilber Bio Imaging, Collégien, France).
2.7. Calcium Imaging
3T3-L1 adipocytes were differentiated on micro coverslips in a 35-mm dish. Calcium imaging experiment was performed as described previously [23]. Briefly, cells were incubated with 3.3 μM Fura-2 AM (Thermo Fisher Scientific, Waltham, MA) for at least 40 min. After incubation, the coverslips were placed in an open chamber (Warner Instruments LLC, CT) and perfused with standard bath solution (140 mM NaCl, 5 mM KCl, 2 mM CaCl2, 2 mM MgCl2, 10 mM glucose and 10 mM HEPES, pH7.4 adjusted with NaOH) for 3 min. And then, the coverslips were perfused with standard bath solution containing 0.01 % DMSO, 300 μM HYA, or 300 μM LA for 10 min. Images of perfused cells were captured every 5 seconds using a CoolSNAP ES CCD camera (Photometrics, Tucson, AZ). All experiments were conducted at 35° to 36.5°C. Intracellular free Ca2+ concentrations in 3T3-L1 cells were measured by dual-wavelength Fura-2 microfluorometry with excitation at 340/380 nm and emission at 510 nm. The images were acquired using NIS Elements software (NIKON Corp., Tokyo, Japan), and the ratio was calculated using ImageJ (NIH, Bethesda, MD). The viability of cells was confirmed using 3 μM ionomycin.
2.8. Statistical Analysis
Quantitative data are presented as means ± SEM. Group comparisons were performed using a two-tailed unpaired Student’s t-test or analysis of variance (ANOVA) followed by Tukey’s post hoc test, as appropriate. A p value of < 0.05 was considered statistically significant.
3. Result
3.1. HYA Inhibits Adipocyte Hypertrophy in Mice Fed a High-Fat Diet
To investigate the effects of HYA on adipose tissue, male C57BL/6J mice in which obesity was induced by a 6-week high-fat diet were divided into three groups, each receiving a high-fat diet (CT), a high-fat diet containing 1% HYA (HYA) and a high-fat diet containing 1% linoleic acid (LA) for another 5 weeks. Although no significant changes in fat mass were observed in mice fed HYA (Figure 1A), histological analysis of epididymal adipose tissue showed that adipocyte size was significantly reduced in HYA-fed mice compared to CT-fed mice. In contrast, no such effect was observed in LA-fed mice (Figure 1B-D).
3.2. HYA Decreases the Amount of Lipid Content in Cultured Adipocytes
To investigate whether the effect of HYA in vivo is a direct effect on adipocytes, we performed experiments using cultured adipocytes. After treatment of 3T3-L1 mature adipocytes with HYA, intracellular lipid content was evaluated by Oil Red staining. HYA-treated cells showed significantly reduced staining by Oil Red compared to control cells (Figure 2A, B). Consistent with the results of Oil Red staining, gene expression analysis by real-time PCR showed that the expression of genes related to lipogenesis such as FAS, ACC1, SCD1, and ChREBPα decreased in a HYA concentration-dependent manner (Figure 2C). Furthermore, the expression of CPT1A, which is involved in fatty acid utilization, was increased by HYA treatment (Figure 2C). The expression of genes related to lipolysis including ATGL and HSL was decreased by HYA treatment, suggesting that these changes may be compensatory for the decreased lipogenesis and increased fatty acid utilization. The effect of LA on such gene expression was relatively small compared to HYA. These results suggest that HYA suppresses adipocyte hypertrophy by inhibiting lipogenesis and promoting fatty acid oxidation.
3.3. HYA Activates AMP Kinase in Adipocytes
We focused on AMPK as the molecular mechanism of HYA action in adipocytes, a kinase that acts as a cellular energy sensor and plays an important role in metabolic regulation in response to changes in energy status [24,25]. Immunoblotting using phosphorylated antibodies of AMPK showed that HYA increased phosphorylation of AMPK in a concentration-dependent manner in 3T3-L1 mature adipocytes (Figure 3). Consistent with the increased phosphorylation of AMPK, HYA enhanced downstream ACC1 phosphorylation (Figure 3). In contrast, LA treatment did not induce such AMPK phosphorylation. These results suggest that the activation of AMPK by HYA is involved in the reduction of lipid content in adipocytes.
3.4. HYA Activates AMPK by Increasing Intracellular Ca²+ Concentration
One of the mechanisms of AMPK activation involves an increase in intracellular Ca²⁺ concentration [25,26]. To clarify the mechanism of AMPK activation by HYA, the effect of HYA on intracellular Ca²+ concentration in adipocytes was examined by Ca²⁺ imaging using the Fura2-AM probe. Compared to control cells, intracellular Ca²+ concentrations were significantly increased in HYA-treated 3T3-L1 mature adipocytes (Figure 4A, B). In contrast, no change in intracellular Ca²⁺ concentration was observed in cells treated with LA (Figure 4A, B). These results suggest that HYA activates AMPK by increasing intracellular Ca²⁺ concentration.
3.5. HYA Reduces Lipid Content in Adipocytes by a Mechanism Independent of GPR40 and GPR120
Long-chain fatty acids, including HYA, have been reported to act on GPR40 and GPR120 as their receptors [18,27]. To determine whether the action of HYA in adipocytes is mediated by GPR40 and GPR120, we examined the effects of GPR40 or GPR120 inhibitors on HYA-induced decrease in the expression of lipogenic genes in 3T3-L1 mature adipocytes. Real-time PCR analysis showed that HYA again suppressed the expression of lipogenic genes including Fas, Acc1, and Scd1 whereas treatment with GPR40 or GPR120 inhibitors did not cancel the HYA-induced decrease in the expression of these lipogenic genes (Figure 5). These results suggest that HYA acts in adipocytes by a mechanism independent of GPR40 and GPR120.
4. Discussion
Recent studies have revealed that metabolites produced by gut microbiota play an important role in the crosstalk between gut and other organs [12,13,14]. HYA, a metabolite produced by lactic acid bacteria such as Lactobacillus, has been reported to have several physiological functions in the host, its direct action on adipocytes and the mechanism remained unclear. In this study, we demonstrated for the first time that HYA suppresses adipocyte hypertrophy through AMPK activation. Thus, our study adds a new mechanism for metabolic regulation by organ crosstalk between gut and other tissues.
HYA has been reported to have anti-inflammatory effects, including improvement of intestinal epithelial barrier damage in dextran sulfate sodium-induced mouse colitis and atopic dermatitis in NC/nga mice [16,17]. HYA has also been reported to improve systemic metabolism. Miyamoto et al. showed that HYA improves glucose metabolism by promoting GLP-1 secretion via GPR40 and GPR120 in L cells [18]. They also reported that HYA reduces adipocyte size in mice fed a high-fat diet [18], consistent with our results. Although these effects of HYA have been shown to be accompanied by a decrease in food intake [18], we have now shown a mechanism by which HYA acts directly on adipocytes. Thus, HYA may act to suppress adipocyte hypertrophy through its direct action on adipocytes in addition to the effects on the central nervous system including feeding regulation. Given that adipocyte hypertrophy triggers adipose tissue dysfunction and subsequent systemic metabolic disorders, HYA may have a favorable effect on systemic metabolism at least in part through its action on adipocytes. We have recently shown that HYA ameliorates liver fibrosis in a MASH model by suppressing TGF-β signaling in hepatic stellate cells [20]. HYA has also been reported to reduce TG levels in hepatocytes by suppressing SREBP-1c expressions [19]. Although it is not determined whether HYA activates AMPK in the liver, the ameliorative effect of HYA on MASH may involve a reduction in fat accumulation through AMPK activation in the liver.
It is known that the regulatory mechanism of AMPK activity involves an increase in intracellular Ca²⁺ concentration [25,26]. In the present study, we found that HYA increases intracellular Ca²⁺ concentration in cultured adipocytes. The mechanism by which HYA increases intracellular Ca²⁺ concentrations in adipocytes was not determined in this study. Although HYA has been reported to activate the G protein-coupled receptors GPR40 and GPR120 in cultured L cells [18], pharmacological inhibition of both receptors did not cancel the effect of HYA in cultured adipocytes, suggesting that HYA regulates intracellular Ca²⁺ concentrations by a mechanism independent of GPR40 and GPR120 in adipocytes. There may be another GPCR that mediates the action of HYA. Another possibility is that a TRPV1-mediated mechanism may be involved. Previous paper showed that KetoA, a metabolite produced from HYA in the process of linoleic acid saturation, enhances energy metabolism by activating TRPV1 [28]. Given that TRPV1 is expressed predominantly in sensory neurons but also peripheral tissues including adipose tissue [29], it is possible that HYA may increase intracellular Ca²⁺ concentration in adipocytes via TRPV1. Another possible mechanism is that HYA is taken up by adipocytes and directly affects certain signals and transcription factors. In addition to intracellular Ca²⁺ concentration, the AMP/ATP ratio regulates AMPK activity [24,25]. Therefore, future studies are needed to determine whether HYA affects the AMP/ATP ratio in cells including adipocytes.
5. Conclusions
In this study, we show for the first time that HYA inhibits adipocyte hypertrophy by activating AMPK. Adipocyte hypertrophy plays an important role in the development of adipose tissue dysfunction and the subsequent systemic metabolic disorders. The mechanisms of metabolic regulation by HYA uncovered in this study provide an important basis for the development of new therapies for obesity and obesity-associated metabolic disorders.
Author Contributions
T.H. designed research; R.M., K.S., K.U., Y.H., and T.H. performed research; R.M., K.S., K.U., Y.I., R.A., N.K., Y.K., Y.O., H.K., Y.H., S.K., J.O., and T.H. analyzed data; T.H., R.M., and Y.I. wrote the manuscript. All authors have read and agreed to the manuscript.
Funding
This study was supported in part by research grant from ONO Medical Research Foundation.
Institutional Review Board Statement
The animal study protocol was approved by the Ethics Committee of University of Shizuoka (No. 215326) and Kobe University Graduate School of Medicine (No. P171006).
Acknowledgments
We thank Noster Inc. (Kyoto, Japan) for supplying purified HYA.
Conflicts of Interest
The authors declare no conflicts of interest.
Abbreviations
| ACC1 | acetyl-CoA carboxylase 1 |
| ATGL | adipose triglyceride lipase |
| ATP | adenosine triphosphate |
| AMP | adenosine monophosphate |
| CLA-HY | conjugated linoleic acid hydrase |
| ChREBPa | carbohydrate-responsive element-binding protein a |
| CPT1A | carnitine acyltransferase 1A |
| FAS | fatty acid synthase |
| GLP-1 | glucagon-like peptide-1 |
| GPCR | G protein-coupled receptor |
| GPR40 | G protein-coupled receptor 40 |
| GPR120 | G protein-coupled receptor 120 |
| HSL | hormone-sensitive lipase |
| HYA | 10-hydroxy-cis-12-octadecenoic acid |
| LA | linoleic acid |
| MASH | metabolic dysfunction-associated steatohepatitis |
| SCD1 | stearoyl-CoA desaturase 1 |
| TGF-b | transforming growth factor- b |
| TRPV1 | transient receptor potential vanilloid 1 |
References
- Reaven GM: Insulin resistance and human disease: a short history. J Basic Clin Physiol Pharmacol 1998, 9:387-406.
- Kaplan NM: The deadly quartet. Upper-body obesity, glucose intolerance, hypertriglyceridemia, and hypertension. Arch Intern Med 1989, 149:1514-1520.
- Expert Panel on Detection E, Treatment of High Blood Cholesterol in A: Executive Summary of The Third Report of The National Cholesterol Education Program (NCEP) Expert Panel on Detection, Evaluation, And Treatment of High Blood Cholesterol In Adults (Adult Treatment Panel III). JAMA 2001, 285:2486-2497.
- Renehan AG, Tyson M, Egger M, Heller RF, Zwahlen M: Body-mass index and incidence of cancer: a systematic review and meta-analysis of prospective observational studies. Lancet 2008, 371:569-578. [CrossRef]
- Jiao L, Berrington de Gonzalez A, Hartge P, Pfeiffer RM, Park Y, Freedman DM, Gail MH, Alavanja MC, Albanes D, Beane Freeman LE, et al: Body mass index, effect modifiers, and risk of pancreatic cancer: a pooled study of seven prospective cohorts. Cancer Causes Control 2010, 21:1305-1314. [CrossRef]
- Kahn CR: Triglycerides and toggling the tummy. Nat Genet 2000, 25:6-7.
- Spiegelman BM, Flier JS: Obesity and the regulation of energy balance. Cell 2001, 104:531-543.
- Kahn CR, Wang G, Lee KY: Altered adipose tissue and adipocyte function in the pathogenesis of metabolic syndrome. J Clin Invest 2019, 129:3990-4000.
- Gregor MF, Hotamisligil GS: Inflammatory mechanisms in obesity. Annu Rev Immunol 2011, 29:415-445.
- Kadowaki T, Yamauchi T, Kubota N, Hara K, Ueki K, Tobe K: Adiponectin and adiponectin receptors in insulin resistance, diabetes, and the metabolic syndrome. J Clin Invest 2006, 116:1784-1792.
- Santoro A, McGraw TE, Kahn BB: Insulin action in adipocytes, adipose remodeling, and systemic effects. Cell Metab 2021, 33:748-757.
- Descamps HC, Herrmann B, Wiredu D, Thaiss CA: The path toward using microbial metabolites as therapies. EBioMedicine 2019, 44:747-754.
- Rastogi S, Singh A: Gut microbiome and human health: Exploring how the probiotic genus Lactobacillus modulate immune responses. Front Pharmacol 2022, 13:1042189. [CrossRef]
- Zhang Y, Chen R, Zhang D, Qi S, Liu Y: Metabolite interactions between host and microbiota during health and disease: Which feeds the other? Biomed Pharmacother 2023, 160:114295.
- Kishino S, Takeuchi M, Park SB, Hirata A, Kitamura N, Kunisawa J, Kiyono H, Iwamoto R, Isobe Y, Arita M, et al: Polyunsaturated fatty acid saturation by gut lactic acid bacteria affecting host lipid composition. Proc Natl Acad Sci U S A 2013, 110:17808-17813. [CrossRef]
- Kaikiri H, Miyamoto J, Kawakami T, Park SB, Kitamura N, Kishino S, Yonejima Y, Hisa K, Watanabe J, Ogita T, et al: Supplemental feeding of a gut microbial metabolite of linoleic acid, 10-hydroxy-cis-12-octadecenoic acid, alleviates spontaneous atopic dermatitis and modulates intestinal microbiota in NC/nga mice. Int J Food Sci Nutr 2017, 68:941-951. [CrossRef]
- Miyamoto J, Mizukure T, Park SB, Kishino S, Kimura I, Hirano K, Bergamo P, Rossi M, Suzuki T, Arita M, et al: A gut microbial metabolite of linoleic acid, 10-hydroxy-cis-12-octadecenoic acid, ameliorates intestinal epithelial barrier impairment partially via GPR40-MEK-ERK pathway. J Biol Chem 2015, 290:2902-2918. [CrossRef]
- Miyamoto J, Igarashi M, Watanabe K, Karaki SI, Mukouyama H, Kishino S, Li X, Ichimura A, Irie J, Sugimoto Y, et al: Gut microbiota confers host resistance to obesity by metabolizing dietary polyunsaturated fatty acids. Nat Commun 2019, 10:4007. [CrossRef]
- Nanthirudjanar T, Furumoto H, Zheng J, Kim YI, Goto T, Takahashi N, Kawada T, Park SB, Hirata A, Kitamura N, et al: Gut Microbial Fatty Acid Metabolites Reduce Triacylglycerol Levels in Hepatocytes. Lipids 2015, 50:1093-1102. [CrossRef]
- Kasahara N, Imi Y, Amano R, Shinohara M, Okada K, Hosokawa Y, Imamori M, Tomimoto C, Kunisawa J, Kishino S, et al: A gut microbial metabolite of linoleic acid ameliorates liver fibrosis by inhibiting TGF-beta signaling in hepatic stellate cells. Sci Rep 2023, 13:18983.
- Hosooka T, Noguchi T, Kotani K, Nakamura T, Sakaue H, Inoue H, Ogawa W, Tobimatsu K, Takazawa K, Sakai M, et al: Dok1 mediates high-fat diet-induced adipocyte hypertrophy and obesity through modulation of PPAR-gamma phosphorylation. Nat Med 2008, 14:188-193.
- Hosooka T, Hosokawa Y, Matsugi K, Shinohara M, Senga Y, Tamori Y, Aoki C, Matsui S, Sasaki T, Kitamura T, et al: The PDK1-FoxO1 signaling in adipocytes controls systemic insulin sensitivity through the 5-lipoxygenase-leukotriene B(4) axis. Proc Natl Acad Sci U S A 2020, 117:11674-11684.
- Kita T, Uchida K, Kato K, Suzuki Y, Tominaga M, Yamazaki J: FK506 (tacrolimus) causes pain sensation through the activation of transient receptor potential ankyrin 1 (TRPA1) channels. J Physiol Sci 2019, 69:305-316. [CrossRef]
- Steinberg GR, Hardie DG: New insights into activation and function of the AMPK. Nat Rev Mol Cell Biol 2023, 24:255-272.
- Hardie DG: Role of AMP-activated protein kinase in the metabolic syndrome and in heart disease. FEBS Lett 2008, 582:81-89.
- McAloon LM, Muller AG, Nay K, Lu EL, Smeuninx B, Means AR, Febbraio MA, Scott JW: CaMKK2: bridging the gap between Ca2+ signaling and energy-sensing. Essays Biochem 2024, 68:309-320.
- Oteng AB, Liu L: GPCR-mediated effects of fatty acids and bile acids on glucose homeostasis. Front Endocrinol (Lausanne) 2023, 14:1206063. [CrossRef]
- Kim M, Furuzono T, Yamakuni K, Li Y, Kim YI, Takahashi H, Ohue-Kitano R, Jheng HF, Takahashi N, Kano Y, et al: 10-oxo-12(Z)-octadecenoic acid, a linoleic acid metabolite produced by gut lactic acid bacteria, enhances energy metabolism by activation of TRPV1. FASEB J 2017, 31:5036-5048. [CrossRef]
- Sun W, Yu Z, Yang S, Jiang C, Kou Y, Xiao L, Tang S, Zhu T: A Transcriptomic Analysis Reveals Novel Patterns of Gene Expression During 3T3-L1 Adipocyte Differentiation. Front Mol Biosci 2020, 7:564339. [CrossRef]
Figure 1.
Effect of HYA treatment on adipocyte hypertrophy in mice fed a high-fat diet. (A) Weight of epididymal adipose tissue (eWAT) in mice fed a high-fat diet (Control) or a high-fat diet containing 1% HYA or 1% LA for 5 weeks after a 6-week high-fat diet (n = 10 mice per group). (B) Representative hematoxylin-eosin (H&E) staining for eWAT of mice as in (A). (C and D) Distribution of adipocyte size (C) and average of adipocyte size (D) shown in (B). Data in (A) and (D) are means ± SEM. **p < 0.01 (one-way ANOVA followed by Tukey’s test).
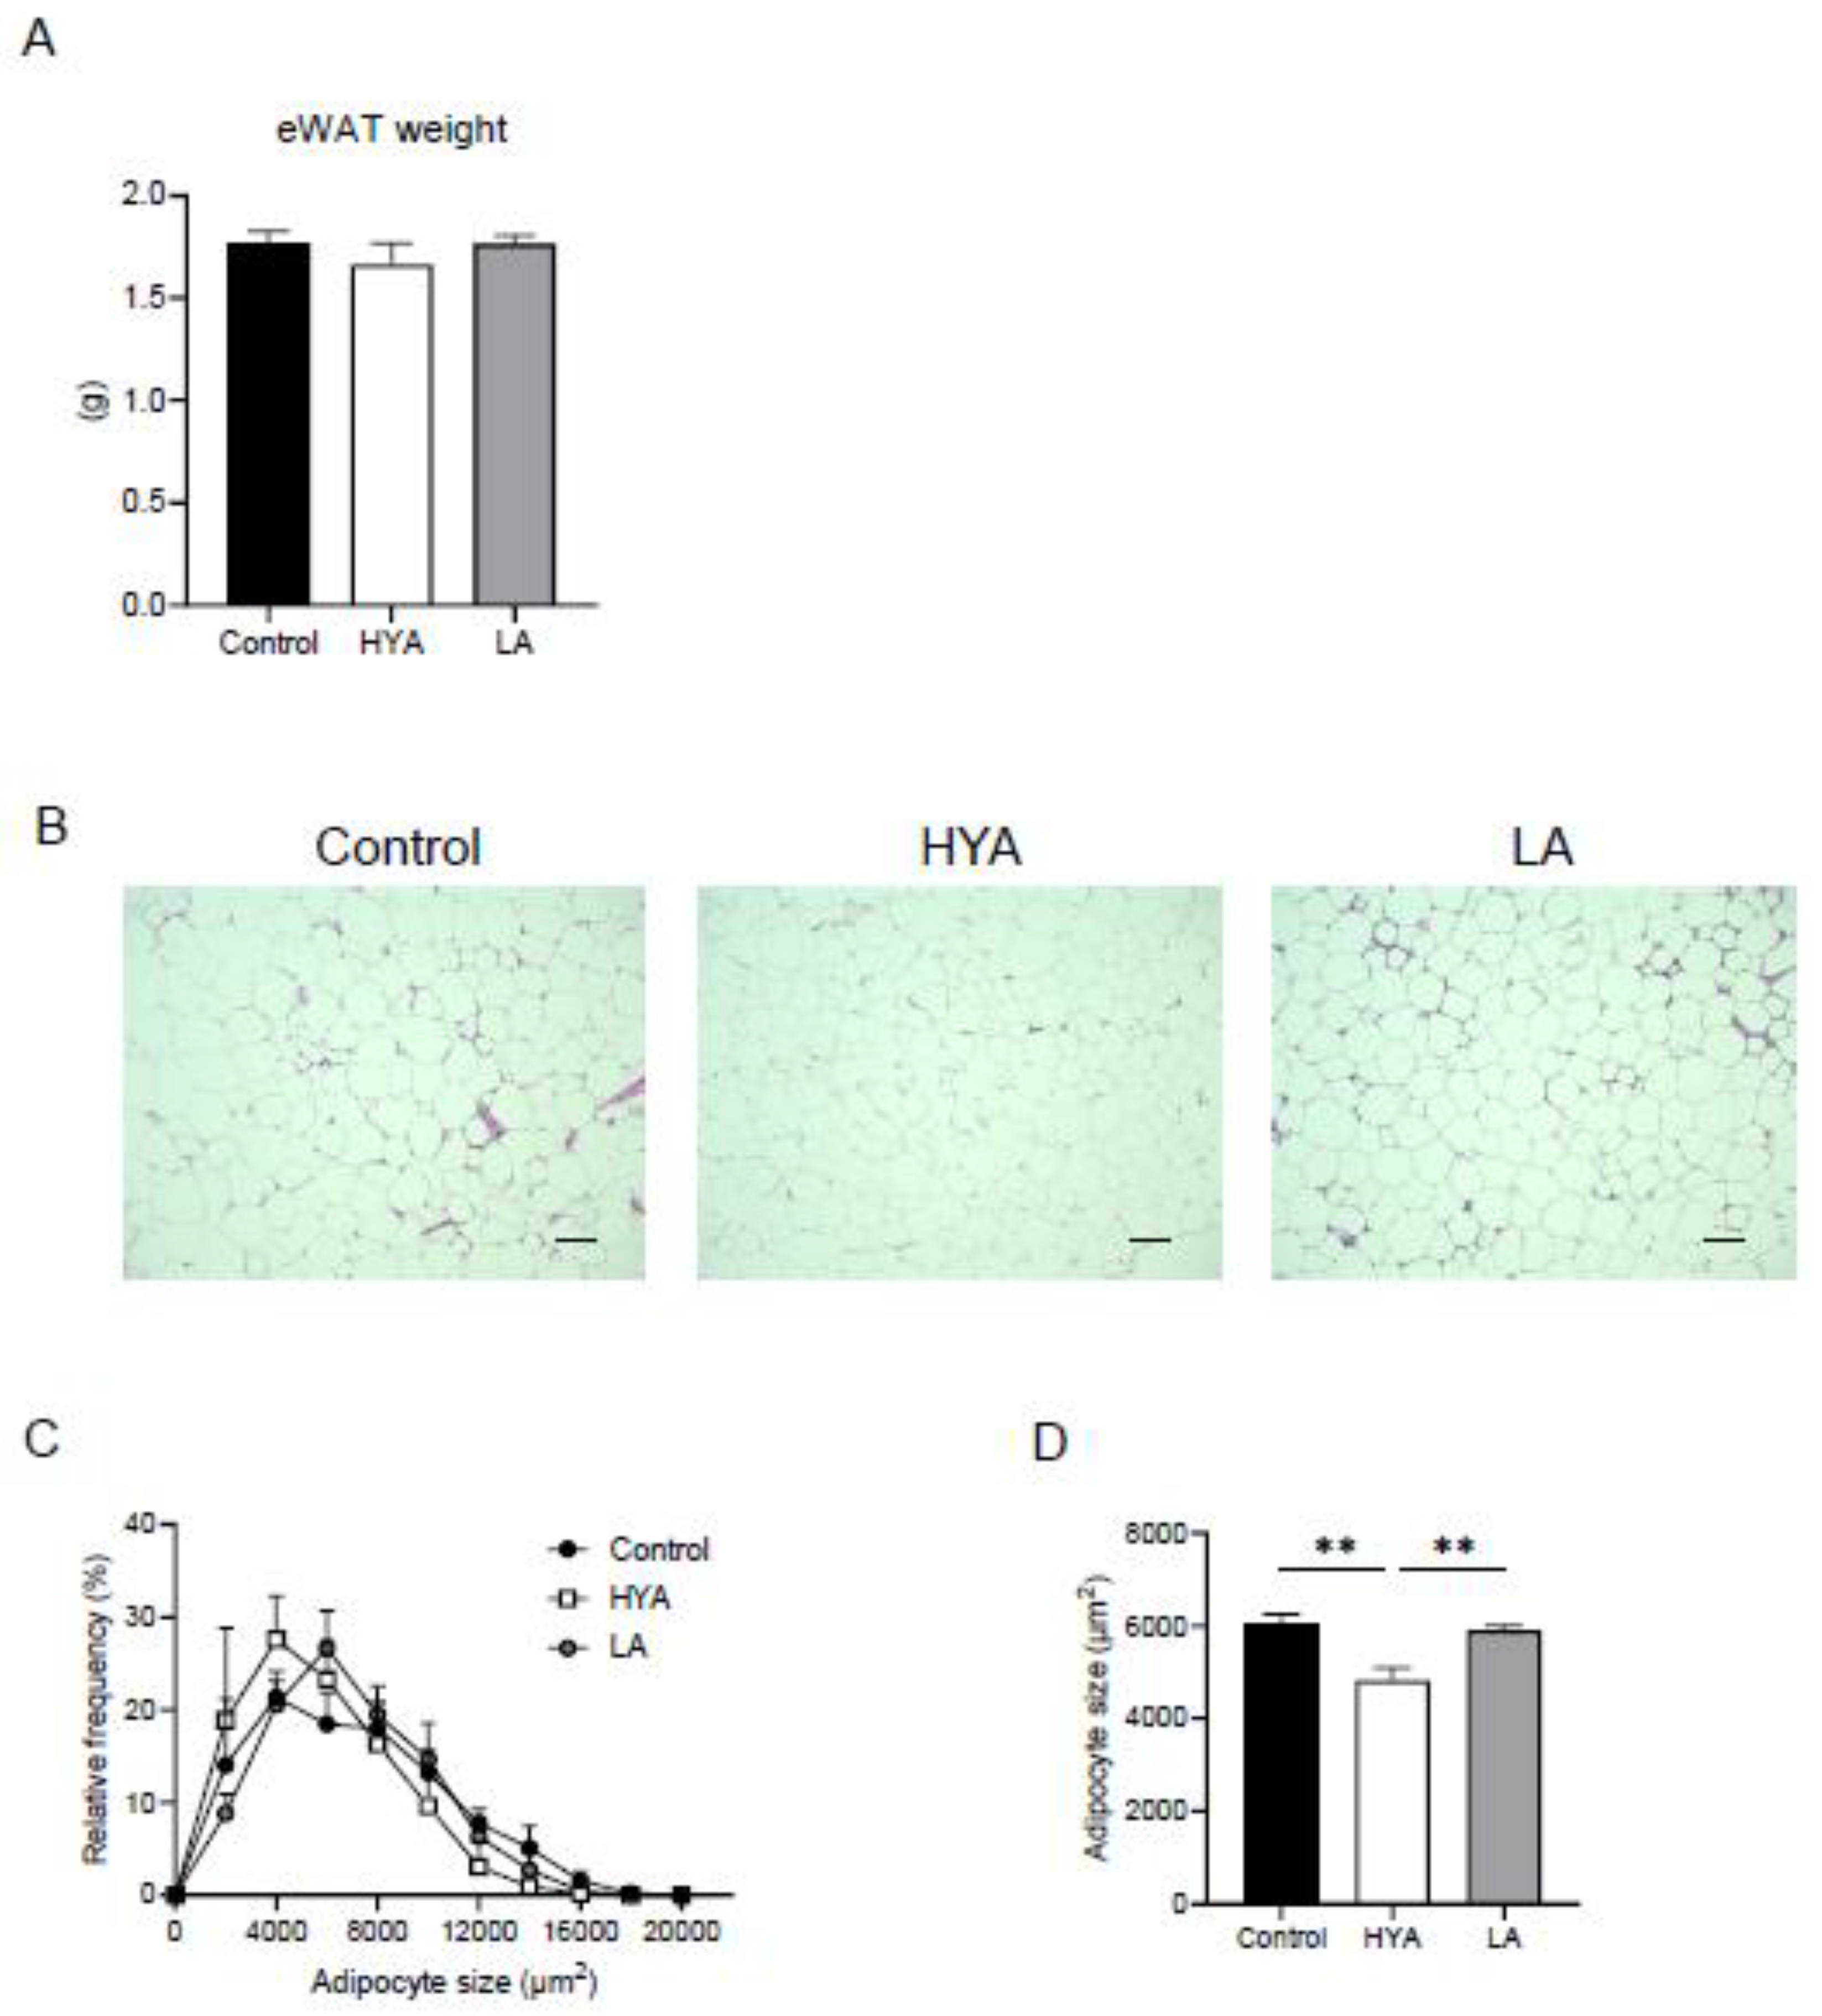
Figure 2.
Effect of HYA on lipid content in 3T3-L1 adipocytes. (A) Representative Oil red O staining of 3T3-L1 adipocytes incubated in the absence (Control) or presence of HYA (10 or 30 μM) or LA (10 or 30 μM) for 48 h. (B) Quantification of Oil red O staining shown in (A). (C) RT-qPCR analysis of mRNA abundance for lipid metabolism-related genes in 3T3-L1 adipocytes treated under the same conditions as in (A). Data in (B) and (C) are means ± SEM (n = 3). *p < 0.05, **p < 0.01, ***p < 0.001 versus control; #p < 0.05, ##p < 0.01, ###p < 0.001 versus HYA 30 µM; †p < 0.05, ††p < 0.01, †††p < 0.001 versus HYA 100 µM; $$ p < 0.01 versus LA 30 µM (one-way ANOVA followed by Tukey’s test).
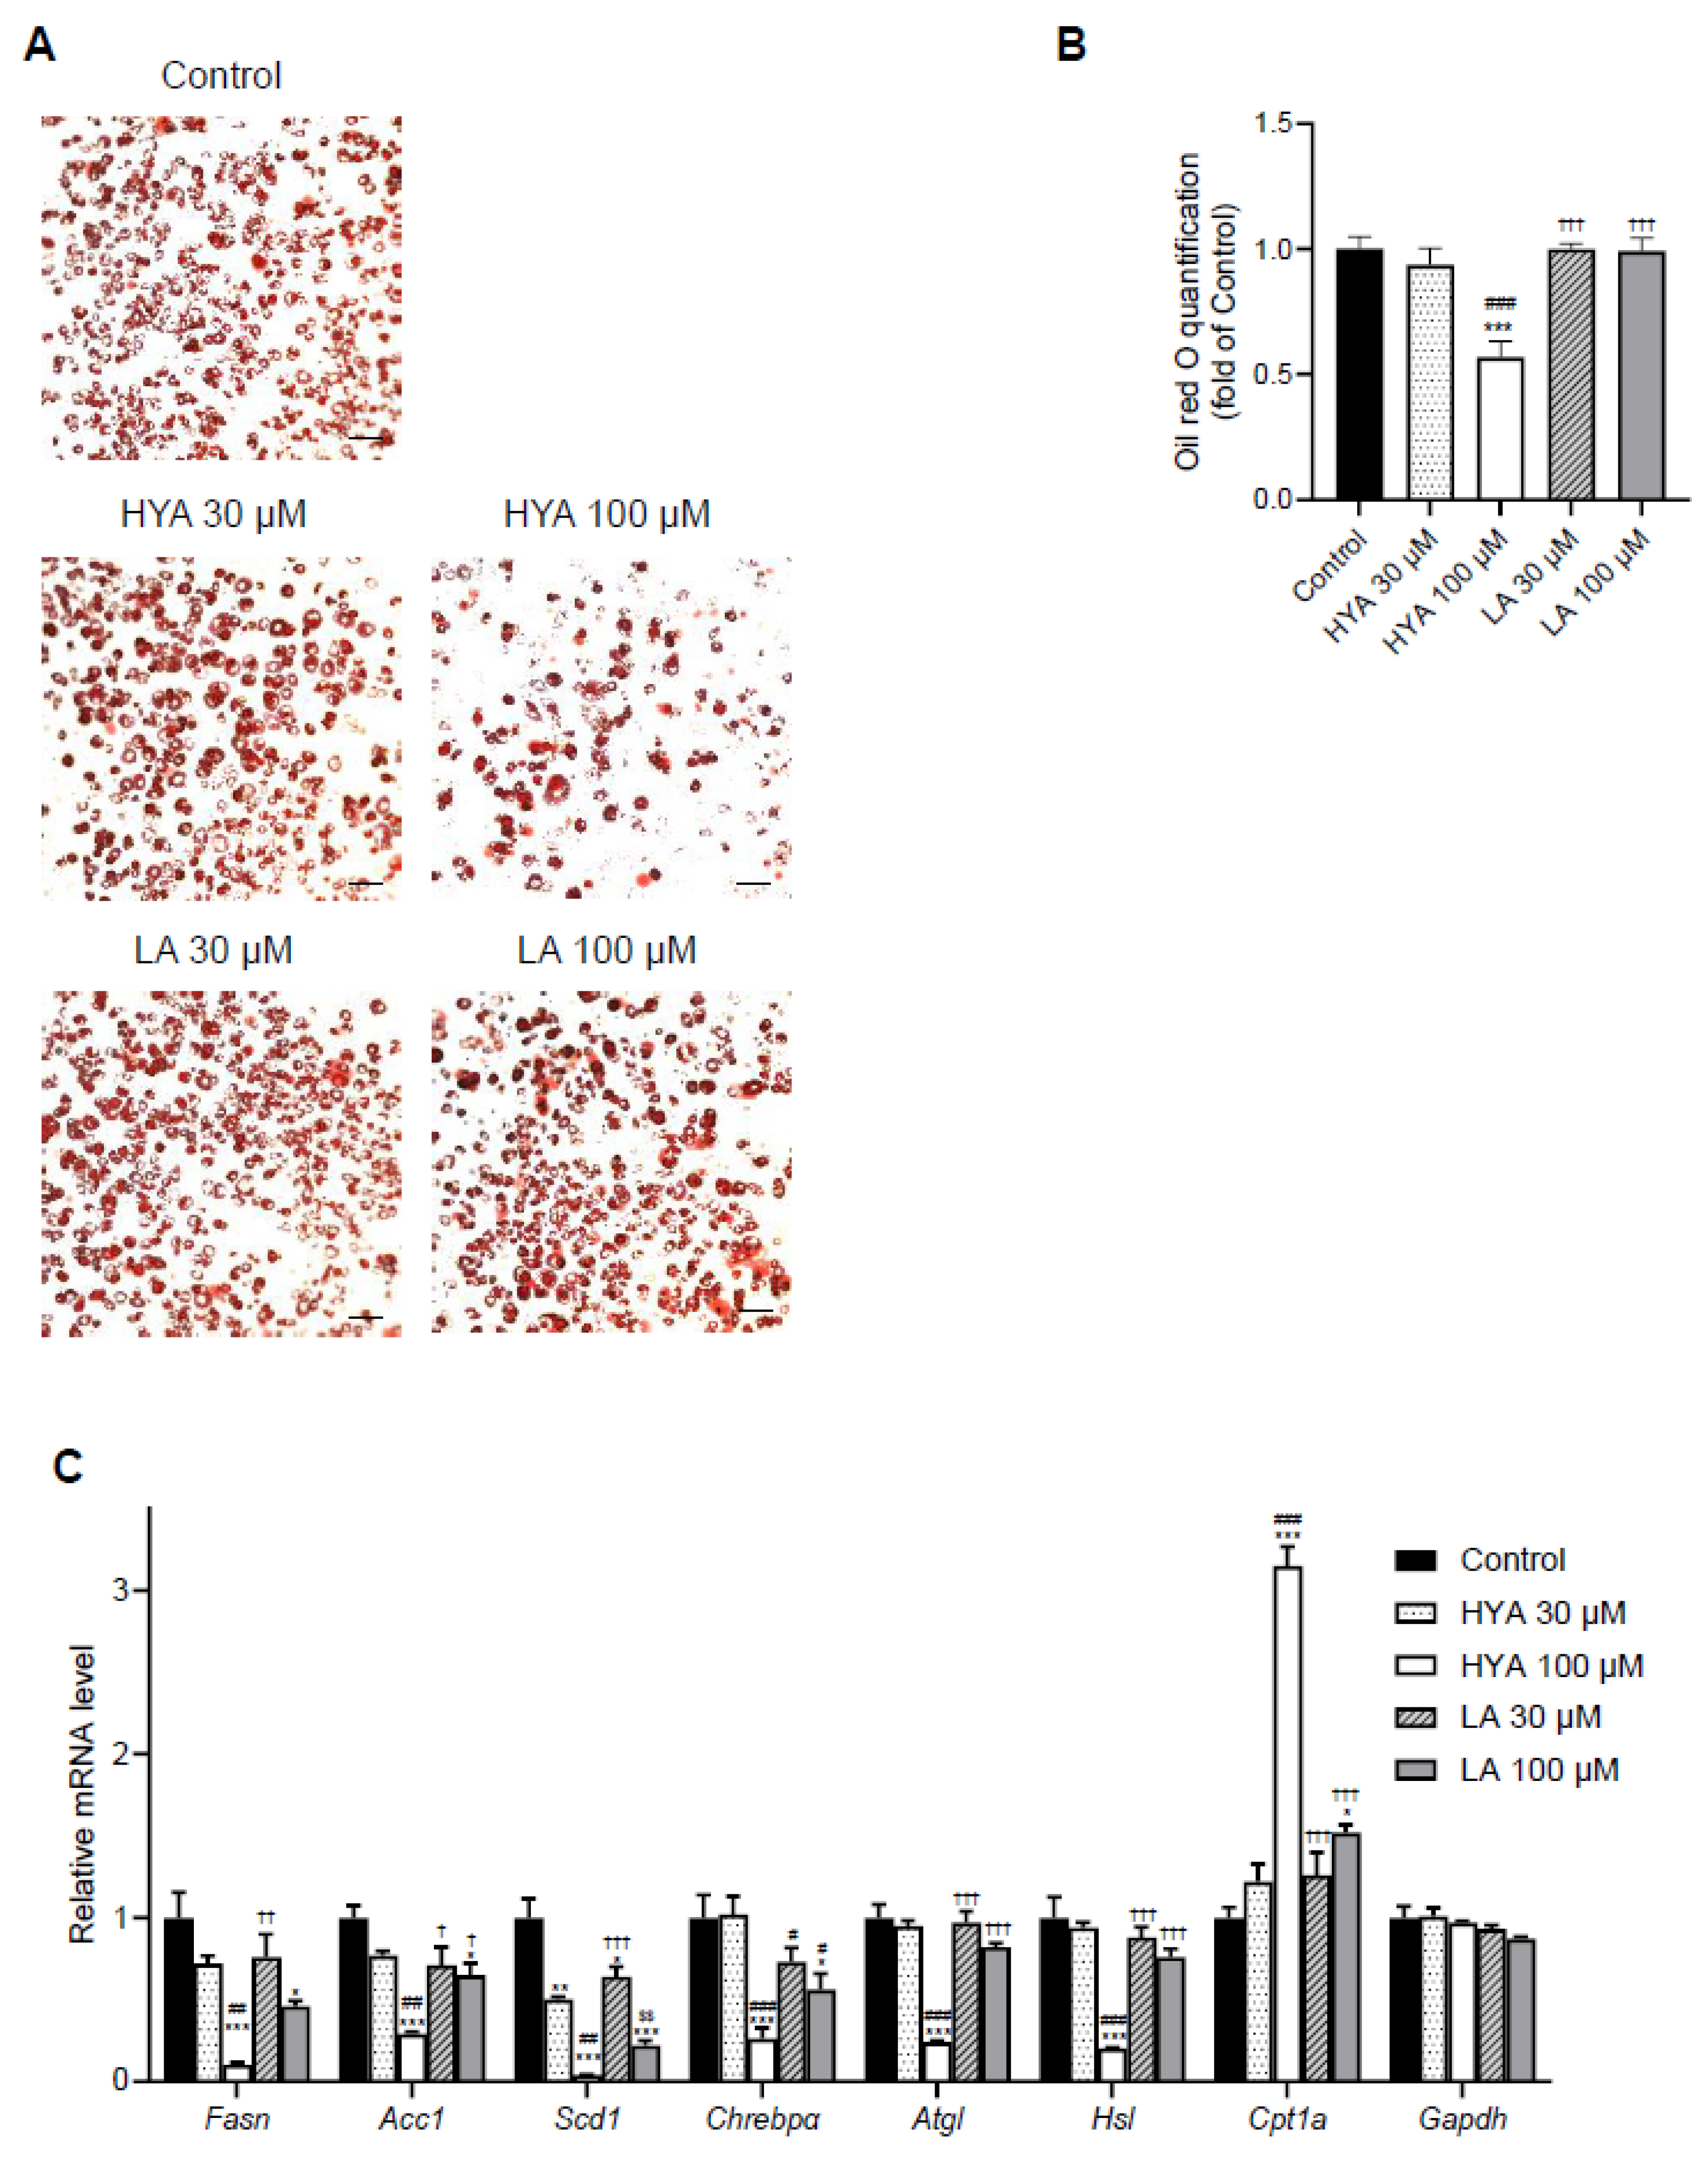
Figure 3.
Effect of HYA on AMPK activation in 3T3-L1 adipocytes. Immunoblot analysis of total and phosphorylated (p) forms of AMPK and ACC1 in 3T3-L1 adipocytes incubated in the absence (Control) or presence of HYA (30, 100, or 300 μM), LA (30, 100, or 300 μM), or 1 mM AICAR for 1 h.
Figure 3.
Effect of HYA on AMPK activation in 3T3-L1 adipocytes. Immunoblot analysis of total and phosphorylated (p) forms of AMPK and ACC1 in 3T3-L1 adipocytes incubated in the absence (Control) or presence of HYA (30, 100, or 300 μM), LA (30, 100, or 300 μM), or 1 mM AICAR for 1 h.
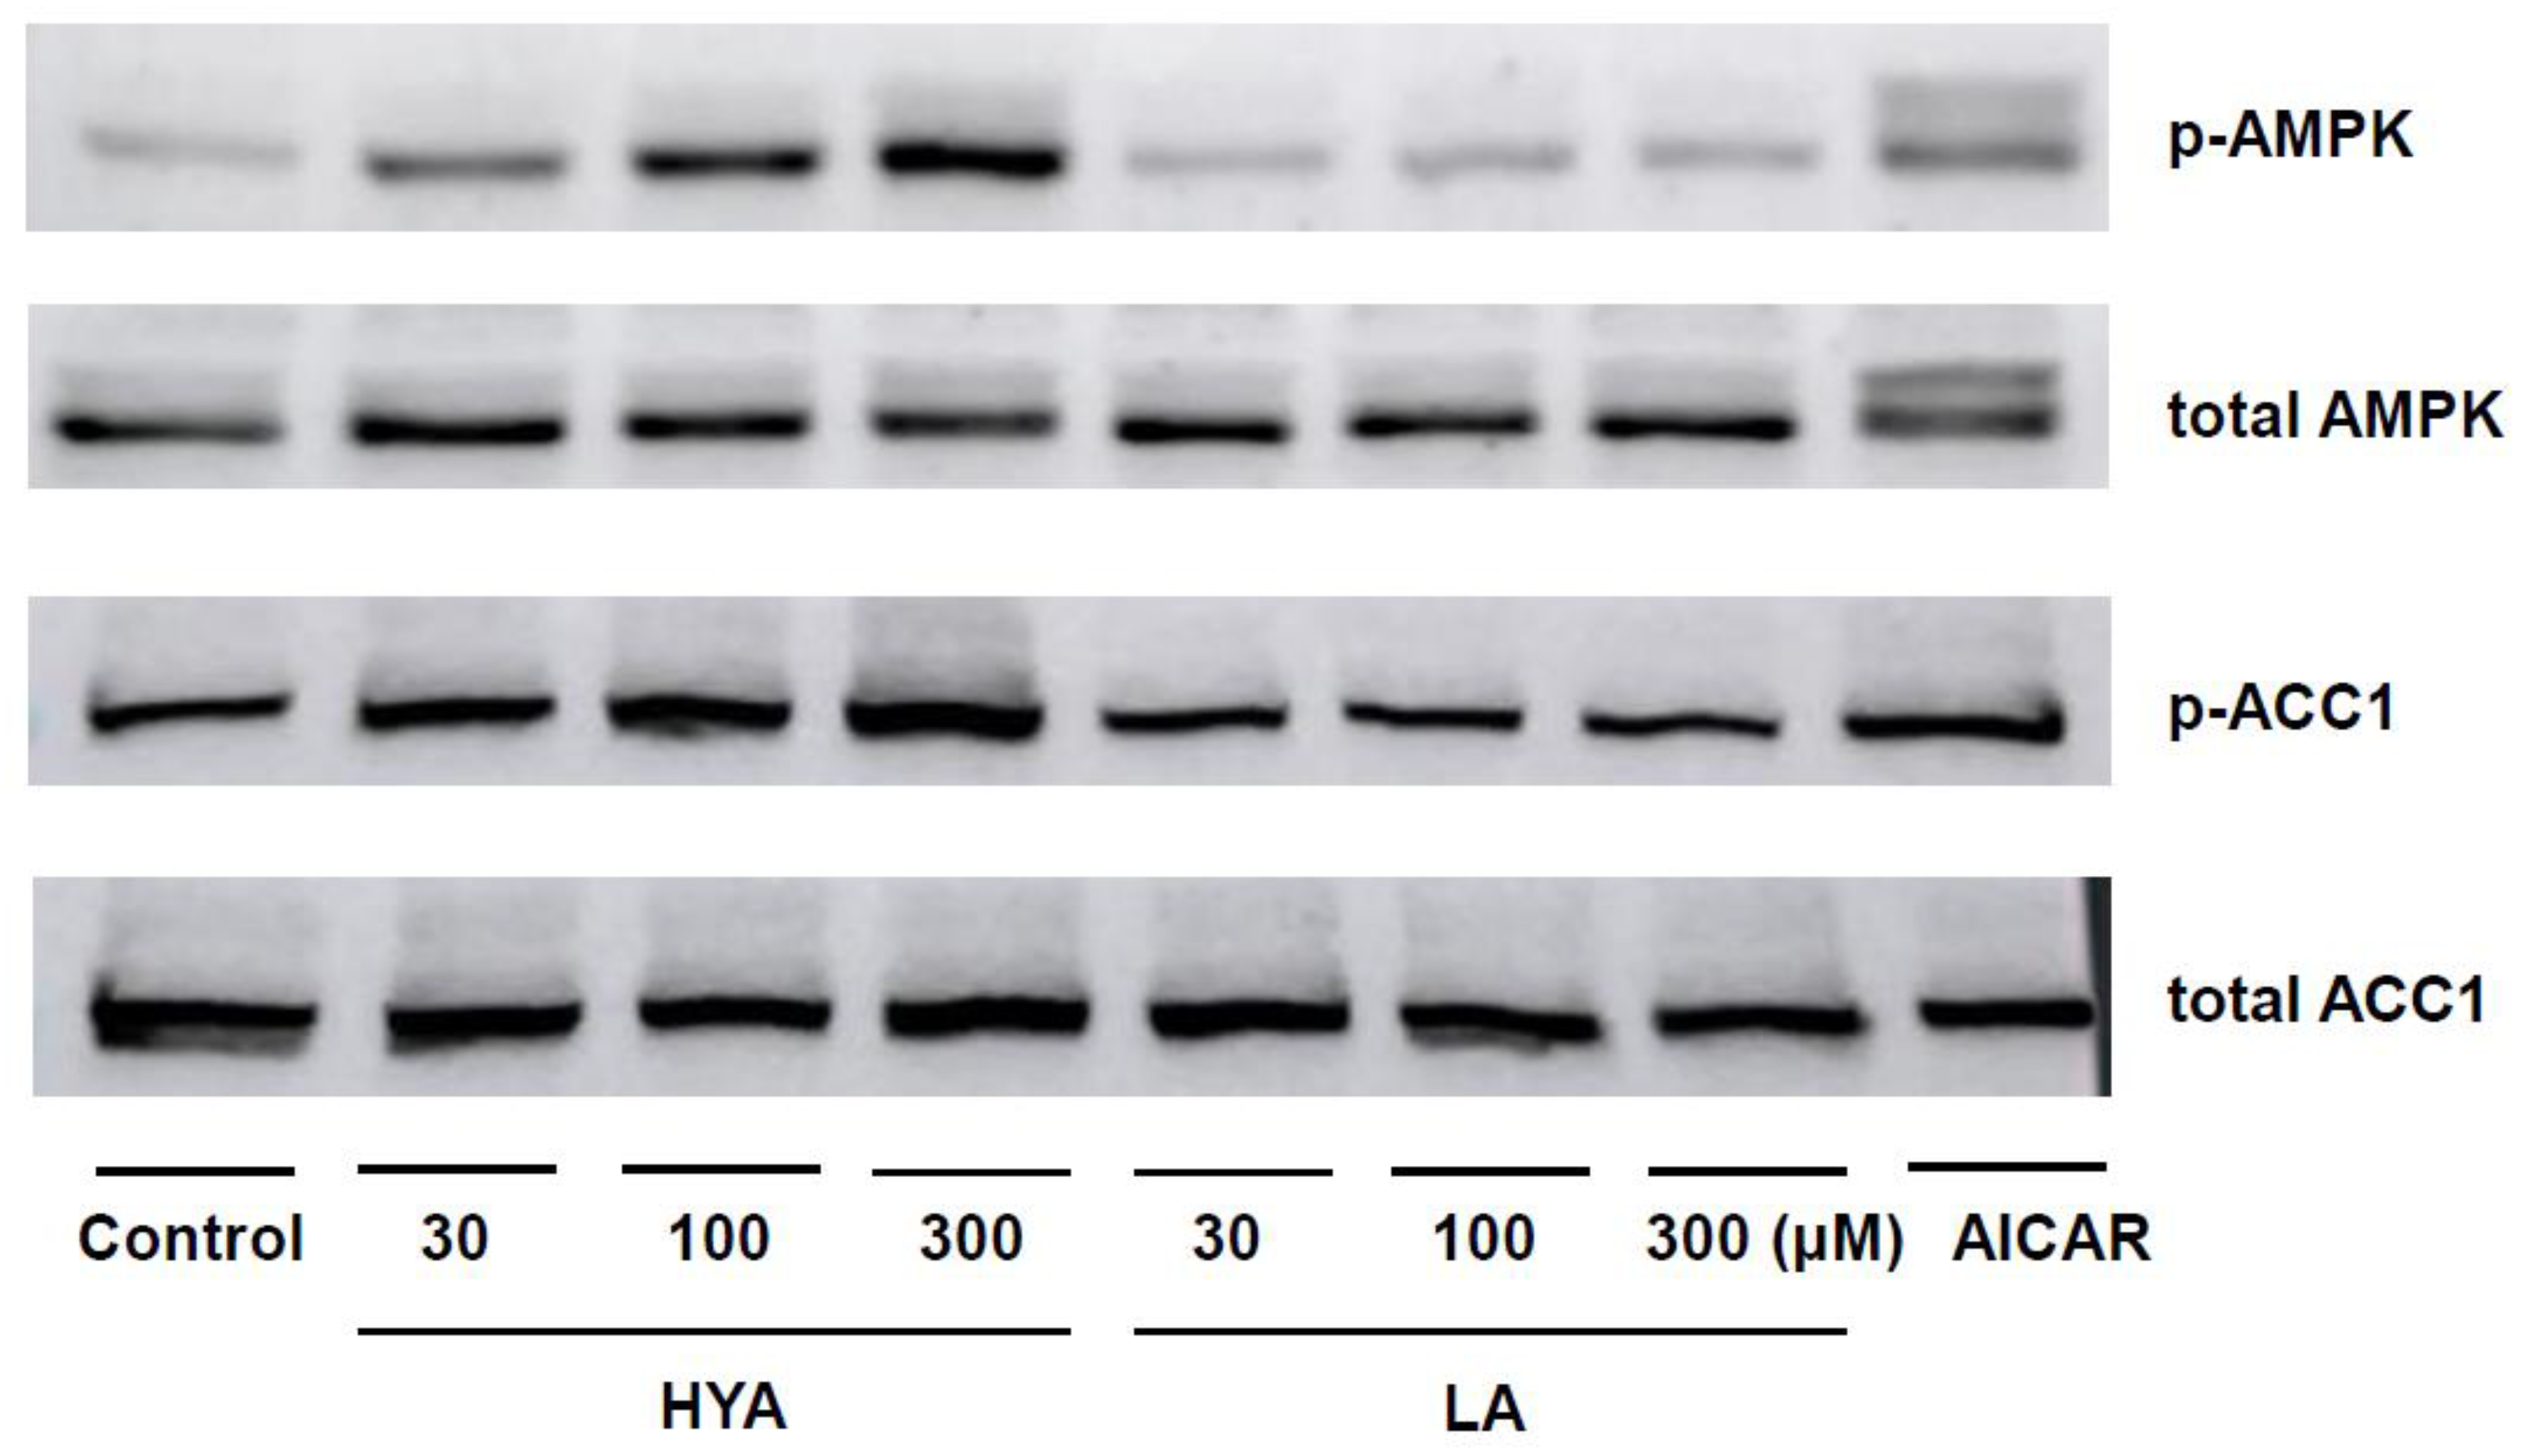
Figure 4.
Effect of HYA on intracellular Ca2+ concentration in 3T3-L1 adipocytes. (A) Changes in intracellular Ca2+ concentrations in 3T3-L1 adipocytes incubated with DMSO (Control), HYA (300 μM), or LA (300 μM). Y-axis: Fura-2 ratio (340/380 nm). (B) Ratio of the peak response during treatment with DMSO, HYA, or LA to that of ionomycin treatment in (A). Data in (B) are means ± SEM. ***p < 0.001 (one-way ANOVA followed by Tukey’s test).
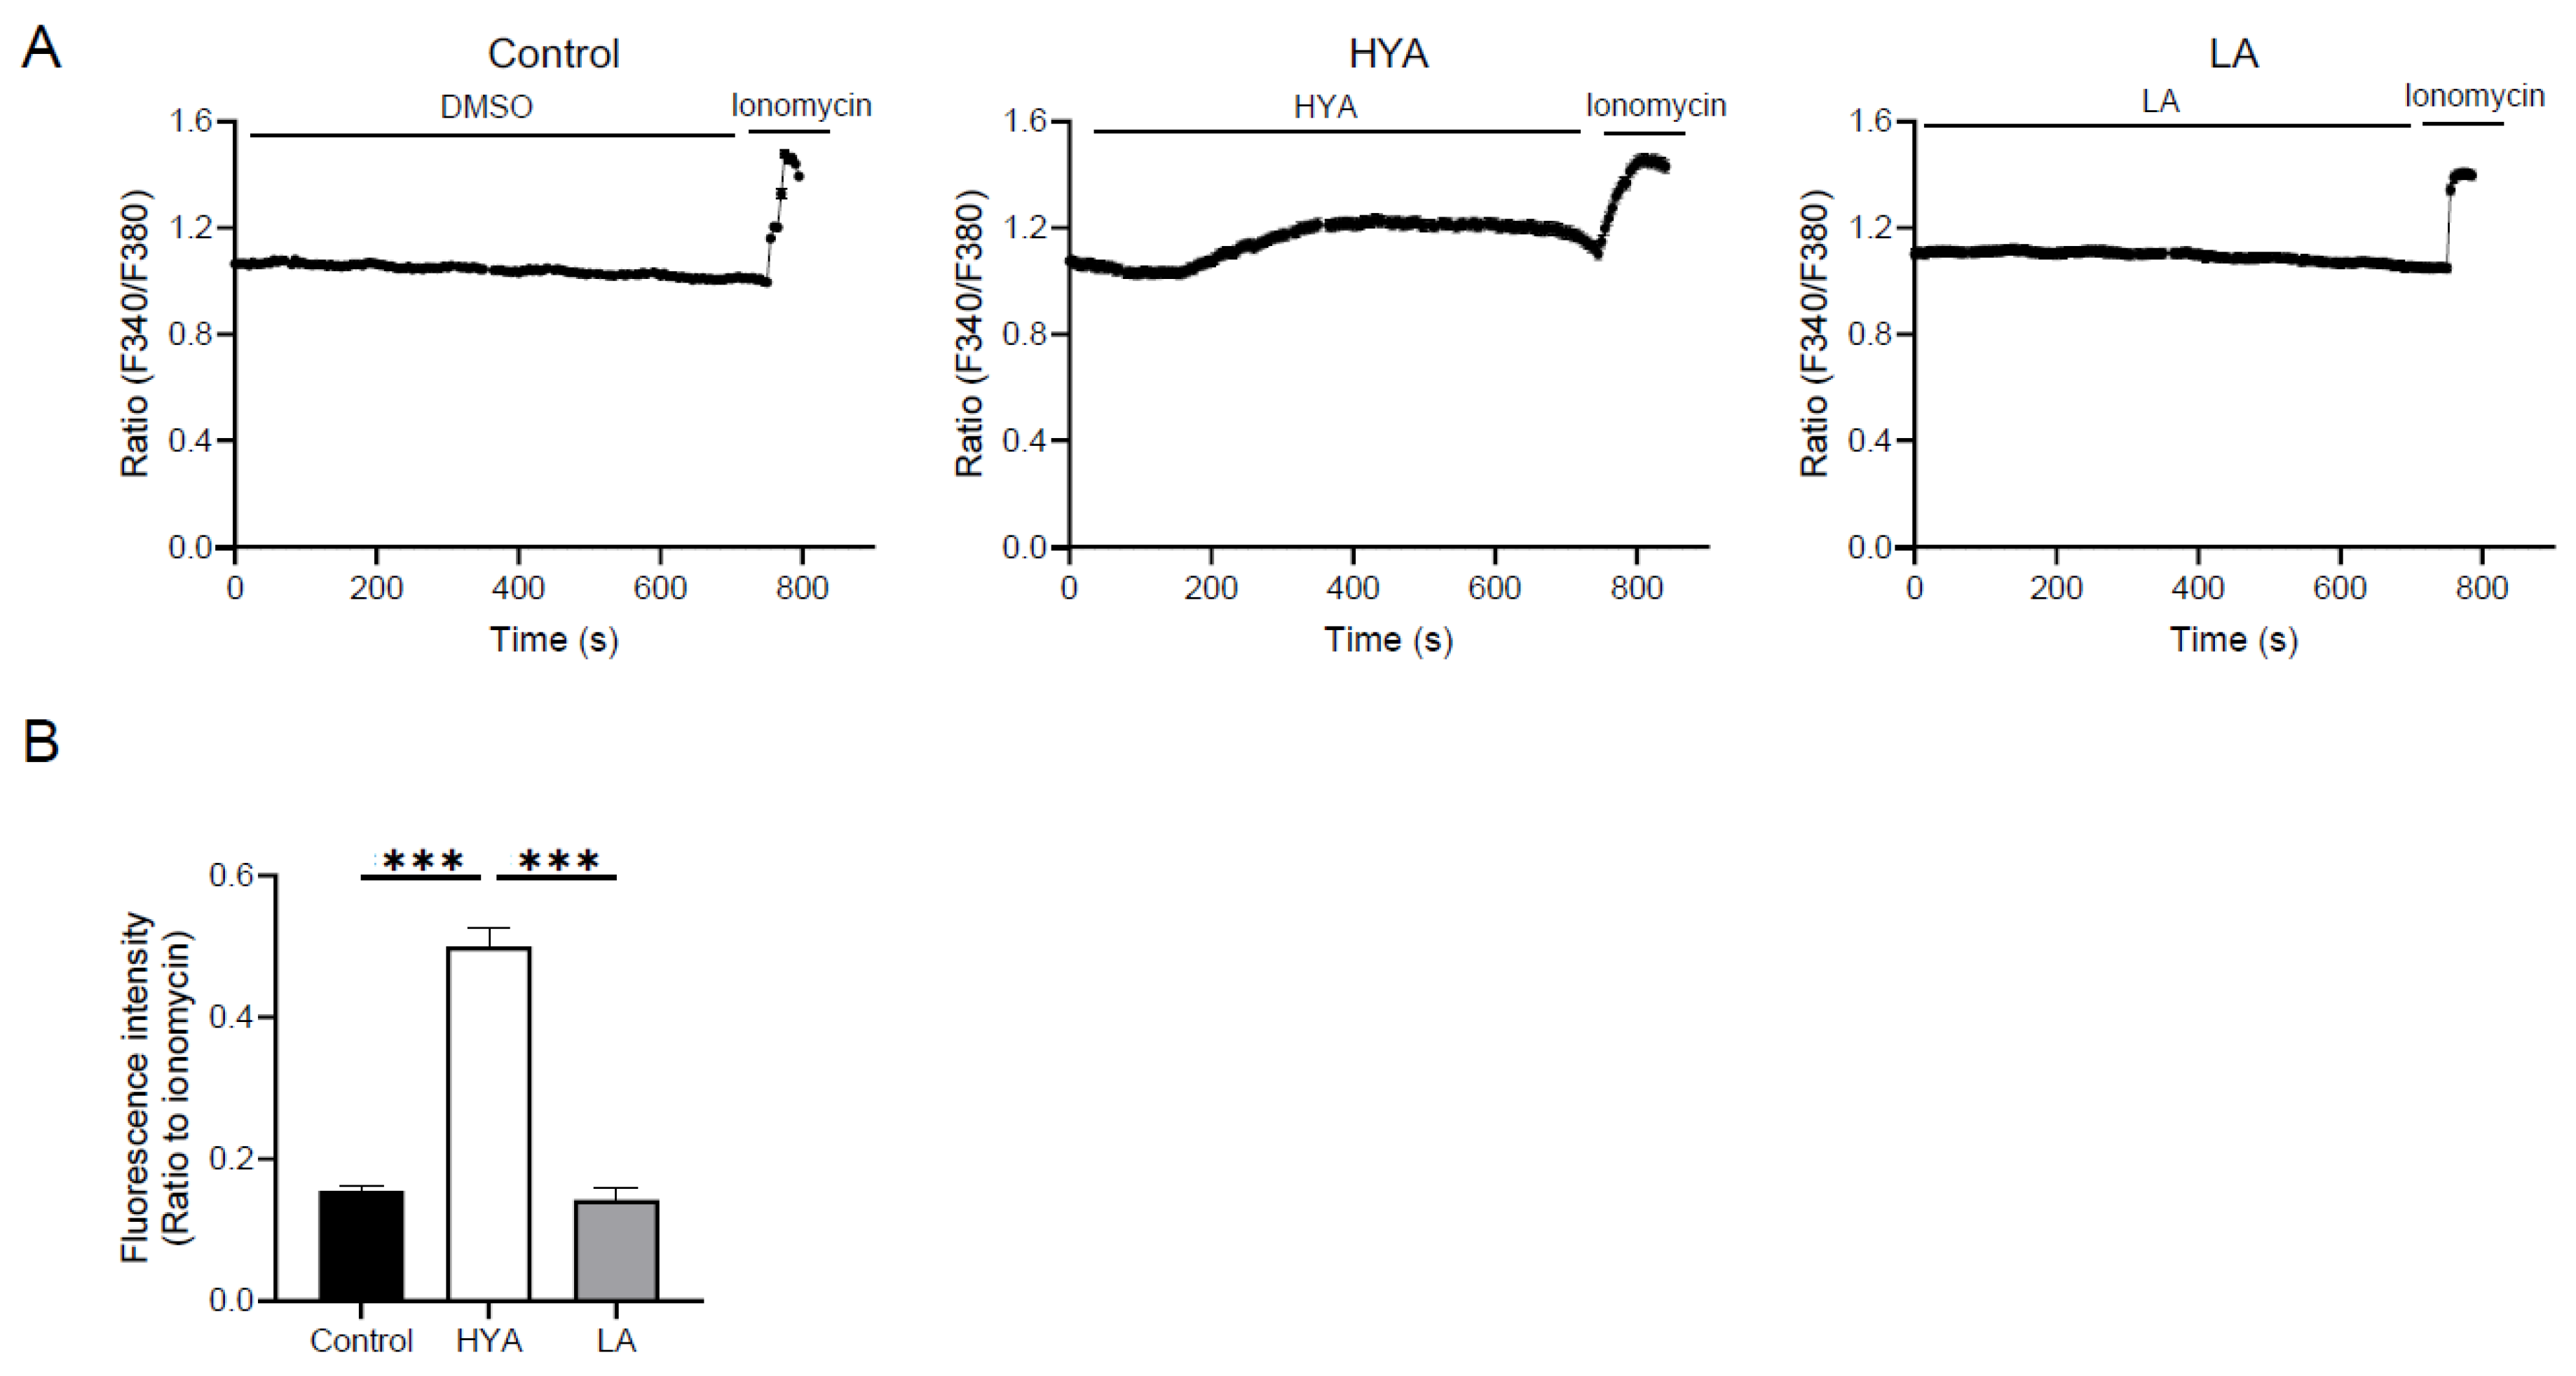
Figure 5.
Effect of inhibitors for GPR40 or GPR120 on HYA-mediated suppression of gene expression related to lipogenesis in 3T3-L1 adipocytes. RT-qPCR analysis of mRNA abundance for lipogenesis-related genes in 3T3-L1 adipocytes treated in the absence (Control) or presence of HYA (100 μM) and inhibitors for GPR40 (GW1100) or for GPR120 (AH7614) for 48 h. Data are means ± SEM (n = 3). ***p < 0.001 versus control (one-way ANOVA followed by Tukey’s test).
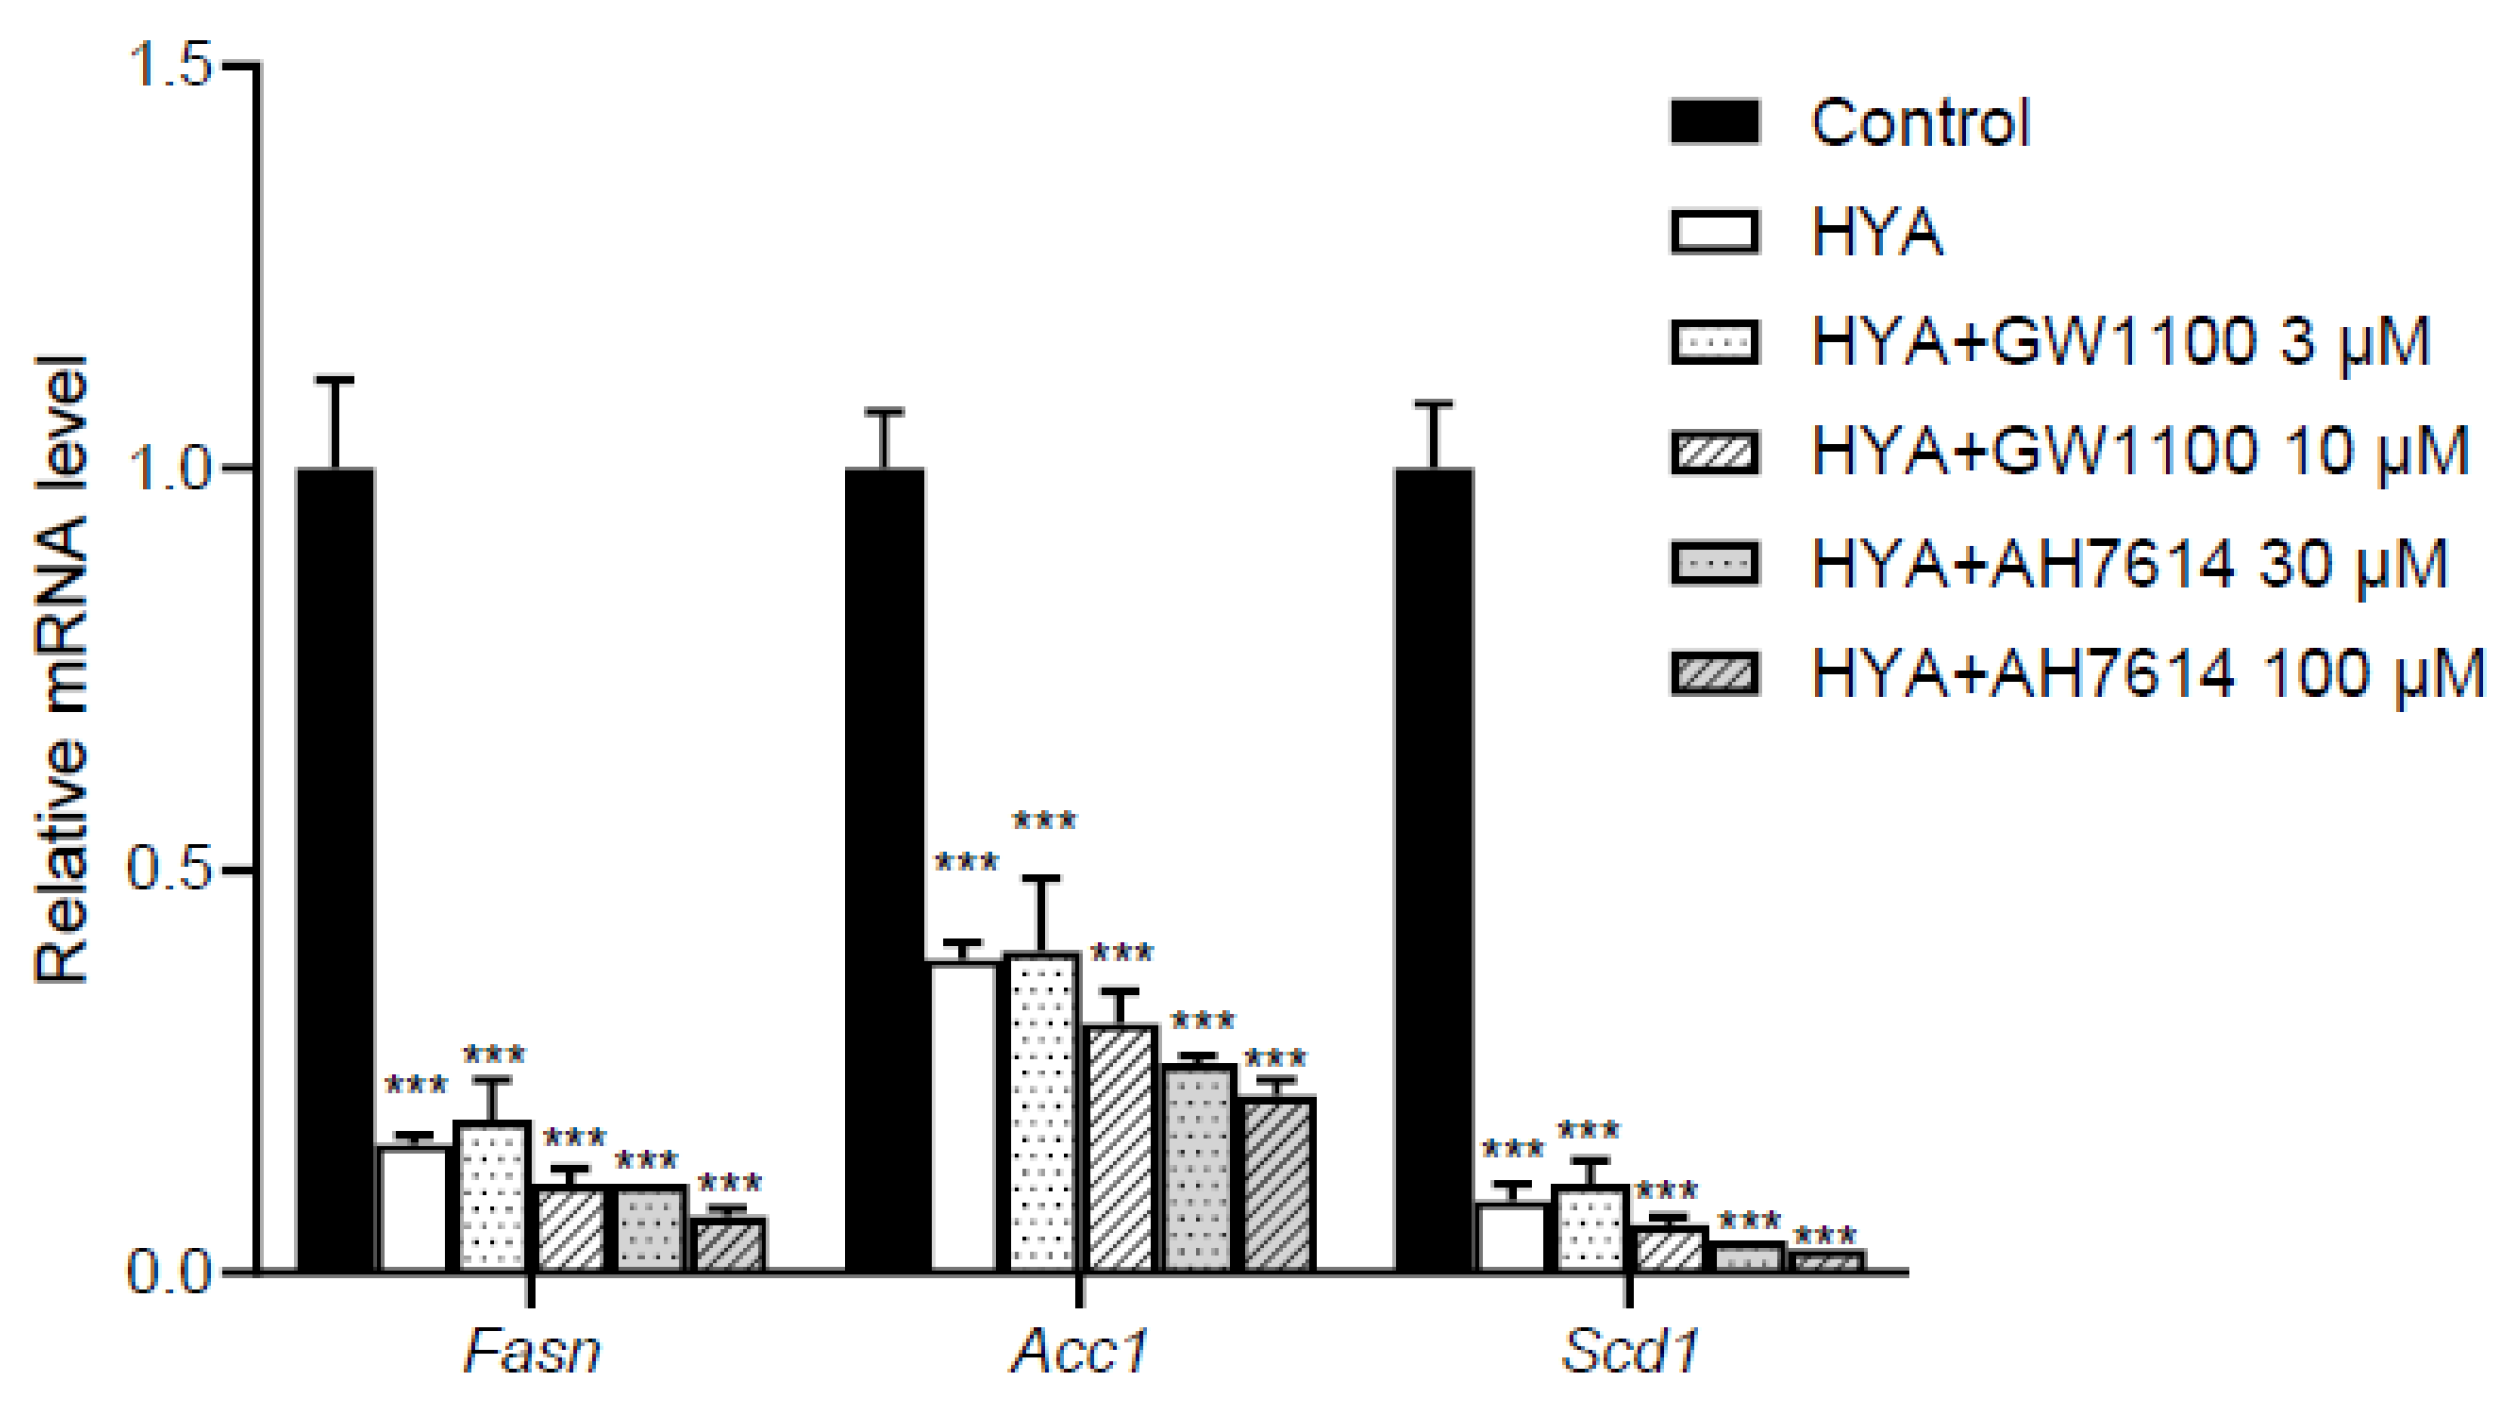

Table 1.
The sequences of the PCR primers.
Disclaimer/Publisher’s Note: The statements, opinions and data contained in all publications are solely those of the individual author(s) and contributor(s) and not of MDPI and/or the editor(s). MDPI and/or the editor(s) disclaim responsibility for any injury to people or property resulting from any ideas, methods, instructions or products referred to in the content. |
© 2025 by the authors. Licensee MDPI, Basel, Switzerland. This article is an open access article distributed under the terms and conditions of the Creative Commons Attribution (CC BY) license (http://creativecommons.org/licenses/by/4.0/).
Copyright: This open access article is published under a Creative Commons CC BY 4.0 license, which permit the free download, distribution, and reuse, provided that the author and preprint are cited in any reuse.


