
Submitted:
04 April 2025
Posted:
07 April 2025
You are already at the latest version
Abstract
Land-use change driven by urbanization has led to considerable habitat degradation and biodiversity loss, underscoring the need for spatially explicit assessment tools. This study evaluates habitat quality and threat intensity in Gochang-gun, South Korea, by integrating a biotope map with the Habitat Quality module of the InVEST model. Land cover was classified using detailed biotope types, and sensitivity values were assigned to each based on their vulnerability to specific threats such as urban areas, roads, and agricultural activity. Spatial modeling revealed high habitat quality in forested and protected zones like Seonunsan Provincial Park and the Dongrim Reservoir, whereas urban and agricultural regions exhibited substantial degradation. Correlation analysis confirmed a significant inverse relationship between habitat quality and degradation, and scenario-based simulations identified urban development and roads as the most detrimental factors. The removal of these threats led to the largest improvements in overall habitat condition. These findings provide actionable insights for biodiversity conservation planning and highlight the utility of biotope maps as a data source for ecosystem service models. The study supports the application of spatial tools for prioritizing conservation zones and formulating nature-based strategies for sustainable land management.
Keywords:
biotope map
; habitat quality
; InVEST model
; Land-use change
; Spatial analysis
; Ecosystem services
; Biodiversity conservation
; Threat factor assessment
; Gochang-gun
1. Introduction
Land-use changes driven by urbanization have severely impacted natural ecosystems, mainly by reducing habitat quality and connectivity [1]. Urban areas experience rapid biodiversity decline due to land cover change, infrastructure expansion, and industrial activity, which diminish ecosystem services [2]. Consequently, there is an urgent need to analyze habitat quality quantitatively and establish sustainable management strategies [3].
Over the past decade, tools such as the InVEST(Integrated Assessment of Ecosystem Services and Tradeoffs) model have become increasingly prominent in quanifying changes in ecosystem services due to landuse dynamics. Although initially developed for global-scale assessments, recent studies have shown that InVEST is highly adaptable to a variety of socio-ecological contexts, including peri-urban areas, coastal areas, and Mediterranean agricultural landscapes [4, 5, 6]. In particular, the habitat quality module has been effectively applied to identify spatially explicit biodiversity priorities in fragmented ecosystems (Ferreira et al., 2022) and to investigate trade-offs between urban growth and conservation values [8]. This approach can be used to identify conservation priorities by analyzing the impacts of threats such as habitat fragmentation, pollution, and human activities, and can serve as a basis for environmental policy decisions [9].
The InVEST model has emerged as a valuable tool for assessing ecosystem services. Specifically, the Habitat Quality module within InVEST enables the spatial quantification of ecosystem health based on land use, threat factors, and sensitivity indices [4]. This approach allows the identification of conservation priorities by analyzing the impact of threats such as habitat fragmentation, pollution, and human activities [9].
Biotope maps are increasingly used as foundational data for assessing habitat distribution and ecological functions. These maps visually classify habitat suitability and ecological value in spatial formats and are widely applied in urban planning and ecological restoration [10]. Recent studies have integrated biotope map data with the InVEST model to assess habitat quality comprehensively [13].
Hong et al. [11] applied InVEST and biotope data to Jeju Island to analyze habitat quality changes from 1989 to 2019, highlighting the influence of urban development and identifying priority areas for protection. Similarly, Wang et al. [1] examined urban areas in China and emphasized the importance of preserving peri-urban green spaces. These studies provide a scientific foundation for land use planning and policymaking to enhance ecosystem services [9].
Recent advances include integrating Bayesian networks with InVEST to refine threat interactions and using high-resolution spatial data and remote sensing technologies for highly accurate habitat assessments [8,13].
In this study, we aimed to quantitatively assess the habitat quality of Gochang-gun using a biotope map integrated with the InVEST model. This study focused on areas with high land-use intensity to evaluate the model’s applicability and explore the biotope map’s utility. Moreover, the spatial analysis of threat factors enables the identification of vulnerable areas and supports the formulation of policy responses.
This approach moves beyond ecological status assessments by offering quantitative data that are applicable to urban planning, environmental impact assessments, and the implementation of nature-based solutions. Our findings provide a scientific basis for enhancing the resilience of urban ecosystems and conserving biodiversity.
2. Materials and Methods
2.1. Study Area
The geographic location of the study area is shown in Figure 1. Gochang-gun is in the southwestern part of Jeollabuk-do, South Korea, bordered by inland areas to the southeast and the West Sea coast to the northwest. The region is predominantly hilly with narrow alluvial plains, and Seonunsan Provincial Park, a designated protected area, is situated in the northern part. Gochang-gun spans between 126° 26′ and 126° 46′ E and between 35° 17′ and 35° 34′ N, covering approximately 31 km east to west and 31.5 km north to south [14]. The 10-year average annual temperature is 13.4 °C(–18–37.7 °C). The average annual precipitation over the same period was 1,238.5 mm (966.3–1,671.7 mm) [15].
Five areas within Gochang-gun have been designated as protected: the Ungok Wetland, West Coast Tidal Flats, Dolmen Heritage Site, Seonunsan Provincial Park, and Dongnim Reservoir Wildlife Protection Area [14]. The Ungok Wetland is a mountainous terrain-type wetland characterized by 12 vegetation types across 88 classified units. It includes diverse wetland forms such as alluvial wetlands and spring-fed systems. Seonunsan Provincial Park is home to several natural monuments, including the Camellia Forest (Natural Monument No. 184), Jangsasong Pine Tree (No. 354), and Climbing Fig Tree (No. 368) [14].
Furthermore, the entire administrative area of Gochang-gun has been designated as a UNESCO Biosphere Reserve. To support the conservation of local ecosytems and promote their sustainable use, the region is systematically managed through a zonation scheme comprising core, buffer, and transition zones.
2.2. Study Method
This study employed the habitat quality module of the InVEST model to quantitatively evaluate the habitat conditions in Gochang-gun. Figure 2 illustrates the overall research workflow and methodology.
2.2.1. Biotope Map
Biotope maps developed under the Natural Environment Conservation Act (Act No. 2024-251, 2024.12.05) have been mandatory for local governments at the city level and above since 2018 [16]. It incorporates ecological and environmental characteristics and serves as foundational data for environmentally sustainable urban planning [17].
Originating in Germany in the 1970s, biotope mapping was designed to support the conservation of natural and semi-natural ecosystems, particularly in rural areas [18]. Urban biotope maps integrate diverse spatial data on land use and land cover, habitat disturbance, and vegetation structure. As demonstrated in Fischer et al. [19], such maps help assess both ecological and biological attributes — including habitat types, species composition, and green infrastructure — to support conservation planning in complex urban environments.
Most InVEST-based studies rely on traditional land-use/land-cover (LULC) datasets such as CORINE or MODIS for input layers [20,21]. In contrast, this study utilizes a biotope map—a fine-resolution ecological dataset mandated under Korea’s Natural Environment Conservation Act—which integrates land use, species composition, vegetation, and disturbance indicators. This approach aligns with European efforts to refine spatial conservation models using high-resolution ecological units [22], offering improved sensitivity for habitat quality modeling at a local-regional scale.
2.2.2. InVEST Model
The InVEST model developed by Sharma et al. [23] was designed to assess ecosystem services and quantify the effects of human activities on habitats [24]. The key inputs include land-use/land-cover (LULC) data, threat factors, weights, maximum influence distances, and habitat sensitivity matrixes [19]. In this study, the LULC input was replaced with a biotope map.
The model calculates habitat degradation (Dxj) and quality (Qxj) at the pixel level, which is useful for prioritizing conservation and identifying biodiversity hotspots.
Key model equations define degradation (Dxj) and habitat quality (Qxj) using inputs such as the threat factor weights (Wi), raster values (Rix), biotope accessibility (βj), sensitivity (Sji), distance decay functions, and a habitat presence indicator (Hj).
The habitat quality formula defines Qxj as the habitat quality at location x, where Hj is a binary indicator denoting whether the biotope type is considered a habitat (1) or not (0), and k is a scaling constant (default value: 0.5).
2.2.3. Assessment of Threat Sensitivity and Model Input Validation
We conducted three supplementary analyses to enhance the policy relevance of the habitat quality model.
- Average sensitivity across threat factors was estimated to identify the most influential factors in habitat degradation.
- A heatmap visualizing sensitivity by habitat type was developed to detect spatial vulnerabilities.
- Scenario-based threat-removal simulations were used to compare habitat quality changes and derive conservation priorities.
3. Results
3.1. Spatial Analysis of Habitat Quality and Threat Levels
The spatial distribution of habitat quality across Gochang-gun is shown in Figure 3(a). Areas such as the Gochang-Buan tidal flat, Dongnim Reservoir, and Seonunsan Provincial Park had high habitat quality scores (> 0.8). In contrast, the habitat quality of agricultural land and urban areas near Gochang-eup was low, often scoring< 0.2.
The threat level distribution shown in Figure 3(b) indicates relatively high values (> 0.6) in areas characterized by roads and agricultural zones. These locations were identified as the major contributors to habitat degradation in this region.
3.2. Quantitative Analysis
The statistical outcomes of habitat quality and threat levels were visualized. The Gochang Biosphere Reserve was categorized into core, buffer, and transitional zones.
Habitat quality was highest in the core zone and relatively lower in the transitional zone. In particular, the median habitat quality in the core zone exceeded 0.6, indicating a better conservation status than in the other zones (Figure 4).
Histogram analysis revealed that most habitat quality values ranged from 0.2 to 0.4. A multimodal pattern was observed in the habitat quality transition zone, where low-quality habitats tended to be concentrated (Figure 5).
These findings suggest that habitat conditions vary markedly with land-use type and highlight the need to establish tailored conservation strategies for each land-use category.
3.3. Correlation Analysis Between Habitat Quality and Degradation
Correlation analysis examined the relationship between habitat quality and degradation (Figure 6). Linear regression revealed an R² value of 0.2025, with a slope of 0.6887, indicating a statistically significant negative relationship. This suggests that increasing threat levels will lead to a notable decline in habitat quality. In particular, areas with low habitat quality experienced sharp increases in degradation, emphasizing the need for prioritized management in high-risk areas.
3.4. Diagnosis of Threat Factors for Habitat Protection
We conducted a detailed analysis of threat sensitivities and validated the model inputs with a view to establishing effective conservation strategies. The average sensitivity of each habitat type to individual threats is shown in Figure 7.
The analysis revealed that, overall, habitats were most sensitive to urban areas and roads, indicating their widespread and severe impacts on various habitat types. Conversely, average sensitivity to grasslands was the lowest (approximately 0.06), suggesting minimal influence.
The matrix of habitat-type sensitivity to threat factors is shown in Figure 8, where the degree of sensitivity is expressed on a scale from 0 to 1. Higher values indicate greater vulnerability. Most habitat types showed consistently high sensitivity to urban and road-related threats, highlighting the impact of urbanization and infrastructure expansion on ecological degradation.
Finally, the impact of removing individual threats on overall sensitivity is shown in Figure 9. The removal of roads resulted in the most significant reduction in sensitivity, followed by the removal of urban areas. These findings suggest that these two factors are the most detrimental and should be prioritized in habitat management strategies. Interestingly, grassland removal slightly increased the sensitivity of some habitat types, indicating positive ecological interactions.
4. Discussion
Patterns of habitat degradation driven by urban expansion and road infrastructure have been widely documented across global landscapes. In Mediterranean regions, agricultural intensification and peri-urban sprawl have been identified as key drivers of habitat loss [26], while in the northeastern United States, biodiversity declines have been closely linked to the expansion of linear infrastructure [27]. Urban green infrastructure plays a critical role in mitigating such threats, as highlighted in recent international studies [28].
This study integrates biotope map data with the InVEST habitat quality module to assess spatially explicit patterns of ecological degradation in Gochang-gun. The analysis reveals that forested areas in the north and center of the region retain relatively high habitat quality, likely due to the influence of institutional designations such as provincial parks and biosphere reserves. In contrast, coastal and intensively cultivated areas show marked signs of ecological degradation, reinforcing the need for localized conservation measures [13].
Key anthropogenic threats identified include roads and urban development. Scenario-based threat removal analysis demonstrated that these two drivers had the most significant impact on reducing ecological sensitivity, and most habitat types exhibited high vulnerability to them. These results corroborate broader findings that urbanization and infrastructure growth are critical stressors on biodiversity [4,29].
Furthermore, the study emphasizes the need for conservation strategies that are tailored to the quality and sensitivity levels of specific zones. Core habitats require preservation-based approaches, while transition zones characterized by low quality and high sensitivity demand active restoration. Such zonation improves the strategic allocation of limited conservation resources [30].
Finally, discrepancies observed between the InVEST model’s input threat weights and actual sensitivity outputs highlight the necessity of revisiting model parameters. Enhancing model reliability will require rigorous field-based validation, especially in refining sensitivity matrices and spatial datasets. These insights contribute to the evolving international best practices that advocate for integrated spatial modeling tools in support of ecosystem-based policy design [19,25].
5. Conclusions
This study provides a spatially grounded evaluation of habitat quality in Gochang-gun by combining biotope map data with the InVEST Habitat Quality model. The analysis identified clear spatial disparities, with protected forested regions maintaining high ecological integrity, while urbanized and agricultural zones exhibited notable habitat degradation. Roads and urban land use were found to be the most impactful threats, with their removal significantly improving habitat conditions. These insights underscore the need for threat-specific management strategies and highlight the value of using biotope maps in ecological modeling and spatial planning. Considering that the entire administrative area of Gochang-gun is designated as a UNESCO Biosphere Reserve, conservation strategies must align with the core, buffer, and transition zone framework. Particularly, transition areas with lower habitat quality require active restoration and nature-based solutions. Overall, this study demonstrates the utility of integrative modeling approaches for ecosystem assessment and offers a practical foundation for enhancing biodiversity conservation at the regional scale.
Author Contributions
Conceptualization, D. U.K.; methodology, D. U.K.; software, D. U.K.; validation, D. U.K.; formal analysis, D. U.K.; investigation, D. U.K.; data curation, D. U.K.; writing—original draft preparation, D. U.K.; writing—review and editing, D. U.K. and H. Y. Y.; visualization, H. Y. Y.; supervision, D. U.K.; project administration, D. U.K. All authors have read and agreed to the published version of the manuscript.
Data Availability Statement
The original contributions presented in this study are included in the article. Further inquiries can be directed to the corresponding author.
Conflicts of Interest
Data is contained within the article.
Abbreviations
| DT | Degradation transition zone |
| DB | Degradation buffer zone |
| DC | Degradation core zone |
| HT | Habitat quality transition zone |
| HB | Habitat quality buffer zone |
| HC | Habitat quality core zone |
| InVEST | Integrated valuation of ecosystem services and tradeoffs |
| LULC | Land use/land cover |
References
- Wang, H.; Tang, L.; Qiu, Q.; Chen, H. Assessing the Impacts of Urban Expansion on Habitat Quality by Combining the Concepts of Land Use, Landscape, and Habitat in Two Urban Agglomerations in China. Sustainability 2020, 12, 4346. [Google Scholar] [CrossRef]
- You, G.; Chen, T.; Shen, P.; Hu, Y. Designing an Ecological Network in Yichang Central City in China Based on Habitat Quality Assessment. Sustainability 2023, 15, 8313. [Google Scholar] [CrossRef]
- Hu, Y.; Xu, E.; Dong, N.; Tian, G.; Kim, G.; Song, P.; Ge, S.; Liu, S. Driving Mechanism of Habitat Quality at Different Grid-Scales in a Metropolitan City. Forests 2022, 13, 248. [Google Scholar] [CrossRef]
- La Rosa, D.; Spyra, M.; Inostroza, L. Indicators of Ecosystem Services for Urban Planning: A Review. Environ. Sci. Policy 2014, 42, 98–111. [Google Scholar] [CrossRef]
- Albaladejo-García, J.A.; Martínez-Paz, J.M. Substitution Effects and Spatial Factors in the Social Demand for Landscape Aesthetics in Agroecosystems. Landsc. Urban Plan 2025, 239, 104013. [Google Scholar] [CrossRef]
- Cervelli, E.; Pindozzi, S.; Allevato, E.; Saulino, L. Landscape Planning Integrated Approaches to Support Post-Wildfire Restoration in Natural Protected Areas: The Vesuvius National Park Case Study. Land 2022, 11, 1024. [Google Scholar] [CrossRef]
- Broquet, M.; Campos, F.S.; Cabral, P.; David, J. Habitat Quality on the Edge of Anthropogenic Pressures: Predicting the Impact of Land Use Changes in the Brazilian Upper Paraguay River Basin. J. Clean. Prod. 2024, 447, 140017. [Google Scholar] [CrossRef]
- Baró, F.; Gómez-Baggethun, E.; Haase, D. Ecosystem Service Bundles along the Urban-Rural Gradient: Insights for Landscape Planning and Management. Landsc. Urban Plan. 2017, 157, 117–129. [Google Scholar] [CrossRef]
- Zhang, W.; Lu, X.; Xie, Z.; Ma, J.; Zang, J. Study on the Spatiotemporal Evolution of Habitat Quality in Highly Urbanized Areas Based on Bayesian Networks: A Case Study from Shenzhen, China. Sustainability 2024, 16, 10993. [Google Scholar] [CrossRef]
- Kim, T.; Kim, G. Biotope Map Creation Method and Utilization Plan for Eco-Friendly Urban Development. Land 2024, 13, 699. [Google Scholar] [CrossRef]
- Hong, H.-J.; Kim, C.-K.; Lee, H.-W.; Lee, W.-K. Conservation, Restoration, and Sustainable Use of Biodiversity Based on Habitat Quality Monitoring: A Case Study on Jeju Island, South Korea (1989–2019). Land 2021, 10, 774. [Google Scholar] [CrossRef]
- Qi, Y.; Hu, Y. Spatiotemporal variation and driving factors analysis of habitat quality: A Case study in Harbin, China. Land 2024, 13, 67. [Google Scholar] [CrossRef]
- Hinsch, M.; Groß, J.; Burkhard, B. The influence of model choice and input data on pollinator habitat suitability in the Hannover region. PLoS One 2024, 19, e0305731. [Google Scholar] [CrossRef] [PubMed]
- Kim, D.U.; Kim, J.C.; You, C.H.; Oh, W. Occurrences status of biota in Gochang-gun, South Korea. GEODATA 2024, 6, 123–143. [Google Scholar] [CrossRef]
- National Institute of Ecology. Establishment of Gochang-gun biotope map, 2022. Available online: https://ecolibrary.me.go.kr/nie/#/search/detail/5880399 (accessed on 21 Oct 2023).
- Ministry of the Environment. Guidelines for the Development of Biotope Map, 2021.
- Il, L.K. Lee Sung Joo, Tuvshinjargal Namuun, Lee Eun Sun, Lee Gwan Gyu, Jeon Seong Woo. Study on Heat Vulnerability Assessment Using Biotope Map (A Case Study of Suwon, Korea). Journal of Climate Change Research, 2020, 11, 6–1. [Google Scholar]
- Sukopp, H.; Weiler, S. Biotope mapping and nature conservation strategies in urban areas of the Federal Republic of Germany. Landsc Urban Plan 1988, 15, 39–58. [Google Scholar] [CrossRef]
- Fischer, L.K.; von der Lippe, M.; Kowarik, I. Urban Land Use Types Contribute to Grassland Conservation: The Example of Berlin. Urban For. Urban Green. 2013, 12, 428–437. [Google Scholar] [CrossRef]
- Martínez-Harms, M.J.; Bryan, B.A.; Balvanera, P. Scenarios for Land Use and Ecosystem Services in the Southern Andes. Ecosyst. Serv. 2016, 20, 63–73. [Google Scholar] [CrossRef]
- Jamil, R.; Julian, J.P.; Steele, M.K. Vegetation Structure and Distribution Across Scales in a Large Metropolitan Area: Case Study of Austin MSA, Texas, USA. Geographies 2025, 5, 11. [Google Scholar] [CrossRef]
- Proutsos, N.D.; Solomou, A.D. Urban Green Spaces as an Effective Tool to Regulate Urban Climate and Biodiversity: Current Research and Challenges. Land 2025, 14, 497. [Google Scholar] [CrossRef]
- Mondal, I.; Naskar, P.K.; Alsulamy, S.; Jose, F. Habitat Quality and Degradation Change Analysis for the Sundarbans Mangrove Forest Using InVEST Habitat Quality Model and Machine Learning. Environ. Dev. Sustain 2024. [Google Scholar] [CrossRef]
- Mukhopadhyay, A.; Hati, J.P.; Acharyya, R.; Pal, I.; Tuladhar, N.; Habel, M. Global trends in using the InVEST model suite and related research: A systematic review. Ecohydrol Hydrobiol 2024. [CrossRef]
- Veisi Nabikandi, B.; Rastkhadiv, A.; Feizizadeh, B.; Gharibi, S.; Gomes, E. A scenario-based framework for evaluating the effectiveness of nature-based solutions in enhancing habitat quality. GeoJournal 2025, 90. [Google Scholar] [CrossRef]
- Guerra, C.A.; Metzger, M.J.; Maes, J.; Pinto-Correia, T. Policy Impacts on Regulating Ecosystem Services: Looking at the Implications of 60 Years of Landscape Change on Soil Erosion Prevention in a Mediterranean Silvo-Pastoral System. Landsc. Ecol. 2016, 31, 1457–1475. [Google Scholar] [CrossRef]
- Coleman, D.J.; Gittman, R.K.; Landry, C.E. Quantifying the Impacts of Future Shoreline Modification on Biodiversity in a Case Study of Coastal Georgia, United States. Conserv. Biol, 2025; Early View. [Google Scholar] [CrossRef]
- Lourdes, K.T.; Hamel, P.; Gibbins, C.N.; Sanusi, R. Planning for Green Infrastructure Using Multiple Urban Ecosystem Service Models and Multicriteria Analysis. Landsc. Urban Plan. 2022, 221, 104517. [Google Scholar] [CrossRef]
- Sharma, R.; Rimal, B.; Stork, N.; Baral, H.; Dhakal, M. Spatial Assessment of the Potential Impact of Infrastructure Development on Biodiversity Conservation in Lowland Nepal. ISPRS Int. J. Geo-Inf. 2018, 7, 365. [Google Scholar] [CrossRef]
- Xu, C.; Jing, Y.; Zhang, Y.; Liu, Y.; Yin, W.; Zhao, S. Identification of Ecological Security Pattern and Ecological Restoration Zoning Strategy in the Shandong Section of the Beijing-Hangzhou Grand Canal. Land 2025, 14, 439. [Google Scholar] [CrossRef]
Figure 1.
Location of the study area, Gochang-gun, in South Korea.
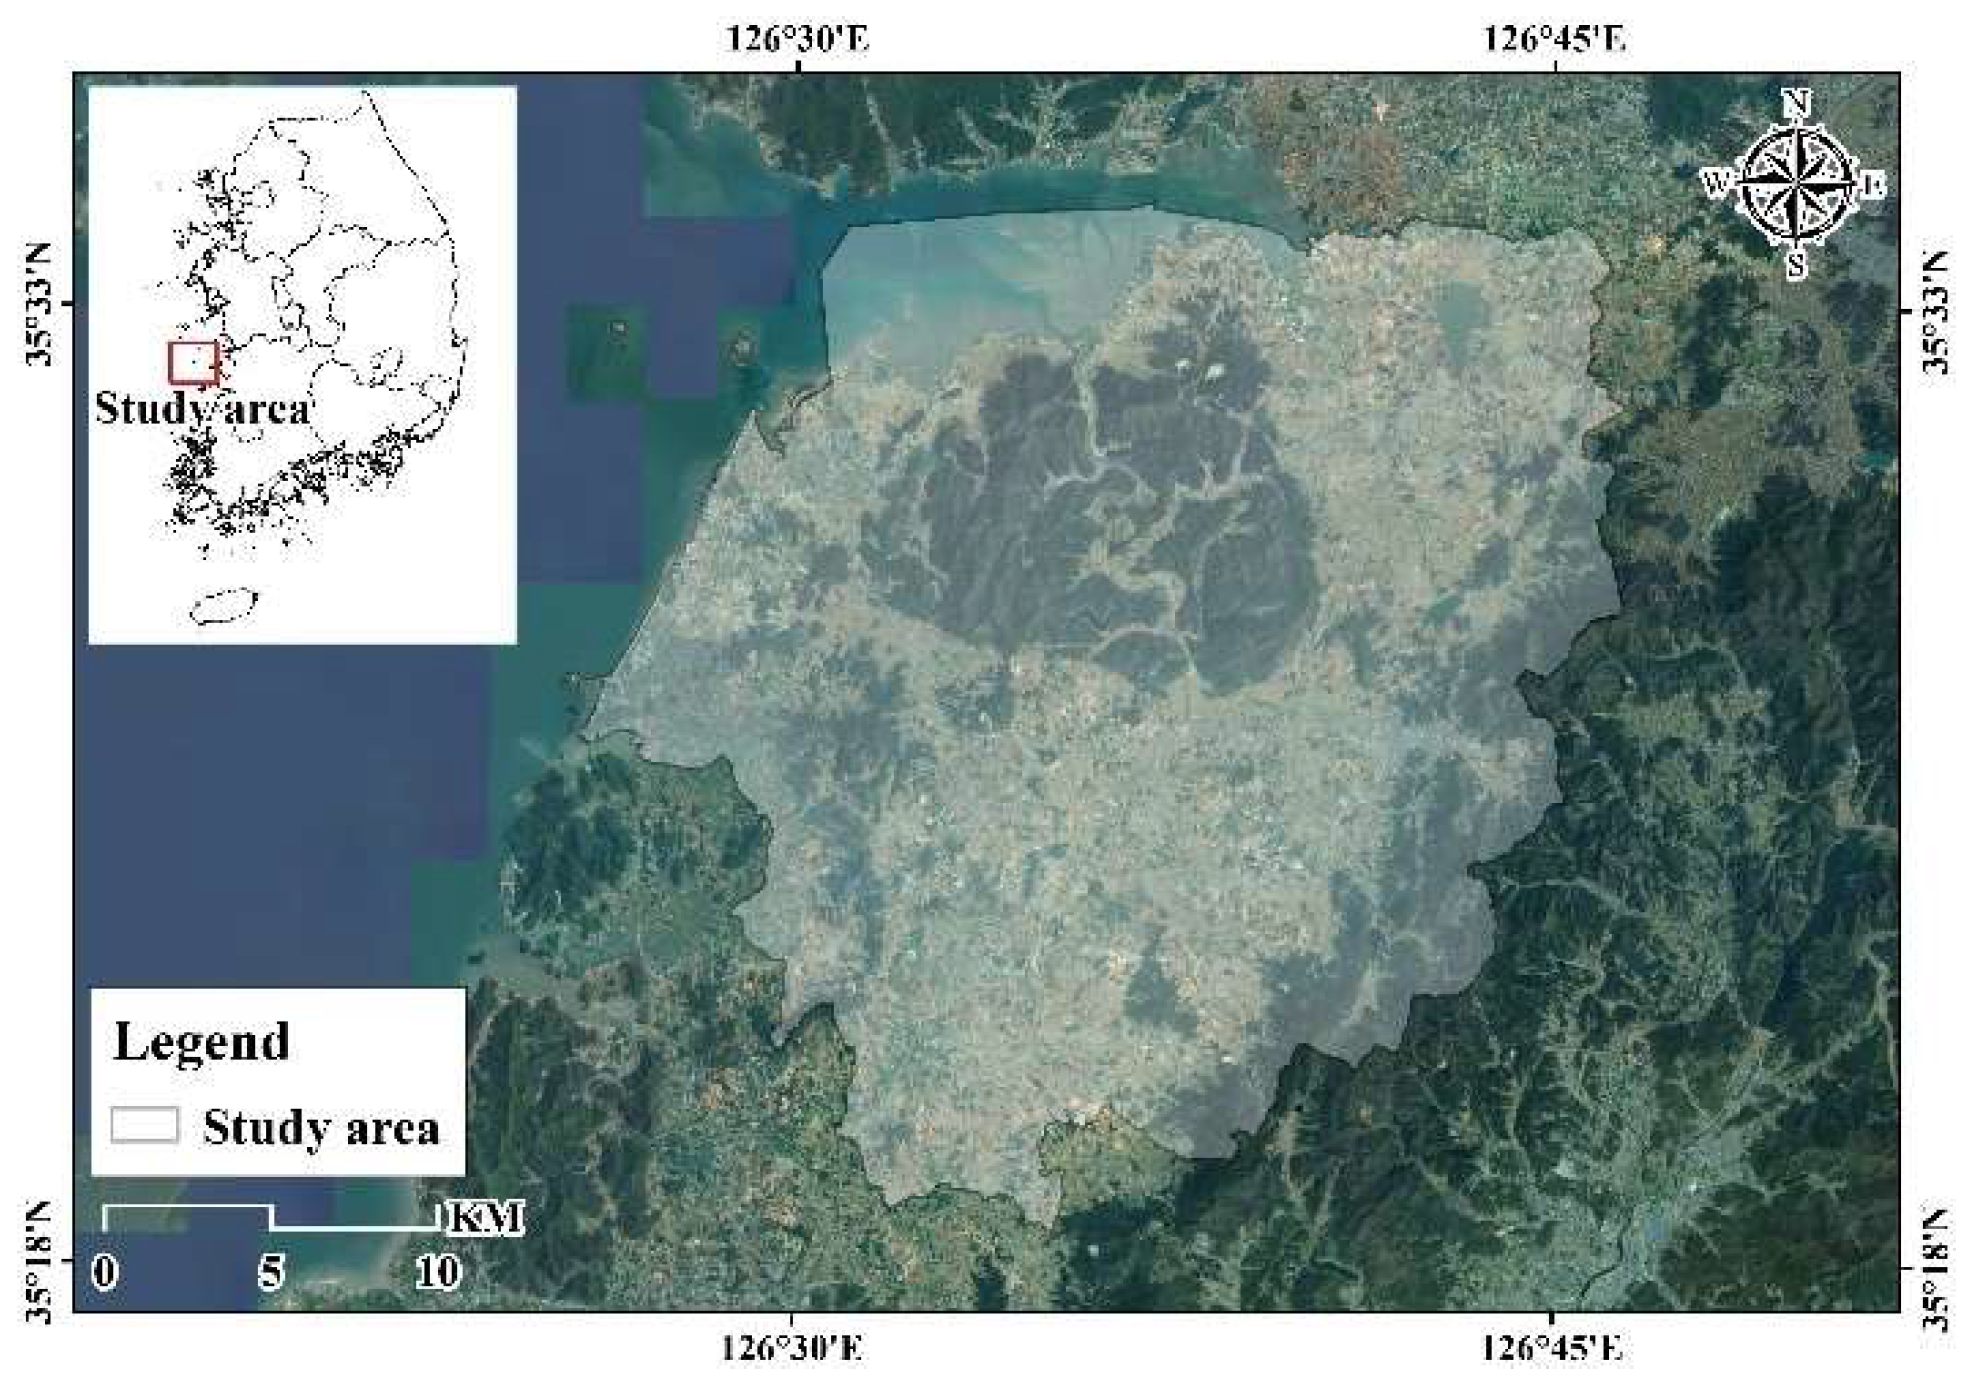
Figure 2.
Workflow for habitat quality assessment and extended analysis using the InVEST model.
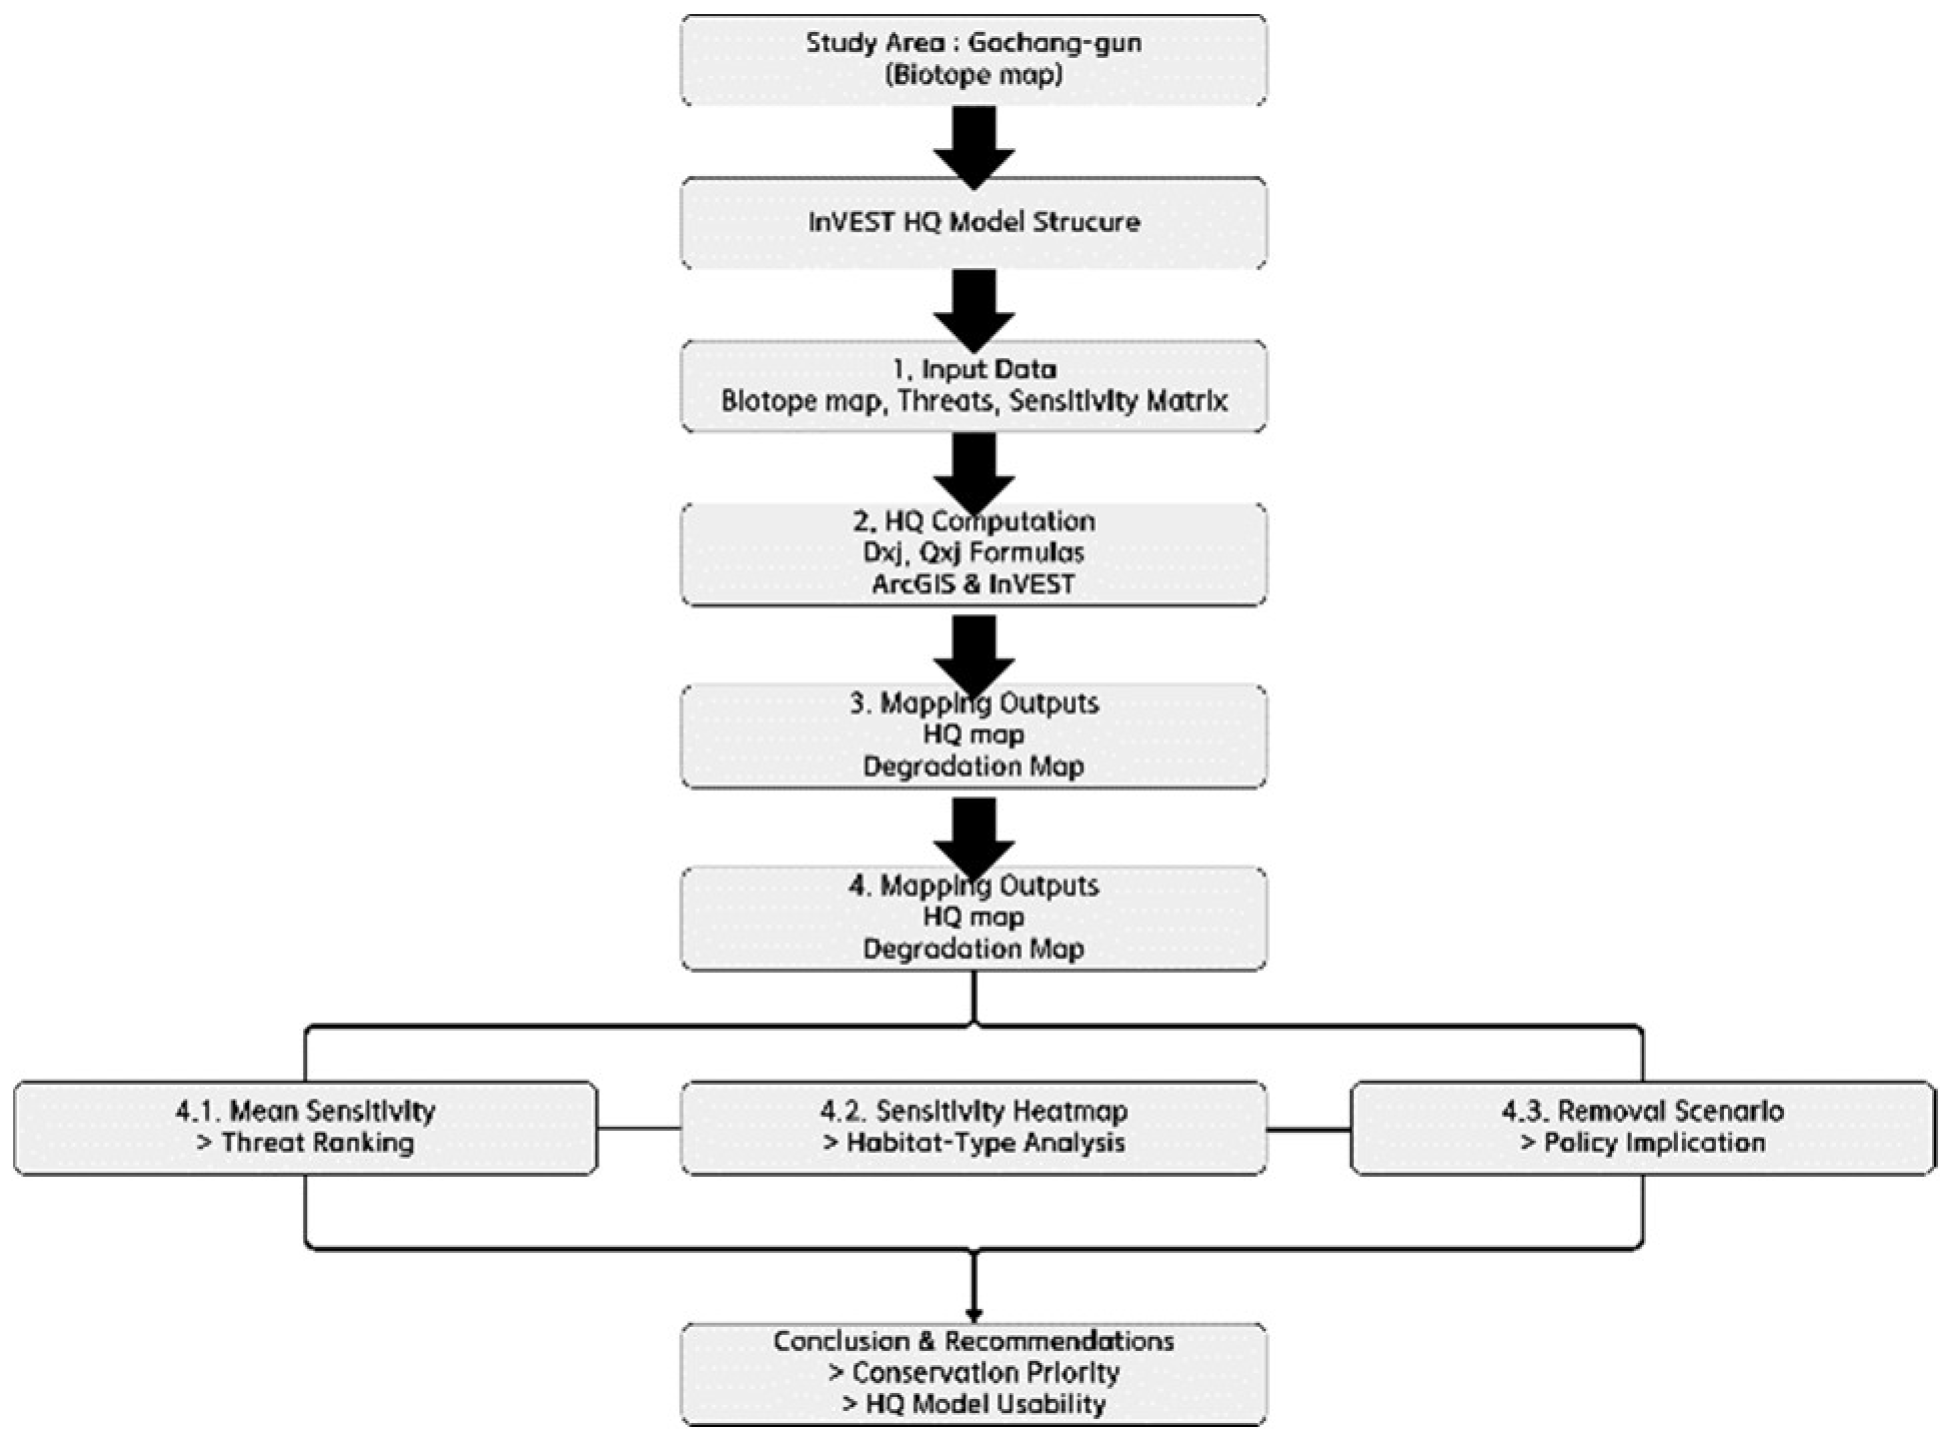
Figure 3.
Spatial patterns of habitat quality and degradation in Gochang-gun. (a) High habitat quality values are concentrated in forested and protected areas. (b) Degradation levels are elevated near roads and agricultural zones.
Figure 3.
Spatial patterns of habitat quality and degradation in Gochang-gun. (a) High habitat quality values are concentrated in forested and protected areas. (b) Degradation levels are elevated near roads and agricultural zones.
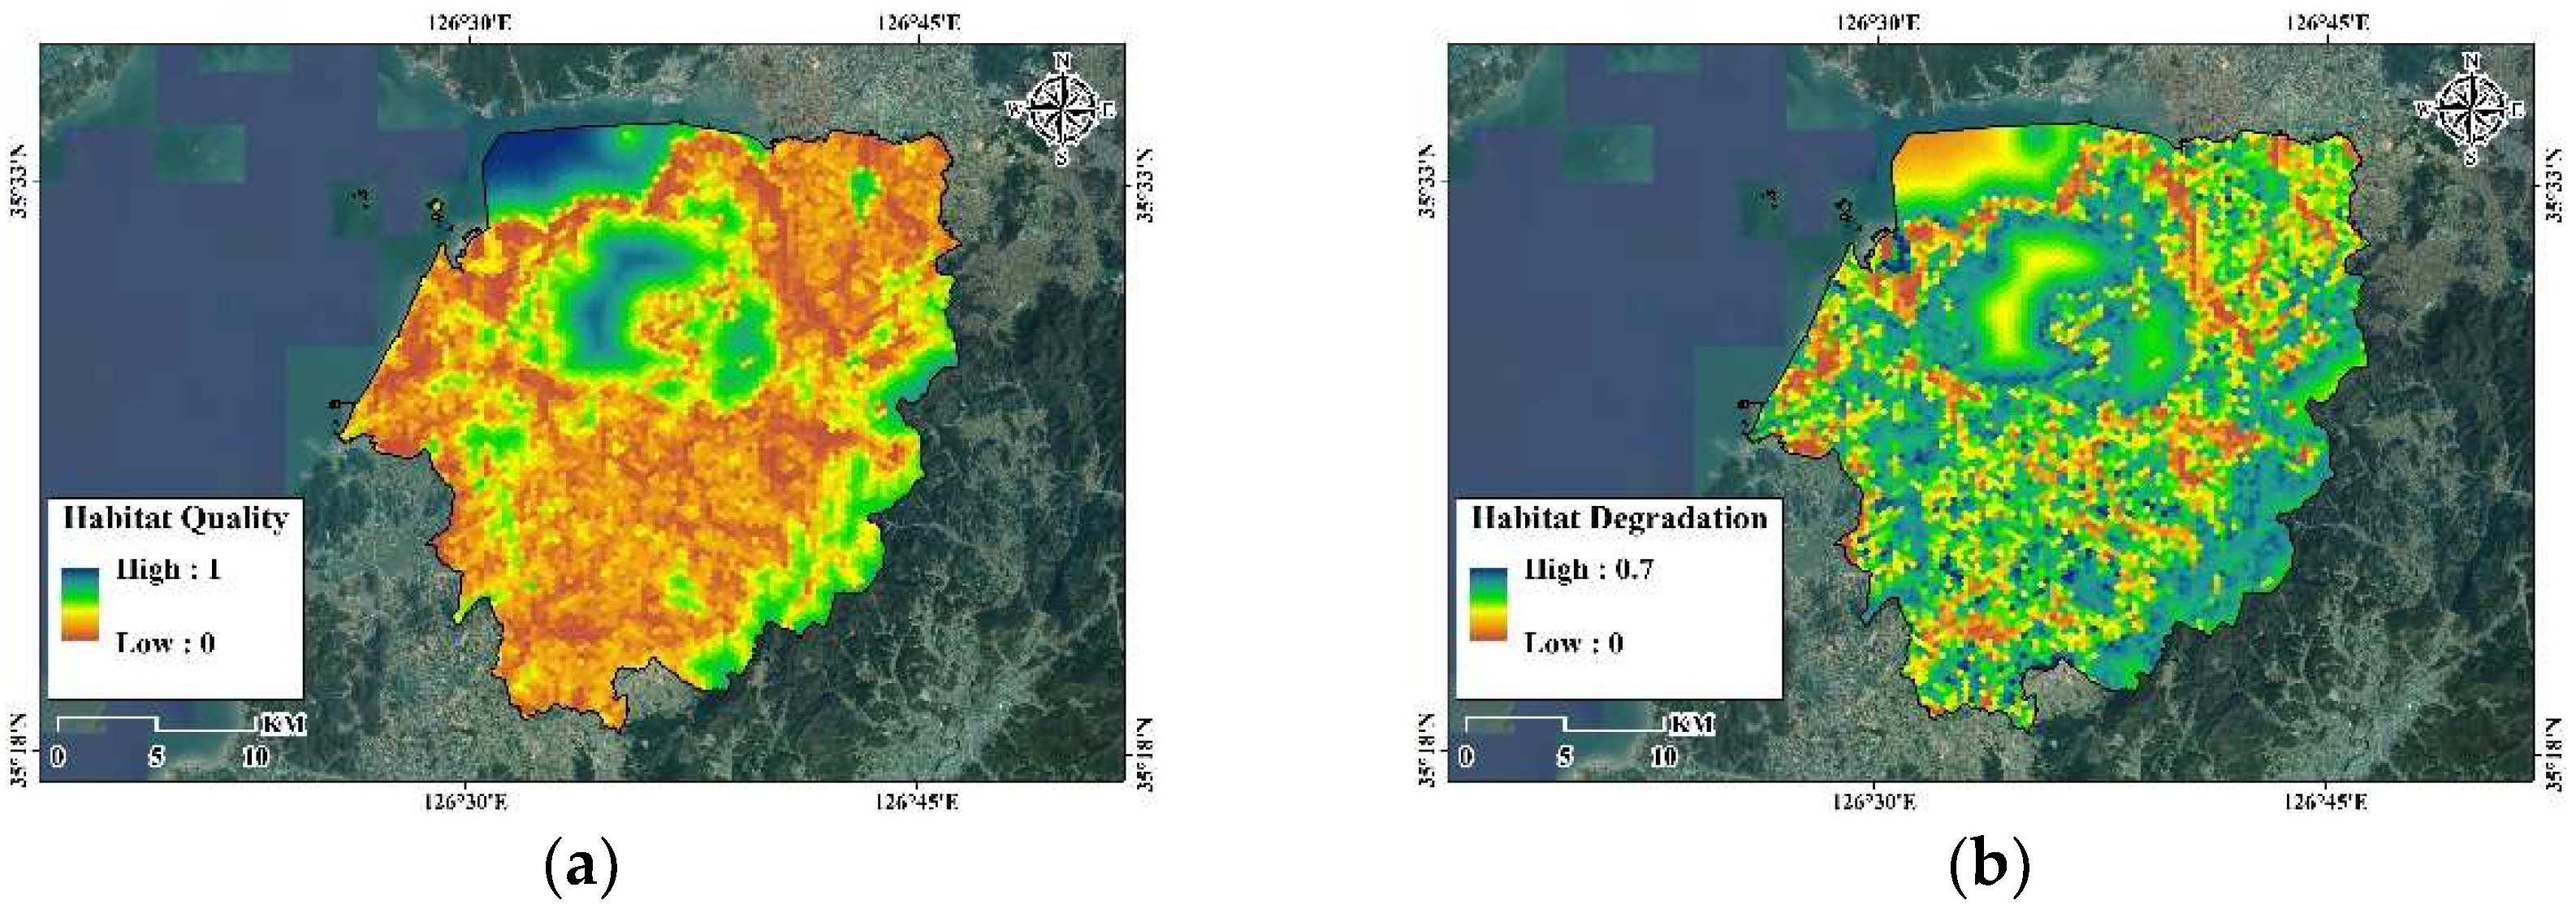
Figure 4.
Boxplots of variable distributions in habitat quality and degradation within the core, buffer, and transitional zones of the Gochang Biosphere Reserve.
Figure 4.
Boxplots of variable distributions in habitat quality and degradation within the core, buffer, and transitional zones of the Gochang Biosphere Reserve.
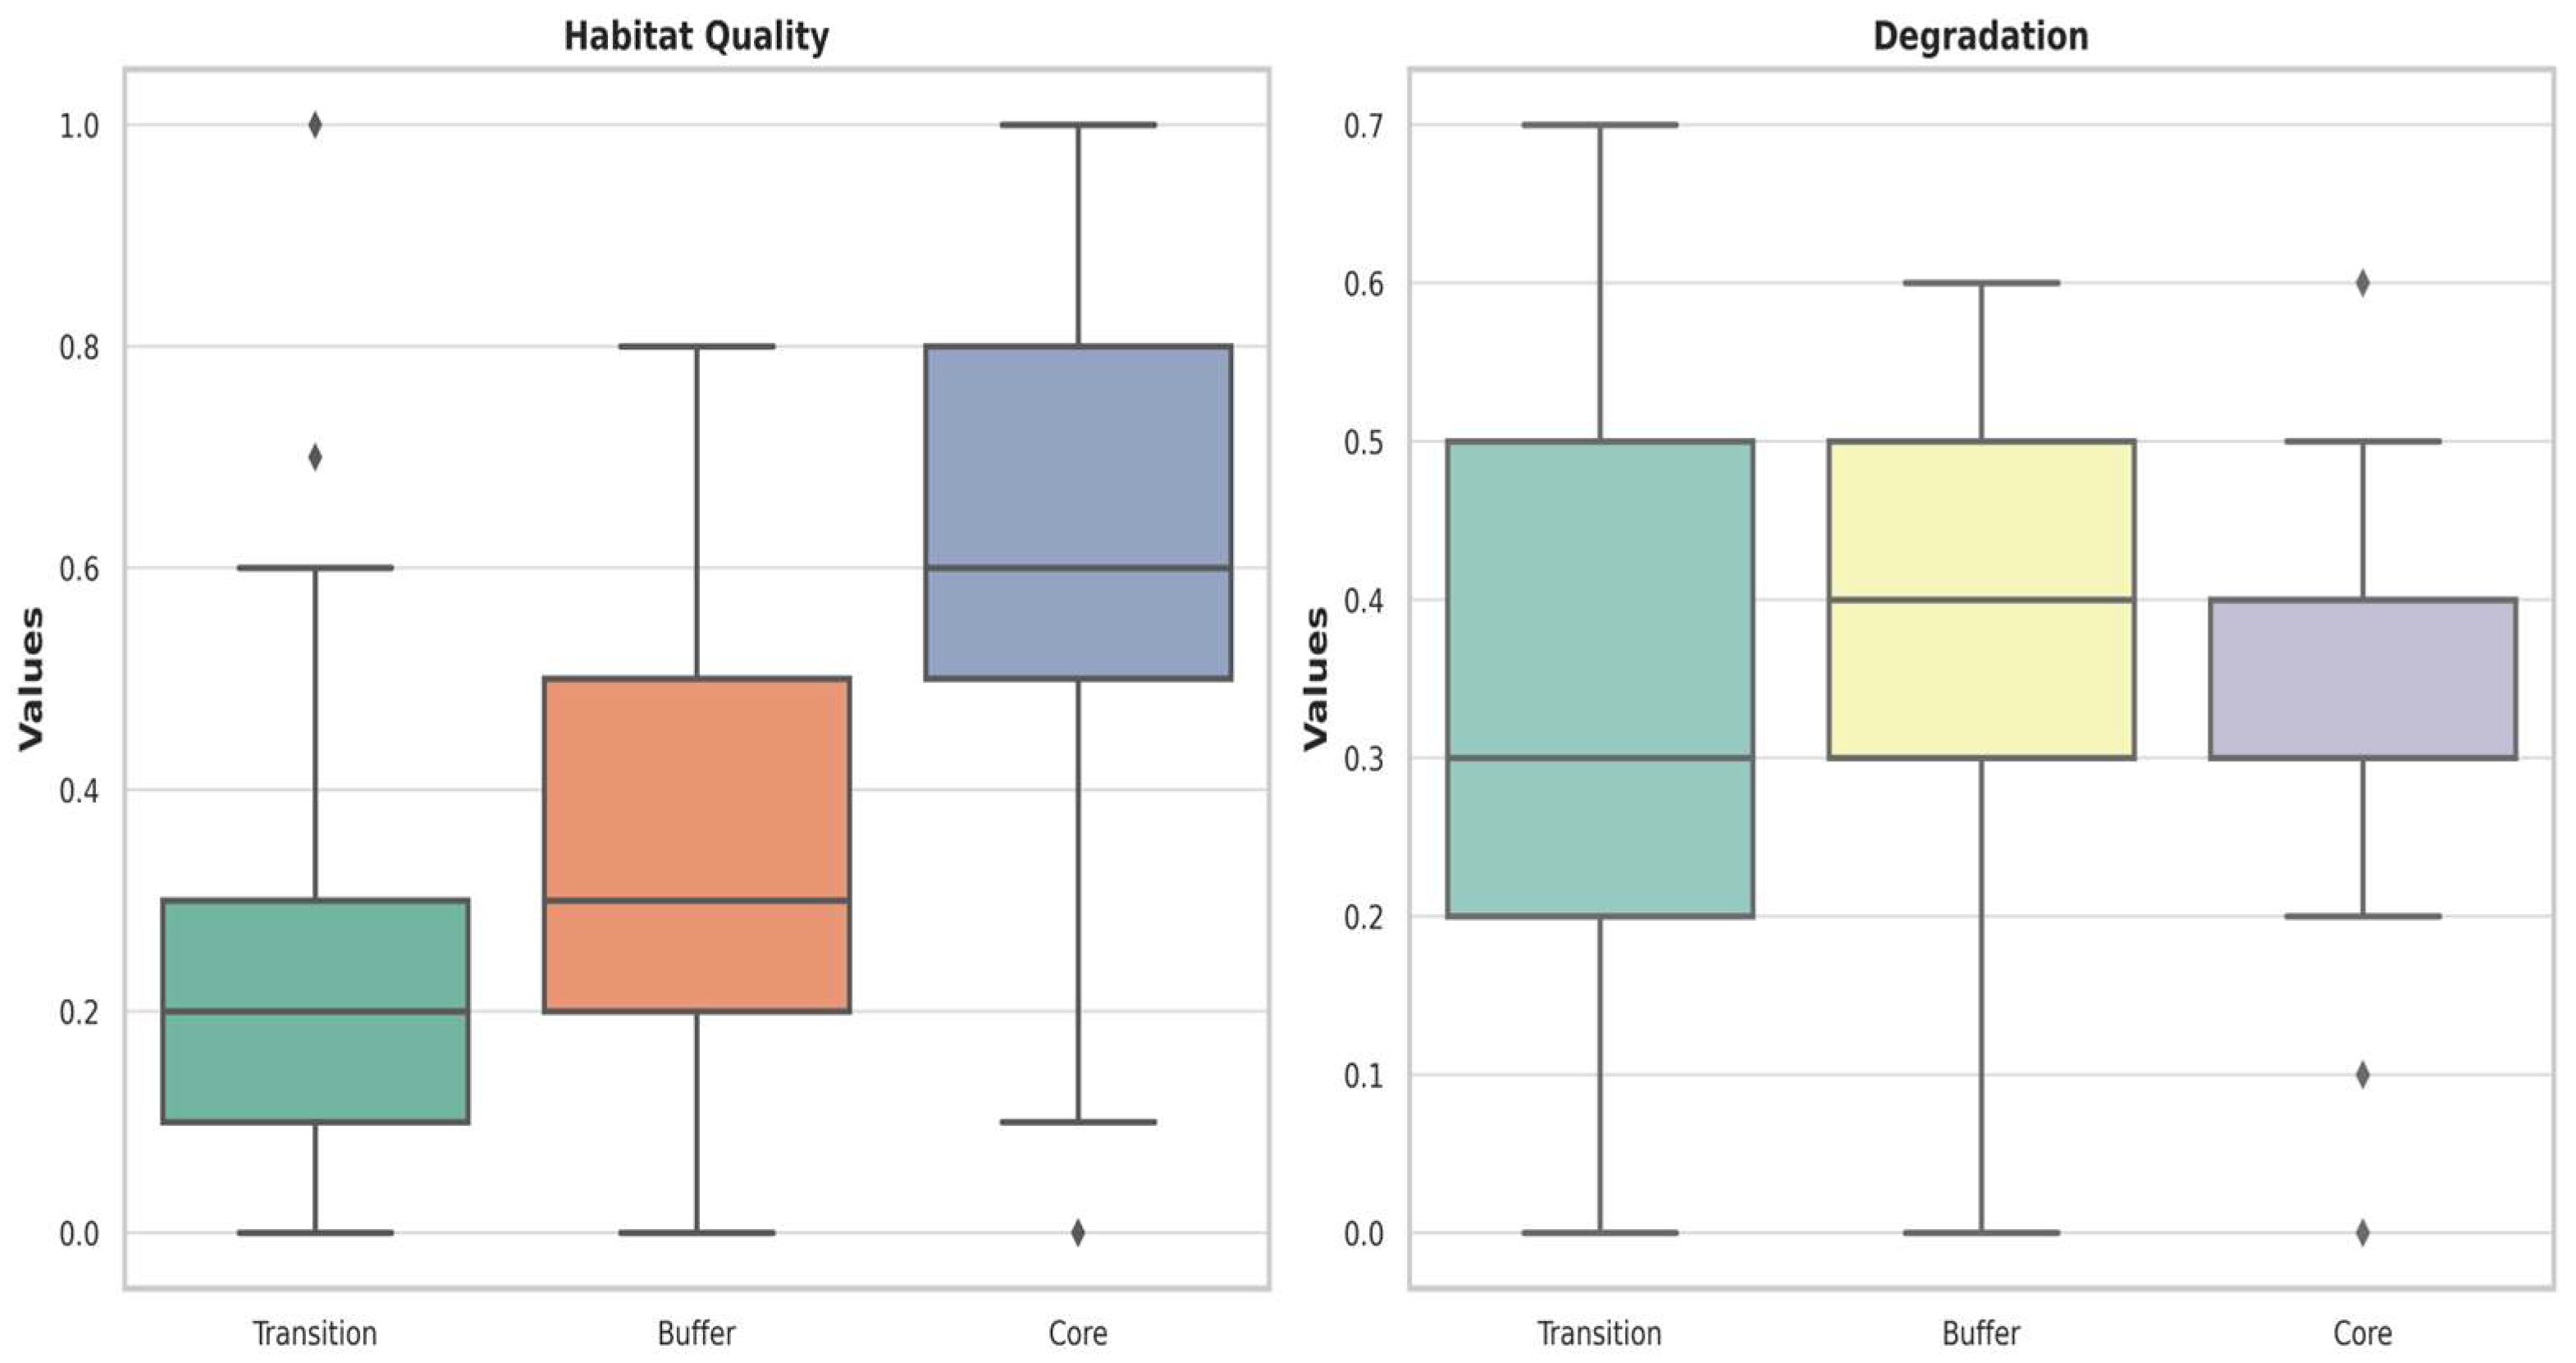
Figure 5.
Frequency distribution of habitat degradation and quality values within the core, buffer, and transitional zones of the Gochang Biosphere Reserve. DT, DB, and DC, degradation transition buffer and core zones, respectively; HT, HB, and HC, habitat quality transition, buffer, and core zones, respectively.
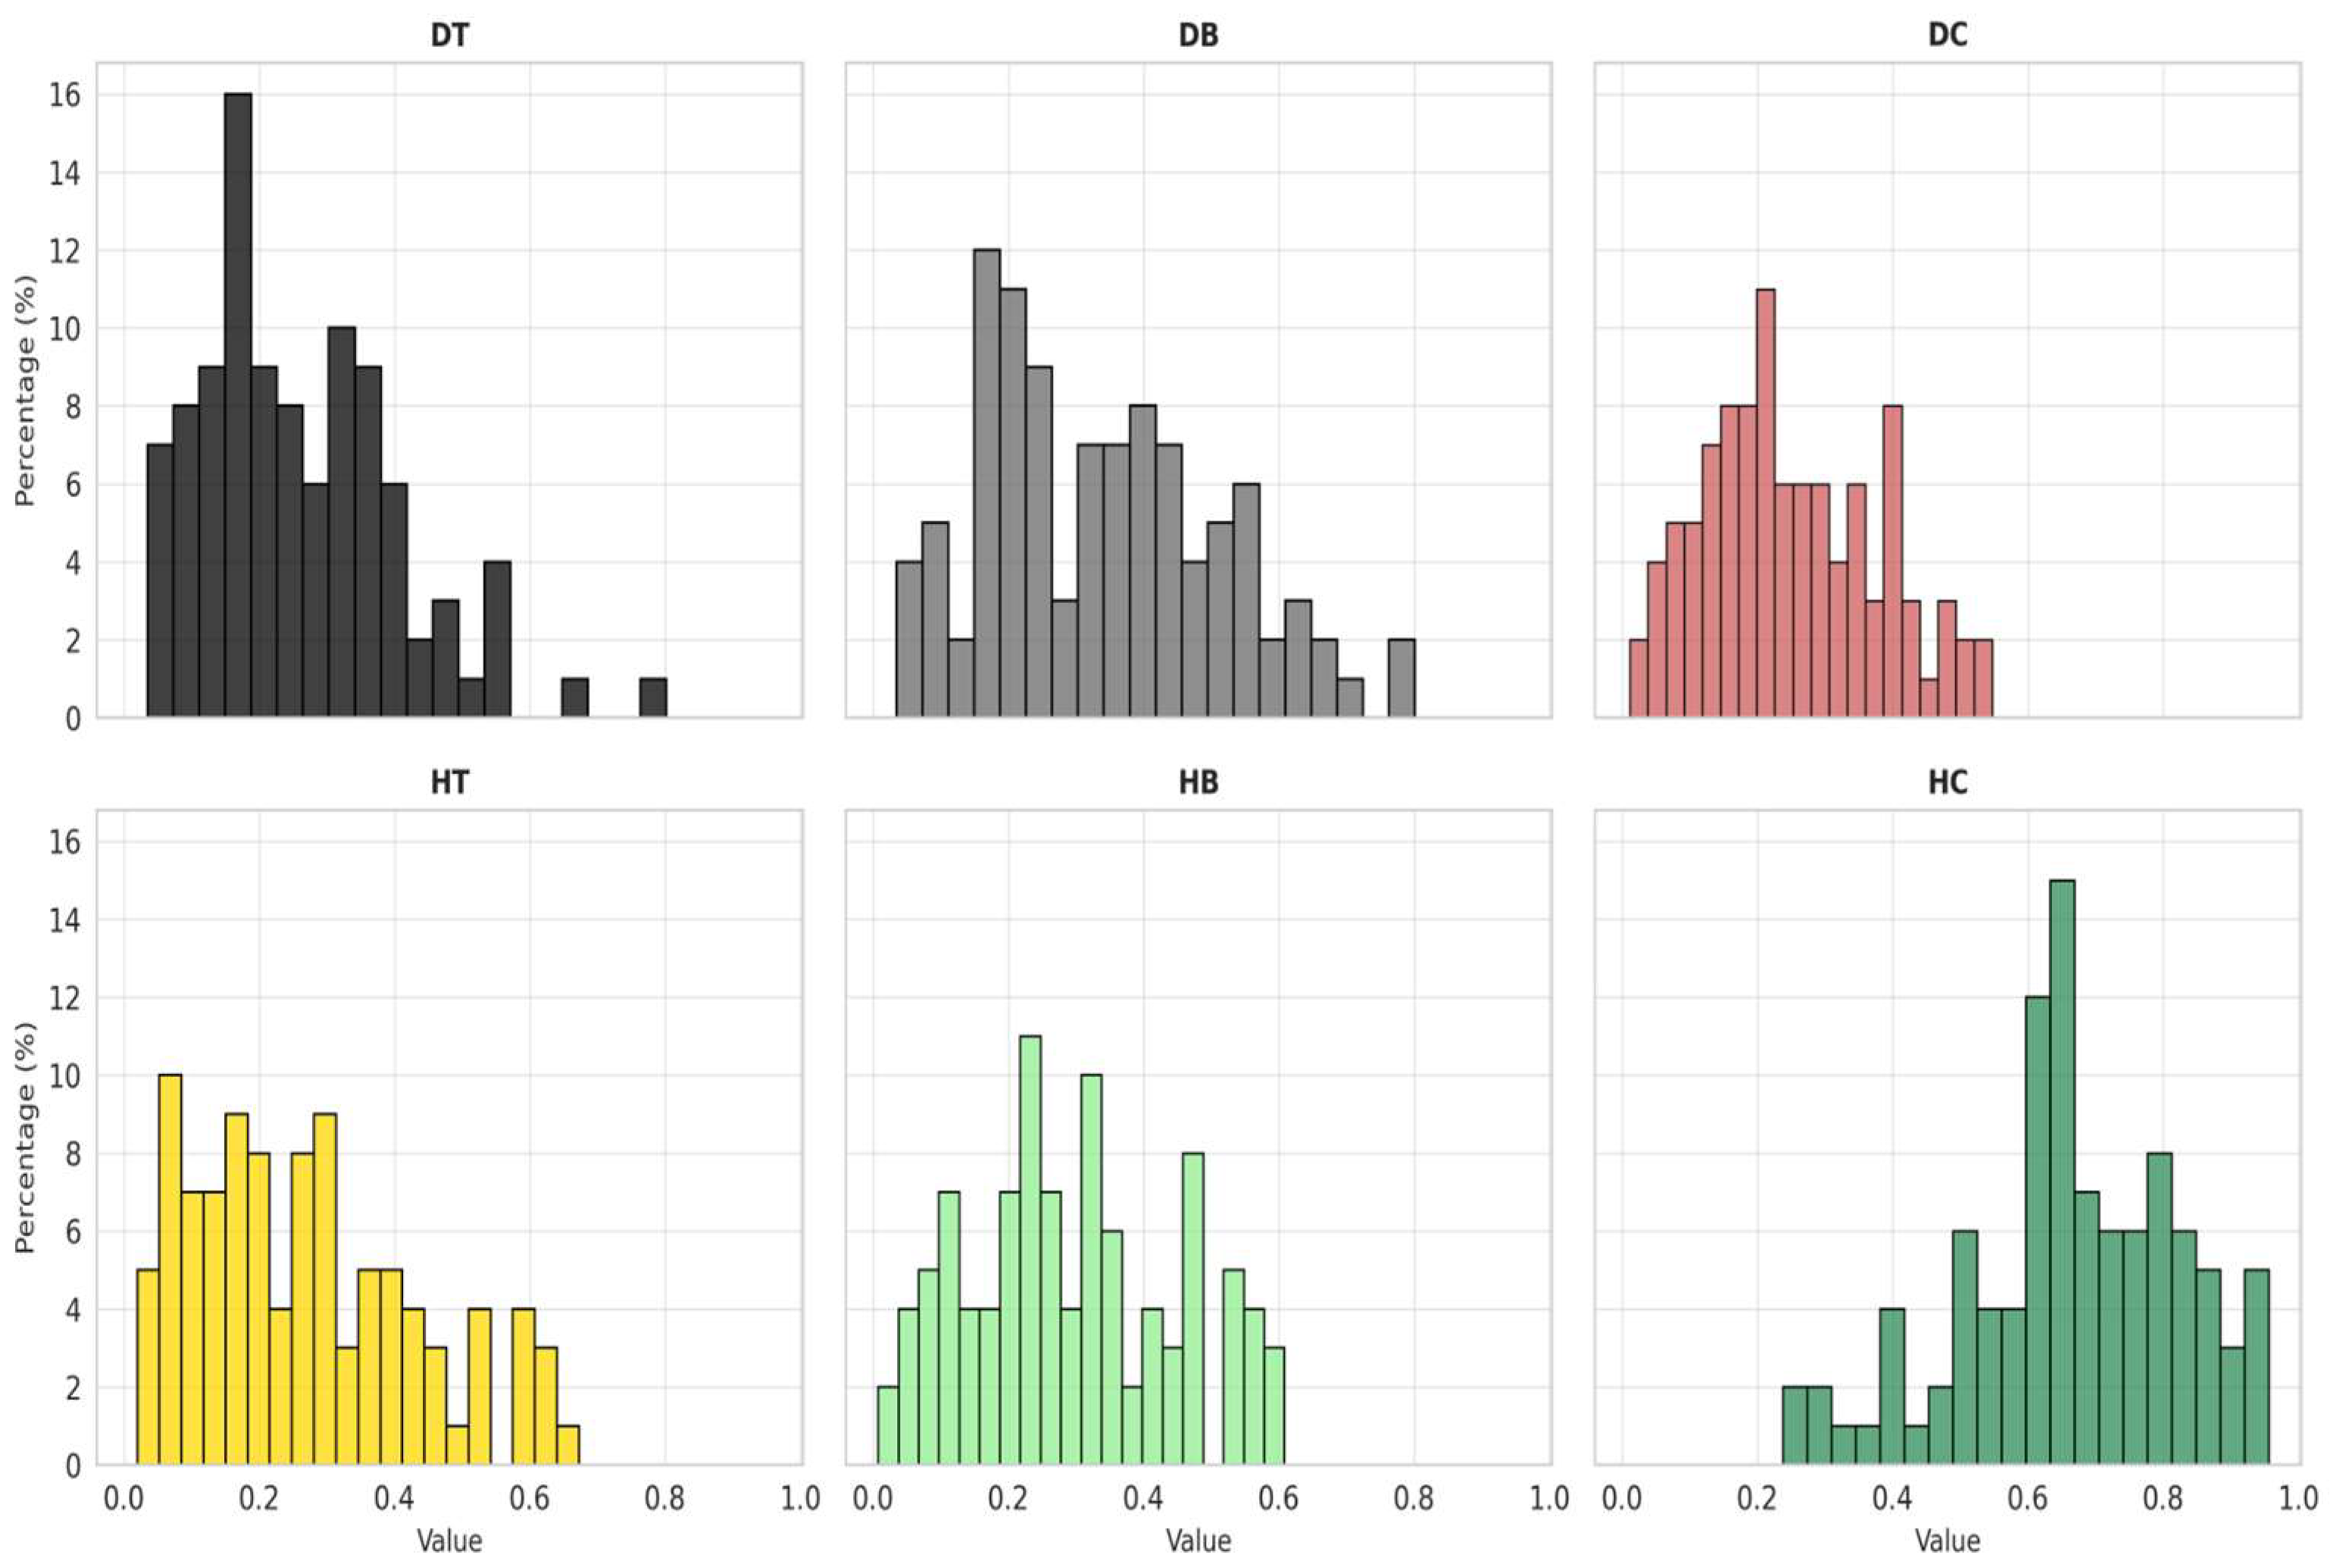
Figure 6.
Correlation between habitat quality and habitat degradation.
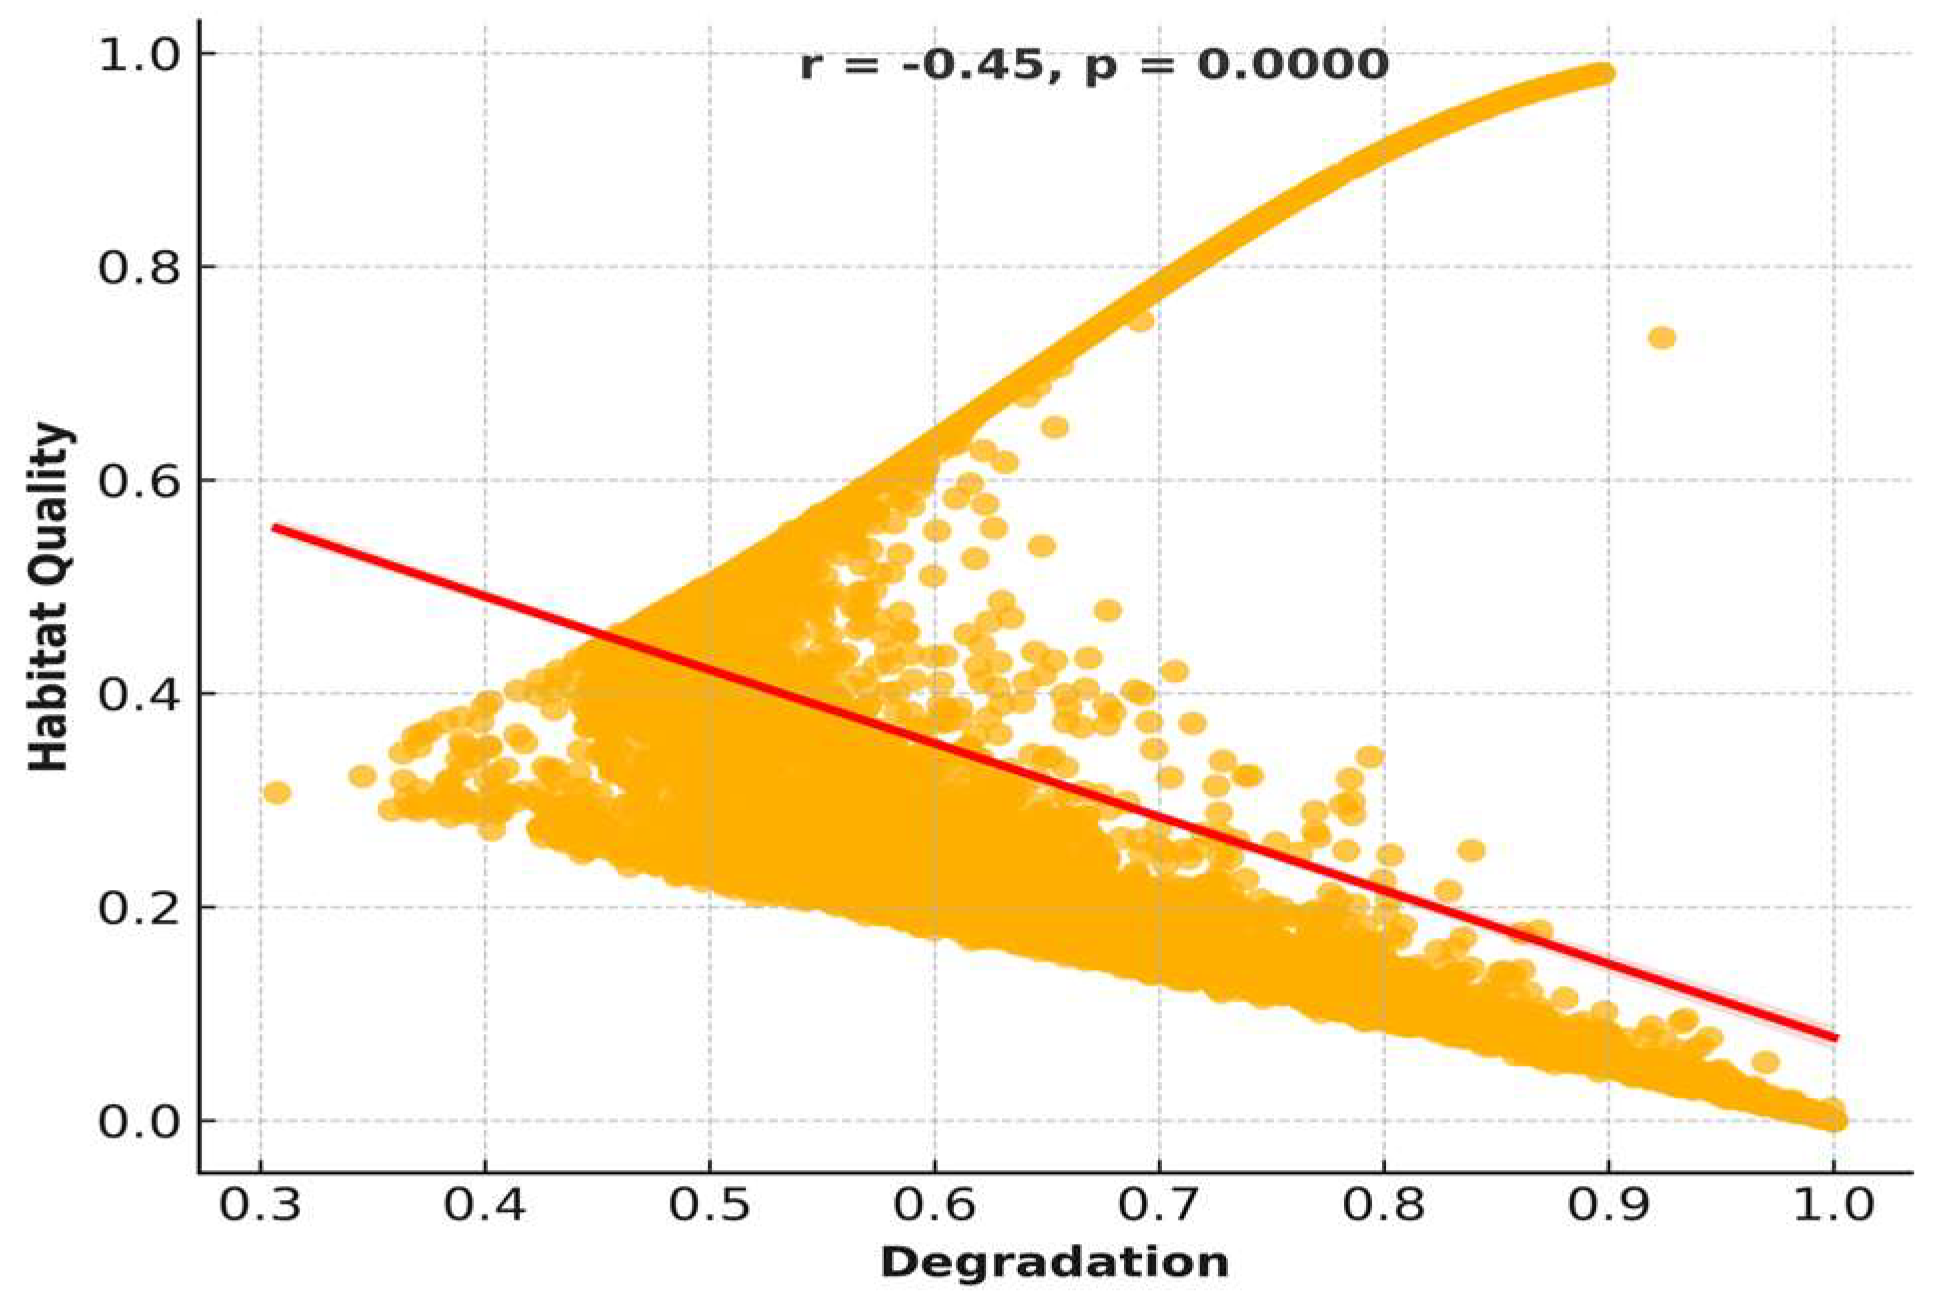
Figure 7.
The average sensitivity of various habitat types to threat factors.
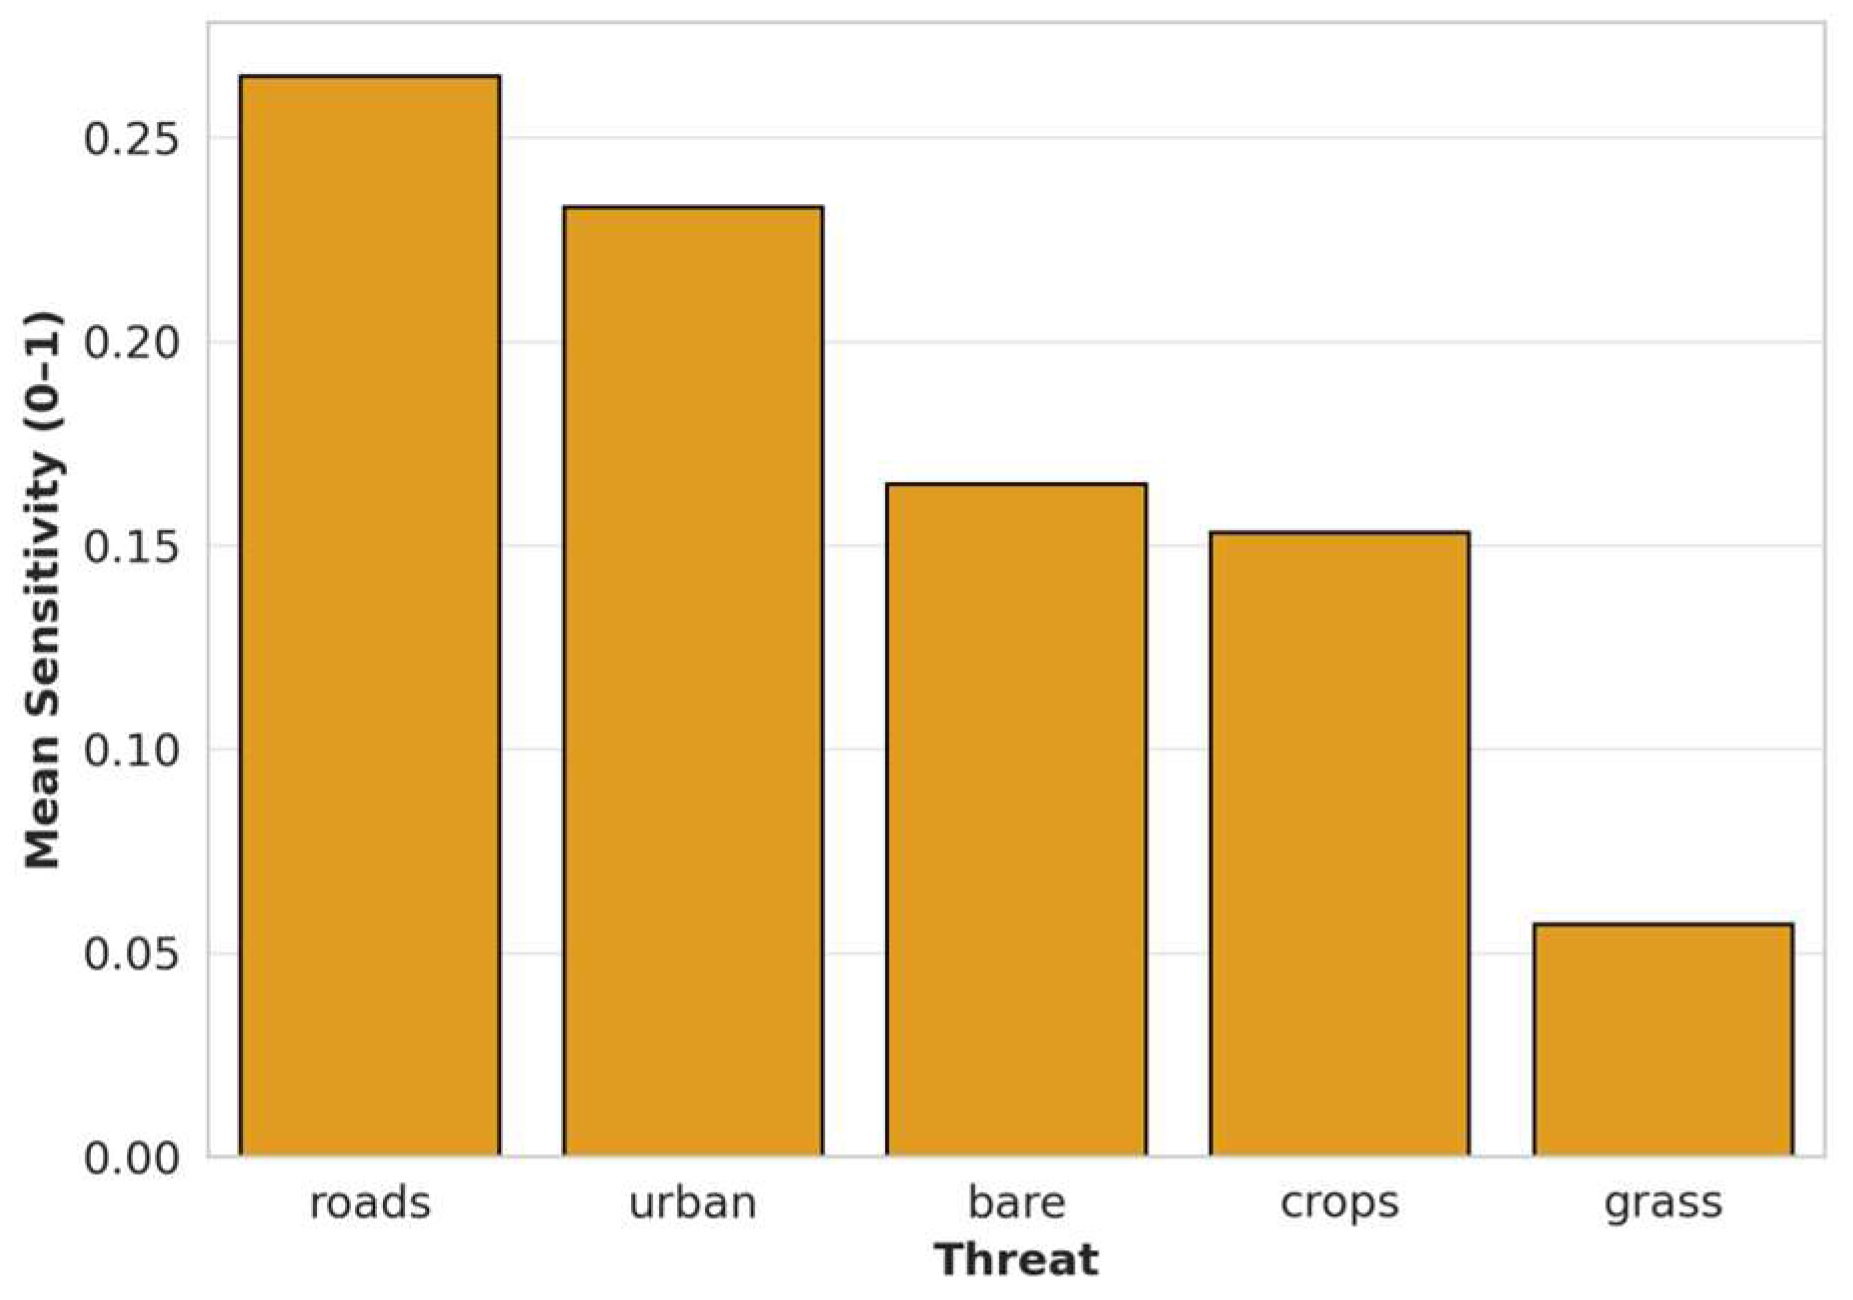
Figure 8.
Matrix of habitat type sensitivity to individual threat factors.
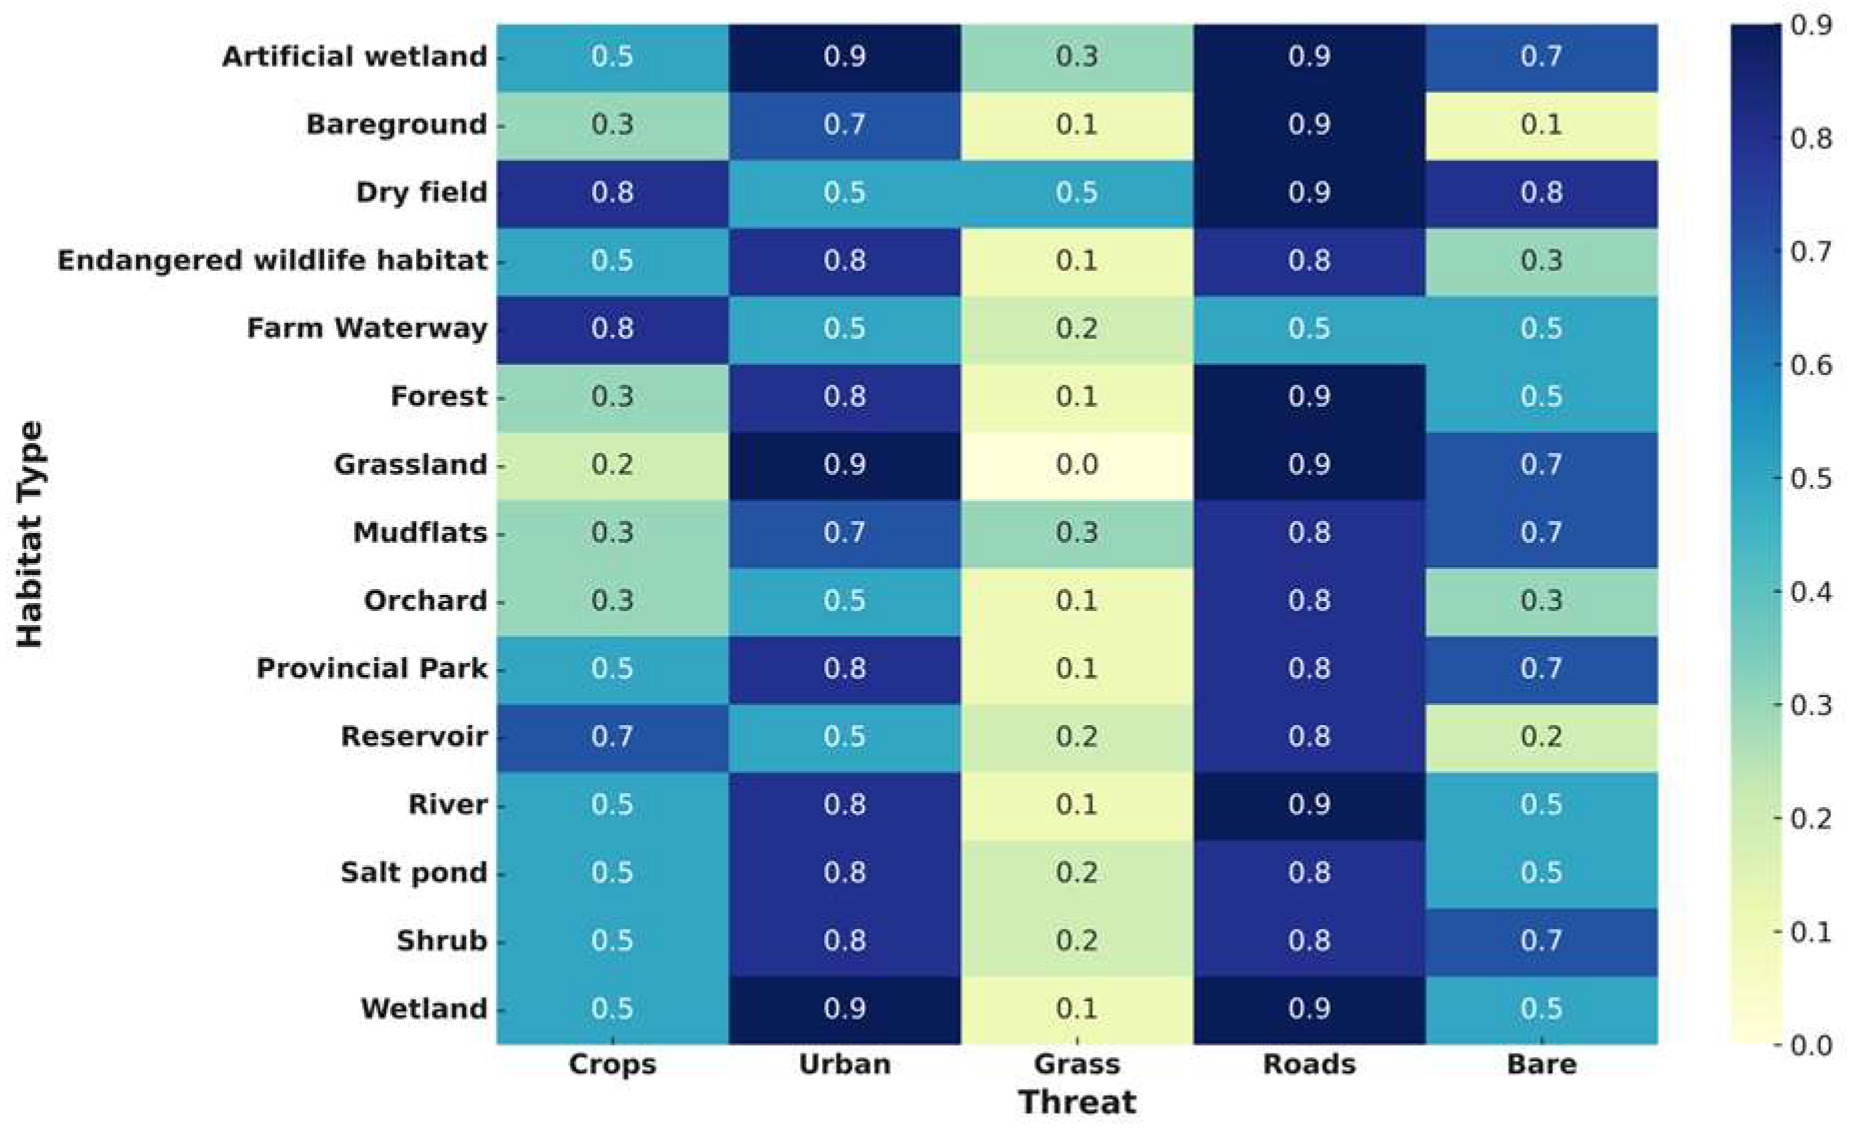
Figure 9.
Change in the average sensitivity value of various habitat types in response to threat factor removal.
Figure 9.
Change in the average sensitivity value of various habitat types in response to threat factor removal.
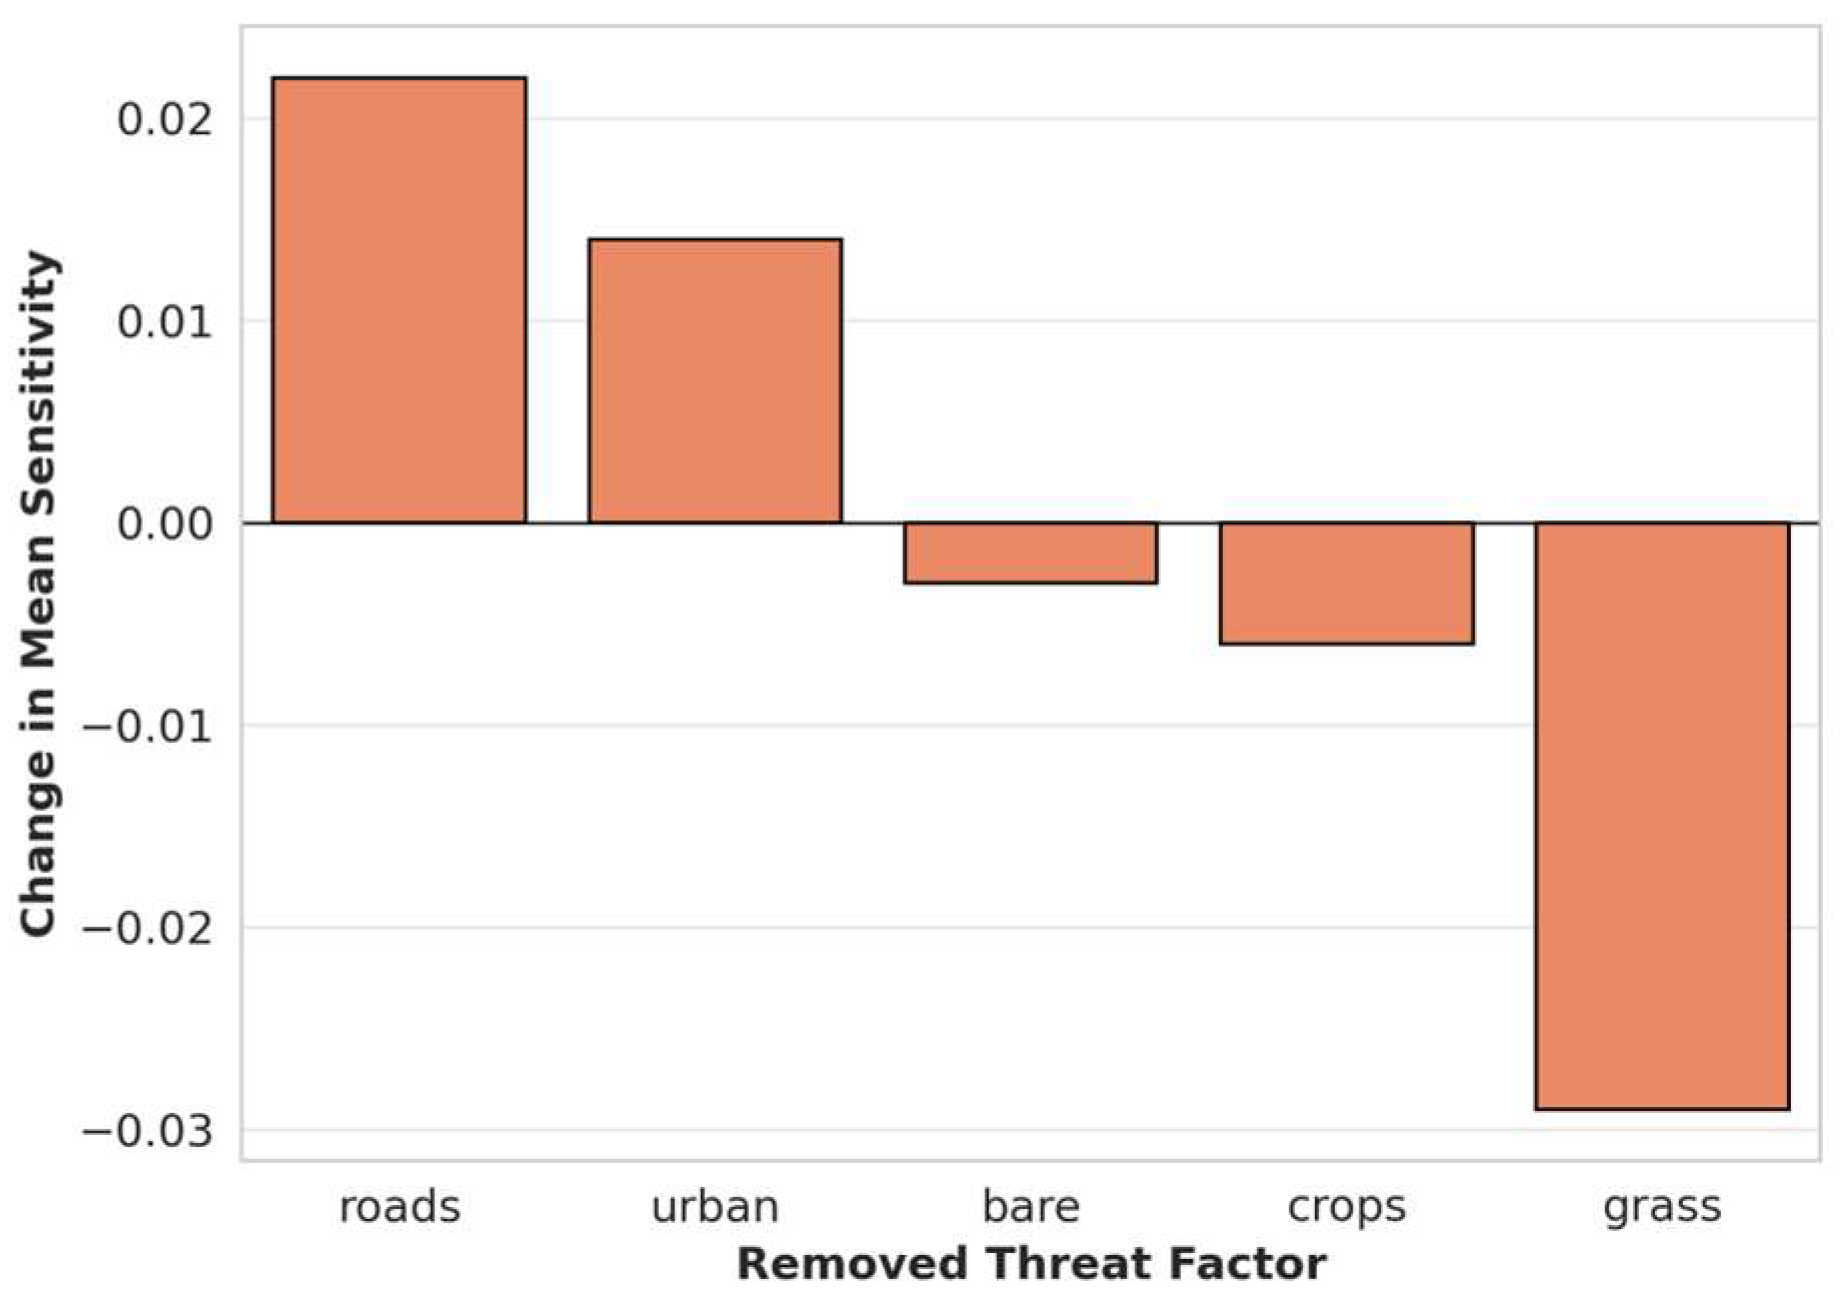

Table 1.
Assigned sensitivity values of each habitat type to individual threat factors.
| Name | Crops | Urban | Grass | Roads | Bare |
| Artificial wetland | 0.5 | 0.9 | 0.3 | 0.9 | 0.7 |
| Bare ground | 0.3 | 0.7 | 0.1 | 0.9 | 0.1 |
| Dry field | 0.8 | 0.5 | 0.5 | 0.9 | 0.8 |
| Endangered wildlife habitat | 0.5 | 0.8 | 0.1 | 0.8 | 0.3 |
| Farm waterway | 0.8 | 0.5 | 0.2 | 0.5 | 0.5 |
| Forest | 0.3 | 0.8 | 0.1 | 0.9 | 0.5 |
| Grassland | 0.2 | 0.9 | 0.0 | 0.9 | 0.7 |
| Mudflats | 0.3 | 0.7 | 0.3 | 0.8 | 0.7 |
| Orchard | 0.3 | 0.5 | 0.1 | 0.8 | 0.3 |
| Provincial Park | 0.5 | 0.8 | 0.1 | 0.8 | 0.7 |
| Reservoir | 0.7 | 0.5 | 0.2 | 0.8 | 0.2 |
| River | 0.5 | 0.8 | 0.1 | 0.9 | 0.5 |
| Salt pond | 0.5 | 0.8 | 0.2 | 0.8 | 0.5 |
| Shrub | 0.5 | 0.8 | 0.2 | 0.8 | 0.7 |
| Wetland | 0.5 | 0.9 | 0.1 | 0.9 | 0.5 |
Table 2.
Attributes of input threat factors applied in the InVEST habitat quality model.
| THREAT | WEIGHT | MAX_DIST (m) | DECAY |
| Crops | 0.7 | 8 | linear |
| Urban | 1.0 | 10 | exponential |
| Grass | 0.5 | 6 | linear |
| Roads | 1.0 | 3 | exponential |
| Bare | 1.0 | 5 | exponential |
MAX DIST, maximum influence distance.
Disclaimer/Publisher’s Note: The statements, opinions and data contained in all publications are solely those of the individual author(s) and contributor(s) and not of MDPI and/or the editor(s). MDPI and/or the editor(s) disclaim responsibility for any injury to people or property resulting from any ideas, methods, instructions or products referred to in the content. |
© 2025 by the authors. Licensee MDPI, Basel, Switzerland. This article is an open access article distributed under the terms and conditions of the Creative Commons Attribution (CC BY) license (http://creativecommons.org/licenses/by/4.0/).
Copyright: This open access article is published under a Creative Commons CC BY 4.0 license, which permit the free download, distribution, and reuse, provided that the author and preprint are cited in any reuse.


