
Submitted:
01 April 2025
Posted:
02 April 2025
You are already at the latest version
Abstract
Background: Accurate diagnosis of IgE-mediated allergic diseases is crucial for effective management. This study compared the diagnostic performance of two multiplex allergy assays, AllergyChip and ALEX2, by measuring IgE reactivity to 31 inhalant allergens using serum samples from 90 participants.
Methods: The qualitative analysis included calculating the Overall Percentage Agreement (OPA), Positive Percentage Agreement (PPA), and Negative Percentage Agreement (NPA) to assess test agreement. Cohen's kappa (k) quantified the strength of agreement. Receiver Operating Characteristic (ROC) analysis evaluated AllergyChip’s ability to differentiate positive and negative sIgE results. Spearman’s correlation coefficient (Rs) assessed agreement between sIgE classes, and Bland-Altman plots evaluated quantitative agreement.
Results: AllergyChip showed substantial agreement with ALEX2, with an OPA of 88% and Cohen’s kappa of 0.792. AUC analysis demonstrated excellent discriminatory ability (AUC = 0.891). Spearman's correlation (Rs = 0.792) indicated significant agreement between the two assays. However, AllergyChip had lower PPA (below 70%) for 9 allergens, with particularly low rates for profilin allergens Phl p 12 (0%) and Bet v 2 (30%).
Conclusions: AllergyChip performs well in detecting IgE to inhalant allergens and offers a viable alternative diagnostic tool. However, differences in sensitivity suggest that AllergyChip should complement, rather than replace, ALEX2, especially in cost-sensitive settings. Further studies are needed to confirm these findings and improve accuracy in multiplex allergy diagnostics.
Keywords:
multiplex assay
; allergen microarray
; IgE binding
; allergy in vitro diagnostics
; allergy immunoassay
; ALEX2
Introduction
Allergic diseases, including allergic rhinitis, asthma, and atopic dermatitis, have become increasingly prevalent, affecting up to 30% of the global population [1]. Accurate diagnosis of these conditions is crucial for effective management and treatment [2]. Traditionally, the skin prick test (SPT) has served as the gold standard for diagnosing IgE-mediated allergic reactions [3]. However, the SPT has limitations: it is invasive, can cause discomfort, and its results can be difficult to standardize [4,5]. Additionally, SPT provides limited quantitative data, which can complicate the interpretation of results, particularly in cases of polysensitization [6].
In response to these challenges, in vitro testing for specific IgE (sIgE) antibodies has gained prominence, offering a less invasive and more quantifiable approach to allergy diagnosis [7]. Among these in vitro methods, component-resolved diagnostics (CRD) have emerged as a valuable tool. CRD allows for the identification of specific allergenic molecules responsible for allergic reactions, offering a more detailed and individualized allergic profile for each patient [8]. This level of detail is particularly beneficial for guiding allergen-specific immunotherapy, especially in polysensitized individuals [9].
Despite the advancements in CRD, the high cost associated with these tests remains a significant barrier to their widespread adoption [10]. Moreover, the availability of multiple testing platforms with varying technologies has led to inconsistencies in sIgE measurement, complicating the interpretation and comparison of results across different systems [11]. For instance, studies have shown that the results from different sIgE tests, such as ImmunoCAP, ISAC, and ALEX2, are not directly interchangeable due to differences in detection technologies and calibration methods. A comparative study between ALEX2 and ImmunoCAP ISAC revealed that while both tests showed good overall agreement, there were notable differences in sensitivity and specificity for certain allergens. ALEX2 demonstrated higher sensitivity for some components, particularly for peanut allergens (Ara h 2 and Ara h 6), while ISAC showed better performance for others, such as birch pollen (Bet v 1) [12,13,14]. Another study comparing ISAC and ImmunoCAP singleplex assays found that while there was generally good concordance between the two methods, ISAC tended to underestimate sIgE levels compared to ImmunoCAP, especially at higher concentrations [15,16,17]. This discrepancy was particularly evident for certain allergens, including house dust mite (Der p 1) and cat (Fel d 1) components. Furthermore, a comprehensive comparison of ALEX2, ISAC, and ImmunoCAP singleplex highlighted the technological differences between these platforms. ALEX2 uses nanotechnology-based allergen immobilization, ISAC employs a microarray format, while ImmunoCAP uses a three-dimensional cellulose sponge matrix. These distinct approaches result in varying detection limits and dynamic ranges, which can lead to discrepancies in sIgE quantification, especially for low and high sIgE levels [18]. This variability poses a challenge in clinical practice, where consistent and reliable results are paramount for accurate diagnosis and treatment planning. The discrepancies between different testing platforms underscore the need for standardization in allergy diagnostics and careful interpretation of results, particularly when comparing data from different systems or transitioning patients between diagnostic methods.
The focus on inhalant allergens is particularly relevant given their pervasive role in allergic diseases. Inhalant allergens, such as pollen, dust mites, and animal dander, are common triggers of allergic rhinitis and asthma—conditions that significantly impact patients' quality of life [19]. Understanding the specific sensitizations to these inhalant allergens is crucial for effective management, particularly in the context of allergen-specific immunotherapy [20].
In this context, the introduction of new multiplex diagnostic systems offers the potential to enhance the accessibility and reliability of CRD [21]. This study aims to compare two such systems: the AllergyChip, a new multiplex array, and the widely recognized ALEX2 microarray test. Both systems are designed to detect specific IgE antibodies against a broad range of inhalant allergens, but they employ different technologies and allergen panels. The AllergyChip includes 98 analytes from 45 allergen sources, while ALEX2 encompasses 295 allergens from 165 sources [22].
This comparative analysis will provide insights into the performance of AllergyChip relative to ALEX2 in detecting sIgE antibodies, with a particular focus on inhalant allergens. By examining parameters such as AUC, NPA, PPA, OPA, Rs, k, between the two tests, this study seeks to determine AllergyChip’s sIgE detection performance with respect to the ALEX2 method. Furthermore, the study will explore the potential implications of any observed discrepancies between the two systems, contributing to the ongoing discussion about standardization and harmonization in allergy diagnostics.
Methods
sIgE Measurements
AllergyChip comprises of 98 allergens from 45 allergen sources (33 extracts and 65 allergen components, 49 inhalant and 49 food allergens). Allergens are printed on polymer-coated glass slides in duplicates. The whole list of allergens is presented in supplementary Table 1. On a glass slide, there are 21 fields. 20 fields are used for patient samples and 1 field is used for test performance quality control purposes. According to the manufacturer, AllergyChip is a quantitative test that measures sIgE in kUa/L. Each individual allergen is validated according to a homologous calibration curve based on other quantitative test measurements. The limit of quantification is (LoQ) is 0,35 kUa/L. AllergyChip test was performed according to manufacturer instructions. Briefly, serum samples were diluted 5 times with a dilution buffer and left for 10 min. Incubation to reduce anti-CCD-IgE binding to CCD molecules. After sample pretreatment, 80 µl of samples were incubated for 2 hours at 37 C. Then a washing buffer (100 μl) was used 5 times to remove unbound molecules. Secondary incubation was carried out with fluorophore labeled antibodies against human IgE for 30 min at 37°C. Washing procedure was repeated with additional rinsing of glass slide with deionized water. Dried glass slides were scanned using fluorescence scanner (excitation wavelength 635nm).
ALEX2 (MacroArray DX, Vienna, Austria) has 295 allergens (117 allergen extracts and 178 molecular components) from 165 allergen sources. These allergens and components are printed on a nitrocellulose membrane in a cartridge as a single drop. The assay was conducted following the manufacturer's instructions. In summary, chip was incubated with 0.5 ml of 5 times diluted and pretreated with a CCD inhibitor. After 2 h of incubation, the chips were thoroughly washed, and a detection reagent of anti-human IgE conjugated with alkaline phosphatase was applied and incubated for 30 min. After another round of thorough washing, the enzyme substrate was added, and the reaction was completed in few minutes. The membranes were dried, and the color reaction intensity for each allergen spot was captured by a CCD camera. The software processed the images and generated a report that showed the allergen concentration in kUa/L.
Sera Samples
From February 2021 till July 2024 serum samples were collected and tested at Imunodiagnostika. The ALEX2 test was done within 2 weeks from sample collection date and then aliquoted and stored at –20°C until analysis with AllergyChip. 90 most multisensitized serum samples to inhalant allergens were selected for study. Lithuanian Bioethics Committee for Biomedical Research approved the study protocol (No. 2021/01-1298˗776). All participants provided their informed written consent before participating in the study. For participants who were minors, written consent was also obtained from their parents or guardians. The data was anonymized to protect the privacy and confidentiality of the participants.
Statistical Analysis
Allergen sIgE results were included for further statistical analysis only if there were at least 10 positive results for the corresponding allergens from Alex2. This threshold was established to enhance statistical power and to increase confidence in the comparisons due to the limited sample size.
For qualitative comparison Overall Percentage Agreement (OPA), positive and negative percentage agreement PPA and NPA were calculated. The Cohen kappa statistic (k) and its 95% CI was used to test the level of agreement between AllergyChip and ALEX2 assays. The strength of agreement was considered less than a chance for k ≤ 0; slight for k = 0.01–0.20; fair for k = 0.21–0.40; moderate k = 0.41–0.60; substantial for k = 0.61–0.80; and almost perfect for k > 0.81. Reciever Operating Charateristics (ROC) analysis was perfomed to understand the AllergyChip ability to distinguish between negative and positive results. The AUC values were rated 0.5: no discrimination (equivalent to random guessing); 0.51 - 0.7: poor discrimination; 0.71 - 0.8: acceptable discrimination; 0.81 - 0.9: excellent discrimination; > 0.91: outstanding discrimination.
For semiquantitative study AlergyChip and ALEX2 values were grouped to classes (class 0: <0.3 kUA/L; class 1: 0.3 to <1.0 kUA/L; class 2: 1 to <5.0 kUA/L; class 3: 5 to <15 kUA/L; and class 4: ≥15 kUA/L) and Spearman's Correlation coefficient (Rs) was calculated. Rs values were categorized as very high positive correlation (0.9–1.0), high positive (0.7–0.9), moderate positive (0.5–0.7), low positive (0.3–0.5) or negligible (below 0.3).
For quantitative study analysis, Bland–Altman plot was drawn to assess the agreement between the AllergyChip and ALEX2 assays in measuring sIgE concentrations across shared inhalant allergens. These plots allow for visualization of the mean differences between the two methods and identify any systematic bias. The linear correlation of the overall sIgE levels measured by AllergyChip and positive ALEX2 tests result values was depicted by scatterplot and linear correlation coefficient was calculated.
P values of 0.05 or less were considered statistically significant. All statistical analysis was performed using SPSS statistical software, version 17.0 (SPSS Inc., Chicago, IL, USA).
Results
Sera Samples
A total of 90 serum samples were collected from participants residing in Vilnius, Lithuania. The cohort consisted of 44 men (49%) and 46 women (51%), with an average age of 24 years and a median age of 25.5 years. The age range of participants varied from 1 to 57 years. These participants were tested for IgE reactivity against 31 inhalant allergens, resulting in a complete dataset comprising 2,790 individual records (Table 1)
sIgE Measurements
Qualitative Agreement
The overall OPA between the two tests was substantial with 88% agreement for all shared inhalant allergens (n = 31) with NPA of 91% and a PPA of 80%. Cohen's kappa (k) value for overall agreement was 0.721 (95% CI: 0.693–0.748), also indicating substantial agreement between the assays. And ROC analysis AUC for overall tested allergens was 0.891 (95% CI: 0.876 - 0.906) indicating overall AllergyChip excellent discrimination between positive and negative ALEX2 results. However, extremely low PPA rates were noted for profilin allergens, such as Bet v 2 (30%) and Phl p 12 (0%), as shown in Table 2. In contrast, high OPA was observed for major inhalant allergens, including Art v 1, Bet v 1, Aln g 1, Phl p 2, Phl p 5, Phl p 6, Can f 4, Der f 1, Der f 2, Der p 2, Fel d 1, Fel d 4, where PPA exceeded 90%, k ≥ 0,773 (95% CI: 0,623 - 0,923), AUC ≥ 0,911 (95% CI: 0,827 - 0,995) - outstanding discrimination. But other major allergen molecules: Can f 1, Can f 6, Alt a 1, Der p 23, Equ c 1, Phl p 1, Der p 1, Mus m 1 had PPA ranging from 62 to 83%, indicated by higher numbers of false results in Table 2.
Semiquantitative Agreement
A Spearman's correlation (Rs) was calculated to assess the agreement between sIgE classes measured by AllergyChip and ALEX2 for each allergen. For that AllergyChip sIgE values were categorized according to ALEX2 classification system. A summary of the Rs values is presented in Table 1. High and very high positive correlation were observed for 22 out of 31 allergens ranging from 0.740 to 0.941 (p < 0.01). And moderate positive correlation from 0.507 to 0.670 (p < 0.01) was determined for 7 allergens (Can f 6, Alt a 1, Art v, Lol p 1, Equ c 1, Mus m 1, Fel d 7). Only profilins Bet v 2 and Phl p 12 had low and negligible correlation respectively (Rs = 0,395 p < 0.01 and Rs = -0.073 p < 0.496). The overall Spearman's correlation for all allergens was Rs = 0.792, showing high positive agreement between the two methods.
Quantitative Agreement
The scatterplot was used to further analyze the linear relationship between AllergyChip and ALEX2 quantitative values. In this graphical method, the two test results are plotted against the one’s sIgE values. As shown in Figure 1.
A positive linear correlation coefficient (R² = 0.723) was observed, indicating good linear relationship agreement between the two methods in quantifying sIgE levels for shared allergens (2,724 data points).
Since a correlation among the tests may not necessarily depict a quantitative agreement, we applied the Bland–Altman plot method for graphical representation of the agreement between ALEX2 and AllergyChip measurements in Figure 2.
Bland–Altman plot highlights the minimal bias observed between the methods. Outliers were mainly found for allergens such as Phl p 12 and Bet v 2, where significant underestimation by AllergyChip was noted, aligning with the low Rs seen in Table 2. The analysis revealed that the mean difference between AllergyChip and ALEX2 was 1,00 and a positive diference values for the majority of data points indicating a tendency of AllergyChip to underestimate the sIgE concentrations compared to ALEX2. However, after the ALEX2 sIgE value exceeds approximately 50 kUa/L, a shift is observed, with the AllergyChip test beginning to overestimate sIgE levels relative to ALEX2, as shown by the tendency shift of scatter points towards the negative difference values.
Discussion
The results of this study offer a valuable perspective on the comparative performance of AllergyChip and ALEX2, shedding light on the strengths and limitations of each platform in detecting specific IgE antibodies. Given the increasing prevalence of allergic diseases and the critical need for accurate diagnosis, understanding the nuances between different diagnostic tools is essential for optimizing patient care. This discussion aims to delve deeper into the technological differences, calibration methods, and sensitivity issues observed in this study, while also reflecting on the broader implications of these findings for clinical practice and future research directions.
Every immunoassay relies on specific concentrations of allergens, serum conditions, and detection antibodies optimized to offer the best dynamic range under given analytical conditions. When comparing the same allergens on ALEX2 and AllergyChip, it is essential to recognize the differences in the solid phases and detection principles employed by these platforms. One key factor is the technological variation between the two systems. ALEX2 utilizes a nitrocellulose (NC) membrane for allergen immobilization, while AllergyChip employs a polymer-coated glass slide. This difference in the immobilization surface, and consequently the quantity of allergen available per test spot, can partly explain the discrepancies observed in sensitivity between the two assays. ALEX2 uses allergen-coated beads on a porous NC membrane, which allows for a higher concentration of allergens per spot. This results in lower competitive binding inhibition with non-IgE antibodies, offering better performance in detecting specific IgE when compared to the planar glass surface of AllergyChip, where the amount of available allergen per spot is considerably lower. Similar observations have been discussed in previous studies [23].
Inconsistent results between different multiplex assays may also stem from variations in the methods used to generate calibration curves. Although quantitative inter-assay comparisons revealed a linear correlation, the distributions varied. This is expected, as discrepancies in sIgE values have been previously demonstrated between established assays, even when calibration curves are interpolated using the same international standard [24,25]. These differences in calibration can contribute to the observed variation in sensitivity and specificity between AllergyChip and ALEX2, particularly for certain allergens where the test sensitivity plays a critical role in detecting lower levels of IgE.
Our findings regarding the overall percentage agreement (OPA), negative percentage agreement (NPA), and positive percentage agreement (PPA) are consistent with previous microarray comparison studies. For instance, a study comparing ImmunoCAP sIgE singleplex tests and the ISAC IgE multiplex assay in 101 patients sensitized to grass pollens found correlations between ISAC and ImmunoCAP results, with PPA and NPA values ranging between 60 and 100% for PPA and 78–97% for NPA [26]. Similarly, in studies comparing ISAC and ImmunoCAP sIgE measurements across 55 allergens, the PPA was 79% and the NPA was 94% [27]. Other comparisons, such as between Microtest and ISAC or ImmunoCAP vs ISAC, showed OPA values of 86% and 88%, respectively [28]. In the comparison between ALEX and ISAC, an OPA of 86%, NPA of 90%, and PPA of 80% was reported across 102 samples [29].
Interestingly, the low PPA observed for profilins in our study, particularly Bet v 2 and Phl p 12, is in line with previous comparisons between ALEX2 and ISAC, where profilin PPA was also relatively low at 64.9% [13]. In our study, the poor performance of Bet v 2 and Phl p 12 allergens, as indicated by low PPA, kappa values (k), and Spearman’s correlation coefficients (Rs), underscores the lower analytical sensitivity of AllergyChip for these specific allergens. This reduced sensitivity is likely responsible for the higher rate of false negatives observed with AllergyChip, particularly for profilins and certain other major allergens.
Additionally, the shift observed in the Bland-Altman plots, which reflects the differences in results between the two tests, has been noted in other studies comparing ISAC and ALEX as well [30,31,32]. In our case, this shift is also related to the different dynamic ranges of the tests, which influence the detection of specific IgE concentrations at both lower and higher levels. The Bland-Altman plots suggest that, while there is overall agreement between AllergyChip and ALEX2, there are specific areas where the assays diverge, particularly at higher sIgE concentrations.
It is important to acknowledge several limitations of our study. The relatively small sample size (n = 90) may limit the generalizability of the findings and reduce the statistical power of certain comparisons. Additionally, the time gap between performing the ALEX2 and AllergyChip tests could have led to slight variations in sIgE levels due to factors such as sample degradation or the effects of multiple freezing and thawing cycles. These factors may have contributed to discrepancies between the results of the two assays. Furthermore, the tests were conducted by two different professional laboratory technicians, which could introduce an element of human error and procedural variability.
Despite these limitations, our study represents the first direct comparison of AllergyChip and ALEX2, offering valuable insights into the performance of these assays. Future studies with larger cohorts are needed to confirm these findings and further explore potential areas for improving the AllergyChip test. It is expected that manufacturers of AllergyChip will continue to enhance both the performance of the assay and the number of allergen molecules available on the chip. This could lead to improvements in the sensitivity and accuracy of AllergyChip, making it a more robust tool for clinical allergy diagnostics.
Conclusion
In conclusion, this study provides a comprehensive comparison of AllergyChip and ALEX2 for the detection of sIgE to inhalant allergens. While both systems exhibit high overall agreement, ALEX2 in some cases outperforms AllergyChip in terms of sensitivity for specific allergens, particularly profilins. Despite these differences, AllergyChip presents a promising and cost-effective alternative for allergen-specific IgE testing, especially in clinical settings where affordability and accessibility are primary concerns. Its lower cost makes it an attractive option for routine diagnostics, although it may be most effective when used alongside more sensitive platforms like ALEX2 for comprehensive allergen profiling
Author Contributions
Laimis Silimavicius: Formal Analysis; Investigation; Methodology; Resources; Validation; Visualization; Writing – Original Draft Preparation; Mege Cerniauskiene: Investigation; Methodology; Linas Griguola: Investigation; Kacper Packi: Writing – Original Draft, Preparation Conceptualization, supervision.
Conflicts of Interest
Laimis Silimavicius, Mege Cerniauskiene and Linas Griguola report a relationship with Imunodiagnostika, which includes employment. Other authors declare no competing financial interests or personal relationships that could influence the work.
References
- PDQ Adult Treatment Editorial Board. PDQ Cancer Information Summaries [Internet]. National Cancer Institute (US); Bethesda (MD): Mar 14 OE, Fallopian Tube, and Primary Peritoneal Cancer Treatment (PDQ®): Health Professional Version.
- Modugno, F.; Edwards, R.P. Ovarian cancer: prevention, detection, and treatment of the disease and its recurrence. Molecular mechanisms and personalized medicine meeting report. International Journal of Gynecologic Cancer 2012, 22 (Supp 2). [Google Scholar] [CrossRef]
- Mancari, R.; Cutillo, G.; Bruno, V.; Vincenzoni, C.; Mancini, E.; Baiocco, E.; et al. Development of new medical treatment for epithelial ovarian cancer recurrence. Gland surgery 2020, 9, 1149. [Google Scholar] [CrossRef] [PubMed]
- Eisenkop, S.M.; Spirtos, N.M.; Friedman, R.L.; Lin, W.-C.M.; Pisani, A.L.; Perticucci, S. Relative influences of tumor volume before surgery and the cytoreductive outcome on survival for patients with advanced ovarian cancer: a prospective study. Gynecologic oncology 2003, 90, 390–396. [Google Scholar] [CrossRef]
- Zou, R.; Jiang, Q.; Luo, X.; Chen, M.; Yuan, L.; Yao, L. Cytoreductive surgery is feasible in patients with limited regional platinum-resistant recurrent ovarian cancer. World Journal of Surgical Oncology 2023, 21, 375. [Google Scholar] [CrossRef]
- Bristow, R.E.; Tomacruz, R.S.; Armstrong, D.K.; Trimble, E.L.; Montz, F. Survival effect of maximal cytoreductive surgery for advanced ovarian carcinoma during the platinum era: a meta-analysis. Journal of clinical oncology 2002, 20, 1248–1259. [Google Scholar] [CrossRef] [PubMed]
- Dindo, D.; Demartines, N.; Clavien, P.-A. Classification of surgical complications: a new proposal with evaluation in a cohort of 6336 patients and results of a survey. Annals of surgery 2004, 240, 205–213. [Google Scholar] [CrossRef]
- Seagle, B.-L.L.; Butler, S.K.; Strohl, A.E.; Nieves-Neira, W.; Shahabi, S. Chemotherapy delay after primary debulking surgery for ovarian cancer. Gynecologic oncology 2017, 144, 260–265. [Google Scholar] [CrossRef] [PubMed]
- Kengsakul, M.; Nieuwenhuyzen-de Boer, G.M.; Udomkarnjananun, S.; Kerr, S.J.; van Doorn, H.C.; van Beekhuizen, H.J. Factors Predicting 30-Day Grade IIIa–V Clavien–Dindo Classification Complications and Delayed Chemotherapy Initiation after Cytoreductive Surgery for Advanced-Stage Ovarian Cancer: A Prospective Cohort Study. Cancers 2022, 14, 4181. [Google Scholar] [CrossRef]
- Straubhar, A.M.; Wolf, J.L.; Zhou, M.Q.C.; Iasonos, A.; Cham, S.; Wright, J.D.; et al. Advanced ovarian cancer and cytoreductive surgery: independent validation of a risk-calculator for perioperative adverse events. Gynecologic oncology 2021, 160, 438–444. [Google Scholar] [CrossRef]
- Copeland, G.; Jones, D.; Walters, M. POSSUM: a scoring system for surgical audit. British Journal of Surgery 1991, 78, 355–360. [Google Scholar] [CrossRef]
- Gawande, A.A.; Kwaan, M.R.; Regenbogen, S.E.; Lipsitz, S.A.; Zinner, M.J. An Apgar score for surgery. Journal of the American College of Surgeons 2007, 204, 201–208. [Google Scholar] [PubMed]
- Bilimoria, K.Y.; Liu, Y.; Paruch, J.L.; Zhou, L.; Kmiecik, T.E.; Ko, C.Y.; et al. Development and evaluation of the universal ACS NSQIP surgical risk calculator: a decision aid and informed consent tool for patients and surgeons. Journal of the American College of Surgeons 2013, 217, 833–842.e3. [Google Scholar]
- Cruz, J.A.; Wishart, D.S. Applications of machine learning in cancer prediction and prognosis. Cancer informatics. 2006, 2, 117693510600200030. [Google Scholar] [CrossRef]
- Miller, R.A.; Pople Jr, H.E.; Myers, J.D. Internist-I, an experimental computer-based diagnostic consultant for general internal medicine. In Computer-assisted medical decision making; Springer, 1985; pp. 139–158. [Google Scholar]
- Turing, A.M. Computing machinery and intelligence; Springer, 2009. [Google Scholar]
- Alpaydin, E. Introduction to machine learning; MIT press, 2020. [Google Scholar]
- Liang, Z.; Zhang, G.; Huang, J.X.; Hu, Q.V. (Eds.) Deep learning for healthcare decision making with EMRs. 2014 IEEE International Conference on Bioinformatics and Biomedicine (BIBM); IEEE, 2014. [Google Scholar]
- Silver, D.L. (Ed.) Machine lifelong learning: Challenges and benefits for artificial general intelligence. Artificial General Intelligence: 4th International Conference, AGI 2011, Mountain View, CA, USA, August 3-6, 2011; 2011 Proceedings 4. Springer, 3 August 2011. [Google Scholar]
- Rajkomar, A.; Dean, J.; Kohane, I. Machine learning in medicine. New England Journal of Medicine 2019, 380, 1347–1358. [Google Scholar] [CrossRef] [PubMed]
- Fagotti, A.; Ferrandina, M.G.; Vizzielli, G.; Pasciuto, T.; Fanfani, F.; Gallotta, V.; et al. Randomized trial of primary debulking surgery versus neoadjuvant chemotherapy for advanced epithelial ovarian cancer (SCORPION-NCT01461850). International Journal of Gynecologic Cancer. 2020, 30. [Google Scholar]
- Van Meurs, H.S.; Tajik, P.; Hof, M.H.; Vergote, I.; Kenter, G.G.; Mol, B.W.J.; et al. Which patients benefit most from primary surgery or neoadjuvant chemotherapy in stage IIIC or IV ovarian cancer? An exploratory analysis of the European Organisation for Research and Treatment of Cancer 55971 randomised trial. European journal of cancer 2013, 49, 3191–3201. [Google Scholar]
- Berek, J.S.; Renz, M.; Kehoe, S.; Kumar, L.; Friedlander, M. Cancer of the ovary, fallopian tube, and peritoneum: 2021 update. International Journal of Gynecology & Obstetrics. 2021, 155, 61–85. [Google Scholar]
- Kumar, A.; Janco, J.M.; Mariani, A.; Bakkum-Gamez, J.N.; Langstraat, C.L.; Weaver, A.L.; et al. Risk-prediction model of severe postoperative complications after primary debulking surgery for advanced ovarian cancer. Gynecologic oncology 2016, 140, 15–21. [Google Scholar]
- Panici, P.B.; Di Donato, V.; Fischetti, M.; Casorelli, A.; Perniola, G.; Musella, A.; et al. Predictors of postoperative morbidity after cytoreduction for advanced ovarian cancer: Analysis and management of complications in upper abdominal surgery. Gynecologic Oncology 2015, 137, 406–411. [Google Scholar]
- Inci, M.G.; Rasch, J.; Woopen, H.; Mueller, K.; Richter, R.; Sehouli, J. ECOG and BMI as preoperative risk factors for severe postoperative complications in ovarian cancer patients: results of a prospective study (RISC-GYN—trial). Archives of Gynecology and Obstetrics 2021, 304, 1323–1333. [Google Scholar]
- Cham, S.; Chen, L.; Clair, C.M.S.; Hou, J.Y.; Tergas, A.I.; Melamed, A.; et al. Development and validation of a risk-calculator for adverse perioperative outcomes for women with ovarian cancer. American journal of obstetrics and gynecology 2019, 220, 571.e1–571.e8. [Google Scholar] [PubMed]
- Rausei, S.; Uccella, S.; D'Alessandro, V.; Gisone, B.; Frattini, F.; Lianos, G.; et al. Aggressive surgery for advanced ovarian cancer performed by a multidisciplinary team: A retrospective analysis on a large series of patients. Surgery Open Science 2019, 1, 43–47. [Google Scholar]
- Yalcin, Y.; Tatar, B.; Erdemoglu, E.; Erdemoglu, E. The parameters to estimate postoperative severe complications classified through Clavien-Dindo after upper abdominal surgery in patients with primary and recurrent ovarian cancer. Ginekologia polska 2019, 90, 557–564. [Google Scholar] [CrossRef] [PubMed]
- Hernandez, M.C.; Chen, C.; Nguyen, A.; Choong, K.; Carlin, C.; Nelson, R.A.; et al. Explainable Machine Learning Model to Preoperatively Predict Postoperative Complications in Inpatients With Cancer Undergoing Major Operations. JCO Clinical Cancer Informatics 2024, 8, e2300247. [Google Scholar] [PubMed]
- Deng, H.; Eftekhari, Z.; Carlin, C.; Veerapong, J.; Fournier, K.F.; Johnston, F.M.; et al. Development and validation of an explainable machine learning model for major complications after cytoreductive surgery. JAMA Network Open 2022, 5, e2212930. [Google Scholar]
- Sp, S.; C, R.K.; Kr, A.; et al. Delay in Time to Adjuvant Chemotherapy and its Impact on Oncological Outcomes in Patients Undergoing Optimal Cytoreductive Surgery for Advanced Ovarian Cancer: Analysis of 1480 Cases From the Indian HIPEC Registry. J Surg Oncol 2024, 130, 1358–1363. [Google Scholar] [CrossRef]
Figure 1.
Scatterplot graph of sIgE values (kUa/L) correlation between Alex2 and AllergyChip.
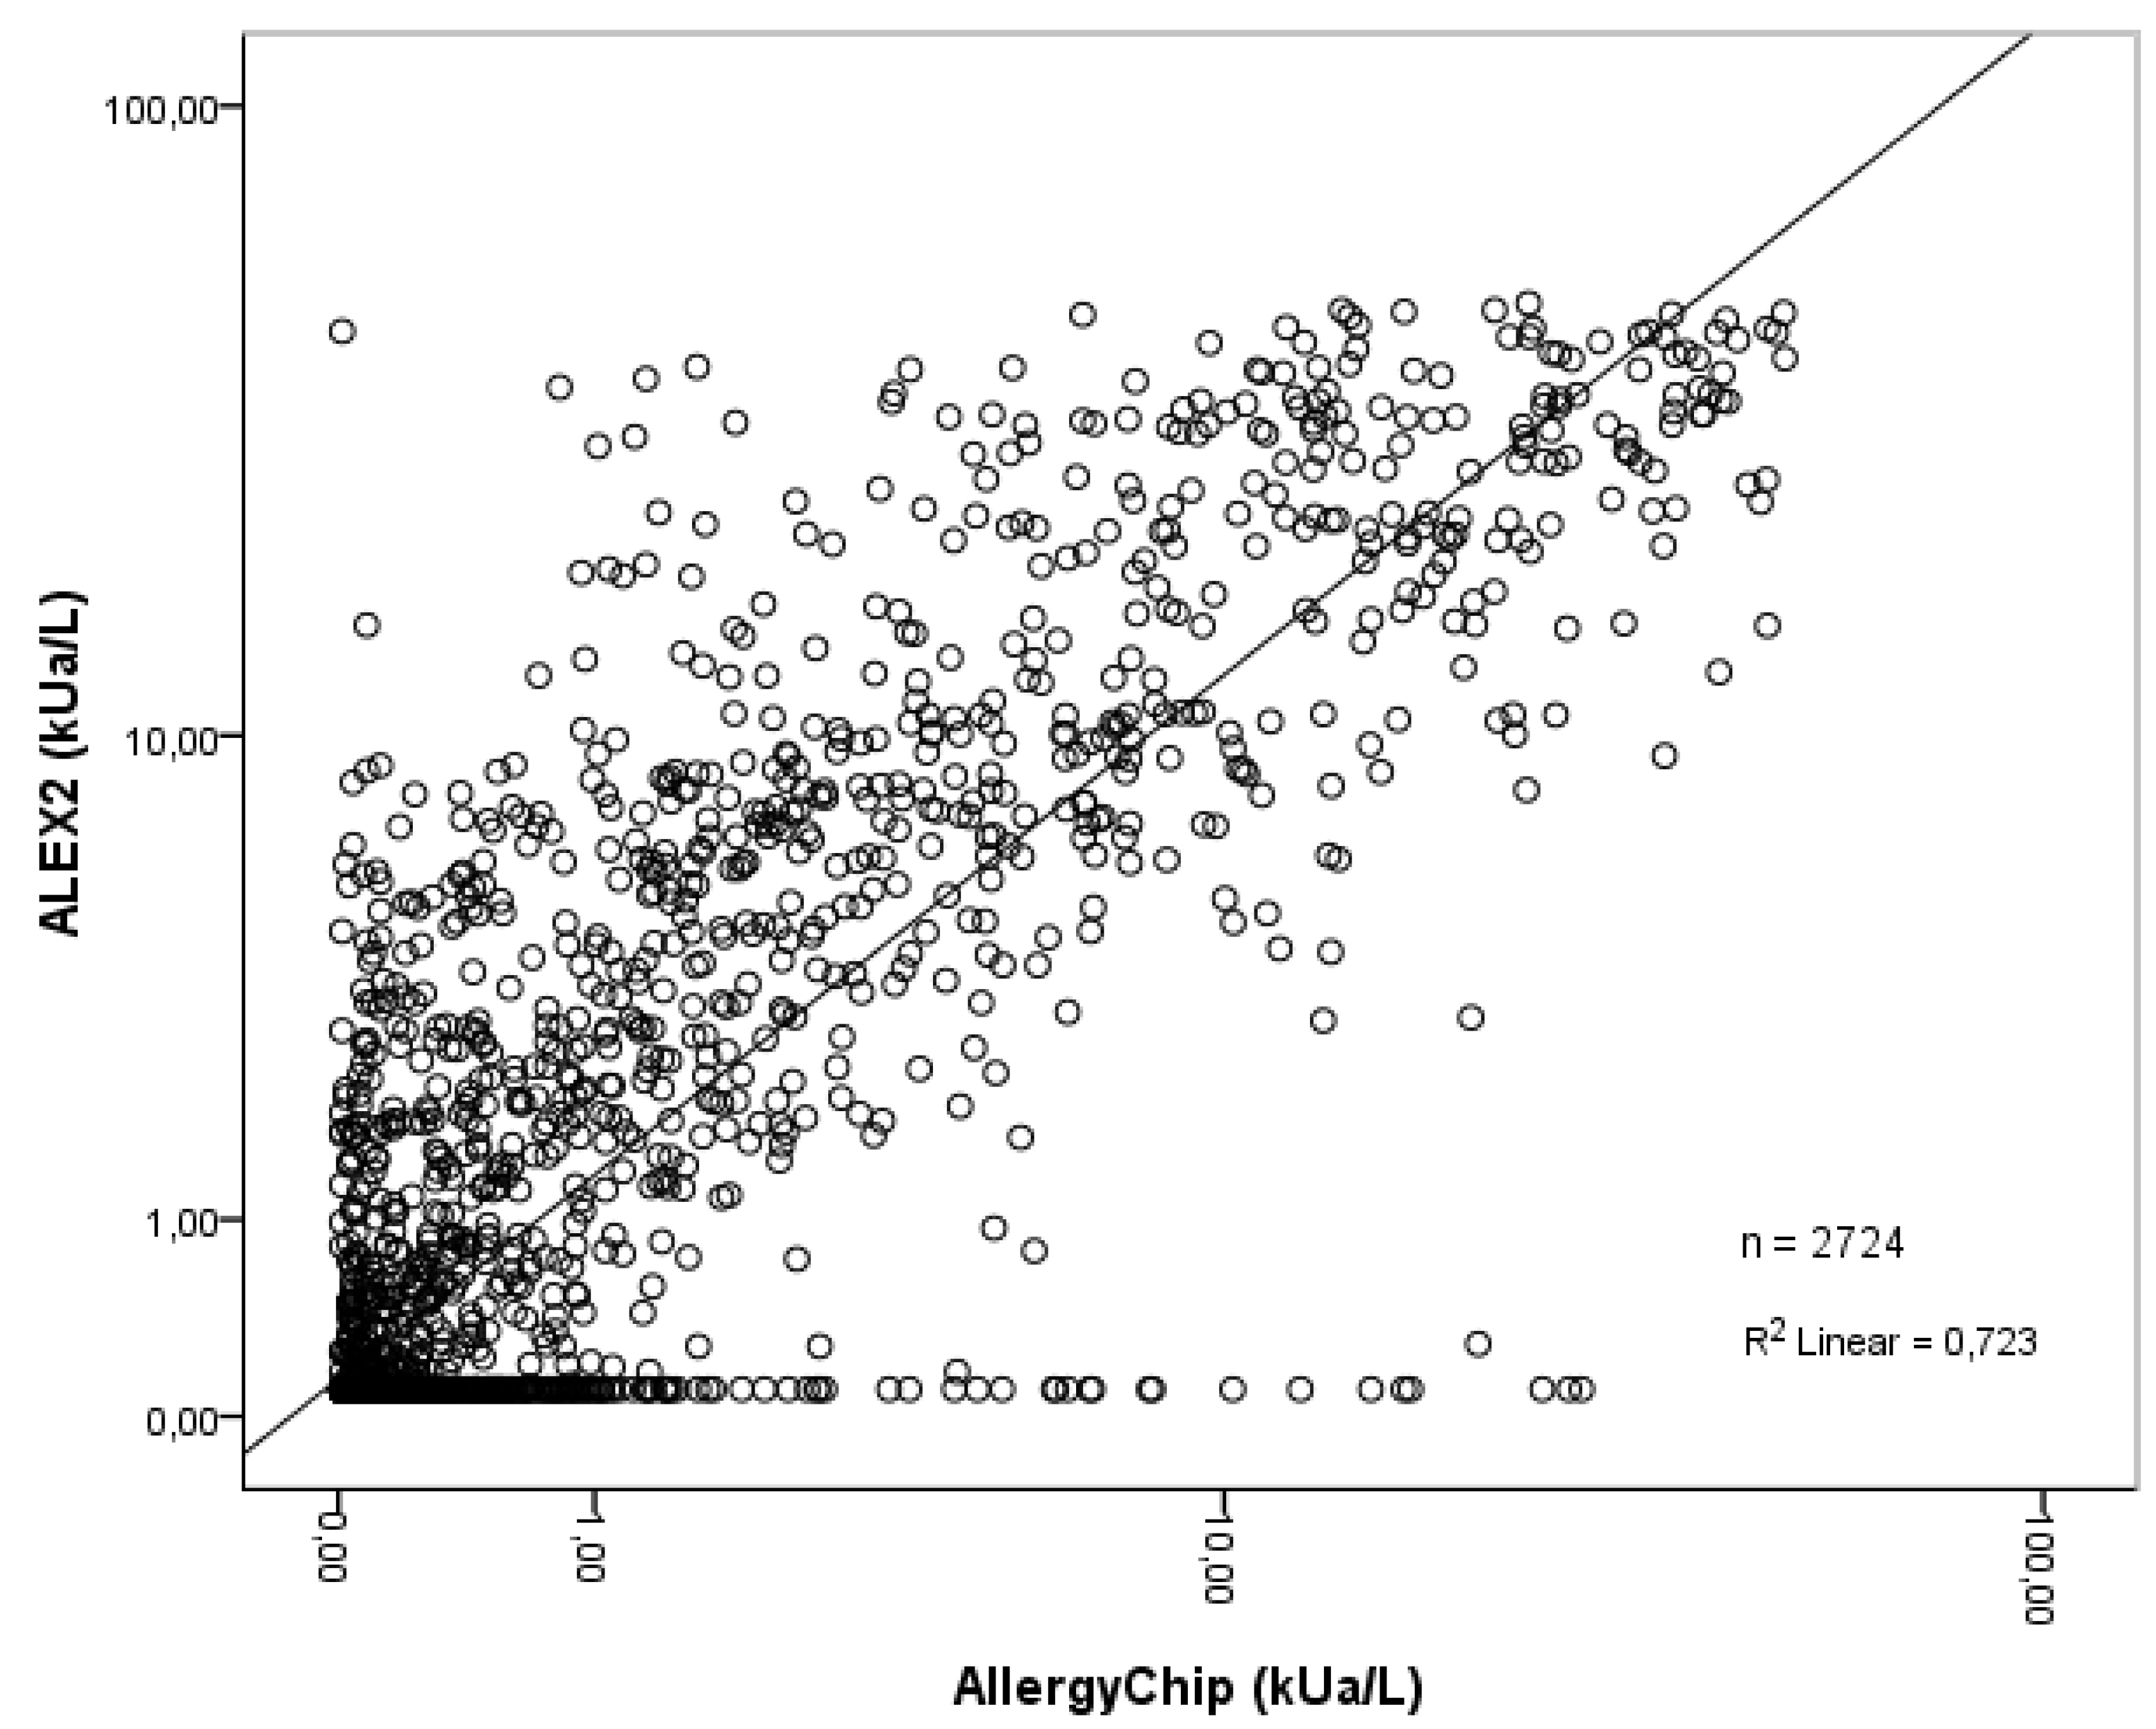
Figure 2.
The Bland–Altman plot of ALEX2 and AllergyChip.
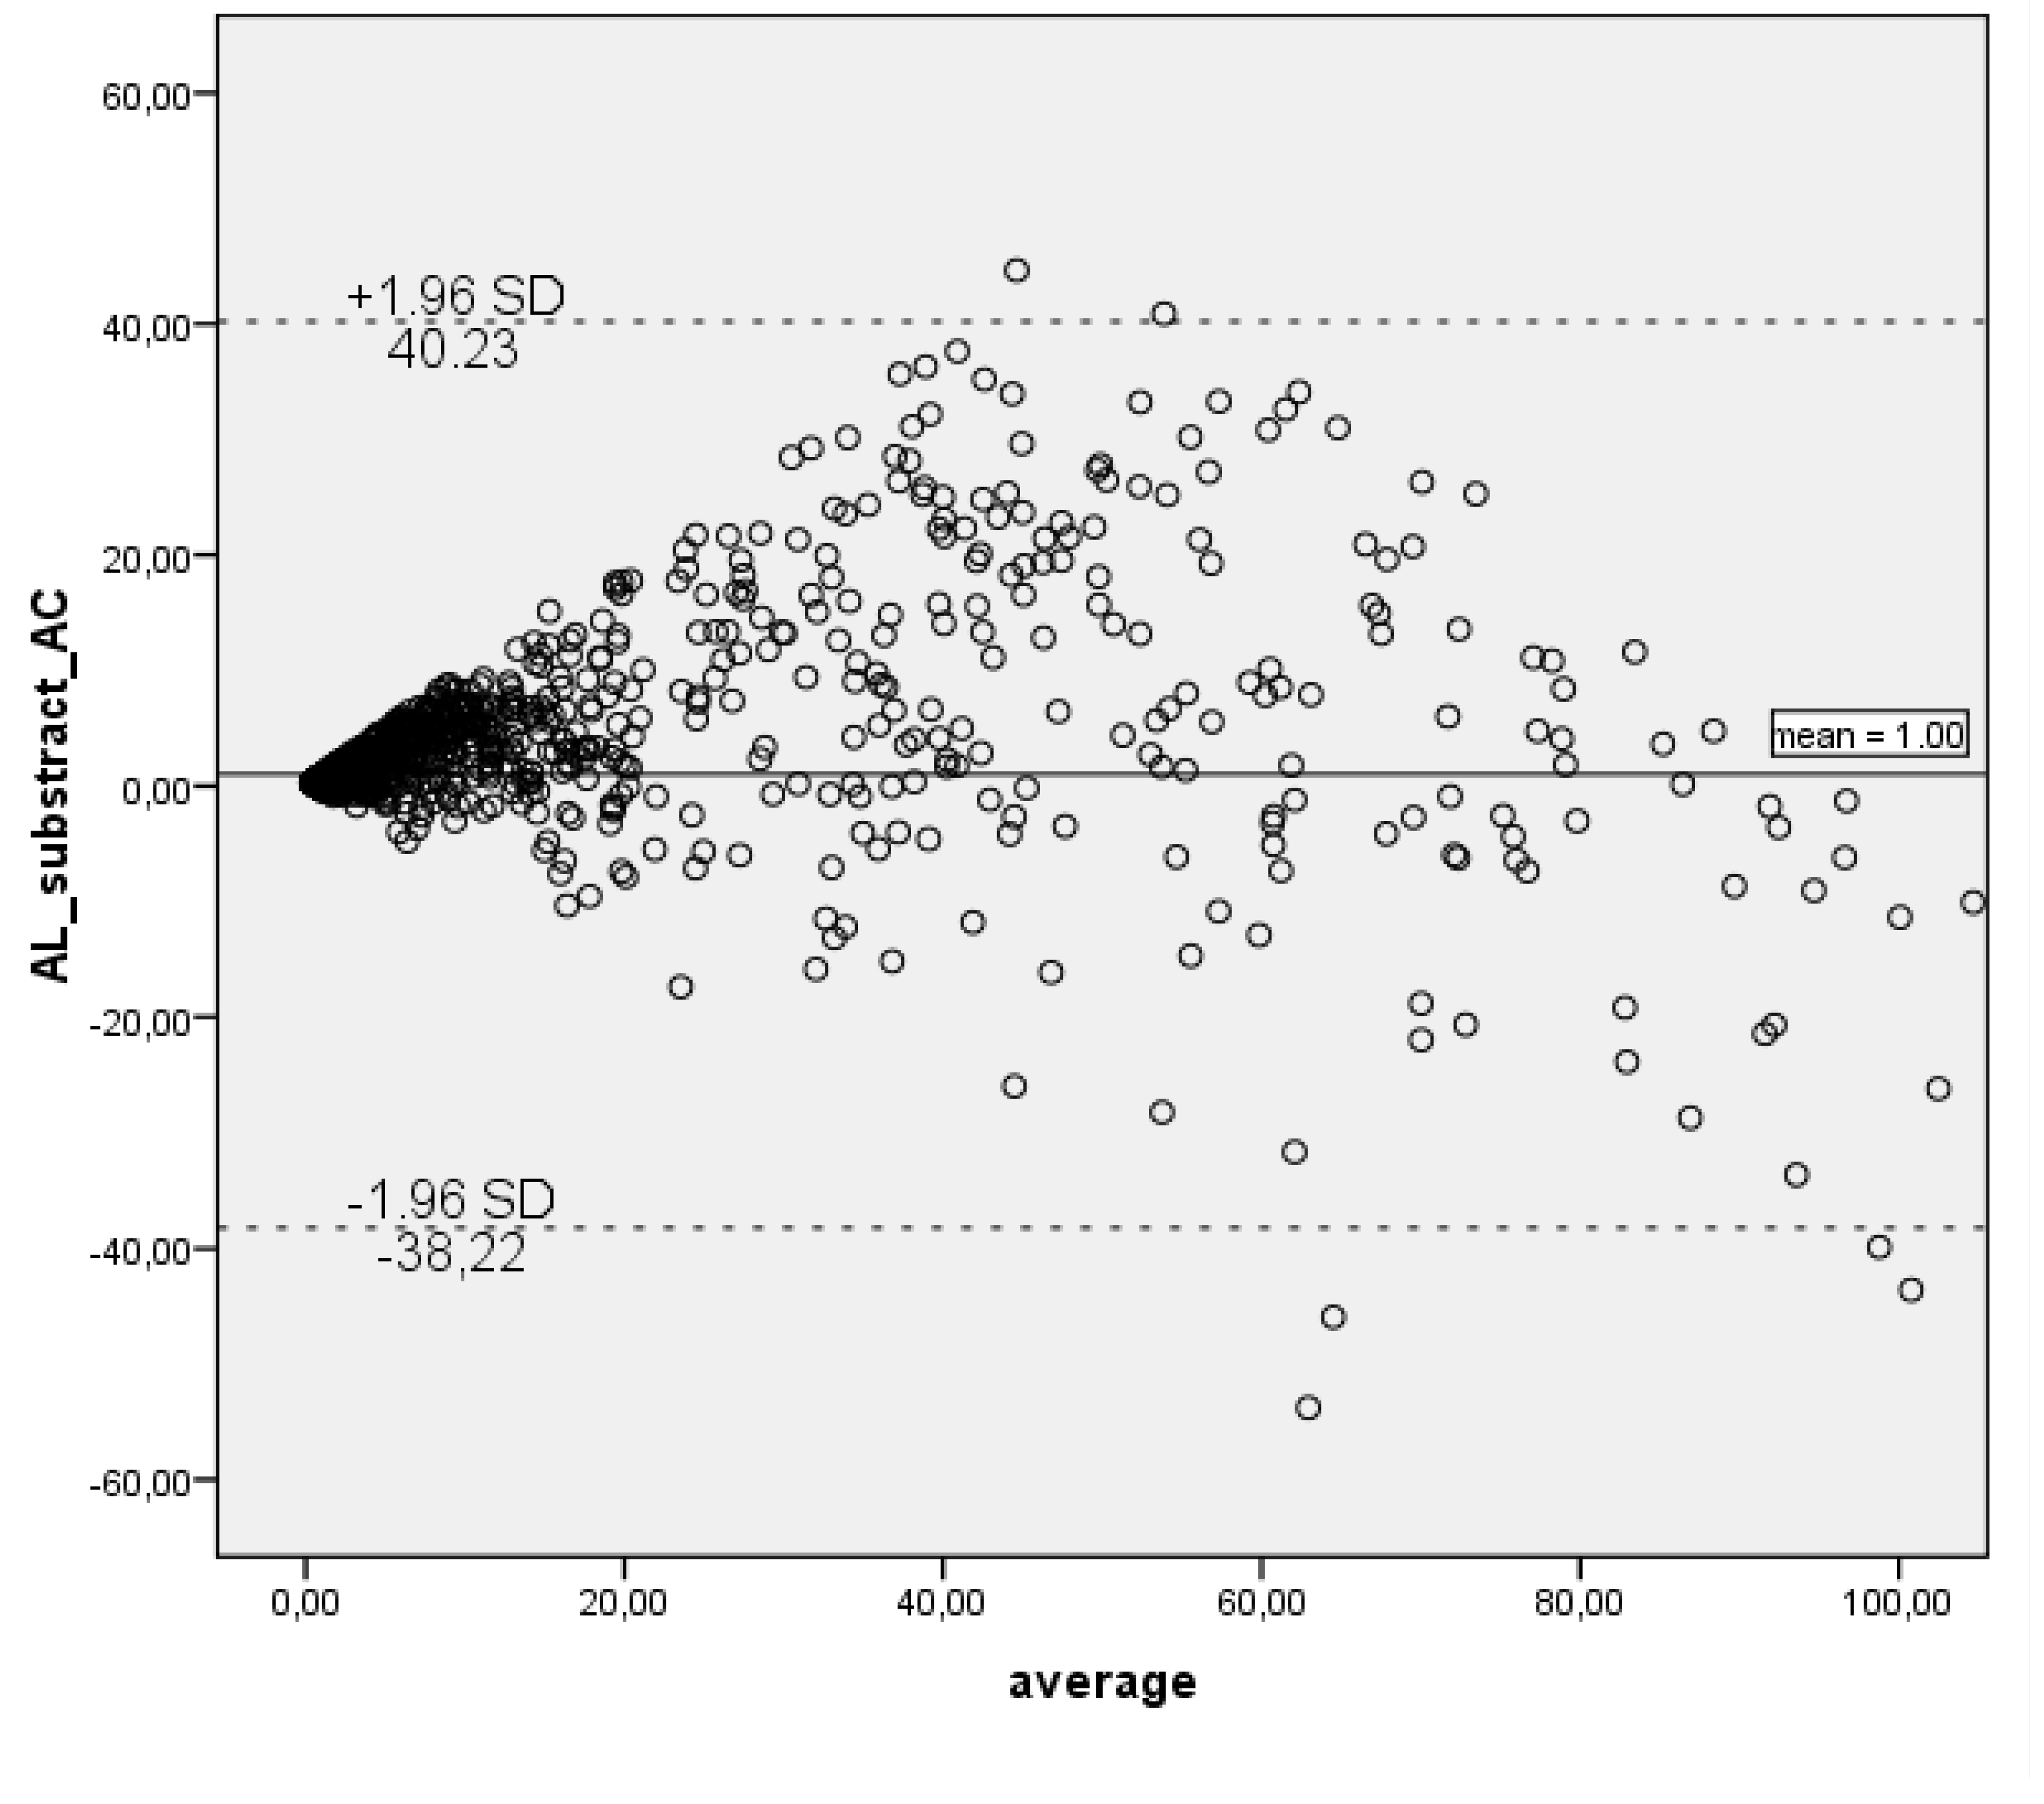

Table 1.
Study population.
| Total number of serum samples | 90 |
|---|---|
| Men, n (%) | 44 (49) |
| Women, n (%) | 46 (51) |
| Age, average (yr) | 24 |
| Age, median (yr) | 25.5 |
| Age, range (yr) | 1-57 |
| Locale | Vilnius, Lithuania |
| Final data set: | |
| Allergens studied, n | 31 |
| Complete records | 2790 |
Table 2.
AllergyChip 31 inhalant allergen performance assessment using ALEX2 test as a reference method.
Table 2.
AllergyChip 31 inhalant allergen performance assessment using ALEX2 test as a reference method.
| Allergen | protein family | TP (AL+ AC+) | FN (AL+ AC-) | FP (AL- AC+) | TN (AL- AC-) | ToP (AL+) | ToN (AL-) | AUC (95% CI) | PPA | NPA | OPA | k (95% CI) | k interpretation | Rs |
|---|---|---|---|---|---|---|---|---|---|---|---|---|---|---|
| Alt a 1 | Alt a 1-Family | 13 | 3 | 12 | 62 | 16 | 74 | 0.884 (0.785 - 0.983) | 81% | 84% | 83% | 0.533 (0.317 - 0.749) | Moderate | 0.610* |
| Lol p 1 | Beta-Expansin | 29 | 17 | 7 | 37 | 46 | 44 | 0.731 (0.622 - 0.840) | 63% | 84% | 73% | 0.469 (0.287 - 0.651) | Moderate | 0.587* |
| Phl p 1 | Beta-Expansin | 36 | 13 | 3 | 38 | 49 | 41 | 0.862 (0.784 - 0.940) | 73% | 93% | 82% | 0.649 (0.492 - 0.805) | Substantial | 0.818* |
| Der f 1 | Cysteine Protease | 32 | 3 | 4 | 51 | 35 | 55 | 0.951 (0.898 - 1.000) | 91% | 93% | 92% | 0.837 (0.721 - 0.953) | Almost perfect | 0.876* |
| Der p 1 | Cysteine Protease | 26 | 12 | 5 | 47 | 38 | 52 | 0.853 (0.767 - 0.939) | 68% | 90% | 81% | 0.603 (0.433 - 0.773) | Moderate | 0.740* |
| Phl p 2 | Expansin | 20 | 2 | 1 | 67 | 22 | 68 | 0.925 (0.828 - 1.000) | 91% | 99% | 97% | 0.908 (0.806 – 1.00) | Almost perfect | 0.941* |
| Phl p 5 | grass Group 5/6 | 26 | 2 | 4 | 58 | 28 | 62 | 0.958 (0.898 - 1.000) | 93% | 94% | 93% | 0.847 (0.73 - 0.965) | Almost perfect | 0.888* |
| Phl p 6 | grass Group 5/6 | 20 | 1 | 6 | 63 | 21 | 69 | 0.911 (0.827 - 0.995) | 95% | 91% | 92% | 0.799 (0.656 - 0.942) | Substantial | 0.775* |
| Can f 1 | Lipocalin | 20 | 7 | 2 | 61 | 27 | 63 | 0.974 (0.949 - 0.999) | 74% | 97% | 90% | 0.749 (0.593 - 0.904) | Substantial | 0.809* |
| Can f 2 | Lipocalin | 10 | 0 | 2 | 78 | 10 | 80 | 0.996 (0.986 - 1.000) | 100% | 98% | 98% | 0.897 (0.755 – 1.00) | Almost perfect | 0.875* |
| Can f 4 | Lipocalin | 15 | 2 | 4 | 69 | 17 | 73 | 0.959 (0.897 - 1.000) | 88% | 95% | 93% | 0.792 (0.631 - 0.953) | Substantial | 0.842* |
| Can f 6 | Lipocalin | 15 | 3 | 9 | 63 | 18 | 72 | 0.813 (0.678 - 0.948) | 83% | 88% | 87% | 0.63 (0.435 - 0.825) | Substantial | 0.670* |
| Equ c 1 | Lipocalin | 8 | 5 | 11 | 66 | 13 | 77 | 0.777 (0.590 - 0.964) | 62% | 86% | 82% | 0.396 (0.128 - 0.665) | Fair | 0.534* |
| Fel d 4 | Lipocalin | 18 | 2 | 5 | 65 | 20 | 70 | 0.933 (0.839 - 1.000) | 90% | 93% | 92% | 0.786 (0.635 - 0.938) | Substantial | 0.804* |
| Fel d 7 | Lipocalin | 13 | 7 | 16 | 54 | 20 | 70 | 0.809 (0.698 - 0.920) | 65% | 77% | 74% | 0.363 (0.138 - 0.588) | Fair | 0.507* |
| Mus m 1 | Lipocalin | 7 | 7 | 7 | 69 | 14 | 76 | 0.749 (0.579 - 0.919) | 50% | 91% | 84% | 0.408 (0.123 - 0.693) | Fair | 0.517* |
| Der p 7 | Mite Group 7 | 15 | 1 | 2 | 72 | 16 | 74 | 0.953 (0.863 - 1.000) | 94% | 97% | 97% | 0.889 (0.765 – 1.00) | Almost perfect | 0.858* |
| Der f 2 | NPC2 Family | 46 | 4 | 4 | 36 | 50 | 40 | 0.925 (0.855 - 0.995) | 92% | 90% | 91% | 0.82 (0.701 - 0.939) | Almost perfect | 0.894* |
| Der p 2 | NPC2 Family | 45 | 5 | 3 | 37 | 50 | 40 | 0.928 (0.868 - 0.988) | 90% | 93% | 91% | 0.821 (0.702 - 0.939) | Almost perfect | 0.881* |
| Der p 23 | Peritrophin-like protein domain | 24 | 14 | 2 | 50 | 38 | 52 | 0.887 (0.813 - 0.961) | 63% | 96% | 82% | 0.619 (0.45 - 0.789) | Substantial | 0.772* |
| Art v 1 | Plant Defensin | 20 | 5 | 3 | 62 | 25 | 65 | 0.92 (0.828 - 1.000) | 80% | 95% | 91% | 0.773 (0.623 - 0.923) | Substantial | 0.839* |
| Aln g 1 | PR-10 | 56 | 4 | 6 | 24 | 60 | 30 | 0.913 (0.851 - 0.975) | 93% | 80% | 89% | 0.746 (0.597 - 0.894) | Substantial | 0.743* |
| Bet v 1 | PR-10 | 73 | 2 | 1 | 14 | 75 | 15 | 0.977 (0.946 - 1.000) | 97% | 93% | 97% | 0.883 (0.753 – 1.00) | Almost perfect | 0.865* |
| Cor a 1.0103 | PR-10 | 41 | 29 | 1 | 19 | 70 | 20 | 0.92 (0.862 - 0.979) | 59% | 95% | 67% | 0.357 (0.169 - 0.545) | Fair | 0.790* |
| Bet v 2 | Profilin | 3 | 7 | 3 | 77 | 10 | 80 | 0.752 (0.592 - 0.912) | 30% | 96% | 89% | 0.318 (−0.08 - 0.717) | Fair | 0.395* |
| Phl p 12 | Profilin | 0 | 12 | 3 | 75 | 12 | 78 | 0.656 (0.520 - 0.793) | 0% | 96% | 83% | −0.056 (−0.544 - 0.432) | Less than chance | −0.073; p = 0.496 |
| Der p 21 | unknown | 20 | 2 | 5 | 63 | 22 | 68 | 0.938 (0.860 - 1.000) | 91% | 93% | 92% | 0.799 (0.656 - 0.942) | Substantial | 0.860* |
| Der p 5 | unknown | 21 | 2 | 14 | 53 | 23 | 67 | 0.915 (0.819 - 1.000) | 91% | 79% | 82% | 0.601 (0.424 - 0.778) | Moderate | 0.741* |
| Fel d 1 | Uteroglobin | 55 | 6 | 2 | 27 | 61 | 29 | 0.936 (0.881 - 0.991) | 90% | 93% | 91% | 0.804 (0.674 - 0.934) | Substantial | 0.894* |
| Art v | 18 | 6 | 9 | 57 | 24 | 66 | 0.824 (0.719 - 0.929) | 75% | 86% | 83% | 0.59 (0.401 - 0.779) | Moderate | 0.588* | |
| Sec c | 19 | 3 | 4 | 64 | 22 | 68 | 0.93 (0.856 - 1.000) | 86% | 94% | 92% | 0.793 (0.645 - 0.94) | Substantial | 0.815* | |
| Total allergens | 764 | 188 | 160 | 1678 | 952 | 1838 | 0.891 (0.876 - 0.906) | 80% | 91% | 88% | 0.721 (0.693 - 0.748) | Substantial | 0.792* | |
TP – true positive; FN – false negative; FP – false positive; TN – true negative; ToP – total of positives; ToN – total of negatives; AL+/- Alex2 positive / negative; AC+/- AllergyChip positive / negative; AUC – area under the curve; CI- confidence interval; PPA – positive percentage agreement; NPA – negative percentage agreement; OPA - overall percentage agreement; k – Cohen‘s kappa; Rs – Spearman‘s correlation; * - correlation is significant at the 0.01 level (2-tailed).
Disclaimer/Publisher’s Note: The statements, opinions and data contained in all publications are solely those of the individual author(s) and contributor(s) and not of MDPI and/or the editor(s). MDPI and/or the editor(s) disclaim responsibility for any injury to people or property resulting from any ideas, methods, instructions or products referred to in the content. |
© 2025 by the authors. Licensee MDPI, Basel, Switzerland. This article is an open access article distributed under the terms and conditions of the Creative Commons Attribution (CC BY) license (http://creativecommons.org/licenses/by/4.0/).
Copyright: This open access article is published under a Creative Commons CC BY 4.0 license, which permit the free download, distribution, and reuse, provided that the author and preprint are cited in any reuse.


