Submitted:
03 April 2025
Posted:
07 April 2025
You are already at the latest version
Abstract
The production and development of drug-loaded nanofibers by electrospinning are interesting because of their use as scaffolds in drug-delivery system applications. In the present study, Preparing the 50:50 polylactic acid: Gelatin and ZnO nanoparticles (PLA: GA: ZnO) scaffold nanofibers for loading the anti-inflammatory drugs naproxen and meloxicam at 0.1, 0.2, and 0.3 wt. % of each drug. The morphology results measured by scanning electron microscopy showed significantly increased diameters by 556±427, 566±437, and 1298±723 nm for 0.1%, 0.2%, and 0.3wt.% for naproxen, respectively compared with 352±245 nm for PLA: GA: ZnO. While the meloxicam revealed nanofibers with smaller diameters; the respective diameters for the ratios 0.1%, 0.2%, and 0.3% were 327 ± 163 nm, 312 ± 156 nm, and 333 ± 209 nm. Zinc oxide increases the crystal size, while the loaded drugs improve the degree of crystallization. Consequently, the fibers turn into a low-crystalline structure. FTIR spectroscopy results indicated no chemical interaction between the polymers. Moreover, adding zinc oxide nanoparticles to the blend polymer fibers increased the surface's free energy by 56.31±1.69 mJ.m-2 and reduced the contact angle to 83.16 ± 2.49°. Conversely, both naproxen and meloxicam increased the contact angle and reduced the surface's free energy, reaching values of 116.14 ± 3.48°, 114.4 ± 3.43°, 37.05±1.11 mJ.m-2, and 38.78±1.16 mJ.m-2 In addition, the drugs accelerate the thermal degradation of the polymer matrix. The maximum cumulative release for drug samples at 21 days was 97.62±4.88%, and 93.75±4.53 % for NAP and MEL respectively, while 87.24±4.24% for PLA: GA: ZnO. The kinetic model for samples showed the Korsmeyer-Peppas more suitable in this study, the burst release of 60.66% and 55.67% drugs from NAP and MEL Nano fibrous formulations was observed during the first 24 h. The diffusion coefficient (n) values of all nanofiber samples were found to be n < 0.45, confirming that the drug release mechanism follows Fickian diffusion. Naproxen produced a diameter of inhibition zones (MIC) at a stuck solution (MIC1000) of 17± 3.7 mm against S. aureus and 16±3.1 mm against E. coli, while meloxicam showed MIC1000 of 18±3.4 mm and 17±3.7 mm against S. aureus and E. coli, respectively. All dilution ratios of the drug solutions showed antibacterial activity. All samples showed no cytotoxicity, with cell viability ranging from 81% to 98.5%, confirming their biocompatibility. In addition, the naproxen showed the low half-maximal inhibitory concentration (IC50) value indicates that the drug is effective at low concentrations. The statistical analysis of all samples (P< 0.05)
Keywords:
drug delivery
; PBS solution
; zinc oxide
; naproxen
; meloxicam
; MTT assay
; antibacterial activity
1. Introduction
Electrospinning has received great attention among nanofibrous scaffolding production methods due to its simplicity and low cost [1,2,3,4]. To design and prepare nanofibers that act as drug delivery systems, they must have important properties such as drug loading and drug retention efficiency. Drug release kinetics such as zero-order, first-order, Higuchi, and Korsmeyer-Peppas are often used to analyze the release mechanism of drugs. To date, more than 100 different polymers have been used to produce nanofibers with different properties [5,6]. Antibacterial nanofibers are typically produced by incorporating drugs or antibacterial agents into their structure, such as the zinc oxide (ZnO) nanoparticles [7,8]. In addition, it increases the water uptake ability and the fibers’ hydrophilicity [9]. Use the appropriate concentration from ZnO nanoparticles, which does not exceed 2% by weight, so as not to cause clumping and prevent water absorption, in addition to enhancing the speed of drug release and contributing to resistance to bacteria [10]. The benefit of using nanoparticles in drug delivery is that they control the release rate and allow for the encapsulation of hydrophobic molecules[11].The type of polymer, the properties of the drug, and the method of drug loading result in nanofibers with a drug content as low as 60% (w/w)[12].Many biodegradable and/or biocompatible polymers can be used to make therapeutic dressings [13,14,15,16]. Polylactic acid (PLA) is an attractive polymer due to its biodegradability and biocompatibility and low levels of immunogenicity [11], making it widely used in fabricating tissue-engineering materials such as scaffolds and drug delivery systems [17,18,19]. Gelatin is a natural polymer derived from collagen found in animal skin and bones. Gelatin has a high water-retention property and can completely degrade within the body, making it an ideal substitute for the original extracellular matrix (ECM) [20,21]. There are many biocompatible and biodegradable biomaterials, including bovine serum albumin (BSA), gelatin, zein, polycaprolactone (PCL), polylactic acid (PLA) and chitosan used in oral drug delivery systems [22,23,24]. Nonsteroidal anti-inflammatory drugs (NSAIDs) such as naproxen and meloxicam are used as analgesic and anti-inflammatory agents that have inhibitory and protective effects against cancer cells [25,26,27]. The morphology of the electrospun nanofibers is influenced by the physical and chemical properties of the incorporated drug, especially its solubility in the solvent used [28]. The therapeutic substance is introduced into the body through formulations or devices known as drug delivery systems (DDS), through which the drug molecules or therapeutic agents are loaded, improving their efficiency and safety [29]. Nanofibers are the most attractive material for biomedical applications because they easily absorb drug molecules [30,31]. In addition, they possess various properties, such as high mechanical properties [32,33], high porosity [34,35], and low density [36]. All these properties make nanofibers an ideal vehicle for drug delivery [37]. Electrospinning parameters such as fiber morphology (fiber diameter), polymer concentration, solvent type, electrical conductivity, and viscosity play an important role in drug release [38]. Heterogeneous drug distribution in the polymer matrix during the drying and storage steps results in burst release. In contrast, uniform drug distribution in the polymer matrix results in release rates that decrease continuously over time [39,40]. In addition, the benefits of NAP-loaded nanofibers by electrospinning local pain treatments [41]. Meloxicam (MEL) has a crystal structure and low water absorption. It is considered a non-steroidal anti-inflammatory that selectively prevents CYCLO-oxygenase-2. It is usually used to treat pain or inflammation [42]. In this study, biopolymers such as gelatin and polylactic acid were used, and the biodegradability and antibacterial ability of the polymer fiber blend were enhanced by adding ZnO nanoparticles to form a nonwoven fiber network to transport naproxen and meloxicam particles via drug delivery system.
2. Experimental Part
2.1. Materials and Instrumentations
Polylactic acid (PLA) powder (20-80 mesh) was obtained from BASF, Ludwigshafen, and Gelatin (GA) 99% pure, yellow-colored powder was obtained from HIMedia Laboratories, Mumbai, Maharashtra, India. Zinc oxide was obtained from Nanjing High Technology Nano Material Co., Nanjing, Jiangsu, China, with purity > 99.5% and diameter < 30 nm. Solvents such as dichloromethane (DCM) with purity 99.9% and MW 84.93. Trifluoroacetic (TFA) with molar mass (M) 114,02 g/mol and purity ≥99,9 % was obtained from Loba Chemie Pvt. Ltd., Mumbai, Maharashtra, India. Phosphate-buffered saline (PBS) tablets were purchased from Medicago Inc., Quebec, Canada. Drugs such as naproxen and meloxicam were obtained from Pioneer Pharmaceutical Co., Sulaymaniyah, Republic of Iraq. The morphology of the nanofibers was analyzed using field emission scanning electron microscopy (FESEM) (MIRA3 TESCAN, France). Fourier transform infrared spectroscopy (FT-IR) (FT-NIR, USA) was employed to determine the type of bonding between the added nanoparticles and the polymer matrix. The agar well diffusion method evaluated the antibacterial activity against Staphylococcus aureus (S.aureus, Gram-positive) and Escherichia coli (E.coli, Gram-negative). The wettability of the fibers was determined by measuring the contact angle using a G10 Kruss, Germany. The ultraviolet-visible UV-visible (UV_1800, Japan) examination of the release solutions showed the amount of adsorption obtained. MTT ASSAY was performed in vitro on the L929/A cell line to evaluate the cytotoxicity of the samples. The nanofiber samples’ crystallinity properties were determined by X-ray diffraction (p-XRD) (Phillips, The Netherlands). The thermal properties and thermal stability of the nanofibers were investigated by using differential scanning calorimetry (DSC-TGA, BAHR, Germany).
2.2. Preparation of Polymer Solutions and Electrospinning Conditions
A 50:50 mixture of polylactic acid and gelatin was prepared, with the polymer concentration of each solution being 10 wt.%. The PLA solution involved dissolving 1 g of polylactic acid in 9 g of dichloromethane (DCM) solvent with a molar mass of 84.93 g·mol−1. The same ratios were used to prepare the GA solution, which involved dissolving 1 g of gelatin in 9 g of trifluoroacetic acid (TFA) solvent with a molar mass of 114.023 g·mol−1. Afterward, ZnO nanoparticles were added to the mixture in a 50:50 ratio of 2 wt.%. The final procedure was to incorporate drugs into the PLA: GA: ZnO mixture, where six mixtures were made, three of which included naproxen or meloxicam in the ratios of [0.1, 0.2, and 0.3 wt.%]. All polymer blends were prepared at room temperature and mixed using a magnetic stirrer to achieve the desired homogeneity. All the prepared blends were transferred into a 1.0 mL syringe at a constant feeding rate of 1.0 mL/h using an MS-2200-Daiwha syringe infusion pump. The continuously applied voltage was ±16 kV, the distance between the needle and the collector was 15 cm, and the relative humidity was not more than 40%. After completing the required process, the synthesized nanofibers were collected at room temperature.
2.3. Cumulative drug release
Cumulative percent drug release refers to the total percentage of a drug released from a pharmaceutical formulation over a specific time period. To prepare the phosphate buffer 0.01 M, pH 7 was achieved by immersing one tablet of phosphate-buffered saline (PBS) in 200 ml of distilled water. 10 mg of each fiber sample was immersed in 1 ml of buffer solution for a duration ranging from 2 to 21 days. The amount of the substance released into the buffer solution at 37 ℃ for each time point was measured using a UV spectrometer (UV_1800, Japan) by determining the optical absorbance. The release rate of the drug was calculated using the following equation [43]:
Release = Mt / Mn ×100
Where Mt is the amount of drug released at a given time and Mn is the total amount of drug incorporated into the nanofibers.
2.4. Swelling and Degradation
After the specified release period, the fibers previously immersed in the buffer solution were removed, wiped with filter paper to remove the residual moisture, and weighed at room temperature. The degree of swelling was calculated according to the following equation [44]:
Swelling ratio (%)= (Ws- Wd) / Wd ×100
Ws is the weight of swollen nanofibers after removing excess moisture using filter paper, while Wd is the weight of nanofibers that were dried under vacuum conditions at 50°C.
The hydrolysis of the fibers was studied by measuring the residual mass, where the swollen nanofibers were washed with distilled water several times to remove impurities and then placed in a drying under vacuum conditions at 50°C. The degradation of fibers was calculated by the following equation [45]:
Degradation % = (Wi – Wd) / Wi ×100
Wi, Wd represents the nanofibers’ initial/original weight before immersion and subsequent oven drying. `
2.5. Antibacterial and MTT Assays
2.5.1. Antimicrobial
The agar dilution method means that the prepared antibiotics need to be dissolved first to obtain a stock solution and then diluted to obtain a suitable initial concentration. On the other hand, E. coli and S. aureus were used as Gram-negative and Gram-positive bacteria, respectively. Suspensions were prepared by growing bacterial colonies in a liquid medium and incubating them for four to eight hours at 37°C, approximately 1 × 10⁴ CFU/spot. A cotton swab was dipped in the suspension and then used to wipe the surface of a Mueller Hinton (MH) agar tray. Pores of 7 mm diameter were created using a sterile cork punch and then filled with different concentrations of sample release solutions at 21 days (as shown in section 2.3).
To determine the minimum inhibitory concentration (MIC) by dilution methods, antibiotics are also needed in a substance that requires preliminary dissolution to obtain a stock solution and then dilution to obtain an appropriate starting concentration. A diluter, such as a phosphate buffer, was used to prepare the antibiotics. The stock antibiotics solution was divided into 50%, 25%, and 12.5% for each sample. The Petri dishes were then incubated at 37°C for 24 h are used to make working solutions in Mueller-Hinton agar [46].
2.5.2. MTT Assay
A colorimetric assay (MTT ASSAY) was performed on mouse cells (L929) to evaluate the cytotoxicity of the samples using the serial dilution method. The cells were seeded in 96-well plates at a density of 1*104 cells/well, and the final volume was 200 μL. The cells were treated with different concentrations of the release solutions of the nanofiber samples and incubated for 24 hours. A 10 μL of tetrahydroxylated MTT solution (0.5 mg/ml) was added to each well and then incubated for 3 h at 37°C. Metabolically active cells reduce tetrahydroxylated MTT tetrazolium into purple formazan crystals. Subsequently, 100 μL of dimethyl sulfoxide DMSO was added to dissolve the crystals. The absorbance at 570 nm was measured using a plate reader, where the absorbance value was directly proportional to the number of viable cells.
2.6. Statistical Analysis
Statistical analysis was performed for all data, and the results are presented in the figures as mean ± standard deviation. A one-way ANOVA (Single Factor) analysis of variance was performed. All the experimental results of solubility and single medium dissolution tests are expressed as mean ± standard deviation and statistically compared by a two-sample t-test. Significant differences were considered as p-value less than 0.05, while those with p-value less than 0.01 were considered highly significant. Tukey HSD (Honestly Significant Difference) test for determination of the largest value of the difference between two group means.
3. Results and Discussion
3.1. Surface Morphology of Nanofibers
To determine the morphology of the electrospun fibers, field emission scanning electron microscopy (FE_SEM) analysis was performed, and the results provided images of drug-loaded nanofibers. The images were processed to obtain fiber diameter by using ImageJ (National Institute of Health, Bethesda, MD) to determine the average diameters of at least 50 fibers. Table 1 and Figure 1 show the diameter measurements, the diameter of samples range within nanometers and 5 μm FESEM images, and their fiber distribution. Figure 1B shows an increase in fiber thickness and viscosity with agglomeration due to the addition of ZnO [47,48]. As the ZnO nanoparticles increased, the fiber diameter increased from 182±77 to 352±245 nm. The ZnO nanoparticles have a large surface area, which contributes to the increase in viscosity, as it increases the rate of interaction between solution molecules. Viscosity is an important factor in determining the shape of the resulting nanofibers [49]. Naproxen (NAP) - loaded PLA: GA: ZnO nanofibers showed significant increases in fiber diameters of 556±427, 566±437, and 11298±723 nm when loaded at 0.1%, 0.2%, and 0.3 wt.%, respectively. The thickness of the fibers increases proportionally with the increase in NAP concentration (Figure 1c, d, e); the results are in agreement with a previous study [50].
The diameters and ranges of the blend and composite nanofibers were analyzed to determine their structural properties, as shown in Table 1. The meloxicam (MEL)-loaded PLA: GA: ZnO nanofibers showed thinner nanofibers with diameters of 327 ± 163, 312 ± 156, and 333 ± 209 nm at 0.1 wt.%, 0.2 wt.%, and 0.3 wt.% MEL concentration, respectively.
The 0.2% MEL concentration revealed nanofibers with thinner thickness, indicating a larger surface area to volume ratio and better dispersion of drug molecules within the polymer matrix compared to other concentrations. Scanning electron microscope (SEM) images of the electrospun fibers showed smooth and porous structures, as shown in Figure 1F. According to the FESEM images as shown in Figure 1, we notice the discrepancy between the fiber diameters, which leads to a large increase in the standard deviation because the solvents used are fast volatile during the electrospinning process compared to solvents such as dimethyl formaldehyde. The velocity of volatilization leads to an increase in jet viscosity, and these changes inhibit both bead formation and jet thinning as well as increase the solidification rate [51].
3.2. X-Ray Diffraction Analysis
The crystalline size of the samples was calculated using the Debye-Scherrer formula [52]:
D = k*λ / β*cosθ
Where D is the crystalline size, K is Scherrer’s constant (0.98), λ denotes the wavelength (Å), β represents the full width at half maximum (FWHM), and θ is the maximum peak angle (rad).
Bragg’s equation was used to calculate the distance between the planes (d-spacing) [53]:
N λ = 2d sinθ
Where n is the deflection integer.
Crystallinity was evaluated using the Segal method, which is represented by the equation below [54]. The method provides the percentage of crystallinity of the material by comparing the crystalline and amorphous regions.
C (%) = (Ic / I) × 100%
Where “C” expresses the relative degree of crystallinity, “I”, is the crystalline and amorphous regions, and “Ic” is the crystalline portion [55]. Figure 2 shows the diffraction patterns of the nanofibers loaded with drug particles. Table 2 shows the results of crystal properties, such as interplane distance (d-spacing), full width at half maximum (FWHM), crystal size, and crystallinity.Samples (PLA:GA) Q1, (PLA:GA :ZnO) Q2,(PLA:GA:ZnO-0.1% NAP) Q3, and (PLA:GA:ZnO-0.2%MEL) Q4 exhibited broad peaks at 2θ ≈ 23.17°, 22.39°, 23.18°, and 22.89°, respectively. PLA is a semi-crystalline polymer that consists of both crystalline and amorphous phases [56]. The broad peak at 2θ ≈ 23.17° observed upon the addition of GA to PLA indicates that GA, as an amorphous polymer, does not affect the crystallinity of PLA [57]. The peak persisted after the addition of ZnO nanoparticles but shifted to a lower 2θ angle [58]. This shift suggests an interaction between the ZnO particles and the polymer backbone, leading to a drop in the degree of crystallinity. However, the crystal’s size increased, as it is influenced by the full width at half-maximum (FWHM) according to equation 4. Naproxen and meloxicam-loaded fibers showed an increase in the FWHM to 9.38 (Q3) and 9.24 (Q4), respectively, resulting in a decrease in crystallite size and an enhancement in the degree of crystallinity. This indicates a structural shift of the fibers toward a more amorphous state. The decrease in crystal size indicates the physical mixing or dissolution of the drug molecules within the polymer matrix, ensuring the effective incorporation of the drug. The incorporation of drugs into the polymer matrix limits the recrystallization time, resulting in the formation of amorphous emulsions or solid solutions [59]. The increase in the evaporation rate during the electrospinning process of solvents leads to a decrease in the degree of crystallinity. Therefore, we notice that the degree of crystallinity of sample Q2 is low even though the ZnO nanoparticles have a wurtzite structure [60].In addition of the crystalline structure depends on the process parameters (applied voltage and flow rate) and solvent medium (evaporation rate and polymer–solvent interaction [61].
3.3. Surface Wettability
Contact angle measurements were performed to evaluate the wettability of the samples by placing a drop of distilled water on the fiber surfaces. Contact angle analysis is a direct method to determine the free energy of the surface of the material. Figure 3A shows the contact angles at different time intervals (20, 40, and 60 s), while Figure 3B shows the correlation between contact angle and surface free energy, the testing created three times for each sample. Gelatin is a hydrophilic polymer and is in sharp contrast to polylactic acid, which is highly hydrophobic. Modifications to both the bulk and surface properties of materials can enhance their wettability. Thus, GA has been incorporated into PLA to improve the wettability of nanofibers [62,63]. Sample Q1, which consisted of GA and PLA fibers, showed a low contact angle of 90.65 ± 1.72°, indicating that the addition of gelatin significantly enhanced the water absorption capacity of the fibers [64]. The combination of these two polymers significantly improved the wettability of the fibers. Moreover, adding zinc oxide nanoparticles to the blend polymer fibers increased the surface’s free energy up to 56.31±1.69 mJ.m-2 and reduced the contact angle to 83.16 ± 2.49° for sample Q2, compared to sample Q1 [47]. In addition, ZnO nanoparticles increase the water absorption of electrospun nanofibers by forming hydrogen bonds with water molecules [65]. Conversely, both naproxen and meloxicam increased the contact angle and reduced the surface’s free energy, reaching values of 116.14 ± 3.48°, 114.4 ± 3.43°, 37.05±1.11 mJ.m-2, and 38.78±1.16 mJ.m-2, respectively. The contact angle increases strongly with the increase in the rate of solvent evaporation or the decrease in its boiling point, so you will find that the value of the contact angle differs according to the type of solvent used [66]. In general, all tested samples were hydrophilic, and the decrease in contact angle values was associated with a significant enhancement in the drug dissolution rate [67]. The statically of the above results were Tukey HSD (P-value was 0.00116), and Tukey HSD inference was P< 0.01.
3.4. Fourier Transform Infrared Analysis
Fourier transform infrared (FTIR) spectroscopy was used to investigate the interactions between polymer blend chains, ZnO nanoparticles, and drug particles in the nanofibers. Figure 4 shows the FTIR spectra of the samples, covering a range of 500 to 4000 cm-1, to determine the structural characteristics of the nanofibers. A prominent peak was observed at 3332 cm-1, corresponding to the N-H stretching vibration within the amide region. This peak confirms the presence of gelatin in the nanofiber structure, as gelatin is a polymer rich in amino acids and contains hydroxyl groups in its side chains, particularly observed for sample Q1. Two peaks were identified at 2964 cm-1 and 1365 cm-1, corresponding to the bending vibrations of the asymmetric and symmetric -CH₃, respectively. In addition, the peak at 1776 cm-1 represents the C=O bond, which indicates the presence of PLA, which contains the characteristic of a carbonyl group. The stretching vibration peak at 1504 cm-1 is attributed to the amide II group of gelatin, resulting from the interference between N–H bending and C–N stretching vibrations [68,69]. New peaks at 883 cm-1, 1409 cm-1, and 1543 cm-1 appear upon the addition of ZnO nanoparticles. In addition, several peaks observed in the 1700–600 cm-1 range can be attributed to the vibrations of C=O, C–O, C–C, and C–H bonds that are assigned to Zn-O vibrations of ZnO nanoparticles that indicate the nanofibers are composed of PLA: G and ZnO.The NAP peaks observed in the region of 800–1800 cm−1 include peaks at 1776 cm−1, indicating the C=O (carbonyl) stretching vibration, at 1681 cm−1, attributed to (C–C) modes of the aromatic groups, at 1367 cm−1 associated with CH3 bending vibration, and at 1193 cm−1 indicative of the C=O stretching vibration. The vibration modes detected at 1012 and 846 cm−1 correspond to NAP’s C–O–C bonds [50]. The FTIR spectrum of sample Q4. After adding meloxicam, it shows two distinct peaks at 3062 cm−1 due to the stretching vibrations of N–H, and 1161 cm−1 corresponding to the S=O stretching vibrations of meloxicam [70]. The interactions between the added ZnO nanoparticles and the drugs in the nanofibers were analyzed, and no significant change was observed in the characteristic peaks, as shown in Figure 4.
3.5. Thermal Analysis
Figure 5A illustrates the TGA curves of samples Q1, Q2, Q3, and Q4, respectively. The PLA: GA blend (sample Q1) exhibited a single-step weight loss within the temperature range between 273 °C and 322 °C. Upon the addition of zinc oxide (sample Q2), the weight loss percentage increased by 4.8% compared to Q1, with four distinct stages of weight loss observed: 62–103°C, 213–278°C, 368–455°C, and 724–865°C, respectively. The addition of ZnO nanoparticles reduced the thermal stability of the polymer matrix, as ZnO accelerated the degradation of the PLA electrospun mat [71]. The nanofibers (sample Q3) showed three weight-loss steps of 110–180°C, 224–267°C, and 625–778°C, with an increased weight loss of 12.5 %, exceeding that of neat PLA: GA nanofibers. Similarly, the nanofibers (sample Q4) exhibited three weight-loss steps of 66–143°C, 226–284°C, and 408–484°C, with an even greater weight loss increase of 21.14% compared to neat PLA: GA nanofibers. These findings confirm that the incorporation of NAP and MEL particles into the blend nanofibrous structure accelerates the thermal degradation of the polymer matrix [50,70]. This result is confirmed by prior studies of surface wettability and nanofiber surface morphology.
Figure 5B represents the DSC thermal curves for the same samples. Endothermic peaks were observed in the DSC curves after the addition of ZnO and drug particles. For sample Q2 (with ZnO), the onset temperature (Tonset) was 64.56°C, with an endothermic peak temperature (Tpeak) of 75.26°C and an enthalpy value of 645.1 J/g. For sample Q3 (with NAP), the Tonset was 117.85°C, the Tpeak was 145.37°C, and the enthalpy value was 5329 J/g. For sample Q4 (with MEL), the Tonset was 101.18°C, the Tpeak was 110.25°C, and the enthalpy value was 2979 J/g. The presence of endothermic peaks in the DSC curve indicates that the composite nanofibers become more degradable after the addition of ZnO, NAP, and MEL compared to the PLA: GA nanofibers. These results are consistent with a previous study [50,67].
3.6. Release, Swelling, and Degradation Measurements
Figure 6 shows the relationship between time and the cumulative percentage of drug release for the nanofiber samples. Release studies were performed in phosphate buffer solution (pH = 7.2) to maintain neutral conditions, ensuring drug solubility was not hindered. The results showed a sustained release trend for samples Q1 and Q2, starting with an initial release phase followed by a steady release phase. Sample Q1 of gelatin-polylactic acid nanofibers (PLA: GA nanofibers) showed a release of 58.13%±2.90 on day 4, followed by a steady release reaching 83.64± 4.18 % on day 14. Sample Q2 of ZnO nanofibers showed a more pronounced initial release, with 50.45±2.52 % of the drug released after only 2 days of immersion. This rapid release is likely attributed to the highly soluble ZnO particles present on the surfaces of the fibers. Zinc oxide (ZnO) nanoparticles play a major role in drug delivery due to their important properties, such as non-toxicity, good biocompatibility, and non-immunogenicity [72]. In addition, the ZnO nanoparticle enhances the cumulative release of drugs [73]. The second stage was a steady continuous trend from day 14 to day 21 at 86.60± 4.34%. Samples Q3 and Q4 showed a higher release index compared to sample Q2. Meloxicam showed a slower increase in release, while naproxen showed a faster release because of the hydrogen bonds of NAP dimer. A burst release followed by a steady release, the maximum cumulative release for all samples at 21 days were 83.92±4.19%, 87.24±4.24, 97.62±4.88%, and 93.75±4.53 % for Q1, Q2, Q3, and Q4, respectively. The high standard deviation of the diameters of the produced nanofibers, as shown in Table 1, is likely to affect the drug-release behaviors of the fibers, which is what was obtained in a previous study on the subject [74]. The statically of the above results were Bonferroni (P-value was 0.041) and Holm Inference was P< 0.05
The drug release process is affected by several factors, including the swelling ability of the fibers, the solubility of the drug within the polymer matrix and release medium, and the rate of diffusion of drug molecules from the polymer matrix into the surrounding environment [75]. The fluid absorption ability of the electrospun nanofiber samples was evaluated using gelatin, a hydrophilic protein [76], which enhances the water absorption properties of hydrophobic PLA.
Figure 7A indicates that the swelling index of the blend fibers reached its highest value of about 73.3±3.56 % on the eighth day. The addition of ZnO nanoparticles further improved the swelling by increasing the water absorption of nanofibers and creating hydrogen bonds with water molecules. The swelling index increased to 65.11± 3.25 % on the fourth day, 72.19± 3.52 % on the sixth day, and 72.90±3.77 % on the 21st day. The combination of naproxen and meloxicam further enhanced the swelling index of the fibers. The highest rates of swelling were observed for both drugs on eight days, reaching approximately 80.75±4.04 % for naproxen and 76.90± 3.86 % for meloxicam. Figure 7B shows the degradation of samples Q1, Q2, Q3, and Q4 over different periods. PLA is a hydrophobic polymer, while gelatin, as a hydrophilic polymer, allows water molecules to enter its structure, which breaks its chains and facilitates its decomposition/degradation. For sample Q1, the degradation index reached 46.54±2.33 % on day 2 in PBS at pH 7.2, increased to 54.70±2.73 % on day 4, and stabilized between 60.05±3.0 to 60.72±3.03 % from day 14 to day 21. The addition of ZnO nanoparticles, with their high surface area and numerous active sites, enhanced the degradation process, peaking at 64.03±3.2 % on day 8 in PBS at pH 7.2. Drugs incorporated into the fibers increased degradation rates, with naproxen-loaded fibers reaching a maximum degradation index of 76.23±3.91 % and meloxicam-loaded fibers peaking at 74.3±3.81 %, both at day 21 in PBS at pH 7.2. Fiber degradation plays a crucial role in the drug release process and supports extracellular matrix (ECM) regeneration, providing sufficient space for cell proliferation [77,78].The pH of nanofibers plays an important role in the wound healing process, as an acidic or alkaline environment can affect bacterial growth and thus the speed of wound healing [79]. Figure 7C shows the pH values of fiber samples over several days at room temperature RT.
An initial decrease in the pH value of gelatin and polylactic acid nanofibers was observed, reaching 6.6±0.137 after 4 days, likely due to acidic by-products resulting from the degradation of polylactic acid PLA [80]. By day 6, the solution reaches a nearly neutral value (pH = 6.7±0.134), probably due to the buffering effect of gelatin attributed to the amino acid chains and the carboxyl group of polypeptide chains [81].
Sample Q2, which contained ZnO nanoparticles, showed a slight pH fluctuation compared to sample Q1. The pH peaked at 6.85±0.137 on day 8, which is a favorable value for bacterial inhibition and wound healing. It is worth noting that the optimal pH for wound healing is between 5.5 and 6.5 [82].
The drug-loaded nanofibers created a slightly more acidic environment than Q2, with the pH values of naproxen and meloxicam-loaded fibers ranging from 6.7 to 6.8. The highest pH was observed in the naproxen-loaded fibers, reaching 7.1±0.146 and 7.05 ± 0.141 on day 8. The statistical swelling and degradation indexes and PH results were Tukey HSD (P-value 0.015, 0.001, and 0.0084), and Tukey HSD inferfence were P< 0.05, P< 0.001, respectively.
3.7. Drug Release Kinetics Models
Drug release kinetics describe the mechanism and rate of drug release from the fibers over time. In this study, four pharmacokinetic models were employed to analyze the release profiles: the zero-order model, the first-order model, the Higuchi model, and the Korsmeyer-Peppas model [83,84]. The zero-order and first-order models are primarily used to understand the kinetics of drug release, while the other models help explain the underlying mechanisms of the release process [85]. The zero-order drug release rate is based on the constant release of the drug regardless of its content and is a function of the release time. Meanwhile, the first-order drug release rate is based on residual concentration [86]. The Higuchi model expresses the amount of drug released from the fiber as a function of the square root of the release time. On the other hand, the Korsmeier-Pippas model expresses release phenomena involving diffusion or swelling [87]. The kinetic parameters were obtained by linear regression on Microsoft Excel.
Zero order: Q = Q0 - K0 t
First order: log Q = logQ0 - k1 t / 2.303
Higuchi: log Q = 1/2 log t + log KH
Krosmeyer _ Peppas: log (Mt / Mꚙ) = n log t + log KKP
Where Q and Q0 are the loaded drug content and drug released from nanofibers after time t, respectively. K0, K1, KH, and KKP are the constants of the zero-order model, the first-order model, the Higuchi model, and the Korsmeier-Pippas model, respectively. Mt/Mꚙ represents the fraction of the released drug at time t, and n is the diffusional coefficient. Mt is the cumulative amount of drug released at time t, while M∞ is the initial loading of the drug.
Table 3 shows the pharmacokinetic parameters of drug release from the prepared nanofibers according to different kinetic models. It is shown that all the nanofiber samples adhered to the Korsmeier- Pippas model, based on the high coefficient of determination (R²). The R² values for Q1, Q2, Q3, and Q4 were 0.934, 0.91, 0.96, and 0.95, respectively, with the highest values for Q3 and Q4, indicating that these samples represent the best nanofiber formulations. The Korsmeier-Pippas model, which explains the drug release from a polymer system [88], is in good agreement with the polymeric system in this study. The diffusion coefficient (n) values of all nanofiber samples were found to be n < 0.45, confirming that the drug release mechanism follows Fickian diffusion, which indicates a diffusion-controlled mechanism [89]. Figure 8 shows fitting data to the Korsmeyer-Peppas kinetic model for samples Q1, Q2, Q3, and Q4. All nanofibers exhibited intermittent release. The burst release of 60.66% and 55.67% drugs from Q3 and Q4 nanofibrous formulations was observed during the first 24 hours. This behavior could be attributed to an accumulation of NAP and MEL on the surface of nanofibers. After that, the drug diffusion from the pores of nanofibers provides the possibility of further release of drugs from nanofibers.
3.8. Antibacterial Activity and MTT Assays Measurements
The antibacterial activity of the drug-loaded nanofibers was evaluated using the agar well diffusion method against two types of bacteria strains, S. aureus and E. coli. Figure 9 and Table 4 show the inhibition zone and minimum inhibitory concentration (MIC) of the antibacterial activity of nanofibers for samples Q1, Q2, Q3, and Q4, respectively. PLA nanofibers alone showed negligible antibacterial activity, in contrast to gelatin, which has shown some antimicrobial properties in previous studies [90]. The incorporation of gelatin into PLA improved the antibacterial resistance of the fibers.
The stuck concentration release solution of PLA: GA nanofibers produced a MIC1000 (1000 mg/ L) with a diameter of inhibition zone of 11±2.2 mm against Gram-negative bacteria E. coli and 13±2.5 mm against Gram-positive bacteria S. aureus. However, when the release solution was diluted to 50% at MIC500, no effect was observed against E. coli, while the inhibition zone of 11±2.3 mm was maintained against S. aureus.
The release solution containing ZnO nanoparticles showed stronger antibacterial resistance, with MIC1000 , the an inhibition zone of 15±2.9 mm against E.coli and 16±3.2 mm against S. aureus, then decreased for more dilution. ZnO nanoparticles are known to be non-toxic to human cells and act as effective antibacterial agents. They interact with bacterial membranes and/or intracellular components, causing damage to vital bacterial structures [91,92,93,94,95]. The addition of nanoparticles to zinc oxide leads to the killing of bacteria in addition to the absence of toxicity [47]. The addition of naproxen and meloxicam enhanced the antibacterial activity of the nanofibers. Naproxen produced a MIC1000 with a diameter of inhibition zones of 17± 3.7 mm against S. aureus and 16±3.1 mm against E. coli, while meloxicam showed MIC1000 with a diameter of inhibition zones of 18±3.4 mm and 17±3.7 mm against S. aureus and E. coli, respectively, then reduction for more dilution. All dilution ratios of the drug solutions showed antibacterial activity, except for MIC125 at the 12.5% dilution, which had no effect. It was observed that increasing the dilution ratio of the sample solutions decreased their antimicrobial activity.
Significant. 50%, 25%, and 12.5%: Stuck concentration diluted to 50%, 25%, and 12.5%, MIC50, MIC25, MIC12.5: Values of MIC at 500, 250, and 125 mg/L with three times for each sample.
The cytotoxicity evaluation of nanofiber structures is crucial for their biological application. The cell viability assay was performed using the MTT method to evaluate the cytotoxicity of the nanofibrous release solutions. The viability of mouse L929 cells treated with different dilution ratios (1:160 to 1:10) of release solutions was analyzed using MTT assay; the results are shown in Figure 10 and Table 5. A sample was considered nontoxic if the cell viability exceeded 70% unite 1:10 of dilute ratio [96]. All samples showed no cytotoxicity, with cell viability ranging from 81% to 98.5%, confirming their biocompatibility. In addition, the lowest viability (closer to 70%) at higher concentrations [97].
The cytotoxicity was also evaluated using half-maximal inhibitory concentration IC50 (as shown in Figure 10B), which represents the drug concentration at which 50% of cells are killed [98]. The IC50 can be calculated by linear fitting for the curves in Figure 10A. According to the results in Table 5, naproxen showed the lowest IC50 value. A low IC50 value indicates that the drug is effective at low concentrations, resulting in minimal toxicity and fewer adverse effects [99].
4. Conclusion
Composite nanofibers were successfully fabricated using the electrospinning technique from four different polymer solutions. The nanofibers were thoroughly characterized to assess their morphologies, crystallinity, thermal properties, contact angle, and spectral interactions. Antibacterial activity against Staphylococcus aureus and Escherichia coli was evaluated. The cell viability assay of mouse L929 was performed using the MTT method to evaluate the cytotoxicity of the nanofibrous release solutions. The velocity volatilization of solvent leads to an increase in jet viscosity, and these changes inhibit both bead formation and jet thinning as well as increase the solidification rate. Velocity volatilization of solvent leads to decreasing crystallinity and enhancement of polymer degradation. The ZnO nanoparticle enhances the cumulative release of drugs. It also further improved the swelling by increasing the water absorption of nanofibers and creating hydrogen bonds with water molecules. Fourth kinitics release models were created as zero-order, the first-order, the Higuchi, and the Korsmeier-Pippas models, respectively. The Korsmeier-Pippas model, which explains the drug release from a polymer system is in good agreement with the polymeric system in this study. Increasing the dilution ratio of the sample solutions decreased their antimicrobial activity. All samples showed no cytotoxicity, confirming their biocompatibility. In addition, the lowest viability (closer to 70%) at higher concentrations. The mean and standard deviation of cell viability increased with increasing the diluted percentages. P-values for all samples less than 0.05 are considered significant.
Author Contributions
Saleh Abbas Habeeb designed and carefully reviewed the study. At the same time, Ali G.I. formulated the research and experimental work.
Funding
Any scientific institution or company to finance the research provides no support.
Data Availability Statement
All data supporting the study is available from the corresponding author and ready upon request.
Acknowledgments
The authors extend their sincere thanks and appreciation to all those involved in this work from the College of Materials Engineering, University of Babylon, Iraq and the University of Tabriz, Iran for guidance.
Conflicts of Interest
The authors declare that they have no competing interests influencing the research.
References
- Tijing, L.; Woo, Y.; Yao, M.; Ren, J.; Shon, H.K. : Electrospinning for membrane fabrication: strategies and applications, Comprehensive Membrane Science and Engineering 1,418-444 (2017).
- Hoque, E.; Nuge, T.; Yeow, T.K.; Nordin, N. : Electrospun matrices from natural polymers for skin regeneration, Nanostructured Polymer Composites for Biomedical Applications 87-104. 2019. [CrossRef]
- Faris, D.; Hadi, N.J.; Habeeb, S.A. Effect of rheological properties of (Poly vinyl alcohol/Dextrin/Naproxen) emulsion on the performance of drug encapsulated nanofibers. Mater. Today: Proc. 2021, 42, 2725–2732. [Google Scholar] [CrossRef]
- Mustfa, W.M.; Habeeb, S.A. Evaluation of the physical properties and filtration efficiency of PVDF/PAN nanofiber membranes by using dry milk protein. Mater. Res. Express 2023, 10, 095306. [Google Scholar] [CrossRef]
- Kajdič, S.; Planinšek, O.; Gašperlin, M.; Kocbek, P. Electrospun nanofibers for customized drug-delivery systems. J. Drug Deliv. Sci. Technol. 2019, 51, 672–681. [Google Scholar] [CrossRef]
- Gouda, M.; Khalaf, M.M.; Shaaban, S.; El-Lateef, H.M.A. Fabrication of Chitosan Nanofibers Containing Some Steroidal Compounds as a Drug Delivery System. Polymers 2022, 14, 2094. [Google Scholar] [CrossRef] [PubMed]
- Alippilakkotte, S.; Kumar, S.; Sreejith, L. Fabrication of PLA/Ag nanofibers by green synthesis method using Momordica charantia fruit extract for wound dressing applications. Colloids Surfaces A: Physicochem. Eng. Asp. 2017, 529, 771–782. [Google Scholar] [CrossRef]
- Pankongadisak, P.; Sangklin, S.; Chuysinuan, P.; Suwantong, O.; Supaphol, P. The use of electrospun curcumin-loaded poly(L-lactic acid) fiber mats as wound dressing materials. J. Drug Deliv. Sci. Technol. 2019, 53, 101121. [Google Scholar] [CrossRef]
- Kusworo, T.D.; Aryanti, N.; Dalanta, F. Effects of incorporating ZnO on characteristic, performance, and antifouling potential of PSf membrane for PRW treatment. IOP Conf. Ser.: Mater. Sci. Eng. 1053, 012134(2021). [CrossRef]
- Liew, W.C.; Muhamad, I.I.; Chew, J.W.; Karim, K.J.A. Synergistic effect of graphene oxide/zinc oxide nanocomposites on polylactic acid-based active packaging film: Properties, release kinetics and antimicrobial efficiency. Int. J. Biol. Macromol. 2023, 253, 127288. [Google Scholar] [CrossRef] [PubMed]
- Tyler, B.; Gullotti, D.; Mangraviti, A.; Utsuki, T.; Brem, H. Polylactic acid (PLA) controlled delivery carriers for biomedical applications. Adv. Drug Deliv. Rev. 2016, 107, 163–175. [Google Scholar] [CrossRef]
- Potrč, T.; Baumgartner, S.; Roškar, R.; Planinšek, O.; Lavrič, Z.; Kristl, J.; Kocbek, P. Electrospun polycaprolactone nanofibers as a potential oromucosal delivery system for poorly water-soluble drugs. Eur. J. Pharm. Sci. 2015, 75, 101–113. [Google Scholar] [CrossRef]
- Zeng, J.; Yang, L.; Liang, Q.; Zhang, X.; Guan, H.; Xu, X.; Chen, X.; Jing, X. Influence of the drug compatibility with polymer solution on the release kinetics of electrospun fiber formulation. J. Control. Release 2005, 105, 43–51. [Google Scholar] [CrossRef] [PubMed]
- Kim, K.; Luu, Y.K.; Chang, C.; Fang, D.; Hsiao, B.S.; Chu, B.; Hadjiargyrou, M. Incorporation and controlled release of a hydrophilic antibiotic using poly(lactide-co-glycolide)-based electrospun nanofibrous scaffolds. J. Control. Release 2004, 98, 47–56. [Google Scholar] [CrossRef]
- Tungprapa, S.; Jangchud, I.; Supaphol, P. Release characteristics of four model drugs from drug-loaded electrospun cellulose acetate fiber mats. Polymer 2007, 48, 5030–5041. [Google Scholar] [CrossRef]
- Habeeb, S.A. , Hussein, A.O. and Ayham, M.H., 2025. Comparative Analysis of the Polyacrylonitrile-Titania and Amidoxime Polyacrylonitrile-Titania Composite Fibers. J. Test. Evaluation. [CrossRef]
- Saniei, H.; Mousavi, S. Surface modification of PLA 3D-printed implants by electrospinning with enhanced bioactivity and cell affinity. Polymer 2020, 196. [Google Scholar] [CrossRef]
- Wardhono, E.Y.; Kanani, N.; Alfirano; Rahmayetty; Alfirano, A. ; Rahmayetti, R. Development of polylactic acid (PLA) bio-composite films reinforced with bacterial cellulose nanocrystals (BCNC) without any surface modification. J. Dispers. Sci. Technol. 2019, 41, 1488–1495. [Google Scholar] [CrossRef]
- Santoro, M.; Shah, S.R.; Walker, J.L.; Mikos, A.G. Poly(lactic acid) nanofibrous scaffolds for tissue engineering. Adv. Drug Deliv. Rev. 2016, 107, 206–212. [Google Scholar] [CrossRef]
- Su, K.; Wang, C. Recent advances in the use of gelatin in biomedical research. Biotechnol. Lett. 2015, 37, 2139–2145. [Google Scholar] [CrossRef]
- Abdulkadhim, M.K.; Habeeb, S.A. The Possibility of Producing Uniform Nanofibers from Blends of Natural Biopolymers. Mater. Perform. Charact. 2022, 11, 313–323. [Google Scholar] [CrossRef]
- Mamidi, N.; Delgadillo, R.M.V.; González-Ortiz, A. Engineering of carbon nano-onion bioconjugates for biomedical applications. Mater. Sci. Eng. C 2021, 120, 111698. [Google Scholar] [CrossRef]
- Foox, M.; Zilberman, M. Drug delivery from gelatin-based systems. Expert Opin. Drug Deliv. 2015, 12, 1547–1563. [Google Scholar] [CrossRef]
- Al-Jbour, N.D.; Beg, M.D.; Gimbun, J.; Alam, A.M. An Overview of Chitosan Nanofibers and their Applications in the Drug Delivery Process. Curr. Drug Deliv. 2019, 16, 272–294. [Google Scholar] [CrossRef]
- Conaghan, P.G. A turbulent decade for NSAIDs: update on current concepts of classification, epidemiology, comparative efficacy, and toxicity. Rheumatol. Int. 2011, 32, 1491–1502. [Google Scholar] [CrossRef]
- Roy, S.; Banerjee, R.; Sarkar, M. Direct binding of Cu(II)-complexes of oxicam NSAIDs with DNA backbone. J. Inorg. Biochem. 2006, 100, 1320–1331. [Google Scholar] [CrossRef]
- Knottenbelt, C.; Chambers, G.; Gault, E.; Argyle, D.J. The in vitro effects of piroxicam and meloxicam on canine cell lines. J. Small Anim. Pr. 2006, 47, 14–20. [Google Scholar] [CrossRef]
- Pelipenko, J.; Kocbek, P.; Kristl, J. Critical attributes of nanofibers: Preparation, drug loading, and tissue regeneration. Int. J. Pharm. 2015, 484, 57–74. [Google Scholar] [CrossRef]
- Jain, K.K. : Drug delivery systems-an overview, Drug delivery systems, 1-50 (2008). [CrossRef]
- Arumugam, M.; Murugesan, B.; Chinnalagu, D.K.; Mahalingam, S. Dual therapeutic approach: Biodegradable nanofiber scaffolds of silk fibroin and collagen combined with silver and gold nanoparticles for enhanced bacterial infections treatment and accelerated wound healing. J. Drug Deliv. Sci. Technol. 2024, 95. [Google Scholar] [CrossRef]
- Habeeb, S.A.; Abdulkadhim, M.K. Natural Biopolymer–Hydrogel Nanofibers for Antibacterial Applications. J. Eng. Mater. Technol. 2023, 146, 1–27. [Google Scholar] [CrossRef]
- Zhang, S.; Tang, N.; Cao, L.; Yin, X.; Yu, J.; Ding, B. Highly Integrated Polysulfone/Polyacrylonitrile/Polyamide-6 Air Filter for Multilevel Physical Sieving Airborne Particles. ACS Appl. Mater. Interfaces 2016, 8, 29062–29072. [Google Scholar] [CrossRef]
- Habeeb, S. , Rajabi, L. and Dabirian, F.: Comparing two electrospinning methods in producing polyacrylonitrile nanofibrous tubular structures with enhanced properties, Iran. J. Chem. Chem. Eng 38,23-42(2019).
- Yanilmaz, M.; Lu, Y.; Li, Y.; Zhang, X. SiO2/polyacrylonitrile membranes via centrifugal spinning as a separator for Li-ion batteries. J. Power Sources 2015, 273, 1114–1119. [Google Scholar] [CrossRef]
- Abdulkadhim, M.K.; Habeeb, S.A. Electro spun uniform nanofiber from gelatin: Chitosan at low Concentration. Mater. Today: Proc. 2023, 87, 299–306. [Google Scholar] [CrossRef]
- Marano, S.; Barker, S.A.; Raimi-Abraham, B.T.; Missaghi, S.; Rajabi-Siahboomi, A.; Craig, D.Q. Development of micro-fibrous solid dispersions of poorly water-soluble drugs in sucrose using temperature-controlled centrifugal spinning. Eur. J. Pharm. Biopharm. 2016, 103, 84–94. [Google Scholar] [CrossRef]
- Chen, S.; Li, R.; Li, X.; Xie, J. Electrospinning: An enabling nanotechnology platform for drug delivery and regenerative medicine. Adv. Drug Deliv. Rev. 2018, 132, 188–213. [Google Scholar] [CrossRef]
- Heikkilä, P.; Harlin, A. Parameter study of electrospinning of polyamide-6. Eur. Polym. J. 2008, 44, 3067–3079. [Google Scholar] [CrossRef]
- Ji, W.; Yang, F.; Beucken, J.J.v.D.; Bian, Z.; Fan, M.; Chen, Z.; Jansen, J.A. Fibrous scaffolds loaded with protein prepared by blend or coaxial electrospinning. Acta Biomater. 2010, 6, 4199–4207. [Google Scholar] [CrossRef]
- Huang, X.; Brazel, C.S. On the importance and mechanisms of burst release in matrix-controlled drug delivery systems. J. Control. Release 2001, 73, 121–136. [Google Scholar] [CrossRef]
- Akduman, Ç. , Özgüney, I. and Akçakoca Kumbasar, E.P.: Release Characteristics of Naproxen Loaded Electrospun Thermoplastic Polyurethane Nanofibers, XIIIth International Izmir Textile and Apparel Symposium, Antalya, Turkey, 2014. https://hdl.handle.net/11499/51804.
- Bartos, C.; Motzwickler-Németh, A.; Kovács, D.; Burián, K.; Ambrus, R. Study on the Scale-Up Possibility of a Combined Wet Grinding Technique Intended for Oral Administration of Meloxicam Nanosuspension. Pharmaceutics 2024, 16, 1512. [Google Scholar] [CrossRef]
- Hu, J.; Prabhakaran, M.P.; Tian, L.; Ding, X.; Ramakrishna, S. Drug-loaded emulsion electrospun nanofibers: characterization, drug release and in vitro biocompatibility. RSC Adv. 2015, 5, 100256–100267. [Google Scholar] [CrossRef]
- Ahmadipour, Z.; Dorraji, M.S.S.; Ashjari, H.R.; Dodangeh, F.; Rasoulifard, M.H. Applying in-situ visible photopolymerization for fabrication of electrospun nanofibrous carrier for meloxicam delivery. Sci. Rep. 2023, 13, 1–11. [Google Scholar] [CrossRef]
- Anand, S.; Pandey, P.; Begum, M.Y.; Chidambaram, K.; Arya, D.K.; Gupta, R.K.; Sankhwar, R.; Jaiswal, S.; Thakur, S.; Rajinikanth, P.S. Electrospun Biomimetic Multifunctional Nanofibers Loaded with Ferulic Acid for Enhanced Antimicrobial and Wound-Healing Activities in STZ-Induced Diabetic Rats. Pharmaceuticals 2022, 15, 302. [Google Scholar] [CrossRef]
- Kowalska-Krochmal, B.; Dudek-Wicher, R. The Minimum Inhibitory Concentration of Antibiotics: Methods, Interpretation, Clinical Relevance. Pathogens 2021, 10, 165. [Google Scholar] [CrossRef]
- Khan, M.Q.; Kharaghani, D.; Nishat, N.; Shahzad, A.; Hussain, T.; Khatri, Z.; Zhu, C.; Kim, I.S. Preparation and characterizations of multifunctional PVA/ZnO nanofibers composite membranes for surgical gown application. J. Mater. Res. Technol. 2019, 8, 1328–1334. [Google Scholar] [CrossRef]
- Rodríguez-Tobías, H.; Morales, G.; Ledezma, A.; Romero, J.; Grande, D. Novel antibacterial electrospun mats based on poly(d,l-lactide) nanofibers and zinc oxide nanoparticles. J. Mater. Sci. 2014, 49, 8373–8385. [Google Scholar] [CrossRef]
- Adabi, M.; Saber, R.; Naghibzadeh, M.; Faridbod, F.; Faridi-Majidi, R. Parameters affecting carbon nanofiber electrodes for measurement of cathodic current in electrochemical sensors: an investigation using artificial neural network. RSC Adv. 2015, 5, 81243–81252. [Google Scholar] [CrossRef]
- Akduman, C.; Özgüney, I.; Kumbasar, E.P.A. Preparation and characterization of naproxen-loaded electrospun thermoplastic polyurethane nanofibers as a drug delivery system. Mater. Sci. Eng. C 2016, 64, 383–390. [Google Scholar] [CrossRef] [PubMed]
- Golecki, H.M.; Yuan, H.; Glavin, C.; Potter, B.; Badrossamay, M.R.; Goss, J.A.; Phillips, M.D.; Parker, K.K. Effect of Solvent Evaporation on Fiber Morphology in Rotary Jet Spinning. Langmuir 2014, 30, 13369–13374. [Google Scholar] [CrossRef]
- Nadhim, B.A.; Habeeb, S.A. Studying the Physical Properties of Non-Woven Polyacrylonitrile Nanofibers after Adding γ-Fe2O3 Nanoparticles. Egypt. J. Chem. 2021, 64, 7521–7530. [Google Scholar] [CrossRef]
- Karbownik, I.; Rac-Rumijowska, O.; Fiedot-Toboła, M.; Rybicki, T.; Teterycz, H. The Preparation and Characterization of Polyacrylonitrile-Polyaniline (PAN/PANI) Fibers. Materials 2019, 12, 664. [Google Scholar] [CrossRef] [PubMed]
- Habeeb, S.A.; Rajabi, L.; Dabirian, F. Production of polyacrylonitrile/boehmite nanofibrous composite tubular structures by opposite-charge electrospinning with enhanced properties from a low-concentration polymer solution. Polym. Compos. 2019, 41, 1649–1661. [Google Scholar] [CrossRef]
- Segal, L.; Creely, J.J.; Martin, A.E., Jr.; Conrad, C.M. An Empirical Method for Estimating the Degree of Crystallinity of Native Cellulose Using the X-Ray Diffractometer. Text. Res. J. 1959, 29, 786–794. [Google Scholar] [CrossRef]
- Echeverría, C.; Limón, I.; Muñoz-Bonilla, A.; Fernández-García, M.; López, D. Development of Highly Crystalline Polylactic Acid with β-Crystalline Phase from the Induced Alignment of Electrospun Fibers. Polymers 2021, 13, 2860. [Google Scholar] [CrossRef]
- Kim, H.; Knowles, J.C.; Kim, H. Porous scaffolds of gelatin–hydroxyapatite nanocomposites obtained by biomimetic approach: Characterization and antibiotic drug release. J. Biomed. Mater. Res. Part B: Appl. Biomater. 2005, 74B, 686–698. [Google Scholar] [CrossRef]
- Karthikeyan, C.; Varaprasad, K.; Akbari-Fakhrabadi, A.; Hameed, A.S.H.; Sadiku, R. Biomolecule chitosan, curcumin and ZnO-based antibacterial nanomaterial, via a one-pot process. Carbohydr. Polym. 2020, 249, 116825. [Google Scholar] [CrossRef]
- Verreck, G.; Chun, I.; Rosenblatt, J.; Peeters, J.; Van Dijck, A.; Mensch, J.; Noppe, M.; Brewster, M.E. Incorporation of drugs in an amorphous state into electrospun nanofibers composed of a water-insoluble, nonbiodegradable polymer. J. Control. Release 2003, 92, 349–360. [Google Scholar] [CrossRef] [PubMed]
- Song, Z.; Chiang, S.W.; Chu, X.; Du, H.; Li, J.; Gan, L.; Xu, C.; Yao, Y.; He, Y.; Li, B.; et al. Effects of solvent on structures and properties of electrospun poly(ethylene oxide) nanofibers. J. Appl. Polym. Sci. 2017, 135. [Google Scholar] [CrossRef]
- Kurd, F.; Fathi, M.; Shekarchizadeh, H. Basil seed mucilage as a new source for electrospinning: Production and physicochemical characterization. Int. J. Biol. Macromol. 2017, 95, 689–695. [Google Scholar] [CrossRef] [PubMed]
- Hendrick, E.; Frey, M. Increasing Surface Hydrophilicity in Poly(Lactic Acid) Electrospun Fibers by Addition of Pla-b-Peg Co-Polymers. J. Eng. Fibers Fabr. 2014, 9. [Google Scholar] [CrossRef]
- Theerawitayaart, W.; Prodpran, T.; Benjakul, S. Enhancement of Hydrophobicity of Fish Skin Gelatin via Molecular Modification with Oxidized Linoleic Acid. J. Chem. 2019, 2019, 1–11. [Google Scholar] [CrossRef]
- van Wachem, P.; Hogt, A.; Beugeling, T.; Feijen, J.; Bantjes, A.; Detmers, J.; van Aken, W. Adhesion of cultured human endothelial cells onto methacrylate polymers with varying surface wettability and charge. Biomaterials 1987, 8, 323–328. [Google Scholar] [CrossRef]
- Mosallanezhad, P.; Nazockdast, H.; Ahmadi, Z.; Rostami, A. Fabrication and characterization of polycaprolactone/chitosan nanofibers containing antibacterial agents of curcumin and ZnO nanoparticles for use as wound dressing. Front. Bioeng. Biotechnol. 2022, 10, 1027351. [Google Scholar] [CrossRef]
- Lin, Y.; Cai, Q.; Li, Q.; Xue, L.; Jin, R.; Yang, X. Effect of solvent on surface wettability of electrospun polyphosphazene nanofibers. J. Appl. Polym. Sci. 2009, 115, 3393–3400. [Google Scholar] [CrossRef]
- Friuli, V.; Pisani, S.; Conti, B.; Bruni, G.; Maggi, L. Tablet Formulations of Polymeric Electrospun Fibers for the Controlled Release of Drugs with pH-Dependent Solubility. Polymers 2022, 14, 2127. [Google Scholar] [CrossRef]
- Chieng, B.W.; Ibrahim, N.A.B.; Yunus, W.M.Z.W.; Hussein, M.Z. Poly(lactic acid)/Poly(ethylene glycol) Polymer Nanocomposites: Effects of Graphene Nanoplatelets. Polymers 2013, 6, 93–104. [Google Scholar] [CrossRef]
- Gaspar-Pintiliescu, A.; Stefan, L.M.; Anton, E.D.; Berger, D.; Matei, C.; Negreanu-Pirjol, T.; Moldovan, L. Physicochemical and Biological Properties of Gelatin Extracted from Marine Snail Rapana venosa. Mar. Drugs 2019, 17, 589. [Google Scholar] [CrossRef]
- Ahmadipour, Z.; Dorraji, M.S.S.; Ashjari, H.R.; Dodangeh, F.; Rasoulifard, M.H. Applying in-situ visible photopolymerization for fabrication of electrospun nanofibrous carrier for meloxicam delivery. Sci. Rep. 2023, 13, 1–11. [Google Scholar] [CrossRef]
- Salaris, V.; García-Obregón, I.S.F.; López, D.; Peponi, L. Fabrication of PLA-Based Electrospun Nanofibers Reinforced with ZnO Nanoparticles and In Vitro Degradation Study. Nanomaterials 2023, 13, 2236. [Google Scholar] [CrossRef]
- Chao, S.; Zhang, Y.; Cheng, S.; Shao, X.; Liu, S.; Lu, W.; Wang, Y.; Zhang, P.; Yao, Q. Ibuprofen-Loaded ZnO Nanoparticle/Polyacrylonitrile Nanofibers for Dual-Stimulus Sustained Release of Drugs. ACS Appl. Nano Mater. 2023, 6, 5535–5544. [Google Scholar] [CrossRef]
- Chao, S.; Zhang, Y.; Cheng, S.; Shao, X.; Liu, S.; Lu, W.; Wang, Y.; Zhang, P.; Yao, Q. Ibuprofen-Loaded ZnO Nanoparticle/Polyacrylonitrile Nanofibers for Dual-Stimulus Sustained Release of Drugs. ACS Appl. Nano Mater. 2023, 6, 5535–5544. [Google Scholar] [CrossRef]
- Li, Z.; Kang, H.; Che, N.; Liu, Z.; Li, P.; Li, W.; Zhang, C.; Cao, C.; Liu, R.; Huang, Y. Controlled release of liposome-encapsulated Naproxen from core-sheath electrospun nanofibers. Carbohydr. Polym. 2014, 111, 18–24. [Google Scholar] [CrossRef]
- Tungprapa, S.; Jangchud, I.; Supaphol, P. Release characteristics of four model drugs from drug-loaded electrospun cellulose acetate fiber mats. Polymer 2007, 48, 5030–5041. [Google Scholar] [CrossRef]
- Basavaraju, K.C.; Jayaraju, J.; Rai, S.K.; Damappa, T. Miscibility studies of xanthan gum with gelatin in dilute solution. J. Appl. Polym. Sci. 2008, 109, 2491–2495. [Google Scholar] [CrossRef]
- Prakash, J.; Venkataprasanna, K.; Bharath, G.; Banat, F.; Niranjan, R.; Venkatasubbu, G.D. In-vitro evaluation of electrospun cellulose acetate nanofiber containing Graphene oxide/TiO2/Curcumin for wound healing application. Colloids Surfaces A: Physicochem. Eng. Asp. 2021, 627. [Google Scholar] [CrossRef]
- Niranjan, R.; Kaushik, M.; Selvi, R.T.; Prakash, J.; Venkataprasanna, K.; Prema, D.; Pannerselvam, B.; Venkatasubbu, G.D. PVA/SA/TiO2-CUR patch for enhanced wound healing application: In vitro and in vivo analysis. Int. J. Biol. Macromol. 2019, 138, 704–717. [Google Scholar] [CrossRef]
- Edikresnha, D.; Suciati, T.; Munir, M.M.; Khairurrijal, K. Polyvinylpyrrolidone/cellulose acetate electrospun composite nanofibres loaded by glycerine and garlic extract within vitroantibacterial activity and release behaviour test. RSC Adv. 2019, 9, 26351–26363. [Google Scholar] [CrossRef]
- Salaris, V.; García-Obregón, I.S.F.; López, D.; Peponi, L. Fabrication of PLA-Based Electrospun Nanofibers Reinforced with ZnO Nanoparticles and In Vitro Degradation Study. Nanomaterials 2023, 13, 2236. [Google Scholar] [CrossRef]
- Poznanski, J.; Szczesny, P.; Ruszczyńska, K.; Zielenkiewicz, P.; Paczek, L. Proteins contribute insignificantly to the intrinsic buffering capacity of yeast cytoplasm. Biochem. Biophys. Res. Commun. 2013, 430, 741–744. [Google Scholar] [CrossRef]
- Qin, M.; Guo, H.; Dai, Z.; Yan, X.; Ning, X. Advances in flexible and wearable pH sensors for wound healing monitoring. J. Semicond. 2019, 40. [Google Scholar] [CrossRef]
- Armedya, T.P.; Dzikri, M.F.; Sakti, S.C.W.; Abdulloh, A.; Raharjo, Y.; Wafiroh, S.; Purwati; Fahmi, M. Z. Kinetical Release Study of Copper Ferrite Nanoparticle Incorporated on PCL/Collagen Nanofiber for Naproxen Delivery. BioNanoScience 2019, 9, 274–284. [Google Scholar] [CrossRef]
- Irani, M.; Sadeghi, G.M.M.; Haririan, I. The sustained delivery of temozolomide from electrospun PCL-Diol-b-PU/gold nanocompsite nanofibers to treat glioblastoma tumors. Mater. Sci. Eng. C 2017, 75, 165–174. [Google Scholar] [CrossRef]
- Irani, M.; Sadeghi, G.M.M.; Haririan, I. The sustained delivery of temozolomide from electrospun PCL-Diol-b-PU/gold nanocompsite nanofibers to treat glioblastoma tumors. Mater. Sci. Eng. C 2017, 75, 165–174. [Google Scholar] [CrossRef]
- Jahromi, L.P.; Ghazali, M.; Ashrafi, H.; Azadi, A. A comparison of models for the analysis of the kinetics of drug release from PLGA-based nanoparticles. Heliyon 2020, 6, e03451. [Google Scholar] [CrossRef]
- Azadi, A.; Rouini, M.-R.; Hamidi, M. Neuropharmacokinetic evaluation of methotrexate-loaded chitosan nanogels. Int. J. Biol. Macromol. 2015, 79, 326–335. [Google Scholar] [CrossRef]
- Shaikh, H. K. , Kshirsagar, R. V., Patil, S. G. : Mathematical models for drug release characterization: a review, World J Pharm Pharm Sci 4, 324-338 (2015).
- Azhar, F.F.; Shahbazpour, E.; Olad, A. pH sensitive and controlled release system based on cellulose nanofibers-poly vinyl alcohol hydrogels for cisplatin delivery. Fibers Polym. 2017, 18, 416–423. [Google Scholar] [CrossRef]
- Kwak, H.W.; Kim, J.E.; Lee, K.H. Green fabrication of antibacterial gelatin fiber for biomedical application. React. Funct. Polym. 2019, 136, 86–94. [Google Scholar] [CrossRef]
- Colon, G.; Ward, B.C.; Webster, T.J. Increased osteoblast and decreased Staphylococcus epidermidis functions on nanophase ZnO and TiO2. J BIOMED MATER RES A: An Official Journal of The Society for Biomaterials, The Japanese Society for Biomaterials, and The Australian Society for Biomaterials and the Korean Society for Biomaterials 2006, 78A, 595–604. [Google Scholar] [CrossRef]
- Habeeb, S.A. , Abdulkadhim, T.A.: Effect of the Tires Crumb Rubber Loading Levels on NR/SBR Compounding Properties for Antibacterial Applications, Iran. J. Chem. Chem. Eng 42, 4153-4166 (2023). [CrossRef]
- Habeeb, S.A.; Nadhim, B.A. Removal of Nickel (II) Ions, Low Level Pollutants, and Total Bacterial Colony Count from Wastewater by Composite Nanofibers Film. Sci. Iran. 2022, 30, 2056–2069. [Google Scholar] [CrossRef]
- Padmavathy, N.; Vijayaraghavan, R. Enhanced bioactivity of ZnO nanoparticles—an antimicrobial study. Sci. Technol. Adv. Mater. 2008, 9, 035004. [Google Scholar] [CrossRef]
- Webster, T.J.; Seil, I.; Seil, J.T. Antimicrobial applications of nanotechnology: methods and literature. Int. J. Nanomed. 2012, 7, 2767–2781. [Google Scholar] [CrossRef]
- Cannella, V.; Altomare, R.; Chiaramonte, G.; Di Bella, S.; Mira, F.; Russotto, L.; Pisano, P.; Guercio, A. Cytotoxicity Evaluation of Endodontic Pins on L929 Cell Line. BioMed Res. Int. 2019, 2019, 1–5. [Google Scholar] [CrossRef]
- Srikanth, M.; Khan, W.S.; Asmatulu, R.; Misak, H.E.; Yang, S.-Y.; Asmatulu, E. In vitro Cytotoxicity Studies of Industrially Used Common Nanomaterials on L929 and 3T3 Fibroblast Cells. J. Biomed. Res. Environ. Sci. 2020, 1, 192–200. [Google Scholar] [CrossRef]
- Eisenbrand, G.; Pool-Zobel, B.; Baker, V.; Balls, M.; Blaauboer, B.; Boobis, A.; Carere, A.; Kevekordes, S.; Lhuguenot, J.-C.; Pieters, R.; et al. Methods of in vitro toxicology. 40. [CrossRef]
- Berrouet, C.; Dorilas, N.; Rejniak, K.A.; Tuncer, N. Comparison of Drug Inhibitory Effects [Formula: see text) in Monolayer and Spheroid Cultures. Bull. Math. Biol. 2020, 82, 1–23. [Google Scholar] [CrossRef]
Figure 1.
FE-SEM images of the electro spun fibers and their fiber distrbutions showing: (A) PLA: GA, (B) PLA: GA: ZnO, (C) PLA:GA: ZnO:0.1 wt.% NAP, (D) PLA:GA: ZnO:0.2 wt.% NAP, (E) PLA:GA: ZnO:0.3 wt.% NAP, (F) PLA:GA: ZnO:0.1 wt.% MEL, (G) PLA:GA: ZnO:0.2 wt.% MEL, and (H) PLA:GA: ZnO:0.3 wt.% MEL.
Figure 2.
(p-XRD) patterns of samples Q1, Q2, Q3, and Q4.
Figure 3.
Surface wettability: (A) contact angle measurements at different time intervals (20, 40, and 60 s), and (B) the relationship between contact angle and surface free energy for samples Q1, Q2, Q3, and Q4, respectively.
Figure 3.
Surface wettability: (A) contact angle measurements at different time intervals (20, 40, and 60 s), and (B) the relationship between contact angle and surface free energy for samples Q1, Q2, Q3, and Q4, respectively.
Figure 4.
FTIR spectra of samples Q1, Q2, Q3, and Q4 respectively.
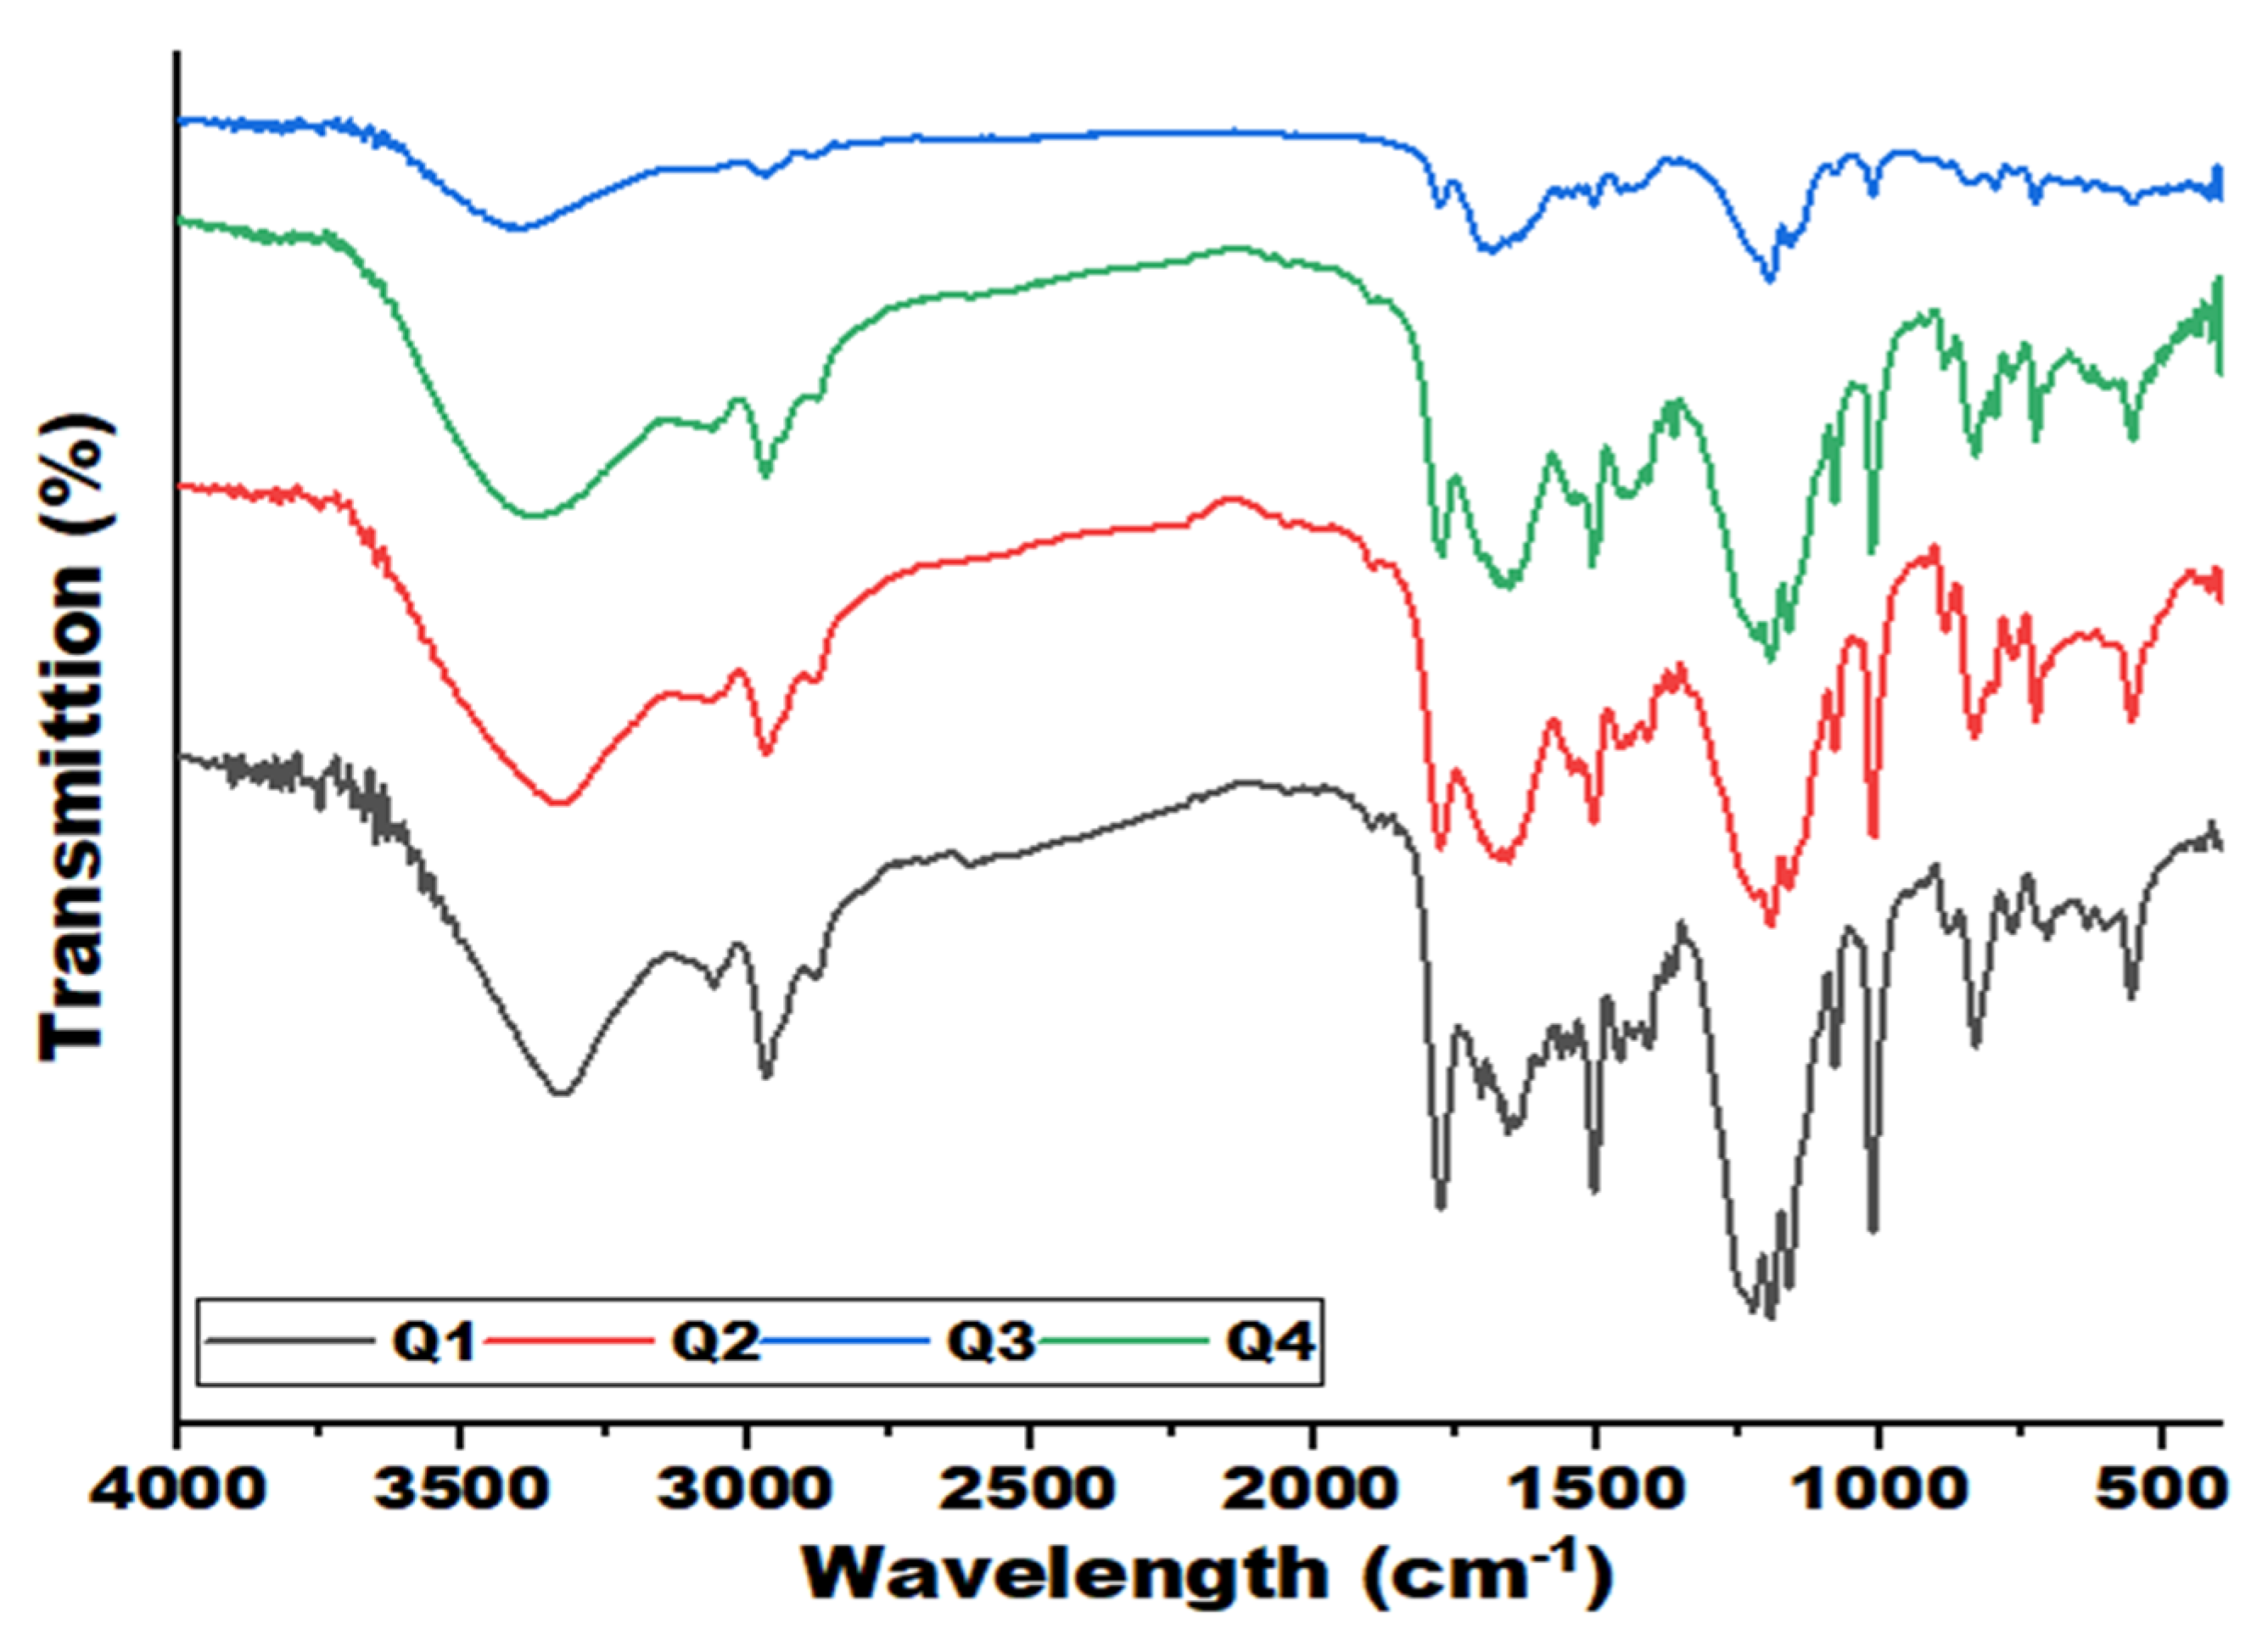
Figure 5.
Thermal analysis: (A) Thermogravimetric Analysis (TGA), and (B) Differential Scanning Calorimetry (DSC): curves of samples Q1, Q2, Q3, and Q4, respectively.
Figure 5.
Thermal analysis: (A) Thermogravimetric Analysis (TGA), and (B) Differential Scanning Calorimetry (DSC): curves of samples Q1, Q2, Q3, and Q4, respectively.
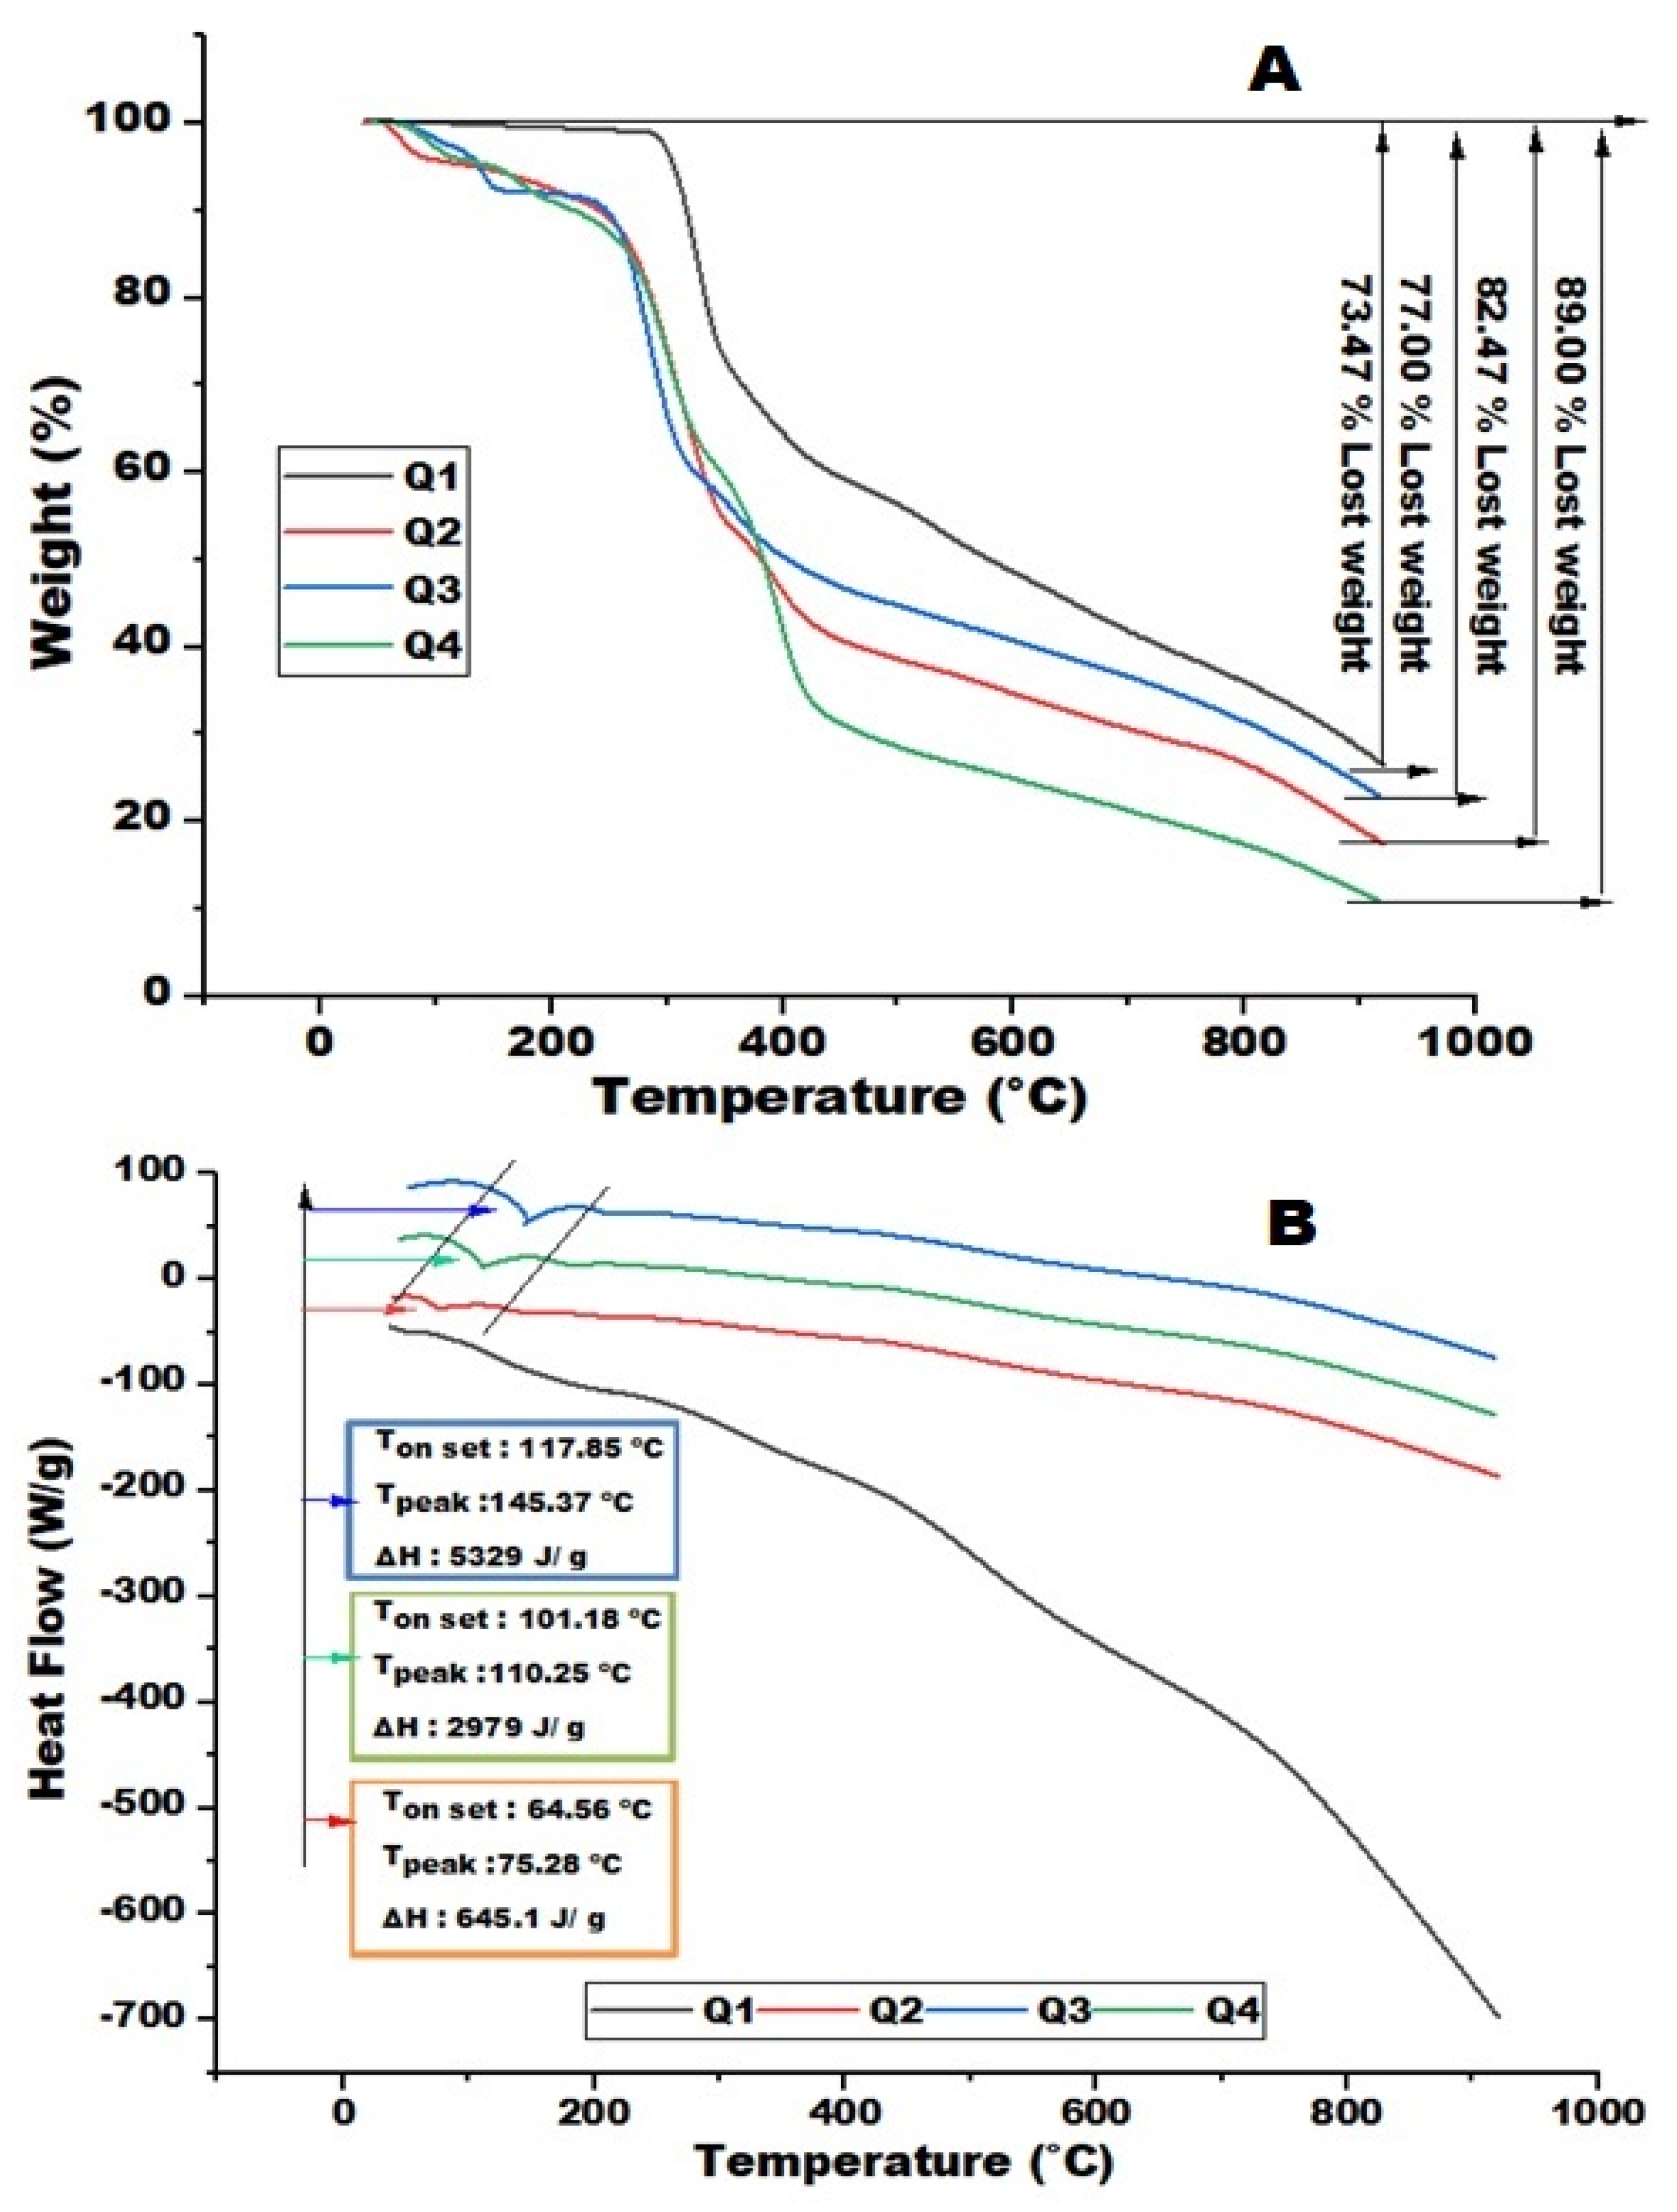
Figure 6.
Cumulative release percentages of the nanofiber samples Q1, Q2, Q3, and Q4 respectively over time (days) in PBS at pH7.2 (mean ± S.D.).
Figure 6.
Cumulative release percentages of the nanofiber samples Q1, Q2, Q3, and Q4 respectively over time (days) in PBS at pH7.2 (mean ± S.D.).
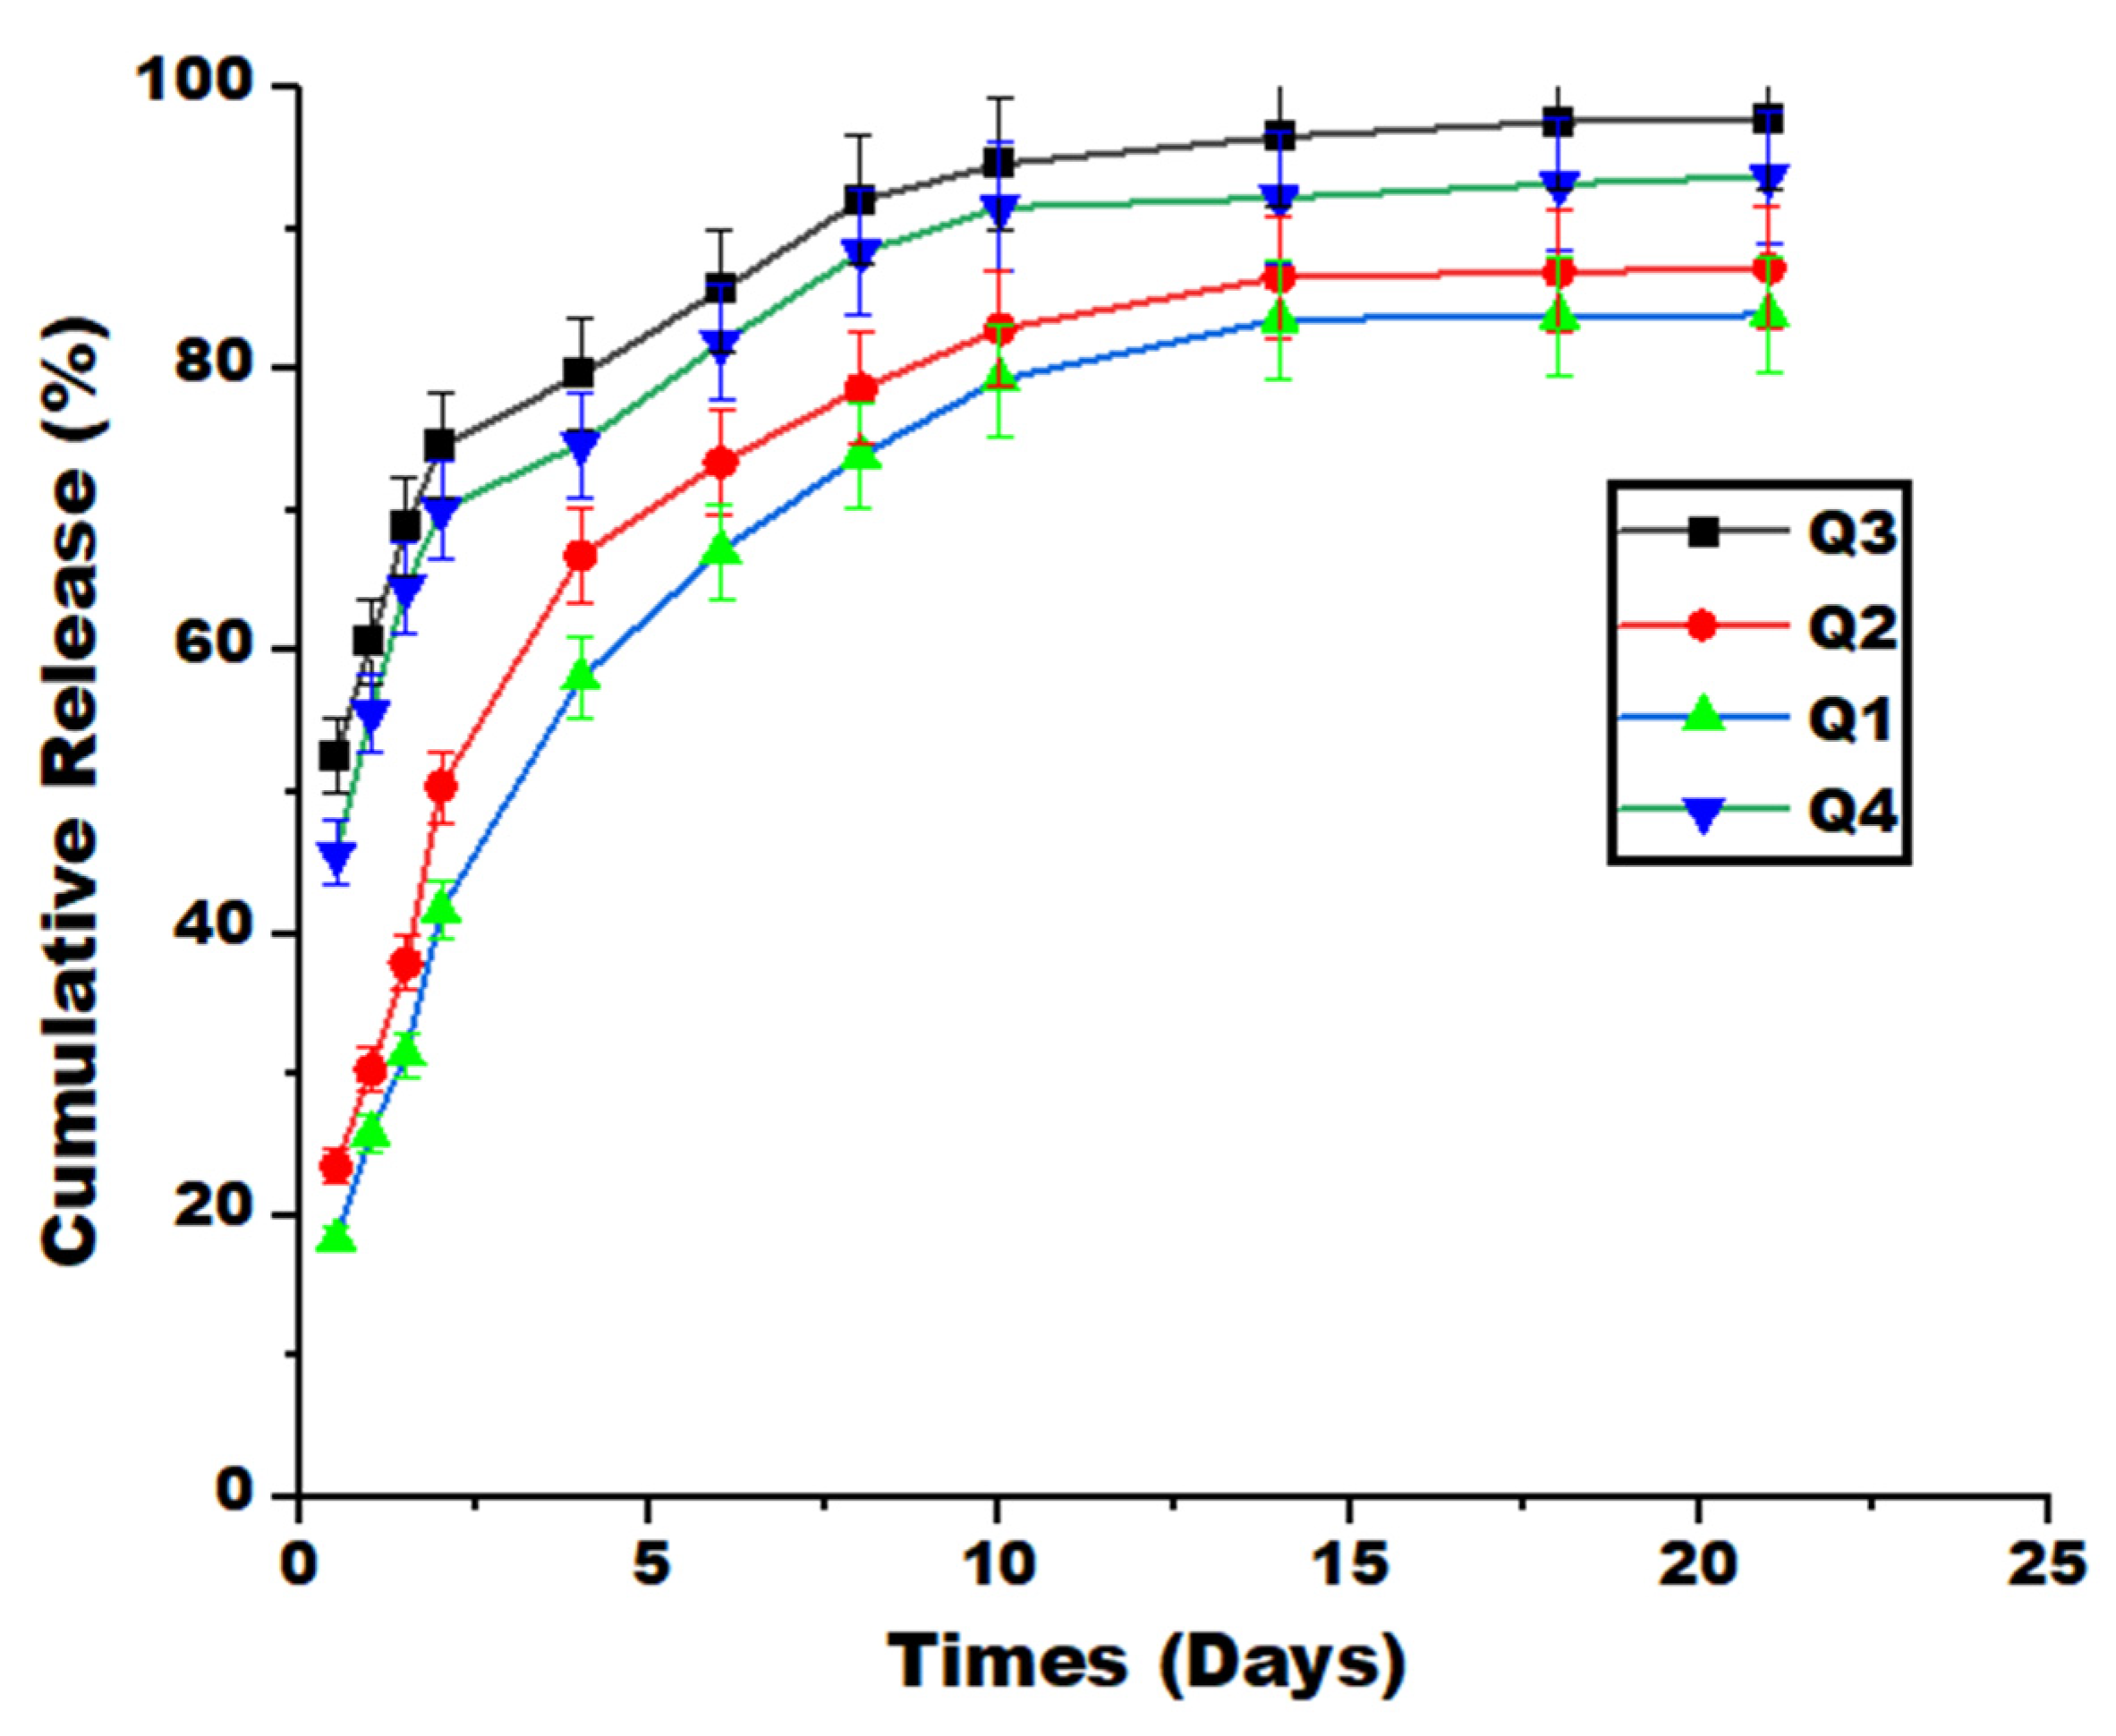
Figure 7.
Variation of the (A) Swelling index, (B) degradation index, and (C) pH measured after various release times in PBS solution at pH7.2 (mean ± S.D.) for samples Q1, Q2, Q3, and Q4, respectively.
Figure 7.
Variation of the (A) Swelling index, (B) degradation index, and (C) pH measured after various release times in PBS solution at pH7.2 (mean ± S.D.) for samples Q1, Q2, Q3, and Q4, respectively.
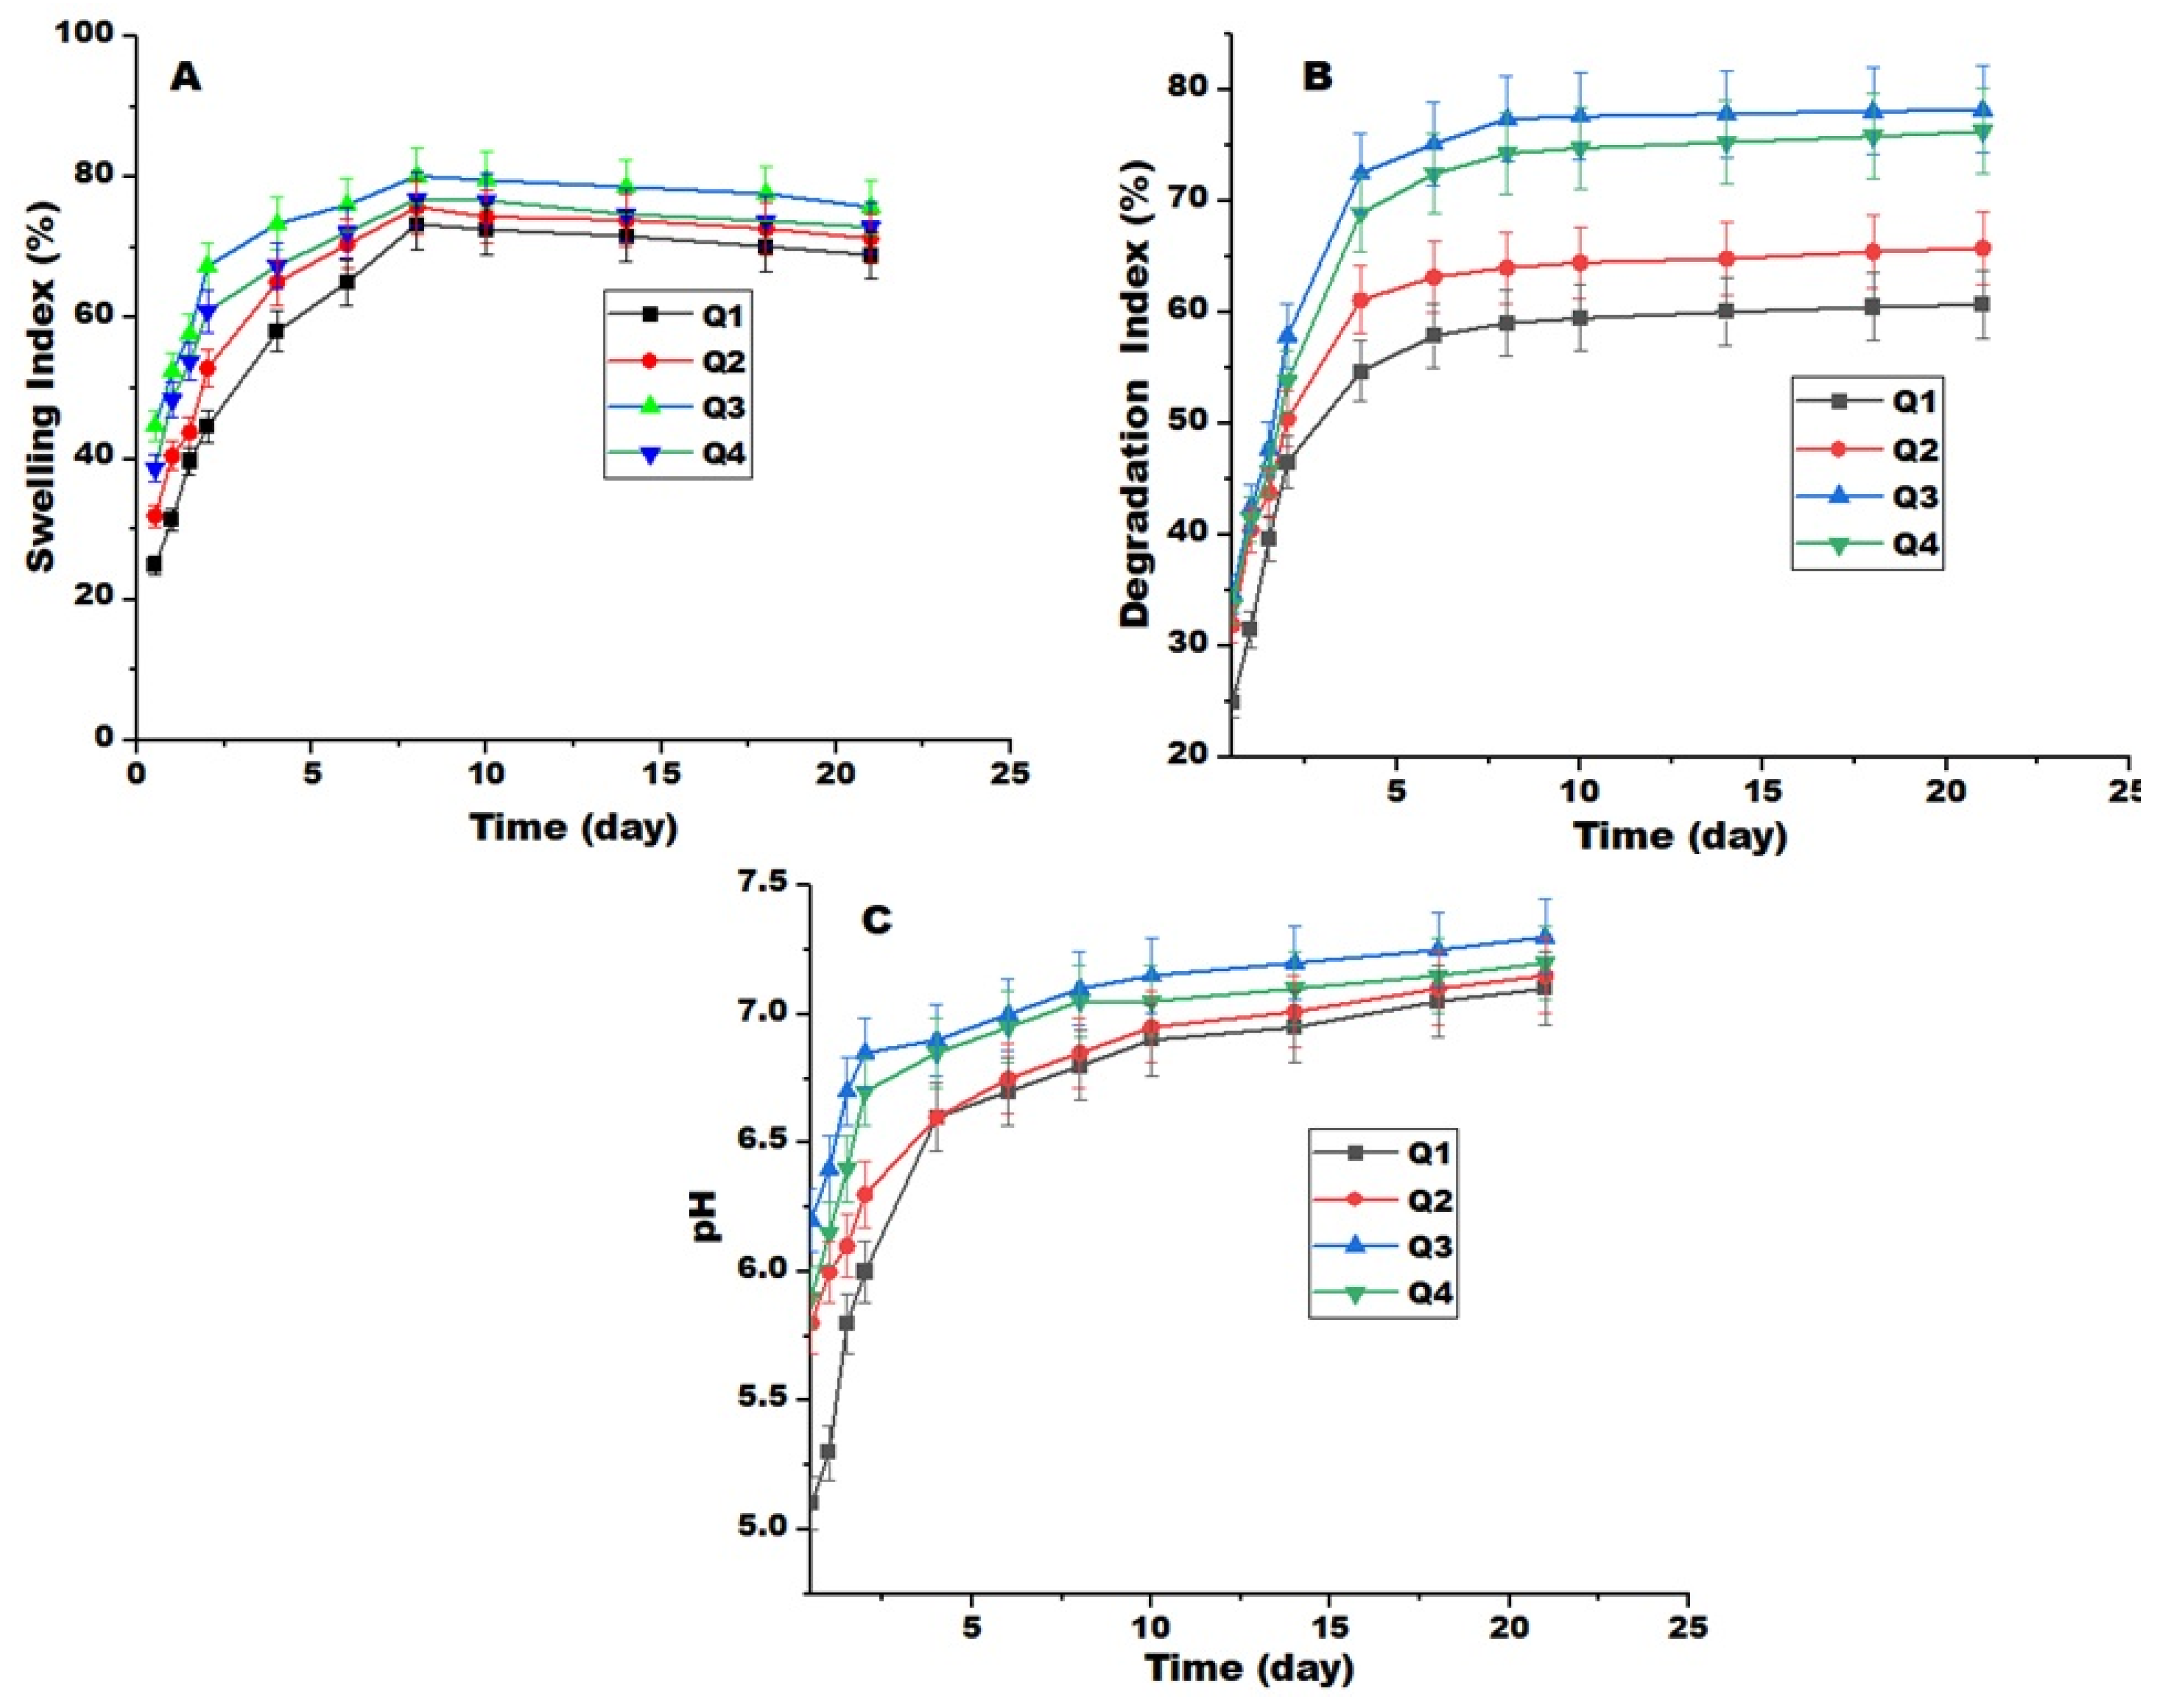
Figure 8.
Fitting Data to the Korsmeyer-Peppas Kinetic Model for samples (A) Q1, (B) Q2, (C) Q3, and (D) Q4.
Figure 8.
Fitting Data to the Korsmeyer-Peppas Kinetic Model for samples (A) Q1, (B) Q2, (C) Q3, and (D) Q4.
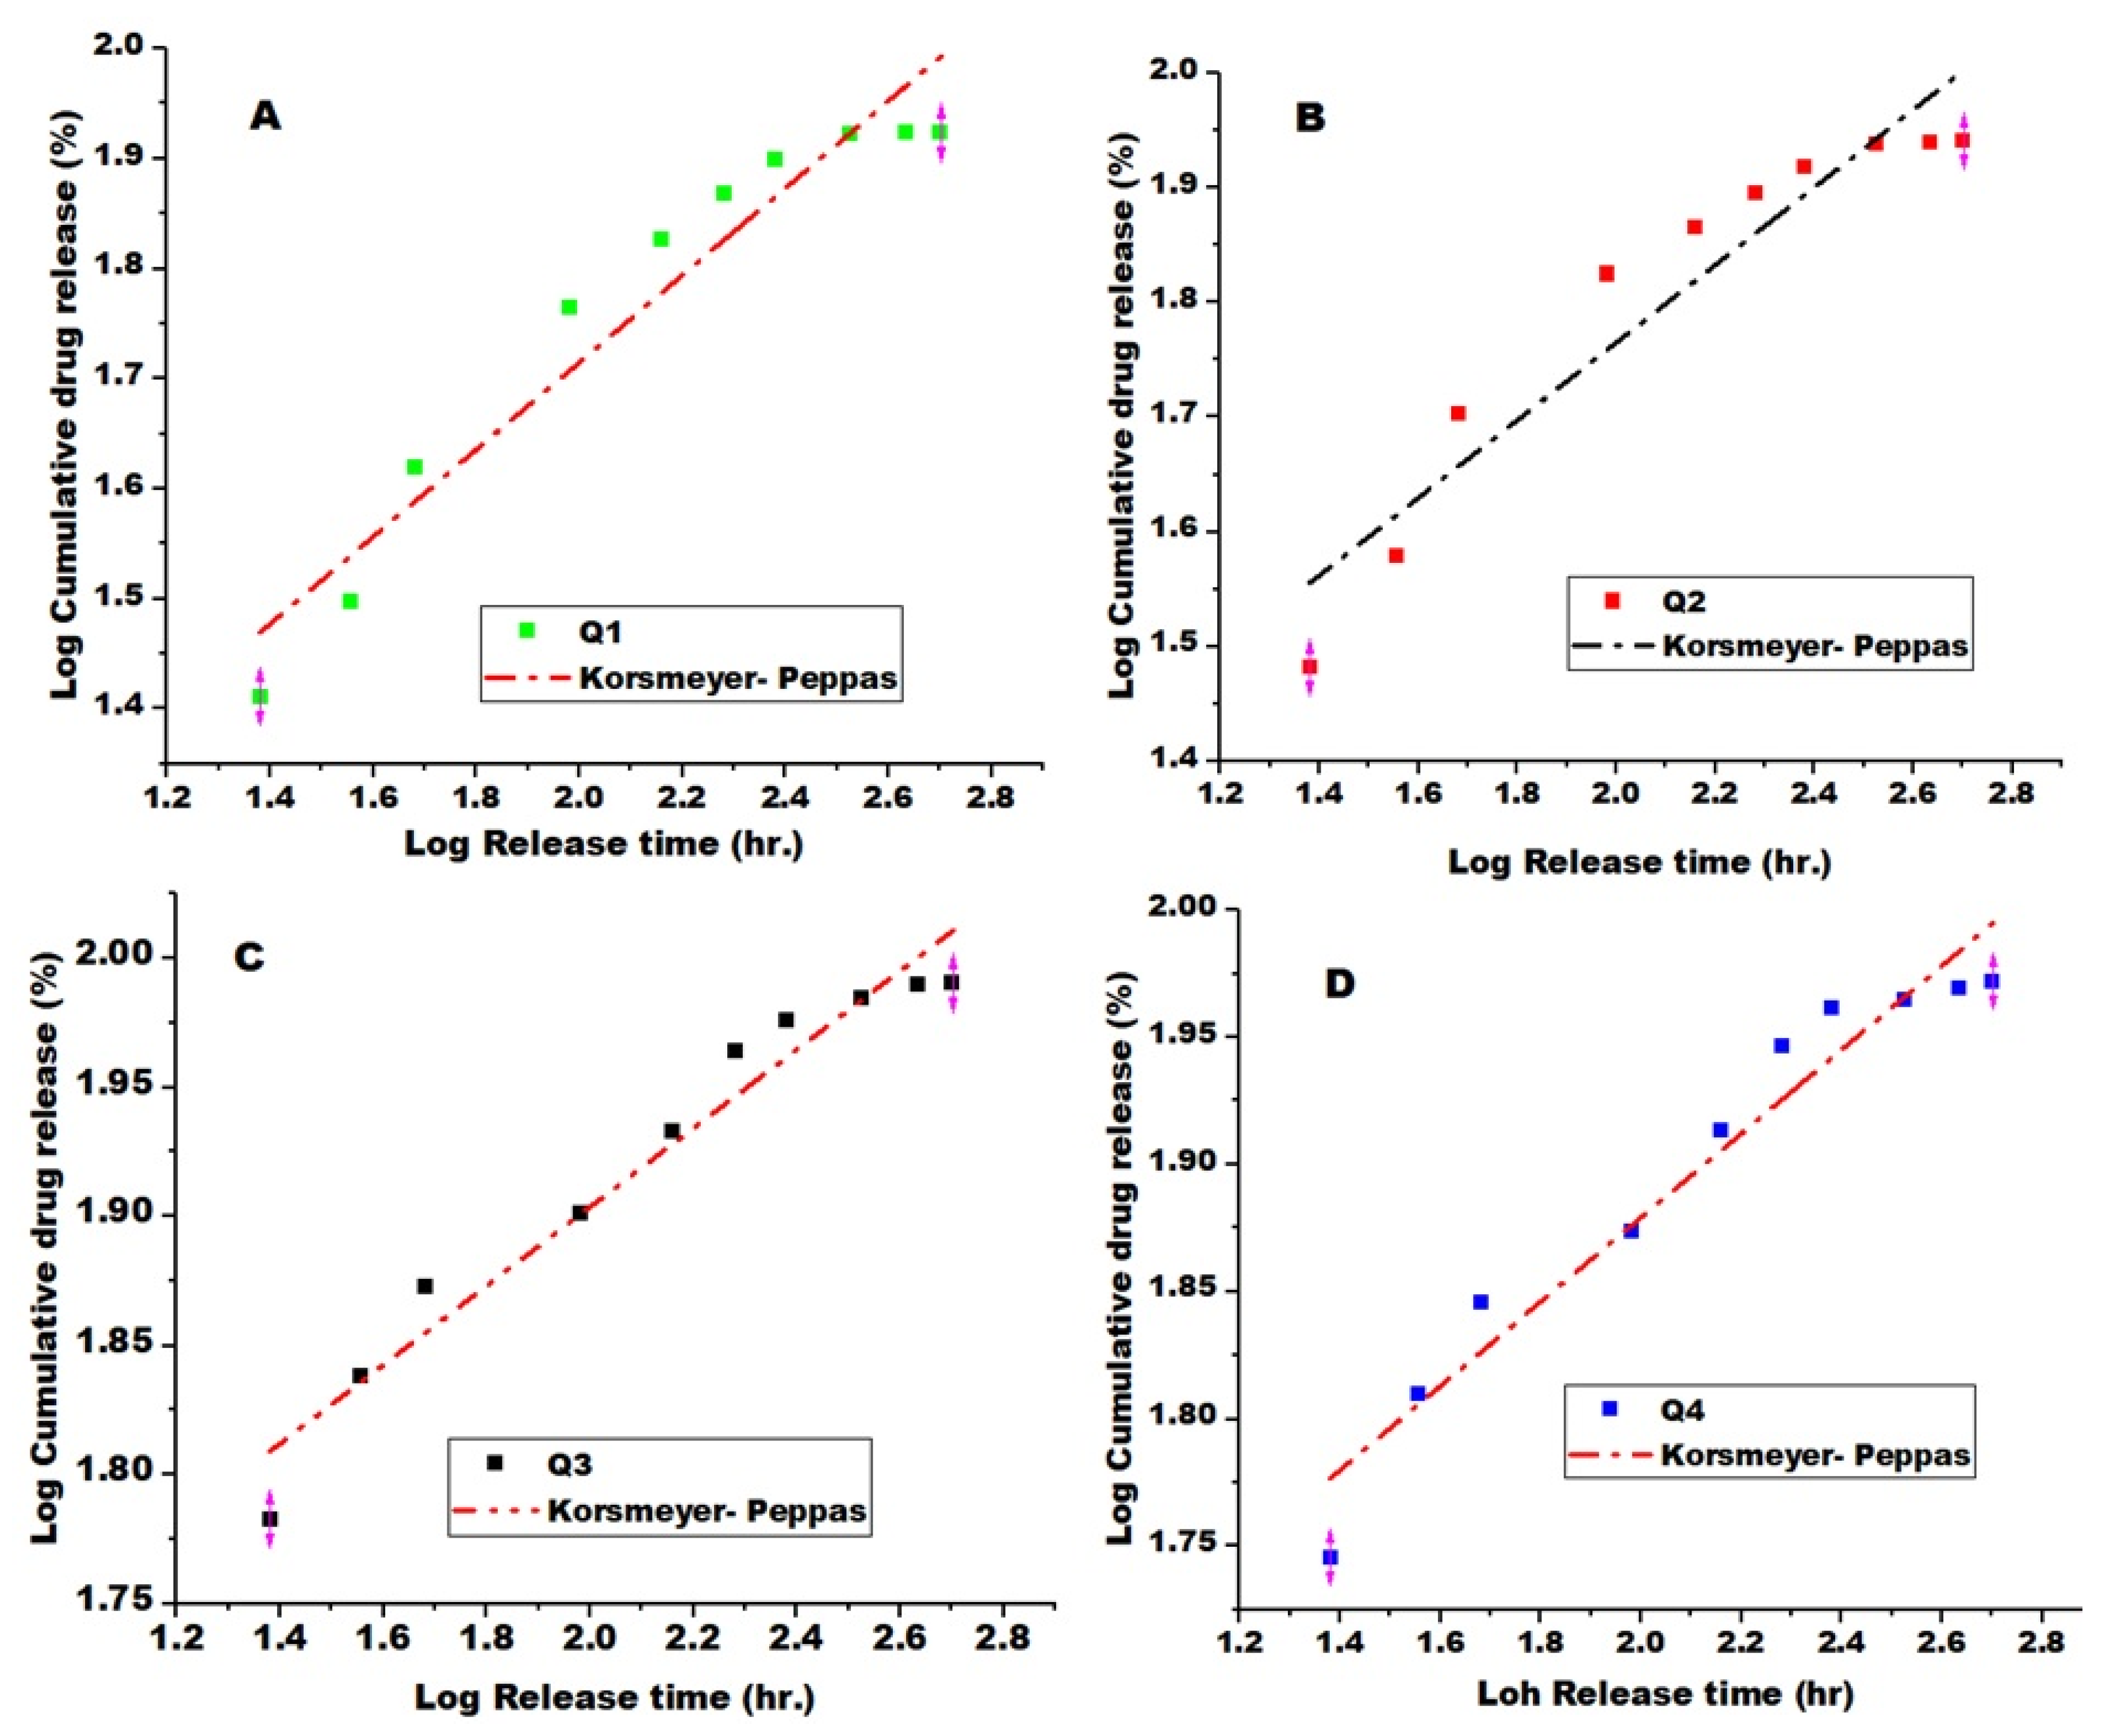
Figure 9.
Bacterial colonies on Plates of S. aureus and E.coli for Q1, Q2, Q3, and Q4 composite nanofibers .The control samples (buffer solution) are placed in the center, first is MIC1000, second is MIC500, third is MIC250, and fourth is MIC125.
Figure 9.
Bacterial colonies on Plates of S. aureus and E.coli for Q1, Q2, Q3, and Q4 composite nanofibers .The control samples (buffer solution) are placed in the center, first is MIC1000, second is MIC500, third is MIC250, and fourth is MIC125.
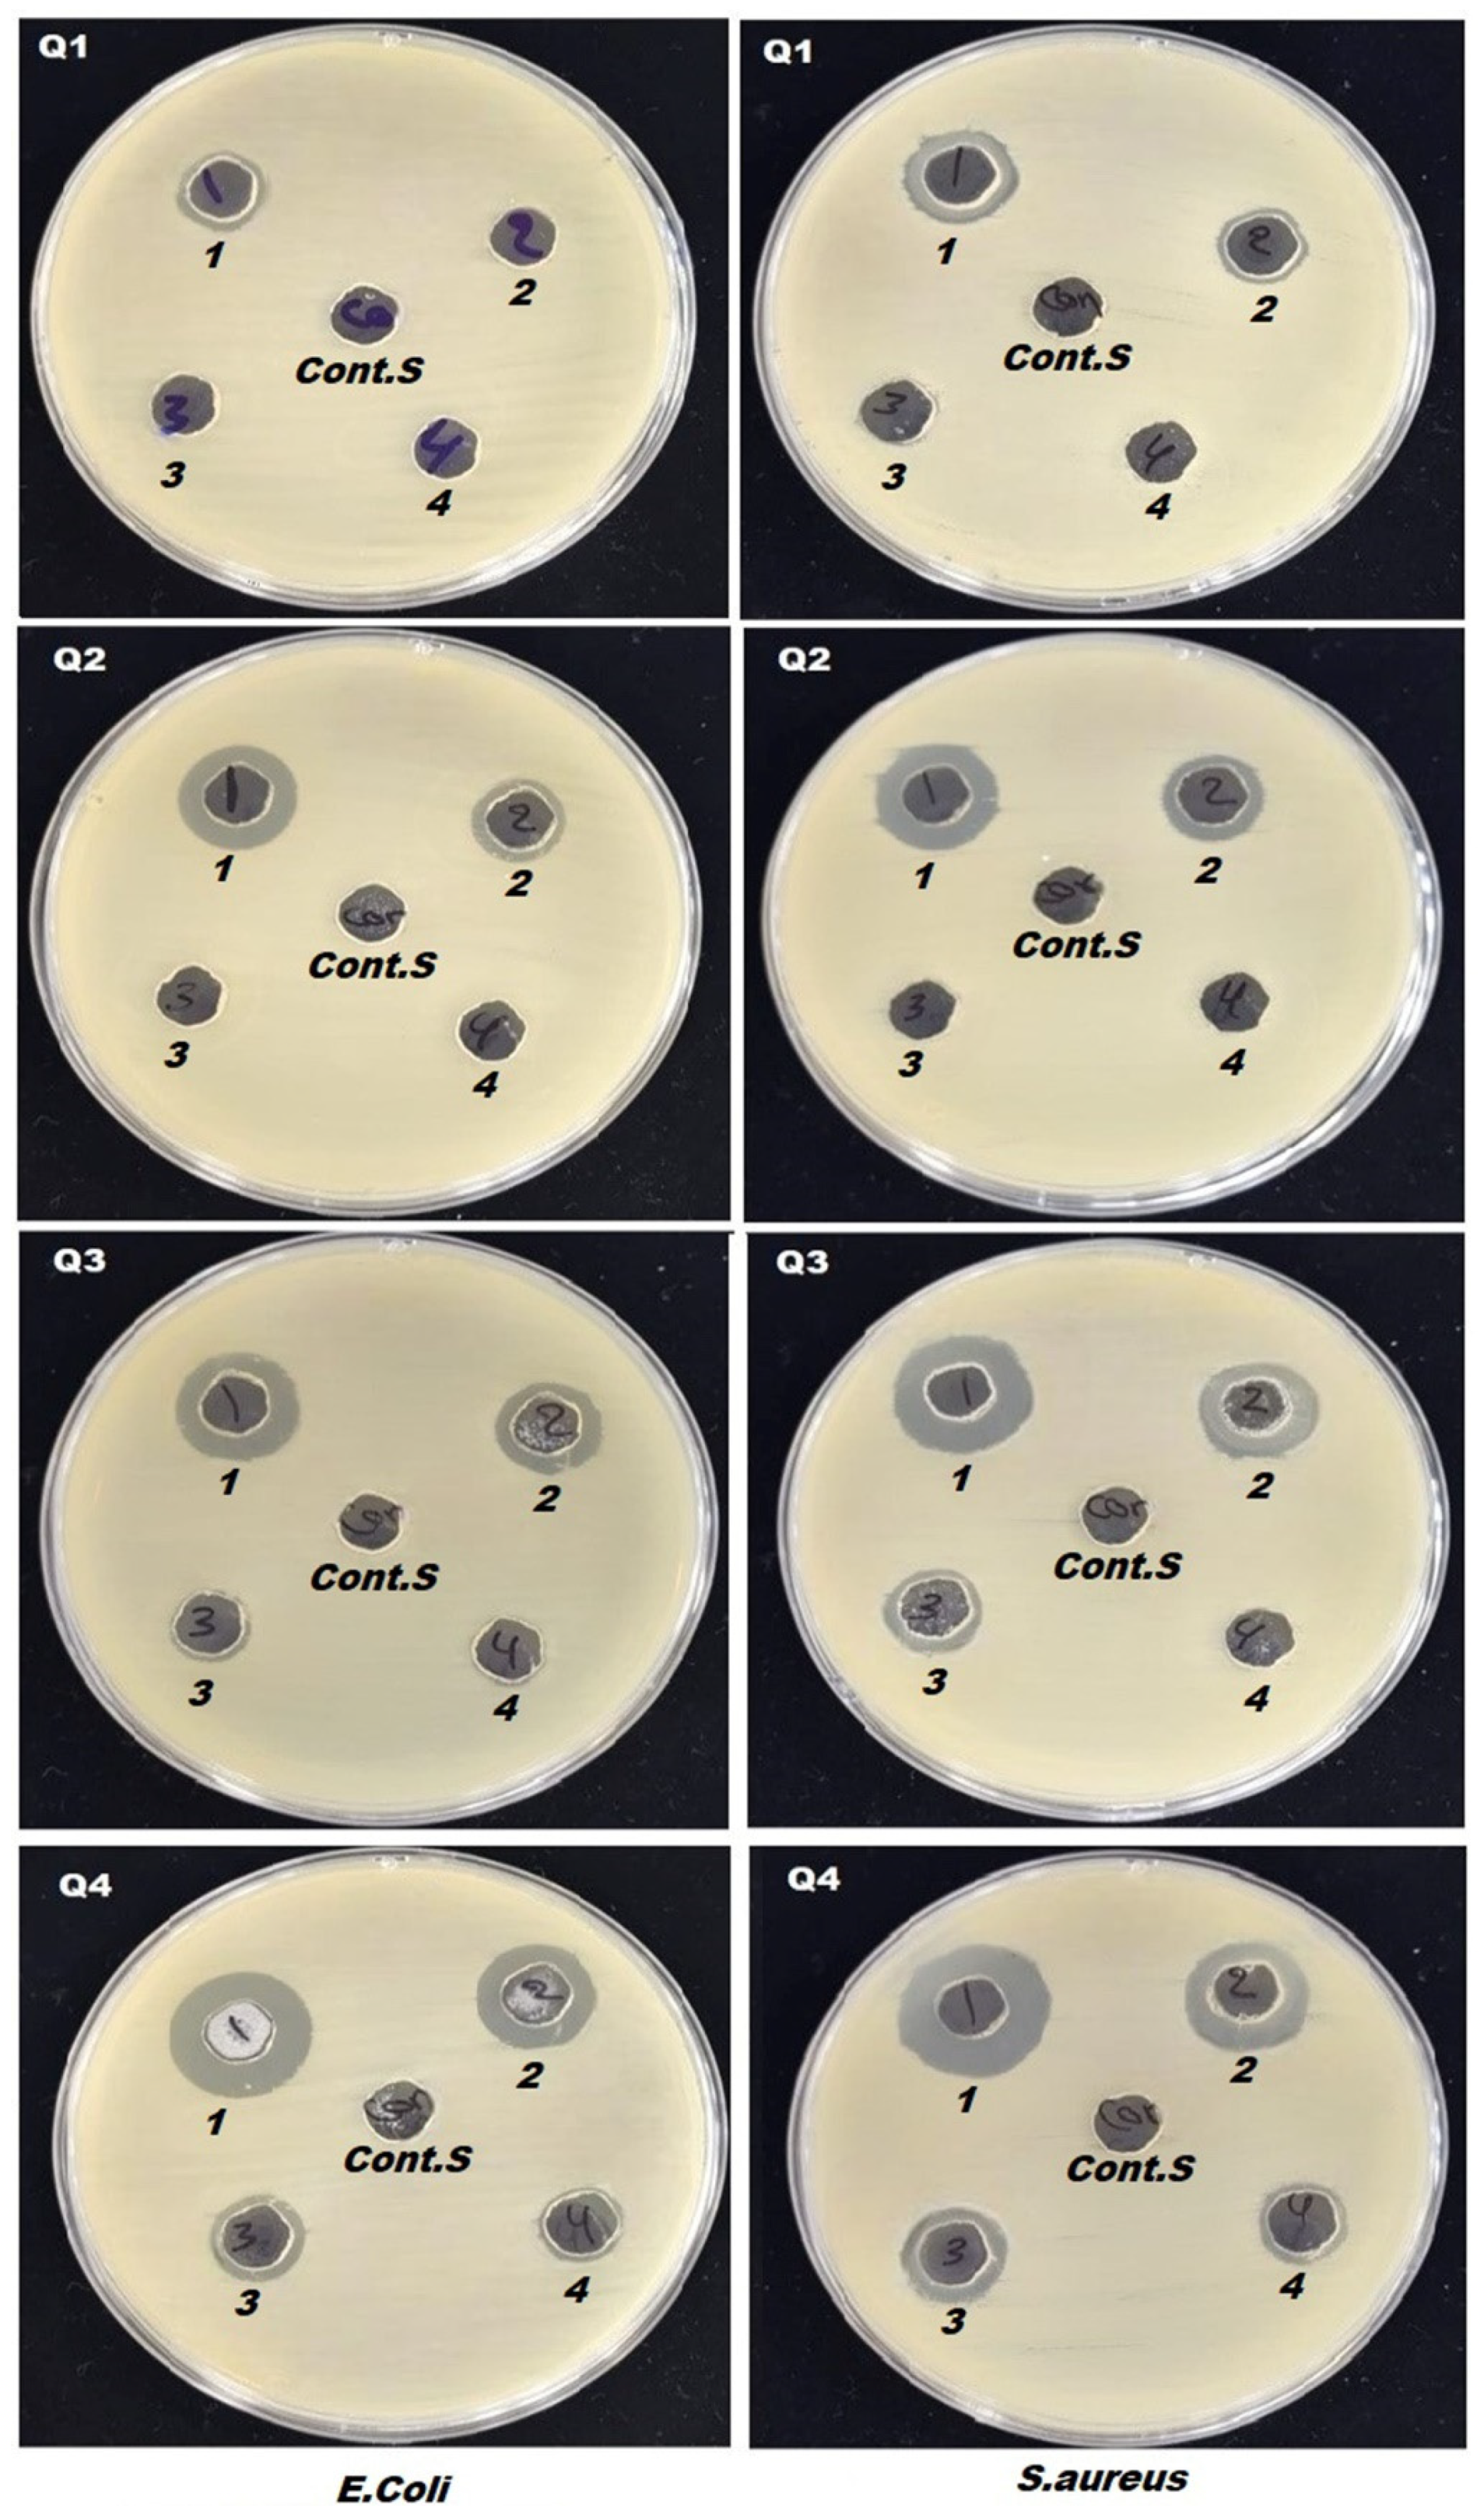
Figure 10.
(A) Cell viability of Q1, Q2, Q3, Q4, and control sample on L929 cells as a function of samples dilution ratio, (B) linear fitting of samples.
Figure 10.
(A) Cell viability of Q1, Q2, Q3, Q4, and control sample on L929 cells as a function of samples dilution ratio, (B) linear fitting of samples.
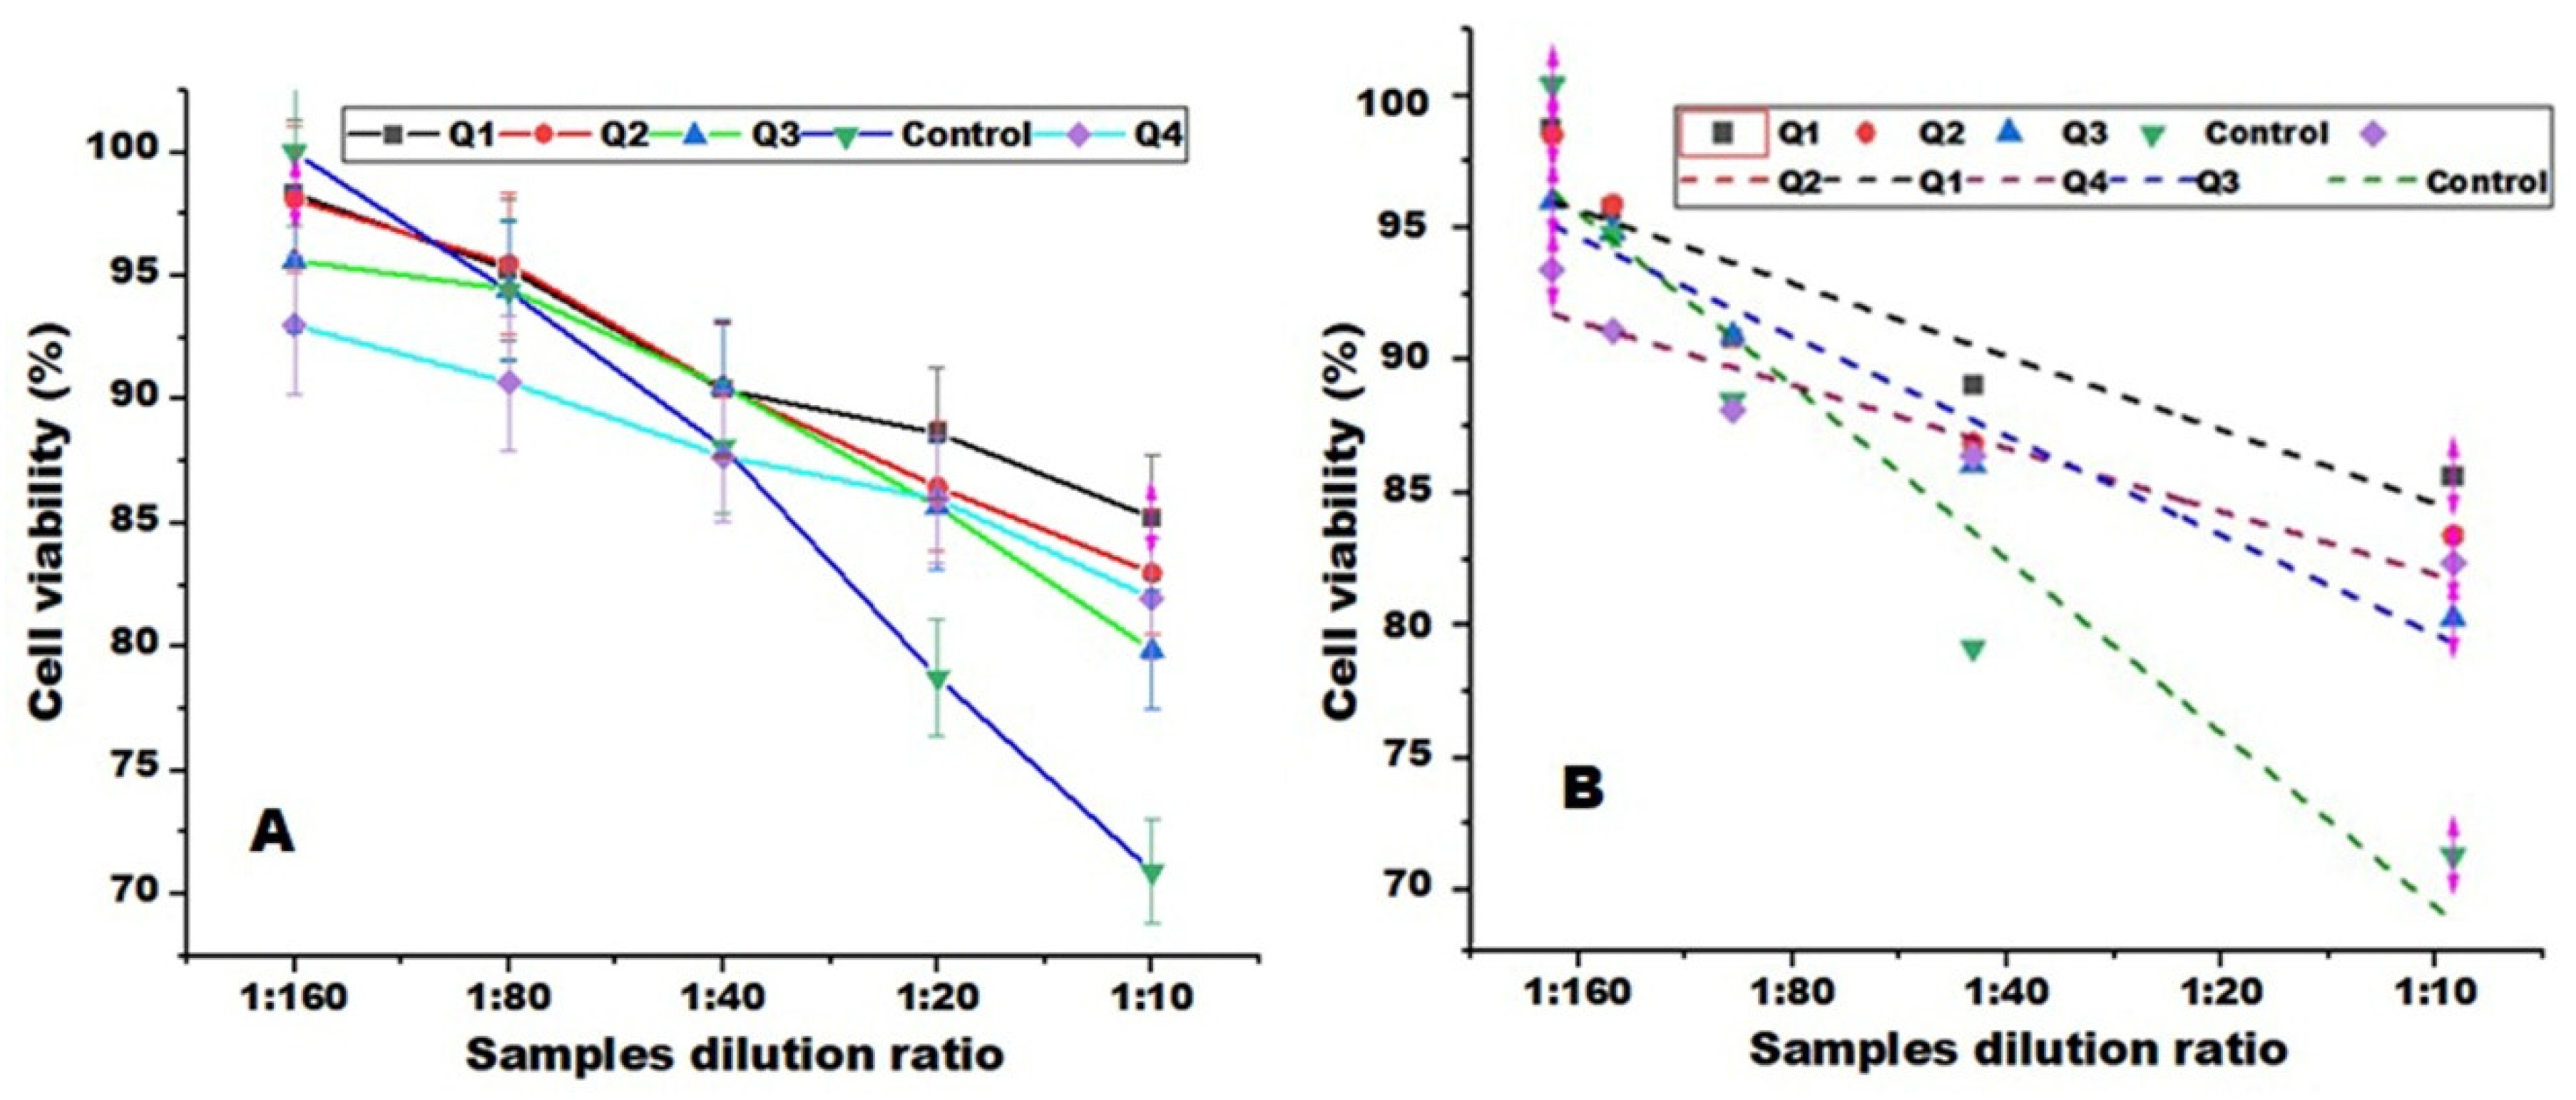

Table 1.
Diameters and ranges of blend and composite nanofibers.
| Samples | Nanofiber diameters (nm) | Range of diameters (nm) |
| PLA: GA | 182±77 | 76-315 |
| PLA: GA: ZnO | 352±245 | 81-1199 |
| PLA: GA: ZnO: 0.1wt. % NAP. | 556±427 | 86-1580 |
| PLA: GA: ZnO: 0.2wt. % NAP. | 566±437 | 122-1766 |
| PLA: GA: ZnO: 0.3wt. % NAP. | 1298±723 | 453-2951 |
| PLA: GA: ZnO: 0.1wt. % MEL. | 327±163 | 86-701 |
| PLA: GA: ZnO: 0.2wt. % MEL. | 312±156 | 81-695 |
| PLA: GA: ZnO: 0.3wt. % MEL. | 333±209 | 134-1193 |
Table 2.
Crystalline properties of nanofibers samples Q1, Q2, Q3, and Q4 for drug delivery applications.
Table 2.
Crystalline properties of nanofibers samples Q1, Q2, Q3, and Q4 for drug delivery applications.
| Sample # | Peak position 2θ (°) |
d-spacing [Å] |
FWHM [°2Th.] |
Degree of crystallinity [%] |
Crystallite Size [Å] | Structural Observation |
| Q1 | 23.17 | 3.84 | 7.42 | 23.26 | 11 | Semi-crystalline PLA with gelatin added |
| Q2 | 22.39 | 3.97 | 5.44 | 17.54 | 15 | Effect of ZnO addition observed |
| Q3 | 23.18 | 4.25 | 9.38 | 30.92 | 9 | Naproxen loaded; more amorphous |
| Q4 | 22.89 | 3.88 | 9.24 | 28.44 | 9 | Meloxicam loaded; more amorphous |
Table 3.
The pharmacokinetic parameters for drug release from the prepared nanofibers and static analysis (t-Test: Paired Two Sample for Means).
Table 3.
The pharmacokinetic parameters for drug release from the prepared nanofibers and static analysis (t-Test: Paired Two Sample for Means).
| Samples | Zero Order | First Order | Higuchi | Korsmeyer- Peppas | P-values | |||||
|
K0 (hr-1) |
R2 |
K1 (hr-1) |
R2 |
KH (hr -0.5) |
R2 | n | KPP | R2 | ||
| Q1 | 0.127 | 0.754 | 0.0035 | 0.871 | 0.12 | 0.900 | 0.395 | 1.470 | 0.934 | 0.003 |
| Q2 | 0.119 | 0.712 | 0.0038 | 0.860 | 0.129 | 0.870 | 0.340 | 1.555 | 0.910 | 0.01 |
| Q3 | 0.0794 | 0.734 | 0.0065 | 0.953 | 0.661 | 0.882 | 0. 153 | 1.783 | 0.960 | 0.046 |
| Q4 | 0.082 | 0.720 | 0.0043 | 0.880 | 0.162 | 0.863 | 0.165 | 1.776 | 0.95 | 0.048 |
Table 4.
Inhibition zone and minimum inhibitory concentration (MIC) of the antibacterial activity of nanofibers against two types of bacteria, S. aureus and E. coli. P-values less than 0.05 are considered.
Table 4.
Inhibition zone and minimum inhibitory concentration (MIC) of the antibacterial activity of nanofibers against two types of bacteria, S. aureus and E. coli. P-values less than 0.05 are considered.
| Samples | Dilute concentrations |
MIC (mg/L) |
Inhibition zoon (mm) for (S. aureus) | Inhibition zoon (mm) for (E. coli) |
| Control sample | - | 0 | 0 | |
| Q1 | Stuck concentration | MIC1000 (1000) | 11±2.21 | 13±2.5 |
| 50% | MIC 50 (500) | 0 | 11±2.3 | |
| 25% | MIC 25 (250) | 0 | 0 | |
| 12.5% | MIC 12.5 (125) | 0 | 0 | |
| Q2 | Stuck concentration | MIC1000 (1000) | 15±2.9 | 16±3.2 |
| 50% | MIC 50 (500) | 12±2.4 | 13±2.6 | |
| 25% | MIC 25 (250) | 0 | 0 | |
| 12.5% | MIC 12.5 (125) | 0 | 0 | |
| Q3 | Stuck concentration | MIC1000 (1000) | 16±3.1 | 17±3.7 |
| 50% | MIC 50 (500) | 14±2.8 | 15±3.1 | |
| 25% | MIC 25 (250) | 10±1.8 | 12±2.2 | |
| 12.5% | MIC 12.5 (125) | 0 | 0 | |
| Q4 | Stuck concentration | MIC1000 (1000) | 17±3.6 | 18±3.4 |
| 50% | MIC 50 (500) | 13±2.6 | 15±2.9 | |
| 25% | MIC 25 (250) | 11±2.2 | 12±2.4 | |
| 12.5% | MIC 12.5 (125) | 0 | 0 |
Table 5.
Mean absorbance and standard deviation of (cell number per mL) were measured at a wavelength of 570 nm for samples of L929 cells at different dilution rates.
Table 5.
Mean absorbance and standard deviation of (cell number per mL) were measured at a wavelength of 570 nm for samples of L929 cells at different dilution rates.
| Dilution rates | Samples | ||||
| Q1 | Q2 | Q3 | Q4 | Control | |
| Mean ± SD | Mean ± SD | Mean ± SD | Mean ± SD | Mean ± SD | |
| 1:160 | 451 ± 11 | 450 ± 18 | 438± 11 | 426± 10 | 461 ± 5 |
| 1:80 | 437 ± 5 | 438 ± 9 | 433 ± 11 | 416± 5 | 433 ± 10 |
| 1:40 | 414 ± 6 | 415 ± 6 | 415 ± 6 | 402± 5 | 404 ± 6 |
| 1:20 | 406 ± 10 | 396 ± 7 | 393 ± 5 | 394± 8 | 36 1± 13 |
| 1:10 | 391 ± 9 | 380 ± 6 | 366 ± 12 | 376± 11 | 325 ± 5 |
| R2 | 0.984 | 0.993 | 0.96 | 0.987 | 0.990 |
| IC 50 | 15.68 | 13.365 | 12.723 | 17.111 | 7.934 |
IC50: Half-Maximal Inhibitory Concentration, R2: Correction factor.
Disclaimer/Publisher’s Note: The statements, opinions and data contained in all publications are solely those of the individual author(s) and contributor(s) and not of MDPI and/or the editor(s). MDPI and/or the editor(s) disclaim responsibility for any injury to people or property resulting from any ideas, methods, instructions or products referred to in the content. |
© 2025 by the authors. Licensee MDPI, Basel, Switzerland. This article is an open access article distributed under the terms and conditions of the Creative Commons Attribution (CC BY) license (https://creativecommons.org/licenses/by/4.0/).
Copyright: This open access article is published under a Creative Commons CC BY 4.0 license, which permit the free download, distribution, and reuse, provided that the author and preprint are cited in any reuse.


