
Submitted:
08 April 2025
Posted:
08 April 2025
You are already at the latest version
Abstract
Lung ultrasound (LUS) and thoracic ultrasound (TUS) are commonly used tools in acute care and anesthesia, enabling rapid, bedside assessment of pulmonary pathology and enhancing procedural safety. This scoping review synthesizes current evidence on the diagnostic and procedural applications of LUS and TUS across a wide range of clinical scenarios including pneumothorax, pulmonary edema, pneumonia, pleural effusion, and acute respiratory distress syndrome (ARDS). Emphasis is placed on the diagnostic performance of ultrasound compared to traditional modalities such as chest X-ray and CT. The review also evaluates emerging approaches such as anterior-only lung ultrasound for ARDS phenotyping, quantitative B-line analysis, and COVID-19 risk stratification using LUS scoring. In procedural contexts, we explore real-time guidance for central venous catheter placement, intubation confirmation, and thoracentesis. The review follows PRISMA-ScR guidelines and highlights current gaps in the literature while proposing future directions to expand ultrasound use in high-acuity environments. This comprehensive synthesis reinforces the versatility, safety, and diagnostic value of LUS and TUS in acute care and anesthesiology practice.
Keywords:
Lung Ultrasound
; Thoracic Ultrasound
; Point-of-Care Ultrasound (POCUS)
; Acute Care
; Anesthesiology
; Pleural Effusion
; ARDS
; Pneumothorax
; Pulmonary Edema
; Ultrasound-Guided Procedures
; Thoracentesis
1. Introduction
Thoracic point-of-care ultrasound (POCUS) is gaining prominence in acute care medicine and anesthesiology as a rapid, non-invasive diagnostic and procedural modality [1,2]. While cardiac ultrasound is widely established, the utility of lung ultrasound (LUS) and thoracic ultrasound (TUS) in pulmonary and pleural evaluation continues to expand.
LUS is a specialized sonographic modality used to analyze the lung parenchyma, pleura, and pleural space by detecting characteristic artifacts created by the interaction of ultrasound waves with air, fluid, and tissue [3]. It is most useful in the diagnosis and assessment of lung pathology, such as pleural effusion, pneumothorax, and pulmonary edema. TUS, in contrast, provides a more comprehensive investigation of thoracic structures, including the chest wall (ribs, intercostal spaces, and neurovascular bundle), diaphragm, trachea, central vasculature and, in some cases, limited cardiac structures such as the cavoatrial junction (CAJ). In addition to detecting artifacts, TUS is key in guiding thoracic procedures, such as thoracentesis, vascular access, and percutaneous chest tube thoracostomy [1,2,4].
A scoping review approach was chosen to capture the wide range of evolving applications for LUS and TUS. The pace of change in the clinical application of ultrasound is perhaps best illustrated by the recent addition of LUS to the 2024 diagnostic criteria for ARDS [5]. This review aims to summarize current applications of LUS and TUS in acute care and anesthesiology, with a focus on both diagnostic and procedural utility, following the PRISMA-ScR framework.
2. Methods
The study protocol and all data are available on Open Science Framework (OSF) [6]. Ethics approval for scoping reviews is not required at our institution; however, for transparency, our review adheres to the Preferred Reporting Items for Systematic Reviews and Meta-Analyses extension for scoping reviews (PRISMA-ScR) guidelines.
2.1. Search Strategy
To ensure the relevance and quality of the reviewed literature, a search strategy was designed and conducted by a research librarian (C.V.). The literature review was not limited to a timeframe to allow for a complete review of the data available on the topic. The search was conducted between December 1, 2024, and March 20, 2025. The screening process followed a systematic approach, first identifying publications using MEDLINE, EMBASE, and Cochrane Central Register. The individual search strategies can be found on the published OSF registration [6].
Covidence software (Veritas Health Innovation, Australia) was used for abstract and full-text screening. Abstracts and full texts were screened independently and in duplicate by two authors with consensus by a third author used for discrepancies.
2.2. Study Selection
Inclusion Criteria: Studies of adult patient populations (Age 18 or older) in the intensive care unit, hospital ward, emergency department, urgent care and perioperative setting looking at the use of TUS and LUS as a diagnostic or procedural modality. Preprints and relevant clinical guidelines, provided they contained substantial data related to thoracic ultrasound applications were also included.
Exclusion criteria: Commentaries, editorials, conference literature, and opinion pieces, as well as studies not presenting primary data or evidence, were excluded.
While most topics in this scoping review were explored through structured database searches and screened using Covidence as outlined above, the approach for thoracentesis and percutaneous chest tube placement differed due to the nature of the literature in this area. For these procedures, we employed purposive sampling, drawing on the senior author’s expertise in procedural thoracic ultrasound and longstanding familiarity with the field. Key studies were selected based on expert knowledge and supplemented with targeted citation tracking. The inclusion criteria applied to database-derived studies were uniformly used during purposive sampling to maintain methodological consistency.
This methodological adaptation is consistent with established guidance for scoping reviews. The JBI Manual for Evidence Synthesis supports the use of expert consultation and targeted searches when conventional database strategies may be insufficient [7]. Similarly, Arksey and O’Malley emphasize the flexibility of scoping reviews, allowing for the inclusion of expert-identified literature when methodologically appropriate [8].
2.3. Bias Assessment
In keeping with the PRISMA-ScR guidelines, studies were not assessed for applicability, risk of bias, or publication bias.
3. Results
A total of 4,257 abstracts and publications were identified through the initial database searches. After removing 532 duplicates and screening 1,922 titles and abstracts, 280 full-text articles were assessed for eligibility. Of these, 206 were excluded for not meeting inclusion criteria. Ultimately, 74 studies meeting all criteria were included in the final analysis. The selection process is detailed in the PRISMA-ScR flow diagram (Figure 1).
3.1. Study Characteristics
Included studies encompassed a diverse range of designs, including systematic reviews, randomized control trials, controlled trials, cohort studies, case control studies, and observational studies. Studies were published across various regions and clinical environments, including intensive care units, hospital wards, emergency departments, and perioperative settings.
3.1.1. Scope of Thoracic Pathologies Assessed
Thoracic ultrasound was most frequently evaluated in the context of:
- Pleural effusion
- Pneumothorax
- Pulmonary edema
- Pneumonia
- Acute respiratory distress syndrome
- COVID-19-related lung disease
Several studies also addressed procedural applications, particularly for:
- Thoracentesis
- Central venous catheter insertion
- Intubation confirmation
- Intercostal artery localization via Doppler
3.2. Diagnostic Applications
LUS and TUS consistently showed diagnostic accuracy comparable to CT and superior to CXR for the detection of lung pathology [9].
3.3. Procedural Applications
Multiple studies confirmed the utility of TUS in enhancing procedural safety. The use of color Doppler to identify intercostal vessels during thoracentesis reduced the risk of vascular injury. Studies consistently report that ultrasound guidance shortens access times and reduces insertion-related complications during CVC and endotracheal tube (ETT) placement [10,11,12]. These findings illustrate how TUS is increasingly being used not only to support diagnosis but also to reduce complications during bedside procedures.
To fully appreciate how ultrasound can detect thoracic pathology and guide procedures, it is essential to understand the underlying physics that govern image generation and artifact formation. The following section outlines the foundational principles of lung ultrasonography and the unique acoustic interactions that occur at air-tissue interfaces in the thorax.
4. Discussion
4.1. Physics of Lung Ultrasound
Ultrasonography is based on the passage of sound waves through tissue with subsequent reflection of waves back to the emitting transducer, which converts the sound into electrical signals and creates a two-dimensional image [4,13,14]. The physical properties of the medium through which sound waves pass and the interfaces between different types of tissues dictate the details of the image. Dense tissues reflect more sound back to the transducer, leading to more received signal and a more “hyperechoic” or “bright” area on the screen, while less dense tissues reflect less sound and are interpreted by the machine as “hypoechoic” or “dark.” Dense tissues also have higher impedance and generally transmit sound waves faster, while less dense tissues have lower impedance and transmit sound waves slower [14]. Interfaces between tissues that transmit sound at significantly different speeds cause marked reflection and refraction of ultrasound beams, as governed by Snell’s law (Sin(r)÷ Sin(i) =C1/C2) (Figure 2) [13]. This interplay between sound waves and lung tissue creates artifacts in both normal lungs and lung parenchyma in various states of pathology. For instance, within normally inflated lungs, the sound initially passes into soft tissue (speed 1540m/s) before meeting an interface with air-filled alveoli (speed 330m/s) leading to most of the sound being reflected to the transducer. This results in a bright hyperechoic line overlaying a dark black shadow representing the pleural line and lung parenchyma below.
Understanding the anatomical and physical basis of lung ultrasound provides a foundation for recognizing normal as well as pathologic sonographic artifact patterns. The subsections below elaborate on these patterns to enhance understanding and interpretation.
4.2. Normal LUS Findings
A-Lines
When ultrasound signals are reflected from the pleural membrane due to impedance mismatch with inflated alveoli, a large amount of signal is returned to the ultrasound probe. Some of these signals are absorbed and transduced by the probe to create the image of the pleural line, but some of it is reflected from the probe back into the tissue again. This signal can be reflected between the pleural line and the probe multiple times, creating reverberation artifact or “ghost lines” that mimic the appearance of the pleural line and create hyperechoic, horizontal lines at regular intervals deep to the pleural line (Figure 3) [15]. Visualization of reverberation artifact, or A-lines, is a hallmark of normally aerated lungs and can help exclude interstitial syndromes or pulmonary edema when present.
Lung Sliding
During the respiratory cycle, the visceral and parietal pleura move relative to each other. Utilizing ultrasound, this dynamic movement can be visualized as a shimmering effect along the pleural line referred to as “lung sliding.” This movement can be seen with two dimensional (2D) ultrasound (Video 1) and motion (M) mode (Figure 4) [16]. When using M mode, it is classically described as the pattern of “sandy beach” with the proximal subcutaneous tissue representing water, and the movement of the lung parenchyma representing a beach [16]. The presence of lung sliding suggests that the evaluated region is being actively ventilated with the lung parenchyma reaching the pleural line, and it significantly reduces the likelihood of pneumothorax at thatsite [10].
Lung Pulse
Lung pulse refers to pleural movement caused by cardiac motion, creating a subtle sliding effect between the pleural surfaces [17]. Unlike lung sliding, which reflects the normal ventilatory cycle, lung pulse is better seen with low ventilation or in the absence of ventilation in situations such as low tidal volume ventilation, regional hypoventilation from obstructive lung disease, or contralateral bronchial intubation [17].
B Lines
B-lines are vertical, hyperechoic artifacts that extend from the pleural line to the maximum image depth, move with lung sliding, and obliterate A-lines (Video 2) [18]. They indicate a process of irregular alveolar filling where some alveoli are inflated with air while others are filled with fluid, purulent material, or inflammatory byproducts. Isolated, scattered vertical lines (Figure 5A) are considered normal, while 3 or more B-lines within a single window are considered abnormal and described as alveolar-interstitial syndrome. The greater the disruption of the pleural surface by B-lines, the more severe the underlying pathology is likely to be (Figure 5 A, B, C). This pattern is found in 100% of patients with acute cardiogenic pulmonary edema but only 8% of those with COPD exacerbations, making ultrasound a valuable tool for distinguishing between these conditions [19,20].
4.3. Ultrasound Machine Configuration
Because LUS interpretation relies on artifact detection, proper machine settings are key to image acquisition and diagnostic accuracy. Most ultrasound settings utilize tissue harmonic filters to minimize artifactual findings, but this is undesirable in LUS [21]. It is therefore essential to select the ‘lung’ or ‘pulmonary’ preset available on most commercial POCUS machines; these settings disable the filters and obtain the best visualization of lung artifact. When performing TUS and LUS, four types of transducers can be used, each offering distinct advantages based on imaging depth, resolution, and clinical application (Figure 6). The following subsections elaborate on the different uses of the four types of transducers.
Linear Transducers
High-frequency linear probes, operating at 5–12 megahertz (MHz), provide high-resolution imaging of superficial structures including the pleural line, ribs, and intercostal arteries and veins. Linear transducers are effective for detecting movement of the pleural line in the evaluation of pneumothorax (Figure 4) and for the assessment of vascular structures during thoracic procedures to prevent vascular injury. These transducers, however, are incapable of evaluating deeper structures and inadequate in most cases of pleural effusion, lobar pneumonia, or pulmonary edema [22,23].
Phased-Array Transducers
Low-frequency phased-array transducers (2-5MHz) provide lower resolution images when compared to high frequency transducers in exchange for greater tissue penetration. The relatively small probe footprint allows placement between the ribs and can improve pleural visualization. This probe is well suited in the evaluation of pulmonary edema, pleural effusion, and consolidation [22].
Curvilinear (Convex) Transducers
The curvilinear probes operate at 2-5 MHz and provide lower resolution images with increased depth to allow evaluation of pulmonary edema, pleural effusion, and consolidations. The primary difference from the phased-array probe in LUS is the large footprint which can allow visualization of a larger surface of lung tissue, underlying spine, or pleural fluid in one window but can be confounded by rib shadows [24].
Microconvex Transducers
The microconvex transducer operates at a frequency of 3-6 MHz, combining features of linear and curvilinear probes; microconvex transducers provide a balance of resolution and field of view [24].
With these four primary transducer types, LUS and TUS can be used to thoroughly assess the thorax and lungs from various angles and depths. In the following sections, we discuss individual procedural and diagnostic applications for the most common thoracic and lung pathologies and procedures beginning with intubation assessment.
5. Procedural Uses of Thoracic Ultrasound
5.1. Intubation Assessment
When performing endotracheal intubation (ETT), it is essential to confirm that the ETT is properly positioned in the trachea at the correct depth. Unrecognized misplacement in the esophagus can lead to life-threatening complications [25]. Traditional methods of ETT verification include auscultation of bilateral lung sounds which is unfortunately insensitive, CXR which can be slow and not always available, and quantitative capnography which cannot assess ETT depth or evaluate for right mainstem intubation. Ultrasound of the trachea and lungs can verify both the tracheal placement and location of the ETT after intubation. Utilizing a linear probe placed across the distal neck (Figure 7B-C), clinicians can visualize a malpositioned ETT in the esophagus as a second air-filled structure lateral to the trachea, mandating immediate removal and tracheal placement. To directly visualize the ETT in the larynx in the same view, studies have shown that inflating and deflating the ETT cuff rotating the ETT in the trachea and placing color Doppler over the cuff may be useful approaches [25,26,27].
The combination of LUS and tracheal ultrasound has been shown to be highly sensitive, more accurate, and faster than capnography in confirming ETT placement [15]. POCUS airway assessment has also been evaluated in obese, high risk and critically ill patients. In obese patients, verification using ultrasound was significantly faster than auscultation and capnography, reducing the median confirmation time from 55 to 43 seconds in this patient population that can be challenging to intubate (p < 0.0001) [28]. Similarly, a large systematic review of over 2500 patients confirmed that ultrasound maintains 99% sensitivity for tracheal ETT placement in cardiac arrest patients, although specificity was slightly lower at 84% in this subset [29]. Despite its advantages, ultrasound does not completely replace other confirmation methods, particularly in challenging airway cases. False positives may occur if the artifacts that indicate esophageal intubation are not recognized [21,28,29,30,31,32,33].
Future Directions
For acute care and anesthesia clinicians, training in tracheal ultrasound technique, including the identification of tracheal versus esophageal ETT placement and lung sliding, should be considered. Future studies should focus on protocol standardization, optimizing ultrasound-based confirmation workflow, and further evaluating its impact on patient outcomes.
5.2. Central Venous Catheter Placement
The use of ultrasound for CVC placement and verification has been accepted as standard of care [10,34]. Ultrasound is noninferior to CXR for confirming catheter placement while providing faster results (10 minutes vs 50 minutes), reducing radiation exposure, and lowering healthcare costs [35,36]. CVC placement can be verified using a modified subcostal view that brings the superior vena cava (SVC) and cavoatrial junction (CAJ) into view. This modified view is obtained by first optimizing the long-axis view of the inferior vena cava (IVC). Once the IVC is clearly visualized, the imaging depth should be increased, and the transducer angled cephalad to bring the SVC into the ultrasound sector. In this view, the SVC appears at the bottom of the sector, typically around the 5 to 6 o’clock position, as it enters the right atrium (RA) [37]. This view allows dynamic monitoring of the guidewire, facilitating confirmation of accurate positioning at the CAJ and enabling precise determination of the optimal catheter insertion depth (Figure 8). This method significantly improved success rates (100% vs. 87.5%, p < 0.05) and reduced access times (26.8 ± 12.5 seconds vs. 44.8 ± 54.9 seconds, p < 0.05) [35]. When CAJ views were inadequate, contrast-enhanced ultrasound (CEUS) successfully verified catheter position in 29.7% of cases, offering an alternative for challenging placements [38]. Beyond verification, POCUS is especially useful in live guidance of CVC placement [10]. While it is most used for internal jugular and femoral venous access, POCUS can also aid in subclavian vein cannulation. A study comparing ultrasound guidance to the blind cannulation for subclavian venous catheter placement found that pneumothorax was completely avoided in the ultrasound group (0% vs. 4.9%), with lower rates of arterial puncture, hemothorax, and brachial plexus injury [35,36].
These findings collectively support ultrasound as an essential component of CVC insertion, guidance, and post-procedural confirmation.
Future Directions
Institutions should consider replacing routine CXR-based CVC verification with ultrasound protocols, particularly in the ICU, intraoperative, and perioperative settings. Future research should focus on standardizing ultrasound-guided CVC placement techniques. Further investigation is warranted to evaluate the impact of LUS standardization on diagnostic precision and patient outcomes in perioperative care.
5.3. Thoracentesis and Percutaneous Chest Tube Placement
Thoracentesis is a common procedure performed in acute care settings to manage and diagnose pleural effusions. In cases of empyema or moderate to large pneumothoraces, percutaneous chest tube thoracostomy is used as the treatment and management. Procedural complications associated with these two procedures include hematoma, hemothorax secondary to intercostal vessel laceration, and pneumothorax [39]. These complications can significantly increase morbidity, mortality, and hospital-associated costs [39]. The incidence of these is thought to be underreported in the literature due to a lack of randomized trials [38,39]. A meta-analysis by Gordon et al. in 2010 revealed an iatrogenic pneumothorax rate during thoracentesis of 9.3%, with a significant decrease in the rate to 4.0% when using ultrasonography (odds ratio 0.3, 95% CI, 0.2-0.7) [40]. While the initial goal of ultrasound-assisted thoracentesis was to confirm safe needle placement and sufficient thoracic fluid, it can provide much more actionable data [38]. Ultrasound assistance can also help proceduralists avoid damaging vascular structures. Anatomic variation and tortuous courses of the intercostal arteries (Figure 9 & Video 4-5) are more prevalent than previously thought, raising concerns that relying solely on traditional landmark-based guidance approaches could leave some patients at higher risk for neurovascular bundle damage, hemorrhage, and hemorrhagic shock [12,41].
Multiple recent studies have shown that linear ultrasound with Doppler can visualize the intercostal space and assess the vascular structures and thus avoid these structures upon needle insertion [42,43]. Fraser et al. recently introduced the DIVOT protocol (Table 1), which utilizes high-frequency linear probes and Doppler to directly visualize intercostal arteries and reduce the risk of vascular injury during thoracentesis and percutaneous chest tube placement.
6. Diagnostic uses of LUS
In this section, the evidence underlying the diagnostic use of LUS in various clinical scenarios will be summarized.
6.1. Pneumothorax
Pneumothorax is defined by the presence of air in pleural space. Current practice often utilizes CXR to detect pneumothorax. However, CXR may miss small areas of pleural separation and typically requires an upright position for optimal detection [44]. Unfortunately, this positioning often cannot be utilized in acute care settings. In contrast, LUS allows rapid bedside assessment in the supine position [44,45,46].
The diagnostic accuracy of LUS in pneumothorax remains debated. The traditional approach to identifying pneumothorax with LUS relies on the absence of “normal” lung artifacts including lung sliding, lung pulse, and vertical artifacts (B lines) at the site of sonographic assessment (Table 1). The absence of these artifacts indicates separation of the parietal and visceral pleura by air (Figure 10). Another key feature is the lung point, which marks the interface between the pneumothorax and normal lung. While not highly sensitive, the lung point is 100% specific for pneumothorax [10].
Although sensitivity rates for pneumothorax detection with LUS vary across studies, ranging from 43% to 87%, a 2020 Cochrane review concluded that LUS is both a sensitive and specific tool, particularly for detecting large, clinically significant pneumothoraces [44,45,46]. However, false-negative results may occur due to factors such as body habitus, small pneumothoraces, or operator technique. Conversely, false positives can result from respiratory splinting due to thoracic pain, large parenchymal blebs, or prior pleurodesis. Despite these limitations, LUS remains a valuable diagnostic modality, particularly in critically ill or non-mobile patients.
6.2. Pulmonary Edema
LUS is an accurate and reliable tool for diagnosing pulmonary edema, consistently outperforming CXRs in sensitivity (97%) and specificity (98%) in acute care settings [20,47,48,49]. The sonographic artifact most associated with pulmonary edema is the presence of B-lines (Table 1 & Figure 5). When identified on LUS, B-lines indicate extravascular lung water (EVLW) and are a key finding in diagnosing pulmonary edema [19]. As EVLW increases, the normal A-line pattern shifts to multiple B-lines, which may coalesce in advanced cases, indicating worsening edema [19,20]. This progression reflects the transition from interstitial to alveolar edema [50]. LUS also provides more nuanced information by tracking the cranio-caudal distribution of B-lines which correlate with edema severity.
Recent studies have expanded the applications of LUS, particularly in quantifying B-lines for pulmonary edema; emerging research supports the integration of computer-aided analysis and texture-based imaging techniques into routine LUS practice to create objective, reproducible, and operator-independent diagnostic tools. A study by Brusasco et al. (2019) introduced QLUSS (Quantitative Lung Ultrasound Scoring System), an automated algorithm for B-line quantification [51]. QLUSS demonstrated a strong correlation with EVLW measurements (R² = 0.86), outperforming other LUS scoring systems such as cLUSS (R² = 0.45) and nLUSS (R² = 0.000). Additionally, the intraclass correlation coefficient (ICC) for QLUSS was 0.998, indicating near-perfect inter-rater reliability [51]. These findings suggest that QLUSS could standardize LUS interpretation for pulmonary edema assessment to reduce subjectivity and variability in clinical decision-making. While it appears to be a promising tool in the evaluation of pulmonary edema, QLUSS is limited in the evaluation of other lung pathology including pleural effusion or lung consolidation and is therefore not capable of providing comprehensive lung ultrasound interpretation at this point [51].
6.3. Pneumonia and Empyema
Pneumonia is a leading cause of hospitalization, with approximately 6 million cases reported annually in the United States [52]. Sonographically, pneumonia typically presents as focal B-lines, subpleural consolidations, and dynamic air bronchograms which are echogenic branching structures that move with respiration, indicating patent airways within consolidated lung (Figure 11). LUS has shown high diagnostic accuracy for community-acquired pneumonia, with a sensitivity of 93.4% and specificity of 97.7%, comparable to CT scan-based diagnosis [53,54]. It outperformed CXR in detecting lung consolidation (93.8% vs. 75%) and patchy shadowing (94.1% vs. 52.9%) and identified pleural thickening in 95.2% of cases by day 6, whereas CXR detected none (p < 0.001) [5,55]. Additionally, the presence of dynamic air bronchograms on LUS is particularly useful in differentiating pneumonia from resorptive atelectasis, with a specificity of 94% and a positive predictive value of 97% [53]. LUS has also proven effective in assessing post-infectious lung injury, reinforcing its role as a reliable bedside diagnostic tool.
6.4. Pleural Effusion
Pleural effusions are defined as an abnormal accumulation of fluid in the pleural space, which may be hemorrhagic, exudative, or transudative depending on the underlying etiology [56]. While traditionally diagnosed with CXR, pleural effusion can be visualized using LUS as a layering hypoechoic collection found at the most dependent aspects of the thoracic cavity [56]. LUS is also more effective at diagnosing smaller effusions than CXR and can distinguish between transudative and exudative effusions based on detailed echotexture of the visualized fluid including echogenicity, septations, and pleural thickening. This versatility and accuracy make LUS the preferred modality in acute settings [57]. A systematic review and meta-analysis found that LUS had a pooled sensitivity of 91% and specificity of 92% for diagnosing pleural effusions; this was much more effective than CXR, which had a sensitivity of 42% and specificity of 81%. Compared to CT, LUS shows high accuracy, with near-perfect agreement in detecting pleural effusions in mechanically ventilated patients (right: 99% vs. 87%, p = 0.009; left: 99% vs. 85%, p = 0.004), reinforcing its role as the preferred imaging modality for effusion evaluation [44,54].

Table 3.
Comparison of Chest X-ray (CXR) and Lung Ultrasound (LUS) for the Diagnosis of Thoracic Pathology Using Computed Tomography of the Lung (CT) as the Reference Standard.
Table 3.
Comparison of Chest X-ray (CXR) and Lung Ultrasound (LUS) for the Diagnosis of Thoracic Pathology Using Computed Tomography of the Lung (CT) as the Reference Standard.
| Condition | Modality | Sensitivity | Specificity | +LR | Notes |
|---|---|---|---|---|---|
| Pulmonary Edema | LUS | 97% | 98% | 48.5 | Bedside; detects B-lines |
| CXR | 75% | 83% | 4.4 | Limited in early disease | |
| CT | — | — | — | Reference standard | |
| Pleural Effusion | LUS | 91% | 92% | 11.4 | Continuous; bedside |
| CXR | 42% | 81% | 2.2 | Requires upright film | |
| CT | — | — | — | Reference standard | |
| Pneumonia | LUS | 93.4% | 97.7% | 40.6 | Dynamic air bronchograms; high accuracy |
| CXR | 75% | 72% | 2.7 | Lower sensitivity for patchy shadowing | |
| CT | — | — | — | Reference standard | |
| Pneumothorax | LUS | 87% | 99% | 87.0 | Lung point 100% specific |
| CXR | 52% | 100% | ∞ | Misses small PTX | |
| CT | — | — | — | Reference standard | |
| ARDS | LUS | 77–100% | 61–100% | Variable | Ranges reflect different phenotyping methods |
| CXR | 65.5–69.4% | — | — | Moderate overlap with LUS | |
| CT | — | — | — | Reference standard |
Complicated Parapneumonic Effusion, Empyema and Hemothorax
Empyema is the accumulation of purulent fluid within the pleural space, while parapneumonic effusion refers to pleural fluid collection that develops in association with pneumonia [58]. Hemothorax is defined as the accumulation of blood within the pleural space [59]. While LUS cannot directly differentiate these different pathologies, several sonographic features of the pleural fluid and pleural line such as complex septations, echogenic material within the fluid, pleural thickening, and the plankton sign (also known as the suspended microbubble sign) are suggestive of either purulent fluid or blood in the pleural space in the appropriate clinical context [60,61].
Complex septations are characterized by multiple internal septa within the pleural fluid, appearing as thin, linear structures on ultrasound. Their presence suggests an exudative effusion, commonly seen in conditions such as empyema or complicated parapneumonic effusions [60].
Echogenic material in pleural fluid (plankton sign) refers to internal echoes within the effusion, appearing as floating particles or swirling patterns on ultrasound. This finding indicates the presence of cellular debris, fibrin, or pus and is commonly associated with exudative effusions due to infection, malignancy, or hemorrhage [61].
Pleural thickening refers to an abnormal increase in the thickness of the pleural lining, appearing as a hyperechoic (bright) band on ultrasound. It is commonly associated with exudative effusions and is seen in conditions such as pleuritis, malignancy, and chronic inflammation [62].
Table 4.
Ultrasound Characteristics of Empyema, Parapneumonic Effusion, and Hemothorax.
| Condition | Definition | Suggestive Sonographic Features |
|---|---|---|
| Empyema | Accumulation of purulent fluid within the pleural space | Complex septations, echogenic material, pleural thickening, plankton sign |
| Parapneumonic Effusion | Pleural fluid collection that develops in association with pneumonia | Complex septations, pleural thickening |
| Hemothorax | Accumulation of blood within the pleural space | Echogenic material, plankton sign |
LUS and TUS outperforms CT in detecting septations, with studies showing ultrasound has a sensitivity of 82.6% and specificity of 100%, compared to CT’s sensitivity of 59.8% and specificity of 87.0% [63]. In cases of hemothorax, ultrasound also performs well, with a reported sensitivity of 92% and specificity of 100% [64]. While CT remains the gold standard for detailed anatomical assessment, particularly in complex hemothorax, ultrasound offers clear advantages in evaluation and intervention planning [64].
Future Directions
With the expansion of handheld ultrasound and AI-based image analysis, the evaluation and management of pleural diseases is expected to expand. Key research priorities should focus on refining sonographic criteria to better distinguish between various exudative effusions, including empyema and hemorrhagic collections, and on integrating artificial intelligence for instantaneous interpretation. Additionally, prospective studies comparing ultrasound-guided interventions to traditional approaches could help establish standardized protocols for managing complex pleural effusions.
6.5. Acute Respiratory Distress Syndrome (ARDS)
In 2012, the Berlin definition of ARDS described it as an acute onset of hypoxemic respiratory failure characterized by bilateral pulmonary infiltrates on chest imaging that are not fully explained by cardiac failure or fluid overload. In January 2024, a new global definition of ARDS was published, updating the Berlin criteria to include LUS as an accepted diagnostic tool for identifying bilateral opacities alongside traditional chest imaging [5]. In a retrospective study, LUS identified 229 ARDS-positive patients, compared to 216 detected by CXR, capturing 79 additional cases with similar mortality rates [65]. However, moderate overlap between LUS and CXR definitions (65.5–69.4%) suggests that neither modality should be used in isolation. Instead, a combined approach utilizing LUS for rapid bedside screening and CXR for more detailed parenchymal assessment may be ideal [65].
A key challenge in using LUS to diagnose ARDS is distinguishing it from acute pulmonary edema (APE), as both conditions share similar ultrasound features, such as diffuse B-lines. In one study, diffuse B-lines were present in 100% of both ARDS and APE patients, making this feature alone insufficient for differentiation [66]. However, other features such as spared lung areas, pleural line abnormalities, lung consolidations, and absent lung sliding were highly specific for ARDS (p < 0.0001) [66]. Additionally, pleural effusion was more common in APE than ARDS (95% vs. 66.6%, p = 0.004), while lung pulse was seen in 50% of ARDS cases but absent in APE (p < 0.0001) [66]. These findings suggest that although diffuse B-lines cannot differentiate between ARDS and APE, other associated findings can make LUS a useful tool for differentiation of ARDS and APE without reliance on CT or echocardiography.
LUS also aids in phenotyping ARDS. Pierrakos et al. compared LUS-based ARDS classification methods to CT-based standards and found that the Piedmont method, which uses only anterior LUS scores, achieved 91% sensitivity and 75% specificity [9]. In comparison, the Amsterdam and Lombardy methods, both employing 12-region protocols that include posterior lung zones presented trade-offs between specificity (Amsterdam: 100%) and sensitivity (Lombardy: 100%) [9]. The anterior lung zones yielded the highest diagnostic accuracy, supporting the feasibility of a simplified anterior-only LUS approach for ARDS phenotyping, particularly in high-acuity settings. Further research should investigate LUS-based severity scoring and its potential role in guiding ventilatory management.
Future Directions
With LUS now integrated into the imaging criteria for ARDS, there is a growing need for clinicians to develop proficiency in its use for identifying bilateral lung opacities and distinguishing ARDS from other causes of respiratory failure. Future efforts should focus on standardized training in ARDS-specific sonographic features, including diffuse B-lines, subpleural consolidations, and pleural abnormalities, to enhance diagnostic accuracy. Additionally, further research is needed to validate LUS-based severity scoring and explore its role in guiding ventilatory strategies and treatment decisions, particularly in resource-limited settings where access to advanced imaging may be restricted.
6.6. COVID-19
The COVID-19 pandemic posed major challenges in rapidly triaging patients with pneumonia, particularly in resource-limited and overwhelmed healthcare systems. Rapid and accurate assessment of disease severity was essential for guiding management decisions [67,68,69]. In this context, LUS and TUS proved valuable for assessment of pulmonary involvement when other imaging modalities were inaccessible or delayed. Aguersif et al. established that LUS outperforms standard clinical assessment in predicting the severity of respiratory illness at hospital admission, highlighting its potential role in optimizing resource allocation [69]. Similarly, Boero et al. supported the use of TUS for screening patients with acute COVID-19 pneumonia in emergency departments and hospital wards, particularly where access to CT imaging was limited [68].
Early LUS scoring has been associated with improved risk stratification in COVID-19, aiding in the identification of patients at greater risk of deterioration. The POCUSCO study, which evaluated LUS within 48 hours of ED admission, found that patients with an LUS score ≥16 had a 23.5% mortality rate, whereas those with a score of zero had no reported mortality [61]. These findings reinforce the value of LUS as tool for early risk assessment, reducing reliance on CT scans and enabling more efficient resource distribution. Serial LUS examinations offer enhanced predictive value over single assessments, allowing for dynamic monitoring of disease progression. A two-center prospective study confirmed that LUS had an 81% concordance with CT scans in tracking COVID-19 pneumonia progression, with LUS scoring predicting ICU stay duration [70].
LUS vs CXR in COVID-19
Compared to chest X-ray, LUS is more sensitive for early-stage viral pneumonia and can detect subtle findings like B-lines and pleural thickening before they appear on CXR. Boero et al. described the role of LUS in screening patients with acute COVID-19 pneumonia, particularly in emergency departments and hospital wards where rapid assessment is necessary [68]. Additionally, serial LUS assessments have been found to detect progressive lung involvement earlier than CXR, making it a more reliable tool for monitoring disease evolution. The ability of LUS to provide bedside imaging without radiation exposure further enhances its clinical utility, particularly in resource-limited settings where access to advanced imaging is restricted.
LUS vs CT in COVID-19
Although CT remains the gold standard for diagnosing viral pneumonia, LUS has strong agreement with CT in detecting lung abnormalities, particularly in COVID-19 pneumonia. A two-center prospective study found that LUS had an 81% concordance with CT scans in tracking disease progression, highlighting its reliability as a non-invasive alternative [70]. Furthermore, studies on post-infectious lung injury in COVID-19 survivors found that LUS had high Cohen’s kappa values and an area under the curve (AUC) of 0.94–0.95 for detecting interstitial lung disease (ILD), reinforcing its potential as a first-line imaging modality for follow-up assessments [71,72]. While CT provides more detailed visualization of lung parenchyma, LUS offers bedside evaluation, reducing the need for repeated radiation exposure and allowing for frequent monitoring of lung pathology in critically ill patients.
Future Directions
Recent guidelines and multicenter trials have increasingly incorporated LUS as a core imaging modality in acute care algorithms. Large-scale studies are needed to validate LUS-based severity scoring systems and determine their role in guiding therapeutic decisions, particularly in differentiating viral pneumonia from other causes of acute respiratory failure. Additionally, incorporating LUS into telemedicine and artificial intelligence-driven diagnostic platforms could expand its accessibility, especially in resource-limited settings where CT and CXR are not readily available. Further investigation into the role of LUS in long-term pulmonary follow-up, particularly in post-viral interstitial lung disease (ILD), will also be essential in optimizing patient care beyond the acute phase of illness.
7. Limitations
This scoping review has several limitations that should be acknowledged. First, while we used a comprehensive search strategy and adhered to the PRISMA-ScR framework, the inherent breadth of scoping reviews limits the ability to perform critical appraisal or meta-analysis of study quality. Second, the inclusion of studies with heterogeneous methodologies, patient populations, and ultrasound protocols may reduce comparability and preclude definitive conclusions about diagnostic performance or clinical outcomes. Third, although we employed purposive sampling informed by expert opinion to capture under-indexed procedural applications such as thoracentesis and chest tube placement, it is possible that relevant studies were missed due to inconsistent terminology or database indexing. Finally, because most included studies were observational and single center, the generalizability of findings is limited. Taken together, these limitations highlight the need for more rigorous, multicenter investigations that use standardized protocols and focus on clinically meaningful outcomes.
8. Conclusion
Lung and thoracic ultrasound have increasingly become part of routine clinical practice in acute and perioperative care. In this review, we identified consistent evidence supporting the use of LUS for diagnosing pneumonia, pulmonary edema, pleural effusion, and pneumothorax, with diagnostic performance often comparable to CT and consistently superior to chest radiography. Beyond diagnosis, thoracic ultrasound enhances procedural safety, particularly when used to guide thoracentesis, central line placement, and endotracheal tube confirmation. Protocols such as anterior-only assessments for ARDS classification and Doppler-based evaluation of the intercostal space exemplify practical applications that can reduce complications and increase confidence at the bedside. As thoracic ultrasound becomes increasingly embedded in clinical practice, there remains a need for widespread training initiatives, prospective validation of protocols, standardized outcome reporting, and research that connects ultrasound use to patient-centered metrics.
Author Contributions
Conceptualization, E.J., D.S.B and H.A.; Methodology, E.J. and H.A.; Literature Review, H.A., M.H., D.S.B., A.K., A.C., L.L., F.E.; Writing Original Draft Preparation, H.A. and M.H.; Writing Review & Editing, E.J, W.C., D.S.B. F.D.; Visualization, E.J.; Supervision, E.J.; Project Administration, E.J. All authors have read and agreed to the published version of the manuscript.
Funding
This research received no external funding.
Institutional Review Board Statement
Not applicable. This scoping review did not involve human subjects or data collection requiring ethical approval.
Informed Consent Statement
Not applicable.
Data Availability Statement
No new data were created or analyzed in this study. Data sharing is not applicable to this article.
Acknowledgments
The authors thank Cecelia Vetter, MLIS for their valuable assistance in developing many of the search criteria that informed this study.
The authors would like to acknowledge the contributions of the Collaborative for POCUS Education, Research & Curriculum (POCUS CERC) for their support in the early conceptualization and review of this manuscript. While not all members are listed as authors, their collective input was instrumental in shaping the direction and scope of this scoping review.
Conflicts of Interest
The authors declare no conflict of interest.
Abbreviations
| APE | Acute Pulmonary Edema. |
| ARDS | Acute Respiratory Distress Syndrome. |
| B-lines | Vertical, hyperechoic reverberation artifacts indicating interstitial syndrome. |
| CAJ | Cavoatrial Junction. |
| CDI | Color Doppler Imaging. |
| CEUS | Contrast-Enhanced Ultrasound. |
| CVC | Central Venous Catheter. |
| CXR | Chest X-Ray. |
| DIVOT | Direct Visualization of the Thoracic Space. |
| DOAJ | Directory of Open Access Journals. |
| ED | Emergency Department. |
| ETT | Endotracheal Tube. |
| EVLW | Extravascular Lung Water. |
| ICA | Intercostal Artery. |
| ICC | Intraclass Correlation Coefficient. |
| ICU | Intensive Care Unit. |
| ILD | Interstitial Lung Disease. |
| IRB | Institutional Review Board. |
| IV | Intravenous. |
| LUS | Lung Ultrasound. |
| M-mode | Motion Mode. |
| MDPI | Multidisciplinary Digital Publishing Institute. |
| OSF | Open Science Framework. |
| POCUS | Point-of-Care Ultrasound. |
| PRISMA-ScR | Preferred Reporting Items for Systematic Reviews and Meta-Analyses extension for Scoping Reviews. |
| QLUSS | Quantitative Lung Ultrasound Scoring System. |
| RA | Right Atrium. |
| SVC | Superior Vena Cava. |
| TLA | Three Letter Acronym. |
| TRUE | Tracheal Rapid Ultrasound Exam. |
| TUS | Thoracic Ultrasound. |
References
- Beshara M, Bittner EA, Goffi A, Berra L, Chang MG. Nuts and bolts of lung ultrasound: utility, scanning techniques, protocols, and findings in common pathologies. Crit Care. 2024;28(1):328. [CrossRef]
- Volpicelli G, Elbarbary M, Blaivas M, et al. International evidence-based recommendations for point-of-care lung ultrasound. In: Intensive Care Medicine. Vol 38. ; 2012:577-591. [CrossRef]
- Piette E, Daoust R, Denault A. Basic concepts in the use of thoracic and lung ultrasound. Curr Opin Anaesthesiol. 2013;26(1):20-30. [CrossRef]
- Lichtenstein DA. Lung ultrasound in the critically ill. Ann Intensive Care. 2014;4(1):1. [CrossRef]
- Li R, Liu H, Qi H, et al. Lung ultrasound assessment of acute respiratory distress syndrome caused by coronavirus disease 2019: An observational study. Hong Kong Journal of Emergency Medicine. 2021;28(1):8-14. [CrossRef]
- Andrade H, Jackson E, Brenner D, Haouili M. Exploring the Role of Thoracic Ultrasound in Anesthesia and Acute Care: A Scoping Review of Diagnostic and Procedural Application. OSF. Published online March 30, 2025. Accessed March 29, 2025. osf.io/5taq3.
- Aromataris E, Porritt K, Pilla B, Jordan Z. JBI Manual for Evidence Synthesis. (Aromataris E, Lockwood C, Porritt K, Pilla B, Jordan Z, eds.). JBI; 2024. [CrossRef]
- Arksey H, O’Malley L. Scoping studies: towards a methodological framework. Int J Soc Res Methodol. 2005;8(1):19-32. [CrossRef]
- Pierrakos C, Smit MR, Pisani L, et al. Lung Ultrasound Assessment of Focal and Non-focal Lung Morphology in Patients With Acute Respiratory Distress Syndrome. Front Physiol. 2021;12:730857. [CrossRef]
- Frankel HL, Kirkpatrick AW, Elbarbary M, et al. Guidelines for the appropriate use of bedside general and cardiac ultrasonography in the evaluation of critically ill patients-part I: General ultrasonography. Crit Care Med. 2015;43(11):2479-2502. [CrossRef]
- American College of Emergency Physicians. Emergency ultrasound guidelines. Ann Emerg Med. 2009;53(4):550-570. [CrossRef]
- Kanai M, Sekiguchi H. Avoiding vessel laceration in thoracentesis: A role of vascular ultrasound with color Doppler. Chest. 2015;147(1):e5-e7. [CrossRef]
- Aldrich JE. Basic physics of ultrasound imaging. Crit Care Med. 2007;35(Suppl):S131-S137. [CrossRef]
- Feldman MK, Katyal S, Blackwood MS. US artifacts. Radiographics. 2009;29(4):1179-1189. [CrossRef]
- Buttar S, Cooper D, Olivieri P, et al. Air and its Sonographic Appearance: Understanding the Artifacts. Journal of Emergency Medicine. 2017;53(2):241-247. [CrossRef]
- Prada G, Vieillard-Baron A, Martin AK, et al. Tracheal, Lung, and Diaphragmatic Applications of M-Mode Ultrasonography in Anesthesiology and Critical Care. J Cardiothorac Vasc Anesth. 2021;35(1):310-322. [CrossRef]
- Lichtenstein DA, Lascols N, Prin S, Mezière G. The “lung pulse”: an early ultrasound sign of complete atelectasis. Intensive Care Med. 2003;29(12):2187-2192. [CrossRef]
- Dietrich CF, Mathis G, Blaivas M, et al. Lung B-line artefacts and their use. J Thorac Dis. 2016;8(6):1356-1365. [CrossRef]
- Johannessen Ø, Reite FU, Bhatnagar R, Øvrebotten T, Einvik G, Myhre PL. Lung Ultrasound to Assess Pulmonary Congestion in Patients with Acute Exacerbation of COPD. International Journal of COPD. 2023;18:693-703. [CrossRef]
- Nakao S, Vaillancourt C, Taljaard M, Nemnom MJ, Woo MY, Stiell IG. Diagnostic Accuracy of Lung Point-Of-Care Ultrasonography for Acute Heart Failure Compared With Chest X-Ray Study Among Dyspneic Older Patients in the Emergency Department. Journal of Emergency Medicine. 2021;61(2):161-168. [CrossRef]
- Matthias I, Panebianco NL, Maltenfort MG, Dean AJ, Baston C. Effect of Machine Settings on Ultrasound Assessment of B-lines. Journal of Ultrasound in Medicine. 2021;40(10):2039-2046. [CrossRef]
- Yen JT, Nguyen MM, Lou Y, Shin JS, Chen Y, Tarnoff HL. Gated Transmit and Fresnel-Based Receive Beamforming with a Phased Array for Low-Cost Ultrasound Imaging. IEEE Trans Ultrason Ferroelectr Freq Control. 2021;68(6):2183-2192. [CrossRef]
- Zhang Z, Chen R, Wang B, et al. Development of a KNN Ceramic-Based Lead-Free Linear Array Ultrasonic Transducer. IEEE Trans Ultrason Ferroelectr Freq Control. 2018;65(11):2113-2120. [CrossRef]
- Rizzatto G. Ultrasound Transducers. Vol 27.; 1998.
- Chou HC, Tseng WP, Wang CH, et al. Tracheal rapid ultrasound exam (T.R.U.E.) for confirming endotracheal tube placement during emergency intubation. Resuscitation. 2011;82(10):1279-1284. [CrossRef]
- Gildea TH, Anderson KL, Niknam KR, et al. The utility of color doppler to confirm endotracheal tube placement: A pilot study. Western Journal of Emergency Medicine. 2020;21(4):870-875. [CrossRef]
- Gottlieb M, Burns K, Holladay D, Chottiner M, Shah S, Gore SR. Impact of endotracheal tube twisting on the diagnostic accuracy of ultrasound for intubation confirmation. American Journal of Emergency Medicine. 2020;38(7):1332-1334. [CrossRef]
- Pfeiffer P, Bache S, Isbye DL, Rudolph SS, Rovsing L, Børglum J. Verification of endotracheal intubation in obese patients - Temporal comparison of ultrasound vs. auscultation and capnography. Acta Anaesthesiol Scand. 2012;56(5):571-576. [CrossRef]
- Sahu AK, Bhoi S, Aggarwal P, et al. Endotracheal Tube Placement Confirmation by Ultrasonography: A Systematic Review and Meta-Analysis of more than 2500 Patients. Journal of Emergency Medicine. 2020;59(2):254-264. [CrossRef]
- Hoffmann B, Gullett JP, Hill HF, et al. Bedside ultrasound of the neck confirms endotracheal tube position in emergency intubations. Ultraschall in der Medizin. 2014;35(5):451-458. [CrossRef]
- Karacabey S, Sanri E, Gencer EG, Guneysel O. Tracheal ultrasonography and ultrasonographic lung sliding for confirming endotracheal tube placement: Speed and Reliability. American Journal of Emergency Medicine. 2016;34(6):953-956. [CrossRef]
- Park SC, Ryu JH, Yeom SR, Jeong JW, Cho SJ. Confirmation of endotracheal intubation by combined ultrasonographic methods in the emergency department. EMA - Emergency Medicine Australasia. 2009;21(4):293-297. [CrossRef]
- Chou HC, Chong KM, Sim SS, et al. Real-time tracheal ultrasonography for confirmation of endotracheal tube placement during cardiopulmonary resuscitation. Resuscitation. 2013;84(12):1708-1712. [CrossRef]
- Practice Guidelines for Central Venous Access 2020: An Updated Report by the American Society of Anesthesiologists Task Force on Central Venous Access. Anesthesiology. 2020;132(1):8-43. [CrossRef]
- Brindley PG, Deschamps J, Milovanovic L, Buchanan BM. Are routine chest radiographs still indicated after central line insertion? A scoping review. J Intensive Care Soc. 2024;25(2):190-207. [CrossRef]
- Fragou M, Gravvanis A, Dimitriou V, et al. Real-time ultrasound-guided subclavian vein cannulation versus the landmark method in critical care patients: A prospective randomized study. Crit Care Med. 2011;39(7):1607-1612. [CrossRef]
- Koratala A. The Subcostal Bicaval View. NephroPOCUS.
- Daniels CE, Ryu JH. Improving the safety of thoracentesis. Curr Opin Pulm Med. 2011;17(4):232-236. [CrossRef]
- Cantey EP, Walter JM, Corbridge T, Barsuk JH. Complications of thoracentesis: Incidence, risk factors, and strategies for prevention. Curr Opin Pulm Med. 2016;22(4):378-385. [CrossRef]
- Gordon CE, Feller-Kopman D, Balk EM, Smetana GW. Pneumothorax following thoracentesis: a systematic review and meta-analysis. Arch Intern Med. 2010;170(4):332-339. [CrossRef]
- Havelock T, Teoh R, Laws D, Gleeson F, BTS Pleural Disease Guideline Group. Pleural procedures and thoracic ultrasound: British Thoracic Society Pleural Disease Guideline 2010. Thorax. 2010;65 Suppl 2:ii61-76. [CrossRef]
- Salamonsen M, Ellis S, Paul E, Steinke K, Fielding D. Thoracic ultrasound demonstrates variable location of the intercostal artery. Respiration. 2012;83(4):323-329. [CrossRef]
- Koyanagi T, Kawaharada N, Kurimoto Y, et al. Examination of intercostal arteries with transthoracic Doppler sonography. Echocardiography. 2010;27(1):17-20. [CrossRef]
- Chan KK, Joo DA, McRae AD, et al. Chest ultrasonography versus supine chest radiography for diagnosis of pneumothorax in trauma patients in the emergency department. Cochrane Database of Systematic Reviews. 2020;2020(7). [CrossRef]
- DeMasi S, Parker MS, Joyce M, Mulligan K, Feeser S, Balderston JR. Thoracic point-of-care ultrasound is an accurate diagnostic modality for clinically significant traumatic pneumothorax. Academic Emergency Medicine. 2023;30(6):653-661. [CrossRef]
- Santorelli JE, Chau H, Godat L, Casola G, Doucet JJ, Costantini TW. Not so FAST—Chest ultrasound underdiagnoses traumatic pneumothorax. Journal of Trauma and Acute Care Surgery. 2022;92(1):44-48. [CrossRef]
- Lichtenstein D, Goldstein I, Mourgeon E, Cluzel P, Grenier P, Rouby JJ. CLINICAL INVESTIGATIONS Comparative Diagnostic Performances of Auscultation, Chest Radiography, and Lung Ultrasonography in Acute Respiratory Distress Syndrome.; 2004. http://www.anesthesiology.org.
- Tierney DM, Huelster JS, Overgaard JD, et al. Comparative Performance of Pulmonary Ultrasound, Chest Radiograph, and CT Among Patients With Acute Respiratory Failure∗. Crit Care Med. 2020;48(2):151-157. [CrossRef]
- Maw AM, Hassanin A, Ho PM, et al. Diagnostic Accuracy of Point-of-Care Lung Ultrasonography and Chest Radiography in Adults With Symptoms Suggestive of Acute Decompensated Heart Failure: A Systematic Review and Meta-analysis. JAMA Netw Open. 2019;2(3):e190703. [CrossRef]
- Picano E, Pellikka PA. Ultrasound of extravascular lung water: A new standard for pulmonary congestion. Eur Heart J. 2016;37(27):2097-2104. [CrossRef]
- Brusasco C, Santori G, Bruzzo E, et al. Quantitative lung ultrasonography: A putative new algorithm for automatic detection and quantification of B-lines. Crit Care. 2019;23(1). [CrossRef]
- File TM, Ramirez JA. Community-Acquired Pneumonia. O’Malley PG, ed. New England Journal of Medicine. 2023;389(7):632-641. [CrossRef]
- Reissig A, Copetti R, Mathis G, et al. Lung ultrasound in the diagnosis and follow-up of community-acquired pneumonia: A prospective, multicenter, diagnostic accuracy study. Chest. 2012;142(4):965-972. [CrossRef]
- Hew M, Corcoran JP, Harriss EK, Rahman NM, Mallett S. The diagnostic accuracy of chest ultrasound for CT-detected radiographic consolidation in hospitalised adults with acute respiratory failure: a systematic review. [CrossRef]
- Xirouchaki N, Magkanas E, Vaporidi K, et al. Lung ultrasound in critically ill patients: Comparison with bedside chest radiography. Intensive Care Med. 2011;37(9):1488-1493. [CrossRef]
- Shen-Wagner J, Gamble C, MacGilvray P. Pleural Effusion: Diagnostic Approach in Adults. Am Fam Physician. 2023;108(5):464-475.
- Hansell L, Milross M, Delaney A, Tian DH, Ntoumenopoulos G. Lung ultrasound has greater accuracy than conventional respiratory assessment tools for the diagnosis of pleural effusion, lung consolidation and collapse: a systematic review. J Physiother. 2021;67(1):41-48. [CrossRef]
- Shen KR, Bribriesco A, Crabtree T, et al. The American Association for Thoracic Surgery consensus guidelines for the management of empyema. J Thorac Cardiovasc Surg. 2017;153(6):e129-e146. [CrossRef]
- Jacoby RC, Battistella FD. Hemothorax. Semin Respir Crit Care Med. 2001;22(6):627-630. [CrossRef]
- Wang T, Du G, Fang L, Bai Y, Liu Z, Wang L. Value of ultrasonography in determining the nature of pleural effusion: Analysis of 582 cases. Medicine (United States). 2022;101(33):E30119. [CrossRef]
- Lane AB, Petteys S, Ginn M, Nations JA. Clinical importance of echogenic swirling pleural effusions. Journal of Ultrasound in Medicine. 2016;35(4):843-847. [CrossRef]
- Yamada A, Taiji R, Nishimoto Y, et al. Pictorial Review of Pleural Disease: Multimodality Imaging and Differential Diagnos. Radiographics. 2024;44(4). [CrossRef]
- Yang L, Wang K, Li W, Liu D. Chest ultrasound is better than CT in identifying septated effusion of patients with pleural disease. Sci Rep. 2024;14(1):11964. [CrossRef]
- Staub LJ, Biscaro RRM, Kaszubowski E, Maurici R. Chest ultrasonography for the emergency diagnosis of traumatic pneumothorax and haemothorax: A systematic review and meta-analysis. Injury. 2018;49(3):457-466. [CrossRef]
- See KC, Ong V, Tan YL, Sahagun J, Taculod J. Chest radiography versus lung ultrasound for identification of acute respiratory distress syndrome: a retrospective observational study. Crit Care. 2018;22(1):203. [CrossRef]
- Copetti R, Soldati G, Copetti P. Chest sonography: A useful tool to differentiate acute cardiogenic pulmonary edema from acute respiratory distress syndrome. Cardiovasc Ultrasound. 2008;6. [CrossRef]
- Cammarota G, Bruni A, Morettini G, et al. Lung ultrasound to evaluate aeration changes in response to recruitment maneuver and prone positioning in intubated patients with COVID-19 pneumonia: preliminary study. Ultrasound Journal. 2023;15(1). [CrossRef]
- Boero E, Schreiber A, Rovida S, Vetrugno L, Blaivas M. The role of lung ultrasonography in COVID-19 disease management. JACEP Open. 2020;1(6):1357-1363. [CrossRef]
- Aguersif A, Sarton B, Bouharaoua S, et al. Lung Ultrasound to Assist ICU Admission Decision-Making Process of COVID-19 Patients with Acute Respiratory Failure. Crit Care Explor. 2022;4(6):E0719. [CrossRef]
- Heldeweg MLA, Lopez Matta JE, Haaksma ME, et al. Lung ultrasound and computed tomography to monitor COVID-19 pneumonia in critically ill patients: a two-center prospective cohort study. Intensive Care Medicine Experimental. 2021;9(1). [CrossRef]
- Giovannetti G, De Michele L, De Ceglie M, et al. Lung ultrasonography for long-term follow-up of COVID-19 survivors compared to chest CT scan. Respir Med. 2021;181. [CrossRef]
- Ramos Hernández C, Tilve Gomez A, Sánchez Fernández A, et al. Multicentre study on the accuracy of lung ultrasound in the diagnosis and monitoring of respiratory sequelae in the medium and long term in patients with COVID-19. Front Med (Lausanne). 2023;10:1199666. [CrossRef]
Figure 1.
PRISMA flowchart.
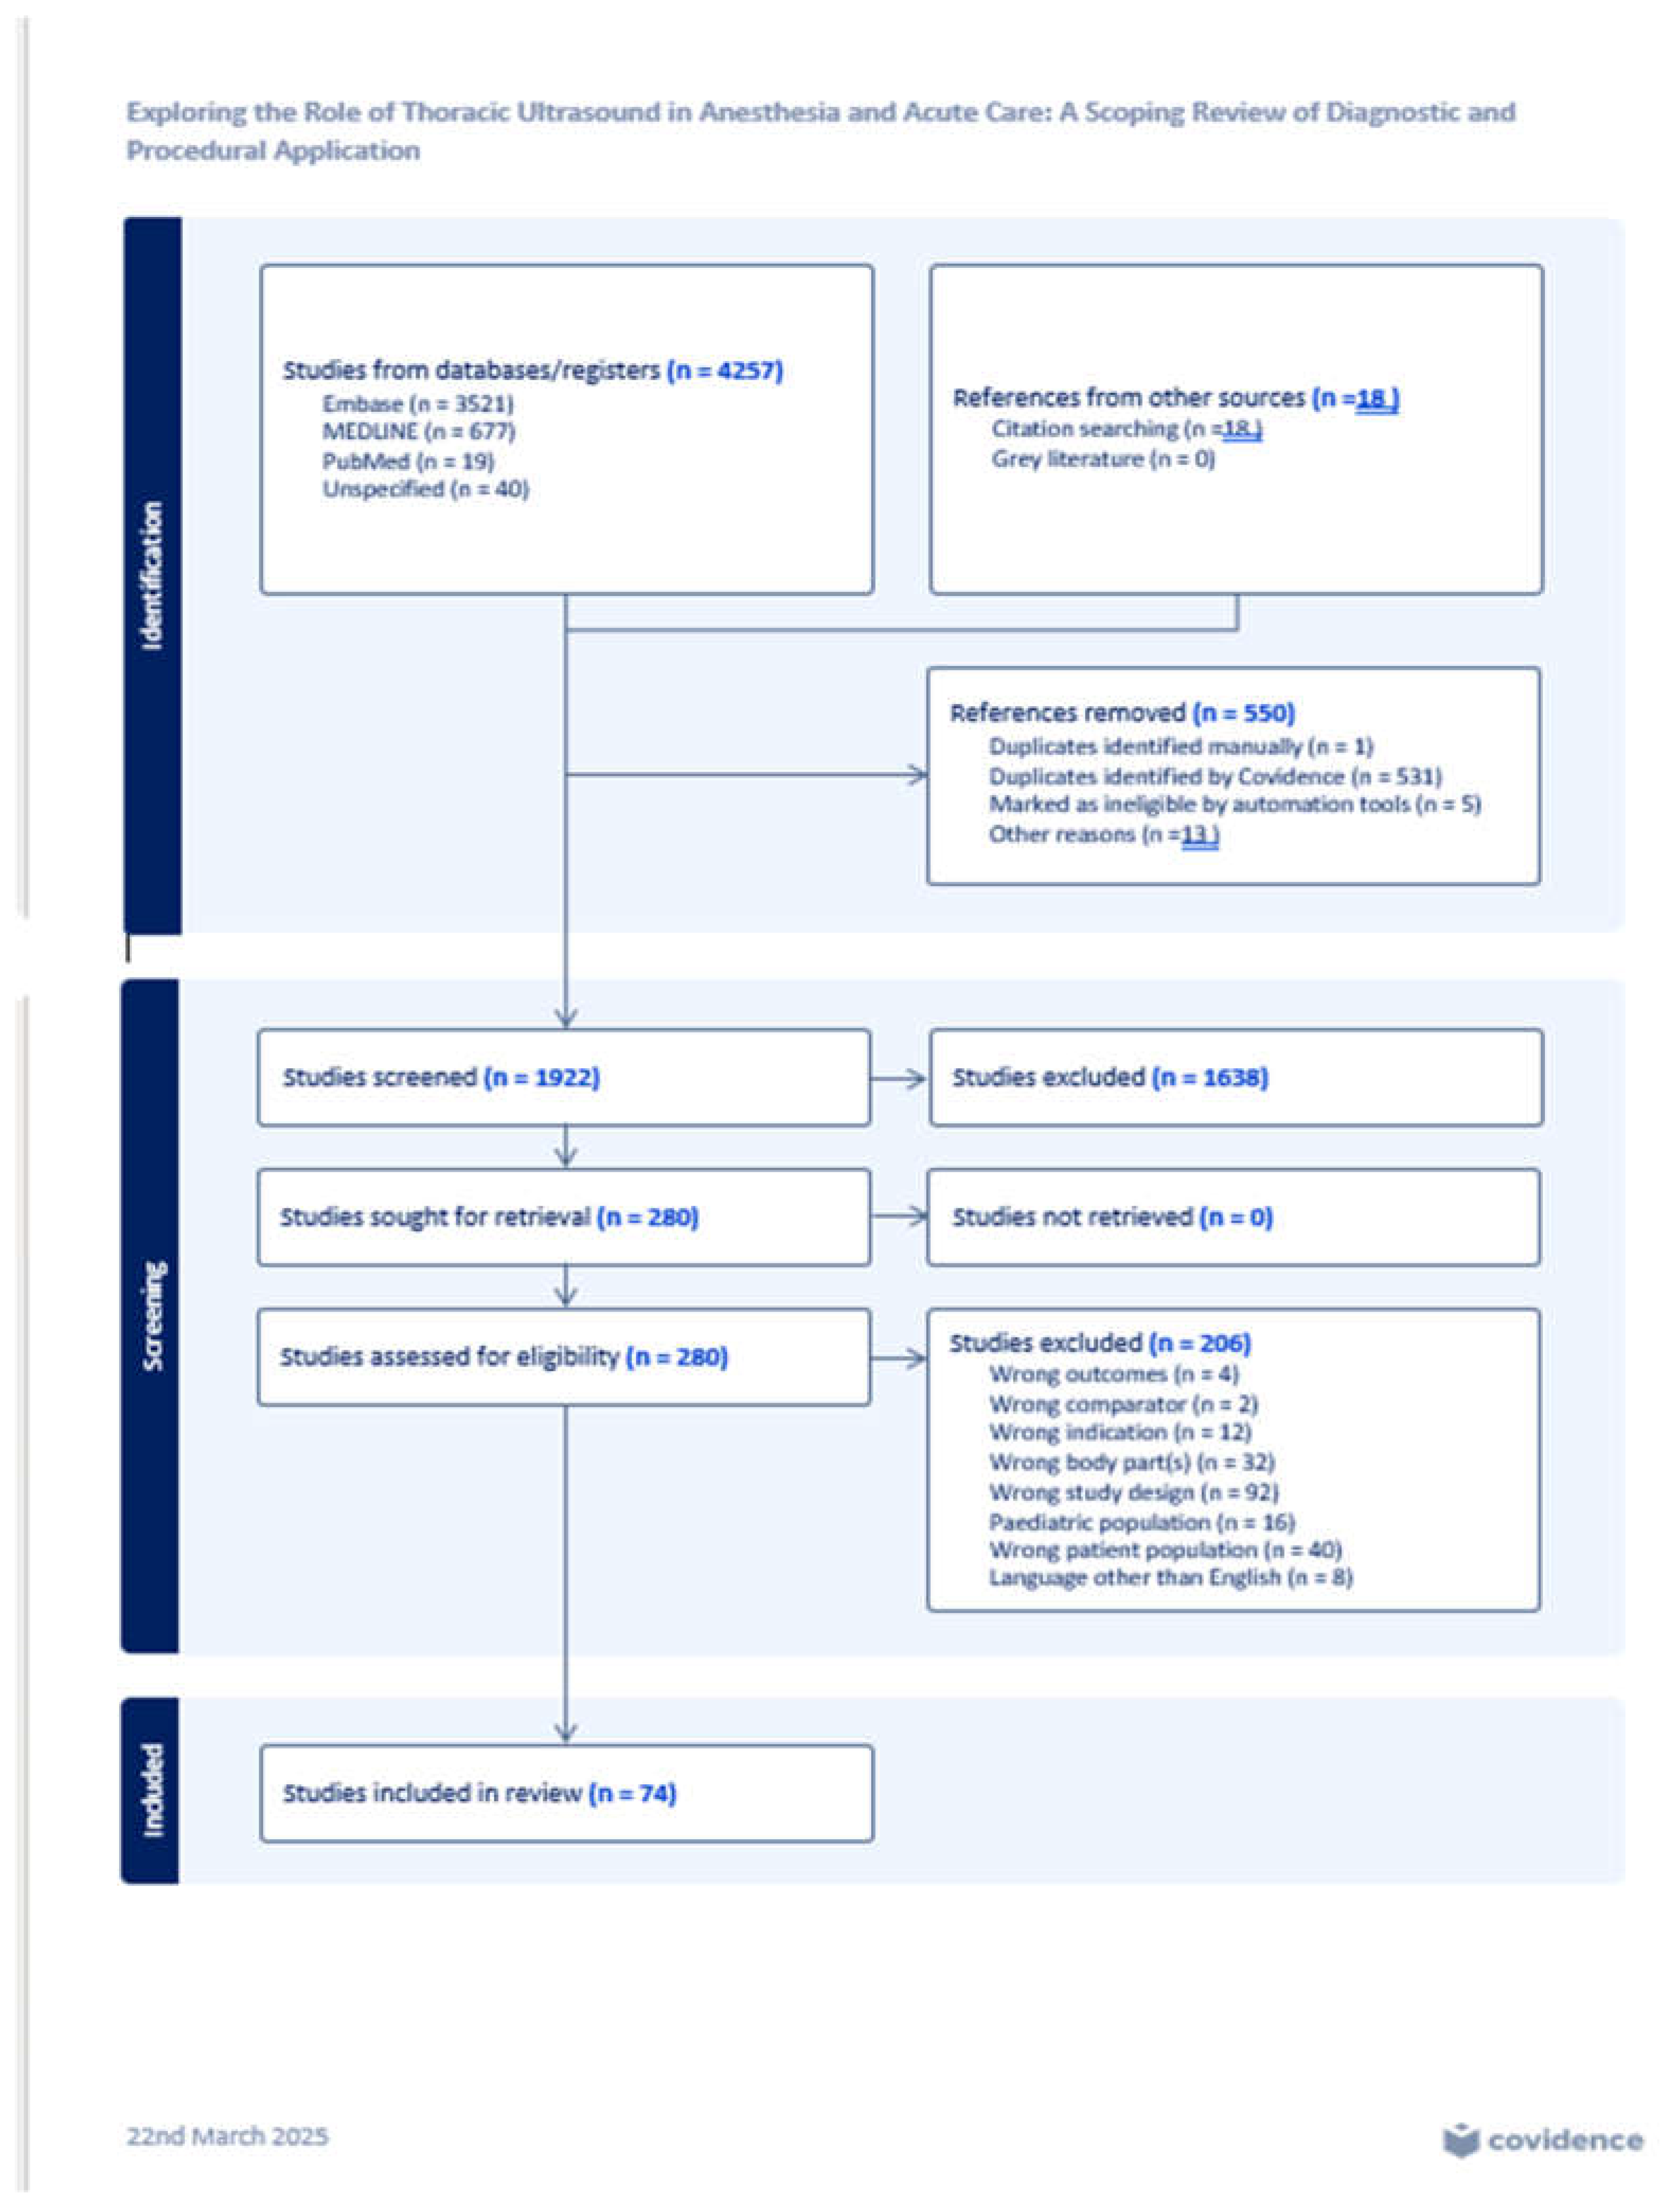
Figure 2.
The variation in ultrasound wave propagation through different tissues, showing minimal refraction between muscle (1580 m/s) and fat (1450 m/s) but significant reflection and refraction at the muscle-air interface (330 m/s). The impedance mismatch with air results in poor ultrasound image quality due to wave reflection.
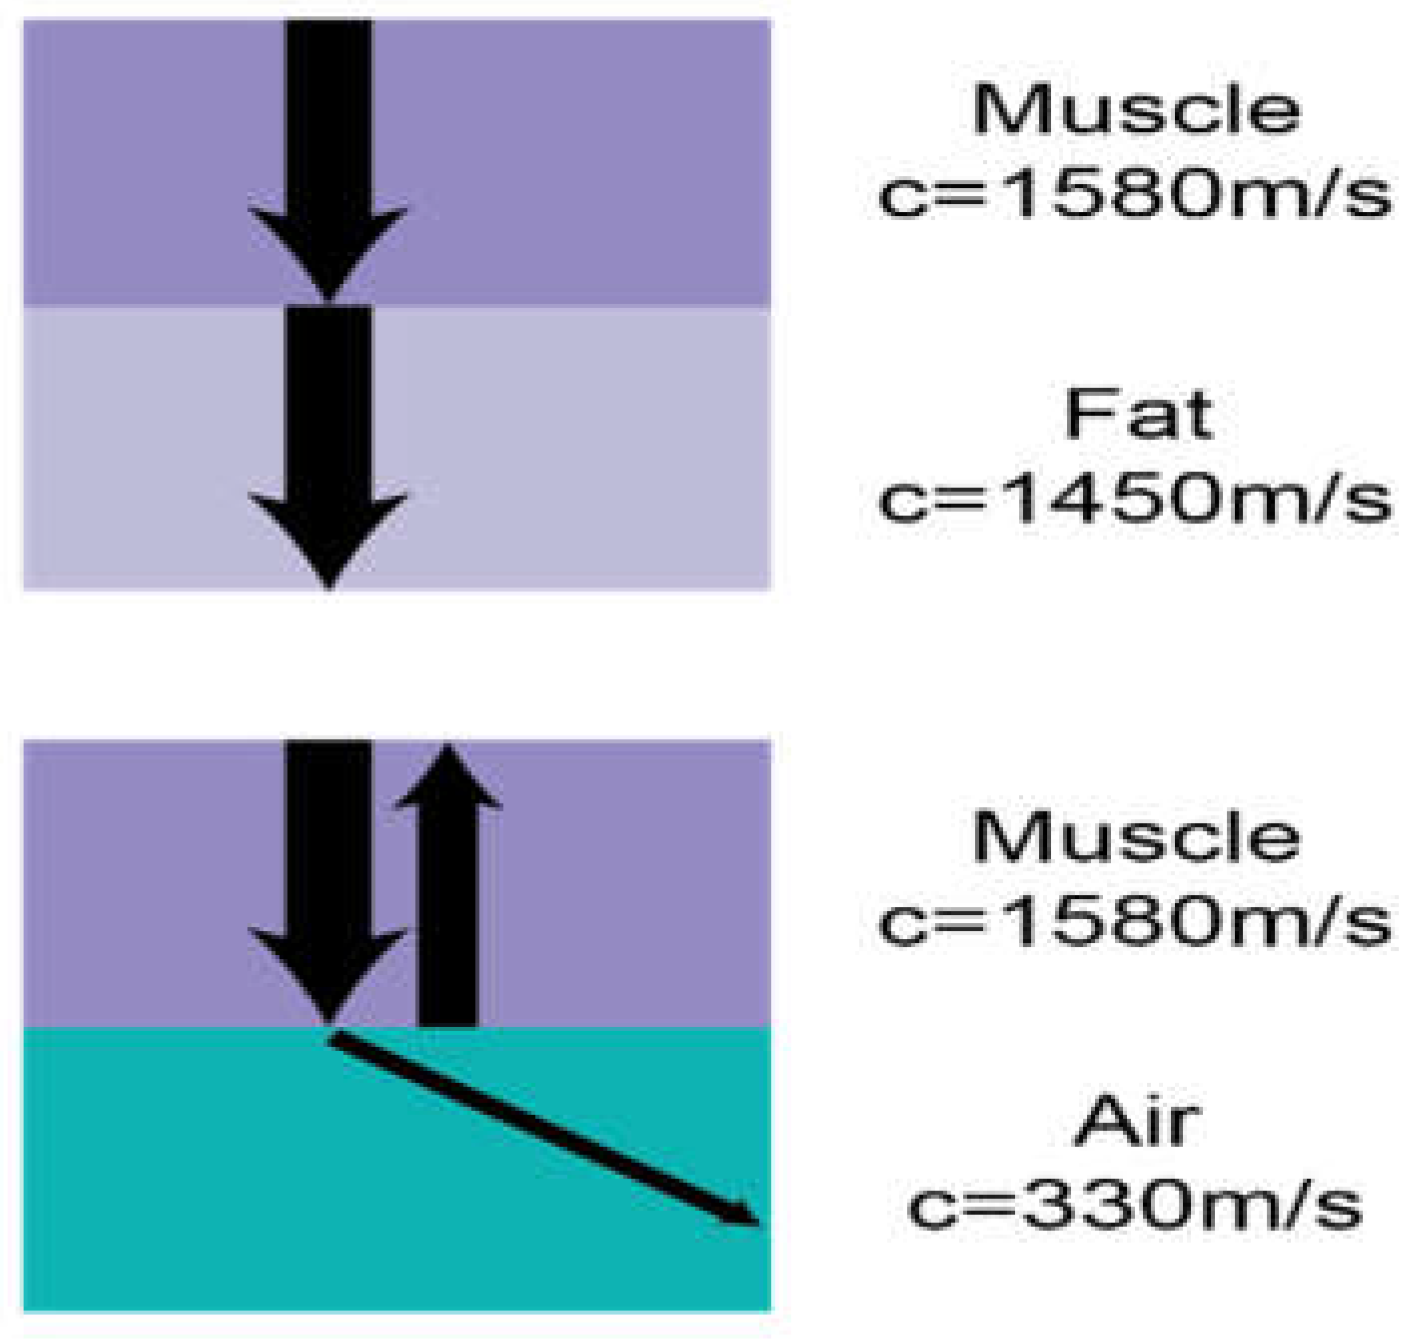
Figure 3.
Formation of A-lines due to reverberation artifact: repeated sound wave reflections between the pleural line and probe result in parallel hyperechoic horizontal lines.
Figure 3.
Formation of A-lines due to reverberation artifact: repeated sound wave reflections between the pleural line and probe result in parallel hyperechoic horizontal lines.
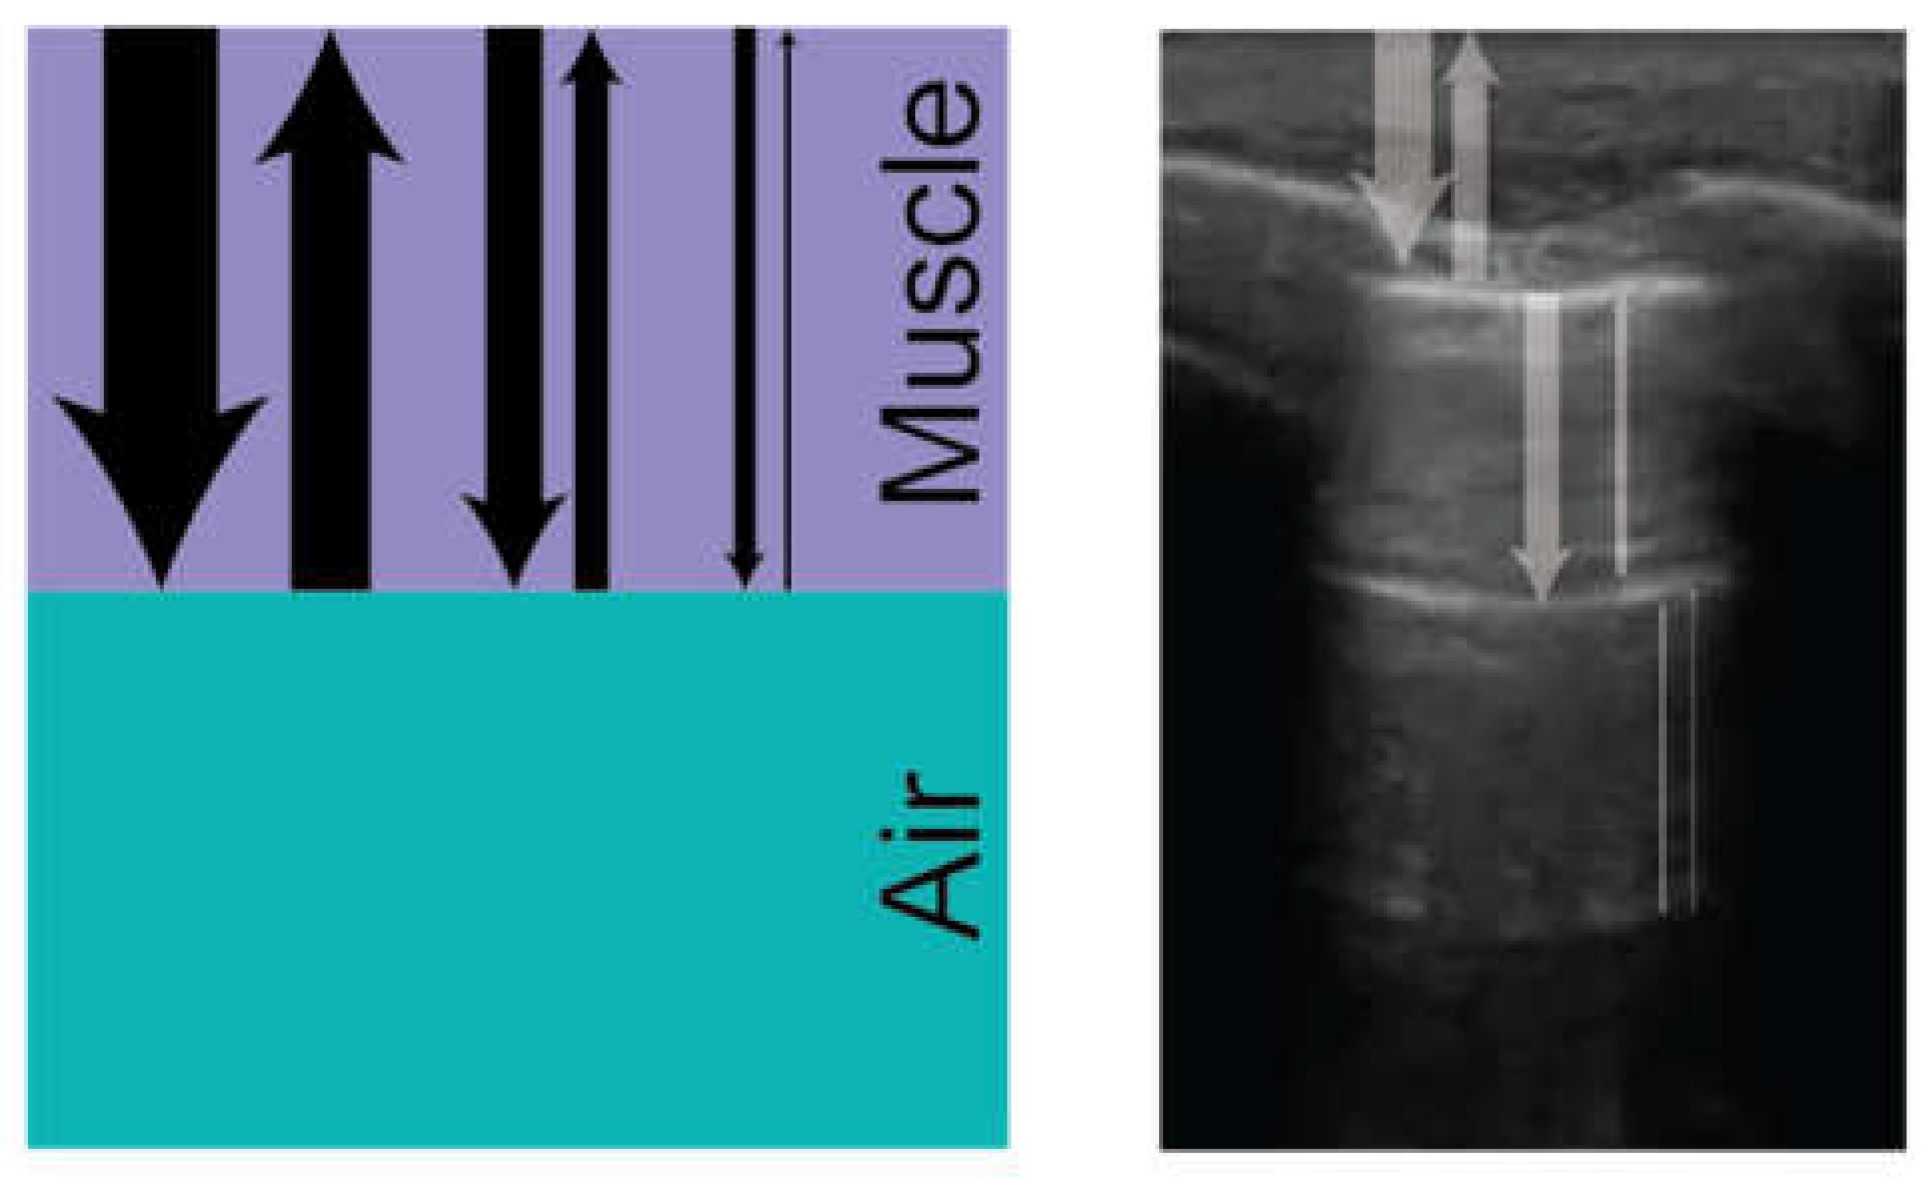
Figure 4.
M mode demonstrating lung sliding in 2-dimensional (2D) ultrasound and Motion mode (M-mode).
Figure 4.
M mode demonstrating lung sliding in 2-dimensional (2D) ultrasound and Motion mode (M-mode).
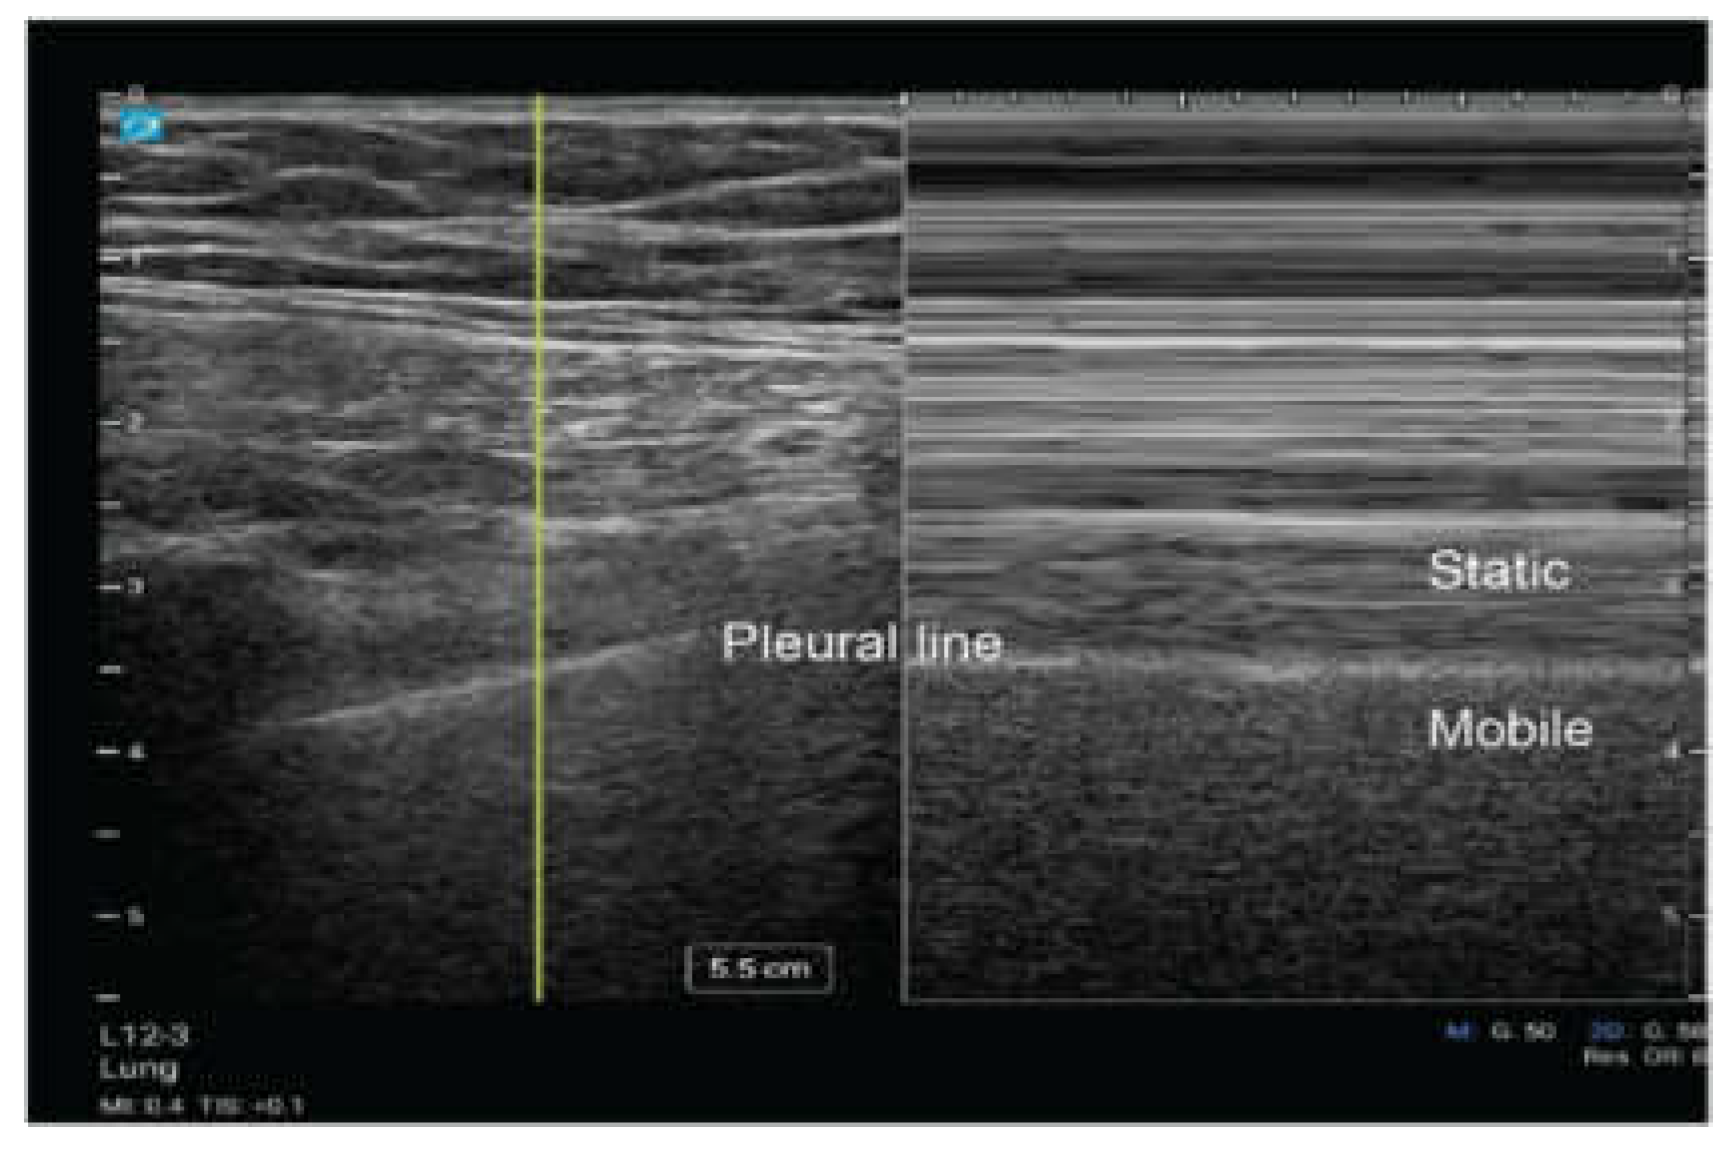
Figure 5.
The * indicates vertical, hyperechoic artifacts extending from the pleural line. The increasing number of these artifacts represent B-lines in panels B, and C suggests a progression of lung interstitial fluid accumulation.
Figure 5.
The * indicates vertical, hyperechoic artifacts extending from the pleural line. The increasing number of these artifacts represent B-lines in panels B, and C suggests a progression of lung interstitial fluid accumulation.
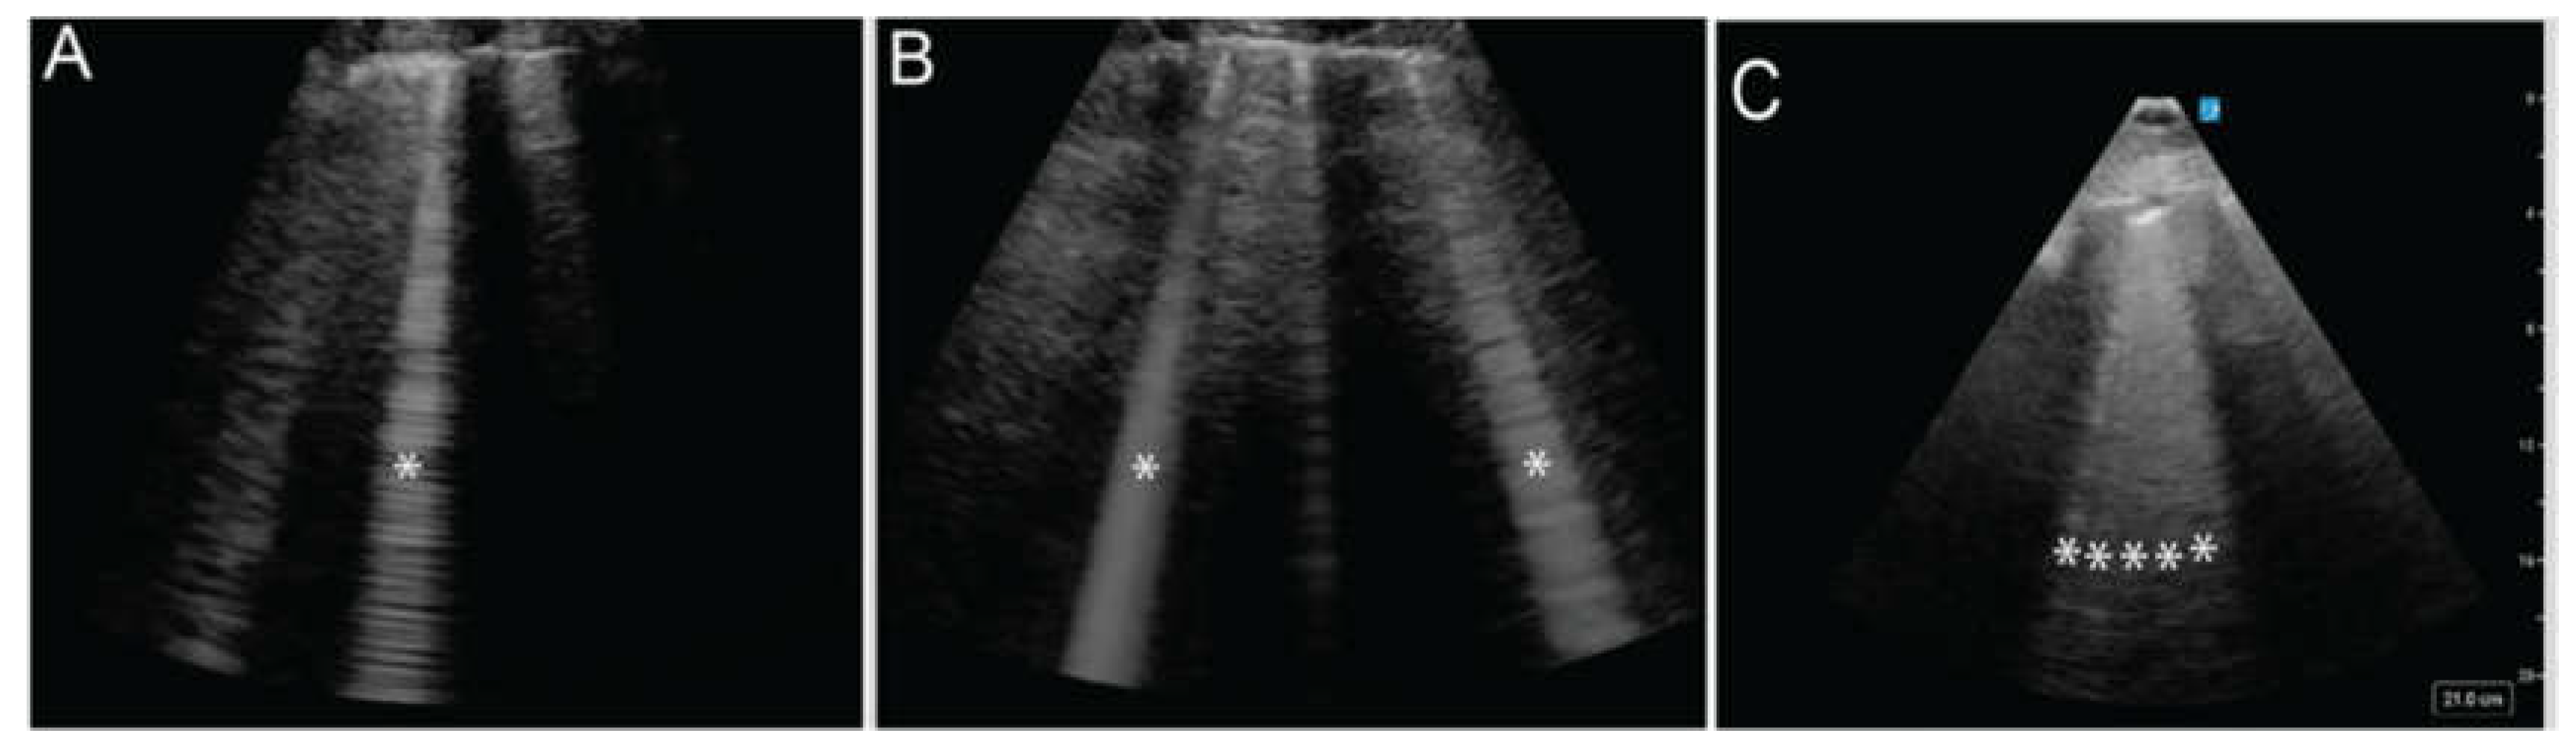
Figure 6.
Comparison of ultrasound transducer types based on footprint. From left to right: Phased array transducer, Linear transducer, Microconvex transducer, and Curvilinear transducer.
Figure 6.
Comparison of ultrasound transducer types based on footprint. From left to right: Phased array transducer, Linear transducer, Microconvex transducer, and Curvilinear transducer.
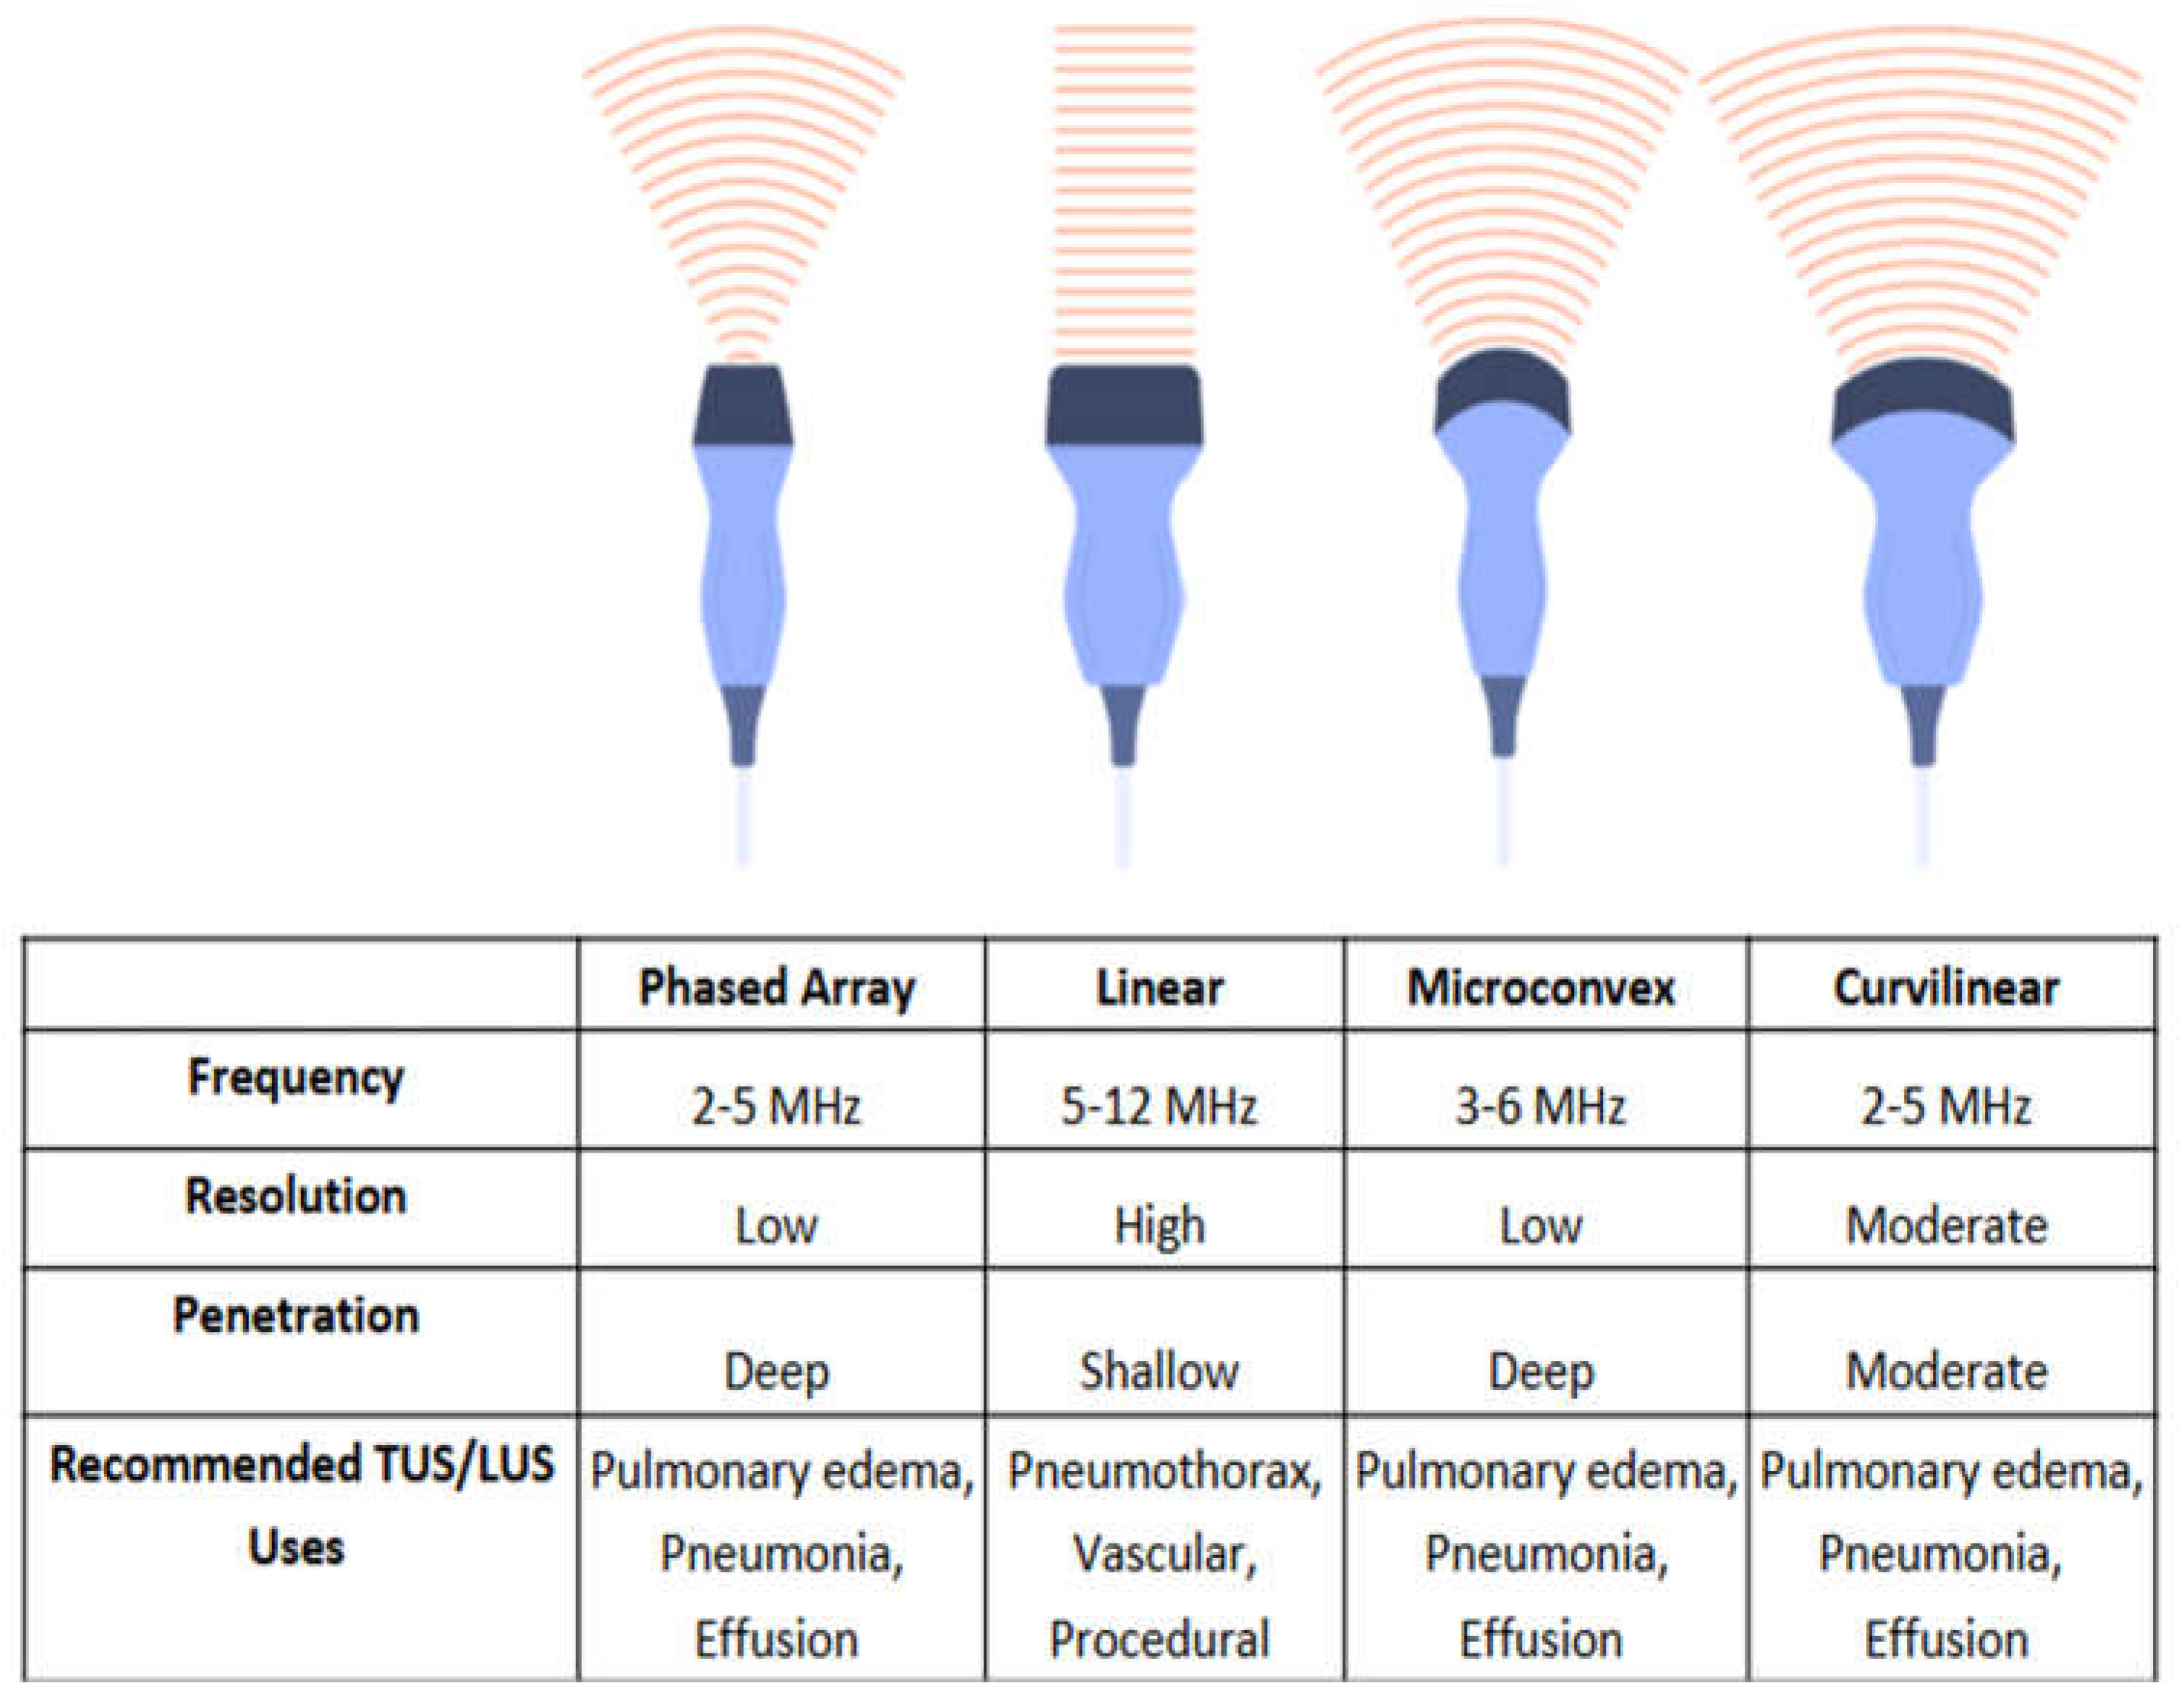
Figure 7.
Ultrasound images of the anterior neck demonstrating ETT placement. A transverse view at the suprasternal notch (Panel A) allows identification of the trachea (Panel B) and confirmation of intratracheal ETT placement using cuff inflation and deflation to generate bubble artifact (Panel C).
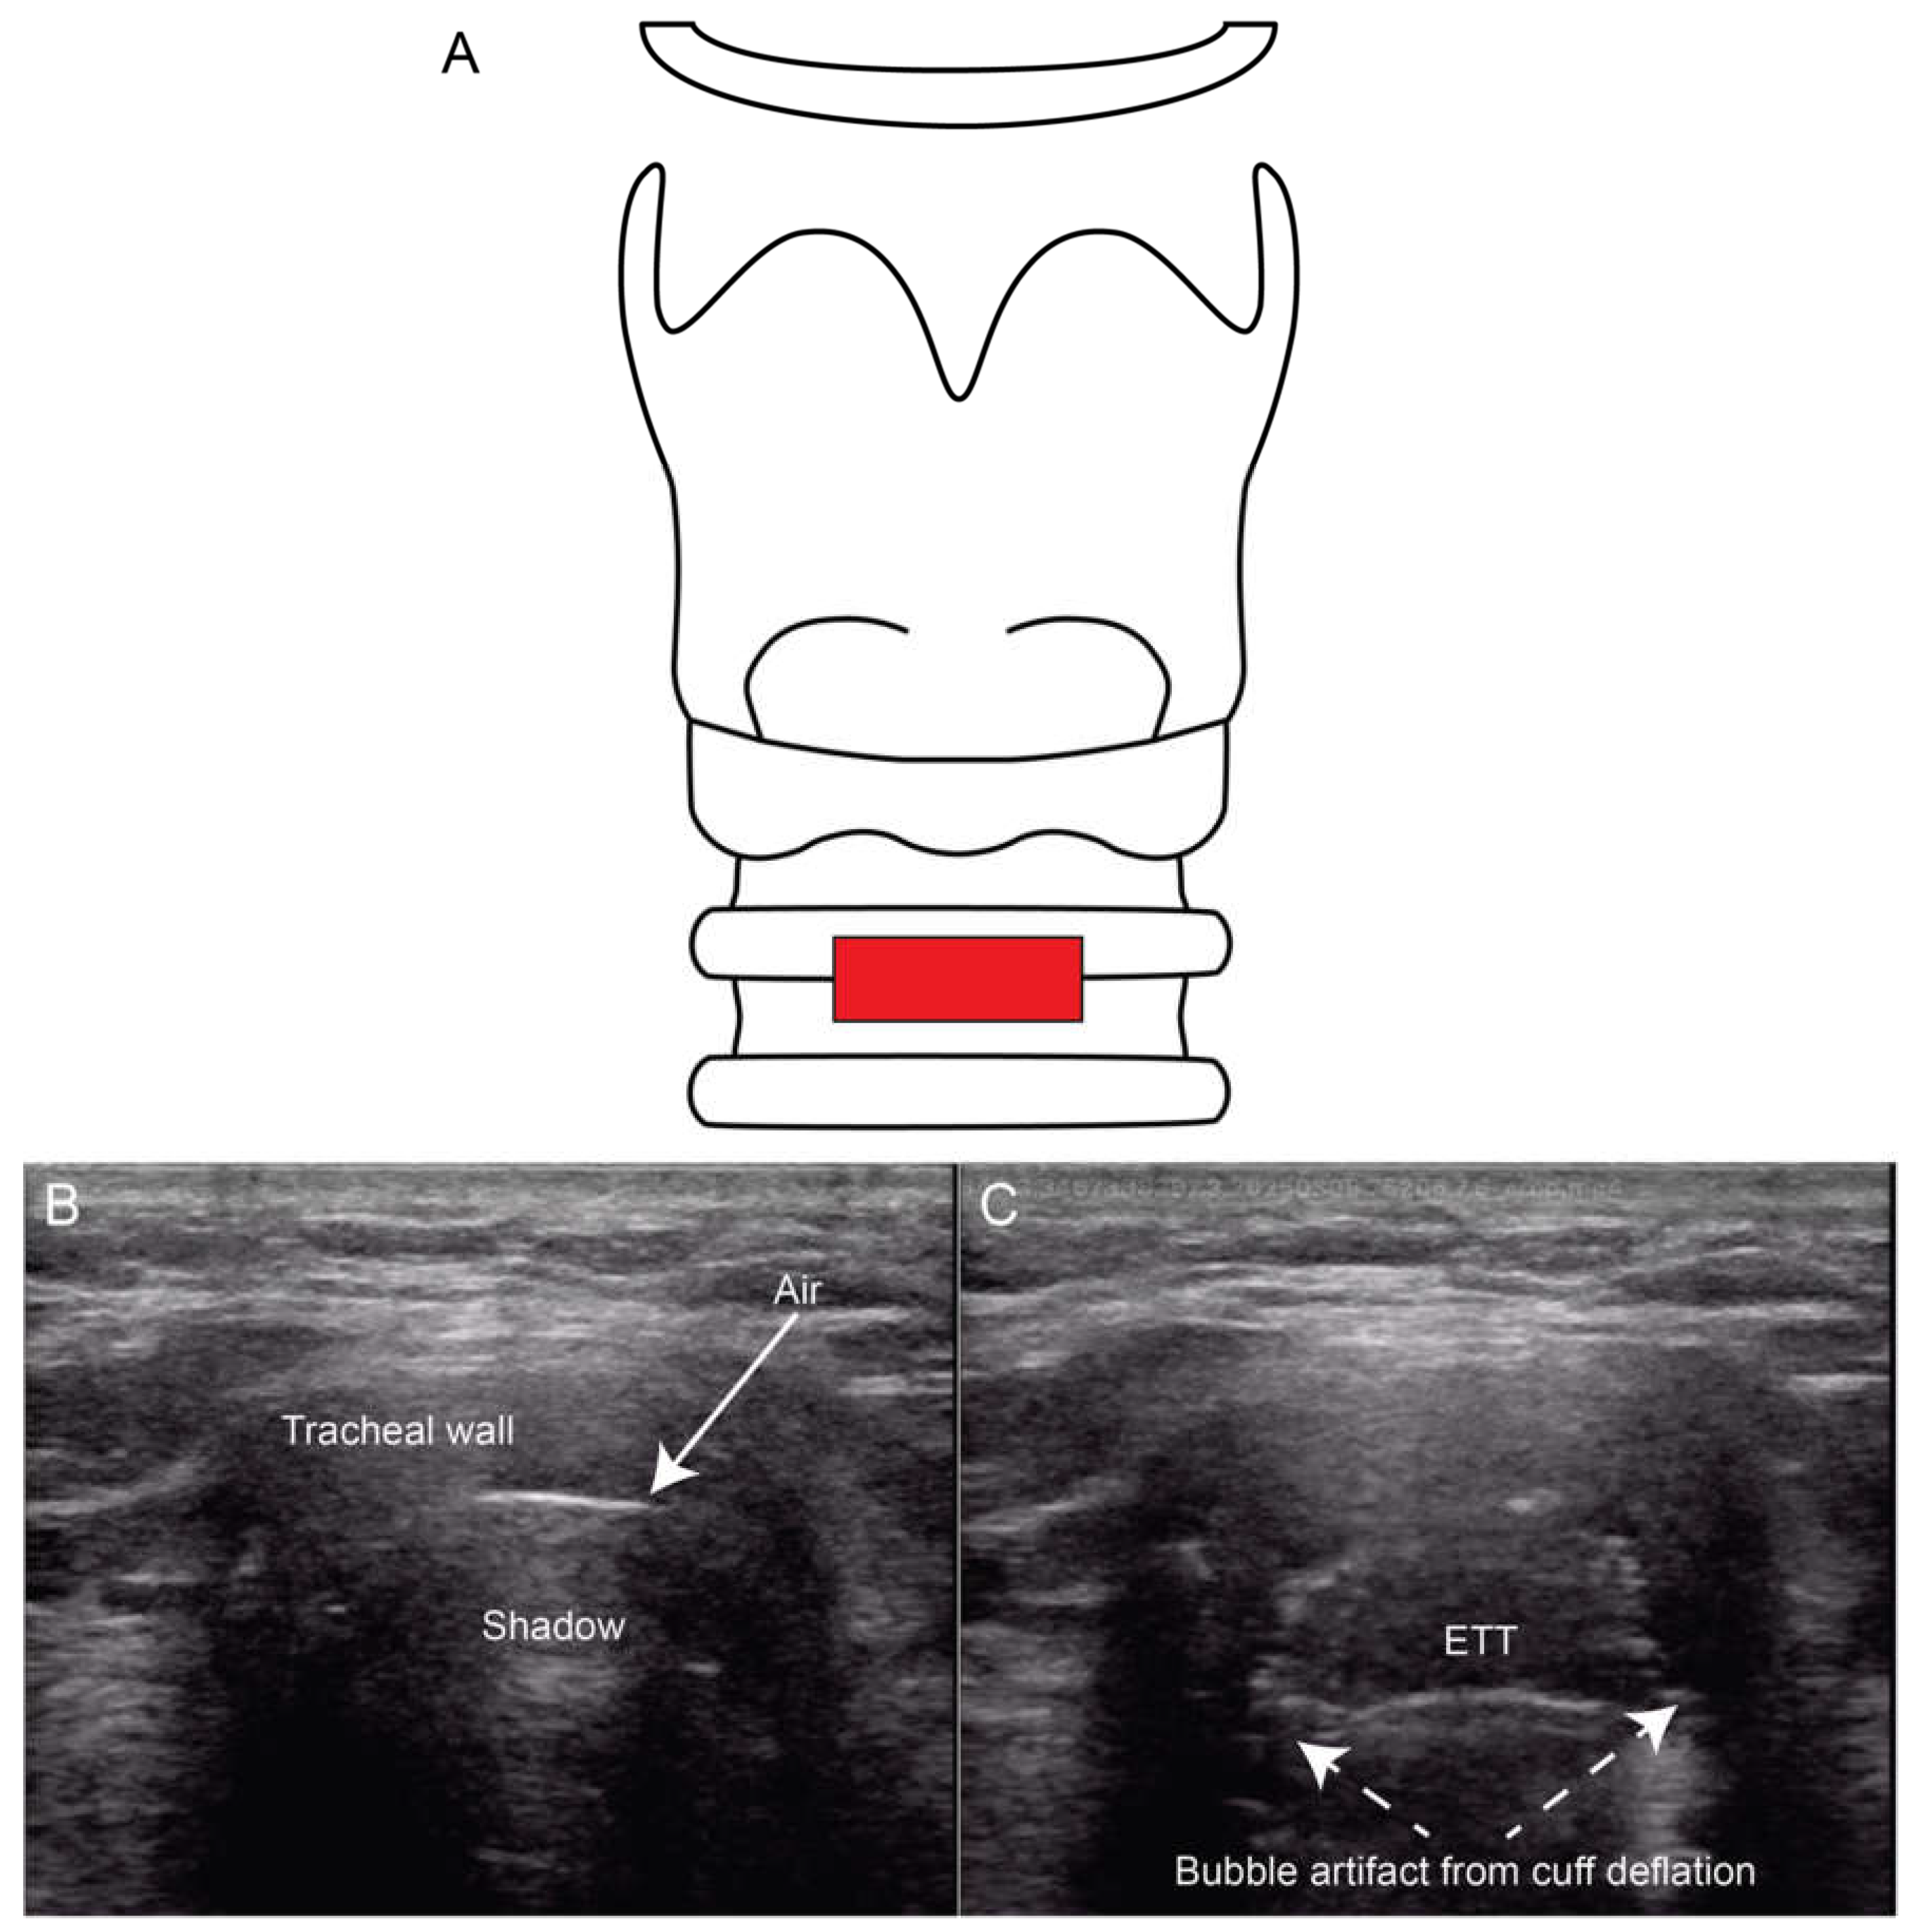
Figure 8.
Subcostal bicaval view demonstrating the inferior vena cava (IVC), right atrium (RA), and superior vena cava (SVC). The CVC wire (arrow) is seen emerging from the SVC into the RA.
Figure 8.
Subcostal bicaval view demonstrating the inferior vena cava (IVC), right atrium (RA), and superior vena cava (SVC). The CVC wire (arrow) is seen emerging from the SVC into the RA.
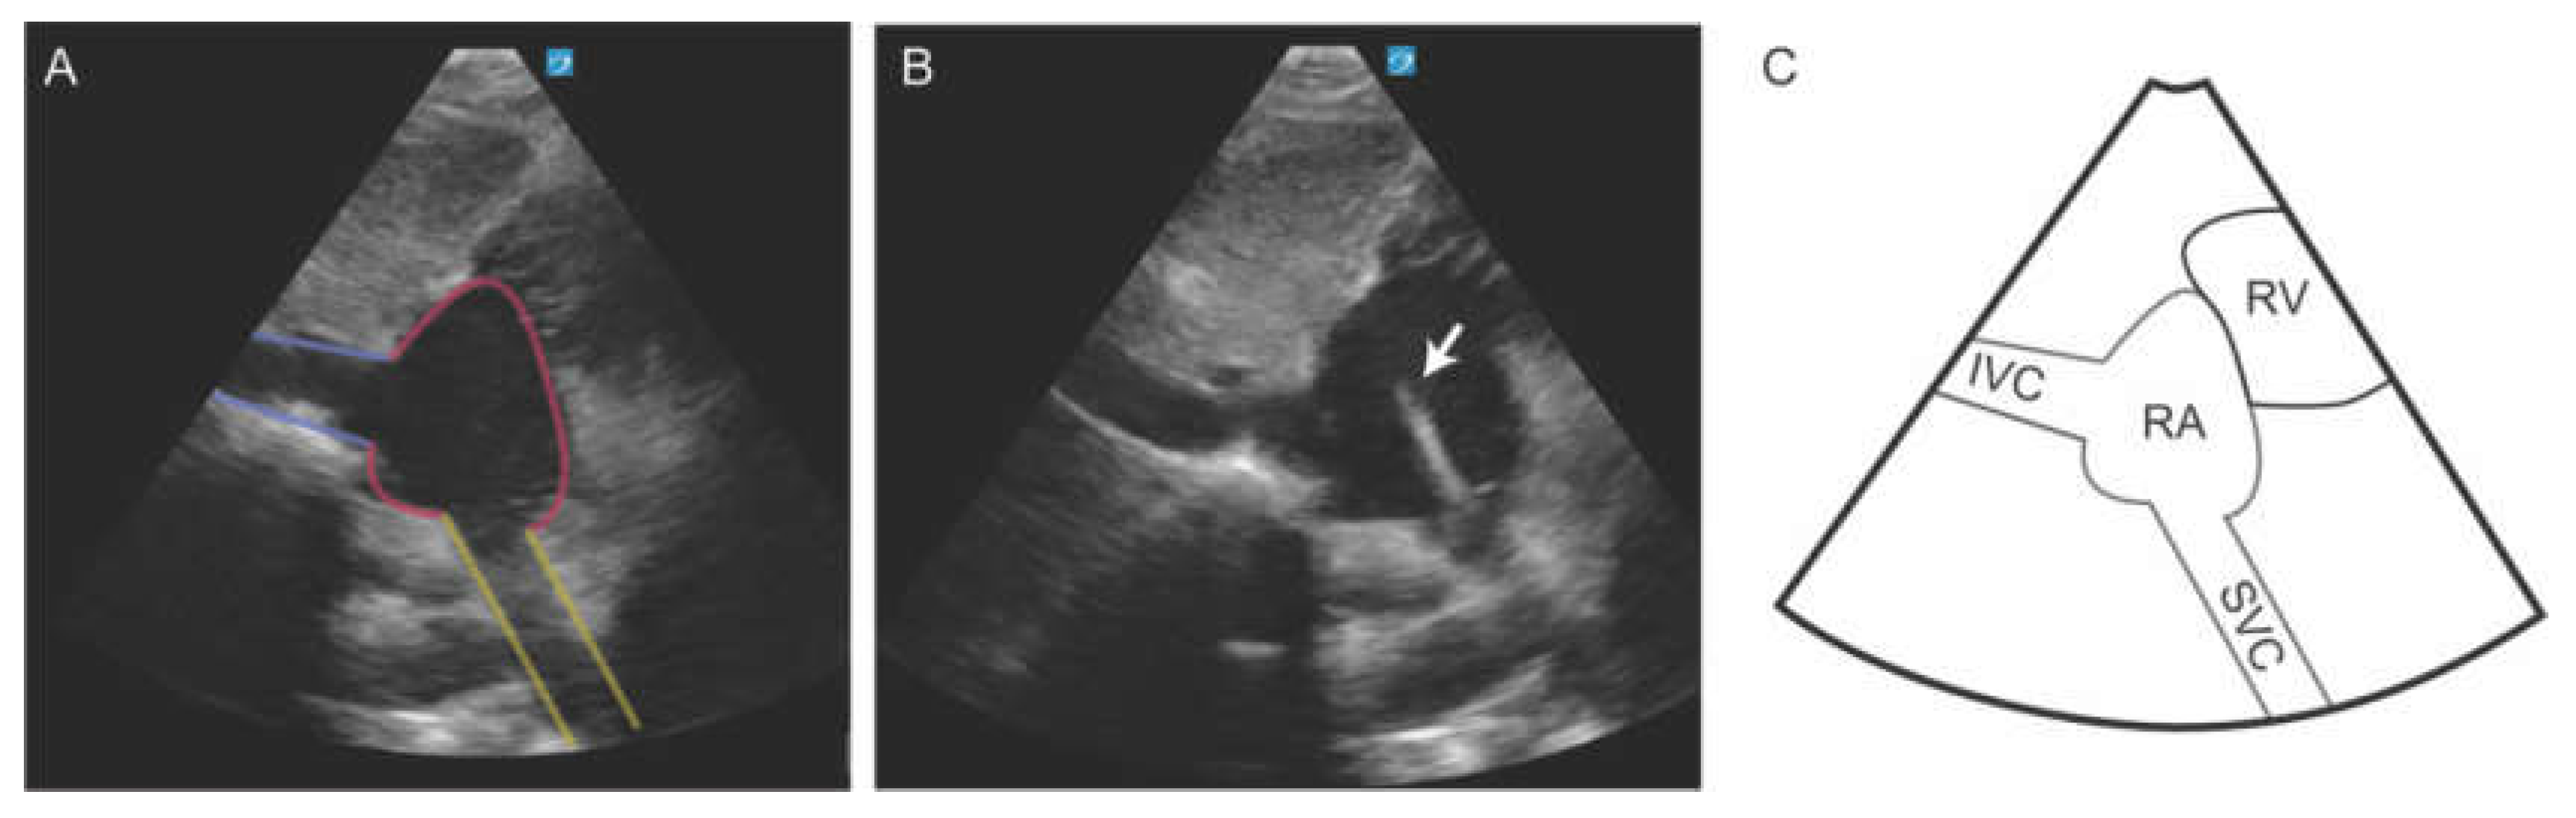
Figure 9.
A. ICA coursing above the rib, visualized using linear ultrasound with color-power Doppler. B Tortuous ICA visualized with arterial angiography.
Figure 9.
A. ICA coursing above the rib, visualized using linear ultrasound with color-power Doppler. B Tortuous ICA visualized with arterial angiography.
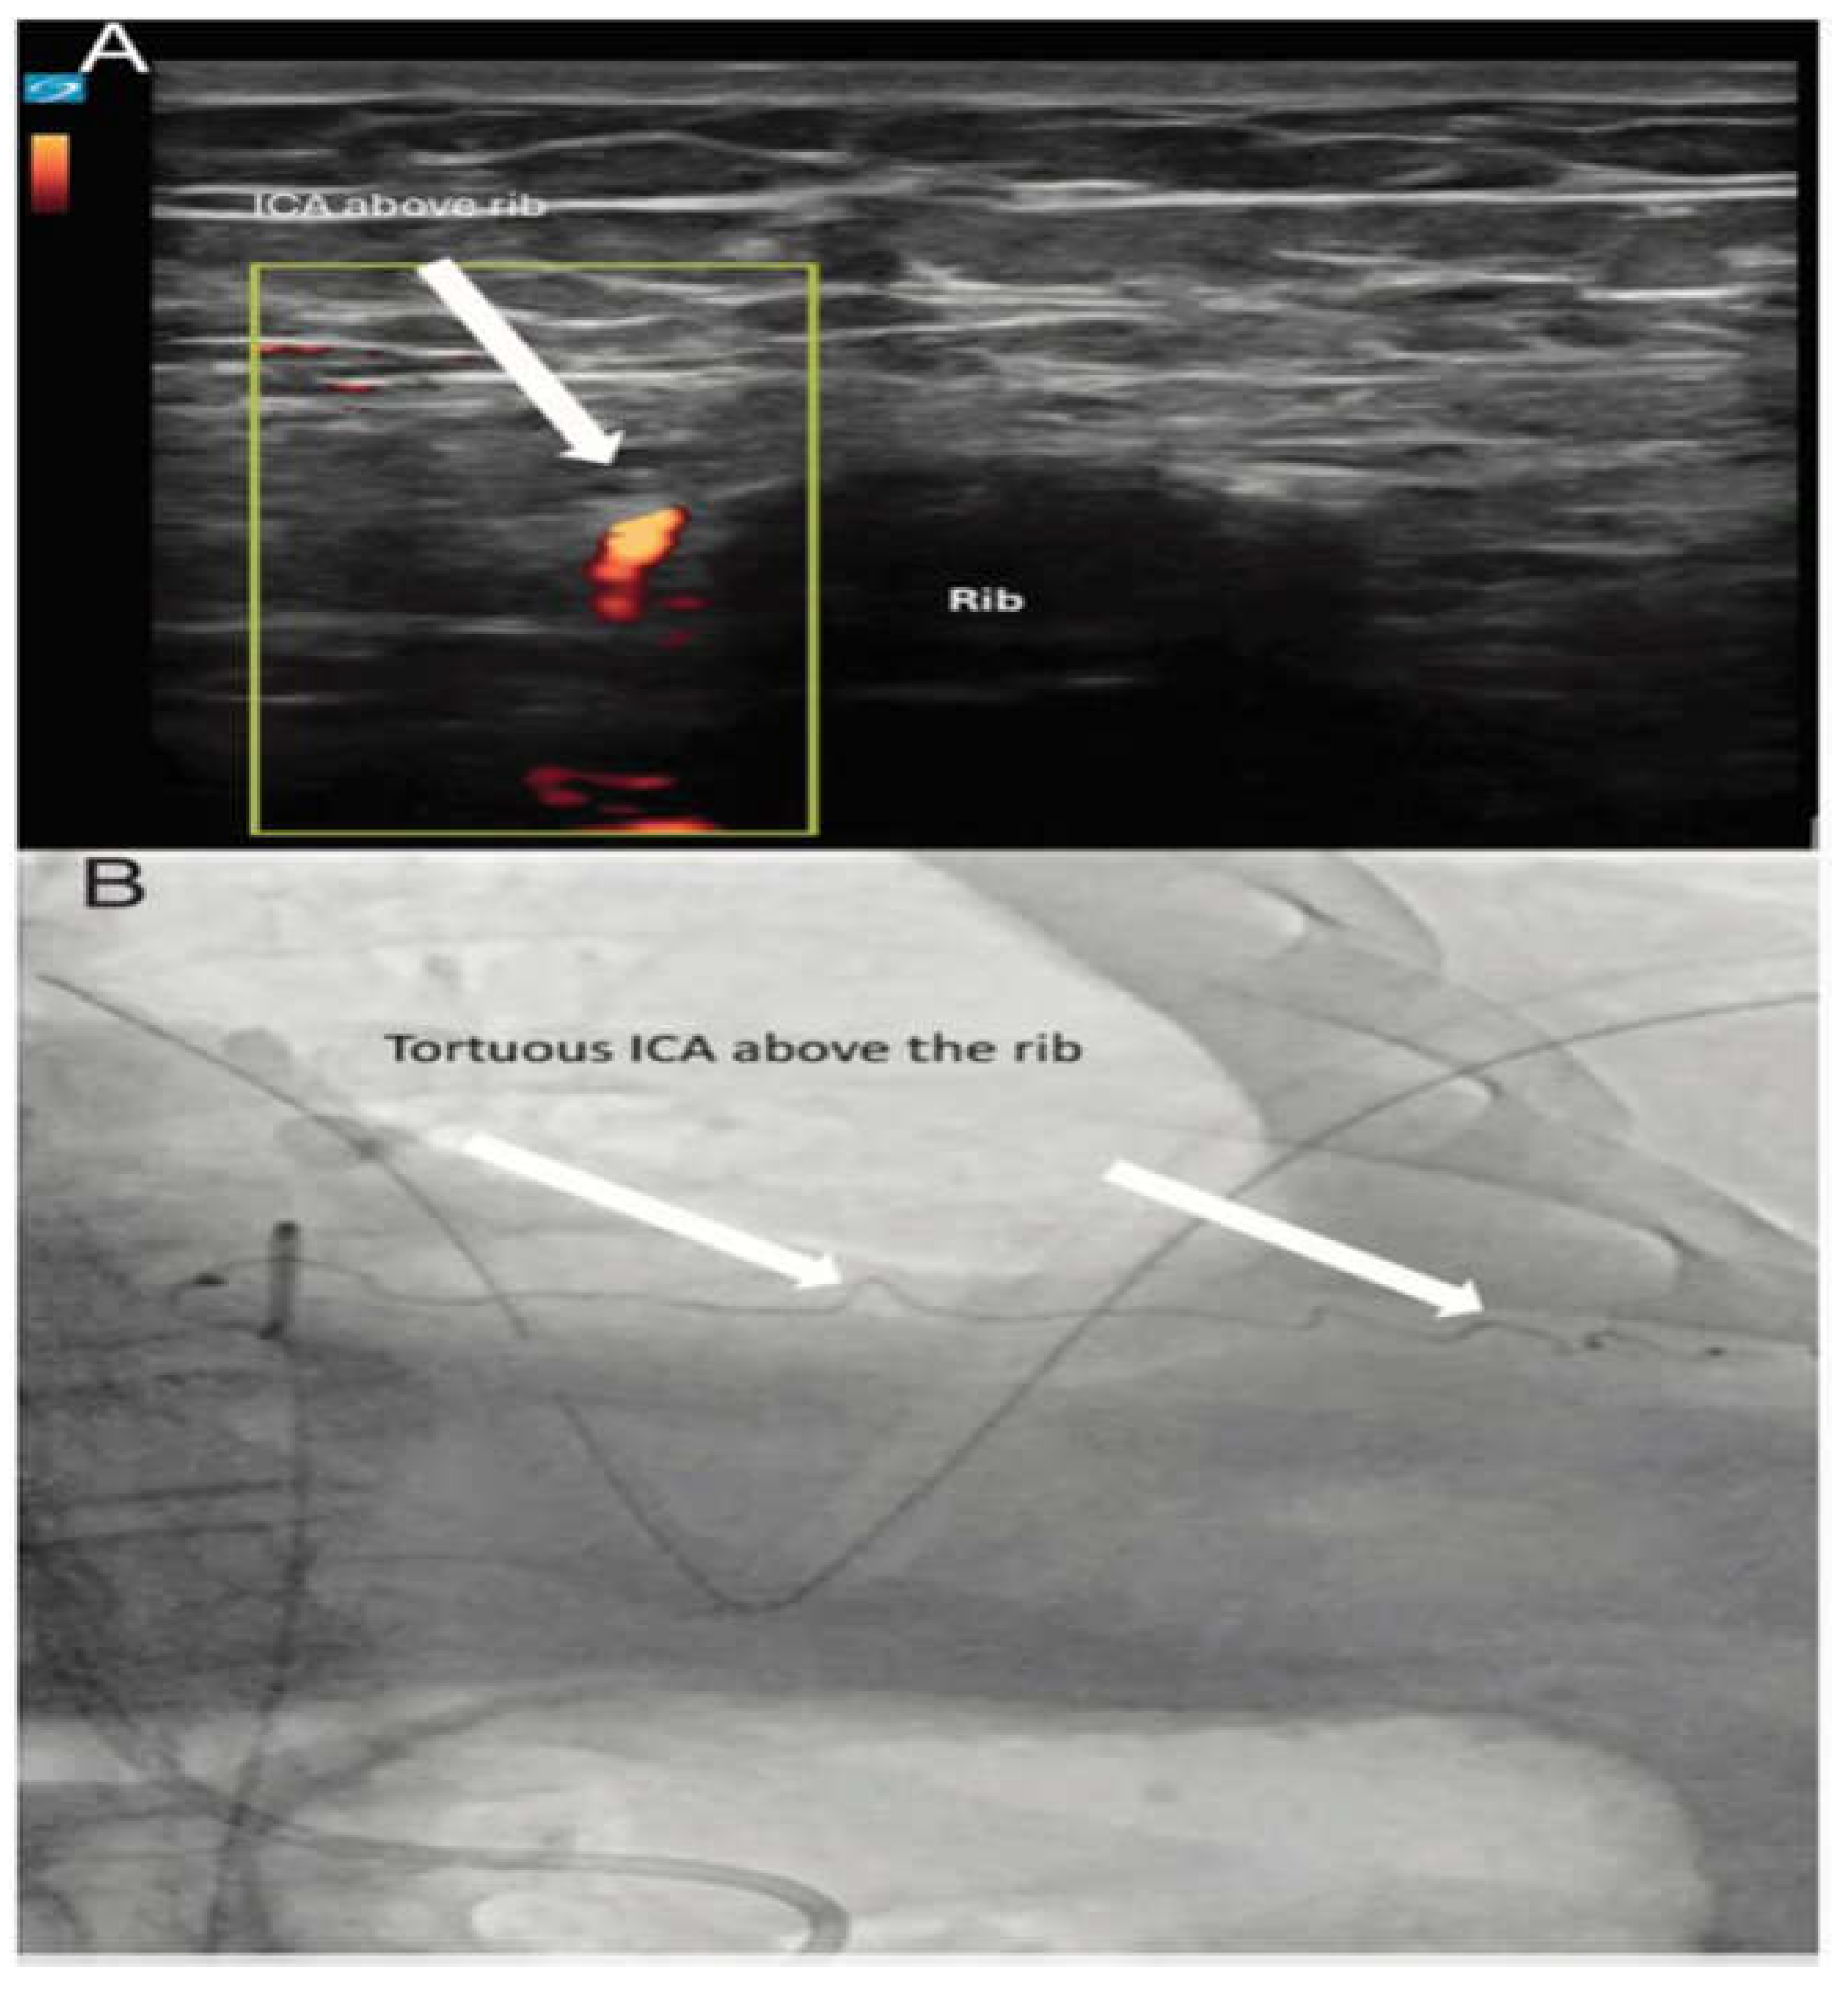
Figure 10.
M-mode ultrasound demonstrating lung sliding. Left: Normal lung with lung sliding producing the "seashore sign." Right: Absent lung sliding consistent with pneumothorax, producing the "barcode sign”.
Figure 10.
M-mode ultrasound demonstrating lung sliding. Left: Normal lung with lung sliding producing the "seashore sign." Right: Absent lung sliding consistent with pneumothorax, producing the "barcode sign”.
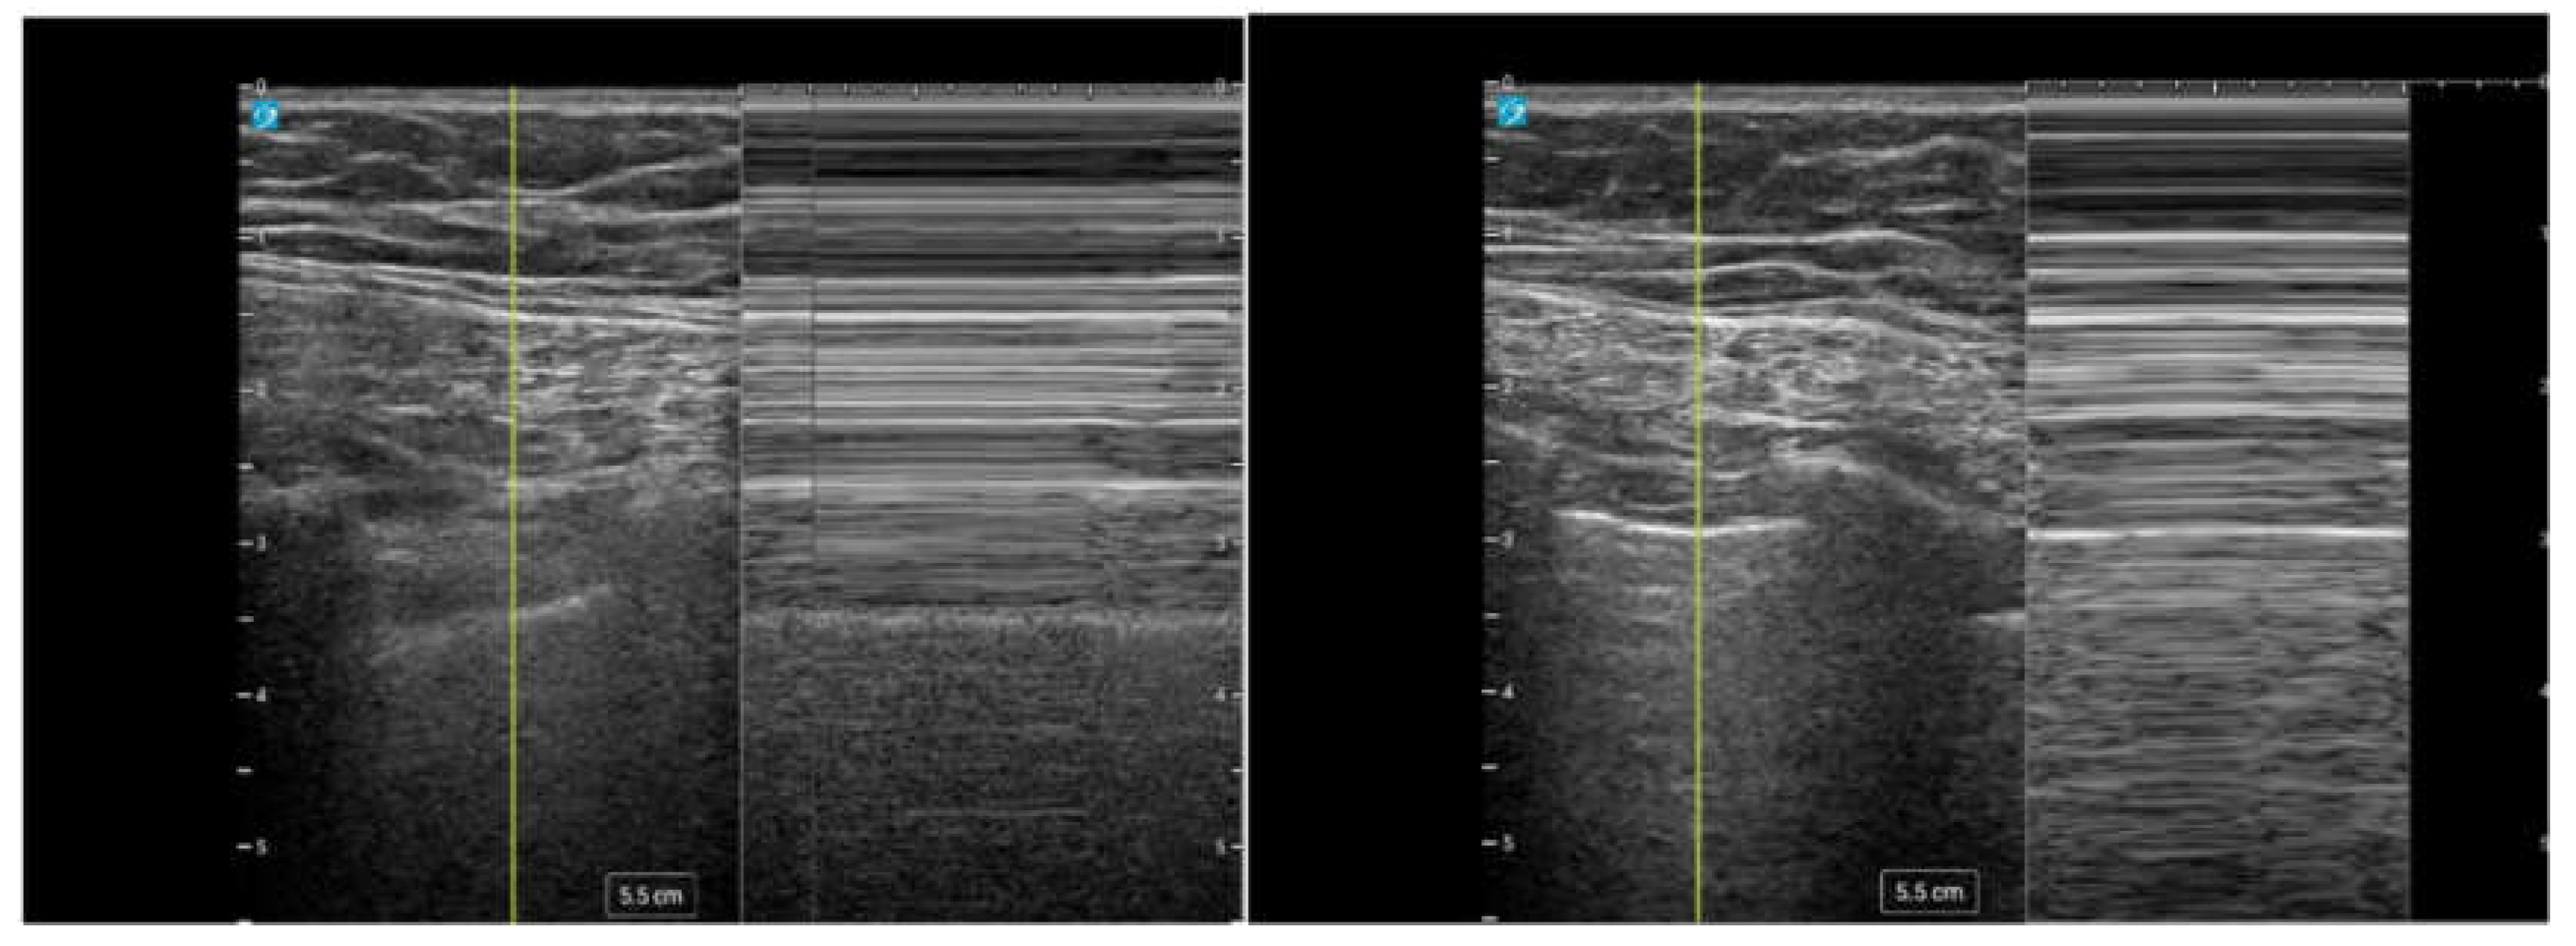
Figure 11.
A) Isolated areas of B-lines (arrows) consistent with pneumonia B) Subpleural consolidation (white outline) C) Large consolidative pneumonia (white outline) D) Air bronchograms (white arrowheads).
Figure 11.
A) Isolated areas of B-lines (arrows) consistent with pneumonia B) Subpleural consolidation (white outline) C) Large consolidative pneumonia (white outline) D) Air bronchograms (white arrowheads).
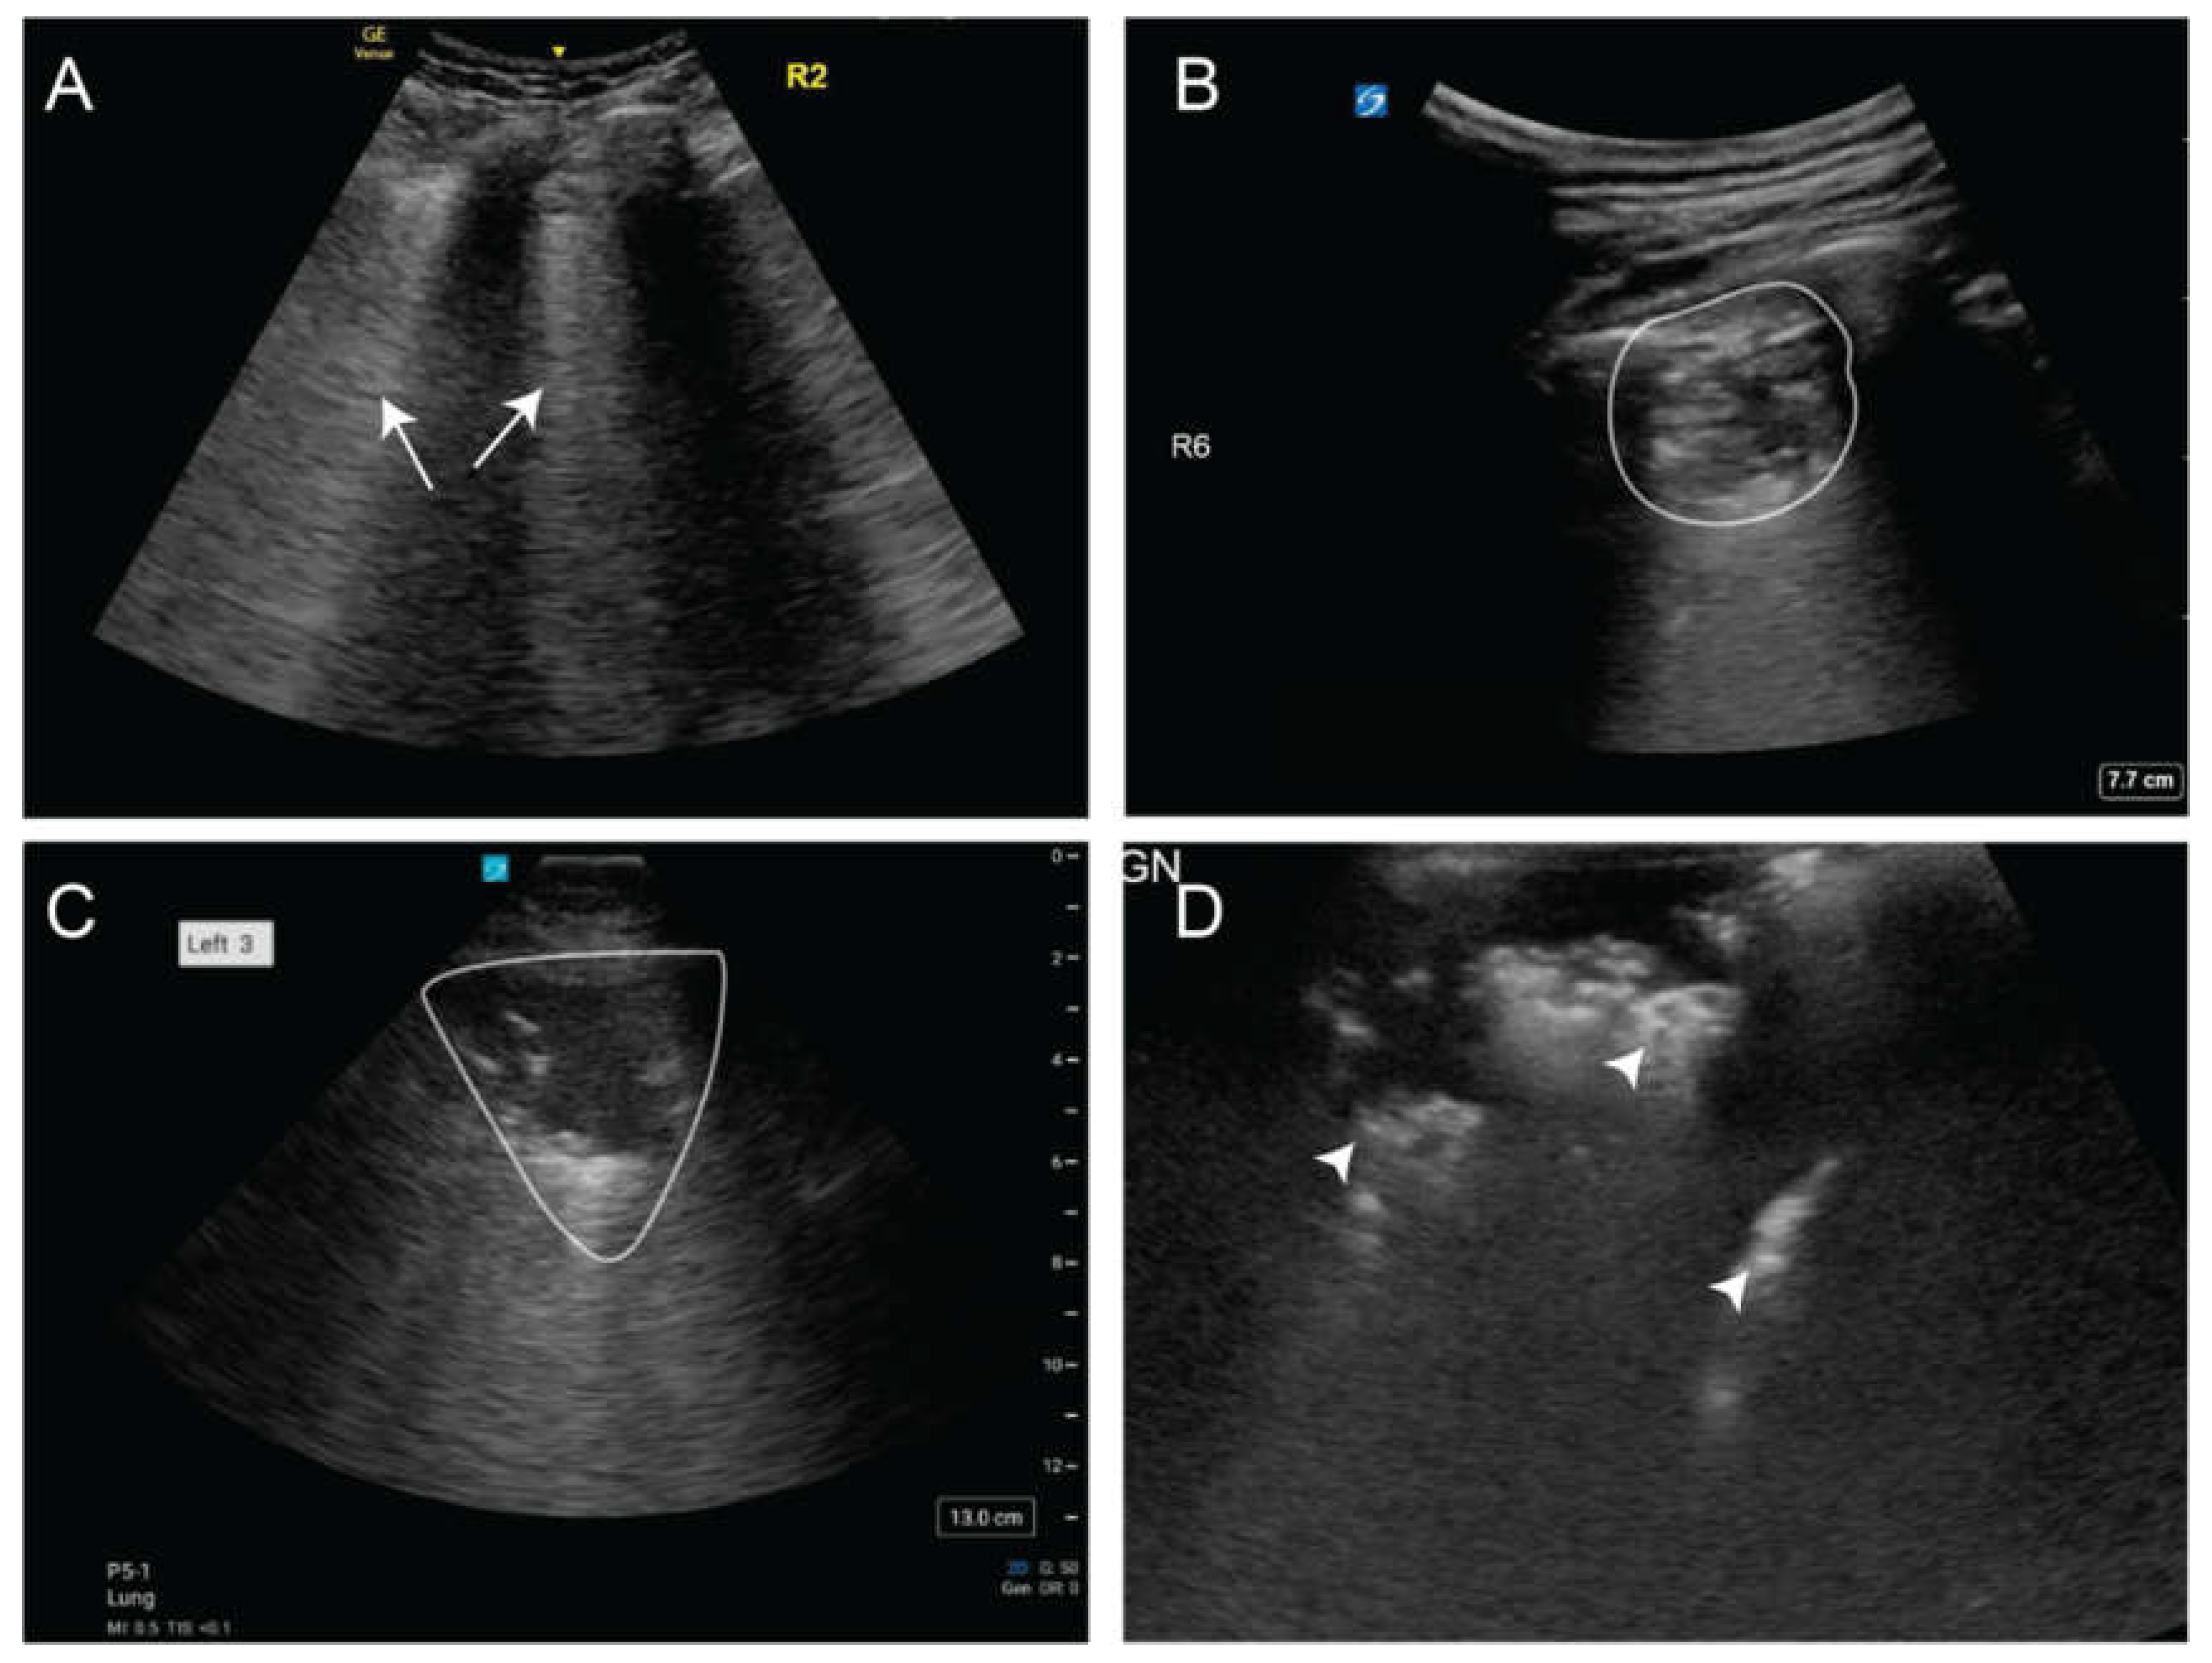
Table 1.
Key Thoracic and Lung Ultrasound Artifacts and Signs in Lung Assessment.
| Term | Definition |
|---|---|
| A-lines | Horizontal, hyperechoic lines from reverberation artifact, indicating air filled lungs and helping exclude interstitial syndromes or pulmonary edema. Can be seen in pneumothorax. |
| Lung Sliding | Shimmering movement of the pleural line seen in 2D and M-mode ("sandy beach" pattern), confirming lung ventilation and reducing the likelihood of pneumothorax. |
| Lung Pulse | Subtle pleural movement due to cardiac motion, seen in low or absent ventilation states (e.g., low tidal volume, regional hypoventilation). |
| B-lines | Vertical, hyperechoic artifacts that move with lung sliding and obliterate A-lines. Scattered B-lines can be normal, but ≥3 per window suggests alveolar-interstitial syndrome. |
Table 2.
Steps of the DIVOT Protocol for Ultrasound-Guided Thoracentesis with Color Doppler Assessment of the Intercostal Space.
Table 2.
Steps of the DIVOT Protocol for Ultrasound-Guided Thoracentesis with Color Doppler Assessment of the Intercostal Space.
| Step | Description |
|---|---|
| Identification | A phased array transducer was used to locate the pleural effusion, lung parenchyma, and diaphragm. |
| Marking | A skin marking pen was used to mark the selected site. |
| Intercostal Space Assessment | A high-frequency linear transducer was used to visualize the target intercostal space and adjacent ribs. Zoom was activated to enhance visualization. |
| Doppler Imaging | Color Doppler imaging (CDI) was applied, scanning from the inferior border of the superior rib to the superior border of the inferior rib. The flow scale was adjusted until pulsatile activity of the intercostal artery (ICA) was identified. |
| Confirmation and Final Assessment | CDI was used to confirm findings and assess additional low-flow vessels in the planned procedural field. |
Disclaimer/Publisher’s Note: The statements, opinions and data contained in all publications are solely those of the individual author(s) and contributor(s) and not of MDPI and/or the editor(s). MDPI and/or the editor(s) disclaim responsibility for any injury to people or property resulting from any ideas, methods, instructions or products referred to in the content. |
© 2025 by the authors. Licensee MDPI, Basel, Switzerland. This article is an open access article distributed under the terms and conditions of the Creative Commons Attribution (CC BY) license (https://creativecommons.org/licenses/by/4.0/).
Copyright: This open access article is published under a Creative Commons CC BY 4.0 license, which permit the free download, distribution, and reuse, provided that the author and preprint are cited in any reuse.


