Submitted:
08 April 2025
Posted:
09 April 2025
You are already at the latest version
Abstract
BACKGROUND AND OBJECTIVES: In 2002, Bangladesh became the first country to implement a ban on the use of polyethylene bags. However, after 20 years, it appears that the ban has not been implemented. Taking this considera-tion, this study investigates the political and economic barriers to the implementations of polyethene bag ban in Bangladesh. METHODS: This study employed a multi-faceted methodology to compre-hensively investigate plastic pollution and management strategies. In this study, content analysis involved reviewing several key documents, including national policies and international frame-works. Spatial analysis using ArcGIS contributed spatial insights, while face-to-face Key Informant Interviews and an online survey captured diverse perspectives. FINDINGS: This study found that low pricing of polythene bag, no available alternatives of polythene bag, high price of alternatives, lack of financial and infrastructural support for the eco-friendly alternatives are the main economic barrier to the polyethene bag bans. Notably, 91 participants (57.90%) think that lack of cheaper alternatives such as polyethene bags is the main barrier to implement of the ban in Bangladesh. The results also indicated that cheaper price (22%), easy availability (36%), and high price of alternative (27%) were the main reasons for preferring polyethene bags among participants. The finding of this study is that a cheaper and environment friendly alternative is needed in our country to implement the ban successfully. Additionally, the public and private sectors should come forward to invest in the alternative bag sector to make it cheaper for consumers. The government's initiatives, while commendable, necessitate stringent enforcement, amendments for specificity, and expansion beyond Dhaka to ensure holistic efficacy. CONCLUSION: The central government's role in influencing plastic waste management through taxation and incentives is pivotal, requiring alignment NGOs and civil society, for fostering public awareness and collaboration. This comprehensive examination serves as a foundation for informed policymaking and sustainable interventions to address the pressing challenges of plastic waste in Bangladesh.
Keywords:
Plastic policy
; ban
; implementation
; political barriers
; economic barriers
INTRODUCTION
Plastics are extensively used globally because of their light weight, high durability, adaptability, ease of manufacturing, and reduced production costs compared with other comparable materials (Angriani et al. (2021). The global production of plastics was only 1.5 MT in 1950, which increased 215 times higher in 2015 with 322 MT (Banu 2019, Barnes 2002). Moreover, it has been predicted that the global production of plastic waste will be 670 MT in 2040 (Delangiz et al., 2022; Mugobo et al., 2022). The plastics industry is expanding swiftly in Asia, which is presently the largest producer in the globe (Kadusic, 2021; Karayilan et al., 2021). The ever-increasing use and waste of plastic has transformed the most alluring aspects of marine and terrestrial ecosystems into a curse(Barrowclough and Birkbeck, 2022,Mai et al. 2024). Due to its destructive effects on ecosystems, the majesty of the oceans, and the livelihoods of marine animals, pollution has been a significant concern over the past decade. Since the majority of plastics are intended for one-time use, half of all plastic waste is packaging materials (UNEP, 2018; Mwaza & Mbohwa, 2017). Moreover, only nine percent of these nine billion tons of plastic have been recycled (UNEP, 2018,World Bank 2021). The same holds true for Bangladesh (Majumder et al., 2020). After Bangladesh's 1971 liberation war, the older commercial district of the city of Dhaka became home to a flourishing plastics manufacturing industry that exported $477 million in the most recent fiscal year. However, because it has no domestic polyolefin industry, the country must import its basic materials (Bharadwaj et al. 2020, Debnath et al., 2023). There are still many large and minor plastics factories operating in the country. There were approximately 5,000 plastics-related enterprises in Bangladesh in 2016. During the previous two decades, factories expanded at a rate of over twenty percent annually. Due to the detrimental effects of their manufacturing and recycling processes and the hazardous residues, these industries fall under the group of Orange B (Environmental Conservation Rules, 1997) category industries. Due to the potential dangers they pose to human life and the environment, the ECR 1997 requires that these enterprises maintain a significant distance from residential areas and protected areas. These factories must be located in industrial zones, areas with a high concentration of industry, or undeveloped land. However, the larger portion of these businesses are located in such areas within Dhaka, creating an intriguing blend of residential and commercial communities. In addition, these enterprises will receive a Location Clearance Certificate and an Environmental Clearance Certificate in that order. These businesses require a certificate of no objection from the local authority, an emergency plan for negative environmental impacts, reports on the feasibility of the industrial unit, the Initial Environmental Examination of the industrial unit, the design of the Effluent Treatment Plant (ETP), and the environmental management of the industrial unit. After completing the aforementioned tasks, these companies must apply for an Environmental Clearance Certificate; without this clearance certificate, they will be denied access to the gas line, unable to begin test operation in the industrial unit, and thus unable to run the project at all (Bangladesh Environment Conservation Act, 1995). The government of Bangladesh has made it illegal to produce, import, market, sell, demonstrate for sale, stock, distribute, commercially carry, or use any polythene shopping bag or other material made of polypropylene or polyethylene, or any other good that is harmful to the environment. This provision was added to the Bangladesh Environmental Conservation Act in 2002. Despite the prohibition, plastic bags are again widely accessible throughout the nation. The government has established a three-year action plan for enforcing the prohibition, but it has yet to be executed. The amended rule states that anybody caught using a banned polythene bag would face a penalty of Tk50,000 to 10 lakh or imprisonment of 1 year up to 10 years, or both (Barrowclough & Birkbeck, 2022). Despite these regulations, plastic factories operate freely across the country with little to no oversight. Therefore, it is obvious that these laws seem to exist just on paper, are not properly implemented, and there is no monitoring to determine whether these rules are being followed or not. While there may be numerous explanations for the lack of follow-through and oversight, the scope of this study will be limited to political considerations. Although there is a significant amount of research on the environmental consequences of polyethylene bag bans, there is a clear lack of studies focusing on the unique economic challenges associated with implementing these bans, especially in the context of Bangladesh. Polyethene bag bans have mostly been studied with a focus on environmental consequences, consumer behavior, and policy design aspects (Frias & Nash, 2019; Islam et al., 2018; Bharadwaj et al., 2020). Previous literature has tried to point the way for future research into possible options to SUPs that pollute nearby environments and ways to fix the damage they cause (Barnes, 2002,Ogutu et al. 2023, Paletta et al. 2019).Another study showed that using polythene bags is becoming more popular every day, even though some of the people surveyed said that plastic goods are bad for the environment. The findings from Banu (2020) shows that public motives combined with stricter enforcement, self-regulation, and monitoring may help reduce SUP pollution. Moreover, Varkey et al. (2021) stated that the enormous public interest in SUP reduction and the companies are concerned about identifying sustainable alternatives. It is found that the polyethene ban is appropriate and beneficial for the country since it has more positive effects than negative ones(Delangiz et al. 2022, Ganeshkumar et al., 2009, Swedish Environmental Protection Agency 2019, Muposhi et al. 2022). In order to reduce the waste of plastics, focus should be made upon the difficulties in replacing natural raw materials and changing industrial methods. Semi-structured interviews reveal that, in order to facilitate easier transitions before taking legislative action, decision makers should step up their efforts to improve consumer knowledge and standardize legislation across jurisdictions (Molloy et al., 2022,Ogushi and Kandlikar 2007). One study finds out that in order to decrease the number of plastic bags used in the community, either raise the price of plastic bags or find alternatives that are less harmful to the environment, including using shopping baskets or bags or eco-friendly plastic bags (Angriani et al., 2021). According to a recent research, plastic contaminants were found in 81% of tap water samples collected globally. This suggests that the people of Bangladesh may be consuming anywhere from 3000 to 4000 microparticles of plastic from tap water each year (Nadiruzzaman et al., 2022). However, there has been a lack of focus on the economic obstacles impeding the effectiveness of these restrictions in Bangladesh. There is a scarcity of research on the economic obstacles related to the prohibition of polyethene bags and the entrepreneurial prospect of sustainable alternatives (Naher and Ebeh, 2024). By scrutinizing the reasons behind the existing compliance landscape, the study contributes to the growing body of knowledge on effective environmental governance and regulatory enforcement. Moreover, the findings of this research are not merely evaluative; they are a catalyst for change. By shedding light on the strengths and weaknesses of governmental interventions and responses, the study aims to propose innovative strategies. These strategies will be instrumental in enhancing the environmental performance of plastic manufacturing industries in Dhaka, ultimately fostering a sustainable balance between economic growth and environmental preservation. In essence, this study is not just about Dhaka's plastic industry; it is a crucial exploration into the delicate interplay between economic development, environmental responsibility, and governmental efficacy. The insights gained will not only benefit Bangladesh but will contribute valuable lessons to the broader discourse on sustainable industrial practices globally. Moreover, this research aims to address this lack of understanding by conducting a comprehensive analysis of the economic barriers that have hindered the enforcement of the Polyethene Bag ban in Bangladesh since 2002.
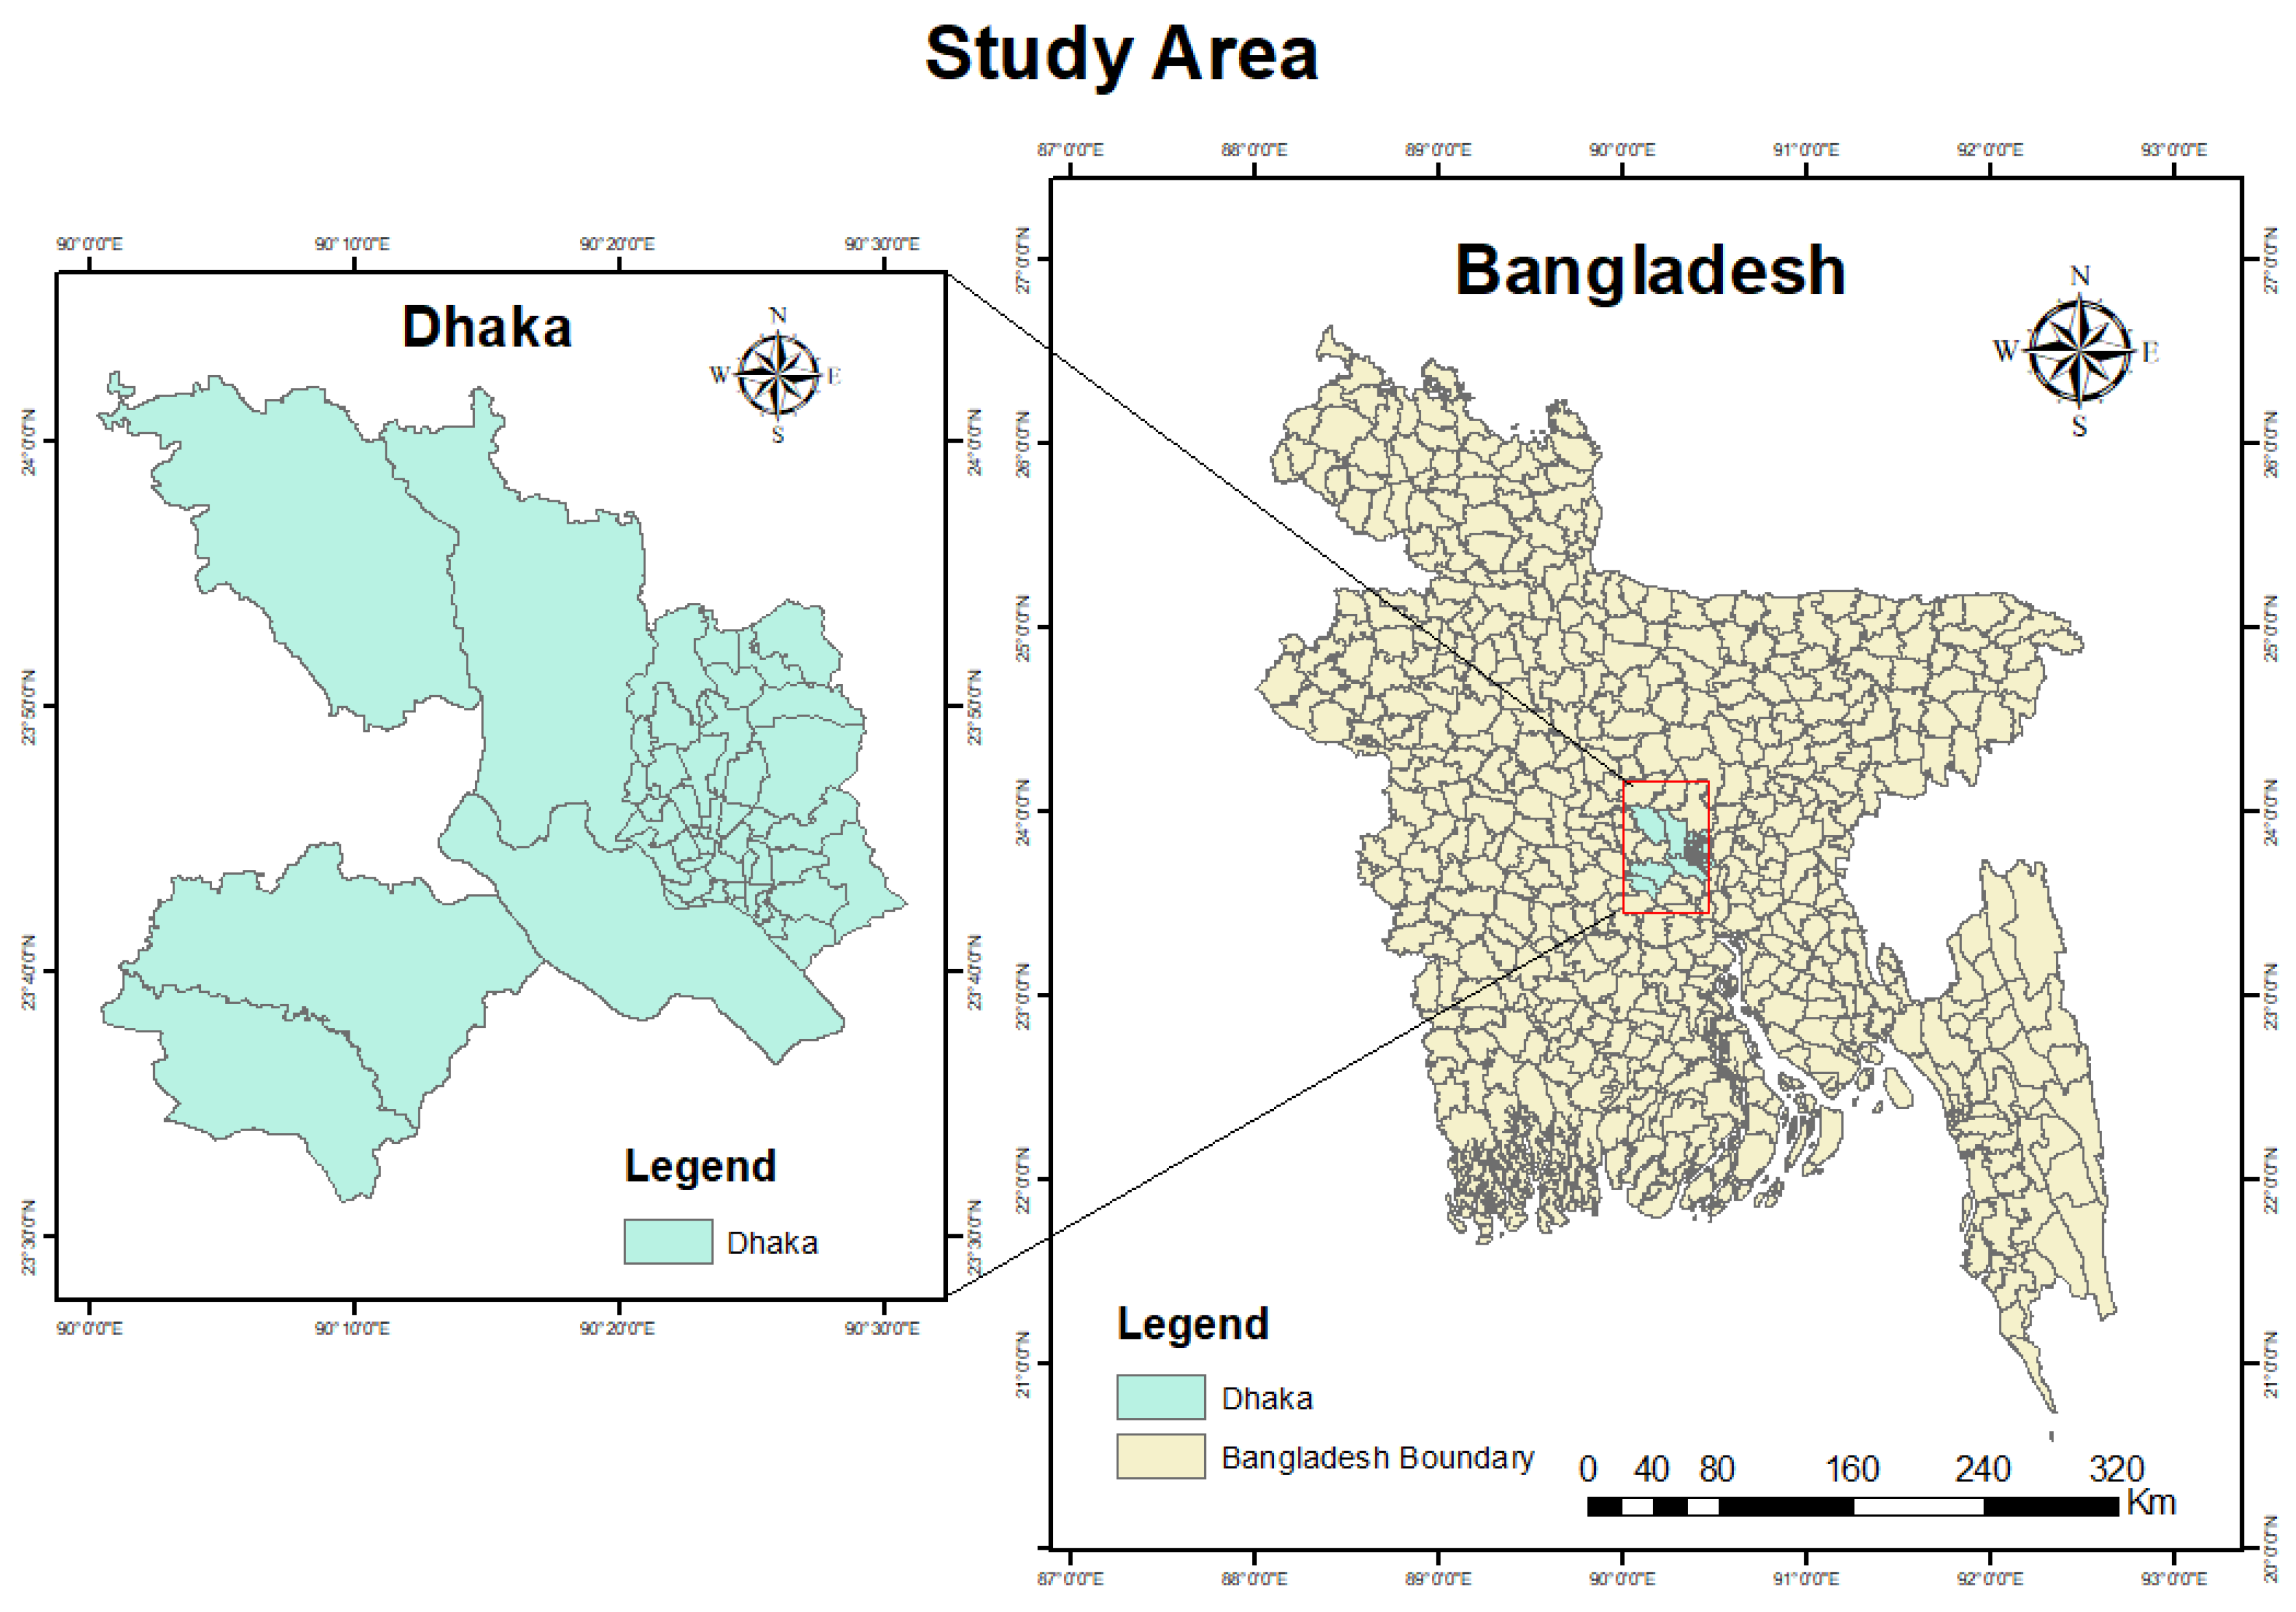
The primary study area is Bangladesh, as the topic focuses on the national implementation of a polyethene bag ban. However, the specific area of this study is Dhaka, Bangladesh. This study adopted a comprehensive research methodology, integrating both qualitative and quantitative approaches, to thoroughly collect, process, analyze, and interpret data concerning plastic pollution. The methodology encompasses an exhaustive review of relevant literature, examination of key governmental policies, a structured field survey utilizing questionnaires, in-depth Key Informant Interviews (KII) conducted face-to-face with a semi-structured questionnaire, and the utilization of Geographic Information System (GIS) for spatial analysis. The data collection process involved both primary and secondary sources and the time period of data collection spanned from mid to late 2024.
MATERIALS AND METHODS
The study design and area of the research is displayed in the figures below:
Figure 1.
Study Design
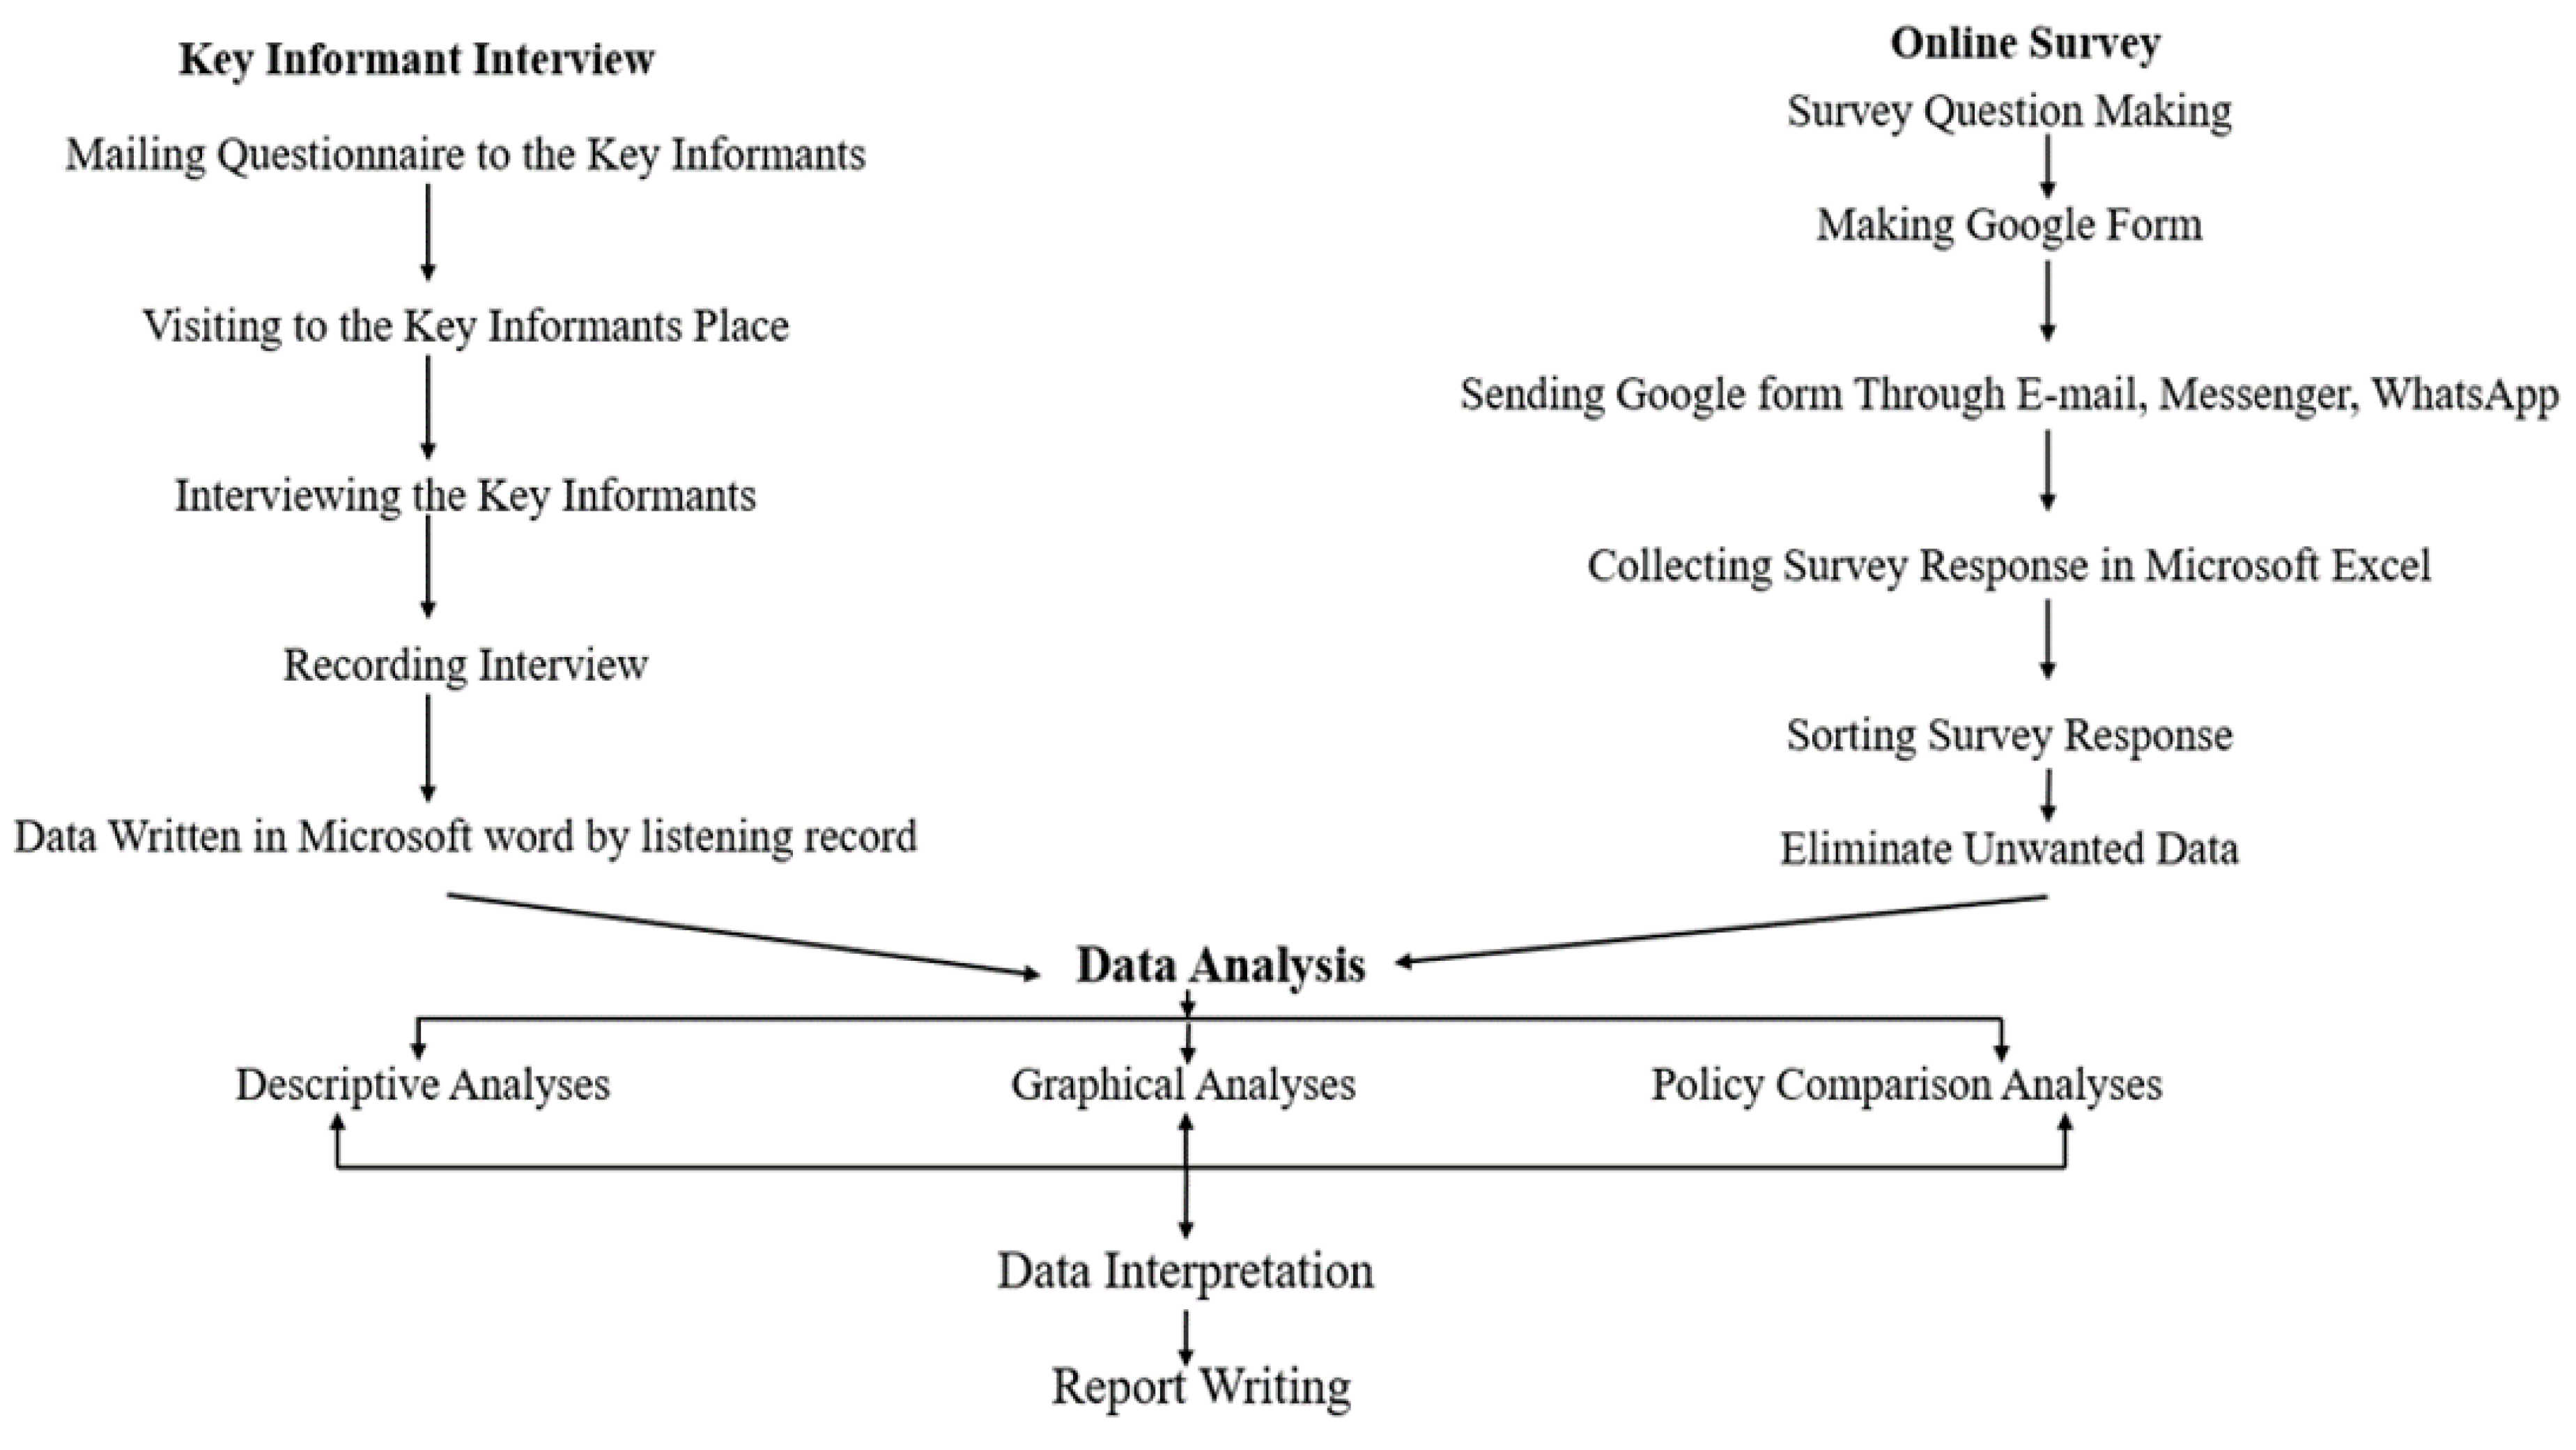
Figure 2.
Geographical location of the study area in Dhaka, Bangladesh.
For the primary data collection, a structured survey questionnaire was meticulously prepared. The following steps outline the procedure for gathering primary data:
- Questionnaire Preparation: Developing a structured survey questionnaire designed to extract detailed insights into plastic usage, disposal habits, and environmental impact.
- Target Demographic: Identifying and selecting stakeholders from various sectors contributing to plastic waste, ensuring a diverse representation.
- Survey Timeline: Conducting the online survey within a specific timeframe, from May to September 2024, to ensure data uniformity.
- GIS Integration: Utilizing GIS tools to geographically map plastic industry hotspots.
- Key Informant Interviews (KII): Developing a semi-structured questionnaire tailored for Key Informant Interviews. Semi-structured questionnaires tailored for 8 face-to-face Key Informant Interviews conducted with experts and professionals between July and October 2024, utilizing a maximum variation purposive sampling method.
The secondary data collection involved obtaining information from the following sources:
- Global and Government's Legal, Plan and Policy Documents: Reviewing key governmental and global legal and policy documents related to plastic regulation, waste management, and environmental sustainability.
- GIS Data Collection: Gather spatial data related to the distribution of plastic industries using GIS and interpolation analysis of collected data.
- Selection of Key Informants: Identify and select key informants with expertise in environmental policy, waste management, and plastic industry representatives.
To achieve the study objectives, an extensive content analysis was conducted, delving into relevant national and international sources. The literature sources encompassed:
- Review of national policy papers, strategies, and plans related to plastic regulation and environmental sustainability. Exploration of research reports and publications by academicians, NGOs, and INGOs, providing insights into the current state of plastic management in the context of Bangladesh.
- A comprehensive review of global frameworks and principles related to plastic pollution was undertaken, including documents such as the UN Guiding Principles on Plastic Management and Circular Economy Practices.
- Exploration of international agreements and initiatives addressing plastic pollution, considering their implications for sustainable plastic management strategies.
- In-depth analysis of European Union policies and strategies related to plastic waste management, with a focus on directives, regulations, and circular economy practices.
- Examination of successful models and initiatives within the European Union aimed at reducing plastic consumption and promoting recycling.
- Investigation into key studies comparing the approaches of various countries in managing plastic pollution, considering cultural, economic, and legislative factors.
- Synthesis of findings from international research reports and publications, providing insights into diverse strategies and their effectiveness in mitigating plastic-related environmental challenges.
In this study, 8 face-to-face Key Informant Interviews were conducted with experts and professionals between July and September 2024. The KII employed a semi-structured questionnaire to gather in-depth insights into plastic pollution, waste management practices, and policy implications. Maximum variation purposive sampling is a non-random sampling technique aimed at capturing a broad range of perspectives and experiences within a given population. In this study, this method was employed for Key Informant Interviews (KII). The process involved deliberately selecting participants who varied significantly in relevant characteristics, ensuring diversity and comprehensive insights into the plastic pollution landscape in Bangladesh. Key factors influencing the selection included expertise in environmental policy, waste management, and representatives from the environmental organizations and personnel involved in environmental research.
The survey was conducted using a stratified sampling method to ensure representation from various demographics. The structured questionnaire focused on assessing public perceptions, behaviors, and awareness regarding plastic use and disposal. The survey took place from August to September 2024. Krejcie and Morgan's sample size determination formula is a widely used method for selecting a representative sample in survey research. The formula calculates the minimum required sample size based on the total population size and desired level of confidence. In this study, Krejcie's formula was applied to determine the appropriate sample size for the online survey. Krejcie and Morgan's sample size determination formula is a widely used method for selecting a representative sample in survey research. The formula calculates the minimum required sample size based on the total population size and desired level of confidence. In this study, Krejcie's formula was applied to determine the appropriate sample size for the online survey.
The formula is as follows:
This survey was conducted with a sample size (n) of 100 individuals drawn from a total population (N) of 135. The study aimed to estimate population parameters with a high level of confidence, set at 95%, as indicated by the value of X2 of 1.96. The margin of error (E) was chosen to be 0.05, representing the acceptable level of variability in the estimated values. Additionally, the estimated proportion of the population with the characteristic of interest (P) is assumed to be 0.5, signifying the maximum variability and, consequently, yielding the maximum required sample size.
Statistical tools, including SPSS v.26.0 and Microsoft Excel, were employed for the analysis of both Key Informant Interview responses and online survey data. The analysis included statistical regression and correlation models, presenting relationships in tabular and graphical formats. This robust analysis aimed to identify patterns, trends, and correlations within the collected data, facilitating a comprehensive understanding of the current landscape of plastic pollution and public attitudes towards it.

Table 1.
Summary of Data Collection.
| Sl. | Data collection method | Instrument | Stakeholders | Total unit |
|---|---|---|---|---|
| 1. | Review of Key Literature/Policies/Strategies |
GoB policy papers, research report, publications conducted by academicians, NGOs and INGOs. | 17 |
|
| 2. | Spatial Data Collection | Geographical Databases | ||
| 3. | Key Informant Interview |
Semi-structured Questionnaire |
Relevant experts, researcher and professionals. | 8 |
| 4. | Survey Questionnaire | Structured Questionnaire |
General People from different backgrounds. | 100 participants for identifying political and economic barriers, respectively |
RESULTS AND DISCUSSION
Identifying the economic barrier for the implementation of Plastic ban law 2002 in Bangladesh
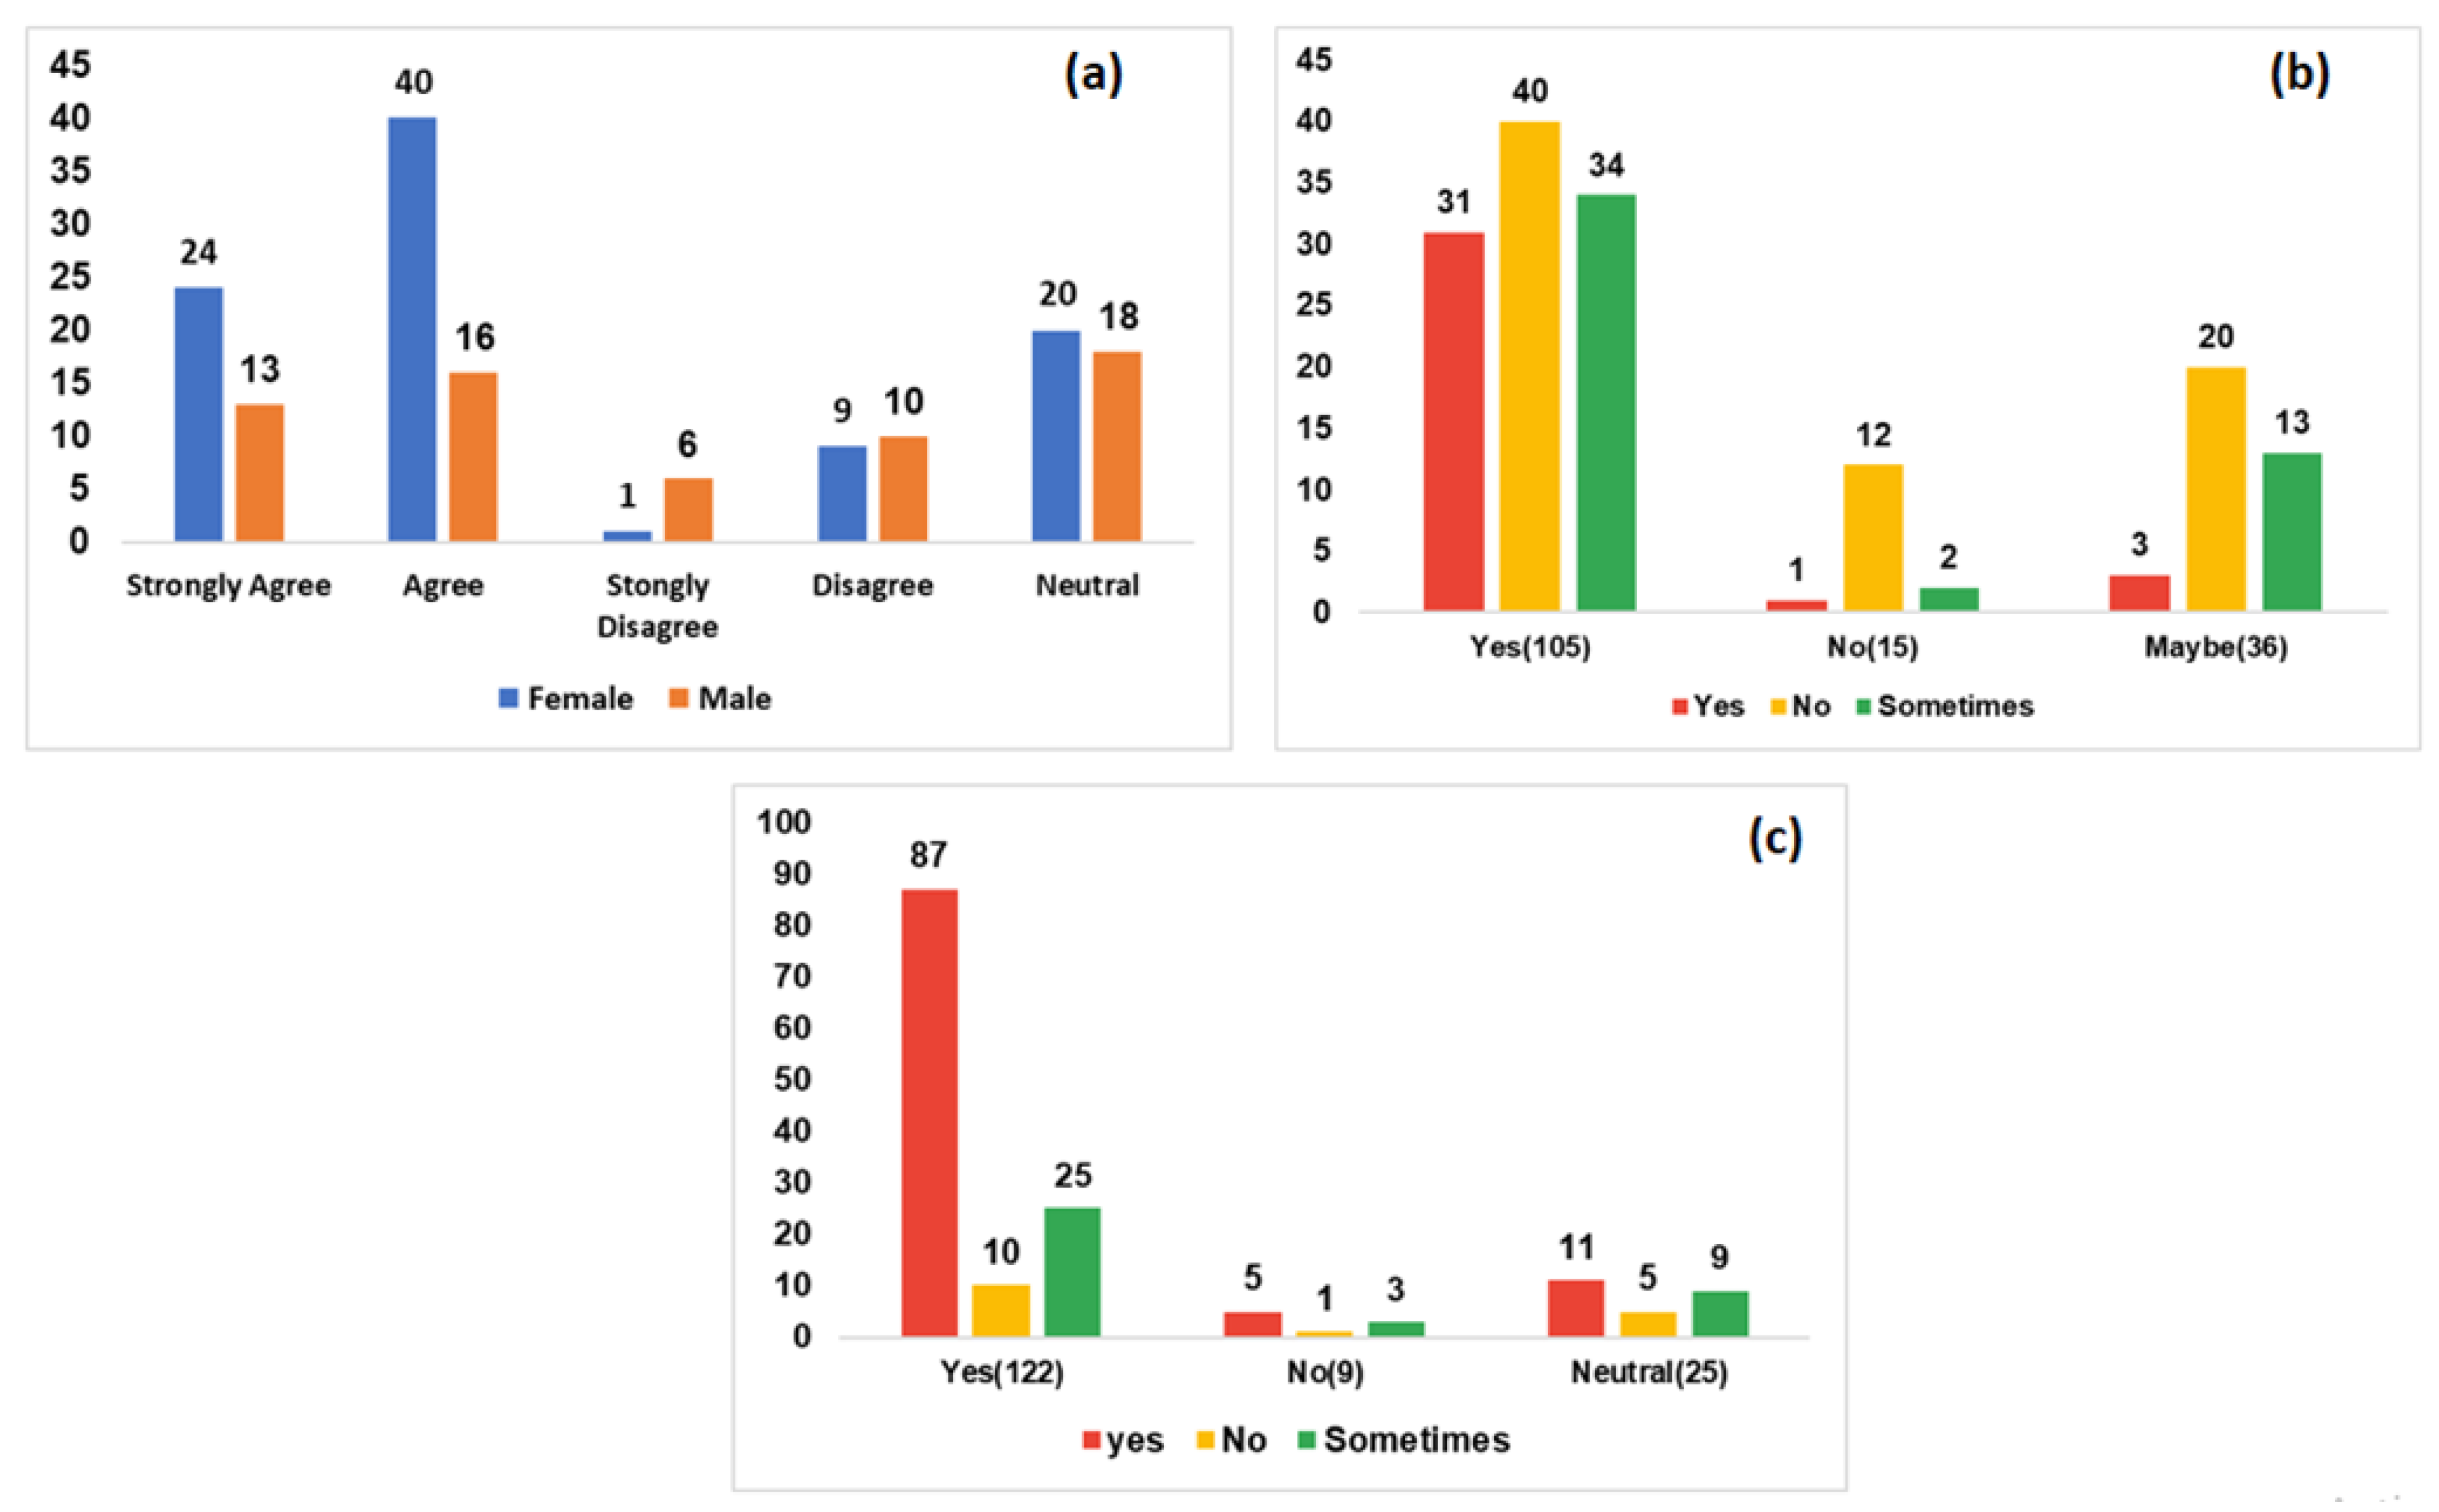
The survey of 100 participants identified key economic barriers to implementing a polyethylene bag ban in Bangladesh. The most significant challenge was the lack of cheaper alternatives, cited by 57.90% of respondents. Many participants emphasized that affordability plays a crucial role in consumer choices, making it difficult to transition away from plastic bags. Additionally, limited financial support for developing alternatives was reported by 36.30% of participants, highlighting the necessity for investments, loans, and tax exemptions to encourage the production of sustainable substitutes. Another major concern was insufficient investment in biodegradable bags, identified by 36.90% of respondents who stressed the need for greater funding to scale up production. Furthermore, consumer dependency on polyethylene bags was noted by 24.20% of participants, indicating the difficulty of changing established shopping habits. The fear of losing customers, acknowledged by 12.00% of respondents, further discouraged businesses from shifting to alternative bag options. Consumer preferences and willingness to pay for alternatives revealed mixed responses. While the majority of the participants expressed support for switching to plastic alternatives, only a small number were consistently willing to pay extra for them. However, 10 participants resisted due to cost concerns, while 25 remained uncertain, demonstrating a cautious approach to increased expenses. Gender differences were also observed in purchasing behavior—64 females and 29 males showed agreement toward buying jute bags, whereas 10 females and 16 males disagreed. This variation suggests that factors such as perceived affordability, environmental awareness, and personal financial capacity influence purchasing decisions. Recycling behavior among participants also exhibited complexity. Although many individuals expressed a preference for using recycled bags, actual participation in recycling activities varied significantly. Among those who were undecided about their preference for plastic alternatives, some engaged in recycling, while others did not. This finding underscores the gap between environmental awareness and actual behavioral practices, indicating that accessibility, convenience, and awareness campaigns are crucial for increasing recycling rates. When asked about compliance with a potential ban, 58% indicated their willingness to follow the regulation, showing strong support for environmental sustainability. However, 16% opposed the ban, citing concerns related to convenience and the practicality of such restrictions. Meanwhile, 26% took a conditional stance, agreeing to comply under specific circumstances, such as the availability of affordable alternatives. This diverse range of responses highlights the importance of policy flexibility, financial incentives, and awareness programs to encourage broader acceptance of the ban.
Figure 3.
Consumer responses on willingness to choose jute bags over polythene bags while purchasing goods at store.
Figure 3.
Consumer responses on willingness to choose jute bags over polythene bags while purchasing goods at store.
Retailers and policymakers also face several challenges in enforcing the ban. The affordability of polythene bags compared to alternatives continues to drive their widespread use. Additionally, concerns about job losses in the plastic industry discourage a transition away from plastic. Limited infrastructure and financial resources further impede the development of eco-friendly substitutes. Retailers' compliance with the ban is influenced by various factors, including the frequency of government inspections, awareness of plastic pollution, availability of alternatives, and possession of valid business licenses. These findings emphasize the need for a comprehensive approach that includes financial incentives, regulatory enforcement, and consumer education to ensure the successful implementation of a polyethylene bag ban in Bangladesh.
Industry Practices and Stakeholder Perception Analysis
The stakeholder survey findings highlight key demographic insights, economic and political challenges, and stakeholder perspectives on plastic pollution and waste management in Bangladesh. The majority of participants (32.99%) were young adults aged 26-35, with private sector employees (30.53%) forming the largest occupational group. A significant portion (46.88%) resided in rural areas, emphasizing the need for diverse geographic representation in policy discussions. Gender representation was nearly balanced (51.55% female, 48.45% male), while Comilla (29.47%) and Sylhet (26.32%) had the highest respondent concentrations. There was unanimous agreement that plastic is a major pollutant and that plastic pollution has increased in recent times. Strong support was observed for government funding in waste management (67.37%), imposing fines on waste disposal, and taxing plastic products (100%). Dissatisfaction with current waste management (64.21%) and recognition of the need for plastic waste segregation (67.37%) were also noted. Most participants (95.79%) believed individuals should bear the cost of waste management at the household level, while municipalities and central governments should manage waste costs at broader levels. Various statistical analyses are shown in Table 5, Table 6, Table 7, Table 8 and Table 9 and in Figure 5, Figure 6 and Figure 7. These tables and figures show a positive correlation (0.384) between the area of residence and opinions on funding plastic waste management at the central government level, suggesting geographic variations in perspectives. A weak negative correlation (-0.190) between area of residence and satisfaction with the current plastic waste management system, indicates potential regional variations in satisfaction levels. A weak negative correlation (-0.128) between the area of residence and realizing the need for plastic waste segregation, though not statistically significant, hints at potential regional differences in awareness.
Table 2.
Correlation between the area of residence and opinion regarding funding for waste management at Government Level.
Table 2.
Correlation between the area of residence and opinion regarding funding for waste management at Government Level.
| Who should fund plastic waste management at the central government level? | Location | ||
| Pearson Correlation | Who should fund plastic waste management at the central government level? | 1.000 | .384 |
| Location | .384 | 1.000 | |
| Sig. (1-tailed) | Who should fund plastic waste management at the central government level? | . | .000 |
| Location | .000 | . | |
| N | Who should fund plastic waste management at the central government level? | 97 | 97 |
| Location | 97 | 97 | |
The Table 5. presents the correlation between the area of residence (Rural, Urban, and Semi-Urban) and opinions regarding funding for waste management at the central government level. The Pearson Correlation coefficient is 0.384, indicating a positive correlation between these variables. The associated significance level (Sig.) is 0.000, suggesting a statistically significant relationship. This implies that as the area of residence changes, there is a corresponding change in opinions on who should fund plastic waste management at the central government level. The coefficients table further elaborates on the linear relationship. The unstandardized coefficient for the constant is 2.806, and for Location (Rural, Urban, Semi-Urban), it is 0.249. This suggests that, on average, there is a 0.249-unit increase in the dependent variable for each one-unit increase in the area of residence category. The collinearity statistics indicate that multicollinearity is not a significant concern, with the variance inflation factor (VIF) being 1.000 for Location. This suggests that the predictor variables are not highly correlated, supporting the reliability of the regression analysis.
Figure 4.
P-plot-Area of Residence VS Opinion regarding funding for waste management at Government Level.
Figure 4.
P-plot-Area of Residence VS Opinion regarding funding for waste management at Government Level.
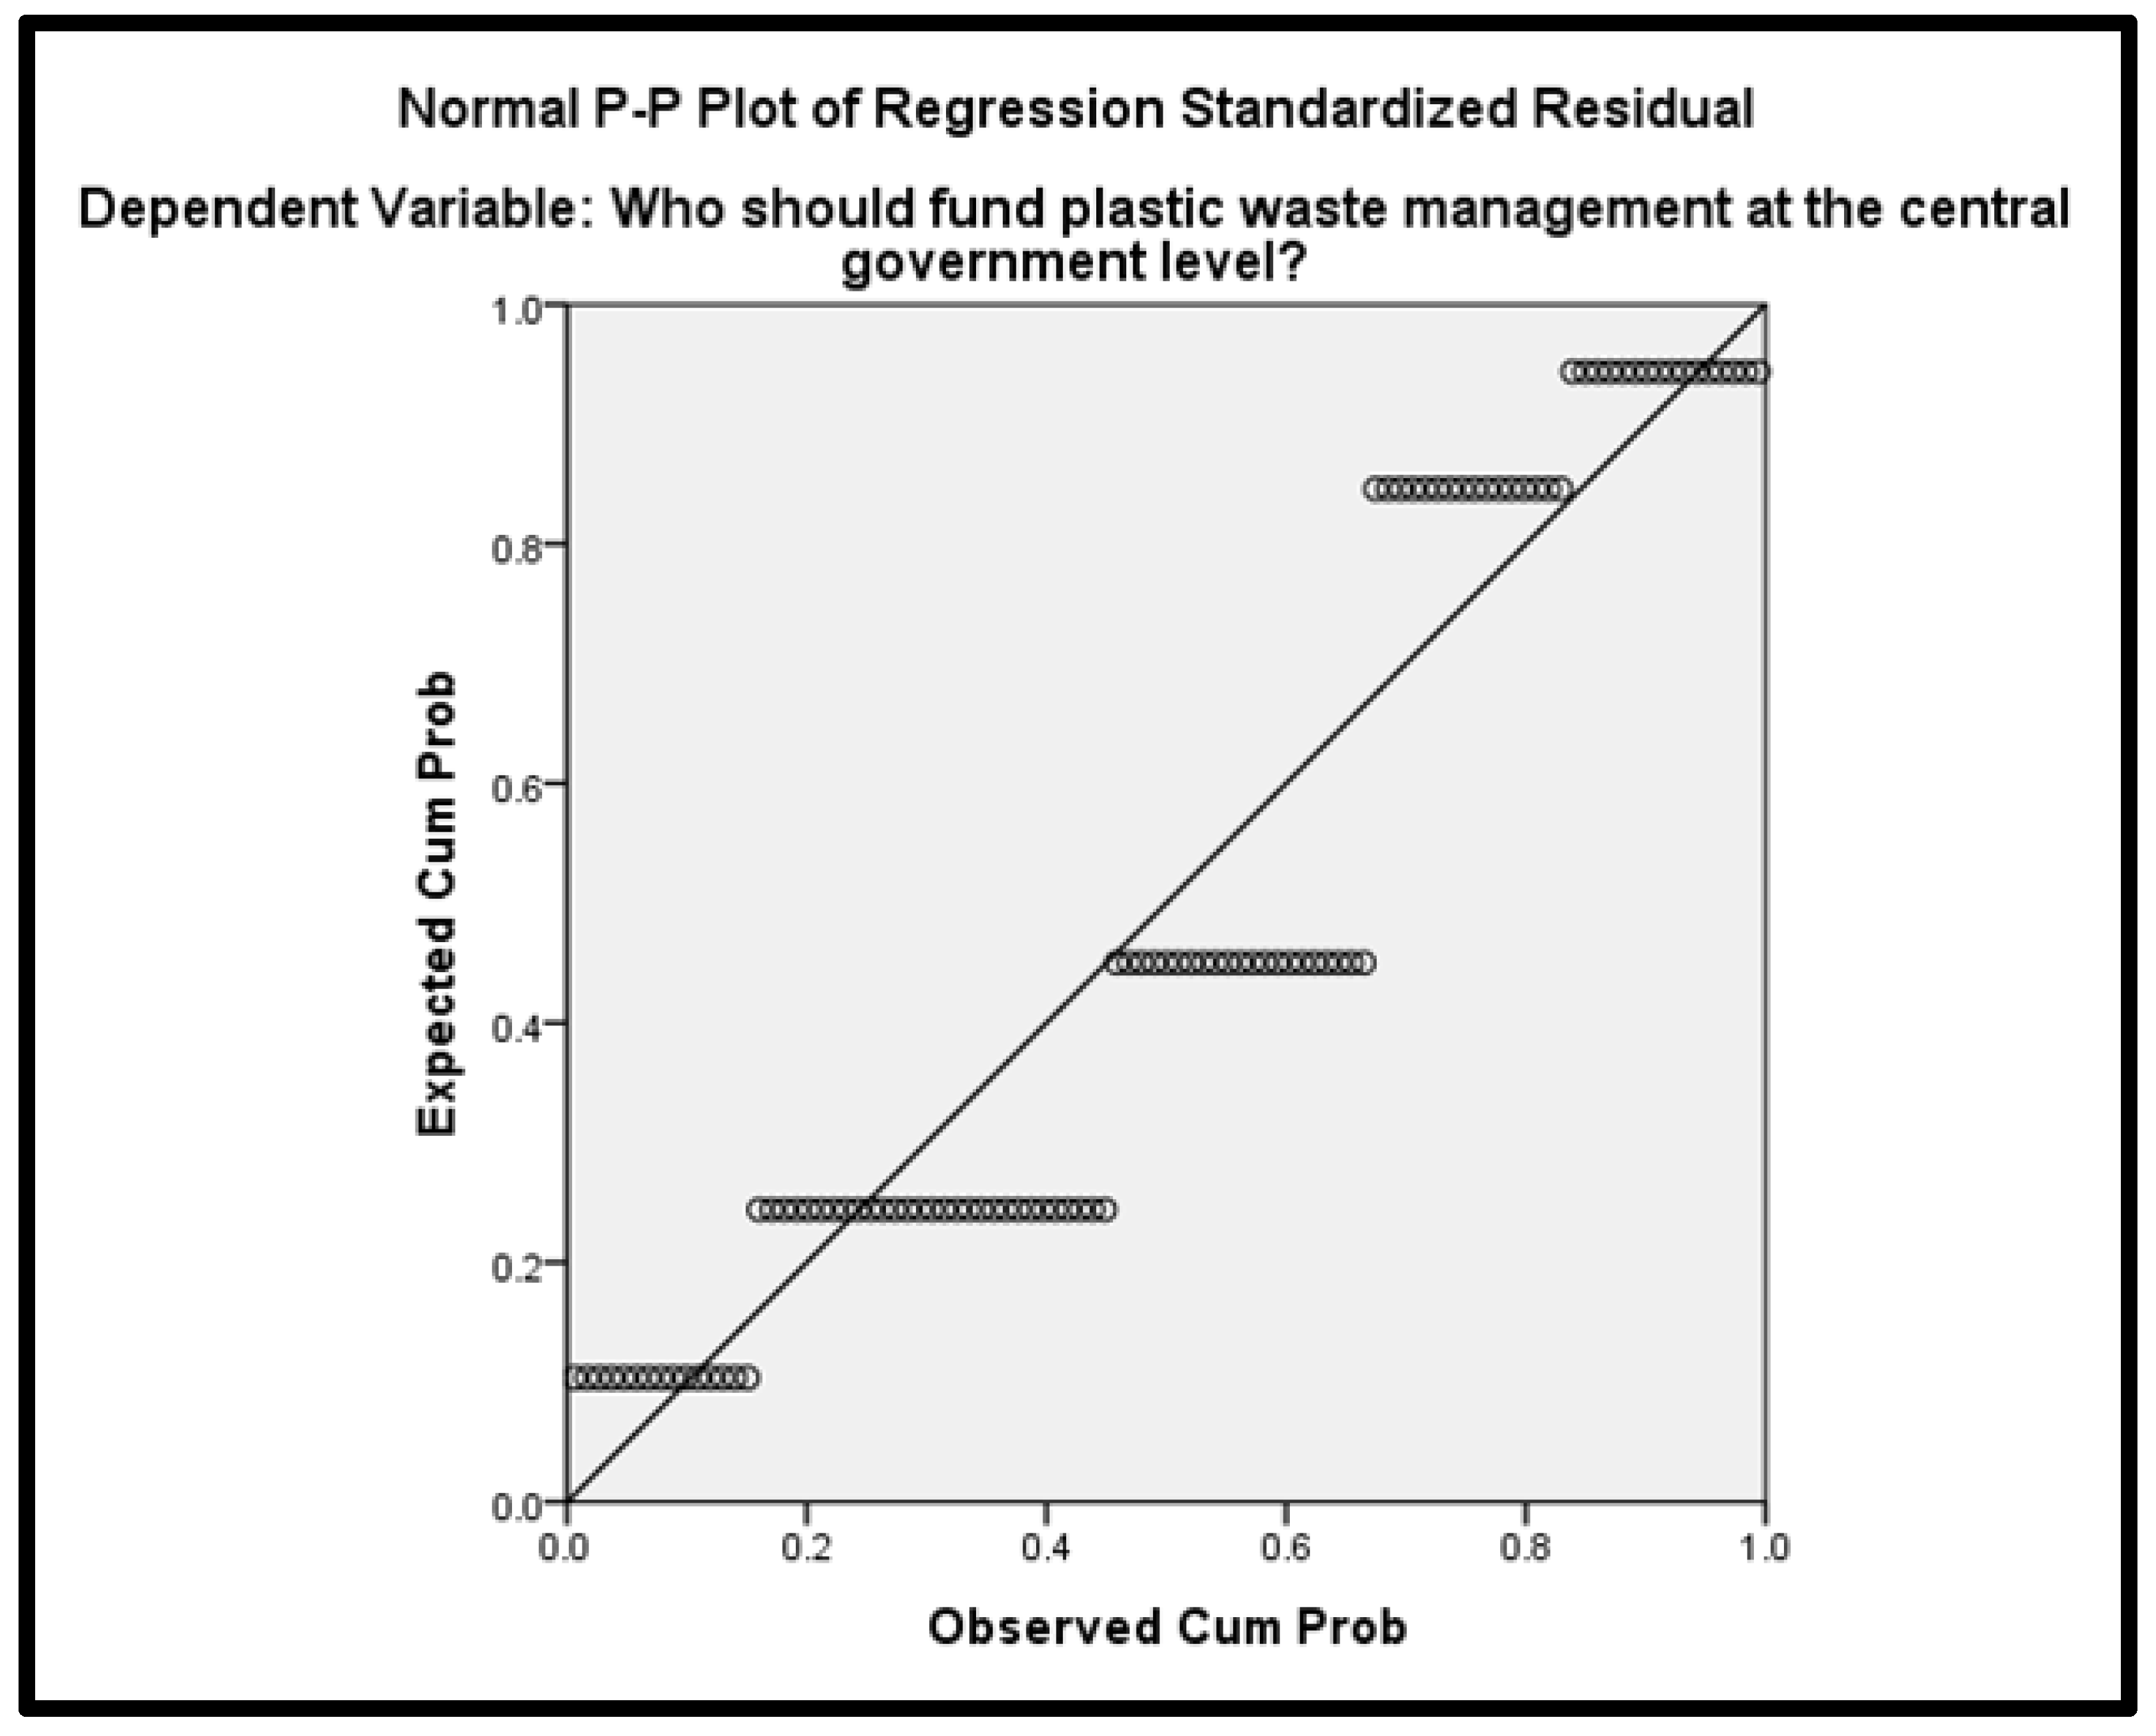
Table 3.
Correlation and Variance Analysis (ANOVA) Between area of residence and opinion regarding implementation of tax rates on plastic products.
Table 3.
Correlation and Variance Analysis (ANOVA) Between area of residence and opinion regarding implementation of tax rates on plastic products.
| How satisfied are you with the current plastic waste management system in your area? | Location | ||
| Pearson Correlation | How satisfied are you with the current plastic waste management system in your area? | 1.000 | -.190 |
| Location | -.190 | 1.000 | |
| Sig. (1-tailed) | How satisfied are you with the current plastic waste management system in your area? | . | .031 |
| Location | .031 | . | |
| N | How satisfied are you with the current plastic waste management system in your area? | 97 | 97 |
| Location | 97 | 97 | |
Table 4.
ANOVA test Between Area of Residence and Opinion regarding implementation of tax rates on plastic products.
Table 4.
ANOVA test Between Area of Residence and Opinion regarding implementation of tax rates on plastic products.
| Sum of Squares | df | Mean Square | F | Sig. | ||
|---|---|---|---|---|---|---|
| 1 | Regression | 1.440 | 1 | 1.440 | 3.553 | .062b |
| Residual | 38.498 | 95 | .405 | |||
| Total | 39.938 | 96 | ||||
a. Dependent Variable: How satisfied are you with the current plastic waste management system in your area? b. Predictors: (Constant), Location.
The presented table depicts the correlation between respondents' locations (rural, urban, and semi-urban) and their satisfaction with the current plastic waste management system. The Pearson correlation coefficient of -0.190 suggests a weak negative relationship between location and satisfaction, and this association is marginally significant with a p-value of 0.031. An analysis of variance (ANOVA) was conducted to further examine the impact of location on satisfaction. The ANOVA results indicate that the regression model, which includes location as a predictor, is marginally significant (p = 0.062). The coefficients table provides additional insights, showing that the constant value of 3.910 represents the estimated satisfaction level for respondents in the reference category, while the coefficient for location is -0.168, indicating a decrease in satisfaction for rural, urban, or semi-urban locations. The confidence interval for the location coefficient spans from -0.345 to 0.009, encompassing zero, which suggests that the effect of location on satisfaction is not precisely estimated. The collinearity statistics indicate no multicollinearity issues, with tolerance values of 1.000.
Figure 5.
P-Plot of Area of Residence VS Opinion regarding implementation of tax rates on plastic products.
Figure 5.
P-Plot of Area of Residence VS Opinion regarding implementation of tax rates on plastic products.
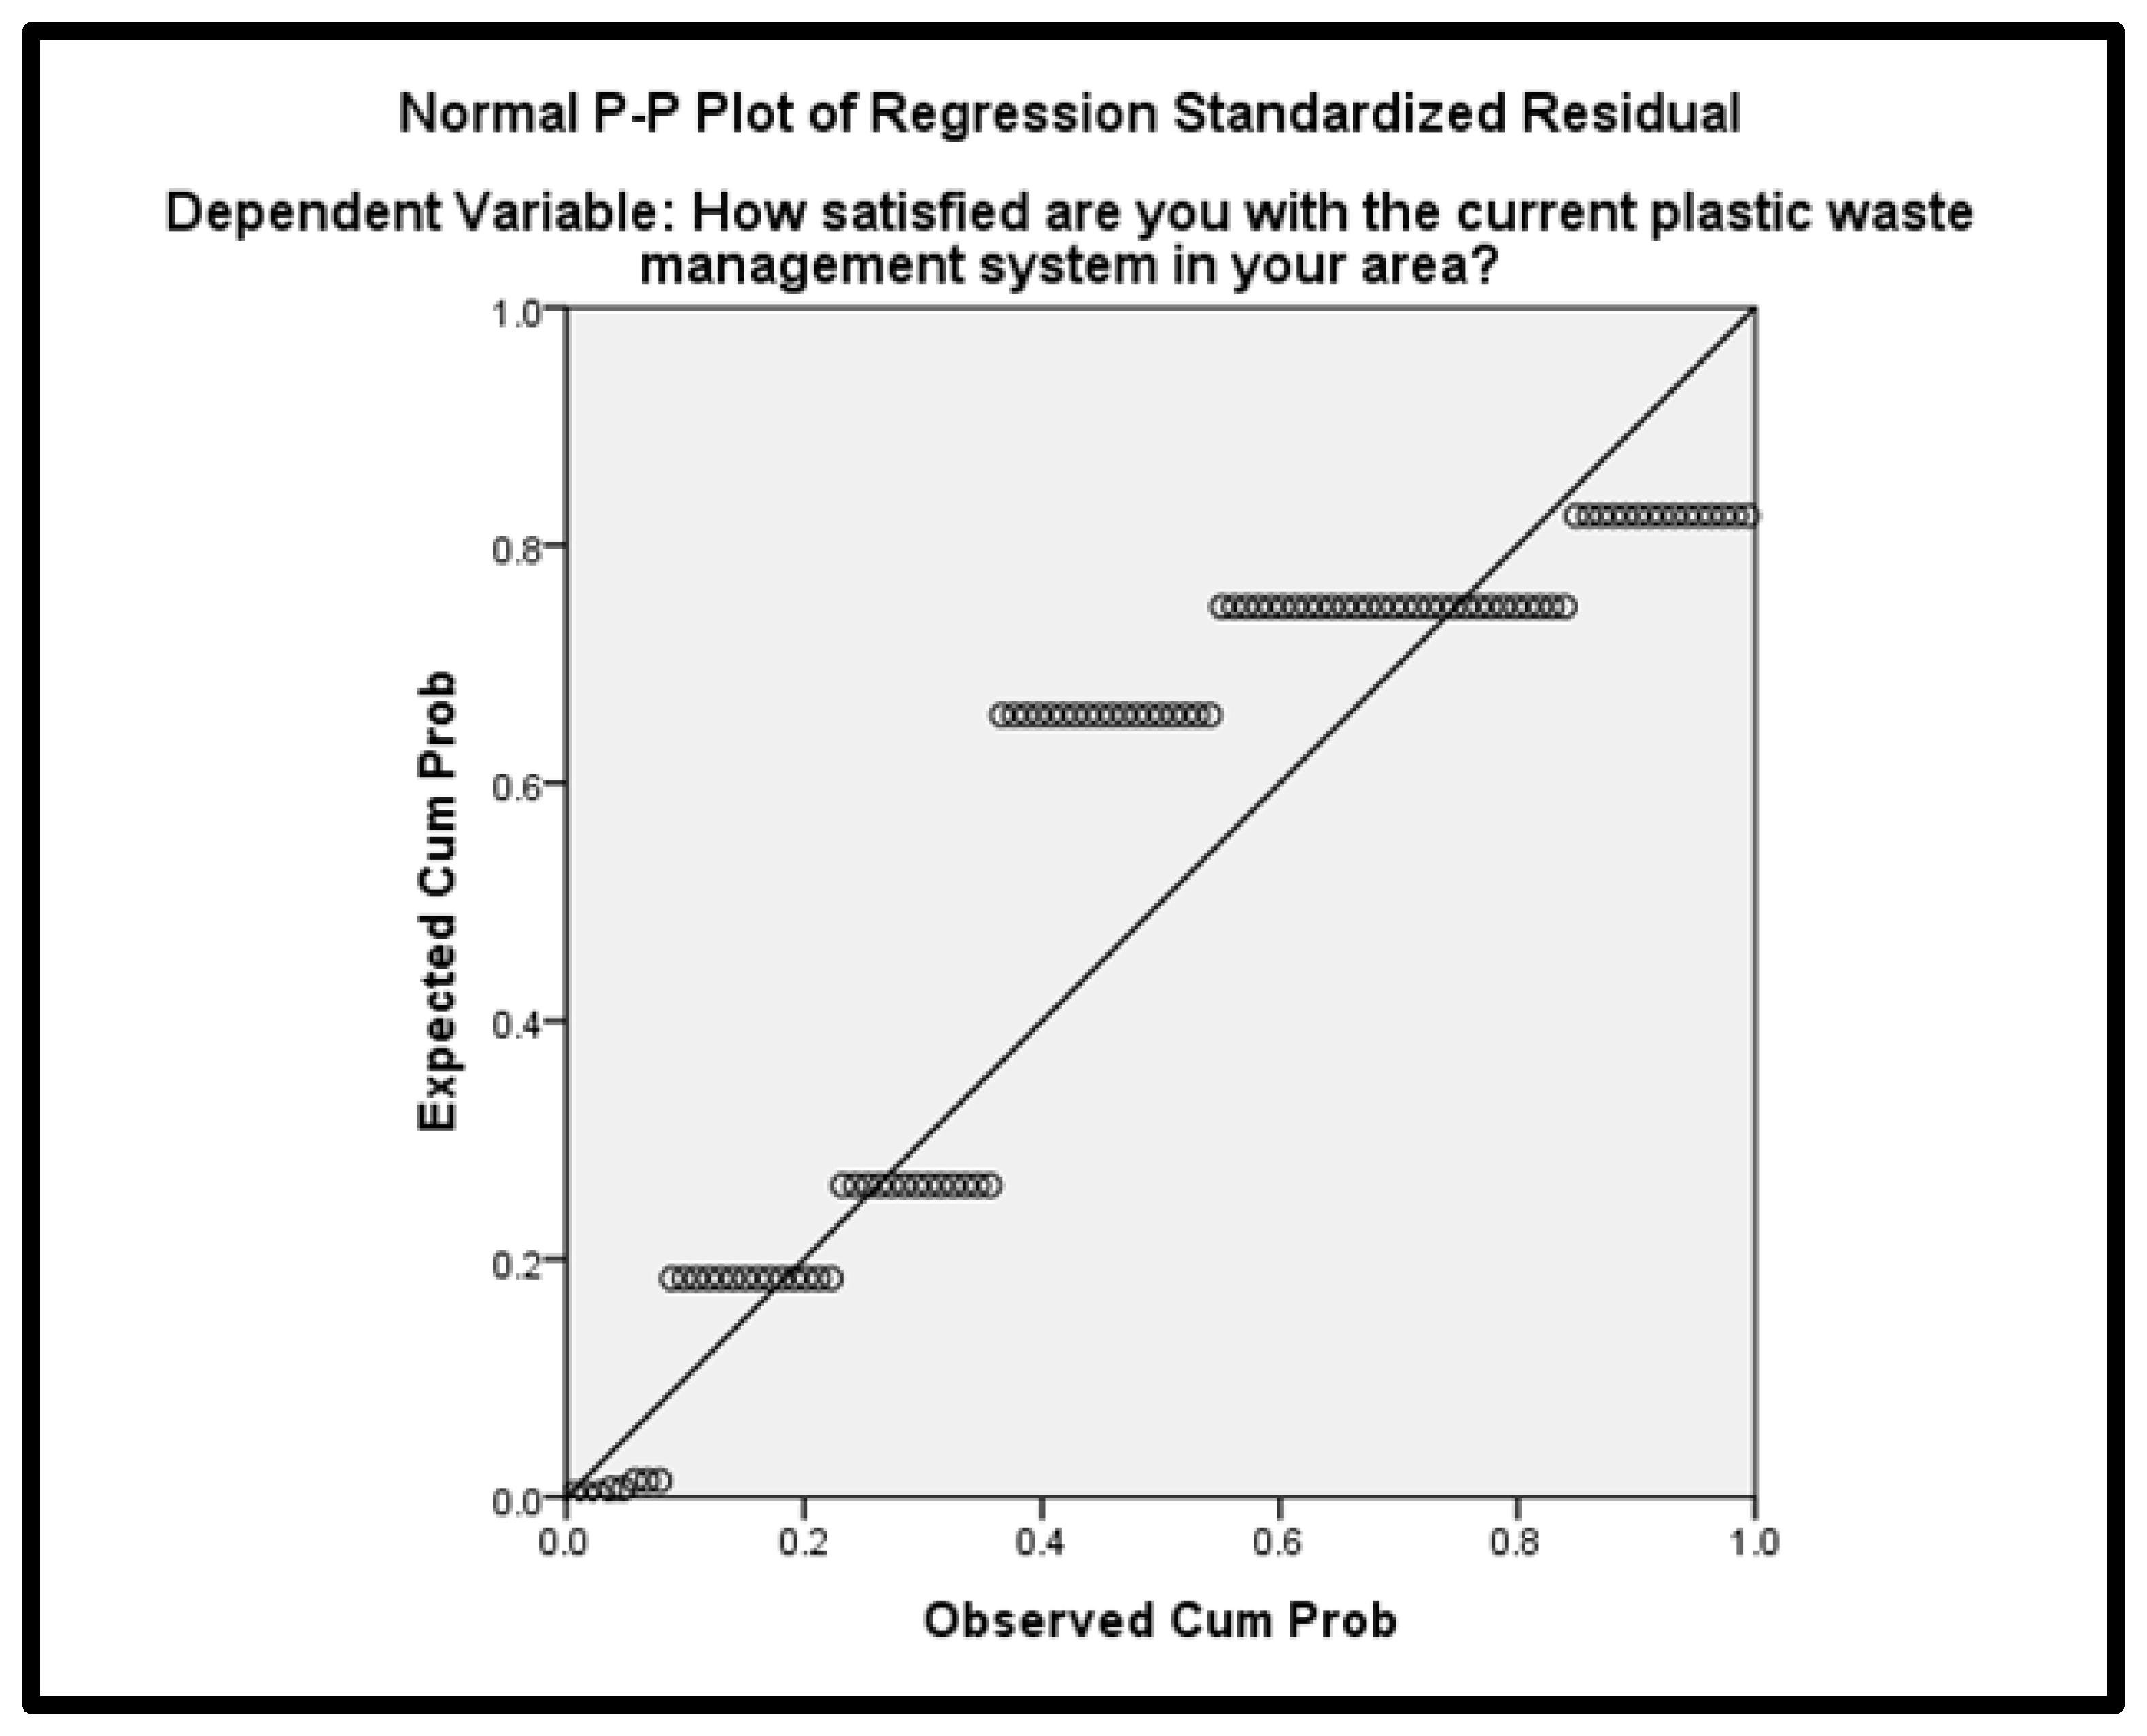
Table 5.
Correlation, Regression Model and Variance Analysis Between Area of Residence and Segregation of plastic wastes.
Table 5.
Correlation, Regression Model and Variance Analysis Between Area of Residence and Segregation of plastic wastes.
| Do you realize the need of plastic waste segregation from other wastes? | Location | ||
| Pearson Correlation | Do you realize the need of plastic waste segregation from other wastes? | 1.000 | -.128 |
| Location | -.128 | 1.000 | |
| Sig. (1-tailed) | Do you realize the need of plastic waste segregation from other wastes? | . | .106 |
| Location | .106 | . | |
| N | Do you realize the need of plastic waste segregation from other wastes? | 97 | 97 |
| Location | 97 | 97 | |
Table 6.
ANOVA Analysis Between Area of Residence and Opinion regarding Implementation of tax rates on plastic products.
Table 6.
ANOVA Analysis Between Area of Residence and Opinion regarding Implementation of tax rates on plastic products.
| Model | Sum of Squares | df | Mean Square | F | Sig. | |
| 1 | Regression | 1.382 | 1 | 1.382 | 1.582 | .212b |
| Residual | 82.989 | 95 | .874 | |||
| Total | 84.371 | 96 | ||||
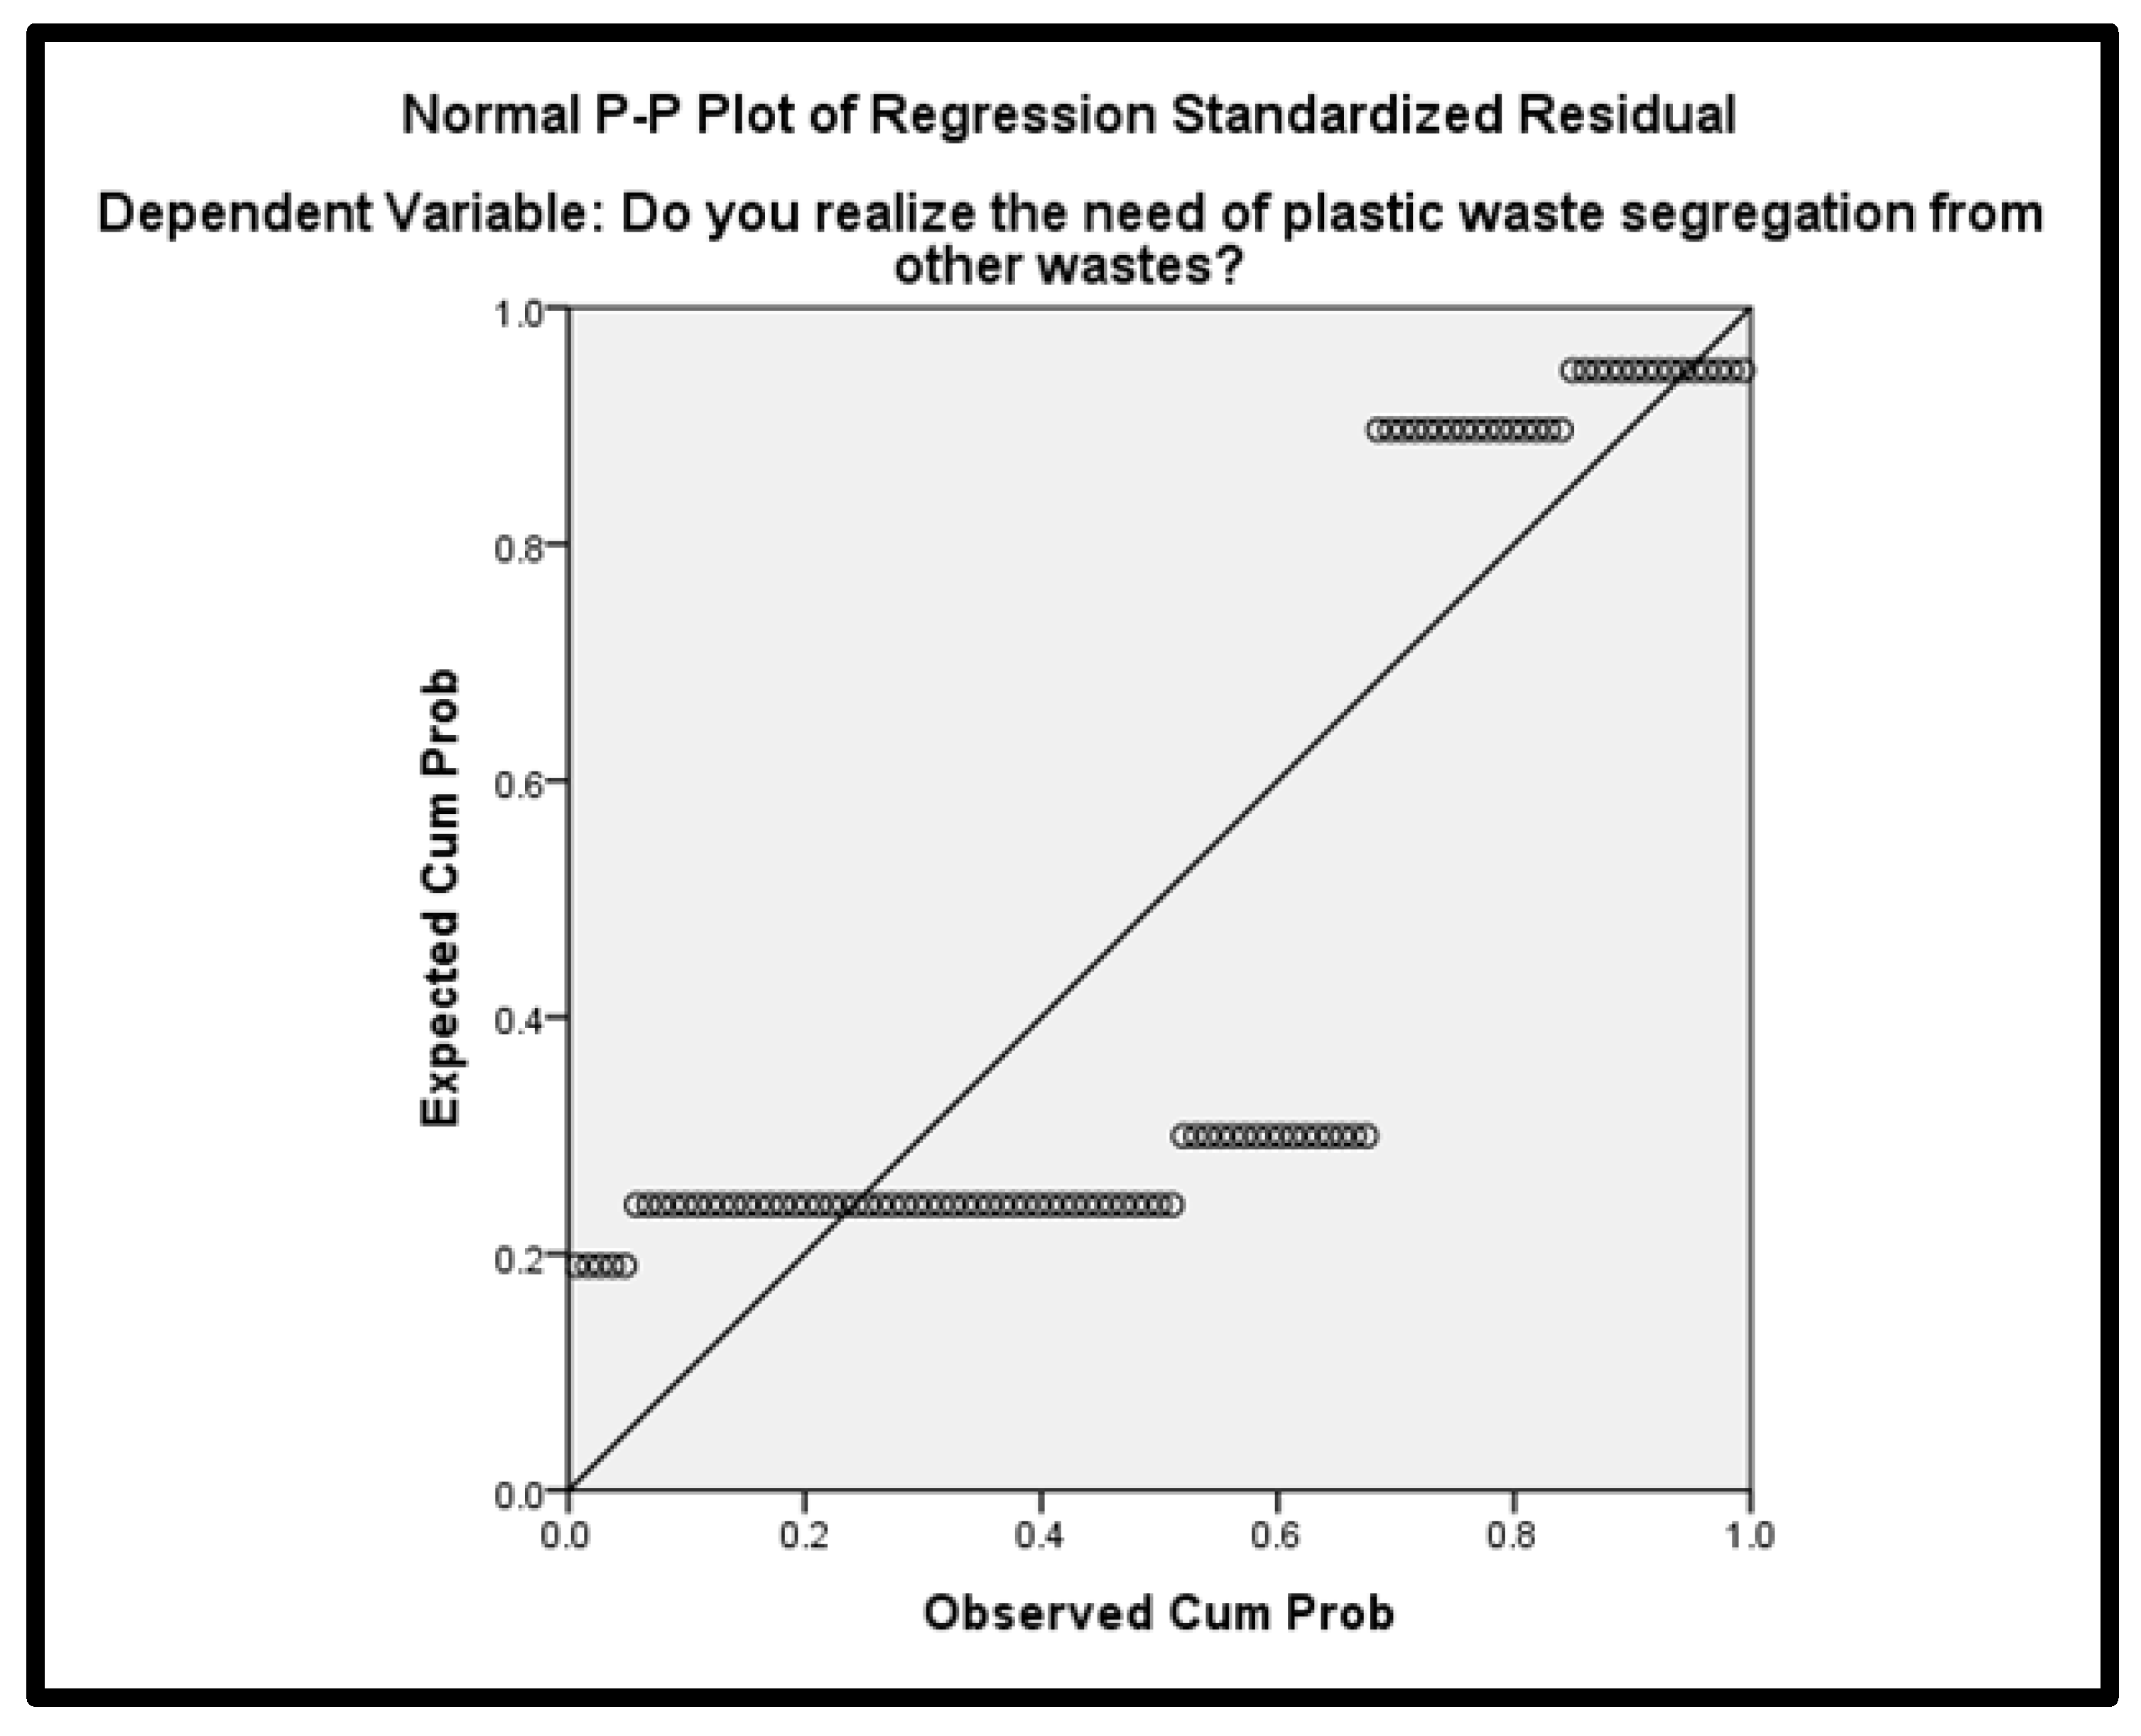
The presented table displays the correlation, regression model, and variance analysis between respondents' locations (rural, urban, and semi-urban) and their opinion regarding the need for plastic waste segregation from other wastes. The Pearson correlation coefficient of -0.128 indicates a weak negative relationship between location and the realization of the need for plastic waste segregation. However, this correlation is not statistically significant at the 0.05 significance level (p = 0.106). The regression model's overall fit is weak, as reflected in an R-square of 0.016, suggesting that only a small proportion of the variability in the need for plastic waste segregation can be explained by location. The analysis of variance (ANOVA) results indicates that the regression model is not statistically significant (p = 0.212), implying that the location variable does not significantly contribute to explaining the variation in respondents' opinions about the need for plastic waste segregation. Examining the coefficients, the constant value of 1.985 represents the estimated opinion level for respondents in the reference category (not specified). The coefficient for location is -0.165, indicating a decrease in the opinion about the need for plastic waste segregation for respondents in rural, urban, or semi-urban locations. The 95% confidence interval for the location coefficient spans from -0.425 to 0.095, indicating that the effect of location on the need for plastic waste segregation is not precisely estimated. The collinearity statistics show no multicollinearity issues, with a tolerance value of 1.000.
Figure 6.
P-plot of Area of Residence VS Opinion regarding plastic waste segregation.
In essence, this discussion elucidates the intricate web of challenges and opportunities in Bangladesh's plastic consumption landscape. As the nation grapples with the repercussions of plastic pollution, a nuanced understanding of regional dynamics, global policies, stakeholder perceptions, and household behaviors becomes imperative. The path forward involves collaborative efforts, informed decision-making, and a commitment to sustainable practices to address the multifaceted challenges posed by plastic consumption and forge a resilient and eco-friendly future.
Figure 7.
Distribution of renowned plastic industries Partex group (a) and RFL group (b) in Bangladesh.
Figure 7.
Distribution of renowned plastic industries Partex group (a) and RFL group (b) in Bangladesh.

The interpolation map 7 (a) illustrating the distribution of Partex group plastic industries highlights a distinct concentration in Dhaka, emphasizing the capital's pivotal role in hosting major industrial entities. The heightened density in Dhaka suggests that Partex group plastic industries strategically positions itself at the heart of economic and manufacturing activities in Bangladesh. This concentration signifies the accessibility to resources, skilled labor, and logistical advantages that Dhaka offers. The city's prominence as a business and economic hub makes it an ideal location for industries like Partex Group Plastic Industries to thrive, catering to both local and national demands for plastic products. On the other hand, the interpolation map 7 (b) depicting the concentration of RFL plastic industries reveals a notable clustering in both Dhaka and Chittagong, underscoring the widespread influence of this industry across two major economic hubs in Bangladesh. The high density in Dhaka, the capital city, signifies its strategic positioning at the forefront of industrial activities. Simultaneously, the presence of the RFL group plastic industries in Chittagong, a key port city, points toward the significance of maritime transportation and trade in facilitating the distribution of plastic products. This concentration aligns with the economic importance of Dhaka and Chittagong, showcasing how industrial activities, including plastic manufacturing, gravitate toward vital economic centers.
Key informant interviews (KIIs) revealed that Bangladesh’s plastic manufacturing sector struggles with sustainability due to inadequate waste management, low awareness of regulations, and inconsistent compliance. Experts emphasized the severe environmental and health impacts of plastic waste, including water contamination and toxic chemical exposure. Major challenges include weak recycling infrastructure, lack of coordination, and limited investment. To improve waste management, KIIs recommended awareness campaigns, regulatory improvements, and investment in recycling technologies and biodegradable alternatives.
Table 7.
Summary of the Interviews.
| Section | Key Points |
|---|---|
| Challenges of Plastic Waste Management |
Limited Infrastructure: Inadequate waste collection and sorting infrastructure leads to mixed waste streams and inefficiencies in recycling Public Awareness Gap: Lack of awareness about proper waste segregation and the environmental impact of plastic pollution Enforcement Hurdles: Weak enforcement of existing regulations on plastic use and waste management Data Deficiencies: Limited data on plastic waste lifecycle hinders effective policy interventions Overwhelmed Capacity: Volume of plastic waste generation outpaces existing capacity for collection, sorting, and recycling Limited Municipal Coverage: Insufficient waste collection coverage, especially in low-income communities Mixed Waste Streams: Minimal source segregation leads to mixed waste streams, reducing the quality and value of recyclable plastic. |
| Emerging Solutions |
NGO Initiatives: NGOs like BRAC and BELA are promoting source segregation and providing designated bins Informal Waste Pickers: NGOs advocate for formalizing informal waste pickers, providing training, safety equipment, and access to recycling channels. |
| Prospective Opportunities |
Rising Public Awareness: Localized NGO initiatives can be scaled for broader impact International Collaboration: Opportunities to collaborate with international waste management experts Circular Economy Potential: Shared vision among stakeholders for a circular economy approach Infrastructure Upgrade: Need for improved waste collection infrastructure and sorting practices. International Collaboration: Partnering with international waste management companies for knowledge and technology exchange. |
| Proposed Circular Economy Approaches |
Social Marketing and Community Outreach: Public awareness campaigns and community outreach programs. Incentivizing Source Segregation: Reward systems for households and businesses that segregate waste Micro-entrepreneurship and Informal Waste Pickers: Formalizing and empowering informal waste pickers Producer Responsibility and Deposit-Return Systems: EPR schemes and deposit-return systems for plastic packaging. Investment in Sorting Technology: Affordable sorting technologies for better recycling efficiency Promoting Sustainable Alternatives: Encouraging reusable shopping bags and biodegradable packaging materials. Source Segregation and Sorting: Improved waste collection and sorting facilities. Efficient Sorting Facilities: Investing in advanced sorting facilities for better recycling. |
| Public-Private Partnerships (PPPs) |
Importance: PPPs are essential for leveraging strengths of each sector to address challenges and create a sustainable future. Benefits: Resource sharing, combining expertise, long-term financial commitment, innovation, and improved service delivery Steps for Effective PPPs: Clear roles and responsibilities, transparency, accountability, and regular monitoring and evaluation. |
| Current State of Public Awareness |
Rising Awareness: Increasing awareness but significant gaps remain, especially in low-income communities Role of NGOs: NGOs are crucial in bridging knowledge gaps through workshops, outreach programs, and media campaigns. NGOs in Plastic Waste Management: Waste Concern, ActionAid Bangladesh, BRAC, ESDO, Save the Children Bangladesh, and Bangladesh Red Crescent Society are actively working on plastic waste management. |
| Transitioning to a Circular Economy |
Policy: Regulations encouraging eco-friendly product design and EPR schemes. Technology: Investment in recycling technologies Recycling Infrastructure: Robust collection and sorting systems Product Design: Focus on designing plastic products for recyclability and extended lifespan. Consumer Awareness: Education and awareness campaigns. Collaboration: Facilitating collaboration between government, industry, NGOs, and consumers. |
Overall, the findings emphasize the need for a multi-faceted approach incorporating stakeholder collaboration, circular economy principles, and policy enforcement to effectively tackle plastic pollution in Bangladesh. However, the study acknowledges limitations, such as potential biases in self-reported data.
Comparative Analysis of Policies and Initiative Taken Against Polyethene Bag Ban Among Eleven Countries in the World
The polyethylene bag ban in Bangladesh, implemented in 2002, initially received public support but faced challenges due to weak enforcement, inadequate recycling management, and economic barriers. Various global approaches to plastic bag regulation offer insights for improvement. Ireland's "bag tax" in 2002 led to a 90% reduction in usage by charging both manufacturers and consumers, while India's 2003 ban on thin plastic bags struggled due to weak enforcement and poor waste management. Tanzania successfully regulated single-use plastics (SUP) through continuous monitoring since 2005, whereas Kenya's stricter penalties, including fines and jail time introduced in 2007 and reinforced in 2017, led to a significant decline in SUP usage. In 2007, Canada encouraged a shift to reusable bags through financial charges and public awareness, while China’s 2008 ban initially reduced consumption but later suffered from monitoring challenges and illegal production. The United States imposed a tariff on plastic bags in 2014, significantly reducing their use by influencing consumer behavior. Similarly, Wales introduced a fee on SUPs in 2011, resulting in a 96% reduction, demonstrating the power of behavioral shifts. The European Union took a comprehensive approach in 2015 by expanding producer responsibility and introducing initiatives like water fountains to reduce SUP waste, while Israel’s 2016 tax on plastic bags gained public support and reduced consumption. To enhance the effectiveness of its plastic bag ban, Bangladesh should strengthen enforcement and monitoring to prevent illegal manufacturing, introduce a bag tax to discourage use economically, and implement public awareness campaigns to foster behavioral changes, similar to Canada and Wales. Additionally, stricter penalties, as seen in Kenya, could deter non-compliance, while improved waste management infrastructure would support long-term sustainability. Expanding producer responsibility, as practiced in the EU, could further ensure accountability from manufacturers. By adopting these strategies, Bangladesh can significantly improve the success of its plastic bag ban and promote sustainable alternatives.
Table 8.
Global plastic policy interventions and its impact.
| Sl. no | Country | Year of ban | Policy framework and products ban | Impact of ban | Reason |
|---|---|---|---|---|---|
| 1 | Bangladesh | 2002 | The Bangladesh Environment Conservation Act underwent revision in the year 2002. According to Rule 6ka of Clause-5 under Section-9, a prohibition has been implemented regarding the manufacturing and use of thin SUP (polythene shopping) bags. Penalties and punishments include the imposition of incarceration and monetary sanctions. | The first response from the general public was favorable. The increase in the use of polymer bags may be attributed to the reluctance of law enforcement agencies and the limited accessibility of affordable alternatives. | The absence of consistent enforcement and effective management of the disposal of waste materials in recycling facilities, incinerators, and the removal of such waste from landfills. |
| 2 |
Ireland |
2002 |
The implementation of a "bag tax" included the introduction of a charge on the sale of polyethylene bags at shops, with customers being responsible for paying the associated tax. The levy was only imposed on SUP bags, whereas reusable bags were granted exemption from the taxation. | The implementation of a charge resulted in a decrease of over 90% in the use of polyethylene bags during the first year. | A tax was imposed on the manufacturing of SUP bags, which was then passed on to customers who used them. Additionally, the tax rate was adjusted proportionally to reflect the rise in usage. |
| 3 |
India |
2003 |
In 2003, a legislative measure was enacted to prohibit the use of bags with a thickness of less than 20 μm. Subsequently, in 2019, the Ministry of Environment and Forests issued new regulations pertaining to the management and processing of plastic waste, superseding the previous laws. As part of these regulations, a partial ban on single-use plastic (SUP) goods was implemented. | Despite the restriction, India remains a significant contributor to the global waste generation. | The presence of irresponsible individual behavior, inadequate waste management systems, and insufficient enforcement of the prohibition are contributing factors to the issue at hand. |
| 4 |
Tanzania |
2005 |
A ban was first implemented on bags with a thickness below 100 μm, which was subsequently extended to include bags with a thickness below 30 μm. |
A ban has been determined to be an effective measure in regulating the use and production of single-use plastics (SUP). | The effectiveness is enhanced by the use of continuous monitoring. |
| 5 | Canada |
2007 and 2011 | In 2007, a prohibition was enacted on Polyethene bags with a thickness of less than 30 μm, accompanied by the implementation of a financial charge on bags over 30 μm in thickness, with the imposition of a continued financial charge for bags of even greater thickness. | The use of certain measures has shown to be very effective in mitigating the increasing number of single-use plastics (SUP) and promoting the utilization of reusable bags. | The attitudes of individuals towards the mitigation of plastic pollution have a significant role in the reduction of single-use plastics (SUP). |
| 6 | Kenya |
2007 |
In 2007, Kenya implemented a ban on single-use plastic (SUP) bags with a thickness below 30 μm, while also introducing a fee on SUP bags above 30 μm in thickness. In response to the perceived ineffectiveness of the ban and fee implemented in 2017, Kenya has enacted one of the most stringent prohibitions on Single-Use Plastics (SUP). This measure entails the imposition of both jail and fines for anybody found in violation of the regulation, specifically targeting the use of SUP bags with a thickness below 30 μm. | Effectively reduced consumption and production of SUP |
Imprisonment, financial penalties, and ongoing surveillance was significant. |
| 7 | China |
2008 |
Legislation has been enacted by The General Office of the State Council to enforce a prohibition on the provision of free single-use plastic (SUP) bags that have a thickness of less than 25 μm in shops, sales outlets, and supermarkets. Additionally, a charge has been introduced for bags that exceed 25 μm in thickness. However, certain exemptions apply in cases where these SUP bags are necessary for maintaining hygiene standards, such as the storage and handling of fresh food. | At first, there was a decrease in the use of single-use plastics (SUP), but subsequently, an upward trend in their usage became evident. | The prevalent presence of SUP bags in China may be attributed to a combination of inadequate supervision and illicit manufacturing practices. |
| 8 |
USA |
2007 | A levy of USD 0.05 has been charged on purchasers of polyethylene bags. | Based on a survey done in 2014, there was a decrease in the average weekly use of Polyethylene bags from 10 to 4. | |
| 9 |
Wales |
2011 |
The proposed legislation aims to impose a tariff on polyethylene bags. | There was a significant decrease of 96% in the occurrence of single-use plastics (SUP) subsequent to the implementation of the charge. | The study observed a favorable behavioral spillover effect among individuals in their attitudes and behaviors towards the tax, specifically in relation to the reduction in the use of single-use plastics (SUP). |
| 10 |
European Union |
2015 |
A legislative measure was enacted wherein an amendment was made to Directive 94/62/EC, specifically targeting single-use Polyethylene bags. | The implementation of the ban has shown efficacy in mitigating the generation and manufacturing of single-use plastic (SUP) trash. |
The expansion of legal obligations to include producers in the task of waste removal, as well as the implementation of programs such as the installation of complimentary clean drinking water fountains. |
| 11 | Israel |
2016 |
Introduce a levy on SUP bags |
The implementation of the ban resulted in a significant decrease in the use of single-use plastics (SUP), with over 70% of the general population expressing their support for this measure. | One contributing factor to the increased use of ecologically friendly reusable bags was the implementation of bag charges and corresponding legislation. |
CONCLUSION
The aim of this study was to identify the political and economic barriers for implementing plastic ban law 2002 in Bangladesh. The findings of this study indicated the use of polythene bags could be attributed to the limited availability of alternative materials and their widespread accessibility. The elevated cost of other options is also a contributing factor. The affordability and widespread accessibility of polyethylene bags contribute to their popularity. The implementation of a substantial tax on single-use plastic (SUP) bags from the outset of manufacturing, along with the promotion of innovative strategies and investments in the development of polyethylene alternatives, as well as efforts to induce changes in consumer behavior, may lead to the eventual success of a ban on polyethylene bags. The practice of individuals bringing their own polythene bags is a widely used method for minimizing the utilization of polythene materials. The objective is to enhance end user knowledge on the negative consequences of plastic use via media advertisements and initiatives conducted by governmental and non-governmental organizations. The implementation of a reward-based plastic collecting program is proposed as a means to incentivize individuals to refrain from indiscriminately disposing of plastic garbage in various locations. The proposed incentives include preferential tax treatments, simplified access to bank loans, and duty-free imports of equipment and machinery for industries and enterprises involved in the creation of biodegradable alternatives to plastics. In an integrated fashion, these findings culminate in recommendations for strengthening regional waste management, aligning local policies with global initiatives, tailoring educational programs based on demographic insights, and implementing Extended Producer Responsibility (EPR) more rigorously. However, it is crucial to acknowledge the study's limitations, including potential biases in self-reported survey data and the relatively short duration of the household-based analysis. As Bangladesh grapples with the environmental and health repercussions of plastic consumption, the insights from this study provide a robust foundation for informed decision-making, emphasizing the urgency of collaborative efforts between government bodies, industries, and civil society. The path forward necessitates a harmonized approach, integrating policy reforms, awareness campaigns, and sustainable practices to navigate the challenges posed by plastic pollution and forge a more environmentally resilient future.
Supplementary Material
The following supporting information can be downloaded at the website of this paper posted on Preprints.org.
ACKNOWLEDGEMENT
The experiment was conducted in Dhaka, Bangladesh, led by the first author and supported by the Centre for Higher Studies and Research of Bangladesh University of Professionals.
References
- Angriani, P.; Muhaimin, M.; Hastuti, K. P.; Adyatma, S.; Saputra, A. N., (2021). Ban on plastic bags usage: consumer perception of single-use plastic bags in traditional market. In 2nd International Conference on Social Sciences Education (ICSSE 2020), 226-232. Atlantis Press(6 pages).
- Banu, N., (2019). Single-use plastic ban and its public health impacts: a narrative review. Ann. SBV, 8(1), 14.https://journals.sbvu.ac.in/index.php/ASBV/article/view/305. (2 pages).
- Barnes, D. K., (2002). Invasions by marine life on plastic debris. Nature, 416(6883), 808-809. https://www.nature.com/articles/416808a. (1 page). [CrossRef]
- Barrowclough, D.; Birkbeck, C. D., (2022). Transforming the global plastics economy: the role of economic policies in the global governance of plastic pollution. Soc. Sci., 11(1), 26.(2 pages).https://www.mdpi.com/2076-0760/11/1/26. [CrossRef]
- Bharadwaj, B.; Baland, J. M.; Nepal, M., (2020). What makes a ban on plastic bags effective? The case of Nepal. Environ. Dev. Econ., 25(2), 95-114. (20 pages). https://www.cambridge.org/core/journals/environment-and-development-economics/article/what-makes-a-ban-on-plastic-bags-effective-the-case-of-nepal/. [CrossRef]
- Debnath, B.; Bari, A. M.; Ali, S. M.; Ahmed, T.; Ali, I.; Kabir, G., (2023). Modelling the barriers to sustainable waste management in the plastic-manufacturing industry: an emerging economy perspective. Sustain. Anal. Model., 3, 100017. (2 pages). https://www.sciencedirect.com/science/article/pii/S2772731023000035. [CrossRef]
- Delangiz, N.; Aliyar, S.; Pashapoor, N.; Nobaharan, K.; Asgari Lajayer, B.; RodríguezCouto, S., (2022). Can polymer-degrading microorganisms solve the bottleneck of plastics’ environmental challenges? Chemosphere, 294, 133709.(1 page). https://www.sciencedirect.com/science/article/abs/pii/S0045653522009143. [CrossRef]
- Frias, J. P.; Nash, R., (2019). Microplastics: finding a consensus on the definition. Mar. Pollut. Bull., 138, 145-147. (2 pages). https://www.sciencedirect.com/science/article/abs/pii/S0025326X19300752. [CrossRef]
- Ganeshkumar, B., Gobinath, R., & Mahendran, N. (2009, January). GIS Based Ecomapping of Industries A Potential Tool for Environmental Performance Analysis and Optimization. In 2009 International Conference on Computer Engineering and Technology (Vol. 2, pp. 569-573). IEEE.(4 pages).
- Hoornweg, D., & Bhada-Tata, P. (2012). What a waste: a global review of solid waste management.
- Islam, M. S.; Haque Proshad, R.; Kormoker, T.; Rahman, M. M.; Mithu, M. M. R., (2018). Toxic effects of plastic on human health and environment: a consequences of health risk assessment in Bangladesh. Int. J. Health, 6(1), 1-5..(4 pages). https://www.ijh.com/articles/10.5923.j.health.20180601.01. [CrossRef]
- Kadušić, A.; Smajić, S.; Pavić, D.; Stojanović, V., (2021). Application of GIS in spatial analysis of industry concentration: the case study of Tešanj municipality (Bosnia and Herzegovina). Glas. Srp. Geogr. Drustva, 101(2), 23-42.(9 pages). https://www.doiserbia.nb.rs/Article.aspx?ID=0350-7599210223K. [CrossRef]
- Karayılan, S.; Yılmaz, Ö.; Uysal, Ç.; Naneci, S., (2021). Prospective evaluation of circular economy practices within plastic packaging value chain through optimization of life cycle impacts and circularity. Resour. Conserv. Recycl., 173, 105691.(1 page). https://www.sciencedirect.com/science/article/pii/S0921344921001317. [CrossRef]
- Mai, L.; Bao, L. J.; Wong, C. S.; Zeng, E. Y., (2024). Microplastics in the terrestrial environment. In Microplastic contamination in aquatic environments, 229-247. Elsevier.(19 pages). https://www.elsevier.com/books/microplastic-contamination-in-aquatic-environments/.
- Majumder, T. A.; Nur, S. S.; Haque, A. A., (2020). Study on characteristics of small-scale plastic industries in Dhaka North and South City Corporations. J. Bangladesh Inst. Plann., 2075, 9363.https://bip.org.(4 pages). [CrossRef]
- bd/admin/uploads/bip-publication/.
- Molloy, S.; Medeiros, A. S.; Walker, T. R.; Saunders, S. J., (2022). Public perceptions of legislative action to reduce plastic pollution: a case study of Atlantic Canada. Sustainability, 14(3), 1852.https://www.mdpi.com/2071-1050/14/3/1852. (1 page). [CrossRef]
- Mugobo, V. V.; Ntuli, H.; Iwu, C. G., (2022). Consumer perceptions of the use of nondegradable plastic packaging and environmental pollution: a review of theories and empirical literature. J. Risk Financ. Manag., 15(6), 244.(1 page). https://www.mdpi.com/1911-8074/15/6/244. [CrossRef]
- Muposhi, A.; Mpinganjira, M.; Wait, M., (2022). Considerations, benefits and unintended consequences of banning plastic shopping bags for environmental sustainability: a systematic literature review. Waste Manag. Res., 40(3), 248-261. https://journals.sagepub.com/doi/10.1177/0734242X211054266(1 page). [CrossRef]
- Mwanza, B. G.; Mbohwa, C., (2017). Major obstacles to sustainability in the plastic industry. Procedia Manuf., 8, 121-128.(7 pages). https://www.sciencedirect.com/science/article/pii/S2351978917301539. [CrossRef]
- Nadiruzzaman, M.; Shewly, H. J.; Esha, A. A., (2022). Dhaka sitting on a plastic bomb: issues and concerns around waste governance, water quality, and public health. Earth, 3(1), 18-30. https://www.mdpi.com/2673-4060/3/1/18. (13 pages). [CrossRef]
- Naher, K.; Ebeh, D. N., (2024). Women Entrepreneurs as Agents of Change: A Comparative Analysis of Social Entrepreneurship Processes in Emerging Markets: A Brief Review. SSRN. (1 page).
- Ogutu, M. O., Akor, J., Mulindwa, M. S., Heshima, O., & Nsengimana, C. (2023). Implementing circular economy and sustainability policies in Rwanda: Experiences of Rwandan manufacturers with the plastic ban policy. Frontiers in Sustainability, 4, 1092107.(1 page). [CrossRef]
- Ogushi, Y., & Kandlikar, M. (2007). Assessing extended producer responsibility laws in Japan. Environmental Science and Technology, 41(13), 4502-4508. (6 pages). [CrossRef]
- Paletta, A., Leal Filho, W., Balogun, A. L., Foschi, E., & Bonoli, A. (2019). Barriers and challenges to plastics valorisation in the context of a circular economy: Case studies from Italy. Journal of Cleaner Production, 241, 118149.(1 page). [CrossRef]
- Staples, C. A.; Peterson, D. R.; Parkerton, T. F.; Adams, W. J., (1997). The environmental fate of phthalate esters: a literature review. Chemosphere, 35(4), 667-749.(82 pages). https://www.sciencedirect.com/science/article/abs/pii/S0045653597001305. [CrossRef]
- Surendran, U.; Jayakumar, M.; Raja, P.; Gopinath, G.; Chellam, P. V., (2023). Microplastics in terrestrial ecosystem: sources and migration in soil environment. Chemosphere, 318, 137946. https://www.sciencedirect.com/science/article/abs/pii/S0045653523006547. (1 page). [CrossRef]
- Swedish Environmental Protection Agency. (2019). The Swedish Waste Management System. Retrieved from Swedish EPA website.
- Swedish Environmental Protection Agency. (2019). The Swedish Waste Management System. Retrieved from Swedish EPA website.
- UNEP-WCMC; IUCN, (2018). Protected planet report, 70. https://www.protectedplanet.net/en/resources/protected-planet-report-2018.
- United Nations Environment Programme (UNEP). (2017). Clean Seas Campaign. Retrieved from UNEP website. (6 pages).
- World Bank. (2021). Towards a Multisectoral Action Plan for Sustainable Plastic Management in Bangladesh. 23-26. https://thedocs.worldbank.org/en/doc/42712a1018d536bb86c35018b9600c53-0310062021/towards-a-multisectoral-action-plan-for-sustainable-plastic-management-in-bangladesh#main. (4 pages).
Disclaimer/Publisher’s Note: The statements, opinions and data contained in all publications are solely those of the individual author(s) and contributor(s) and not of MDPI and/or the editor(s). MDPI and/or the editor(s) disclaim responsibility for any injury to people or property resulting from any ideas, methods, instructions or products referred to in the content. |
© 2025 by the authors. Licensee MDPI, Basel, Switzerland. This article is an open access article distributed under the terms and conditions of the Creative Commons Attribution (CC BY) license (http://creativecommons.org/licenses/by/4.0/).
Copyright: This open access article is published under a Creative Commons CC BY 4.0 license, which permit the free download, distribution, and reuse, provided that the author and preprint are cited in any reuse.


