Submitted:
09 April 2025
Posted:
09 April 2025
You are already at the latest version
Abstract
With the increasing prominence of "obesogenic environments", obesity has emerged as a major challenge to human health. Notably, humans and animals have different responses to the obesogenic environment created by affluent societies, and the susceptibility of both humans and animals to diet-induced obesity appears to be a stable phenotype. Biomarkers and specific genes, which influence body composition through long-term exposure to obesogenic environments, have been identified as higher risk indicators of individuals future weight gain. By utilizing a broad range of pre-exposure characteristics as predictive factors, we can better quantify the heterogeneity of obesity, offering novel perspectives for personalized clinical prevention and treatment.
Keywords:
obesity
; obesity heterogeneity
; predictive factors
1. Introduction
The escalating global prevalence of obesity, coupled with a rise in metabolic disorders, represents one of the most significant threats to human health in the 21st century [1]. By 2022, one in eight people worldwide was classified as obese [2]. Alarmingly, projections for the United States indicate that one in two adults will be obese by 2030 [3]. Besides, obesity is associated with numerous detrimental health outcomes, such as cancer, type 2 diabetes, and cardiovascular diseases, positioning it as a major contributor to decreased life expectancy [4]. The Global Burden of Disease 2019 study projects a 42.7% increase in global obesity-related mortality between 2020 and 2030 [5]. To reduce the health, economic, and societal burdens of obesity, it is crucial to further investigate the environmental and biological factors that regulate weight and how their disruption contributes to obesity. At its core, obesity is caused by an imbalance between energy intake (EI) and energy expenditure. Mechanistic models of obesity, informed by experimental data, can help refine our understanding of these contributing factors and aid in developing more effective prevention and treatment strategies [6]. However, an important question remains: why do individual differences in susceptibility to obesity persist, even in today's obesogenic environment?
Obesity is undoubtedly influenced by both genetic and environmental factors [7]. It is estimated that body mass index (BMI) is highly heritable, with genetics accounting for 40-70% of variations in BMI [8,9]. Yet, the rapid increase in obesity prevalence over the past four decades cannot be attributed to genetic underpinnings [10]. With shifts in the food environment, increased consumption of energy-dense foods and lifestyle changes are primary drivers behind the rising prevalence of obesity in recent decades [11,12]. Prolonged exposure to high-fat diets leads to obesity in most species. While obesogenic environments might suggest that all individuals would eventually become obese, notable variability exists even among obese populations. In animal studies, genetically similar inbred mice fed the same high-fat diet under identical conditions still display varying degrees of obesity. This suggests that significant BMI variability remains within the same species, likely driven by genetic and metabolic factors [13]. In the 1980s, in a controlled overfeeding study, six young men gained an average of 6 kg over six weeks, with notable individual differences in weight and fat gain. The study found that metabolic rate increases during overfeeding were primarily linked to body size and tissue gain, rather than adaptive thermogenesis. This suggests that individual susceptibility to weight gain may stem from inherent differences in energy metabolism and fat storage efficiency [14]. However, research exploring the underlying obesity heterogeneity remains limited. Identifying high-risk populations and developing early interventions are critical for addressing the obesity epidemic. Given that both humans and animal models exhibit obesity heterogeneity, often predicted by early-life characteristics [15], this review examines the heterogeneity of obesity in both human and animal studies.
2. Regulation of Body Weight
Two principal systems in the brain regulate body weight: the energy homeostasis system and the cognitive-emotional control system [16]. The homeostatic regulation relies on neural signals originating from adipose tissue, the endocrine system, the nervous system, and the gastrointestinal system, which are integrated by the central nervous system [17]. Subsequently, the central nervous system relays signals to peripheral organs to control EI and expenditure, thereby maintaining energy homeostasis (Figure 1). The gastrointestinal tract, liver, pancreas, and adipose tissue secrete a variety of hormones that regulate food intake. These hormones act on the brain, particularly the hypothalamus and the hindbrain, to modulate appetite and satiety [18,19]. Notably, gut hormones such as cholecystokinin, peptide YY, glucagon-like peptide 1, glucose-dependent insulinotropic polypeptide, oxyntomodulin,ghrelin and insulin-like factor 5 et al. serve as short-term regulators [20,21]. In contrast, hormones associated with adipose storage, such as leptin, insulin, and amylin, function as long-term regulators [7,22]. Communication between the periphery and the brain occurs through the circulation, which reaches the brain via the hypothalamus or brainstem [23], or through afferent fibers of the vagus nerve that project to structures such as the nucleus tractus solitarius in the hindbrain [17]. The hypothalamic melanocortinergic system serves as a central hub in the regulation of homeostasis. Within this system, two key populations of neurons located in the hypothalamus—the neuropeptide Y/Agouti-related peptide (NPY/AgRP) neurons and the Pro-opiomelanocortin/Cocaine amphetamine-regulated transcript (POMC/CART) neurons—have opposing roles in controlling food intake and energy expenditure [24]. Activation of NPY/AgRP neurons inhibits satiety and drives food consumption, whereas activation of POMC/CART neurons induces satiety, reduces intake, and enhances energy expenditure [25,26]. In addition, cognitive-emotional control is regulated by higher brain centers and is influenced by environmental stimuli (e.g. visual, olfactory, and gustatory cues), past experiences, and emotional triggers [27,28]. This system works in concert with the energy homeostasis system to regulate body weight [16].
3. Risk Factors for Obesity
Obesity results from a complex interplay between genetic predispositions and environmental factors. While monogenic obesity, caused by mutations in individual genes, is rare—accounting for less than 1% of cases—most instances of obesity stem from the interaction of multiple genetic and environmental influences [29,30]. These factors, which vary across individuals and change over time, primarily contribute to obesity by disrupting the balance between EI and expenditure. Furthermore, gene-environment interactions help explain the variability in how individuals respond to obesogenic environments (Figure 2).
3.1. Genetic Factors
Genetics plays a critical role in obesity, with heritability estimates suggesting that around 40%–70% of inter-individual variability in BMI can be attributed to genetic factors [31]. Obesity can be divided into two types based on genetic mutations: monogenic and polygenic obesity. Monogenic obesity results from mutations in specific genes, such as the MC4R gene, which is the most common gene linked to single-gene obesity [32]. It is estimated that 11.3% of obese participants (BMI ≥ 30) carried at least one coding variant in MC4R coding region [33]. Recent population-based studies have identified rare mutations in the BSN and APBA1 genes that are strongly associated with obesity risk, and they have a much greater impact than the MC4R gene [34]. Several other genes, including LEPR, LEP, POMC, and SIM1, have also been implicated in obesity through various mechanisms [35]. Polygenic obesity, the most common form of obesity, results from the combined influence of many gene variants, with each variant contributing a small effect. To date, over 1,000 genetic loci have been identified as associated with BMI and common polygenic obesity [36]. Genome-wide association studies have been instrumental in identifying susceptibility genes for polygenic obesity. Among the most significant findings is the single-nucleotide polymorphism in the first intron of the FTO gene, which has the strongest statistical correlation with obesity [37]. Despite identifying many loci, these genetic signals account for only 6% of the variation in BMI, indicating that genetic predisposition alone cannot explain obesity [38].
3.2. Environmental Factors
Environmental factors have played an increasingly prominent role in the rising prevalence of obesity. Over the past six decades, advances in food production, transportation, and technology have made calorie-dense foods more accessible, while also reducing opportunities for physical activity (PA) [39,40,41,42,43]. These changes provided a modern "obesogenic" environment which contributed to an imbalance between EI and energy expenditure, ultimately resulting in a widespread weight gain and obesity [44,45]. Furthermore, environmental factors can influence obesity through epigenetic mechanisms (BOX 1). Studies have shown that diet and exercise can induce epigenetic changes, affecting gene expression and altering an individual's metabolic and physiological state [46,47]. Additionally, exposure to endocrine-disrupting chemicals, such as certain industrial solvents, plastics, and pesticides, has been linked to the development of obesity by interfering with hormone receptors and disrupting hormonal signaling pathways [48].
Obesity arises from a combination of genetic and environmental factors. Apart from genetic predispositions play a significant role, environmental influences (especially those related to diet, lifestyle, and exposure to certain chemicals) can also significantly impact an individual's risk of becoming obese. Environmental factors may influence gene expression through epigenetic modifications (e.g., DNA methylation, histone acetylation, and microRNA changes), without modifications in the DNA nucleotide sequence, contributing to inter-individual variability [49]. As genetic and environmental factors interact, they contribute to the variability in obesity seen across populations.
BOX1
Environmental factors induce epigenetic modifications linked to DNA methylation, histone modifications, non-coding RNA regulation, and chromatin remodeling. A study explored the effects of high-fat diet (HFD) feeding on epigenetic alterations in the hypothalamus. The results from mice showed that dysregulation in DNA methylation and histone modification was most prominent in those fed an HFD for one month, compared to those fed for three or six months. However, the impact of HFD on chromatin remodeling within hypothalamic cells varied [50]. In a separate study, researchers analyzed genome-wide DNA methylation in blood samples collected from participants before and after a randomized controlled trial involving a low-carbohydrate, low-fat diet (LFD), with or without exercise. The results indicated that weight changes after 18 months of lifestyle intervention were associated with specific gene methylation profiles [51].
4. Pathophysiology of Obesity
Throughout human evolution, environmental survival pressures have predisposed the body to store fat. However, with the rise of industrialization and easy access to high-calorie foods, this adaptive mechanism has become a liability [52]. Obesity is a complex, chronic, and progressive disease characterized by excessive adiposity and dysregulation of enteroendocrine and neurohormonal signaling pathways, which result in heightened appetite and increased energy storage [53]. It is also recognized as a state of chronic low-grade systemic inflammation, marked by elevated levels of circulating proinflammatory cytokines, which adversely impact the central nervous system and organs involved in energy and metabolic homeostasis [54]. In the context of a long term positive energy leveling balance under which excessive adiposity develops slowly over time [55]. Compared with individuals who are not overweight or obesity, obese individuals have larger fat and lean mass, as well as higher resting energy expenditure, cardiac output, blood pressure and greater pancreatic β-cell mass et al [56]. As weight is gained over time, fat accumulates in the subcutaneous and around the viscera, leading to a wide range of metabolic disorders and associated complications [57,58]. At the same time, adipocyte apoptosis induces adipose tissue remodeling, leading to an increase in macrophages and other immune cells within the tissue [59]. These immune cells interact with adipocytes to secrete proinflammatory cytokines, thereby promoting a low-grade systemic inflammatory state in some individuals with obesity [60,61]. Adipocytes also synthesize adipokines and hormones, which are influenced by the distribution and amount of adipose tissue [62]. The hydrolysis of triglycerides within adipocytes releases free fatty acids, which are then transported through the plasma and deposited in various cells, particularly hepatocytes, where they induce cytotoxicity and contribute to a range of metabolic disorders in the liver [63,64]. Obese individuals differ in etiology, pathogenesis, symptom presentation and response to treatment and this phenomenon is referred to as obesity heterogeneity [65,66].
5. Heterogeneity of Obesity
The variability in human responses to obesogenic environments, often observed in affluent societies, is a crucial aspect of the obesity epidemic. Traditional approaches often compare the physiological functions of obese individuals to those of lean controls. However, these studies face challenges in distinguishing whether the observed differences are causes or consequences of obesity. Clearly, obesity heterogeneity also exists among obese people (Figure 2), and experimental studies—particularly those focusing on individuals—can reveal novel causal risk factors or potential pathways of disease.
5.1. Obesity Heterogeneity in Human Population
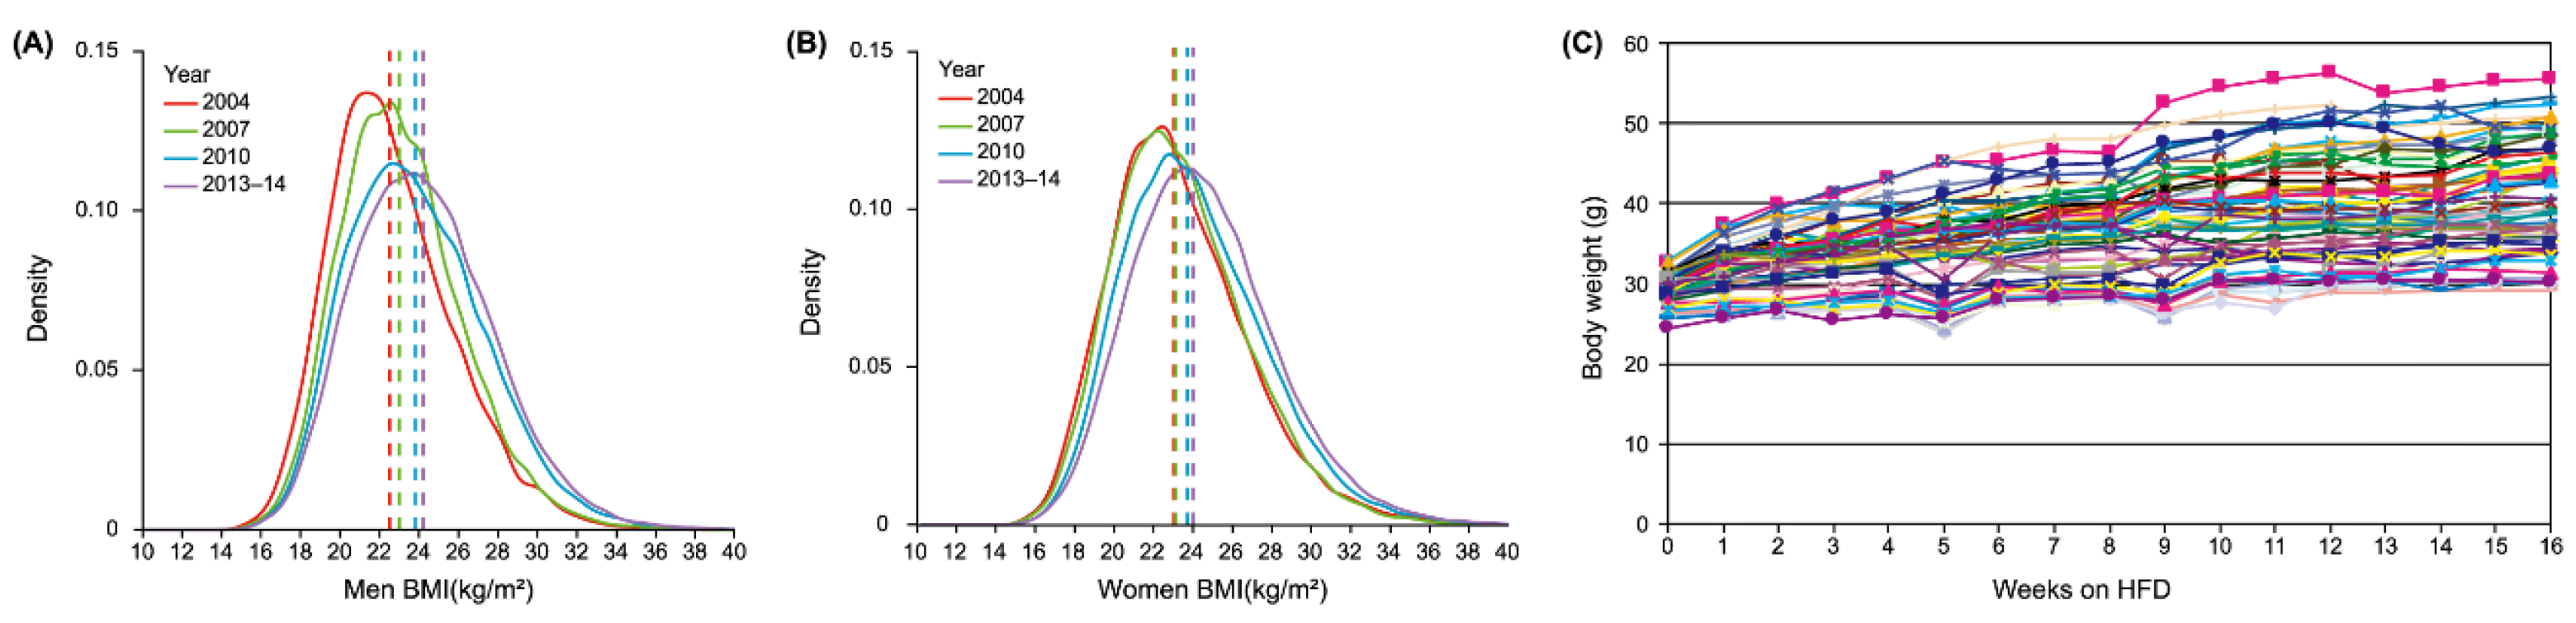
In recent years, food supply per capita has increased significantly, leading to an unprecedented abundance of energy availability. This, combined with the increasing consumption of energy-dense foods, has resulted in overnutrition in the general population [67]. Despite these obesogenic conditions, the extent of obesity varies greatly from person to person, a phenomenon referred to as obesity heterogeneity [68]. Body mass index (BMI), calculated as weight in kilograms divided by height in meters squared (kg m-2), is a commonly used metric for assessing obesity. The World Health Organization defines obesity as BMI ≥ 30 [69], while China Obesity Task Force defines obesity as BMI ≥ 28 [70]. Although obesity is widespread, its severity varies among individuals with obesity. For example, a study in China revealed a nearly Gaussian distribution of BMI in adults, with a range between 28 and 40 on the BMI scale (Figure 3A,B) [71]. Similarly, in Denmark, the BMI distribution of obese adults extends from 30 to 45, showing a wider range compared to China [72]. A study of 3 million adults in the United States also highlighted substantial variation in BMI among obese individuals [73]. These differences in BMI are not region-specific but reflect the global variability in obesity across different populations [74,75].
5.2. Obesity Heterogeneity in Animals
To model the obesogenic environments seen today, high-fat diet (HFD) models using inbred mouse strains like C57BL/6J are commonly employed in obesity studies [76]. Significant differences in the weight of mice exposed to HFD have been demonstrated even within genetically identical populations [77]. When subjected to HFD feedings, C57BL/6J mice display marked variability in weight gain (Figure 3C). This variability becomes more pronounced with prolonged exposure to the diet [78]. In one study, 219 male C57BL/6J mice fed a 58% fat diet for four weeks showed a bell-shaped weight distribution ranging from 24 to 37 grams [79]. In addition, 60 male C57BL/6J mice of similar age were fed an HFD with 45% kcal fat for 4, 8, 12 and 16 weeks, with a body weight distributions of 24.40-32.80, 27.83-48.13, 28.78-56.24 and 29.17-55.44 grams, respectively [80]. Similarly, 324 male mice on a 60% fat diet for 20 weeks exhibited weights between 27.2 and 52.7 grams [81]. For female, 255 C57BL/6J mice fed an HFD with 45% kcal fat from 8 to 43 weeks of age showed weight gains from 0 to 32 grams, also reflecting considerable variability [82]. These studies highlight significant individual differences in weight gain under HFD [82], and the heterogeneity persisted across different nutrient ratios [83].
Extensive experimental data indicate that obesity heterogeneity is a common phenomenon in experimental animal models and even wild rodent. Considerable individual variation exists in the weight gain of voles, an animal widely used to study obesity, after exposure to high-fat conditions [84]. Rats, another commonly used model in obesity research, also show substantial variability in weight gain when subjected to HFD feeding [85]. Mickelsen et al. first identified differences in obesity susceptibility across various rat strains [86,87]. Sprague-Dawley and Wistar rats, in particular, exhibit wide variability in weight gain under hypercaloric conditions (Table 1) [88,89,90,91]. These differences are attributed to factors such as genetic diversity, differences in energy expenditure, and variability in feeding behavior. Thus, obesity heterogeneity is a common phenomenon in experimental models of metabolic disorders.
6. Predictive Factors for Obesity Heterogeneity
Few studies have examined how pre-existing individual differences in animals or humans, prior to exposure to obesogenic environment, affect their susceptibility to obesity. Identifying biomarkers or gene responses before exposure could help predict later changes in body composition, enabling early detection of individuals at higher risk for obesity. These new analyses also offer the potential to develop novel hypotheses about the causes of variability in obesity across populations.
6.1. Human Studies
Understanding how pre-existing individual differences influence weight gain in obesogenic environments is crucial. Recent studies have begun to uncover early-life predictors of obesity, suggesting that specific biomarkers may be significantly associated with an individual's susceptibility to future weight gain before they are exposed to obesogenic conditions [92].
Bouchard et al. investigated the predictors of body composition and energy changes in response to chronic overfeeding in a study involving 24 young, sedentary male twins. Participants were subjected to a standardized overfeeding protocol of 1,000 kcal per day above maintenance levels for 100 days, resulting in significant weight, fat mass (FM), and fat-free mass (FFM) gains. The study not only highlighted the notable individual variability in response to overfeeding with the average gains in FM and FFM for 5.4 kg and 2.7 kg respectively, but also indicated that pre-overfeeding levels of fat-free mass, muscle oxidative capacity, maximal oxygen uptake (VO2max), androgen levels, and plasma leptin concentrations were identified as potential predictors of future body composition changes. Specifically, fat-free mass and muscle oxidative capacity were inversely correlated with energy and weight gain, while plasma leptin levels were positively correlated with these outcomes. Additionally, the thermic effect of a meal and specific hormonal levels (e.g., testosterone and androstenediol-sulfate) were linked to reduced fat gain, highlighting metabolic efficiency as a protective factor against excessive fat accumulation [93].
The study concluded that a combination of metabolic, hormonal, and fitness-related baseline traits can predict individual differences in body composition changes due to overfeeding. These findings provide insights into why some individuals may be more prone to increased fat storage than others under the same overfeeding conditions and emphasize the importance of personalized approaches to weight management. Furthermore, baseline characteristics within the population—such as FFM, muscle oxidative capacity, VO2max, androgen levels, plasma leptin levels—can serve as predictors of future variations in weight gain and offer an important framework for predicting obesity risk and tailoring prevention strategies based on early biomarkers (Figure 4, Table 2).
6.2. Animal Studies
In order to unravel the heterogeneity of obesity, both human and animal studies have unveiled a spectrum of predictive factors that can foreshadow the development of excess adiposity. While human studies have focused on a diverse array of predictors, animal models have provided a controlled environment to dissect the early signs of obesity with precision.
Expression levels of some genes can serve as predictors of obesity following exposure to HFD. Koza et al. have delineated a compelling narrative: the obesity phenotype in inbred C57BL/6J mice at 7 weeks of age exhibits a striking variability and differences in epididymal fat gene expression at 7 weeks of age (prior to a high-fat diet) correlated with obesity after 8 weeks on a high-fat diet in mice. SFRP5, MEST, and BMP3 gene expression levels in epididymal fat biopsies from 7-week-old mice were significantly and positively correlated with obesity at week 16, with SFRP5 correlating with obesity up to 45% and being a strong predictor. Interestingly, this difference also remained stable during subsequent caloric restriction [79]. In particular, elevated expression of these genes may be causally linked to fat mass expansion. Building upon these genetic insights, Speakman et al. also found significant differences in weight gain among mice fed an HFD, which could be predicted by early baseline measures of FM, FFM, and PA. The study selected 60 age-matched male C57BL/6J mice to measure baseline characteristics under a standard LFD, including FM, FFM, PA, food intake, and resting metabolic rate. Subsequently, these mice were switched to HFD and the mice body weights were recorded at weeks 4, 8, 12, and 16 of high-fat feeding. The results showed that baseline FM was strongly positively correlated with weight gain from weeks 4 to 16, baseline FFM was positively correlated with weight gain at weeks 12 and 16, and baseline PA was negatively correlated with weight gain at weeks 8, 12, and 16. However, baseline “food intake”, “resting metabolic rate”, and “body temperature” were not related to later obesity at any time point. Thus, baseline FM, FFM, and PA can serve as predictors of weight gain differences under hypercaloric conditions in this strain of mice, with FM being the strongest predictor [80]. The reasons for this need to be further explained (Box 2).
Moreover, Yang et al. discovered gender differences in multivariable weight prediction models for inbred mice. The study involved 6-week-old C57BL/6J mice (277 males and 278 females), which were fed standard chow until week 8, at which point baseline FM, FFM, and EI were measured and calculated. The mice were then switched to a high-fat diet until week 43. Body weight was measured weekly for the first month, and subsequently every 4 weeks. Multivariable variance analysis for weight prediction indicated that, for male mice on the HFD, baseline FM, FFM, and EI were significant positive predictors of future weight throughout the study. For female mice on the HFD, baseline FM and FFM were significant predictors at all time points, while baseline EI was only a significant predictor of weight at week 35 [82]. In conclusion, baseline characteristics of C57BL/6J mice, including FM, FFM, PA, and EI along with the expression levels of SFRP5, MEST, and BMP3 genes in adipose tissue, can serve as non-genetic predictors of future differences in weight gain (Figure 4). Since these inbred mice have homogenous genes, they offer a model for predicting future obesity risk in humans due to non-genetic factors.
Thermogenic Capacity in wild Brandt's voles predicts differences in susceptibility to obesity. 30 age-matched adult male Brandt's voles were fed a standard LFD for 10 weeks, followed by a HFD for 12 weeks. Baseline levels of non-shivering thermogenesis (NST) were measured during the last 2 weeks of LFD feeding, and body mass was measured at weeks 4, 8, and 12 of the HFD. Multiple regression analyses revealed that baseline NST was the strongest predictor of body weight gain during the high-calorie diet, and that voles with a high maximal thermogenic capacity during low-fat feeding were at high induced obesity risk and had a higher susceptibility to obesity [84].
Prepubertal rat weight gain model accurately predicts risk of obesity in adult rats. Leibowitz et al. fed a high-calorie diet to 24 newly born Sprague-Dawley male rat pups until adulthood. The body fat was measured on day 80 or 100 before death. Experimental data showed that the average daily weight gain for rats at 30-35 days of age was 5-10 g, which was strongly and earliest positively correlated with body fat in adulthood and can be considered a predictor of future obesity [94].
Rodent experimental models are commonly used in studies of obesity heterogeneity. Early measurements of FM, FFM, PA, EI and some gene expression levels in inbred mice can predict future body weight. Since these mice have homogenous genes, they offer a model for predicting future obesity risk in humans due to non-genetic factors. In studies using wild voles, baseline NST on a high-fat diet was a predictor of future susceptibility to obesity. While in outbred rats, weight gain during puberty under a high-fat diet can also predict future obesity levels. Particularly, the genetic heterogeneity in wild voles and outbred rats makes them suitable for simulating human population states and weight gain in early NST or pubertal children might also serve as a predictor of future obesity under today's hypercaloric conditions. Early measurements of body composition, gene expression, and PA in animal models can provide valuable information for predicting weight gain in response to obesogenic environments (Table 2). These predictive factors could guide the development of more targeted interventions for individuals at risk of obesity (Box 2). Importantly, the phenotypic differences observed before HFD exposure remain stable, persisting even when a restrictive LFD is introduced, demonstrating the robustness of these early traits.
BOX2
Several studies have examined the factors contributing to obesity heterogeneity among inbred mice on high-fat diets, including the roles of gender and age in obesity susceptibility [95,96,97]. Other factors such as intrauterine conditions (e.g., uterine position, blood supply, fetal size, and neighboring fetal sex), early postnatal influences (e.g., fetal size, sex ratio, maternal behavior, social interactions, and stress), and adult factors (e.g., social dominance, stress, and health issues) also play a role in obesity susceptibility [15,98]. Research has also explored how different dietary components influence obesity risk in these mice [99,100,101]. Due to their genetic uniformity, individual differences in inbred mouse strains can often be attributed to random events or specific environmental conditions [102]. Environmental factors may influence gene expression through epigenetic modifications (e.g., DNA methylation, histone acetylation, and microRNA changes), contributing to inter-individual variability [49]. Importantly, environmental factors are believed to affect the likelihood of consuming high-fat diets through such epigenetic changes. Studies suggest that non-genetic variation in mice’s responses to high-fat diets is shaped by early-life conditions, such as litter size and nutritional status in early development [103,104]. Inadequate fetal nutrition is associated with an increased risk of obesity in adulthood when exposed to obesogenic environments [105]. Consistent with other findings, litter size during lactation inversely correlates with body weight at weaning, likely due to the limited availability of maternal milk when divided among more offspring. Epigenetic mechanisms, which alter chromatin structure and gene expression without changing the underlying genetic code, are thought to underlie this relationship [106]. These modifications provide a mechanism for obesity that is independent of new genetic mutations. Furthermore, maternal nutritional status significantly affects offspring outcomes. In studies using inbred C57BL/6 mice, maternal consumption of a high-fat diet during pregnancy and lactation led to reduced DNA methylation in the promoters of genes related to the dopamine and opioid systems. This epigenetic alteration influenced long-term gene expression in mesolimbic pathways, increasing dietary fat preference in adulthood and contributing to variations in weight gain later in life [107].
Khera et al. provide an in-depth analysis of genetic contributions to obesity by employing a genome-wide polygenic score (GPS). This GPS was constructed using data from over 300,000 individuals and analyzed 2.1 million genetic variants, offering a comprehensive approach to identify individuals at high risk for severe obesity. The study found that BMI differences due to genetic predisposition emerge early in childhood and persist into adulthood. Notably, individuals in the highest decile of the GPS had a significantly higher risk of obesity compared to those in the lowest decile. This underscores the role of genetic susceptibility in obesity heterogeneity, moving beyond traditional polygenic risk scores that utilized fewer genetic variants with lower predictive power [108]. The study observed a pronounced gradient in body weight and obesity risk, with individuals in higher deciles of the polygenic score being 13 kg heavier on average and 25 times more likely to develop severe obesity. Longitudinal data from a birth cohort study showed minimal differences in birth weight across polygenic score deciles, but by 18 years of age, individuals with higher polygenic scores exhibited a 12 kg weight difference [108]. This study examines the potential of GPS in predicting obesity, thereby providing new insights for clinical decision-making and public health interventions. We expect better prevention and management of obesity and its problems in the future with continuous research and application of these indices. We highlight that integrating genetic risk factors with early biochemical markers could refine predictions of obesity risk. While the GPS alone proved to be a powerful predictor, combining it with metabolic and biochemical indicators could improve precision in identifying individuals at greater risk. This suggests a future direction where genetic data and early life biomarkers work together to enhance individualized approaches for prevention and intervention in obesity (Figure 5).
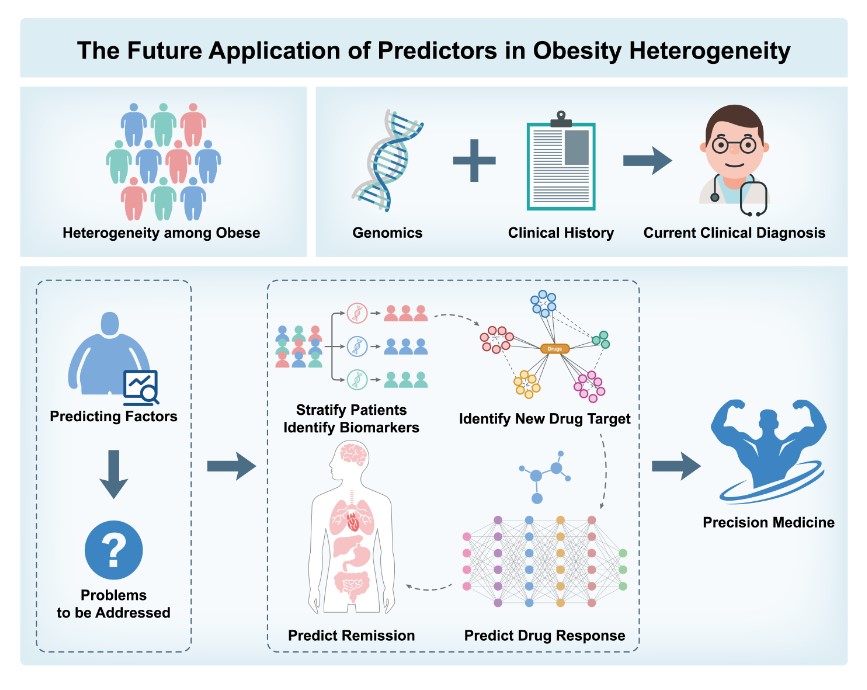
The heterogeneity within obesity populations highlights the limitations of using gene testing and clinical measures, especially BMI, in diagnosing and defining obesity. Moving forward, integrating genetic data, early biochemical biomarkers, and intelligent learning systems holds great potential for optimizing personalized strategies for obesity prevention and treatment. This multi-dimensional integration approach is expected to not only enhance the precision of obesity risk prediction but also improve the efficiency and accuracy of disease management. This approach will contribute to:
- 1.
- Patient Stratification and Biomarker Identification: Combining genetic and biochemical markers to identify high-risk individuals for personalized prevention;
- 2.
- Identification of Novel Drug Targets and Drug Response Prediction: Identifying therapeutic targets and predicting individual responses to treatments;
- 3.
- Application of Artificial Intelligence: Using machine learning to enhance obesity risk prediction accuracy;
- 4.
- Predicting Remission and Long-Term Management: Analyzing genetic and biochemical data to support personalized interventions and manage obesity progression.
7. Concluding Remarks and Future Perspectives
Obesity is a complex metabolic disorder influenced by both genetic and environmental factors. Recent studies in genetically identical organisms, such as inbred mice and monozygotic twins, have revealed significant individual variability in response to obesogenic environments. Despite identical genetic backgrounds, different individuals or animals exhibit varying degrees of obesity when exposed to the same high-fat diet or overfeeding protocols. This phenomenon challenges current paradigms of obesity research and suggests the existence of non-genetic factors that contribute to obesity susceptibility. This review explores the role of early biochemical markers and gene expression patterns in predicting long-term obesity outcomes. Additionally, it discusses how environmental factors, combined with genetic predispositions, influence obesity development. Through understanding the molecular and physiological mechanisms behind these variations, this review proposes potential biomarkers for predicting obesity susceptibility, particularly focusing on characteristics such as FM, FFM, PA, EI, NST, muscle oxidative capacity, VO2max, and gene expressions like SFRP5, MEST, BMP3 and androgen level, which could inform personalized prevention and treatment strategies.
The heterogeneous nature of obesity remains one of the most intriguing challenges in metabolic research.
While genetic predisposition undoubtedly plays a role, it is clear that environmental factors and early-life biomarkers contribute significantly to individual variability in obesity outcomes. The findings from studies on inbred mice and twin cohorts suggest that obesity susceptibility can be predicted by early genetic and biochemical markers, even before the onset of excessive caloric intake. Integrating genetic data, early biochemical biomarkers, and intelligent learning systems holds great potential for optimizing personalized strategies for obesity prevention and treatment. This multi-dimensional integration approach is expected to not only enhance the precision of obesity risk prediction but also improve the efficiency and accuracy of disease management.
Moving forward, more research is needed to identify specific molecular signatures that can be used to predict obesity risk, particularly in humans. Future studies should focus on integrating genetic, epigenetic, and environmental data to develop comprehensive predictive models. Additionally, intervention strategies aimed at modulating early biochemical markers or gene expression patterns could hold promise in preventing obesity before its onset.
Figures
Figure 3.
Heterogeneity of obesity among populations and inbred mice. (A, B) BMI distribution curves of Chinese men (A) and women (B) aged 18-69 from 2004 to 2013-14(Using the lambda-mu-sigma method. The area under each curve is 1) Normal distribution fitting of the entire population in both men and women. When we focus only on obese people, the BMI ranges from 28 to 40. (Adapted with permission from ref. [71], Lancet. Rightslink® by Copyright Clearance Center) (C). Speakman and colleagues revealed the heterogeneity of obesity in inbred mice under experimental conditions, with mice of the same genetic background showing variable weight gain. After 16 weeks of HFD, the smallest individual weighed 29.17 g, while the largest individual weighed 55.44 g. (Adapted with permission from ref. [80], Wiley. https://onlinelibrary.wiley.com/journal/1930739x).
Tables

Table 1.
Summary of studies on obesity heterogeneity in mice, rats, and humans.
| Author year | Model | Design | Findings | Ref. |
|---|---|---|---|---|
| Xiong-Fei Pan 2021 | China's Chronic Disease and Risk Factors Surveys: 2004, 2007, 2010, 2013-14. | Cross-sectional Analysis | Obesity rates rose steadily among all groups. Overweight and obesity raise the risk of chronic diseases and early death | [71] |
| Janne S Tolstrup 2023 | 91,684 Danes | Cross-sectional Surveys | BMI distribution shifted right from 1987 to 2021, with higher values across all percentiles and socioeconomic groups | [72] |
| Aditi Krishna 2015 | 3,050,992 non-Hispanic white, non-Hispanic black, and Hispanic men and women | Longitudinal Analysis | Growing inequalities in BMI at the population level are not driven by these socioeconomic and demographic factors | [73] |
| In Sil Park 2021 | 2,708,938 Korean women | Retrospective Cohort | The impact of obesity on the risk of female-specific cancers varies with cancer type and menopausal status | [74] |
| Min Gao 2021 | 6,910,695 British people | Prospective Cohort | The risk of severe COVID-19 hospitalization and death rises linearly from a BMI of 23 kg/m² upwards | [75] |
| Rémy Burcelin 2002 | Male C57BL/6J mice (IFFACREDO, L'Arbresle, Franc) at 4-to 5-weeks age |
Feeding a high fat diet (HFD) for 9 months | Approximately 50% of the mice became obese and diabetic, 10% lean and diabetic, 10% lean and non-diabetic, and 30% showed intermediate phenotypes | [77] |
| Sarah L.Johnston 2012 | Female C57BL/6J mice (n=147; Harlan United Kingdom, Oxon, United Kingdom) at 6 weeks of age | Laboratory chow (Rat and Mouse Breeder Grower diet CRM; Special Diet Services, Essex, United Kingdom); A low-fat (10% kcal fat; n=47), medium fat (45% kcal fat; n=50) and high-fat diet (60% kcal fat, n=50; Research Diets, New Brunswick, NJ) | Female mice on a high-fat diet experienced weight gains ranging from 1.4% to 65% |
[78] |
| Robert A Koza 2006 | Fale C57BL/6J mice(n=219;the Jackson Laboratory (Bar Harbor, Maine, United States). | Low-fat chow diet 5053 ad libitum (From weaning until 8 wk of age); High saturated fat diet D12331(At 8 wk of age) |
Body weights of 219 mice fed a high-fat diet for 4 wk were distributed in a bell-shaped curve ranging from 24–37 g | [79] |
| Li-Na Zhang 2012 | Male C57BL/6J mice (n=60; Charles River UK, Kent) and female C57BL/6J mice (n=40; Charles River UK) | Male:low-fat control diet (D12450B, 10% kcal/fat and HFD (D12451, 45% kcal/fat; Female: laboratory chow (Rat and Mouse Breeder Grower diet CRM) | Male mice from the same strain, after consuming a high-fat diet with 45% of calories from fat for 16 weeks, exhibited body weights ranging from 29.17g to 55.44g | [80] |
| Anne Kammel 2016 | Male C57BL/6J mice (n=324;Charles River, Germany) | Pre-weaning: a standard chow (sniff) Post-weaning: HFD (60 kcal% fat, 21.9 kJ/g, D12492, Research Diets, Inc., USA) |
324 male C57BL/6J mice on a 60 kcal% high-fat diet for 20 weeks exhibited body weights ranging from 27.2g to 52.7g |
[81] |
| Yongbin Yang,2014 | C57BL/6J mice (n=277 males and n=278 females) from the Jackson Laboratory (Bar Harbor, ME) at 6 weeks of age | A low-fat diet (LFD, 10% calories from fat; n=15 male, n=15 female) or high-fat diet (HFD, 45% calories from fat; n=277 male, n=278 female) | Males and females exhibit substantial fat mass variation, which grows over time, contrasting with the stable fat-free mass | [82] |
| Wu,2022 | C57BL/6N, DBA/2, BALB/c, FVB, And C3H mouse strains | Series 1: D14071601–D14071606 and series 2: D14071607–D14071612 fixed the level of fat 60 or 20% by energy and Varied the protein content from 5 to 30% (5, 10, 15, 20, 25 and 30%, respectively) by energy; Series 3: D14071613–D14071618 and series 4: D14071619–D14071624 fixed the level of protein at 10% (series 3) (10,30, 40, 50, 70, and 80%, respectively) or 25% (series 4) (8.3, 25,33.3, 41.7, 58.3, and 66.6%, respectively) by energy and varied the fat content from 8.3 to 80% by energy | The variations in food intake and body weight changes increased with the elevation of dietary fat levels | [83] |
| Xue-Ying Zhang, Wei Shen,2018 | Male and female Brandt’s voles (3-4 mouth of age) |
HFD (22.9 kJ/g, which consisted of 27% fat [soybean oil], 18% protein, 12% crude fiber, and 23% carbohydrate; Beijing HFK Bioscience Co.); A standard rabbit pellet chow (low-fat control diet [LFD]; 17.5 kJ/g, which consisted of 2.7% fat, 18% protein, 12% crude fiber, and 47% carbohydrate) | Diversity of Thermogenic Capacity Predicts Divergent Obesity Susceptibility in a Wild Rodent | [84] |
| Levin,1985 | Male Sprague-Dawley rats (n=40; Charles River) at 3-mo of age | Purina rat chow caloric content by bomb calorimetry 4.0 kcal/g); A semisynthetic diet (“condensed milk;” CM diet) composed of chow, corn oil, sweetened condensed milk containing 16.3% fat, 14.7% protein, and 56.3% carbohydrate | After 15 wk on a moderately high-calorie high-fat (CM) diet, 43% of 40 3mo-old male Sprague-Dawley rats developed diet-induced obesity (DIO) (29% more weight gain), whereas 57% of diet-resistant (DR) rats gained no more weight than 20 chow-fed controls | [88] |
| Chang,1990 | Female Wistar rats (n=70; Harlan Madison, WI) | A low-fat diet (20% of calories from fat, 20% from protein, and 60% from carbohydrate), the HFD diet (60% of calories from fat) | OP (obesity prone) rats gained approximately twice as much weight as OR (obesity resistant) rats, OR rats had a significantly lower 24h respiratory quotient, and Insulin sensitivity was significantly higher in OR than OP rats | [89] |
| Claude Bouchord 2013 | 24 young lean men (12 pairs of identical twins) | A standardized 353 MJ (84 000 kcal) overfeeding protocol:15 percent from protein, 35 percent from lipid, and 50 percent from carbohydrate | The 100-day overfeeding protocol resulted in an average weight gain of 8.1 kg, ranging from 4.3 to 13.3 kg | [93] |
| Amit V. Khera 2019 | A polygenic predictor comprised of 2.1 million common variants | Using a Bayesian approach to calculate a posterior mean effect for all variants based on a prior and subsequent shrinkage based on linkage disequilibrium, with the optimal predictor chosen based on maximal correlation with BMI in the UK Biobank validation dataset (N = 119,951 Europeans) | Among middle-aged adults, there was a 13-kg gradient in weight and a 25-fold gradient in risk of severe obesity across polygenic score deciles. In a longitudinal birth cohort, minimal differences in birthweight were noted across score deciles, but a significant gradient emerged in early childhood, reaching 12 kg by 18 years | [108] |
| K L Leibowitz 2007 | Ten-day pregnant Sprague–Dawley rats (200–225 g; Charles iver Breeding Labs, Kingston, NY, USA) | a high-fat diet (5.15 kcal/g) consisting of 50% fat (80% lard, 20% vegetable oil), 25% carbohydrates (30% dextrin, 30% cornstarch, 40% sucrose), 25% protein (casein with 0.03% L-cysteine hydrochloride), plus 4% minerals and 3% vitamins | Among rats, there is a variability in the rate of weight gain, with those exhibiting a rapid rate reaching up to 8-10 g per day. Rats with a slower rate of weight gain achieve increments of 5-7 g per day | [94] |
Author Contributions
P.L.: Formal analysis, investigation, visualization and writing-original draft. M.Z.: Methodology, formal analysis and writing-review & editing. A.L.: formal analysis, data curation and visualization. T.L. and J.L.: Formal analysis and data curation. W.C.: Writing-review & editing. K.Y.: Writing-review & editing. G.Z.: Conceptualization, supervision and writing-review & editing.
Acknowledgments
This study was supported by the Thousand Young Talents Program and grants from the National Natural Science Foundation of China (82171554 to G.Z.), the Department of Education of Henan Province (24ZX014 to G.Z.), the Department of Education of Henan Province (25A180019 to W.C.), the Henan Training Program of Innovation and Entrepreneurship for Undergraduates of Henan University (202410475037 to P.L.).
Conflict of Interest
All authors confirmed no declarations of interest.
Abbreviations
| EI | Energy Intake |
| BMI | Body Mass Index |
| NPY/AgRP | The Neuropeptide Y/Agouti-related peptide neurons |
| POMC/CART | The Pro-opiomelanocortin/Cocaine amphetamine-regulated transcript |
| PA | Physical Activity |
| HFD | High-Fat Diet |
| LFD | Low-Fat Diet |
| FM | Fat Mass |
| FFM | Fat-Free Mass |
| VO2max | Maximal Oxygen Uptake |
| NST | Non-Shivering Thermogenesis |
| GPS | Genome-Wide Polygenic score |
References
- Lingvay I, Cohen RV, Roux CW le, et al. Obesity in adults. Lancet 2024;404(10456):972–987; [CrossRef]
- Anderer, S. One in 8 People Worldwide Are Obese. JAMA 2024;331(14):1172; [CrossRef]
- Ward ZJ, Bleich SN, Cradock AL, et al. Projected U.S. state-level prevalence of adult obesity and severe obesity. N Engl J Med 2019;381(25):2440–2450; [CrossRef]
- Anonymous. Obesity Atlas 2024 | World Obesity Federation Global Obesity Observatory. n.d. Available from: https://data.worldobesity.org/publications/?cat=22 [Last accessed: 10/27/2024].
- Chong B, Jayabaskaran J, Kong G, et al. Trends and predictions of malnutrition and obesity in 204 countries and territories: an analysis of the Global Burden of Disease Study 2019. EClinicalMedicine 2023;57:101850; [CrossRef]
- Hall KD, Farooqi IS, Friedman JM, et al. The energy balance model of obesity: beyond calories in, calories out. Am J Clin Nutr 2022;115(5):1243–1254; [CrossRef]
- Müller TD, Blüher M, Tschöp MH, et al. Anti-obesity drug discovery: advances and challenges. Nat Rev Drug Discov 2022;21(3):201–223; [CrossRef]
- Stunkard AJ, Foch TT, Hrubec Z. A twin study of human obesity. JAMA 1986;256(1):51–54.
- Bray MS, Loos RJF, McCaffery JM, et al. NIH working group report-using genomic information to guide weight management: From universal to precision treatment. Obesity (Silver Spring) 2016;24(1):14–22; [CrossRef]
- Loos RJF, Yeo GSH. 10 The genetics of obesity: From discovery to biology. Nat Rev Genet 2022;23(2):120–133; [CrossRef]
- Hall, KD. Did the food environment cause the obesity epidemic? Obesity (Silver Spring) 2018;26(1):11–13; [CrossRef]
- Blüher, M. Obesity: global epidemiology and pathogenesis. Nat Rev Endocrinol 2019;15(5):288–298; [CrossRef]
- O’Rahilly S, Farooqi IS. Human obesity: a heritable neurobehavioral disorder that is highly sensitive to environmental conditions. Diabetes 2008;57(11):2905–2910; [CrossRef]
- Norgan NG, Durnin JV. 14 The effect of 6 weeks of overfeeding on the body weight, body composition, and energy metabolism of young men. Am J Clin Nutr 1980;33(5):978–988; [CrossRef]
- De Francesco PN, Cornejo MP, Barrile F, et al. Inter-individual Variability for High Fat Diet Consumption in Inbred C57BL/6 Mice. Frontiers in Nutrition 2019;6:67; [CrossRef]
- Lister NB, Baur LA, Felix JF, et al. Child and adolescent obesity. Nat Rev Dis Primers 2023;9(1):24; [CrossRef]
- Chaptini L, Peikin S. Physiology of Weight Regulation. In: Practical Gastroenterology and Hepatology Board Review Toolkit. (Wallace MB, Aqel BA, Lindor KD, et al. eds) Wiley; 2016; pp. 1–4; [CrossRef]
- Becetti I, Bwenyi EL, de Araujo IE, et al. The neurobiology of eating behavior in obesity: Mechanisms and therapeutic targets: a report from the 23rd annual harvard nutrition obesity symposium. Am J Clin Nutr 2023;118(1):314–328; [CrossRef]
- Makaronidis J, Batterham RL. Control of Body Weight: How and Why Do We Gain Weight Easier Than We Lose It? In: Textbook of Diabetes. (Holt RIG, Flyvbjerg A. eds) Wiley; 2024; pp. 142–154; [CrossRef]
- Mitoiu BI, Nartea R, Miclaus RS. Impact of Resistance and Endurance Training on Ghrelin and Plasma Leptin Levels in Overweight and Obese Subjects. Int J Mol Sci 2024;25(15):8067; [CrossRef]
- Grosse J, Heffron H, Burling K, et al. Insulin-like peptide 5 is an orexigenic gastrointestinal hormone. Proc Natl Acad Sci U S A 2014;111(30):11133–11138; [CrossRef]
- Cao J, Belousoff MJ, Liang Y-L, et al. A structural basis for amylin receptor phenotype. Science 2022;375(6587):eabm9609; [CrossRef]
- Kim K-S, Seeley RJ, Sandoval DA. Signalling from the periphery to the brain that regulates energy homeostasis. Nat Rev Neurosci 2018;19(4):185–196; [CrossRef]
- Steuernagel L, Lam BYH, Klemm P, et al. HypoMap-a unified single-cell gene expression atlas of the murine hypothalamus. Nat Metab 2022;4(10):1402–1419; [CrossRef]
- Dodd GT, Kim SJ, Méquinion M, et al. Insulin signaling in AgRP neurons regulates meal size to limit glucose excursions and insulin resistance. Sci Adv 2021;7(9):eabf4100; [CrossRef]
- De Solis AJ, Del Río-Martín A, Radermacher J, et al. Reciprocal activity of AgRP and POMC neurons governs coordinated control of feeding and metabolism. Nat Metab 2024;6(3):473–493; [CrossRef]
- Frayn M, Livshits S, Knäuper B. Emotional eating and weight regulation: a qualitative study of compensatory behaviors and concerns. J Eat Disord 2018;6:23; [CrossRef]
- Berthoud H-R, Münzberg H, Morrison CD. Blaming the Brain for Obesity: Integration of Hedonic and Homeostatic Mechanisms. Gastroenterology 2017;152(7):1728–1738; [CrossRef]
- Van Baak MA, Mariman ECM. Mechanisms of weight regain after weight loss — the role of adipose tissue. Nat Rev Endocrinol 2019;15(5):274–287; [CrossRef]
- Pillon NJ, Loos RJF, Marshall SM, et al. Metabolic consequences of obesity and type 2 diabetes: Balancing genes and environment for personalized care. Cell 2021;184(6):1530–1544; [CrossRef]
- Kaisinger LR, Kentistou KA, Stankovic S, et al. Large-scale exome sequence analysis identifies sex- and age-specific determinants of obesity. Cell Genom 2023;3(8):100362; [CrossRef]
- Israeli H, Degtjarik O, Fierro F, et al. Structure reveals the activation mechanism of the MC4 receptor to initiate satiation signaling. Science 2021;372(6544):808–814; [CrossRef]
- Namjou B, Stanaway IB, Lingren T, et al. Evaluation of the MC4R gene across eMERGE network identifies many unreported obesity-associated variants. Int J Obes (Lond) 2021;45(1):155–169; [CrossRef]
- Zhao Y, Chukanova M, Kentistou KA, et al. Protein-truncating variants in BSN are associated with severe adult-onset obesity, type 2 diabetes and fatty liver disease. Nat Genet 2024;56(4):579–584; [CrossRef]
- Trang K, Grant SFA. Genetics and epigenetics in the obesity phenotyping scenario. Rev Endocr Metab Disord 2023;24(5):775–793; [CrossRef]
- Saeed S, Bonnefond A, Froguel P. Obesity: Exploring its connection to brain function through genetic and genomic perspectives. Mol Psychiatry 2024; [CrossRef]
- Frayling TM, Timpson NJ, Weedon MN, et al. A common variant in the FTO gene is associated with body mass index and predisposes to childhood and adult obesity. Science 2007;316(5826):889–894; [CrossRef]
- Locke AE, Kahali B, Berndt SI, et al. Genetic studies of body mass index yield new insights for obesity biology. Nature 2015;518(7538):197–206; [CrossRef]
- Congdon, P. Obesity and Urban Environments. Int J Environ Res Public Health 2019;16(3):464; [CrossRef]
- Strain T, Flaxman S, Guthold R, et al. National, regional, and global trends in insufficient physical activity among adults from 2000 to 2022: a pooled analysis of 507 population-based surveys with 5·7 million participants. Lancet Glob Health 2024;12(8):e1232–e1243; [CrossRef]
- Pineda E, Stockton J, Scholes S, et al. Food environment and obesity: a systematic review and meta-analysis. BMJ Nutr Prev Health 2024;7(1):204–211; [CrossRef]
- Godfray HCJ, Aveyard P, Garnett T, et al. Meat consumption, health, and the environment. Science 2018;361(6399):eaam5324; [CrossRef]
- Pineda E, Atanasova P, Wellappuli NT, et al. Policy implementation and recommended actions to create healthy food environments using the Healthy Food Environment Policy Index (Food-EPI): a comparative analysis in South Asia. The Lancet Regional Health - Southeast Asia 2024;26; [CrossRef]
- Willett W, Rockström J, Loken B, et al. Food in the Anthropocene: the EAT-Lancet Commission on healthy diets from sustainable food systems. Lancet 2019;393(10170):447–492; [CrossRef]
- Elmaleh-Sachs A, Schwartz JL, Bramante CT, et al. Obesity Management in Adults: A Review. JAMA 2023;330(20):2000–2015; [CrossRef]
- Trang K, Grant SFA. Genetics and epigenetics in the obesity phenotyping scenario. Rev Endocr Metab Disord 2023;24(5):775–793; [CrossRef]
- Zhang X, Zhang G, Zhang H, et al. Hypothalamic IKKbeta/NF-kappaB and ER stress link overnutrition to energy imbalance and obesity. Cell 2008;135(1):61–73; [CrossRef]
- Muñoz, JP. The impact of endocrine-disrupting chemicals on stem cells: Mechanisms and implications for human health. Journal of Environmental Sciences 2025;147:294–309; [CrossRef]
- Champagne, FA. Epigenetics and developmental plasticity across species. Dev Psychobiol 2013;55(1):33–41; [CrossRef]
- Ma K, Yin K, Li J, et al. The Hypothalamic Epigenetic Landscape in Dietary Obesity. Advanced Science 2024;11(9):2306379; [CrossRef]
- Keller M, Yaskolka Meir A, Bernhart SH, et al. DNA methylation signature in blood mirrors successful weight-loss during lifestyle interventions: the CENTRAL trial. Genome Med 2020;12(1):97; [CrossRef]
- Wang G, Speakman JR. Analysis of Positive Selection at Single Nucleotide Polymorphisms Associated with Body Mass Index Does Not Support the “Thrifty Gene” Hypothesis. Cell Metab 2016;24(4):531–541; [CrossRef]
- Blüher, M. Obesity: global epidemiology and pathogenesis. Nat Rev Endocrinol 2019;15(5):288–298; [CrossRef]
- Ouchi N, Parker JL, Lugus JJ, et al. Adipokines in inflammation and metabolic disease. Nat Rev Immunol 2011;11(2):85–97; [CrossRef]
- Hill JO, Wyatt HR, Peters JC. Energy Balance and Obesity. Circulation 2012;126(1):126–132; [CrossRef]
- Lee SJ, Shin SW. Mechanisms, Pathophysiology, and Management of Obesity. N Engl J Med 2017;376(15):1491–1492; [CrossRef]
- Chau Y-Y, Bandiera R, Serrels A, et al. Visceral and subcutaneous fat have different origins and evidence supports a mesothelial source. Nat Cell Biol 2014;16(4):367–375; [CrossRef]
- Zacharia A, Saidemberg D, Mannully CT, et al. Distinct infrastructure of lipid networks in visceral and subcutaneous adipose tissues in overweight humans. Am J Clin Nutr 2020;112(4):979–990; [CrossRef]
- Lindhorst A, Raulien N, Wieghofer P, et al. Adipocyte death triggers a pro-inflammatory response and induces metabolic activation of resident macrophages. Cell Death Dis 2021;12(6):579; [CrossRef]
- Wernstedt Asterholm I, Tao C, Morley TS, et al. Adipocyte inflammation is essential for healthy adipose tissue expansion and remodeling. Cell Metab 2014;20(1):103–118; [CrossRef]
- Chavakis T, Alexaki VI, Ferrante AW. Macrophage function in adipose tissue homeostasis and metabolic inflammation. Nat Immunol 2023;24(5):757–766; [CrossRef]
- Scheja L, Heeren J. The endocrine function of adipose tissues in health and cardiometabolic disease. Nat Rev Endocrinol 2019;15(9):507–524; [CrossRef]
- Zhou L, Yu M, Arshad M, et al. Coordination Among Lipid Droplets, Peroxisomes, and Mitochondria Regulates Energy Expenditure Through the CIDE-ATGL-PPARα Pathway in Adipocytes. Diabetes 2018;67(10):1935–1948; [CrossRef]
- Grabner GF, Xie H, Schweiger M, et al. Lipolysis: cellular mechanisms for lipid mobilization from fat stores. Nat Metab 2021;3(11):1445–1465; [CrossRef]
- Brandão I, Martins MJ, Monteiro R. Metabolically Healthy Obesity-Heterogeneity in Definitions and Unconventional Factors. Metabolites 2020;10(2):48; [CrossRef]
- Sulc J, Winkler TW, Heid IM, et al. Heterogeneity in Obesity: Genetic Basis and Metabolic Consequences. Curr Diab Rep 2020;20(1):1; [CrossRef]
- Hu H, Song J, MacGregor GA, et al. Consumption of Soft Drinks and Overweight and Obesity Among Adolescents in 107 Countries and Regions. JAMA Netw Open 2023;6(7):e2325158; [CrossRef]
- Pedersen MM, Ekstrøm CT, Sørensen TIA. Emergence of the obesity epidemic preceding the presumed obesogenic transformation of the society. Sci Adv 2023;9(37):eadg6237; [CrossRef]
- Ogden CL, Fryar CD, Martin CB, et al. Trends in obesity prevalence by race and hispanic origin-1999-2000 to 2017-2018. JAMA 2020;324(12):1208–1210; [CrossRef]
- Mu L, Liu J, Zhou G, et al. Obesity prevalence and risks among Chinese adults: Findings from the China PEACE million persons project, 2014-2018. Circ Cardiovasc Qual Outcomes 2021;14(6):e007292; [CrossRef]
- Pan X-F, Wang L, Pan A. Epidemiology and determinants of obesity in China. Lancet Diabetes Endocrinol 2021;9(6):373–392; [CrossRef]
- Tolstrup JS, Bramming M, Davidsen M, et al. Time trends in body mass index distribution in the general population in Denmark from 1987 to 2021. Dan Med J 2023;70(10):A03230139.
- Krishna A, Razak F, Lebel A, et al. Trends in group inequalities and interindividual inequalities in BMI in the United States, 1993-2012. Am J Clin Nutr 2015;101(3):598–605; [CrossRef]
- Park IS, Kim SI, Han Y, et al. Risk of female-specific cancers according to obesity and menopausal status in 2•7 million Korean women: Similar trends between Korean and Western women. Lancet Reg Health West Pac 2021;11:100146; [CrossRef]
- Gao M, Piernas C, Astbury NM, et al. Associations between body-mass index and COVID-19 severity in 6·9 million people in England: a prospective, community-based, cohort study. Lancet Diabetes Endocrinol 2021;9(6):350–359; [CrossRef]
- Surwit RS, Kuhn CM, Cochrane C, et al. Diet-induced type II diabetes in C57BL/6J mice. Diabetes 1988;37(9):1163–1167; [CrossRef]
- Burcelin R, Crivelli V, Dacosta A, et al. Heterogeneous metabolic adaptation of C57BL/6J mice to high-fat diet. Am J Physiol Endocrinol Metab 2002;282(4):E834-842; [CrossRef]
- Johnston SL, Souter DM, Tolkamp BJ, et al. Intake compensates for resting metabolic rate variation in female C57BL/6J mice fed high-fat diets. Obesity (Silver Spring, Md) 2007;15(3):600–606; [CrossRef]
- Koza RA, Nikonova L, Hogan J, et al. Changes in gene expression foreshadow diet-induced obesity in genetically identical mice. PLoS genetics 2006;2(5):e81; [CrossRef]
- Zhang L-N, Morgan DG, Clapham JC, et al. Factors predicting nongenetic variability in body weight gain induced by a high-fat diet in inbred C57BL/6J mice. Obesity (Silver Spring) 2012;20(6):1179–1188; [CrossRef]
- Kammel A, Saussenthaler S, Jähnert M, et al. Early hypermethylation of hepatic Igfbp2 results in its reduced expression preceding fatty liver in mice. Hum Mol Genet 2016;25(12):2588–2599; [CrossRef]
- Yang Y, Smith DL, Keating KD, et al. Variations in body weight, food intake and body composition after long-term high-fat diet feeding in C57BL/6J mice. Obesity (Silver Spring) 2014;22(10):2147–2155; [CrossRef]
- Wu Y, Hu S, Yang D, et al. Increased Variation in Body Weight and Food Intake Is Related to Increased Dietary Fat but Not Increased Carbohydrate or Protein in Mice. Frontiers in Nutrition 2022;9:835536; [CrossRef]
- Zhang X-Y, Shen W, Liu D-Z, et al. Diversity of Thermogenic Capacity Predicts Divergent Obesity Susceptibility in a Wild Rodent. Obesity (Silver Spring) 2018;26(1):111–118; [CrossRef]
- Levin BE, Comai K, Sullivan AC. Metabolic and sympatho-adrenal abnormalities in the obese Zucker rat: effect of chronic phenoxybenzamine treatment. Pharmacol Biochem Behav 1981;14(4):517–525; [CrossRef]
- Schemmel R, Mickelsen O, Gill JL. Dietary obesity in rats: Body weight and body fat accretion in seven strains of rats. J Nutr 1970;100(9):1041–1048; [CrossRef]
- Mickelsen O, Takahashi S, Craig C. Experimental obesity. I. Production of obesity in rats by feeding high-fat diets. J Nutr 1955;57(4):541–554; [CrossRef]
- Levin BE, Finnegan M, Triscari J, et al. Brown adipose and metabolic features of chronic diet-induced obesity. Am J Physiol 1985;248(6 Pt 2):R717-723; [CrossRef]
- Chang S, Graham B, Yakubu F, et al. Metabolic differences between obesity-prone and obesity-resistant rats. Am J Physiol 1990;259(6 Pt 2):R1103-1110; [CrossRef]
- Clegg DJ, Benoit SC, Reed JA, et al. Reduced anorexic effects of insulin in obesity-prone rats fed a moderate-fat diet. Am J Physiol Regul Integr Comp Physiol 2005;288(4):R981-986; [CrossRef]
- Levin BE, Dunn-Meynell AA, Balkan B, et al. Selective breeding for diet-induced obesity and resistance in Sprague-Dawley rats. Am J Physiol 1997;273(2 Pt 2):R725-730; [CrossRef]
- Elmaleh-Sachs A, Schwartz JL, Bramante CT, et al. Obesity Management in Adults: A Review. JAMA 2023;330(20):2000–2015; [CrossRef]
- Bouchard C, Tchernof A, Tremblay A. Predictors of body composition and body energy changes in response to chronic overfeeding. Int J Obes (Lond) 2014;38(2):236–242; [CrossRef]
- Leibowitz KL, Chang G-Q, Pamy PS, et al. Weight gain model in prepubertal rats: prediction and phenotyping of obesity-prone animals at normal body weight. Int J Obes (Lond) 2007;31(8):1210–1221; [CrossRef]
- Nishikawa S, Yasoshima A, Doi K, et al. Involvement of sex, strain and age factors in high fat diet-induced obesity in C57BL/6J and BALB/cA mice. Exp Anim 2007;56(4):263–272; [CrossRef]
- Hwang L-L, Wang C-H, Li T-L, et al. Sex differences in high-fat diet-induced obesity, metabolic alterations and learning, and synaptic plasticity deficits in mice. Obesity (Silver Spring) 2010;18(3):463–469; [CrossRef]
- Ingvorsen C, Karp NA, Lelliott CJ. The role of sex and body weight on the metabolic effects of high-fat diet in C57BL/6N mice. Nutr Diabetes 2017;7(4):e261; [CrossRef]
- Bailey KR, Rustay NR, Crawley JN. Behavioral phenotyping of transgenic and knockout mice: practical concerns and potential pitfalls. ILAR J 2006;47(2):124–131; [CrossRef]
- Hu S, Togo J, Wang L, et al. Effects of dietary macronutrients and body composition on glucose homeostasis in mice. Natl Sci Rev 2021;8(1):nwaa177; [CrossRef]
- Hu S, Wang L, Yang D, et al. Dietary Fat, but Not Protein or Carbohydrate, Regulates Energy Intake and Causes Adiposity in Mice. Cell Metab 2018;28(3):415-431.e4; [CrossRef]
- Petro AE, Cotter J, Cooper DA, et al. Fat, carbohydrate, and calories in the development of diabetes and obesity in the C57BL/6J mouse. Metabolism 2004;53(4):454–457; [CrossRef]
- Lathe, R. The individuality of mice. Genes Brain Behav 2004;3(6):317–327; [CrossRef]
- As M, M S, A S. Hypothalamic phosphatidylinositol 3-kinase pathway of leptin signaling is impaired during the development of diet-induced obesity in FVB/N mice. Endocrinology 2008;149(3); [CrossRef]
- Huang Y, Osorio Mendoza J, Li M, et al. Impact of graded maternal dietary fat content on offspring susceptibility to high-fat diet in mice. Obesity 2021;29(12):2055–2067; [CrossRef]
- Armitage JA, Khan IY, Taylor PD, et al. Developmental programming of the metabolic syndrome by maternal nutritional imbalance: how strong is the evidence from experimental models in mammals? J Physiol 2004;561(Pt 2):355–377; [CrossRef]
- Holmes A, le Guisquet AM, Vogel E, et al. Early life genetic, epigenetic and environmental factors shaping emotionality in rodents. Neurosci Biobehav Rev 2005;29(8):1335–1346; [CrossRef]
- Vucetic Z, Kimmel J, Totoki K, et al. Maternal high-fat diet alters methylation and gene expression of dopamine and opioid-related genes. Endocrinology 2010;151(10):4756–4764; [CrossRef]
- Khera AV, Chaffin M, Wade KH, et al. Polygenic Prediction of Weight and Obesity Trajectories from Birth to Adulthood. Cell 2019;177(3):587-596.e9; [CrossRef]
Figure 1.
Hypothalamic-Neuron and Peripheral-Hormone Interactions in Energy Homeostasis. Energy balance and weight regulation involve complex central-peripheral interactions. In the hypothalamus, AgRP neurons promote appetite, while POMC neurons suppress it. They interact with each other to regulate the peripheral hormones like leptin, adiponectin, insulin, Ghrelin, PYY, GIP,and GLP-1 on energy balance.
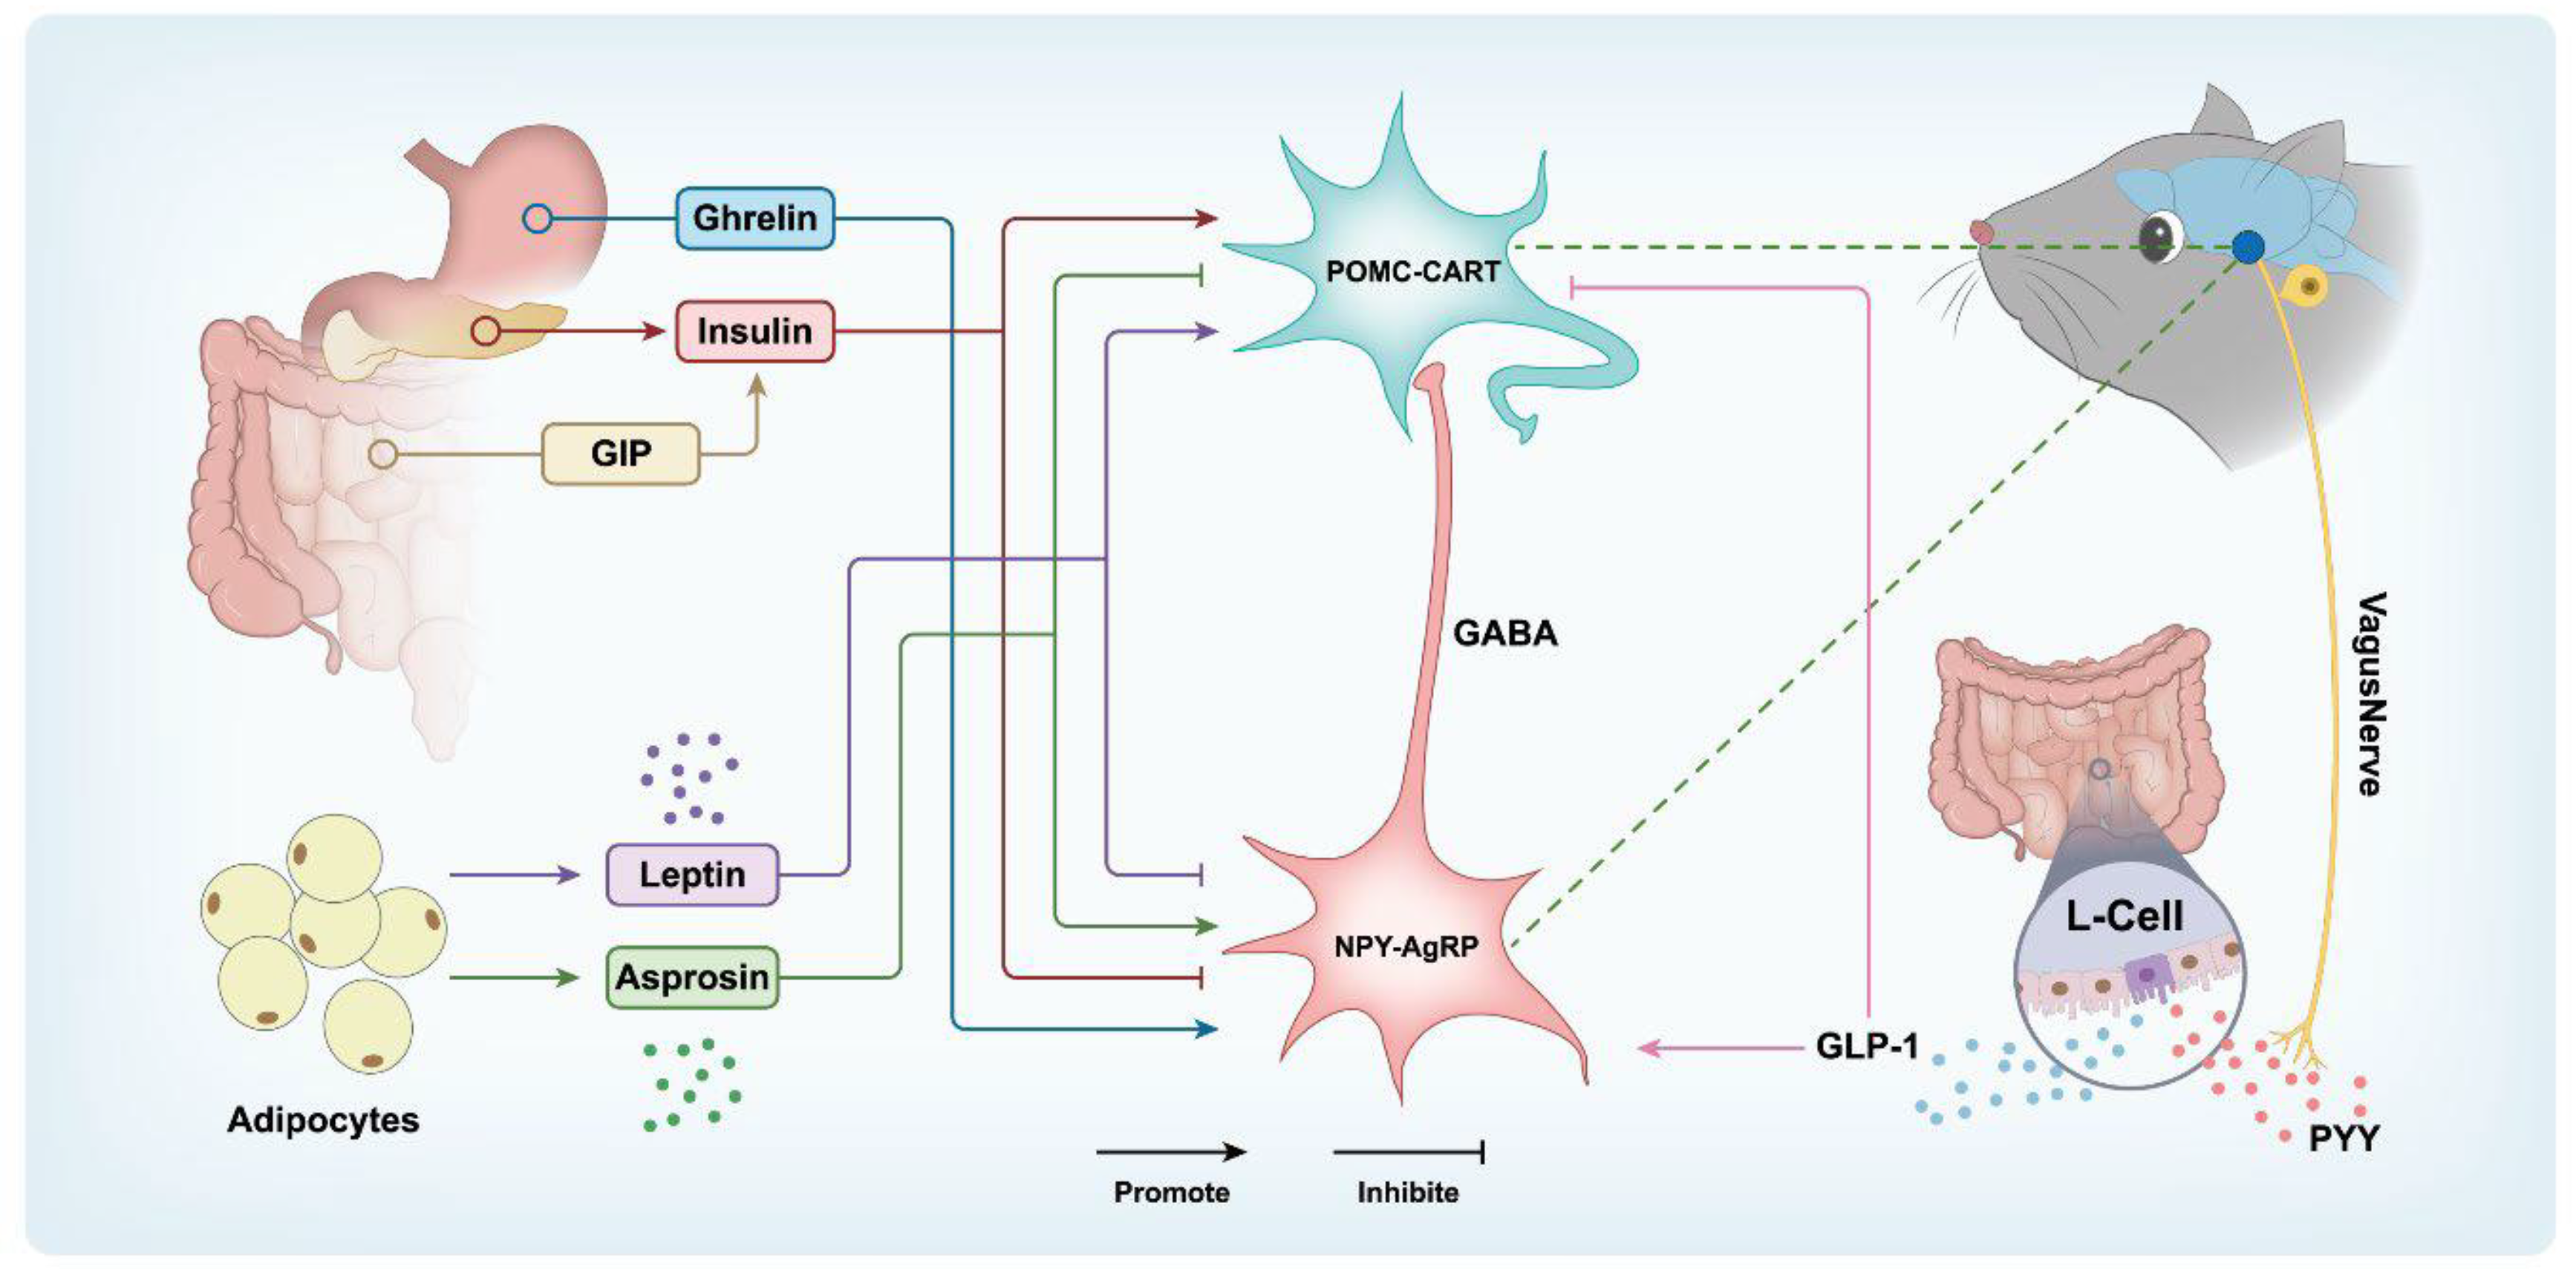
Figure 2.
Key Factors Influencing Energy Homeostasis and Obesity Heterogeneity. Obesity reflects a chronic energy imbalance in which calorie consumption is greater than energy expenditure and is influenced by a number of factors. Genetic background is a key factor influencing susceptibility to obesity, and the main reason for the increasing global prevalence of obesity may have developed in the current environment of overnutrition. Increased energy intake, decreased physical activity and lower energy expenditure due to changes in people's lifestyles can all lead to weight gain. Few people have paid attention to the individual phenotypic variation of these obese people, such as Body Composition; Blood Biochemical Parameters; Energy Metabolism; Feeding Preference.
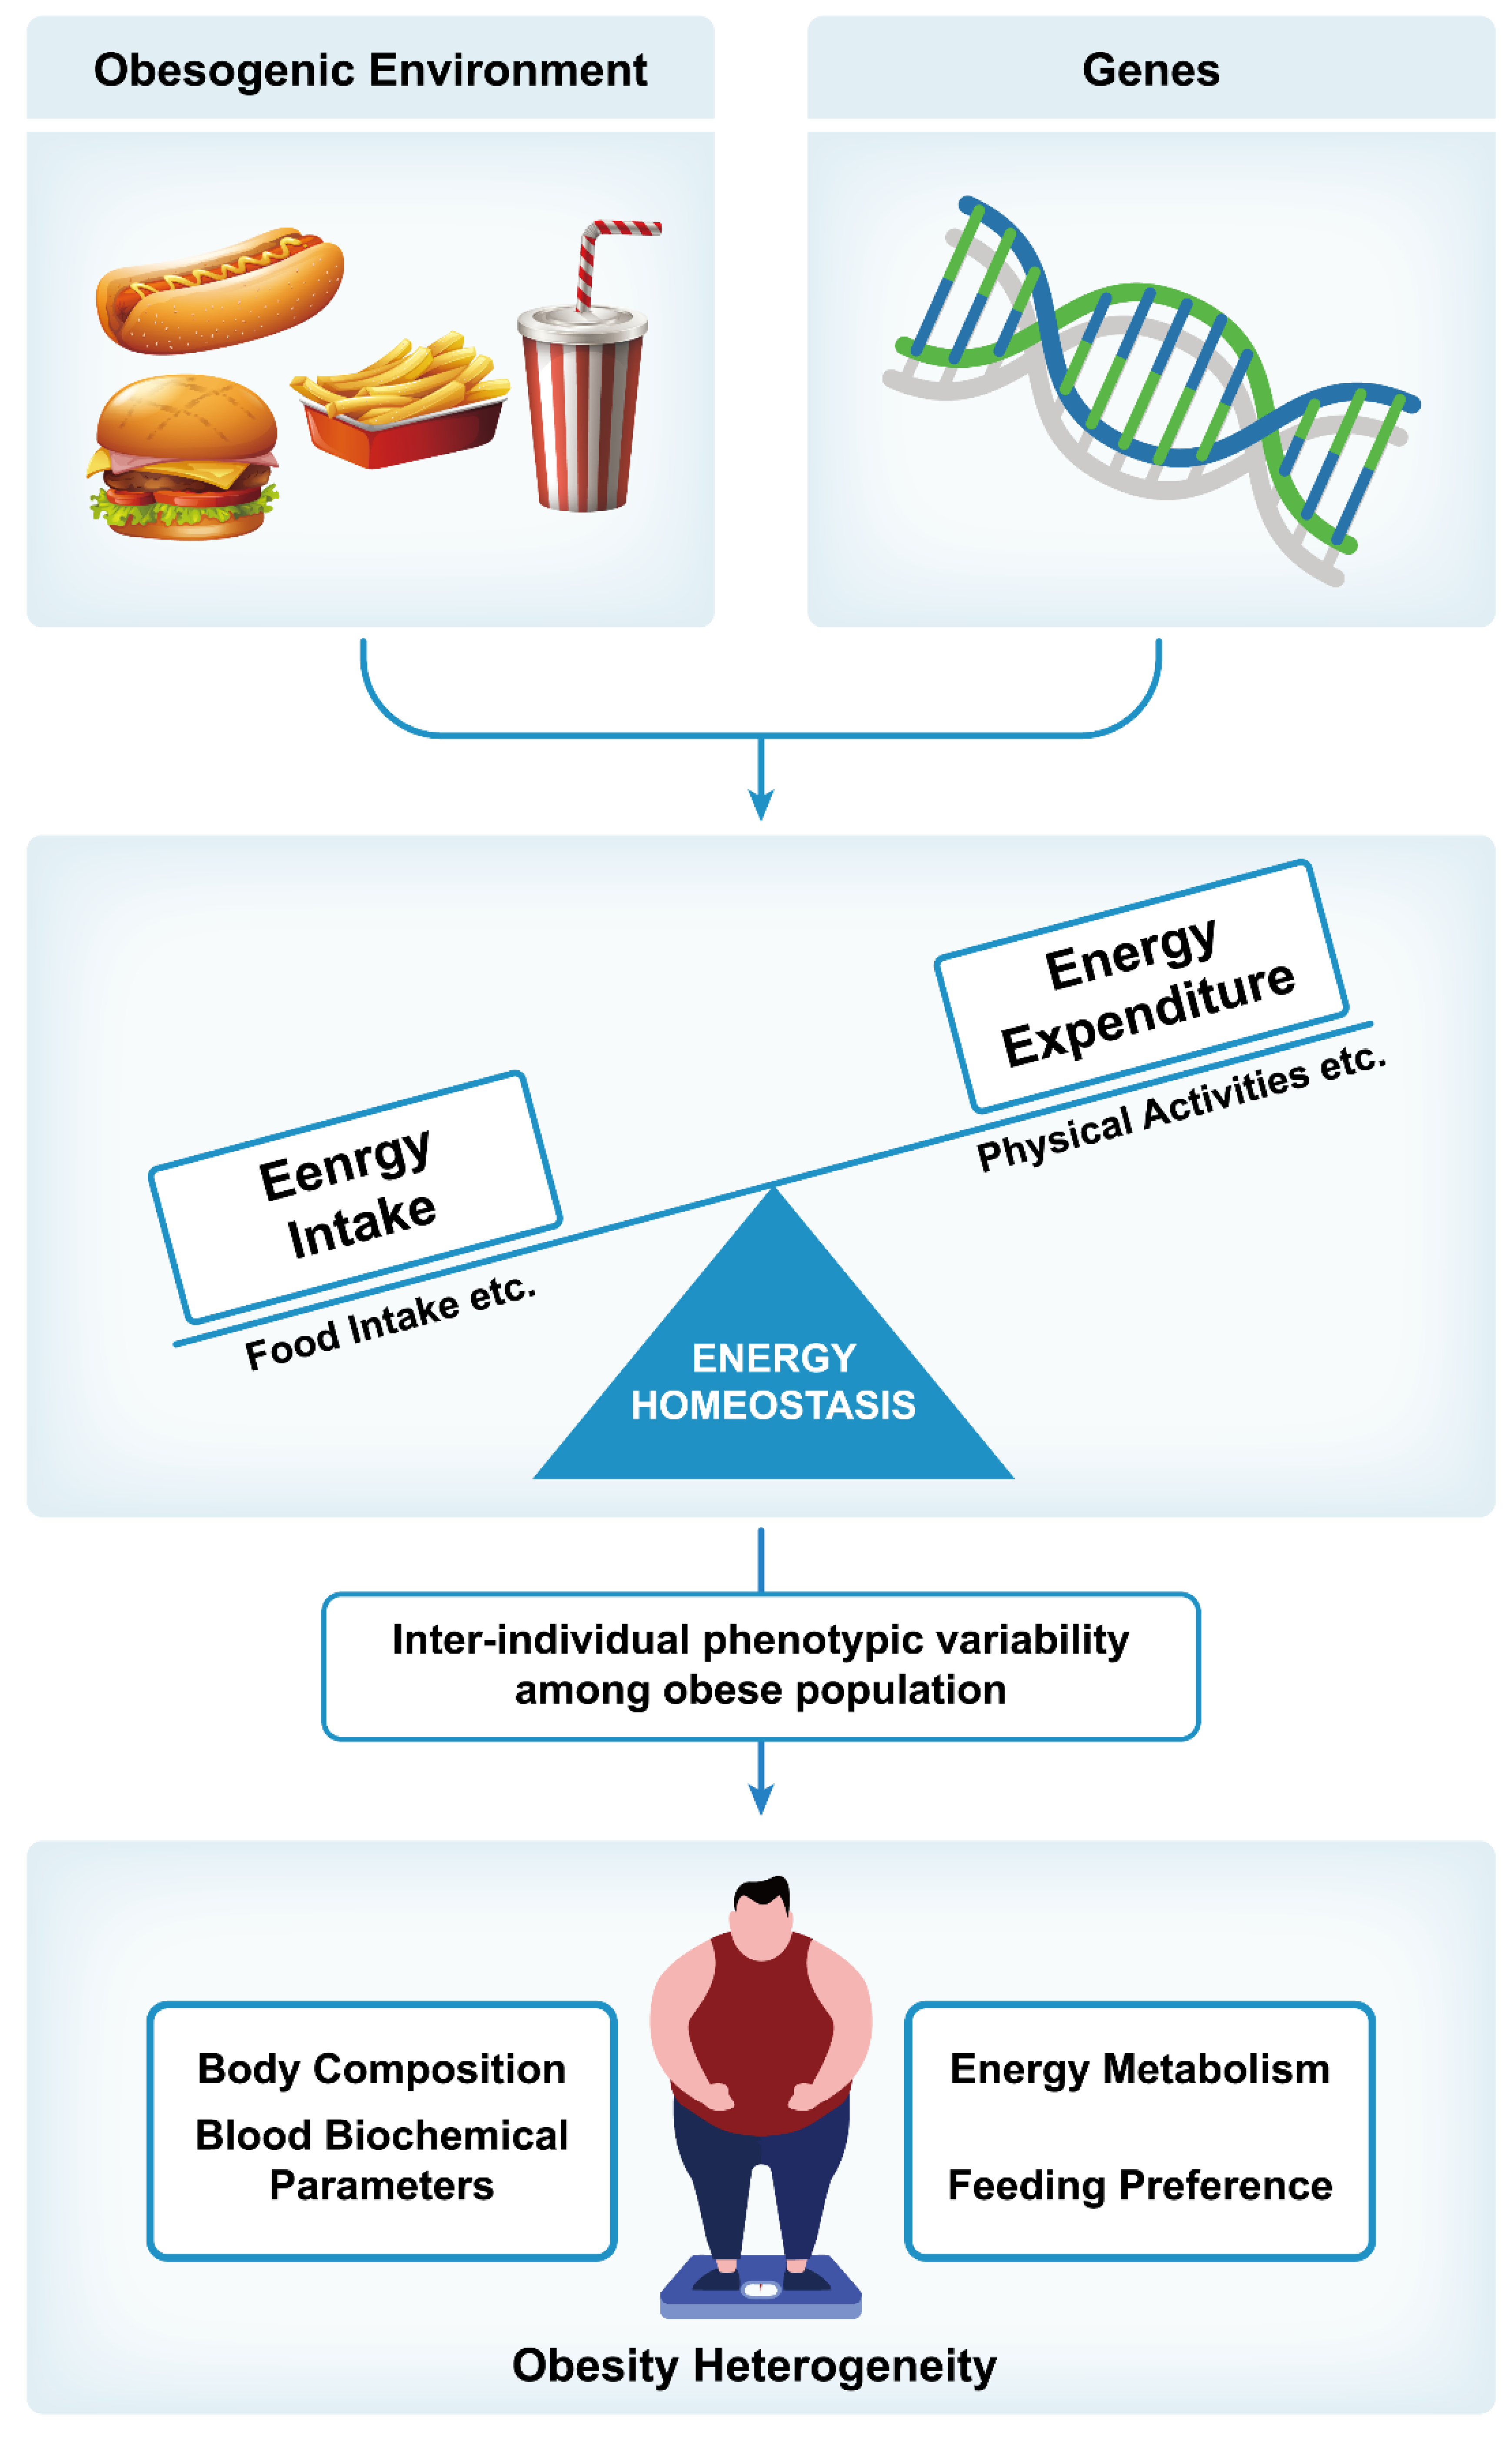
Figure 4.
Predictors of obesity heterogeneity in population and animals. Baseline characteristics within the population—such as FFM, muscle oxidative capacity, VO2max, androgen levels, and plasma leptin levels—can serve as predictors of future variations in weight gain. Baseline characteristics of C57BL/6J mice, including FM, FFM, PA, and EI along with the expression levels of SFRP5, MEST, and BMP3 genes in adipose tissue, can serve as non-genetic predictors of future differences in weight gain. Baseline NST was the strongest predictor of body weight gain during the high-calorie diet in voles.
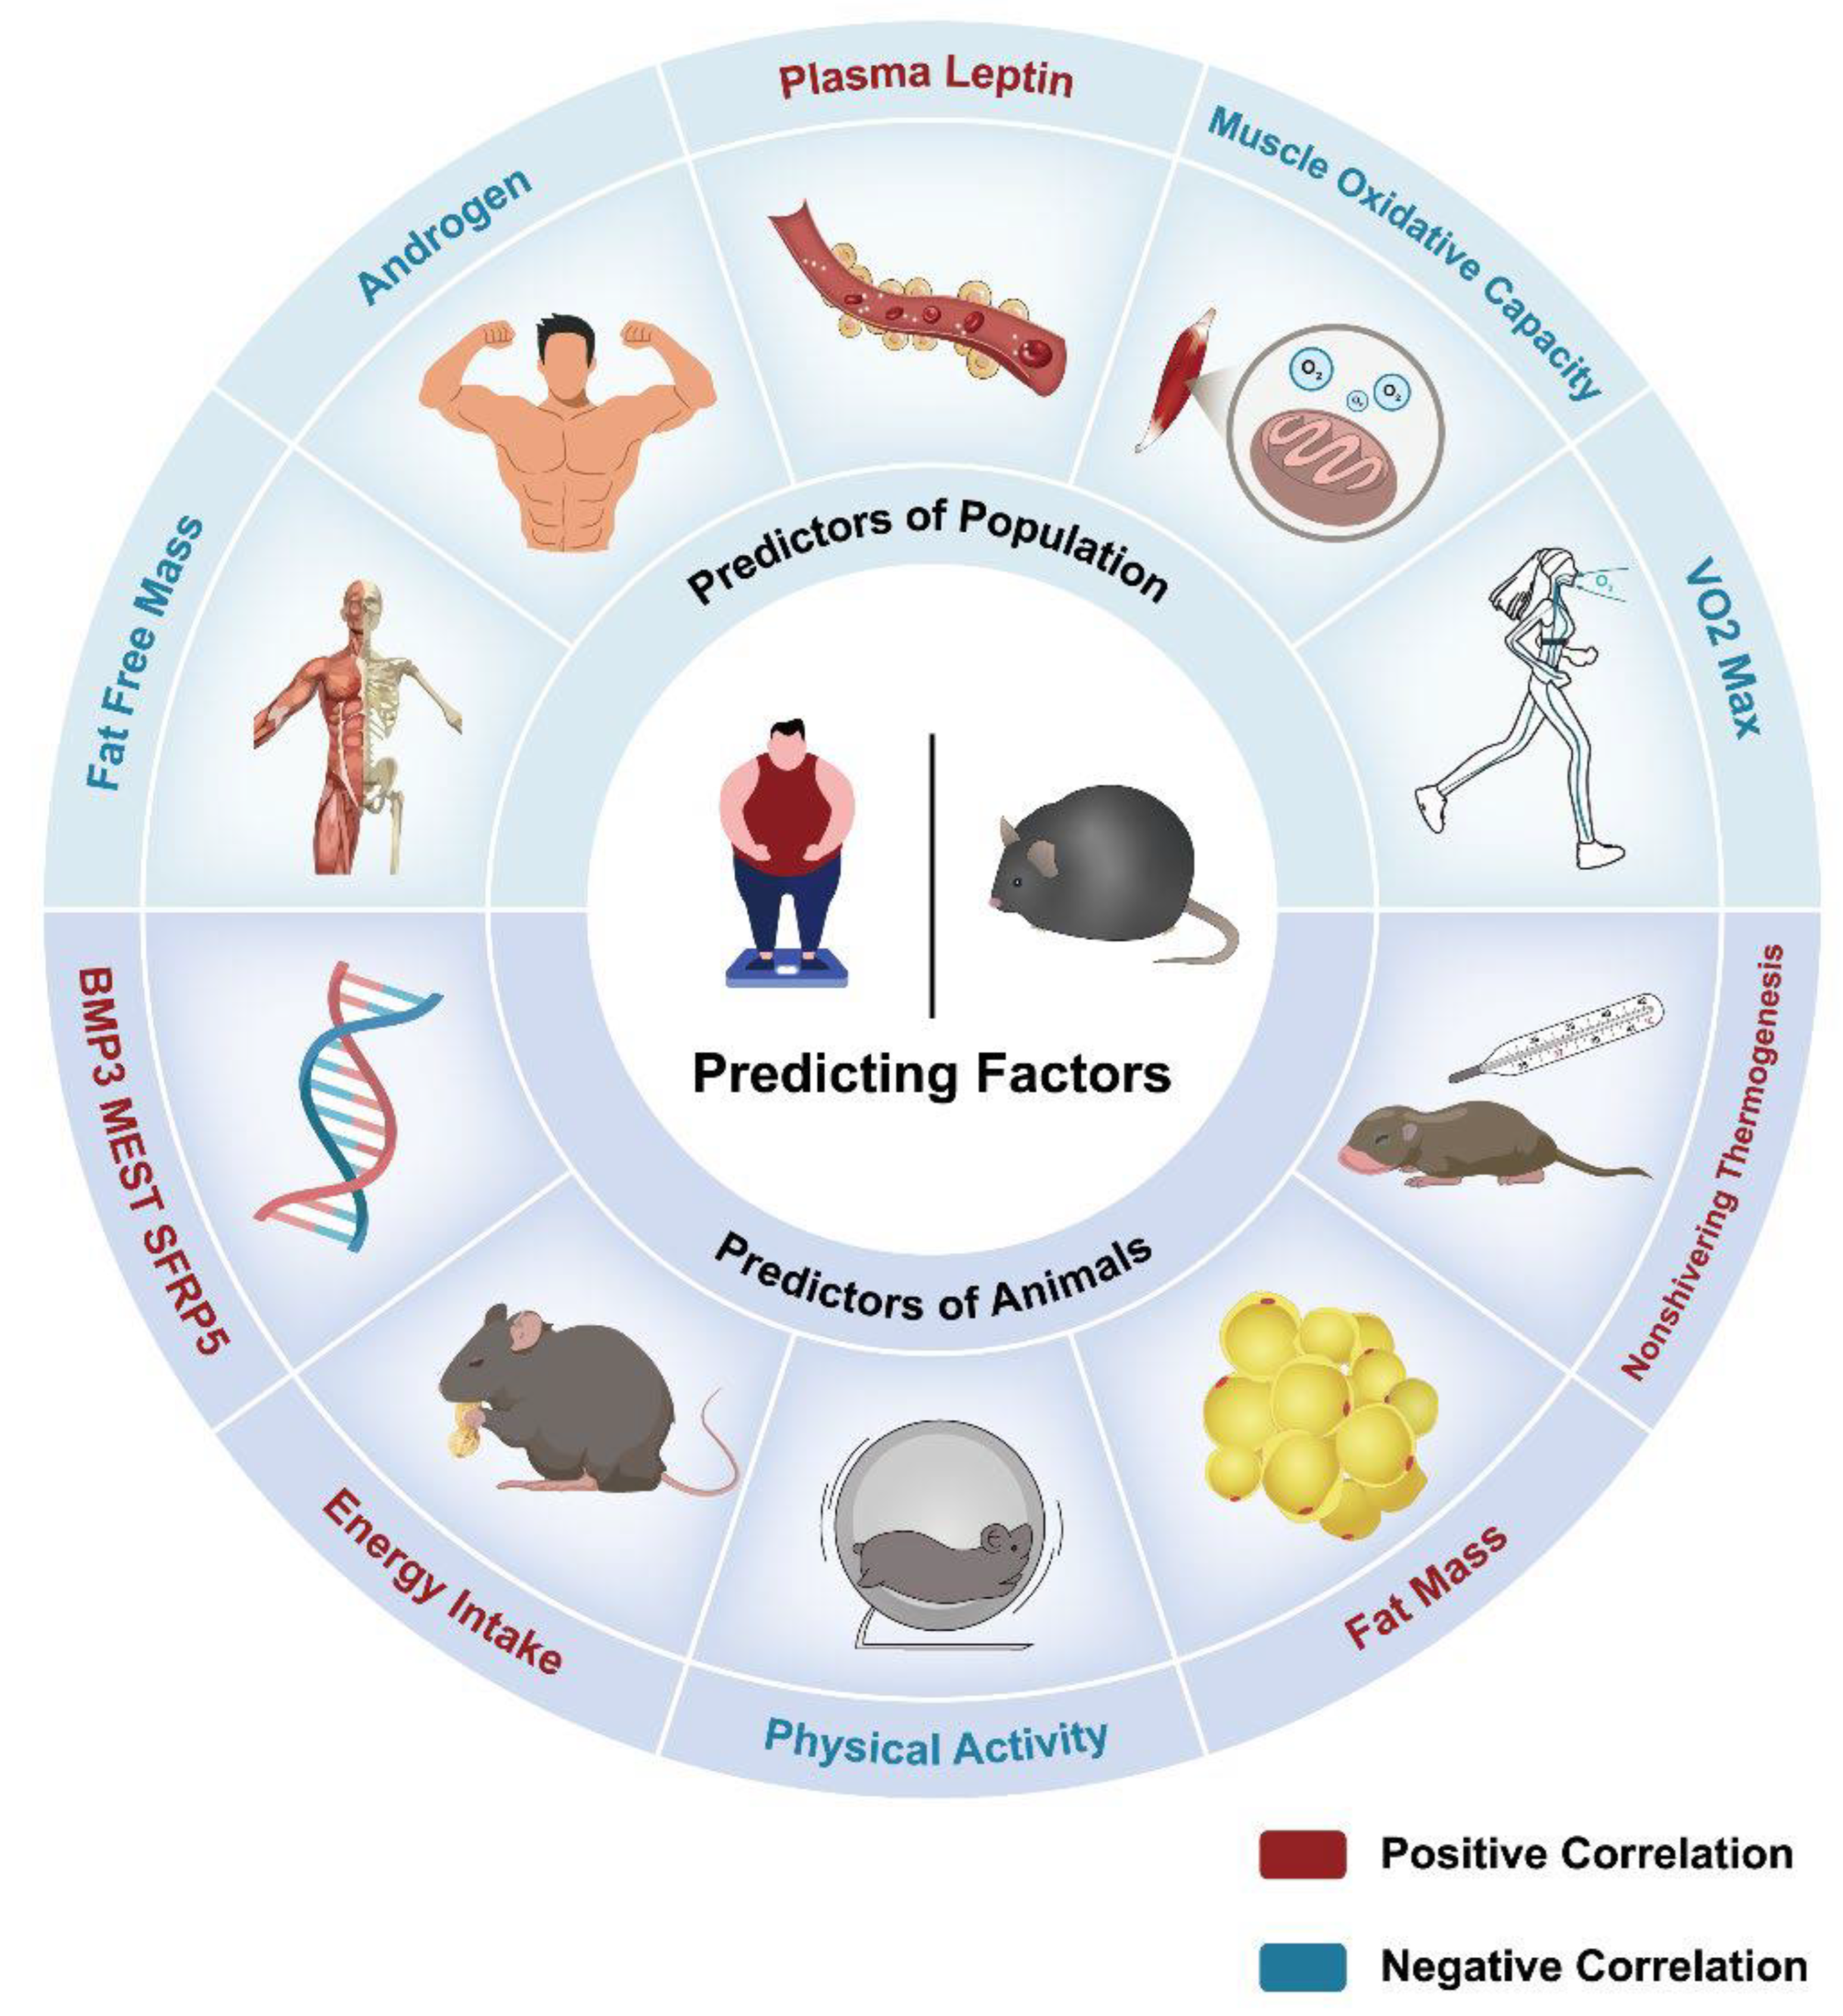
Figure 5.
The future application of predictors in obesity heterogeneity.
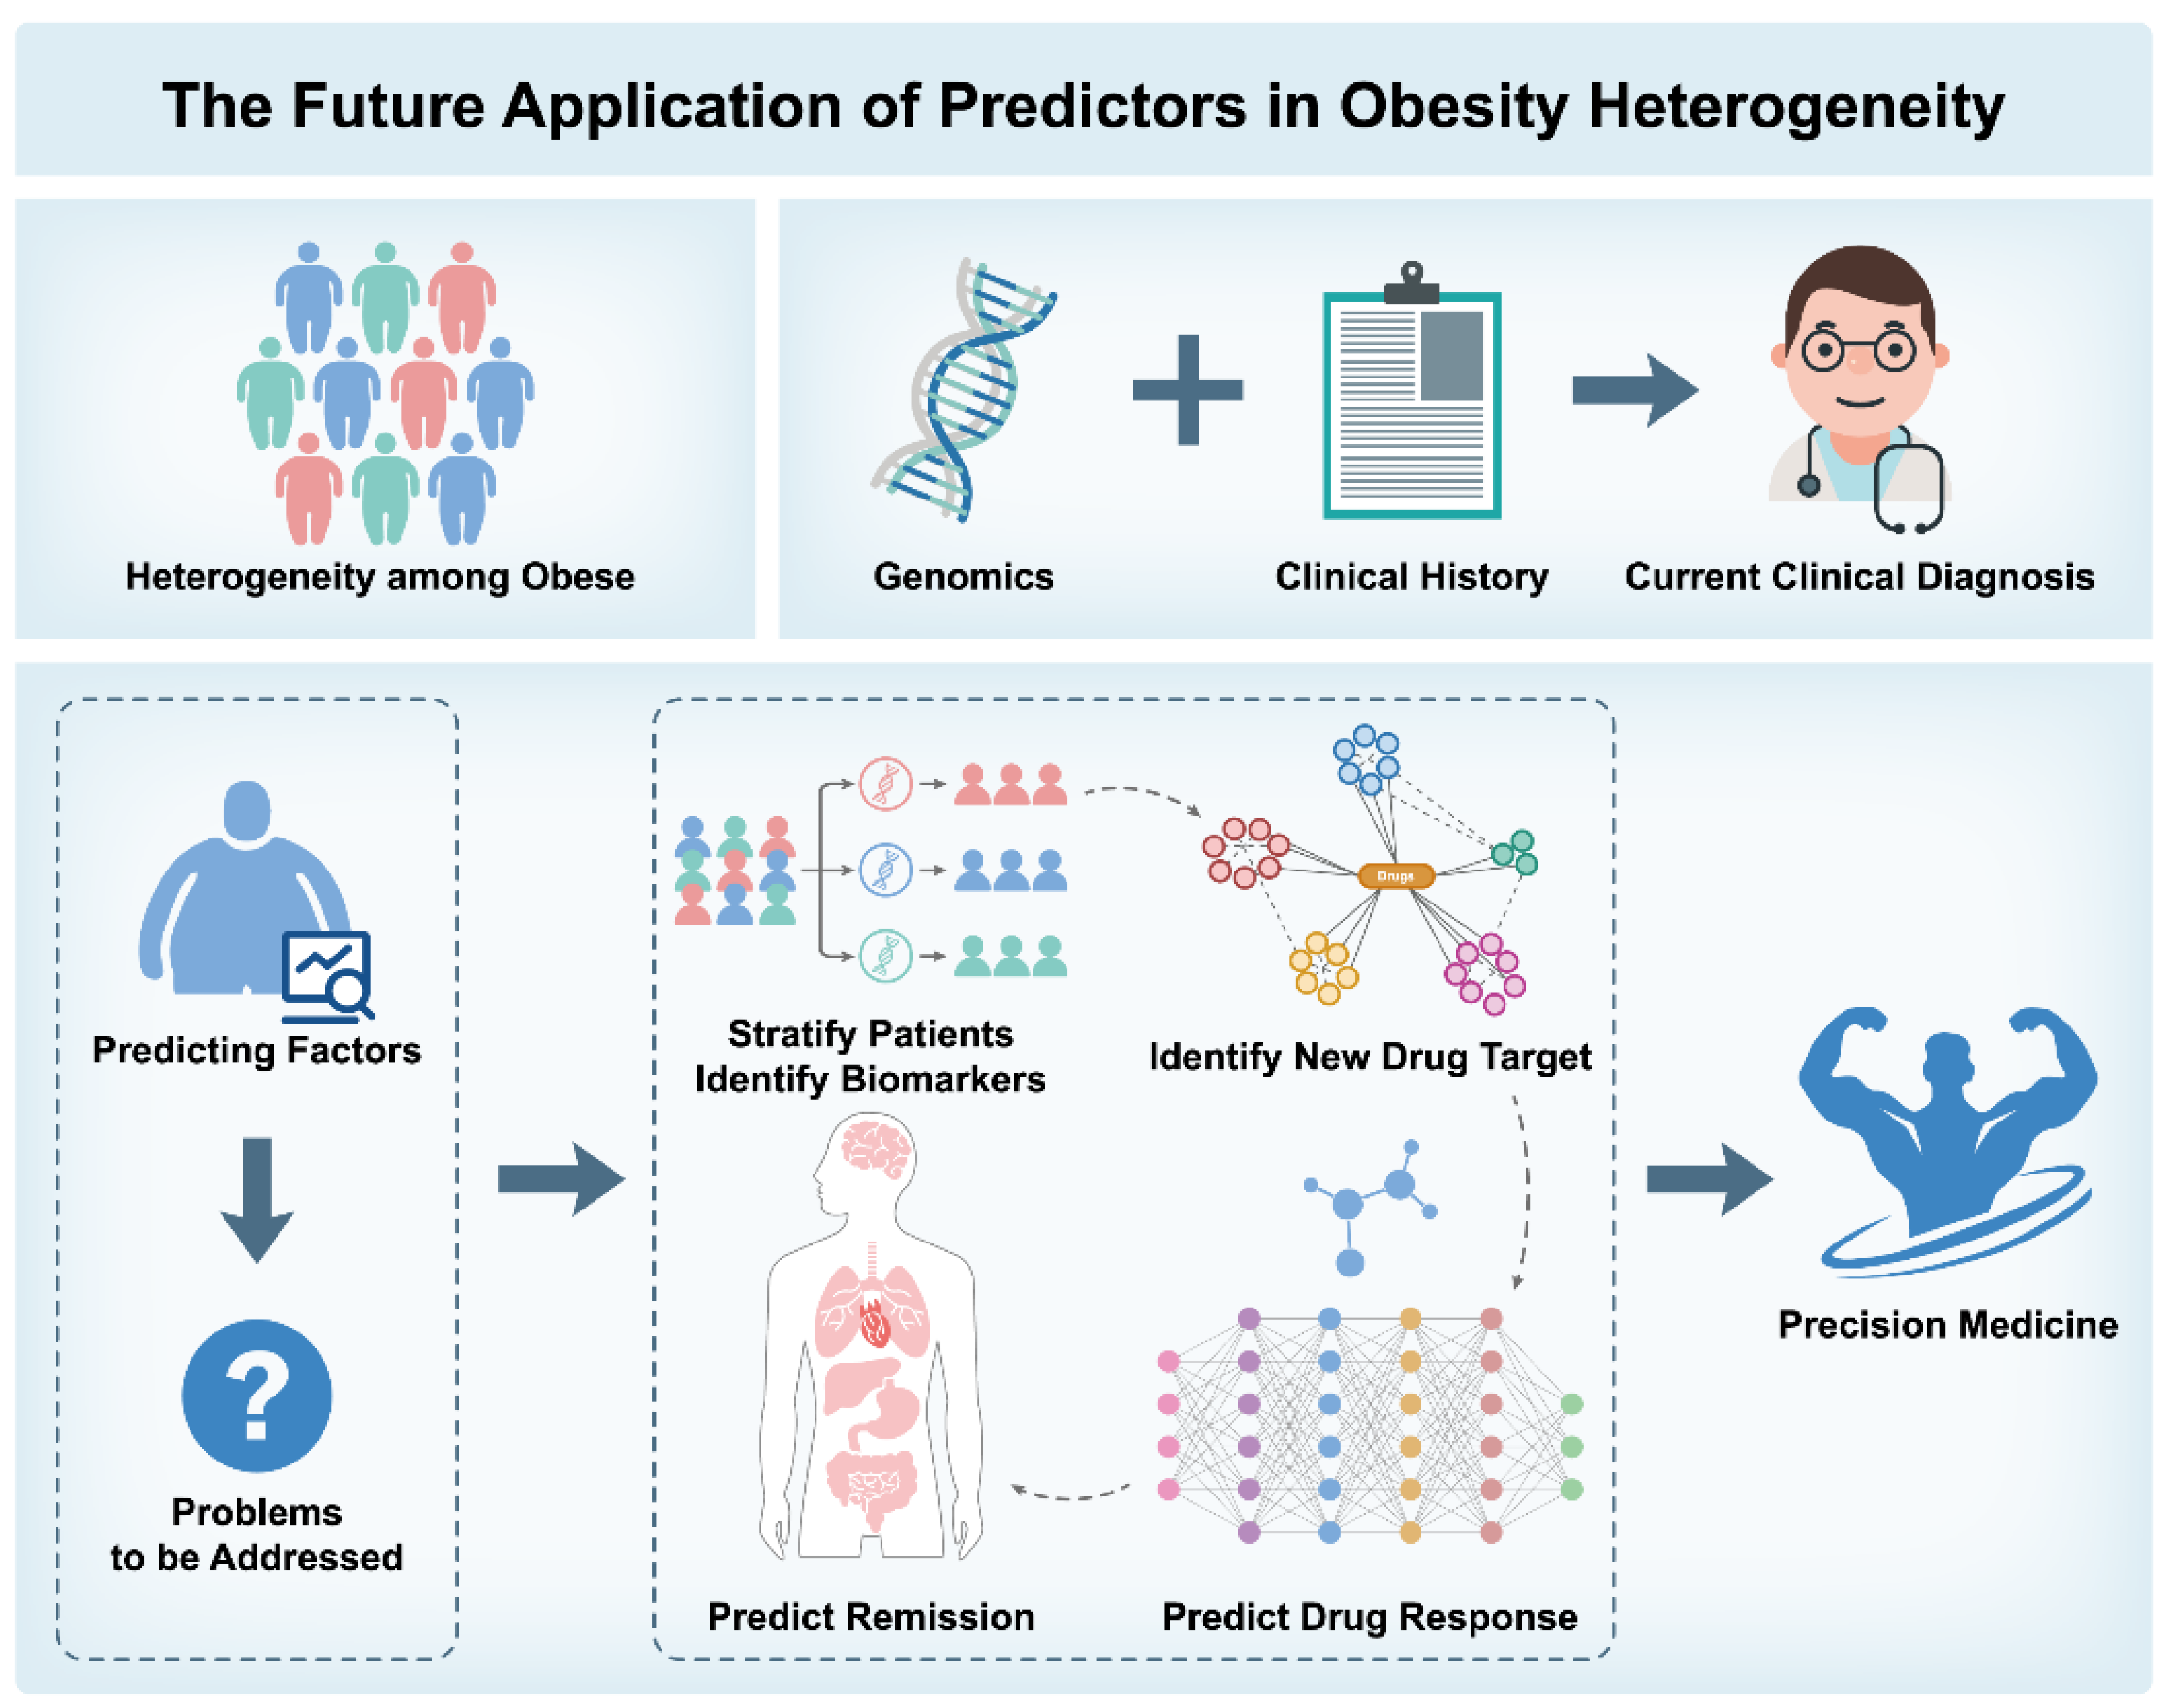
Table 2.
Predictors of nongenetic variability of obesity heterogeneity.
| Predictors | Relationship with BW change | Research object | Methods | Ref. |
|---|---|---|---|---|
| SFRP5 | Positive | Mice | Microarray analysis and qRT-PCR | [79] |
| MEST | Positive | Mice | Microarray analysis and qRT-PCR | [79] |
| BMP3 | Positive | Mice | Microarray analysis and qRT-PCR | [79] |
| Fat Mass | Positive | Mice | Transmitter and dual-energy X-ray absorptiometry | [80,82] |
| Physical Activity | Negative | Mice | Transmitter and dual-energy X-ray absorptiometry | [80] |
| Energy intake | Positive | Mice | HFD:4.73kcal/g; LFD:3.85kcal/g | [82] |
| Non-shivering thermogenesis | Positive | Voles | Induced by a subcutaneous injection of NE around the interscapular BAT | [84] |
| Plasma Leptin | Positive | Population | Specific enzyme-linked immunosorbent assay | [93] |
| Muscle Oxidative capacity | Negative | Population | Enzyme Activity Measurement | [93] |
| Maximal oxygen uptake | Negative | Population | Open gas circuit system | [93] |
| Androgen | Negative | Population | Ethanol extraction, enzymatic hydrolysis, Sephadex chromatography. | [93] |
| Fat Free Mass | Positive in mice Negative in population |
Mice and Population | Transmitter and dual-energy X-ray absorptiometry;Standardized equations for body weight and percentage of fat mass | [80,82,93] |
Disclaimer/Publisher’s Note: The statements, opinions and data contained in all publications are solely those of the individual author(s) and contributor(s) and not of MDPI and/or the editor(s). MDPI and/or the editor(s) disclaim responsibility for any injury to people or property resulting from any ideas, methods, instructions or products referred to in the content. |
© 2025 by the authors. Licensee MDPI, Basel, Switzerland. This article is an open access article distributed under the terms and conditions of the Creative Commons Attribution (CC BY) license (http://creativecommons.org/licenses/by/4.0/).
Copyright: This open access article is published under a Creative Commons CC BY 4.0 license, which permit the free download, distribution, and reuse, provided that the author and preprint are cited in any reuse.


