
Submitted:
09 April 2025
Posted:
11 April 2025
You are already at the latest version
Abstract
Microplastic contamination in agricultural soils has become a growing concern due to its potential impact on soil quality and ecosystem health. This study investigates the abundance, shape, and vertical distribution of microplastics in agricultural soils under different tillage practices. A split-split-plot experimental design was used at two sites, comparing conventional tillage (ST), conservation tillage (deep and shallow), and fertilization treatments. Results indicate that microplastics were present in all soil samples, with significantly lower concentrations in conservation shallow tillage (CTS) compared to deep conservation tillage (CTD). Vertical distribution was found to be homogeneous in ST and CTS but heterogeneous in CTD, suggesting an influence of soil disturbance levels on microplastic migration. Fertilization significantly affected microplastic accumulation at one site, supporting the hypothesis that inorganic fertilizers contribute to microplastic input as well. These findings highlight the need for soil management practices that mitigate microplastic accumulation and mobility.
Keywords:
soil microplastics
; vertical distribution
; agricultural management practices
; fertilization
1. Introduction
Microplastics research in soil ecosystems has been in focus over the last few years since soils are recognized as both a major sink and source of microplastics [1]. Soil microplastics MPs contamination was estimated to be four to 23 times greater than marine MPs contamination, which indicates an obvious need for further understanding of terrestrial MPs pollution [2].
Once incorporated into the soil, microplastics can change their physical, chemical, and biological properties, thereby altering soil functions and services. Various studies have shown that MPs particles in soil alter soil bulk density [3], aggregate stability [4], micro- and macropores ratio [5], water permeability [6], rate of moisture evaporation and water retention capacity [7]. Microplastics particles can adsorb and desorb organic pollutants [8], heavy metals [9], and antibiotics [10], and release toxic chemical additives in the surrounding soil, and potentially in other ecosystem compartments [11]. In addition to adversely affecting soil properties, microplastics can have a negative influence on soil microorganisms [12], flora [13], and fauna [14].
Corradini et al. [15] found that agricultural fields were most polluted and that agricultural activities could be one of the main sources of soil MPs pollution. In their systematic review, Büks and Kaupenjohann [16] have shown that the concentrations of MPs particles in agricultural fields depend on different land use and the application of different agricultural management practices.
The main input pathways of microplastics in agricultural soils are atmospheric deposition, littering, tire abrasion, surface runoff, sewage sludge and other fertilizers, plastic mulching, irrigation, and flooding [17,18]. Although previous studies investigated the distribution, sources, and toxicity of microplastics, research gaps related to the fate of soil microplastics still exist. One major concern is the potential vertical migration of microplastics to groundwater. Generally, it has been established that the vertical and horizontal transport of microplastics in the soil can be influenced by several factors, including soil biota, soil properties such as soil macropores, soil aggregation and cracking, precipitation, and agricultural practices such as plowing and harvesting [14]. O’Connor et al. [19] researched the influence of microplastics particle size and wet-dry cycles on the vertical migration rate of microplastics. They found that the average 100-year potential penetration distance of microplastics is 5.24 m, and that smaller size particles had a greater potential for downward movement under wet-dry cycles. Similarly, Gao et al. [20] found that the type of polymer, surface hydrophobicity, and particle size had the greatest correlation with MPs mobility. It has also been shown that different crop root systems could have an influence on MPs mobility in the soil and that some of the root systems could contribute to the upward movement of microplastics in the soil profile [21].
Generally, the spatial distribution of soil microplastics in agricultural landscapes is assumed to be highly heterogeneous due to the influence of the cropping system and management practices [22]. Rillig et al. [23] hypothesized that plowing could push microplastics from the surface of the soil to a single layer at the plowing depth, and that shallow harrowing could have a mixing effect resulting in the distribution of microplastics throughout the whole tillage layer.
While previous studies have identified agricultural activities as a major source of soil MPs, significant knowledge gaps remain regarding the vertical migration of MPs and the influence of specific agricultural practices, such as tillage and fertilization, on their distribution. This study aims to address these gaps by investigating the abundance, shape, and vertical distribution of MPs under different tillage and fertilization regimes. We hypothesize that conservation tillage, particularly shallow tillage, will reduce MP abundance and limit vertical migration, while fertilization, especially with organic amendments, will increase MP contamination.
2. Materials and Methods
2.1. Site Description, Experimental Design, and Treatments
Two experimental split-split-plot fields are located near Cacinci, Croatia (Long. 17.863508 E, Lat. 45.6134353 N, Altitude 117 m) and Krizevci, Croatia (Long. 16.558217 E, Lat. 46.0278038 N, Altitude 140 m). The experimental field in Cacinci was traditionally a cropland, while the experimental field in Krizevci was a grassland without disturbance for at least 15 years prior to being adapted to the experimental split-split-plot. The experimental sites also differ in soil properties. The samples are taken across the experimental site, from a depth of 0-30 cm and homogenized in average samples. Some of the measured parameters are summarized in Table 1.
Both plots had the same experimental design. Namely, three types of tillage systems: conventional tillage system (ST), conservation tillage system-deep (CTD), and conservation tillage system-shallow (CTS). Within the ST, standard plowing as a tillage practice in which plowing was conducted using a reversible moldboard plow at the depth of 30 cm; within the CTD, a subsoiler with a star roller was utilized as a primary tillage treatment at the depth of 30 cm, and within the CTS, the subsoiler with the star roller at the depth of 5-10 cm was utilized as a primary tillage treatment. In addition, they differed in the crop cover residues management. Namely, CTD and CTS had minimum permanent crop cover residues of a minimum of 30% and 50%, respectively, left on the soil surface, counted after sowing. Furthermore, each tillage system was divided according to the treatment used for the soil conditioning. Different treatments included liming (with calcium oxide according to recommendation) - half of each experimental parcels were subjected to liming and the other half not, and fertilization. Fertilization includes a treatment with a recommended quantity (NPK, urea and CAN) and a treatment with a 50% of the recommended fertilizer amount. Each fertilization treatment was further subdivided into two subplots: one with the application of Geo2 (biophysiological soil activator) and one without. The general scheme of split-split-plot design used in our study is shown in Figure 1. Plots were separated with 2 m wide spacing, and subplots were separated with 1 m wide spacing.
2.2. Soil Sampling and Sample Preparation
Soil was sampled using a single root auger (Ø 8 cm, 15 cm; Eijkelkamp Soil & Water). Within the plots, 10 random locations were selected, and the soil was sampled at three depths at each location: 0-10 cm, 10-20 cm, and 20-30 cm. These depths were chosen based on the common depth of the plow layer in agricultural fields. The total number of soil samples at both experimental plots was 180. Each sample was kept at room temperature in the dark until sample preparation and analysis.
Prior to the analysis of microplastic (MP) content, soil samples were dried at room temperature for 24-48 h, crushed with a pestle and mortar, and further dried to a constant mass. After drying, soil samples were weighed, and 5 ± 0.01 g of soil was transferred to a 250 ml Erlenmeyer flask.
2.3. Microplastics Extraction
The protocol included soil organic matter digestion, density separation, filtration, visual identification of isolated microplastics, and further quantitative and qualitative analysis. In the first step, soil organic matter was digested using hydrogen peroxide 30% w/v, according to Hurley et al. [24]. Namely, 10 ml of hydrogen peroxide was repeatedly added into an Erlenmeyer flask with a weighted soil sample at the temperature of 60°C until foaming ceased. The samples were then dried at 60°C for 24h.
After drying, soil microplastics were extracted using density separation with an aqueous solution of 5M zinc(II)chloride. While this method is widely used due to its efficiency in isolating MPs from complex matrices, it has limitations. For instance, certain high-density polymers may not be fully recovered, and the risk of contamination during sample processing must be carefully managed. To minimize contamination, all equipment was thoroughly cleaned in each iteration of laboratory analyses. 50 ml of ZnCl2 was mixed with a dried soil sample in an Erlenmeyer flask on a magnetic stirrer for 10 minutes. After mixing, the content of the flask was transferred into a cylinder with a top-overflow adapter according to Vermeiren et al. [25]. Erlenmeyer flask was rinsed with 30 ml ZnCl2 solution, and the content of the flask was again transferred into the same measuring cylinder. The contents of the measuring cylinder were stirred using the magnetic stirrer for 10 minutes and left to sediment for 2 hours afterward. Following sedimentation, a ZnCl2 solution using a wash bottle was added to the sedimentation column using the top-overflow method. The top part of the sedimentation column was rinsed with ZnCl2 solution until no particles were visible, and the rinsing solution was collected into a 100 ml beaker. Afterward, the sedimentation and top-overflow processes were repeated. The beaker content was vacuum filtered, and filters containing microplastics were dried for 24 h before the visual inspection using a stereomicroscope. Microplastics were isolated from filter paper according to the criteria from Norén [26].
Isolated particles were transferred from the filter to the microscope slides, particles were counted and photographed using the DP-M17 USB microscope camera (9 MP) for further qualitative analysis. The qualitative analysis included individual MP shape determination and size measurement regardless of polymer type of individual particle. The qualitative analysis has been conducted using ImageJ 1.5 [27]. We have classified microplastic particles from our study into two categories: fragments, which include irregularly shaped particles, and fibers, which include thread-like particles. Size parameters that were measured in the qualitative analysis are maximum Feret diameter and 2D area for fragments, and length for fibers. Isolated particles were stored using two folded microscope slides wrapped with parafilm.
2.4. Data Analysis
Quantitative results were reported as the number of microplastic particles per mass unit of dry soil (items kg-1), calculated from an initial 5 g sample. Qualitative results included particle shape (fragments or fibers), Feret diameter and 2D area of fragments, and fiber length. Statistical analyses were performed in the R programming environment [28] using a suite of methods: repeated measures one-way ANOVA, pairwise t-tests with Bonferroni adjustment, non-parametric Friedman rank-sum tests, Wilcox post hoc tests, Chi-squared tests, and multiple linear regression. Bayesian regression models were also employed to assess credible intervals and validate frequentist findings.
The influence of liming and fertilization on microplastic abundance was evaluated using ANOVA and linear regression. Differences in fragment-to-fiber ratios across soil depths and plots were tested with Chi-squared tests. The fragment ratio (Rf) was calculated as:
where Nfra is the number of fragments and Nfib is the number of fibers in a sample. Rf ranges from 0 (all fibers) to 1 (all fragments). This ratio was further analyzed using ANOVA and multiple linear regression to assess the effects of tillage and soil depth.
Rf =Nfra/(Nfra+Nfib),
3. Results
3.1. Effect of Site, Soil Characteristics and Vertical Distribution of Microplastic Particles
All samples contained microplastics (MPs) in various quantities. The total quantity of MPs did not differ between experimental sites (p = 0.2185; Mann-Whitney U test) (Figure 2). Bayesian factor analysis also showed weak evidence of a significant difference between the sites. A minimal number of MPs per kg of soil was 200, average 1560, and a maximum number of 7400 MP per kg of soil (at Cacinci site).
Physico-chemical parameters analyzed for MPs variability included soil texture (sand, silt, clay), soil pH (H2O), and soil organic carbon (SOC). The summary of effects is given in Table 2. Namely, in a long-term cultivated site Cacinci, there was no significant effect of any of the analyzed parameters. On the other hand, in Krizevci site, which was not plowed for over a decade prior to the experiment, there was a negative correlation between the variability in MPs size and the amount of soil organic carbon. Soil texture (sand, silt, clay) might play a role, but results are not conclusive (p ≈ 0.048).
The analysis showed that the number of MPs between soil layers (B - bottom, M- middle, T- top) was not statistically different at both experimental sites (Figure 3).
Additionally, MPs size did not significantly differ (p > 0.05) between soil layers when both sites were compared. However, at Krizevci site regression analysis suggests higher size variability, but not statistically significant, in the middle and topsoil layers compared to the bottom (Table 3).
3.2. Tillage Effect on Microplastics
To analyze the effect of tillage type and location on microplastic quantity in soil a combination of frequentist and Bayesian methods were applied. The ANOVA results indicate a statistically significant difference among tillage types (ST, CTD and CTS) (F (2,145) = 7.597, p = 0.0007), but not the impact of location. Tukey’s post-hoc test further reveals that CTS has significantly lower microplastic content compared to CTD (p =0.0005), while ST type had a higher microplastic level then CTS but not significantly (p = 0.0326) (Figure 4a). Bayesian regression also confirmed that CTS has a negative effect on microplastic contamination (Figure 4b).
Analysis of vertical distribution of MP shows that the mean abundance within CTS and ST plots is relatively homogenous and within CTD plots relatively heterogeneous at both sites (Figure 5). On the Cacinci site, there were no statistically significant differences in MPs abundance in different soil layers within ST (p=0.598) and CTS plots (p=0.872), while within the CTD plot middle layer (10-20 cm) and bottom layer (20-30 cm) differed significantly (p=0.0038). Similarly, on the Krizevci site, there were no statistically significant differences in microplastics abundance between different soil profile depths within ST (p=0.705,) and CTS plots (p=0.570), while within CTD plot repeated measures ANOVA test showed significant difference between middle (10-20 cm) and bottom (20-30 cm) layer, and also top (0-10 cm) and bottom (20-30 cm) layer (p=0.042).
3.3. Fertilization Effect on Microplastics
A two-way ANOVA indicates that fertilization significantly affects microplastic accumulation (p = 0.0332). The highest mean particle count was found in FR treatment in Cacinci (2233 ± 1534 particles). At the Cacinci site the results show that different fertilization has a significant impact on microplastic contamination (ANOVA, F (3.76) = 3.438, p = 0.021) (Table 4). Pairwise comparisons indicate (Table 5) that FR significantly increases contamination compared to FD, while GFD significantly reduces contamination compared to FR. On the other hand, the results from the Krizevci site indicate that fertilization treatments do not have a statistically significant effect on microplastic contamination (Table 4, 5).
3.4. Types of Microplastic Particles
Results indicate significant differences in MPs type between locations but not between soil layers. Krizevci has a dominant proportion of fiber microplastic (90-96%), whereas Cacinci has a more balanced distribution of fiber and fragment type MPs (45-57%). Hence, two experimental sites significantly differed in MPs fragment/fiber ratio (p<0.001).
At the Cacinci site, only within CTD plots a significant difference in fragment/fiber ratio was noticed (p=0.0007). A strong positive association was found between fragments and the top layer (0-10 cm), and also fibers and the bottom layer (20-30 cm). On Krizevci site there were no statistically significant differences in fragment/fiber ratio found between different tillage treatments.
4. Discussion
Our research utilized a split-split-plot design to investigate the effects of agricultural practices on soil microplastics, dividing fields into subplots with varying tillage practices, fertilization regimes, and crop cover residues. This approach allowed us to examine how these factors influence the occurrence, distribution, and shapes of microplastics across two distinct experimental sites: Cacinci and Krizevci. Unlike previous studies that relied on controlled environments such as porous media columns or incubation setups [19,20,29] this experimental design ensures an effective assessment of the relative roles of various factors influencing the occurrence and vertical distribution of MPs in soil.
4.1. Tillage and Microplastics Distribution
The differences in vertical distribution of MPs in soil in our experiment can be interpreted with the tillage type of each plot, with ST and CTS plots showing homogenous distribution within 30 cm of soil, and CTD heterogeneous. Rillig et al. [23] hypothesized that plowing could lead to the presence of microplastics in a single soil layer at plowing depth. However, our results suggest that plowing leads to the mixing of the plowed soil layer, a consequence of which is the homogeneous vertical distribution of soil microplastics. Intensive mechanical action disrupts soil aggregates and redistributes particles, preventing stratification. Similarly, conservation tillage with shallow cultivation (CTS) exhibited a homogeneous MPs distribution, but with the lowest overall abundance among tillage types. The minimal disturbance—achieved through shallow cultivation and retention of substantial crop residue cover—preserved soil structure and limited MPs incorporation. Crop residues likely act as a barrier, reducing the deposition of airborne microplastics [30] and stabilizing the soil surface against erosion or infiltration-driven particle movement. In contrast, conservation tillage with deep cultivation (CTD) showed a heterogeneous distribution, with significantly higher MPs abundance in the upper (0-10 cm) and middle (10-20 cm) layers compared to the bottom (20-30 cm) layer. This pattern is linked to non-inversion tillage using a subsoiler with a star roller and a spike harrow with a string roller. These tools loosen soil without inverting it, sorting larger aggregates to the surface and potentially compacting lower layers, which restricts MPs penetration [31]. The higher abundance in upper layers may also reflect the ‘first-flush’ phenomenon [19], where initial water infiltration mobilizes microplastics downward but not deeply enough to reach the 20-30 cm layer. Data on soil compaction and infiltration rates further explain these patterns: CTS plots, with minimal disturbance, exhibit higher soil compaction and lower infiltration rates, limiting MPs movement into deeper layers. ST plots, with greater soil turnover, have lower compaction and higher infiltration, promoting even distribution. CTD plots, with intermediate disturbance, balance these effects, retaining more microplastics near the surface due to aggregate sorting and reduced permeability in deeper layers. These findings highlight tillage as a primary driver of MPs distribution, consistent across both sites despite differences in soil texture (e.g., higher clay content at Cacinci). On the other hand, some studies have found a positive correlation between soil texture, particularly clay, and MP abundance [32]. Thus, our results indicate that the tillage type could be one of the main factors affecting vertical microplastics distribution within the soil profile in agricultural soils.
4.2. Fertilization and Microplastics Abundance
Liming treatments had no significant effect on microplastic abundance at either site. Fertilization treatments revealed site-specific effects on MPs abundance. At Cacinci, plots with a 50% reduction in fertilization showed significantly lower MPs levels compared to fully fertilized plots. This suggests that fertilizers, particularly organic ones, are a major MPs source, as supported by Yang et al. [33], who documented high MPs concentrations in organic amendments like manure. Cacinci’s longer agricultural history (since 2017) and repeated fertilizer applications likely amplified this effect, allowing microplastics to accumulate over time. In contrast, at Krizevci, a site converted from natural grassland in 2021, no significant fertilization effect was observed. The shorter agricultural history and fewer fertilizer applications likely minimized MPs input, explaining the lack of difference between treatments. Organic fertilizers can introduce microplastics via contaminated compost or sewage sludge, with particles embedding into the soil matrix over multiple seasons. These findings underscore the importance of land-use history and management intensity in shaping soil MPs contamination, with implications for sustainable farming practices. Recent research, including a study on agricultural fertilizers contributing to microplastic concentrations in UK soils, highlights the growing role of fertilizers in MPs pollution [34].
Previous research has reported contrasting shape ratios in agricultural fields. Namely, Van den Berg et al. [35] found that 86% of microplastics in agricultural soils were fragments, whereas Corradini et al. [36] reported that fibers accounted for 97% of soil microplastics. In this research MPs shapes varied between sites, reflecting diverse pollution sources. At Cacinci, fragments were the dominant type, comprising a higher proportion of total microplastics. This suggests point sources, such as the degradation of agricultural plastics (e.g., mulch films) or litter, which break into irregular fragments over time [37]. At Krizevci, fibers were more prevalent, pointing to atmospheric deposition as a primary source [5,38]. Fibers, often originating from textiles or synthetic materials, are lightweight and easily transported by wind, depositing onto soil surfaces, especially in less intensively managed areas like Krizevci’s recently converted grassland. Within CTD plots at Cacinci, fragments concentrated in the 0-10 cm layer, while fibers were more abundant in the 20-30 cm layer. This shape-dependent stratification indicates that tillage influences particle mobility differently based on morphology. Fibers, with their elongated structure, may penetrate deeper through soil pores during water infiltration or wet-dry cycles [29], while compact fragments remain near the surface where tillage disturbance is greatest. Lehmann et al. [39] note that shape affects soil interactions, with fibers potentially altering water flow more than fragments. These shape differences have broader implications: fragments may pose greater risks to soil structure due to their irregular edges, while fibers could affect water retention and microbial activity [39]. Understanding shape-specific sources and distributions is critical for tracing MPs pathways and mitigating their impacts [33].
In conclusion, our findings demonstrate that tillage practices are a primary determinant of MP distribution in agricultural soils. Conventional tillage (ST) and shallow conservation tillage (CTS) promote homogeneous MP distribution, while deep conservation tillage (CTD) results in stratification. These patterns are consistent across sites with different soil textures, suggesting that the tillage type exerts a stronger influence on MP distribution than soil properties. Fertilization effects were site-specific, with significant MP accumulation observed at the Cacinci site but not at Krizevci. This discrepancy underscores the role of land-use history and management intensity in shaping MP contamination. Organic fertilizers may serve as a major source of MPs, as supported by previous studies documenting high MP concentrations in compost and manure. The ecological implications of these findings are significant. MPs can alter soil structure, water retention, and microbial activity, potentially affecting crop productivity and ecosystem health. For instance, fragments may disrupt soil aggregation, while fibers could influence water flow and microbial colonization. Understanding these interactions is critical for developing sustainable soil management practices that mitigate MP contamination. Future work should integrate polymer analysis with shape and distribution data. Additionally, investigating aggregate dynamics under different tillage regimes could clarify their long-term role in microplastics' fate.
Author Contributions
Writing—original draft preparation, methodology, investigation, B.Ć.; conceptualization, writing—review and editing, B.H.K.; writing—review and editing, funding acquisition, D.J.; writing—review and editing, I.J.; writing—review and editing, investigation, D.H.K. All authors have read and agreed to the published version of the manuscript.”.
Funding
The study has been fully supported by Croatian Science Foundation under the project “Assessment of conservation soil tillage as advanced methods for crop production and prevention of soil degradation—ACTIVEsoil” (IP-2020-02-2647).
Data Availability Statement
Data will be made available on request.
Conflicts of Interest
The authors declare no conflicts of interest.
References
- Sajjad, M.; Huang, Q.; Khan, S.; Khan, M.A.; Liu, Y.; Wang, J.; Lian, F.; Wang, Q. and Guo, G. Microplastics in the soil environment: A critical review. Environmental Technology & Innovation. 2022, 27, 102408. [Google Scholar] [CrossRef]
- Horton, A.A.; Walton, A.; David, S.; Elma, L.; Svendsen, C. Microplastics in freshwater and terrestrial environments: evaluating the current understanding to identify the knowledge gaps and future research priorities. Sci. Total Environ. 2017, 586, 127–141. [Google Scholar] [CrossRef] [PubMed]
- De Souza Machado, A.A.; Lau, C.W.; Till, J.; Kloas, W.; Lehmann, A.; Becker, R.; Rillig, M.C. Impacts of Microplastics on the Soil Biophysical Environment. Environ. Sci. Technol. 2018, 52, 9656–9665. [Google Scholar] [CrossRef]
- De Souza Machado, A.A.; Lau, C.W.; Kloas, W.; Bergmann, J.; Bachelier, J.B.; Faltin, E.; Becker, R.; Görlich, A.S.; Rillig, M.C. Microplastics Can Change Soil Properties and Affect Plant Performance. Environ. Sci. Technol. 2019, 53, 6044–6052. [Google Scholar] [CrossRef] [PubMed]
- Zhang, G.S.; Zhang, F.X.; Li, X.T. Effects of polyester microfibers on soil physical properties: Perception from a field and a pot experiment. Sci. Total Environ. 2019, 670, 1–7. [Google Scholar] [CrossRef]
- Yu, Y.; Flury, M. Current understanding of subsurface transport of micro- and nanoplastics in soil. Vadose Zo. J. 2021, 20, 1–14. [Google Scholar] [CrossRef]
- Mbachu, O.; Jenkins, G.; Kaparaju, P.; Pratt, C. The rise of artificial soil carbon inputs: Reviewing microplastic pollution effects in the soil environment. Sci. Total Environ. 2021, 780. [Google Scholar] [CrossRef]
- Wang, T.; Wang, L.; Chen, Q.; Kalogerakis, N.; Ji, R.; Ma, Y. Interactions between microplastics and organic pollutants: Effects on toxicity, bioaccumulation, degradation, and transport. Sci. Total Environ. 2020, 748. [Google Scholar] [CrossRef]
- Aghilinasrollahabadi, K.; Salehi, M.; Fujiwara, T. Investigate the influence of microplastics weathering on their heavy metals uptake in stormwater. J. Hazard. Mater. 2021, 408. [Google Scholar] [CrossRef]
- Wang, J.; Liu, X.; Li, Y.; Powell, T.; Wang, X.; Wang, G.; Zhang, P. Microplastics as contaminants in the soil environment: A mini-review. Sci. Total Environ. 2019, 691, 848–857. [Google Scholar] [CrossRef]
- Li, Q.; Zeng, A.; Jiang, X.; Gu, X. Are microplastics correlated to phthalates in facility agriculture soil? J. Hazard. Mater. 2021, 412. [Google Scholar] [CrossRef]
- Mammo, F.K.; Amoah, I.D.; Gani, K.M.; Pillay, L.; Ratha, S.K.; Bux, F.; Kumari, S. Microplastics in the environment: Interactions with microbes and chemical contaminants. Sci. Total Environ. 2020, 743. [Google Scholar] [CrossRef] [PubMed]
- Khalid, N.; Aqeel, M.; Noman, A. Microplastics could be a threat to plants in terrestrial systems directly or indirectly. Environ. Pollut. 2020, 267. [Google Scholar] [CrossRef] [PubMed]
- Guo, J.J.; Huang, X.P.; Xiang, L.; Wang, Y.Z.; Li, Y.W.; Li, H.; Cai, Q.Y.; Mo, C.H.; Wong, M.H. Source, migration and toxicology of microplastics in soil. Environ. Int. 2020, 137, 105263. [Google Scholar] [CrossRef]
- Corradini, F.; Casado, F.; Leiva, V.; Huerta-Lwanga, E.; Geissen, V. Microplastics occurrence and frequency in soils under different land uses on a regional scale. Sci. Total Environ. 2021, 752, 141917. [Google Scholar] [CrossRef] [PubMed]
- Büks, F.; Kaupenjohann, M. Global concentrations of microplastics in soils - A review. Soil. 2020, 6, 649–662. [Google Scholar] [CrossRef]
- Fan, W.; Qiu, C.; Qu, Q.; Hu, X.; Mu, L.; Gao, Z. and Tang, X. Sources and identification of microplastics in soils. Soil & Environmental Health. 2023, 1, 100019. [Google Scholar]
- Yu, Y.; Flury, M. Current understanding of subsurface transport of micro- and nanoplastics in soil. Vadose Zo. J 2021, 20, 1–14. [Google Scholar] [CrossRef]
- O’Connor, D.; Pan, S.; Shen, Z.; Song, Y.; Jin, Y.; Wu, W.M.; Hou, D. Microplastics undergo accelerated vertical migration in sand soil due to small size and wet-dry cycles. Environ. Pollut 2019, 249, 527–534. [Google Scholar] [CrossRef]
- Gao, J.; Pan, S.; Li, P.; Wang, L.; Hou, R.; Wu, W.M.; Luo, J.; Hou, D. Vertical migration of microplastics in porous media: Multiple controlling factors under wet-dry cycling. J. Hazard. Mater 2021, 419, 126413. [Google Scholar] [CrossRef]
- Li, H.; Lu, X.; Wang, S.; Zheng, B.; Xu, Y. Vertical migration of microplastics along soil profile under different crop root systems. Environ. Pollut 2021, 278, 116833. [Google Scholar] [CrossRef] [PubMed]
- Brandes, E.; Henseler, M.; Kreins, P. Identifying hot-spots for microplastic contamination in agricultural soils - A spatial modelling approach for Germany. Environ. Res. Lett 2021, 16. [Google Scholar] [CrossRef]
- Rillig, M.C.; Ingraffia, R.; De Souza Machado, A.A. Microplastic incorporation into soil in agroecosystems. Front. Plant Sci 2017, 8, 8–11. [Google Scholar] [CrossRef]
- Hurley, R.R.; Lusher, A.L.; Olsen, M.; Nizzetto, L. Validation of a Method for Extracting Microplastics from Complex, Organic-Rich, Environmental Matrices. Environ. Sci. Technol 2018, 52, 7409–7417. [Google Scholar] [CrossRef] [PubMed]
- Vermeiren, P.; Muñoz, C.; Ikejima, K. Microplastic identification and quantification from organic rich sediments: A validated laboratory protocol. Environ. Pollut 2020, 262. [Google Scholar] [CrossRef]
- Norén, F. , 2007. Small plastic particles in Coastal Swedish waters. KIMO Report, Sweden.
- Schneider, C.A.; Rasband, W.S.; Eliceiri, K.W. NIH Image to ImageJ: 25 years of Image Analysis. Nat. Methods 2012, 9, 671–675. [Google Scholar] [CrossRef]
- R Core Team, 2021. R: A language and environment for statistical computing. R Foundation for Statistical Computing, Vienna, Austria. URL https://www.R-project.org/.
- Zhang, X.; Chen, Y.; Li, X.; Zhang, Y.; Gao, W.; Jiang, J.; Mo, A.; He, D. Size/shape-dependent migration of microplastics in agricultural soil under simulative and natural rainfall. Sci. Total Environ 2022, 815. [Google Scholar] [CrossRef] [PubMed]
- Zhang, Y.; Kang, S.; Allen, S.; Allen, D.; Gao, T. ; Sillanpää; M Atmospheric microplastics: A review on current status and perspectives. Earth-Science Rev 2020, 203, 103118. [Google Scholar] [CrossRef]
- Salem, H.M.; Valero, C.; Muñoz, M.Á.; Gil-Rodríguez, M. Effect of integrated reservoir tillage for in-situ rainwater harvesting and other tillage practices on soil physical properties. Soil Tillage Res 2015, 151, 50–60. [Google Scholar] [CrossRef]
- Wang, Y.; Hou, P.; Liu, K.; Hayat, K. and Liu, W. Depth distribution of nano-and microplastics and their contribution to carbon storage in Chinese agricultural soils. Science of The Total Environment 2024, 913, 169709. [Google Scholar] [CrossRef]
- Yang, L.; Zhang, Y.; Kang, S.; Wang, Z.; Wu, C. Microplastics in soil: A review on methods, occurrence, sources, and potential risk. Sci. Total Environ 2021, 780. [Google Scholar] [CrossRef] [PubMed]
- Cusworth, S.J.; Davies, W.J.; McAinsh, M.R.; Gregory, A.S.; Storkey, J. and Stevens, C.J. Agricultural fertilisers contribute substantially to microplastic concentrations in UK soils. Communications Earth & Environment 2024, 5, 7. [Google Scholar]
- van den Berg, P.; Huerta-Lwanga, E.; Corradini, F.; Geissen, V. Sewage sludge application as a vehicle for microplastics in eastern Spanish agricultural soils. Environ. Pollut 2020, 261. [Google Scholar] [CrossRef]
- Corradini, F.; Meza, P.; Eguiluz, R.; Casado, F.; Huerta-Lwanga, E.; Geissen, V. Evidence of microplastic accumulation in agricultural soils from sewage sludge disposal. Sci. Total Environ 2019, 671, 411–420. [Google Scholar] [CrossRef]
- Yang, J.; Li, R.; Zhou, Q.; Li, L.; Li, Y.; Tu, C.; Zhao, X.; Xiong, K.; Christie, P.; Luo, Y. Abundance and morphology of microplastics in an agricultural soil following long-term repeated application of pig manure. Environ. Pollut 2021, 272, 116028. [Google Scholar] [CrossRef] [PubMed]
- Wright, S.L.; Ulke, J.; Font, A.; Chan, K.L.A.; Kelly, F.J. Atmospheric microplastic deposition in an urban environment and an evaluation of transport. Environ. Int 2020, 136, 105411. [Google Scholar] [CrossRef]
- Lehmann, A.; Leifheit, E.F.; Gerdawischke, M.; Rillig, M.C. Microplastics have shape- and polymer-dependent effects on soil aggregation and organic matter loss – an experimental and meta-analytical approach. Microplastics and Nanoplastics 2021, 1, 1–14. [Google Scholar] [CrossRef]
Figure 1.
Aerial view of split-split-plot design in a) Krizevci site, and b) general scheme of split-split-plot design.
Figure 1.
Aerial view of split-split-plot design in a) Krizevci site, and b) general scheme of split-split-plot design.
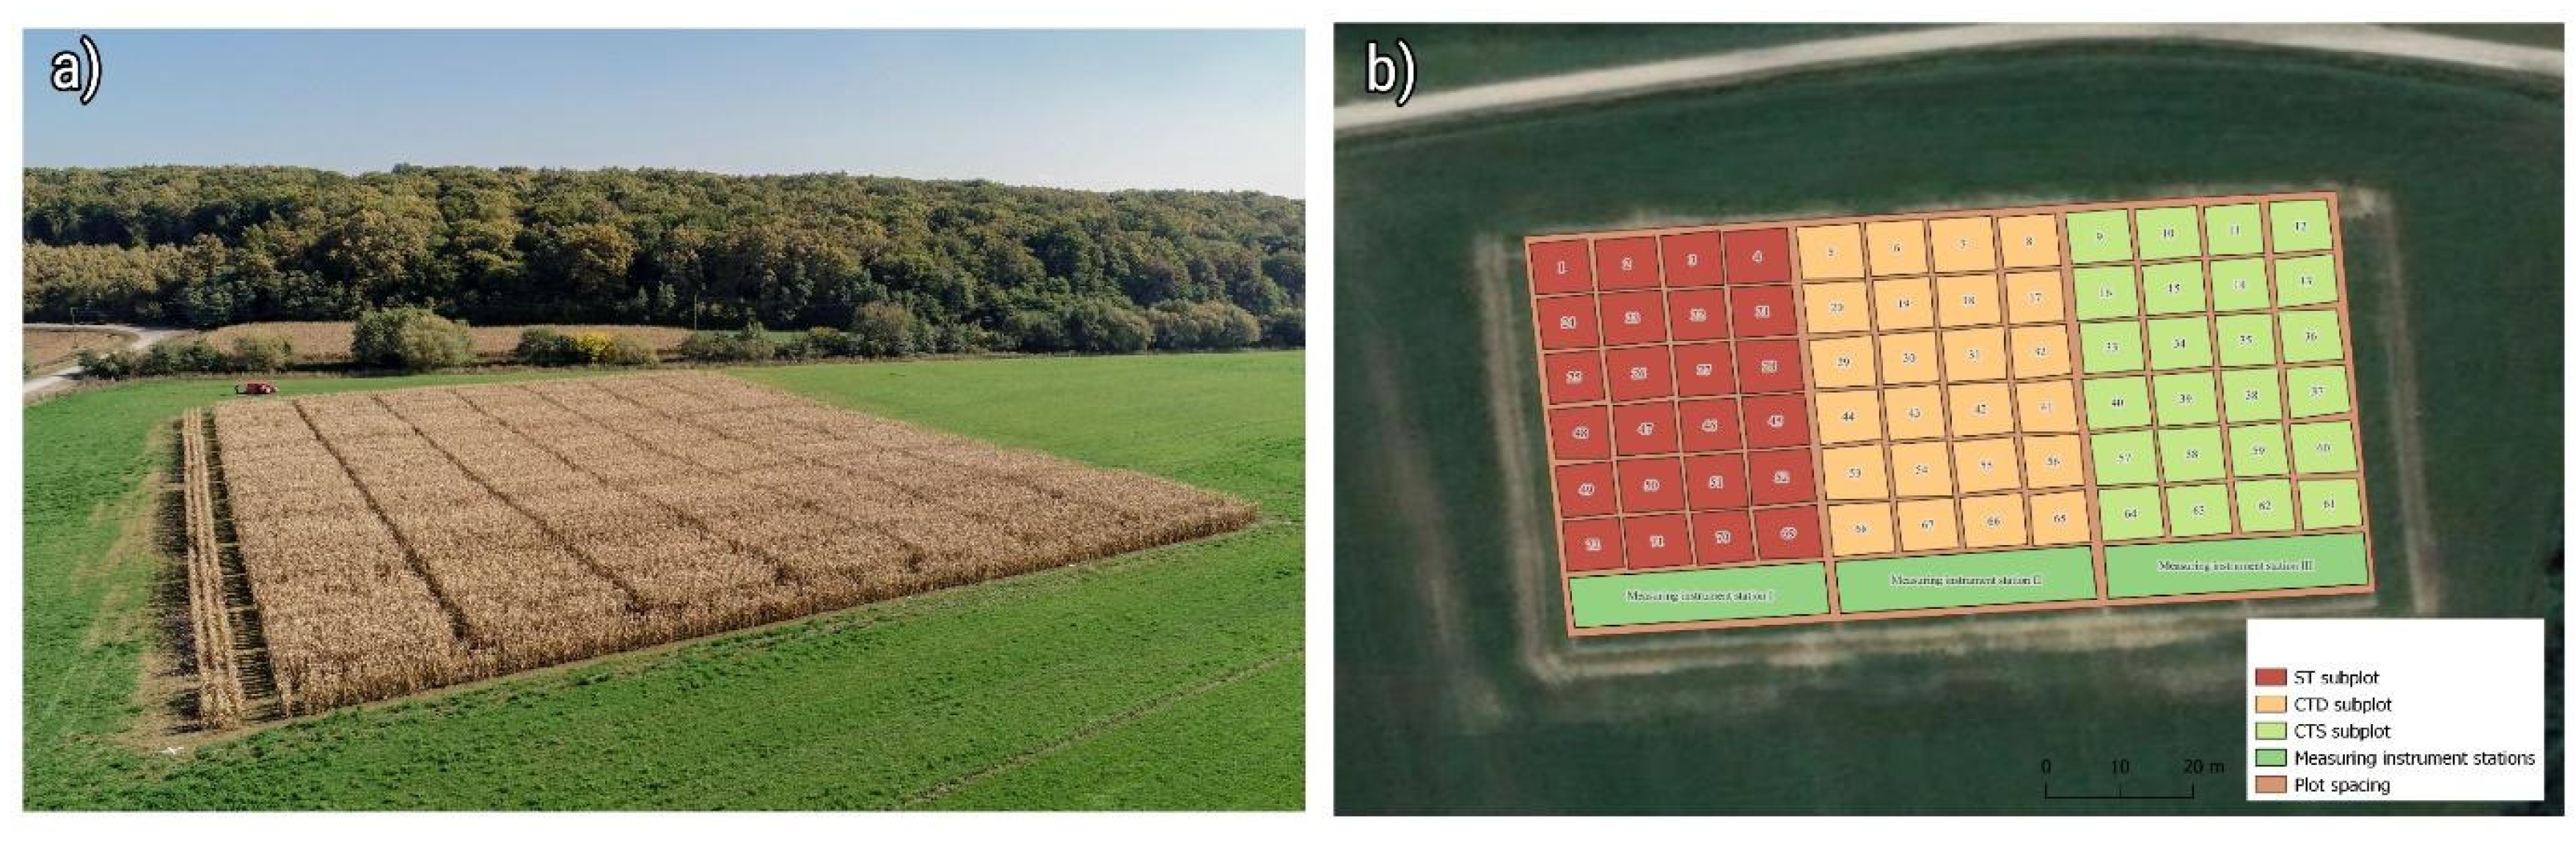
Figure 2.
Quantity of microplastic particles expressed as a total number of particles per 5 g of soil.
Figure 2.
Quantity of microplastic particles expressed as a total number of particles per 5 g of soil.
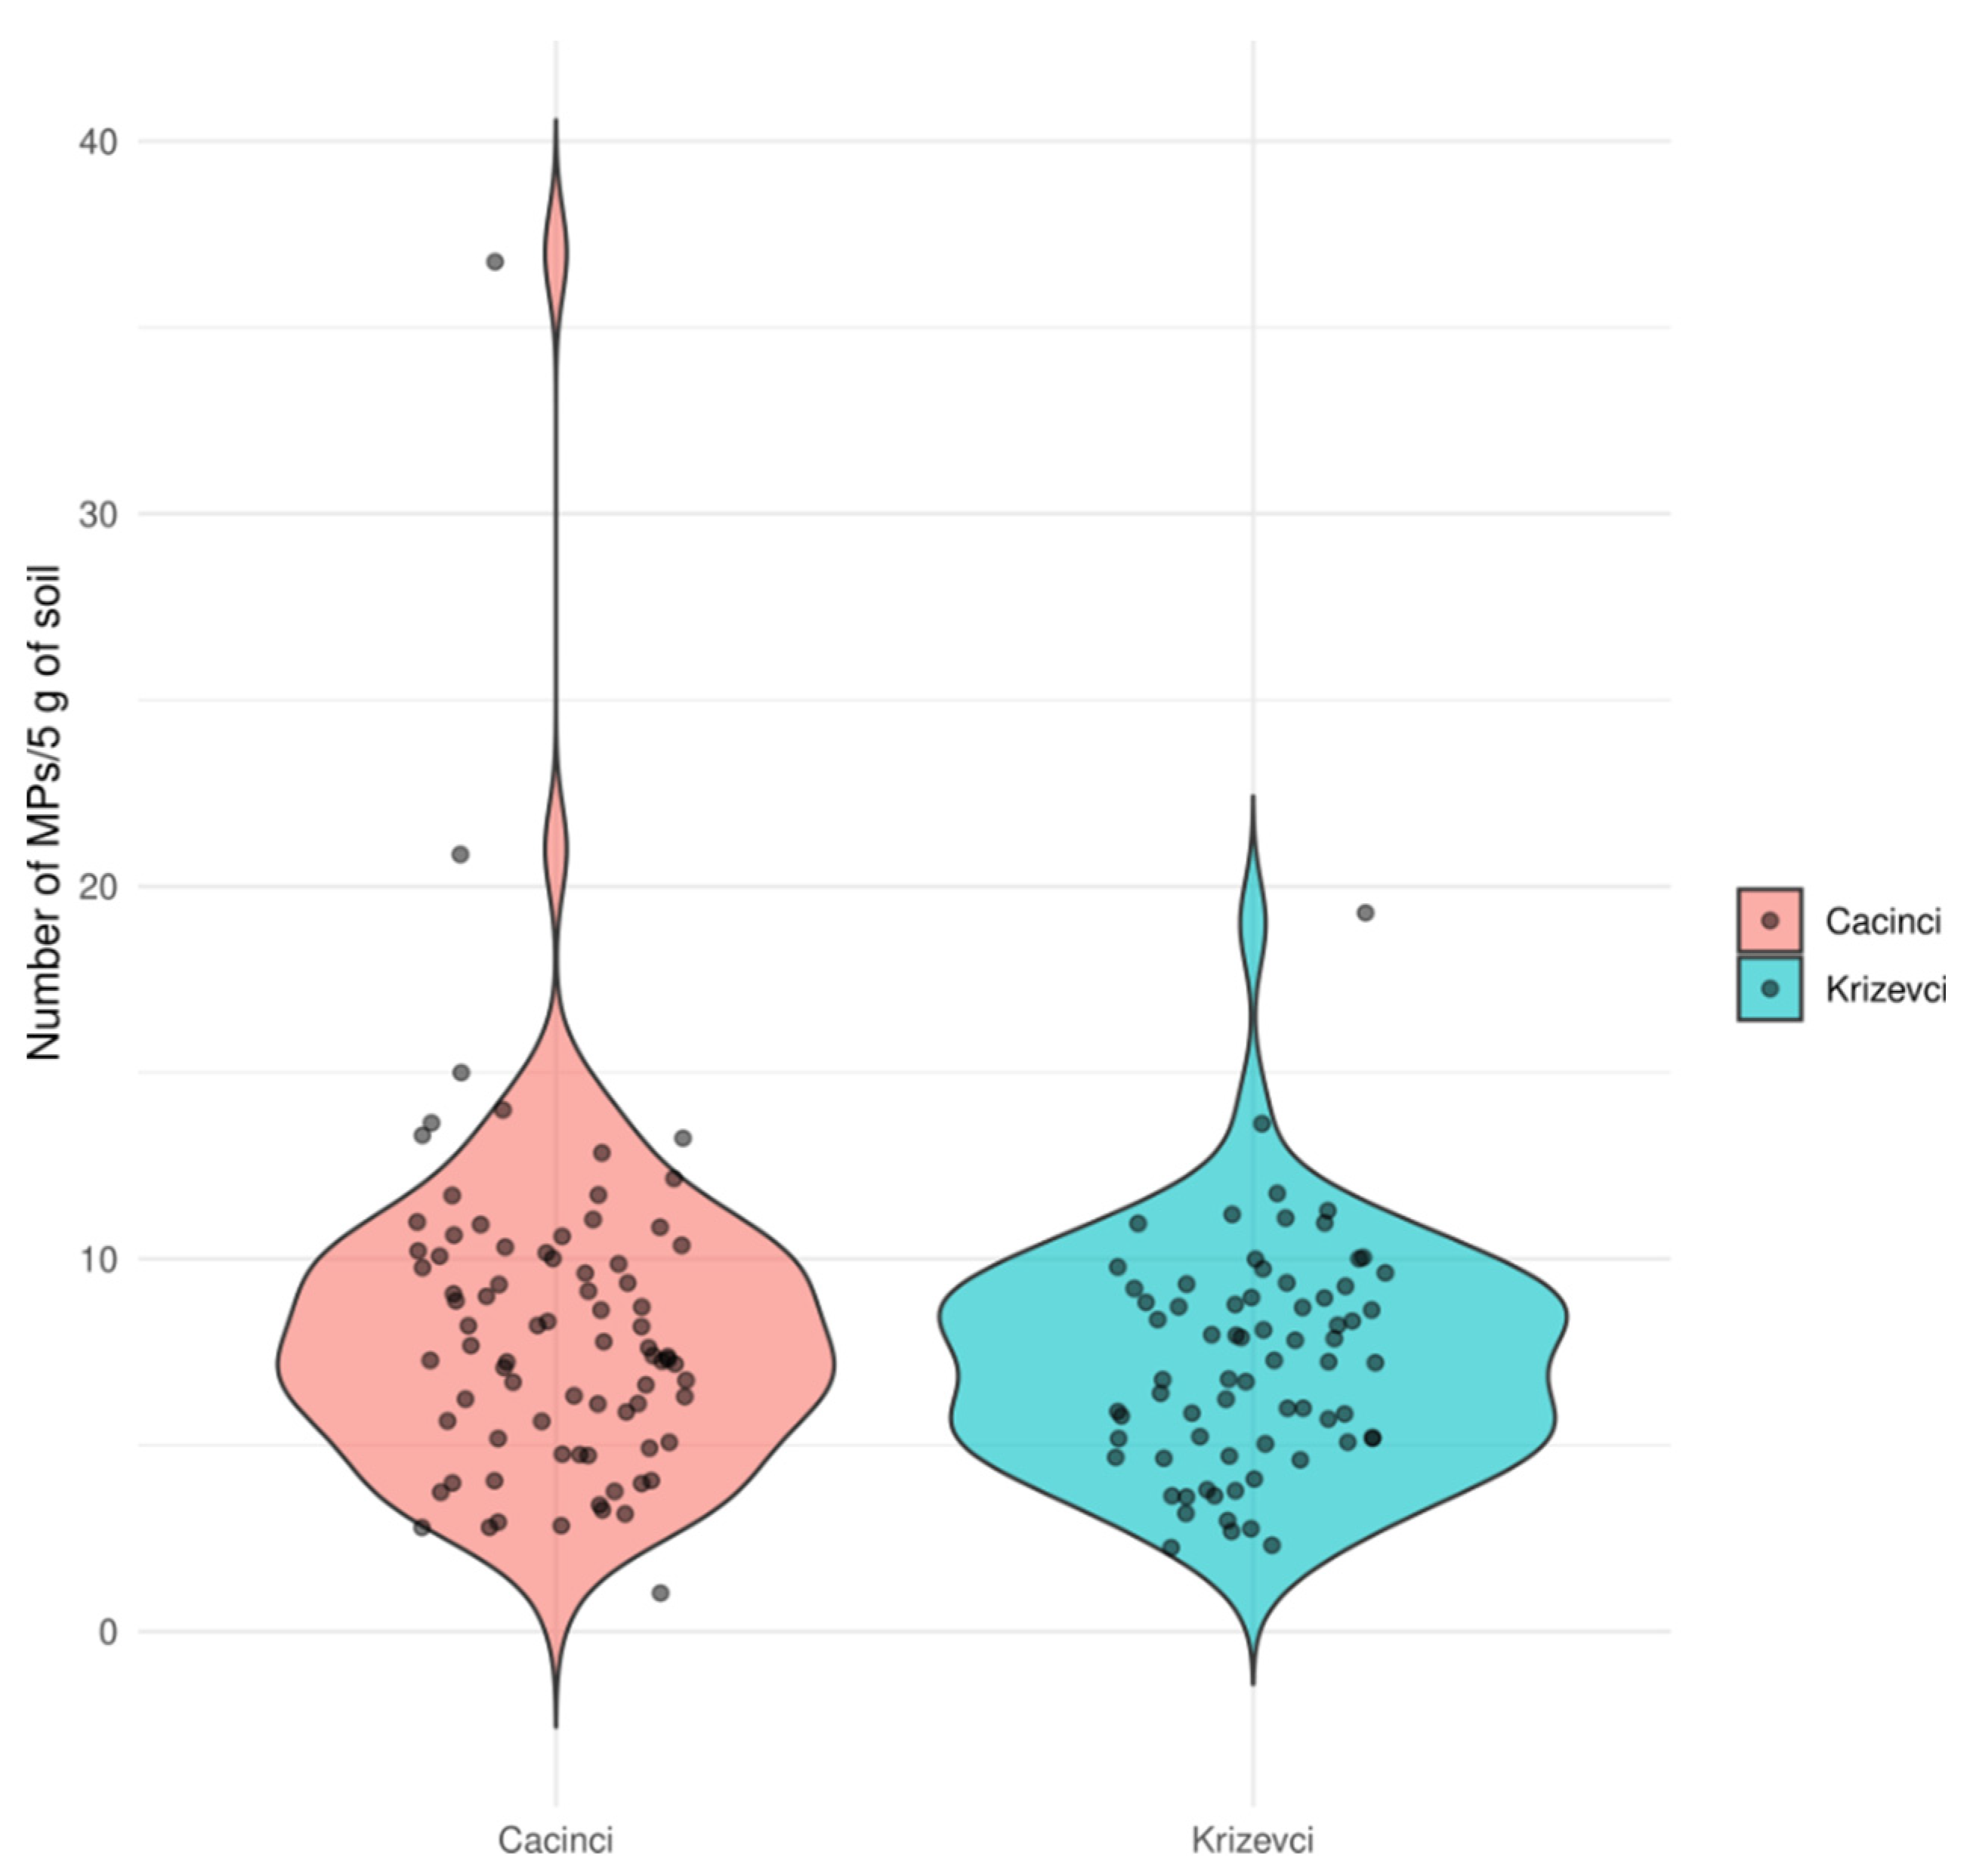
Figure 3.
Mean number of microplastic particles in 5 g of soil in different soil layers (B -bottom, M- middle, T-top) at Cacinci (a) and Krizevci (b) site.
Figure 3.
Mean number of microplastic particles in 5 g of soil in different soil layers (B -bottom, M- middle, T-top) at Cacinci (a) and Krizevci (b) site.
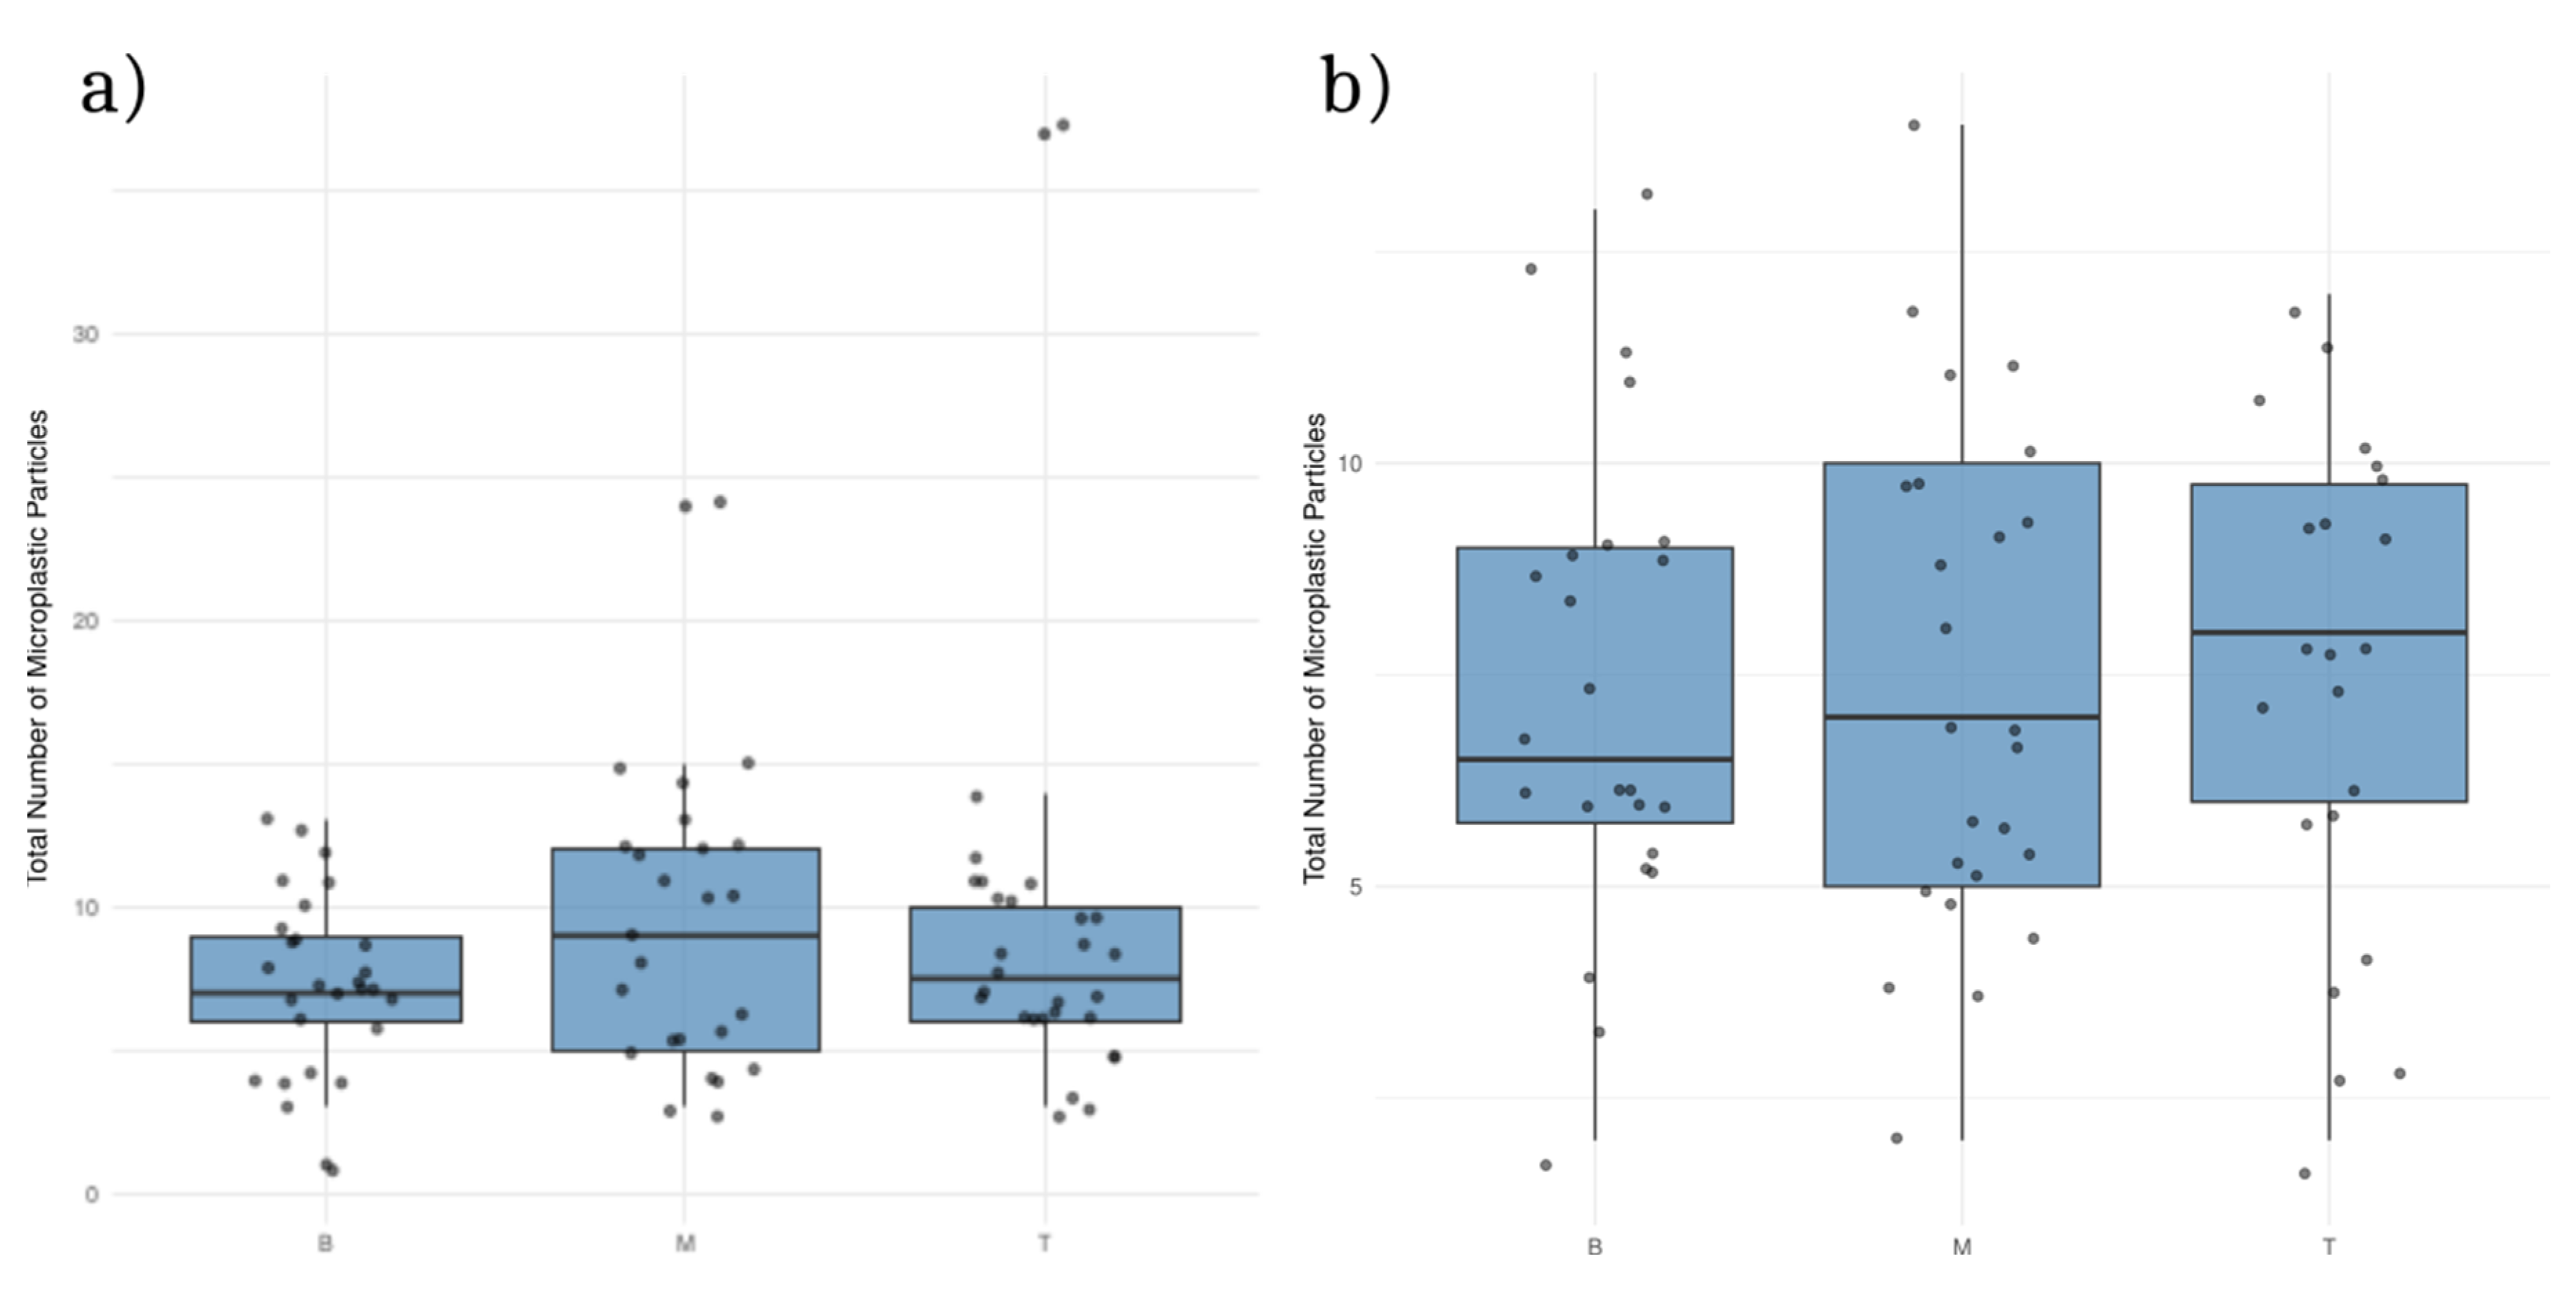
Figure 4.
Number of microplastic particles per kg of soil under different tillage treatment (a), posterior distributions of regression coefficients from the Bayesian model assessing the effects of tillage system (conventional tillage system (ST), conservation tillage system-deep (CTD), and conservation tillage system-shallow (CTS)) and site (Krizevci and Cacinci) on the number of microplastic particles. Points represent posterior means, and horizontal bars denote 95% credible intervals. The reference levels for tillage and site are Conventional Tillage (CT) and the baseline site, respectively. Interaction terms indicate the combined effect of tillage system and site (b).
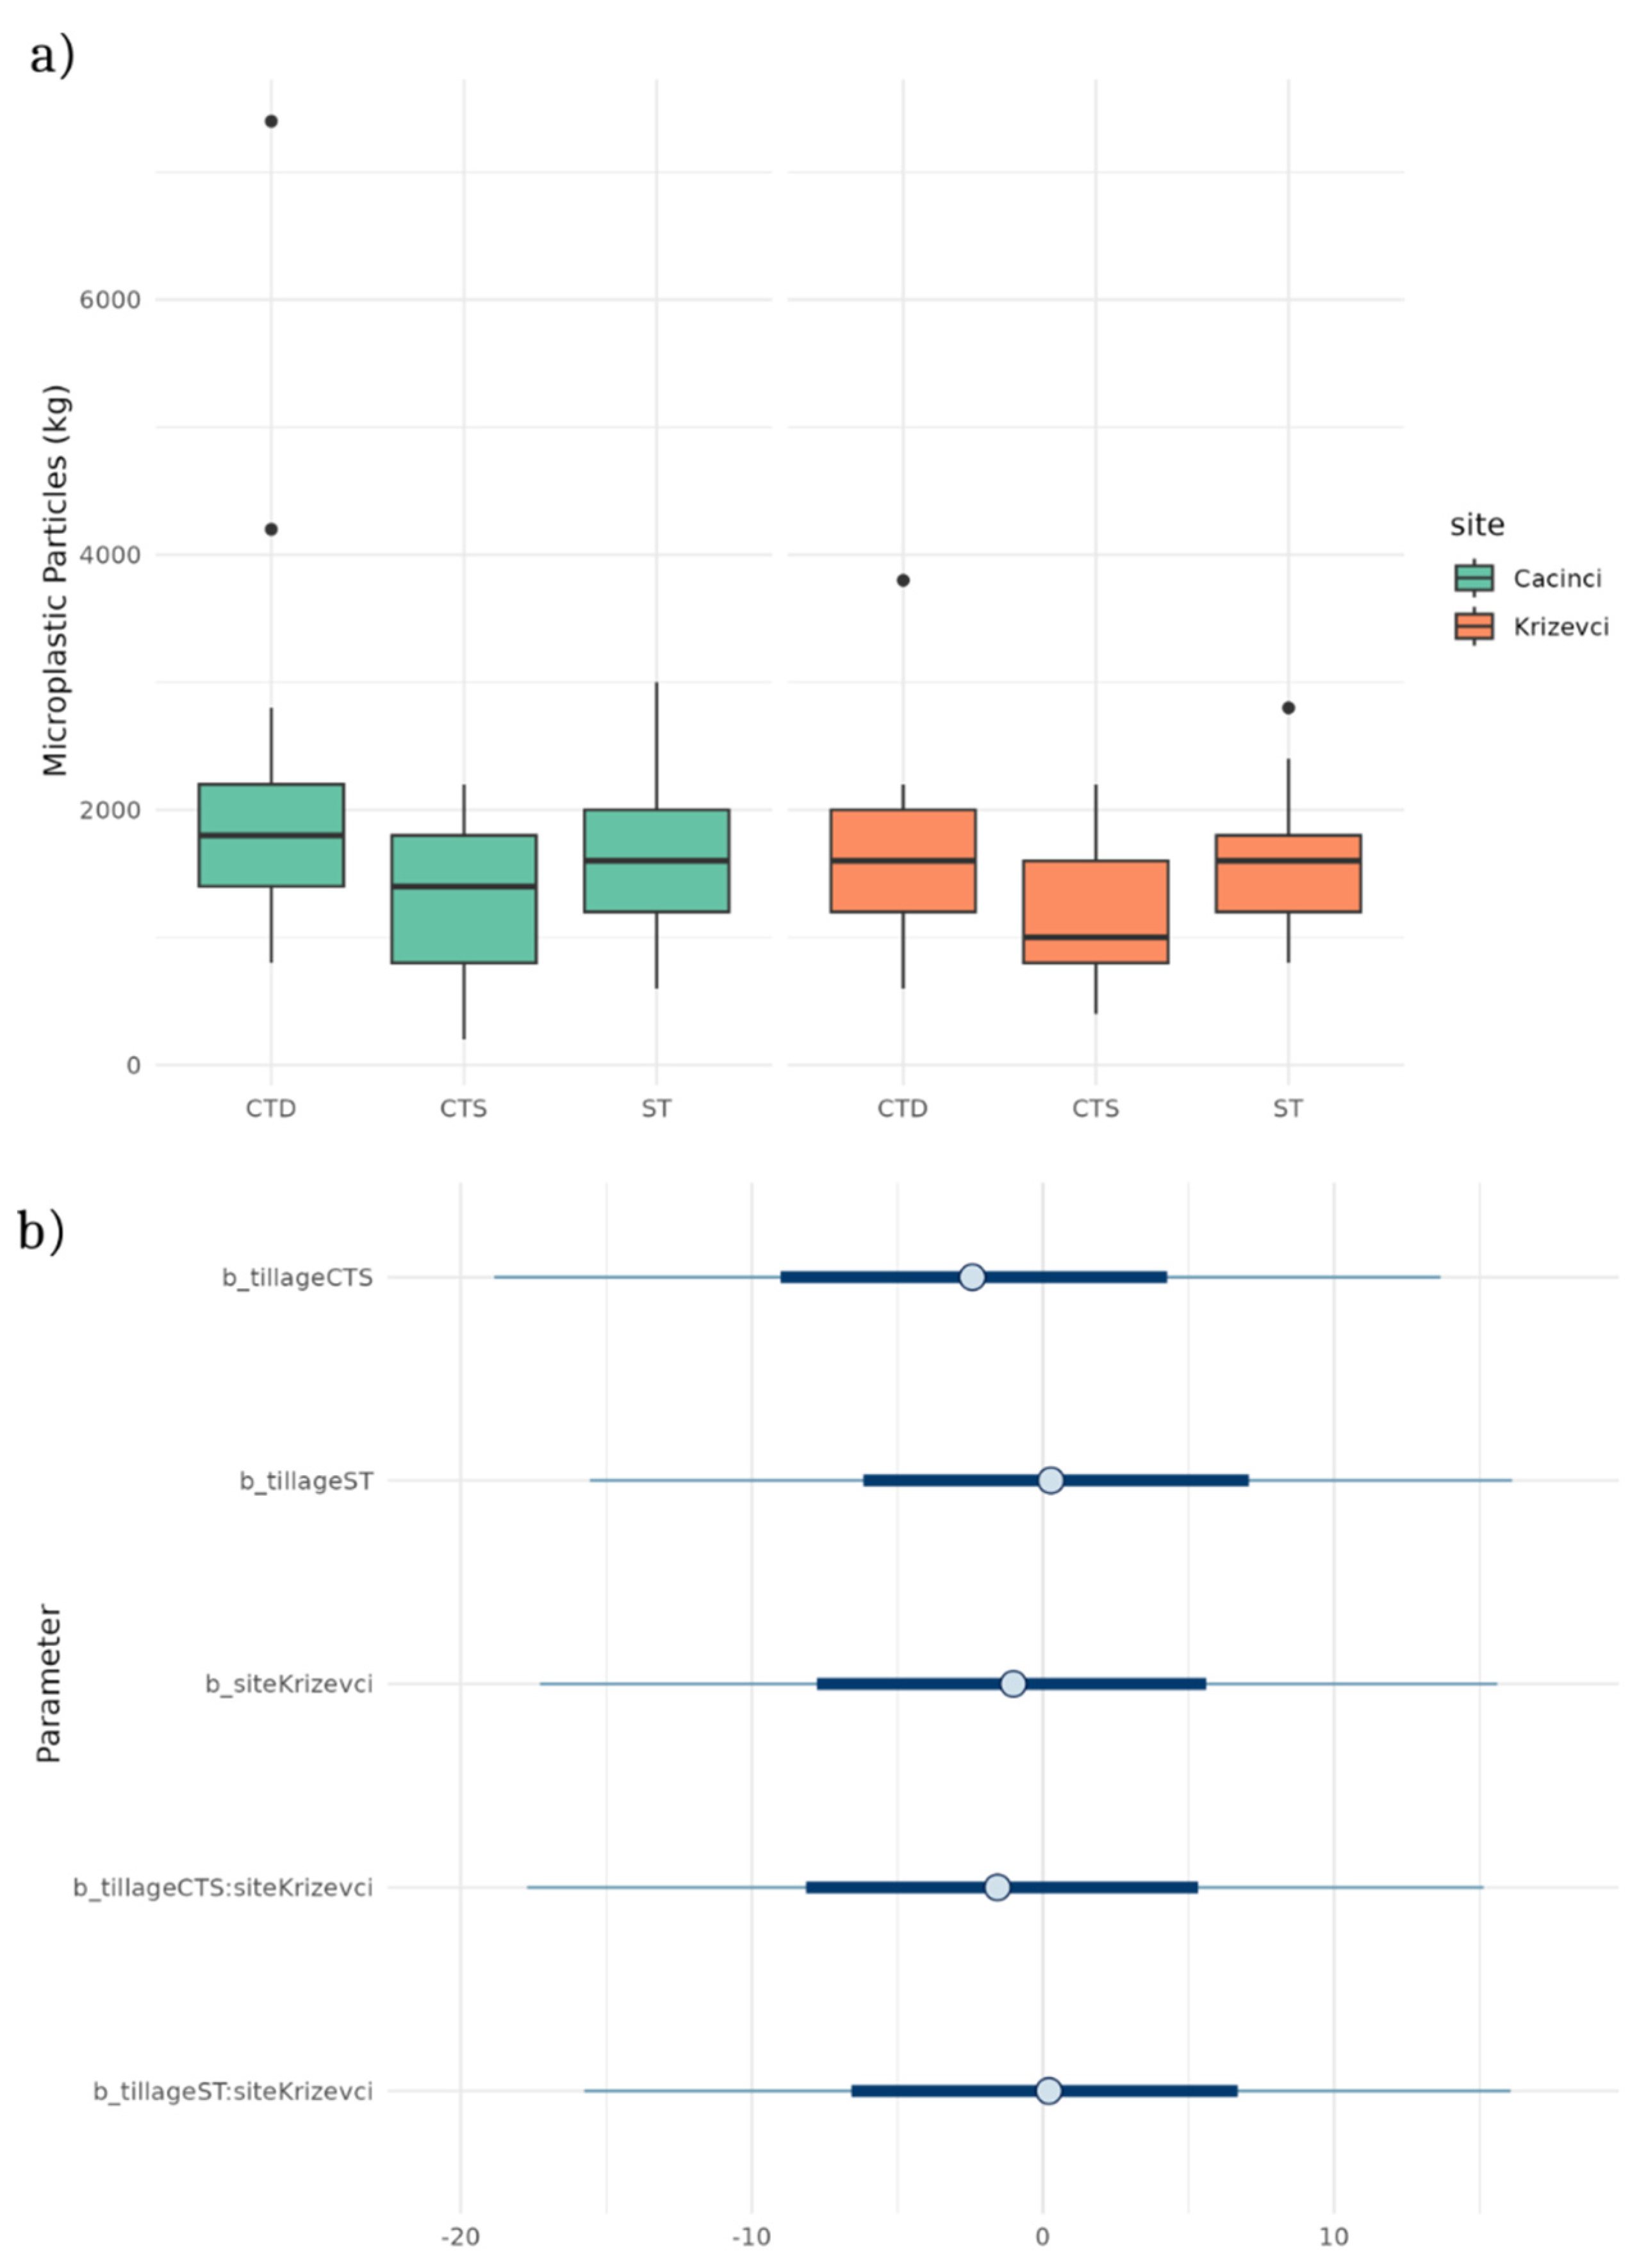
Figure 5.
Vertical distribution of microplastics particles along the soil profile for each plot and sampled depth profile for a) Cacinci site, and b) Krizevci site differed by tillage treatment (conventional tillage system (ST), conservation tillage system-deep (CTD), and conservation tillage system-shallow (CTS)).
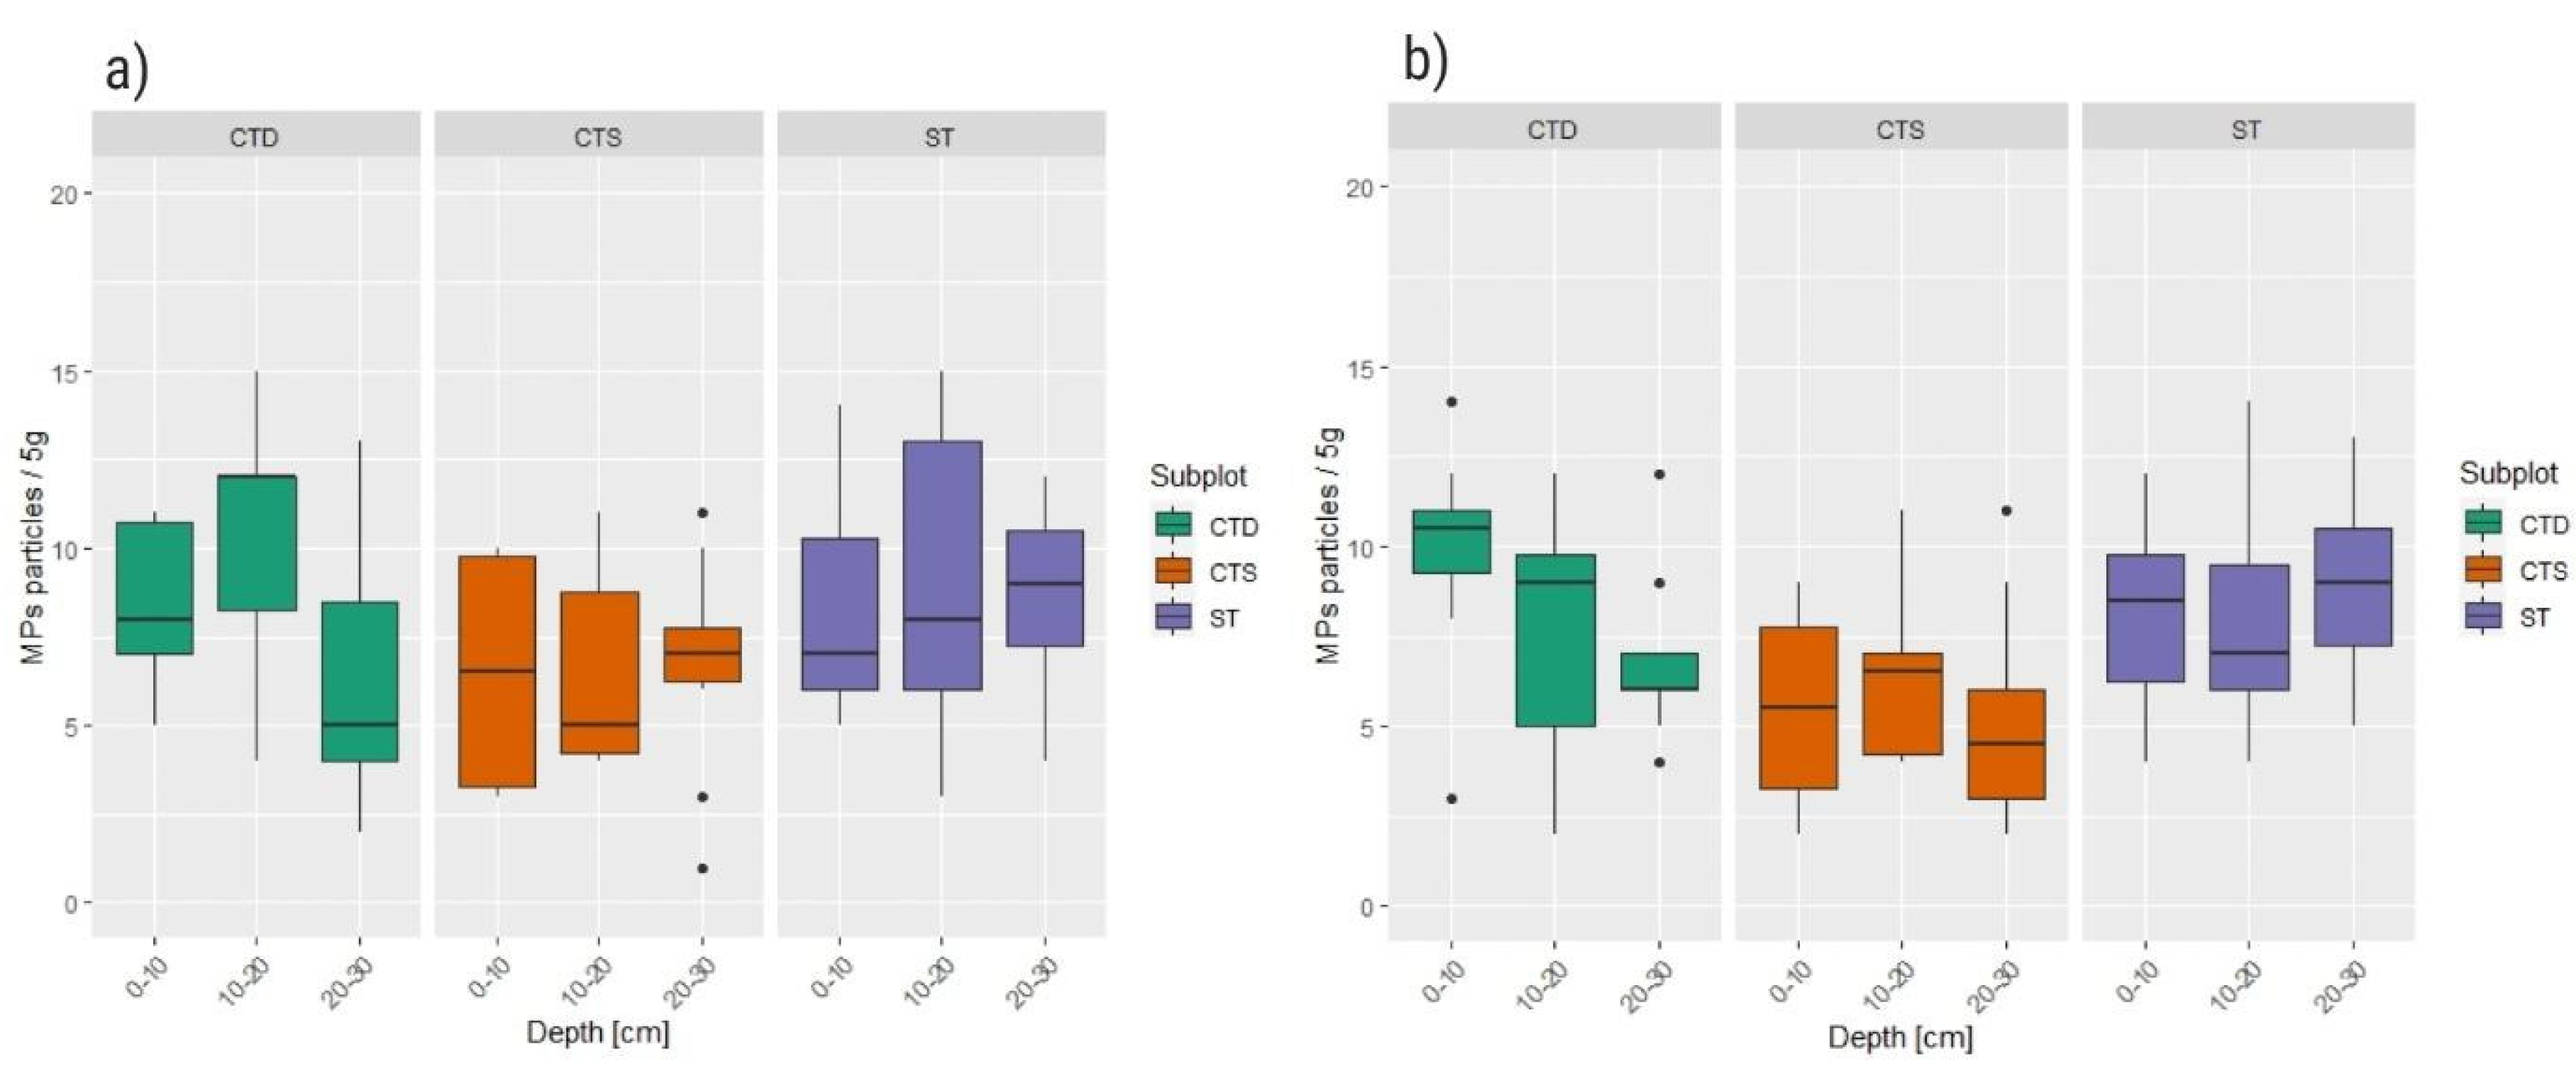
Figure 6.
Distribution of microplastics particle types/shapes through the soil profile: a) Cacinci site, and b) Krizevci site.
Figure 6.
Distribution of microplastics particle types/shapes through the soil profile: a) Cacinci site, and b) Krizevci site.
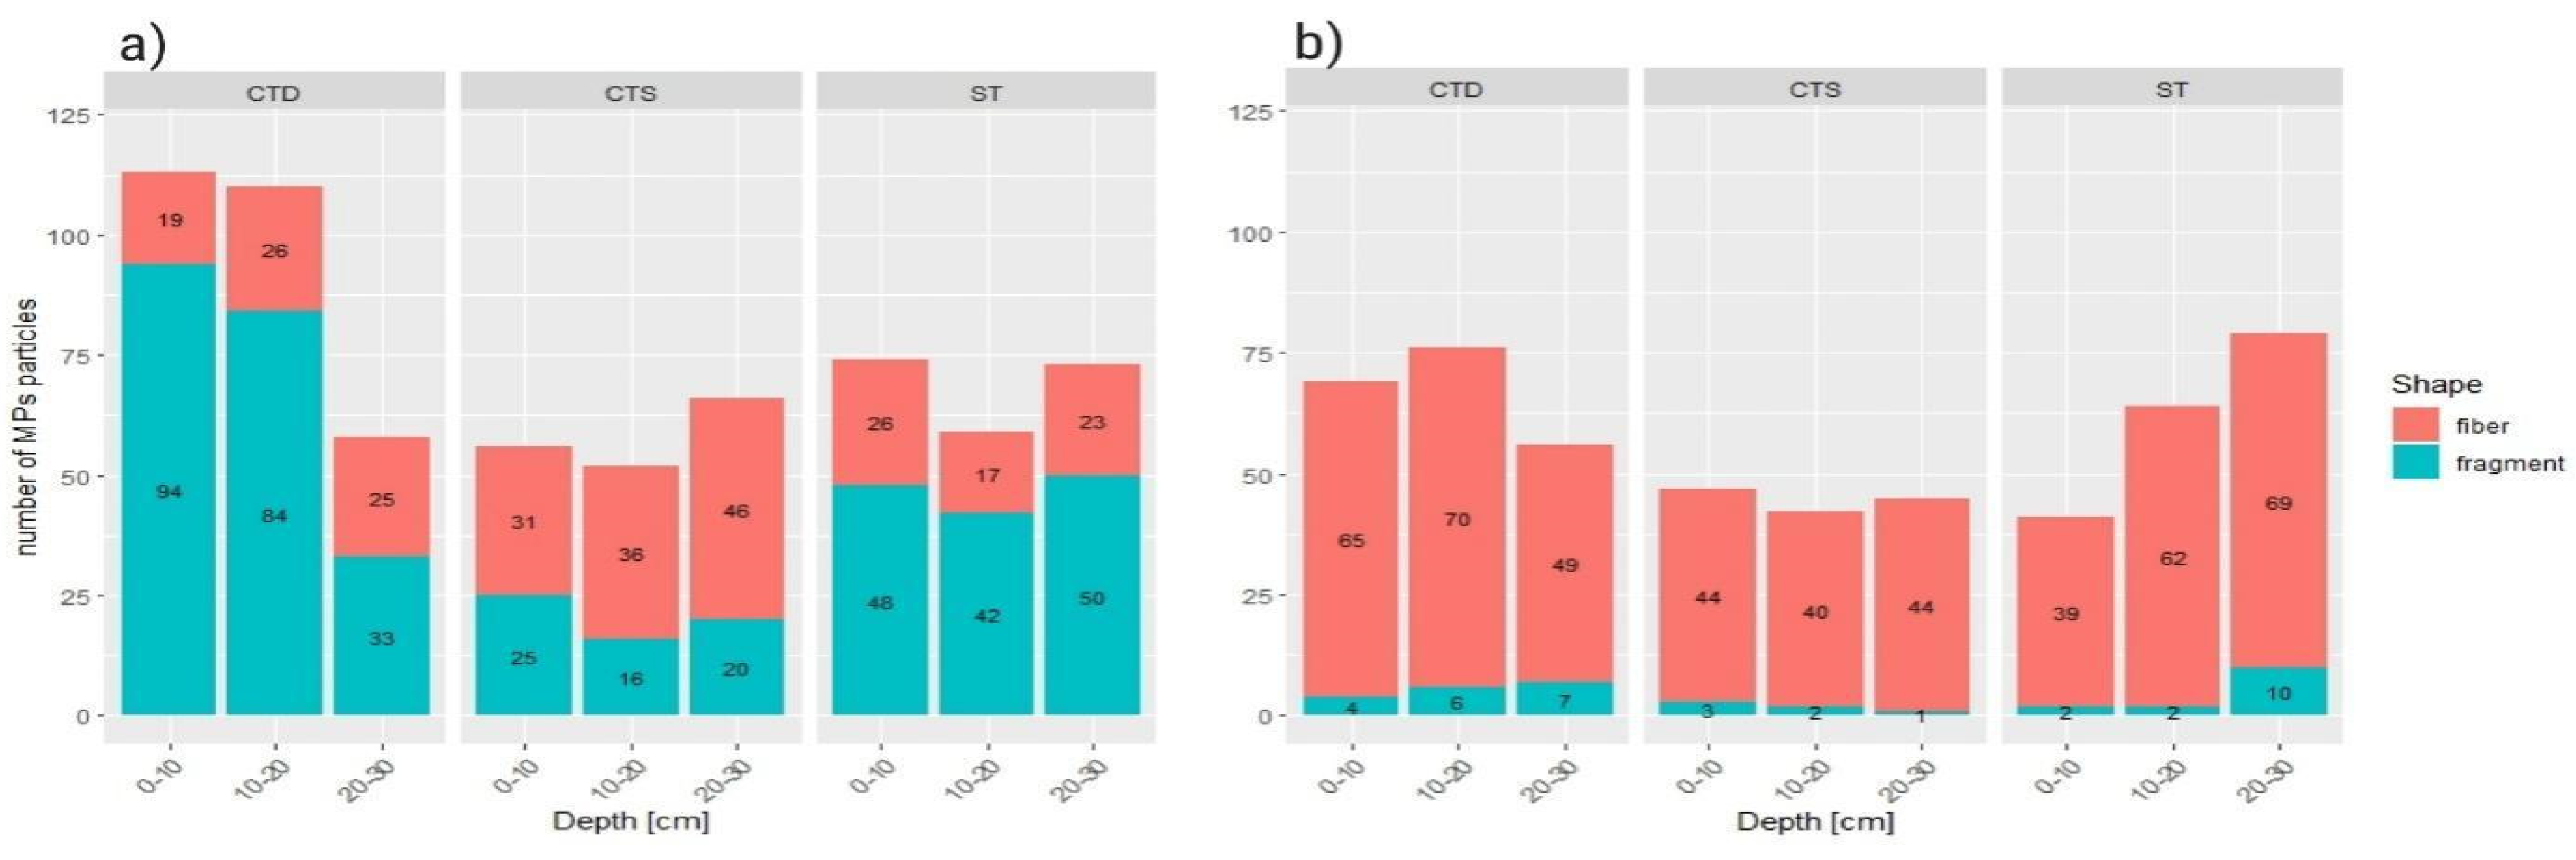

Table 1.
Measured basic soil mechanical, physical and chemical parameters of the both experimental sites (Cacinci and Krizevci).
Table 1.
Measured basic soil mechanical, physical and chemical parameters of the both experimental sites (Cacinci and Krizevci).
| Site |
sand [%] |
silt [%] |
clay [%] |
st |
FC [%vol] |
ρb [g cm-3] |
ci [cm h-1] |
sty |
SOC [%] |
SOM [%] |
| Cacinci | 12.07 | 53.35 | 34.59 | Silty Clay Loam | 34.91 | 1.64 | 57.33 | Stagnosol | 1.42 | 2.84 |
| Krizevci | 7.30 | 82.61 | 10.10 | Silt | 44.59 | 1.39 | 80.04 | Gleysol | 1.18 | 2.36 |
st – soil texture, FC – field water capacity, ρb – soil bulk density, ci – cumulative infiltration, SOC – soil organic carbon, SOM – soil organic matter, sty – soil type.
Table 2.
Summary of the analysis between vertical distribution, soil physico-chemical parameters and number of microplastic particles at both sites.
Table 2.
Summary of the analysis between vertical distribution, soil physico-chemical parameters and number of microplastic particles at both sites.
| Factor | Cacinci | Krizevci |
| Effect of soil layer | No significant effect | Moderate effect: greater variability in upper layers |
| Soil texture (sand, silt, clay) | No significant correlation | Possible influence (p≈0.048) |
| Soil pH | No significant effect | No significant effect |
| Soil Organic Carbon (SOC) | No significant effect | Significant negative correlation with particle variability |
Table 3.
The average size of microplastic particles in different soil layers (B - bottom, M- middle, T- top) at both sites (Cacinci and Krizevci).
Table 3.
The average size of microplastic particles in different soil layers (B - bottom, M- middle, T- top) at both sites (Cacinci and Krizevci).
| Layer | Cacinci (Mean ± SD) | Krizevci (Mean ± SD) |
| B | 1.17 ± 0.506 | 1.13 ± 0.318 |
| M | 1.14 ± 0.462 | 1.10 ± 0.270 |
| T | 1.05 ± 0.449 | 1.16 ± 0.383 |
Table 4.
Descriptive statistics of MPs quantity in different fertilization treatments in both experimental sites.
Table 4.
Descriptive statistics of MPs quantity in different fertilization treatments in both experimental sites.
| Cacinci | Krizevci | |||
| Fertilization Treatment | MP/kg | Sample size (n) | MP/kg | Sample size (n) |
| FD | 1317 ± 313 | 12 | 1417 ± 522 | 12 |
| FR | 2233 ± 1534 | 18 | 1492 ± 700 | 24 |
| GFD | 1492 ± 639 | 39 | 1350 ± 593 | 24 |
| GFR | 1636 ± 742 | 11 | 1655 ± 391 | 11 |
Table 5.
Tukey’s HSD test results for multiple comparisons of fertilization treatments.
| Cacinci | Krizevci | |||||
| Difference | 95% CI | p-value | Difference | 95% CI | p-value | |
| FR-FD | 916.67 | (31.69, 1801.65) | 0.039 | 75.00 | (-481.38, 631.38) | 0.9845 |
| GFD-FR | -741.03 | (-1417.68, -64.37) | 0.026 | -66.67 | (-623.04, 489.71) | 0.9890 |
| GFR-FR | -596.97 | (-1505.77, 311.83) | 0.318 | 237.88 | (-419.01, 894.77) | 0.7757 |
| GFD-FD | 175.64 | (-608.26, 959.54) | 0.935 | -141.67 | (-595.95, 312.61) | 0.8440 |
| GFR-FD | 319.70 | (-671.54, 1310.93) | 0.832 | 162.88 | (-410.11, 735.87) | 0.8768 |
| GFR-GFD | 144.06 | (-666.64, 954.75) | 0.966 | 304.55 | (-268.44, 877.53) | 0.5036 |
Liming treatment showed no effect on soil MP abundance, in either of the two locations.
Disclaimer/Publisher’s Note: The statements, opinions and data contained in all publications are solely those of the individual author(s) and contributor(s) and not of MDPI and/or the editor(s). MDPI and/or the editor(s) disclaim responsibility for any injury to people or property resulting from any ideas, methods, instructions or products referred to in the content. |
© 2025 by the authors. Licensee MDPI, Basel, Switzerland. This article is an open access article distributed under the terms and conditions of the Creative Commons Attribution (CC BY) license (http://creativecommons.org/licenses/by/4.0/).
Copyright: This open access article is published under a Creative Commons CC BY 4.0 license, which permit the free download, distribution, and reuse, provided that the author and preprint are cited in any reuse.


