
Submitted:
10 April 2025
Posted:
11 April 2025
You are already at the latest version
Abstract
The decrease in river streamflow and rainfall volumes due to climate change and/or variability has been affecting several environmental and socioeconomic aspects of the Pantanal floodplain in Brazil. This study analyzed 37-year-long (1986-2023) hydrological time series of rainfall, streamflow and flooded areas in three contributing basins of the Pantanal floodplain (Jauru - JB, Taquari-TB and Miranda-MB), revealing distinct hydrological trends influenced by climate systems and ENSO patterns. Significant decreasing trends in rainfall and streamflow were observed in the northern JB and TB basins, while the southern MB basin showed increasing behavior. As a consequence, the downstream flooded areas in the Pantanal floodplain showed a decreasing trend in the period. Long-term memory processes (Hurst phenomenon) were identified in the time series of the basin flooded surface and also in the Paraguay river stage data, indicating a persistent and aggregated reduction in the hydrologic variables, affecting both the ranching and fishing activities in the region, and the regional ecology. These findings reinforce the need for adaptative management strategies to tackle the impacts of water surface loss, increasing fire risk, and climate variability in the Upper Paraguay basin.
Keywords:
floodplain
; hydrology
; climate change
; persistence
1. Introduction
Several regions of South America have experienced frequent and prolonged droughts in recent decades [1], which were correlated with different global and regional climatic forcings, leading to important ecological and socioeconomic impacts, including widespread forest fires [2,3,4,5,6]. Extreme droughts in Brazil are often linked to the El-Niño Southern Oscillation (ENSO) phenomenon, which modulates the precipitation patterns in the continent [5,7,8] , becoming more severe when persistence of below-average precipitation occurs in a sequence of several years [9]. In the Brazilian Pantanal, the world’s largest floodplain, a positive correlation was observed between the sea surface temperature (SST) rise of the Southern (Northern) Hemisphere oceans, and the increase (decrease) in the yearly precipitation [10] and streamflow [11].
In addition to global climate drivers, such as the greenhouse effect [12], regional forcings, such as large-scale land-use conversion, also play an important role in the decrease of precipitation and streamflow [13,16] in the Cerrado biome (Brazilian savannah), which forms most of the headwaters of the Pantanal floodplain [17]. However, increases in streamflow were also correlated with large-scale deforestation elsewhere, due to decreased evapotranspiration [18,19,20,21].
Although hydrological patterns of streamflow are related to rainfall and evapotranspiration rates in the Pantanal floodplain [22,23], the relationship is not necessarily direct and linear [24]. In addition to the ecological impacts of extreme climate events, there is a variation in the flood pulse dynamics [25,26,27,28,29] which dictates a series of economic activities in the basin’s downstream areas, such as ranching, navigation, fishing, and tourism [30,31].
Agriculture and cattle ranching is the main activity occurring in the Pantanal’s upstream areas, which are also impacted by temperature rise and shortening of the rainy season, causing significant economic losses to farmers and municipalities [32]. Therefore, a better understanding is needed about the relationship between climate change/variability and the alteration of hydrological components of the Pantanal flood pulses, resulting from both climate variability [33,34,35] and land-use change [36,37].
Trend and variability analyses of the historical precipitation series of the Cerrado between 1977 and 2010 indicated that 71% of 125 rainfall gauges in the region showed a general decreasing trend [15]. Similarly, reductions between 6.7 and 8.7% of long-term streamflow in the region were projected for 2050, due to climate change and deforestation, respectively [16].
It is recognized that land-use change in the Pantanal highlands leads to significant impacts on the downstream floodplain, including changes in water and sediment influxes [30,38,39,40]. Additionally, since precipitation is less than potential evapotranspiration in the floodplain, the regional water balance is modulated by upstream inflows [17,41]. Therefore, changes in the rainfall regime and in upstream land-use can impact the size, spatial distribution, seasonality, and persistence of the flooded area in the downstream floodplain [42]. During the typical flood season (Dec-May), the flooded area covers 60 to 80% of the Pantanal [40,43]. A recent remote sensing study mapped the monthly flooded surface of the Pantanal [44], pointing that 2024 was the dryest year in the 30-yr record.
Considering the complexity and the high variability of the Pantanal hydrology, as well as the unknown processes involved in its water balance, further investigation about the trends, patterns, and persistence of hydrological time series of the Pantanal upstream basins is crucial to assess the impacts of climate and land-use change in the Pantanal basin [14,22,33,36,37,45,46,47,48]
Hence, the objective of this study was to assess the hydrologic influence of three main tributaries to the downstream Pantanal floodplain, evaluating the trends, patterns, and persistence in their precipitation and streamflow time series, allowing the establishment of sound climate adaptation strategies for the region.
2. Materials and Methods
2.1. Study Area
The Paraguay river basin, which contains the Pantanal floodplain, extends over 1.2 million km² of Argentina, Bolivia, Paraguay and Brazil, being the second largest river basin in South America. Its headwaters are located in the states of Mato Grosso and Mato Grosso do Sul (Brazil) and its main channel extends for approximately 2,700 km until its confluence with the Paraná and La Plata rivers, which drains into the Atlantic Ocean. The Brazilian portion of the Paraguay is known as Upper Paraguay River Basin-UPRB, upstream of the Pantanal floodplain (42%), whose headwaters contain portions of the Amazon (9%) and Cerrado/Savannah (49%) biomes. These upstream basins are the main sources of water and sediment to the downstream Pantanal floodplain [17,49].
This research focused on three UPRB basins: i) The northern Jauru basin, in the southern Amazon region; ii) The central Taquari basin, in the Cerrado biome, and iii) The southern Miranda basin, also in Cerrado, with fragments of the Brazilian Atlantic Forest [Figure 1]. The study area of the Jauru basin (JB) spans 5,647 km² in its highland area and 2,202 km² in its floodplain. Its topography is comprised of gentle slopes (mean grade of 6.6%), oxidic soils (Orthox), with pastureland and dryland agriculture as the predominant land-uses.
The Taquari basin (TB) highlands span an area of 27,514 km², and its downstream floodplain covers 40,160 km2. The TB basin is formed by gentle topography (mean slope of 8.2%), oxidic soils (Orthox), with pastureland and dryland agriculture as the dominant land-uses. Finally, the southern Miranda basin (MB) has an area of 15,125 km2 in its highlands and 6,638 km² in its floodplain, being the lowest of the three basins in elevation (300 m), with a mean basin slope of 6.5%.
2.2. Data and Analyses
The spatial delineation of the three studied sub-basins was obtained by GIS spatial analysis, with the basin outlets coinciding with the three corresponding streamflow gaging stations, situated in the border between the basins’ highlands and the Pantanal floodplain, downstream. Monthly streamflow data were obtained from three National Water Agency’s-NWA gaging stations: #66072000 (Porto Esperidiao), #66870000 (Coxim), and #66910000 (Miranda) [Figure 2]. Additionally, river stage data from the downstream Paraguay river gage (#66825000) were used to complement the analysis, evaluating the influence of eventual back-water effects in the flooded areas.
The three studied sub-basins span two different Köppen climate zones [Figure 3]. The Cerrado Aw climate is marked by a summer rainy season and dry winters, with annual rainfall ranging from 1,070 mm to 1,720 mm (Jauru basin), and from 1,472 mm to 2,067 mm (Taquari basin). The Miranda basin, with annual rainfall volume ranging between 970 mm and 1,480 mm, is located in the transition zone between the Köppen’s Aw and Am climates, the latter characterized by monsoons and warmer temperatures [50].
Data from six selected rain-gage stations, namely #18558004 (Alto Jauru), #1853002 (Cachoeira Pólvora), #1853003 (Jauru), #1954004 (Camapuã), #2156001 (Jardim), and #2056003 (Estrada MT-738) [Figure 2], were used to correct the bias of the gridded precipitation data [51], downloaded from the Climate Hazards Group InfraRed Precipitation with Station Data-CHIRPS, which is relatively accurate for the studied area [52,53]. The monthly water surface (flooded) areas (A) of the Pantanal floodplain, located in the lower reaches of the three studied sub-basins, were obtained from the MapBiomas Water Project dataset (Collection #3), via Google Earth Engine® queries.
To perform the statistical analysis of the hydrologic time-series, the data were organized into monthly totals (precipitation) and monthly means (streamflow & flooded area), comprising N=37 years, between 1986 and 2023, since at least 30 years of data are necessary to guarantee a climatic stability [54]. All hydrologic time-series of the three sub-basins were organized in hydrologic years, starting in October and ending in September (dry season), to avoid the effect of baseflow carry-over between subsequent years [55].
The non-parametric Mann-Kendall (MK) statistic was used to assess the level of stationarity of the hydrologic time series, detecting trends or jumps [4,14,22,30,46,56,57]. To identify persistence (long-memory processes) in the hydrologic time series, the Hurst coefficient-H [58] was obtained from the rescaled-range (R/Sr) plot [59]. The R/Sr estimate was obtained by the following equations:
where:
The ratio R (t,d)/Sr (t,d) is the rescaled range, consisting in averaging the values of R/Sr for a number of values of t, for a given time lag (d), and plotting the average results of the series of rainfall, streamflow, or flooded area, against log (d). The slope of the graph of x (d) versus log (d), found using ordinary linear regression, is the Hurst coefficient H [60]. Long-term memory (persistence) occurred in the time series when H > 0.5, whereas a value of H ≤ 0.5 indicated a white noise (randomness) in the time series [58,59,61,62].
Additionally, the auto-correlation function (ACF) was performed in the hydrological series of P, Q and A to assess the degree of autocorrelation between the observed data, indicating whether the hydrologic behavior of subsequent years was explained by those of previous years. This occured when the lag-1 and lag-2 ACF were statistically significant, and decreased monotonically [63]. The Mann-Kendall, Hurst, and ACF tests were performed in all hydrological time series using the ‘mannkendall’, ‘hurstexp’ and ‘acf’ scripts, available in the R-Studio® platform, respectively.
Finally, the streamflow (Q) time-series of the three basins were correlated with the corresponding flooded areas (A) downstream, using the Spearman test [64] to assess the relationship between A & Q, vis a vis the back-water effect of the downstream Paraguay river, measured at the Ladário stream gage.
3. Results
3.1. Jauru Basin (JB)
The rainfall and streamflow time-series, their correlation, and the dynamics of the flooded area of the Jauru Basin are presented in Figure 4. The decreasing trends observed in the rainfall (P) and streamflow (Q) series (MK = -0.04 and -0.11, respectively) were not statistically significant (p = 0.71 and 0.37, respectively). The Hurst coefficient for P and Q was H= 0.5, in the threshold between white noise and long-memory. Annual P and Q in the basin were highly correlated (r = 0.75) [Figure 4c].
On the other hand, there was a significant decreasing trend in the water surface in flooded region of the JB in the period (MK = -0.55, p-value <0.001) [Figure 4d]. Additionally, the Hurst coefficient (H = 0.69) indicated a strong persistence and auto-correlation in the series, the latter confirmed by the significant magnitudes of lags 1 & 2 [63] of the ACF.
The low correlation coefficient between the flooded area and upstream inflow of the Jauru river (r = 0.06) [Figure 5] indicates that the former the flooded area was not influenced by the latter.
3.2. Taquari Basin (TB)
The time-series of rainfall and streamflow, their correlation, and the time-series of the flooded area of the Taquari Basin are presented in Figure 6a,b, respectively. Although the rainfall series showed a stationary behavior (MK= -0.12, p = 0.3), the streamflow series presented a significant decrease (MK= -0.63, p <0.001) in the period studied. The correlation between P & Q was r = 0.43 (Figure 5c), and the time-series of the flooded area (Figure 6d) was non-stationary (MK = -0.54, p < 0.001), with a significant decreasing trend.
The Hurst (H) coefficient for the rainfall time-series was 0.49 (white noise), while the H for streamflow and flooded area were 0.68 and 0.69 (long-memory process), respectively. The latter was corroborated by the significant lag-1 & lag-2 of the ACF of the Q & A time-series [9,63].
The correlation between the Taquari annual streamflow and the basin’s annual flooded area [Figure 7a] was high (r = 0.72), indicating that the latter was influenced by the former. Additionally, Figure 7b indicates that the flooded area of the TB was affected by the back-water effect of the Paraguay river [65], given by the significant positive correlation between them (r = 0.78).
3.3. Miranda Basin (MB)
Figure 8 presents the rainfall (P) and streamflow (Q) time-series, their correlation, and the variation of the downstream flooded area of the Miranda Basin-MB in the studied period. As opposed to the Jauru and Taquari basins, where annual rainfall and streamflow decreased between 1986 and 2023, these hydrologic variables increased in the Miranda basin.
The MK coefficients for the time-series of P & Q were 0.12 and 0.31, and the corresponding p-values were 0.29 and 0.02, respectively. The Hurst coefficient for the P, Q, and A time-series were 0.64, 0.62, and 0.73 respectively, indicating the presence of persistence (long-memory process) in the three hydrologic series. However, only the ACF of the flooded area showed autocorrelation, given by the significant and monotonic decreasing values of lags 1 & 2 of the ACF.
Figure 8c presents the correlation between P & Q (r = 0.5), and Figure 8d shows the time-series of the Miranda flooded area, with a significant decreasing trend (MK = -0.59, p < 0.001). The opposite trends observed in the series of streamflow and flooded area indicate that the latter was controlled by different processes.
The correlation between the Paraguay river stage and the Miranda basin flooded area [Figure 9a] showed a strong positive correlation (r = 0.70), whereas no correlation existed between the Miranda river streamflow and the downstream flooded area (r = 0.01) [Figure 9b]. This indicates that the flooded area was controlled by the back-water effect of the Paraguay River [65]. Granted, the decreasing trend in Paraguay river stage [Figure 9c] corroborates this phenomenon.
As occurred with the flooded areas of the three basins studied, the time series of the Paraguay river stage showed a significant decreasing trend (MK= -0.41, p< 0.001), exhibiting a long-memory pattern, given by the Hurst coefficient of 0.64.
4. Discussion
The ENSO variability, generating alternating El Niño & La Niña phenomena, affects the Upper Paraguay Basin differently, with regard to annual precipitation volumes, with alternating floods and droughts [4,10,65]. Although the El Niño is typically associated with reduced rainfall rates in the Cerrado, the years of 1982-1983 and 1997-1998 had strong floods in the Pantanal floodplain [53,66]. On the other hand, the last El Niño event, between 2023-2024, was followed by a small flooded area [44], which could be explained by interdecadal changes of ENSO’s structure [67], or anomalies in warming/ cooling zones in the Atlantic and Pacific oceans [68]. Under climate change circumstances, due to greenhouse forcings, it is likely that ENSO’s impact on South America will be exacerbated [69], though it cannot be perceived just by analyzing hydrologic annual means.
Decreasing trends in rainfall and in streamflow were detected in two of the three basins analyzed (Jauru & Taquari), with the third (Miranda) presenting increasing trends in a 37 yr-long series, corroborating the findings of Thielen et al. [10], though in their study the MK test for precipitation series was not statistically significant.
A possible explanation for this behavior is the different climate systems governing the basins’ hydrology [50]. In the case of the Jauru and Taquari basins, the Köppen climate type is Aw, whereas in the southern Miranda basin, situated near the Tropic of Capricorn and to the Atlantic Forest continuum, the dominant climate is Am. On the other hand, the significant decreasing trends observed in the streamflow series of the two northern basins with Aw climate (Jauru and Taquari), as well as the occurrence of long-memory processes (Hurst phenomenon) in the latter, have been detected elsewhere both in the Cerrado [70], and in the Pantanal headwaters, where decreasing trends of low (high) flows during dry (wet) periods in the Pantanal occurred [71].
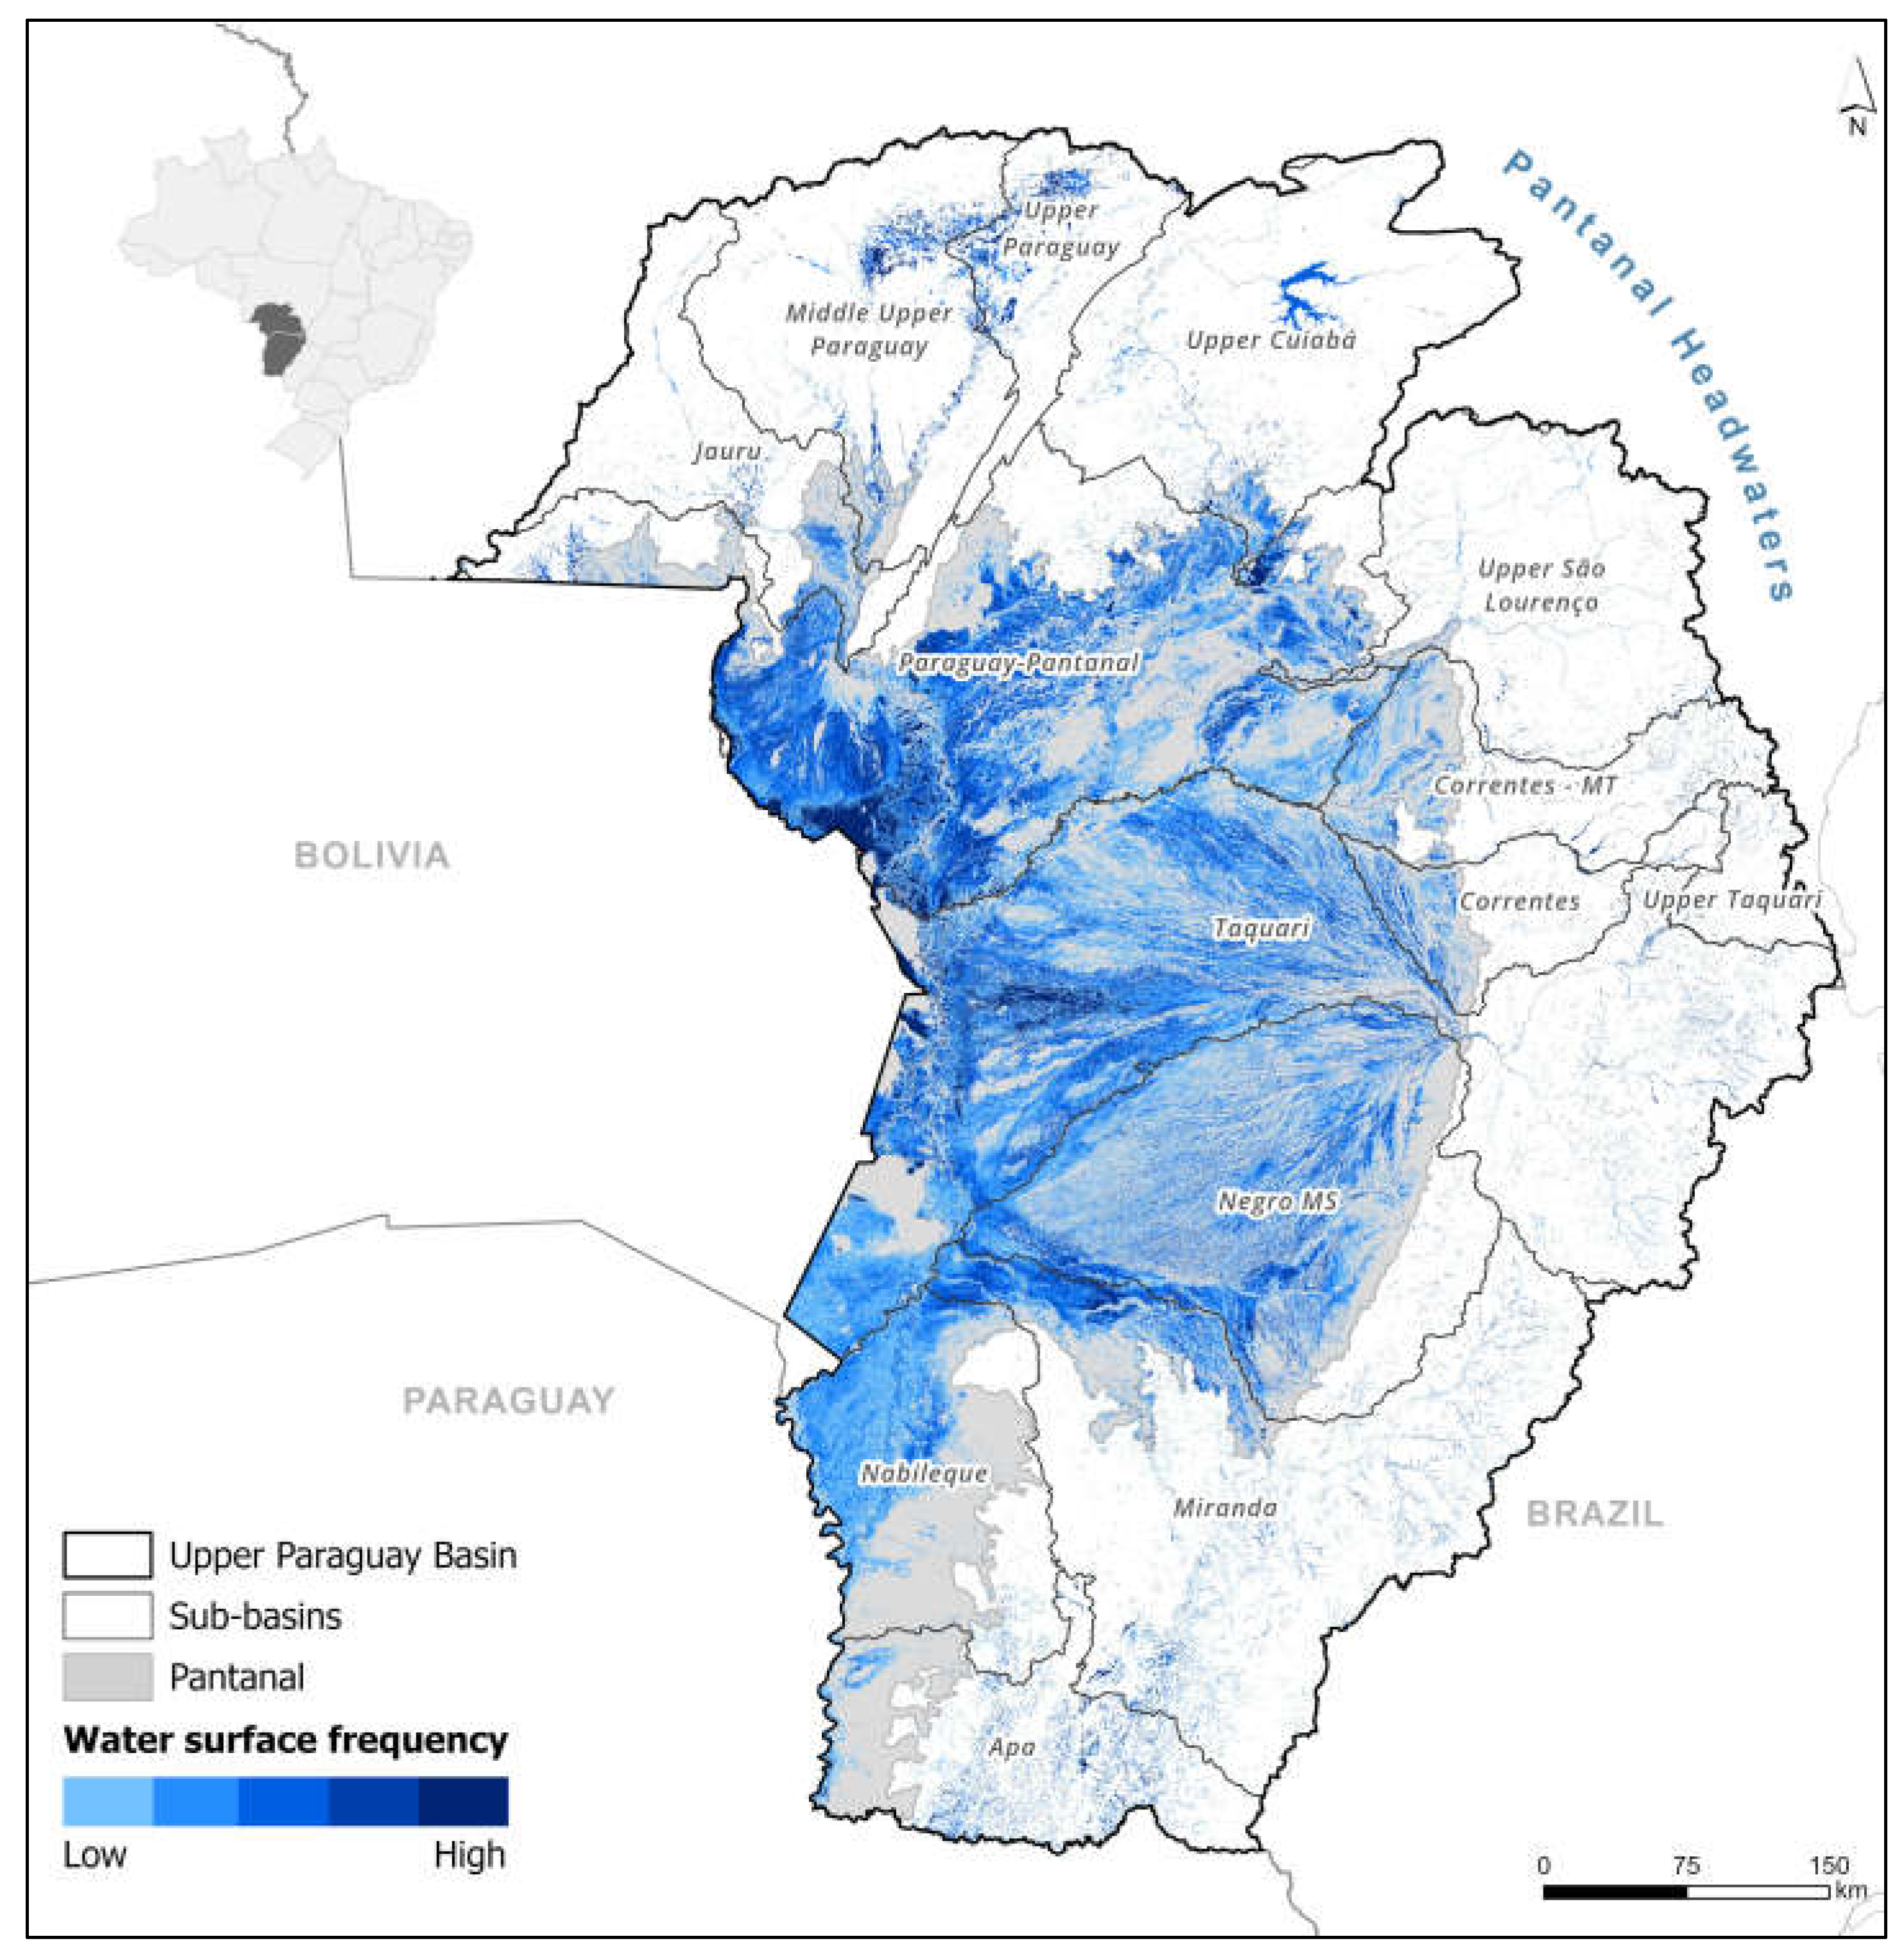
Despite the differences in the hydrology of the three basins, their flooded areas showed a systematically decreasing trend in the studied period [Figure 10]. In the case of the TB and MB sub-basins, their flooded areas were positively correlated with the downstream Paraguay river stage, indicating that a back-water effect of the latter also contributed to the flooding of the lower reaches of the two basins [65]. The same correlation was found for JB, but there is not a cause-effect relationship in the latter, owing it to the reduced flow contribution of the Jauru river to the Paraguay river stage.
Although it was expected that a positive relationship between rainfall volumes and flooded areas existed in Pantanal floodplain, this correlation was weaker than that of the Paraguay river stage at Ladario. As reported previously [43], the annual rainfall in the floodplain’s upland region is not capable of explaining the variability of the downstream flooded areas, the latter being better correlated with the rainfall volumes between December to April. Also, annual streamflow time series usually show weaker correlations than monthly series in the basin [72].
Long-memory processes (Hurst phenomenon) were detected in the time-series of the flooded areas of the three basins studied, as well as in the Paraguay river stage data. This inherent process causes dry years to occur in a sequence in the Pantanal floodplain, leading to severe droughts in the region [59,62]. This conclusion warrants the establishment of preventive measures regarding ranching, fishing, and fire control in the region, following the adaptive management philosophy [73].
5. Conclusions
Significant trends, correlations, and persistence were found in the 37 yr-long hydrologic time series of rainfall, streamflow, and flooded area of three contributing basins of the Pantanal floodplain, in Brazil. In the northern basins (Jauru and Taquari), decreasing trends of rainfall and streamflow were detected, whereas in the southern Miranda basin increasing trends in those variables were found. Distinct climates and their corresponding anomalies in the sub-basins contributed to the distinct hydrologic behaviors observed [15], which are associated with distinct ENSO patterns above and below the Tropic of Capricorn, in addition to the southeastern cyclonic circulation, leading to different humidity influxes to the northern and southern portions of the Pantanal basin [7].
In all three basins, the downstream flooded area decreased with time, and most of the hydrologic series were affected by long-memory process (Hurst phenomenon) and auto-correlation. While the flooded areas of two northern basins were correlated to upstream inflows, the back-water effect of the downstream Paraguay river influenced all three flooding zones, indicating that combined upstream and downstream processes affect the flood pulses in the region. The conclusions could be utilized in the establishment of preventive policies against severe droughts, following the adaptive management principle.
Author Contributions
Conceptualization, investigation and methodology, M.E.M.S.C. and H.M.L.C.; data collection and writing – original draft preparation, M.E.M.S.C.; writing – review and editing, H.M.L.C. and M.R.F.; supervision, H.M.L.C.
Funding
This research received no external funding.
Data Availability Statement
River discharge, observed rainfall and Paraguay river stage (Ladário ruler) are available at <https://www.snirh.gov.br/hidroweb>. CHIRPS (<https://www.chc.ucsb.edu/data/chirps>) and MapBiomas Water Project (<https://plataforma.agua.mapbiomas.org/water/brazil>) have open access to their datasets and were obtained using Google Earth Engine platform.
Acknowledgments
The authors thank the Forestry Engineering Department of the University of Brasília and WWF-Brasil for their technical and logistical support.
Conflicts of Interest
The authors declare no conflicts of interest.
References
- Hao, Z.; Hao, F.; Singh, V.P.; Zhang, X. Changes in the Severity of Compound Drought and Hot Extremes over Global Land Areas. Environ. Res. Lett. 2018, 13. [Google Scholar] [CrossRef]
- Libonati, R.; DaCamara, C.C.; Peres, L.F.; Sander de Carvalho, L.A.; Garcia, L.C. Rescue Brazil’s Burning Pantanal Wetlands. Nature 2020, 588, 217–219. [Google Scholar] [CrossRef] [PubMed]
- Leal Filho, W.; Azeiteiro, U.M.; Salvia, A.L.; Fritzen, B.; Libonati, R. Fire in Paradise: Why the Pantanal Is Burning. Environ. Sci. Policy 2021, 123, 31–34. [Google Scholar] [CrossRef]
- Chagas, V.B.P.; Chaffe, P.L.B.; Blöschl, G. Climate and Land Management Accelerate the Brazilian Water Cycle. Nat. Commun. 2022, 13. [Google Scholar] [CrossRef]
- Feron, S.; Cordero, R.R.; Damiani, A.; MacDonell, S.; Pizarro, J.; Goubanova, K.; Valenzuela, R.; Wang, C.; Rester, L.; Beaulieu, A. South America Is Becoming Warmer, Drier, and More Flammable. Commun. Earth Environ. 2024, 5, 1–10. [Google Scholar] [CrossRef]
- Vidal-Riveros, C.; Currey, B.; McWethy, D.B.; Bieng, M.A.N.; Souza-Alonso, P. Spatiotemporal Analysis of Wildfires and Their Relationship with Climate and Land Use in the Gran Chaco and Pantanal Ecoregions. Sci. Total Environ. 2024, 955, 176823. [Google Scholar] [CrossRef]
- Grimm, A.M. How Do La Niña Events Disturb the Summer Monsoon System in Brazil? Clim. Dyn. 2004, 22, 123–138. [Google Scholar] [CrossRef]
- Ropelewski, C.H.; Halpert, M.S. Precipitation Patterns Associated with the High Index Phase of the Southern Oscilation. J. Clim. 2 1989, 268–284. [Google Scholar] [CrossRef]
- Chaves, H.M.L.; Lorena, D.R. Assessing Reservoir Reliability Using Classical and Long-Memory Statistics. J. Hydrol. Reg. Stud. 2019, 26, 100641. [Google Scholar] [CrossRef]
- Thielen, D.; Schuchmann, K.L.; Ramoni-Perazzi, P.; Marquez, M.; Rojas, W.; Quintero, J.I.; Marques, M.I. Quo Vadis Pantanal? Expected Precipitation Extremes and Drought Dynamics from Changing Sea Surface Temperature. PLoS One 2020, 15, 1–25. [Google Scholar] [CrossRef]
- Genta, J.L.; Perez-Iribarren, G.; Mechoso, C.R. A Recent Increasing Trend in the Streamflow of Rivers in Southeastern South America. J. Clim. 1998, 11, 2858–2862. [Google Scholar] [CrossRef]
- IPCC Climate Change 2023: Synthesis Report. Contribution of Working Groups I, II and III to the Sixth Assessment Report of the Intergovernmental Panel on Climate Change; 2023.
- Hoffmann, W.A.; Jackson, R.B. Vegetation-Climate Feedbacks in the Conversion of Tropical Savanna to Grassland. J. Clim. 2000, 13, 1593–1602. [Google Scholar] [CrossRef]
- Debortoli, N.S.; Dubreuil, V.; Hirota, M.; Filho, S.R.; Lindoso, D.P.; Nabucet, J. Detecting Deforestation Impacts in Southern Amazonia Rainfall Using Rain Gauges. Int. J. Climatol. 2017, 37, 2889–2900. [Google Scholar] [CrossRef]
- Campos, J. de O.; Chaves, H.M.L. Trends and Variabilities in the Historical Series of Monthly and Annual Precipitation in Cerrado Biome in the Period 1977-2010. Rev. Bras. Meteorol. 2020, 35, 157–169. [Google Scholar] [CrossRef]
- Salmona, Y.B.; Matricardi, E.A.T.; Skole, D.L.; Silva, J.F.A.; Coelho Filho, O. de A.; Pedlowski, M.A.; Sampaio, J.M.; Castrillón, L.C.R.; Brandão, R.A.; Silva, A.L. da; et al. A Worrying Future for River Flows in the Brazilian Cerrado Provoked by Land Use and Climate Changes. Sustain. 2023, 15. [Google Scholar] [CrossRef]
- Gonçalves, H.C.; Mercante, M.A.; Santos, E.T. Hydrological Cycle. Dict. Phys. Geogr. Fourth Ed. 2016, 71, 272–273. [Google Scholar] [CrossRef] [PubMed]
- Tucci, C.E.M.; Clarke, R.T. Impact Og Changes in Vegetation Cover on Runoff: Review of Terrestrail Hydrological Cycle Processes. Global Cycle Description of Hydrological Processes in the Basin. 1997, 2, 135–152. [Google Scholar]
- Oliveira, P.T.; Nearing, M.A.; Moran, S.M.; Goodrich, D.C.; Wendland, E.; Gupta, H. V. Trends in Water Balance Components across the Brazilia Cerrado. 2014, 20, 7100–7114. [CrossRef]
- Bruijinzeel, L.A. Hydrology of Moist Tropical Forests and Effects of Conversion: A State of Knowledge Review; Paris, 1990.
- Blöschl, G. unte.; Ardoin-Bardin, S.; Bonell, M.; Dorninger, M.; Goodrich, D.; Gutknecht, D.; Matamoros, D.; Merz, B.; Shand, P.; Szolgay, J. At What Scales Do Climate Variability and Land Cover Change Impact on Flooding and Low Flows? Hydrol. Process 2007, 21, 1241–1247. [Google Scholar] [CrossRef]
- Marengo, J.A.; Tomasella, J.; Uvo, C.R. Trends in Streamflow and Rainfall in Tropical South America: Amazonia, Eastern Brazil, and Northwestern Peru. J. Geophys. Res. Atmos. 1998, 103, 1775–1783. [Google Scholar] [CrossRef]
- Collischonn, W.; Tucci, C.E.M.; Clarke, R.T. Further Evidence of Changes in the Hydrological Regime of the River Paraguay: Part of a Wider Phenomenon of Climate Change? J. Hydrol. 2001, 245, 218–238. [Google Scholar] [CrossRef]
- Hirsch, R.M. A Perspective on Nonstationarity and Water Management. J. Am. Water Resour. Assoc. 2011, 47, 436–446. [Google Scholar] [CrossRef]
- Junk, W.J. The Flood Pulse Concept in River-Floodplain Systems. In Proceedings of the SIL Proceedings; 1922-2010; 1989; pp. 110–127. [Google Scholar]
- Poff, N.L.R.; Allan, J.D.; Bain, M.B.; Karr, J.R.; Prestegaard, K.L.; Richter, B.D.; Sparks, R.E.; Stromberg, J.C. The Natural Flow Regime: A Paradigm for River Conservation and Restoration. Bioscience 1997, 47, 769–784. [Google Scholar] [CrossRef]
- Junk, W.J. Flood Pulsing and the Linkages between Terrestrial, Aquatic, and Wetland Systems. In Proceedings of the SIL Proceedings; 2005; Vol. 29 (1); pp. 11–38. [Google Scholar]
- Junk, W.J.; Da Cunha, C.N.; Wantzen, K.M.; Petermann, P.; Strüssmann, C.; Marques, M.I.; Adis, J. Biodiversity and Its Conservation in the Pantanal of Mato Grosso, Brazil. Aquat. Sci. 2006, 68, 278–309. [Google Scholar] [CrossRef]
- Ivory, S.J.; McGlue, M.M.; Spera, S.; Silva, A.; Bergier, I. Vegetation, Rainfall, and Pulsing Hydrology in the Pantanal, the World’s Largest Tropical Wetland. Environ. Res. Lett. 2019, 14. [Google Scholar] [CrossRef]
- Bergier, I. Effects of Highland Land-Use over Lowlands of the Brazilian Pantanal. Sci. Total Environ. 2013, 463–464, 1060–1066. [Google Scholar] [CrossRef]
- Bravo, J.M.; Collischonn, W.; da Paz, A.R.; Allasia, D.; Domecq, F. Impact of Projected Climate Change on Hydrologic Regime of the Upper Paraguay River Basin. Clim. Change 2014, 127, 27–41. [Google Scholar] [CrossRef]
- Leite-Filho, A.T.; Soares-Filho, B.S.; Oliveira, U.; Coe, M. Intensification of Climate Change Impacts on Agriculture in the Cerrado Due to Deforestation. Nat. Sustain. 2024. [Google Scholar] [CrossRef]
- Diffenbaugh, N.S.; Singh, D.; Mankin, J.S.; Horton, D.E.; Swain, D.L.; Touma, D.; Charland, A.; Liu, Y.; Haugen, M.; Tsiang, M.; et al. Quantifying the Influence of Global Warming on Unprecedented Extreme Climate Events. Proc. Natl. Acad. Sci. U. S. A. 2017, 114, 4881–4886. [Google Scholar] [CrossRef]
- Dey, P.; Mishra, A. Separating the Impacts of Climate Change and Human Activities on Streamflow: A Review of Methodologies and Critical Assumptions. J. Hydrol. 2017, 548, 278–290. [Google Scholar] [CrossRef]
- Spracklen, D. V.; Arnold, S.R.; Taylor, C.M. Observations of Increased Tropical Rainfall Preceded by Air Passage over Forests. Nature 2012, 489, 282–285. [Google Scholar] [CrossRef]
- Marengo, J.A. Variations and Change in South American Streamflow. Clim. Change 1995, 31, 99–117. [Google Scholar] [CrossRef]
- Cigizoglu, H.K.; Bayazit, M.; Önöz, B. Trends in the Maximum, Mean, and Low Flows of Turkish Rivers. J. Hydrometeorol. 2005, 6, 280–290. [Google Scholar] [CrossRef]
- Hamilton, S.K. Human Impacts on Hydrology in the Pantanal Wetland of South America. Water Sci. Technol. 2002, 45, 35–44. [Google Scholar] [CrossRef] [PubMed]
- Mercante, M.A.; Rodrigues, S.C.; Ross, J.L.S. Geomorphology and Habitat Diversity in the Pantanal. Brazilian J. Biol. 2011, 71, 233–240. [Google Scholar] [CrossRef] [PubMed]
- Alho, C.J.R.; Sabino, J. Seasonal Pantanal Flood Pulse: Implications for Biodiversity Conservation – a Review. Oecologia Aust. 2012, 16, 958–978. [Google Scholar] [CrossRef]
- Alho, C.J.R.; Silva, J.S.V. Effects of Severe Floods and Droughts on Wildlife of the Pantanal Wetland (Brazil)-a Review. Animals 2012, 2, 591–610. [Google Scholar] [CrossRef]
- Roque, F.O.; Ochoa-Quintero, J.; Ribeiro, D.B.; Sugai, L.S.M.; Costa-Pereira, R.; Lourival, R.; Bino, G. Upland Habitat Loss as a Threat to Pantanal Wetlands. Conserv. Biol. 2016, 30, 1131–1134. [Google Scholar] [CrossRef]
- Pereira, G.; Ramos, R. de C.; Rocha, L.C.; Brunsell, N.A.; Merino, E.R.; Mataveli, G.A.V.; Cardozo, F. da S. Rainfall Patterns and Geomorphological Controls Driving Inundation Frequency in Tropical Wetlands: How Does the Pantanal Flood? Prog. Phys. Geogr. 2021, 45, 669–686. [Google Scholar] [CrossRef]
- WWF Brazil Early Warning to Mitigate the Impacts of Drought in the Pantanal Available online: https://wwfbrnew.awsassets.panda.org/downloads/0107-nota-tecnica---crise-hidrica.pdf.
- Woodward, C.; Shulmeister, J.; Larsen, J.; Jacobsen, G.E.; Zawadzki, A. The Hydrological Legacy of Deforestation on Global Wetlands. Science (80-. ). 2014, 346, 844–847. [Google Scholar] [CrossRef]
- S. Debortoli, N.; Dubreuil, V.; Funatsu, B.; Delahaye, F.; de Oliveira, C.H.; Rodrigues-Filho, S.; Saito, C.H.; Fetter, R. Rainfall Patterns in the Southern Amazon: A Chronological Perspective (1971–2010). Clim. Change 2015, 132, 251–264. [Google Scholar] [CrossRef]
- Souza, S.A. De; Matos, B.A.; Troger, F.H.; De, T.L.L. Stationarity Analysis of Streamflow Time Series at Paraguai Basin. In Proceedings of the XXII Simpósio Brasileiro de Recursos Hídricos; 2015; pp. 1–8. [Google Scholar]
- Colman, C.B.; Oliveira, P.T.S.; Almagro, A.; Soares-Filho, B.S.; Rodrigues, D.B.B. Effects of Climate and Land-Cover Changes on Soil Erosion in Brazilian Pantanal. Sustain. 2019, 11. [Google Scholar] [CrossRef]
- Assine, M.L.; Macedo, H.A.; Stevaux, J.C.; Bergier, I.; Padovani, C.R.; Silva, A. Avulsive Rivers in the Hydrology of the Pantanal Wetland. Handb. Environ. Chem. 2016, 37, 83–110. [Google Scholar] [CrossRef]
- Alvares, C.A.; Stape, J.L.; Sentelhas, P.C.; De Moraes Gonçalves, J.L.; Sparovek, G. Köppen’s Climate Classification Map for Brazil. Meteorol. Zeitschrift 2013, 22, 711–728. [Google Scholar] [CrossRef]
- Gudmundsson, L.; Bremnes, J.B.; Haugen, J.E.; Engen-Skaugen, T. Technical Note: Downscaling RCM Precipitation to the Station Scale Using Statistical Transformations – A Comparison of Methods. Hydrol. Earth Syst. Sci. 2012, 16, 3383–3390. [Google Scholar] [CrossRef]
- Cavalcante, R.B.L.; Ferreira, D.B. da S.; Pontes, P.R.M.; Tedeschi, R.G.; da Costa, C.P.W.; de Souza, E.B. Evaluation of Extreme Rainfall Indices from CHIRPS Precipitation Estimates over the Brazilian Amazonia. Atmos. Res. 2020, 238, 104879. [Google Scholar] [CrossRef]
- Correia Filho, W.L.F.; de Oliveira-Júnior, J.F.; da Silva Junior, C.A.; Santiago, D. de B. Influence of the El Niño–Southern Oscillation and the Sypnotic Systems on the Rainfall Variability over the Brazilian Cerrado via Climate Hazard Group InfraRed Precipitation with Station Data. Int. J. Climatol. 2022, 42, 3308–3322. [Google Scholar] [CrossRef]
- WMO Calculation of Monthly and Annual 30-Year Standard Normals; Ginebra, Switzerland, 1989.
- Dahmen, E.R.; Hall, M.J. Screening of Hydrological Data: Tests for Stationarity and Relative Consistency; International Institute for Land Reclamation and Improvement/ILRI: Wangeningen, 1990; ISBN 9070754231. [Google Scholar]
- Salas, J.D. Analysis and Modeling of Hydrologic Time Series. In Handbook of Hydrology; Maidmend, D.R., Ed.; New York, 1992; pp. 19.1-19.72.
- Libiseller, C.; Grimvall, A. Performance of Partial Mann-Kendall Tests for Trend Detection in the Presence of Covariates. Environmetrics 2002, 13, 71–84. [Google Scholar] [CrossRef]
- Hurst, H.E.A. A Suggested Statistical Model of Some Time Series Which Occur in Nature 1956.
- Chandrasekaran, S.; Poomalai, S.; Saminathan, B.; Suthanthiravel, S.; Sundaram, K.; Abdul Hakkim, F.F. An Investigation on the Relationship between the Hurst Exponent and the Predictability of a Rainfall Time Series. Meteorol. Appl. 2019, 26, 511–519. [Google Scholar] [CrossRef]
- Mandelbrot, B. & Wallis, J. Range R / S in the Measurement Long Run Statistical Dependence. Water Resour. Res. 1969, 5, 967–988. [Google Scholar]
- Mirza, M.Q.; Warrick, R.A.; Ericksen, N.J.; Kenny, G.J. Tendances et Persistance Des Précipitations Des Bassins Des Fleuves Gange, Brahmapoutre et Meghna. Hydrol. Sci. J. 1998, 43, 845–858. [Google Scholar] [CrossRef]
- Tatli, H. Detecting Persistence of Meteorological Drought via the Hurst Exponent. Meteorol. Appl. 2015, 22, 763–769. [Google Scholar] [CrossRef]
- SALAS, J.D. Analysis and Modeling of Hydrologic Time Series; New York, USA, 1992.
- Yue, S.; Pilon, P.; Cavadias, G. Power of the Mann-Kendall and Spearman’s Rho Tests for Detecting Monotonic Trends in Hydrological Series. J. Hydrol. 2002, 259, 254–271. [Google Scholar] [CrossRef]
- Stevaux, J.C.; Macedo, H. de A.; Assine, M.L.; Silva, A. Changing Fluvial Styles and Backwater Flooding along the Upper Paraguay River Plains in the Brazilian Pantanal Wetland. Geomorphology 2020, 350, 106906. [Google Scholar] [CrossRef]
- Marengo, J.A.; Oliveira, G.S.; Alves, L.M. Climate Change Scenarios in the Pantanal. Handb. Environ. Chem. 2016, 37, 227–238. [Google Scholar] [CrossRef]
- An, S. Il; Wang, B. Interdecadal Change of the Structure of the ENSO Mode and Its Impact on the ENSO Frequency. J. Clim. 2000, 13, 2044–2055. [Google Scholar] [CrossRef]
- Rodrigues, R.R.; Michael, J. McPhaden Why Did the 2011–2012 La Niña Cause a Severe Drought in the Brazilian Northeast? 2014. [Google Scholar]
- Cai, W.; McPhaden, M.J.; Grimm, A.M.; Rodrigues, R.R.; Taschetto, A.S.; Garreaud, R.D.; Dewitte, B.; Poveda, G.; Ham, Y.G.; Santoso, A.; et al. Climate Impacts of the El Niño–Southern Oscillation on South America. Nat. Rev. Earth Environ. 2020, 1, 215–231. [Google Scholar] [CrossRef]
- Chaves, H.M.L.; Lorena, D.R. Assessing Reservoir Reliability Using Classical and Long-Memory Statistics. J. Hydrol. Reg. Stud. 2019, 26, 100641. [Google Scholar] [CrossRef]
- Marques, M.C.S.; Rodriguez, D.A. Impacts of the Landscape Changes in the Low Streamflows of Pantanal Headwaters—Brazil. Hydrol. Process. 2022, 36. [Google Scholar] [CrossRef]
- Rao, A.R.; Bhattacharya, D. Effect of Short-Term Memory on Hurst Phenomenon. J. Hydrol. Eng 2001, 125–131. [Google Scholar] [CrossRef]
- Crossman, N.D. Drought Resilience, Adaptation and Management Policy ( DRAMP ) Framework. Support. Tech. Guidel. 2018, 17. [Google Scholar]
Figure 1.
Upper Paraguay river basin with elevation, with corresponding sub-basins.
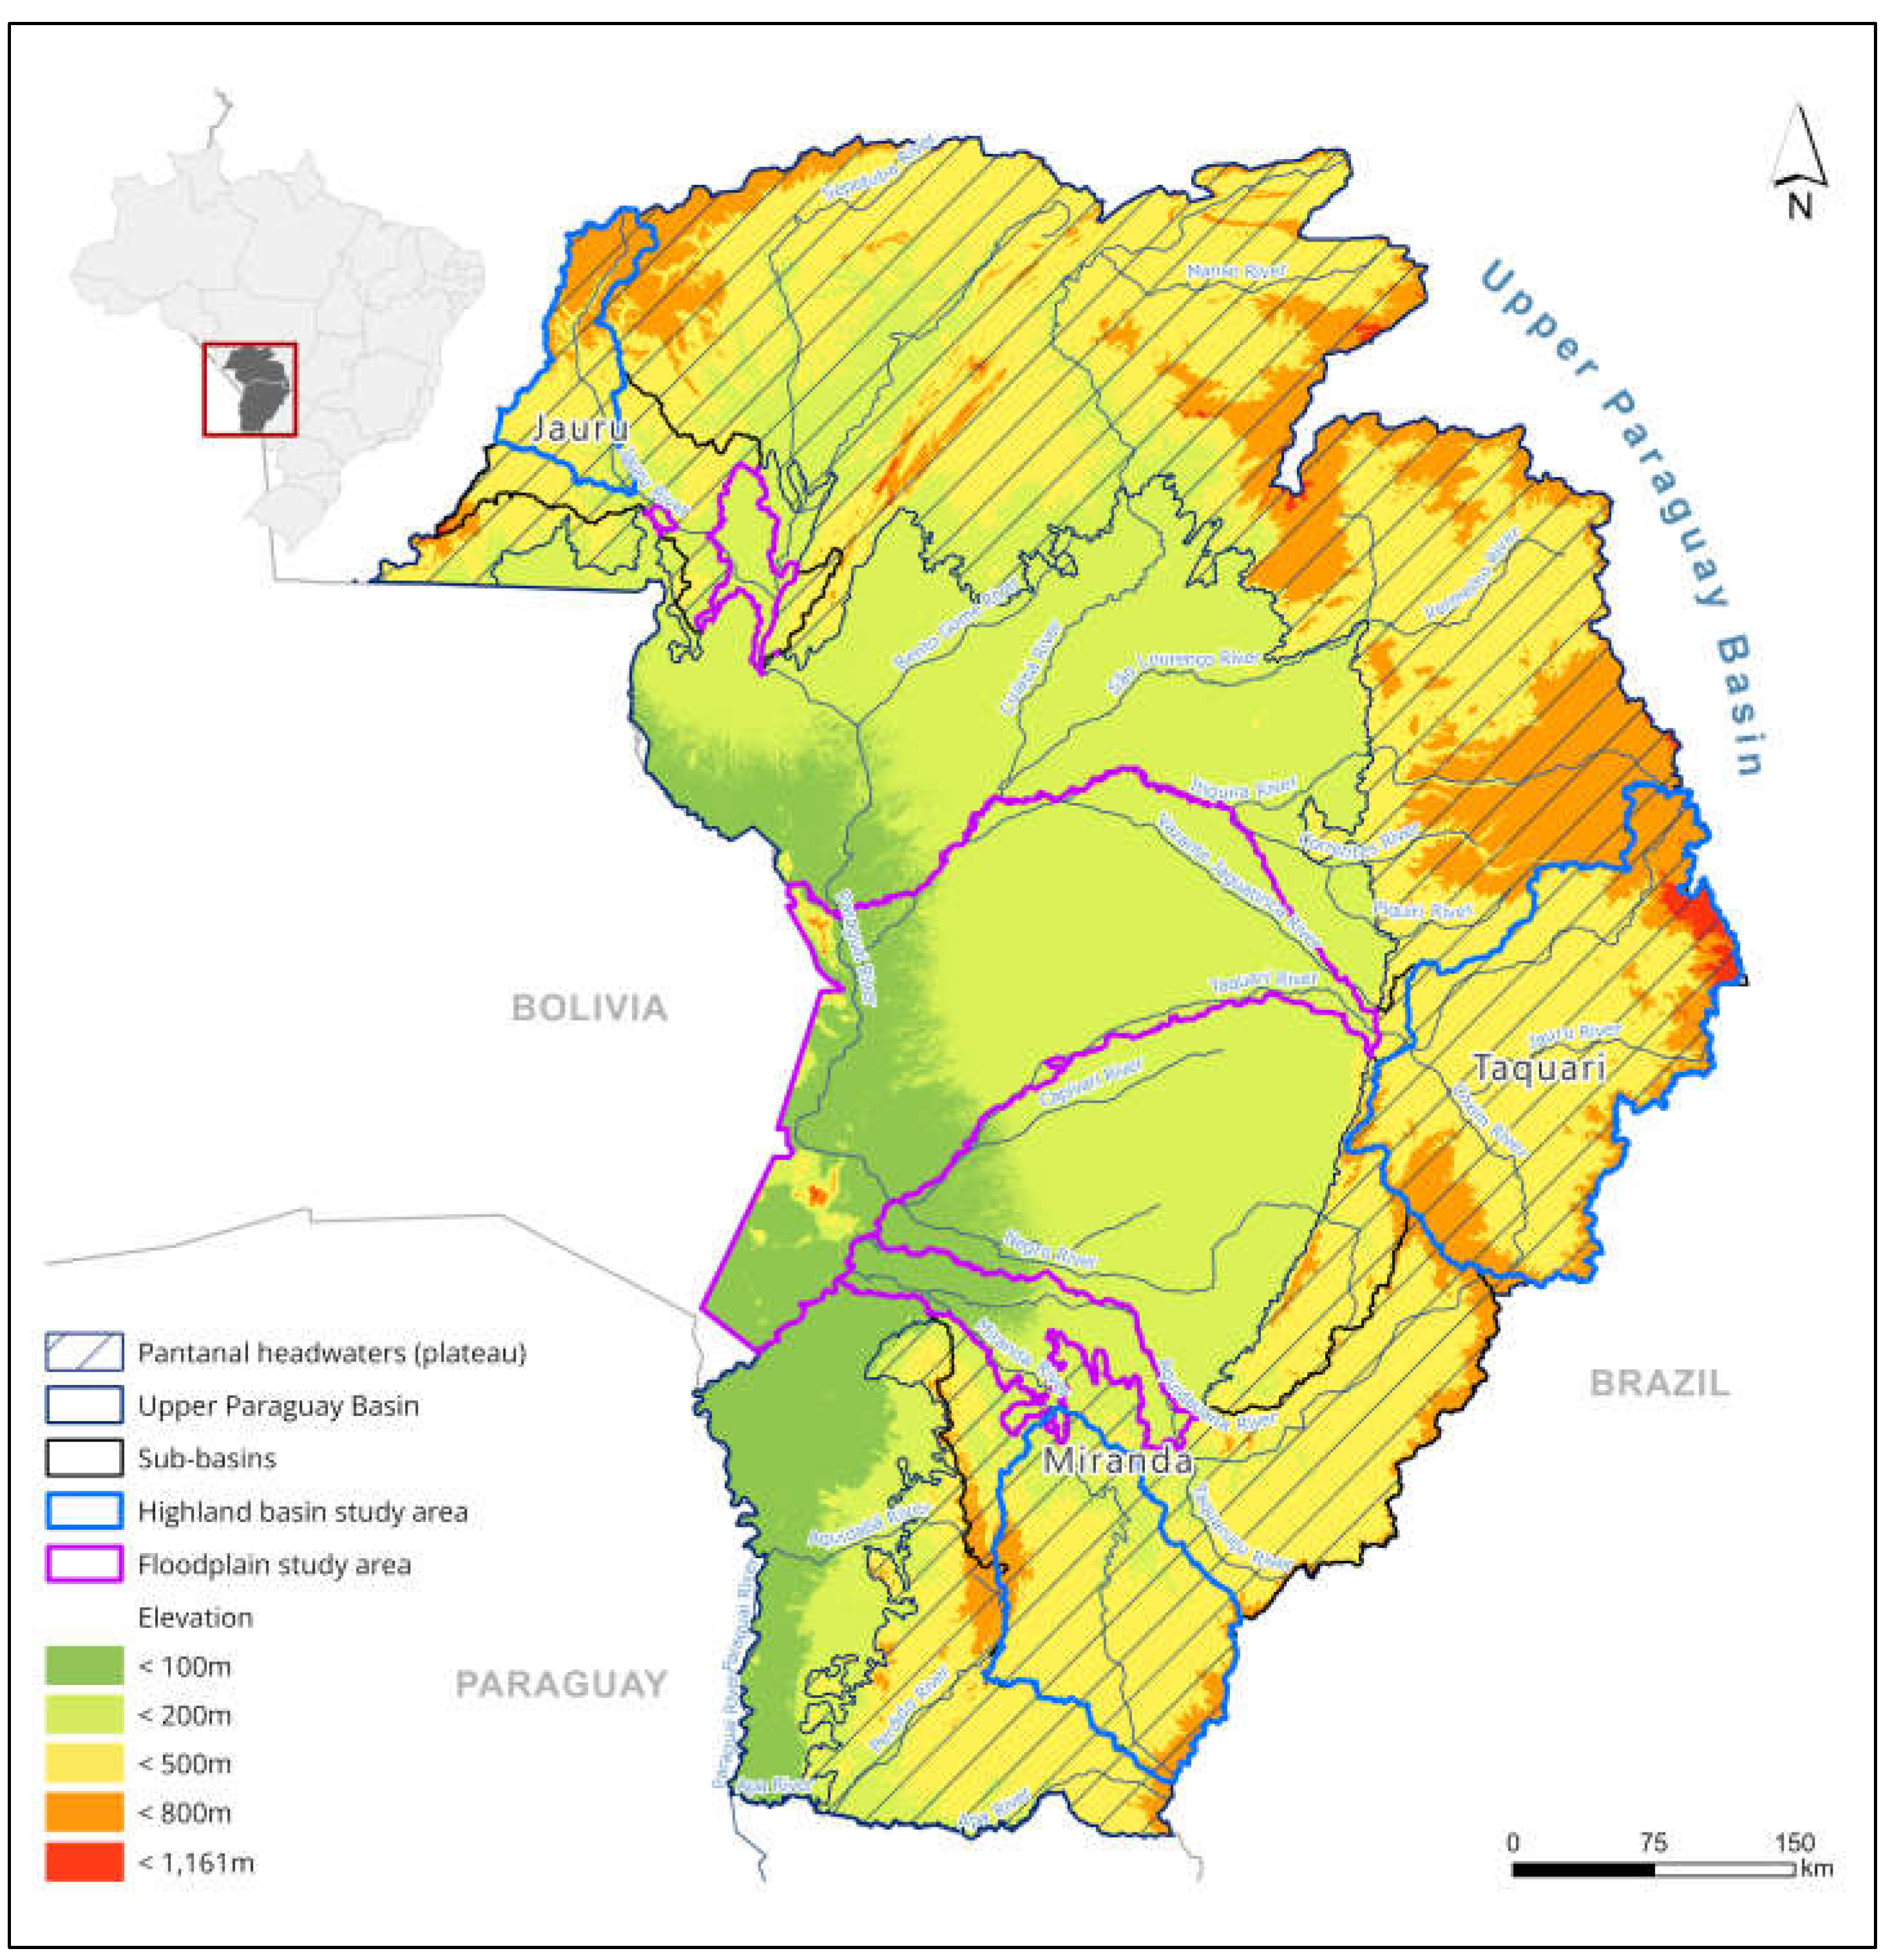
Figure 2.
Upper Paraguay river basin, with corresponding sub-basins, study area, and streamflow gaging stations.
Figure 2.
Upper Paraguay river basin, with corresponding sub-basins, study area, and streamflow gaging stations.
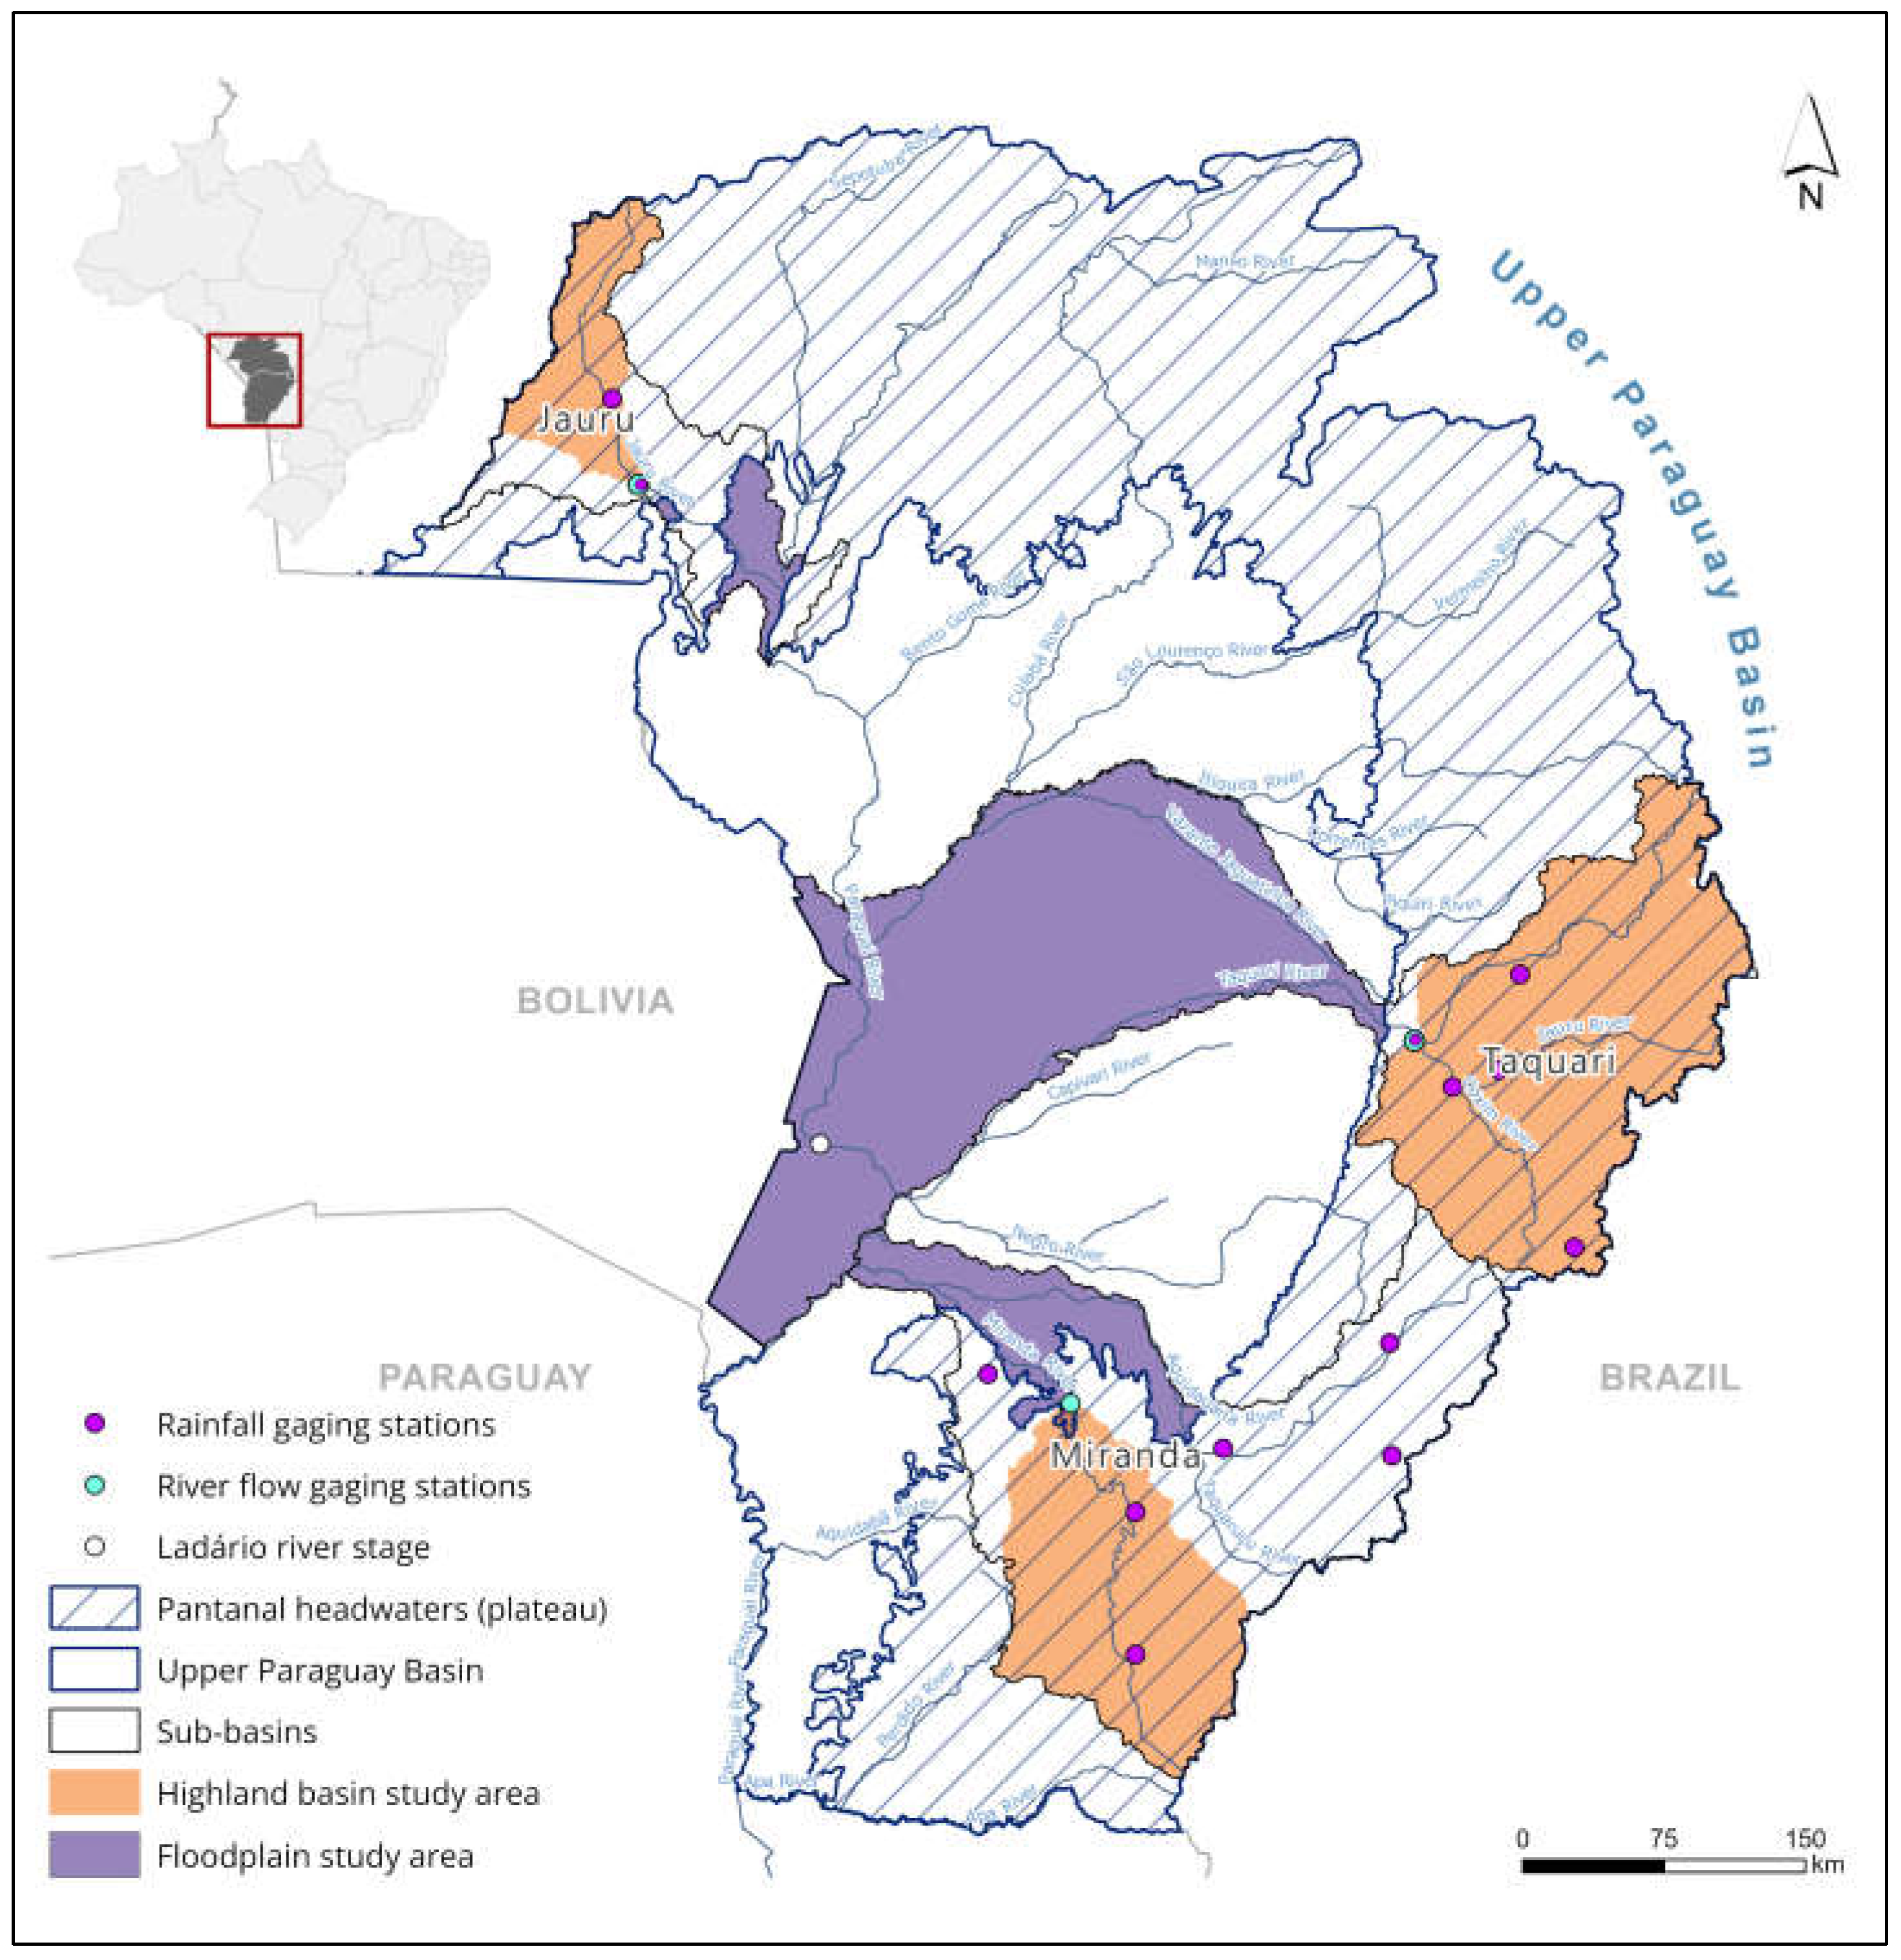
Figure 3.
Upper Paraguay Basin, with the three sub-basins, streamflow and rainfall stations, and Köppen climate zones.
Figure 3.
Upper Paraguay Basin, with the three sub-basins, streamflow and rainfall stations, and Köppen climate zones.
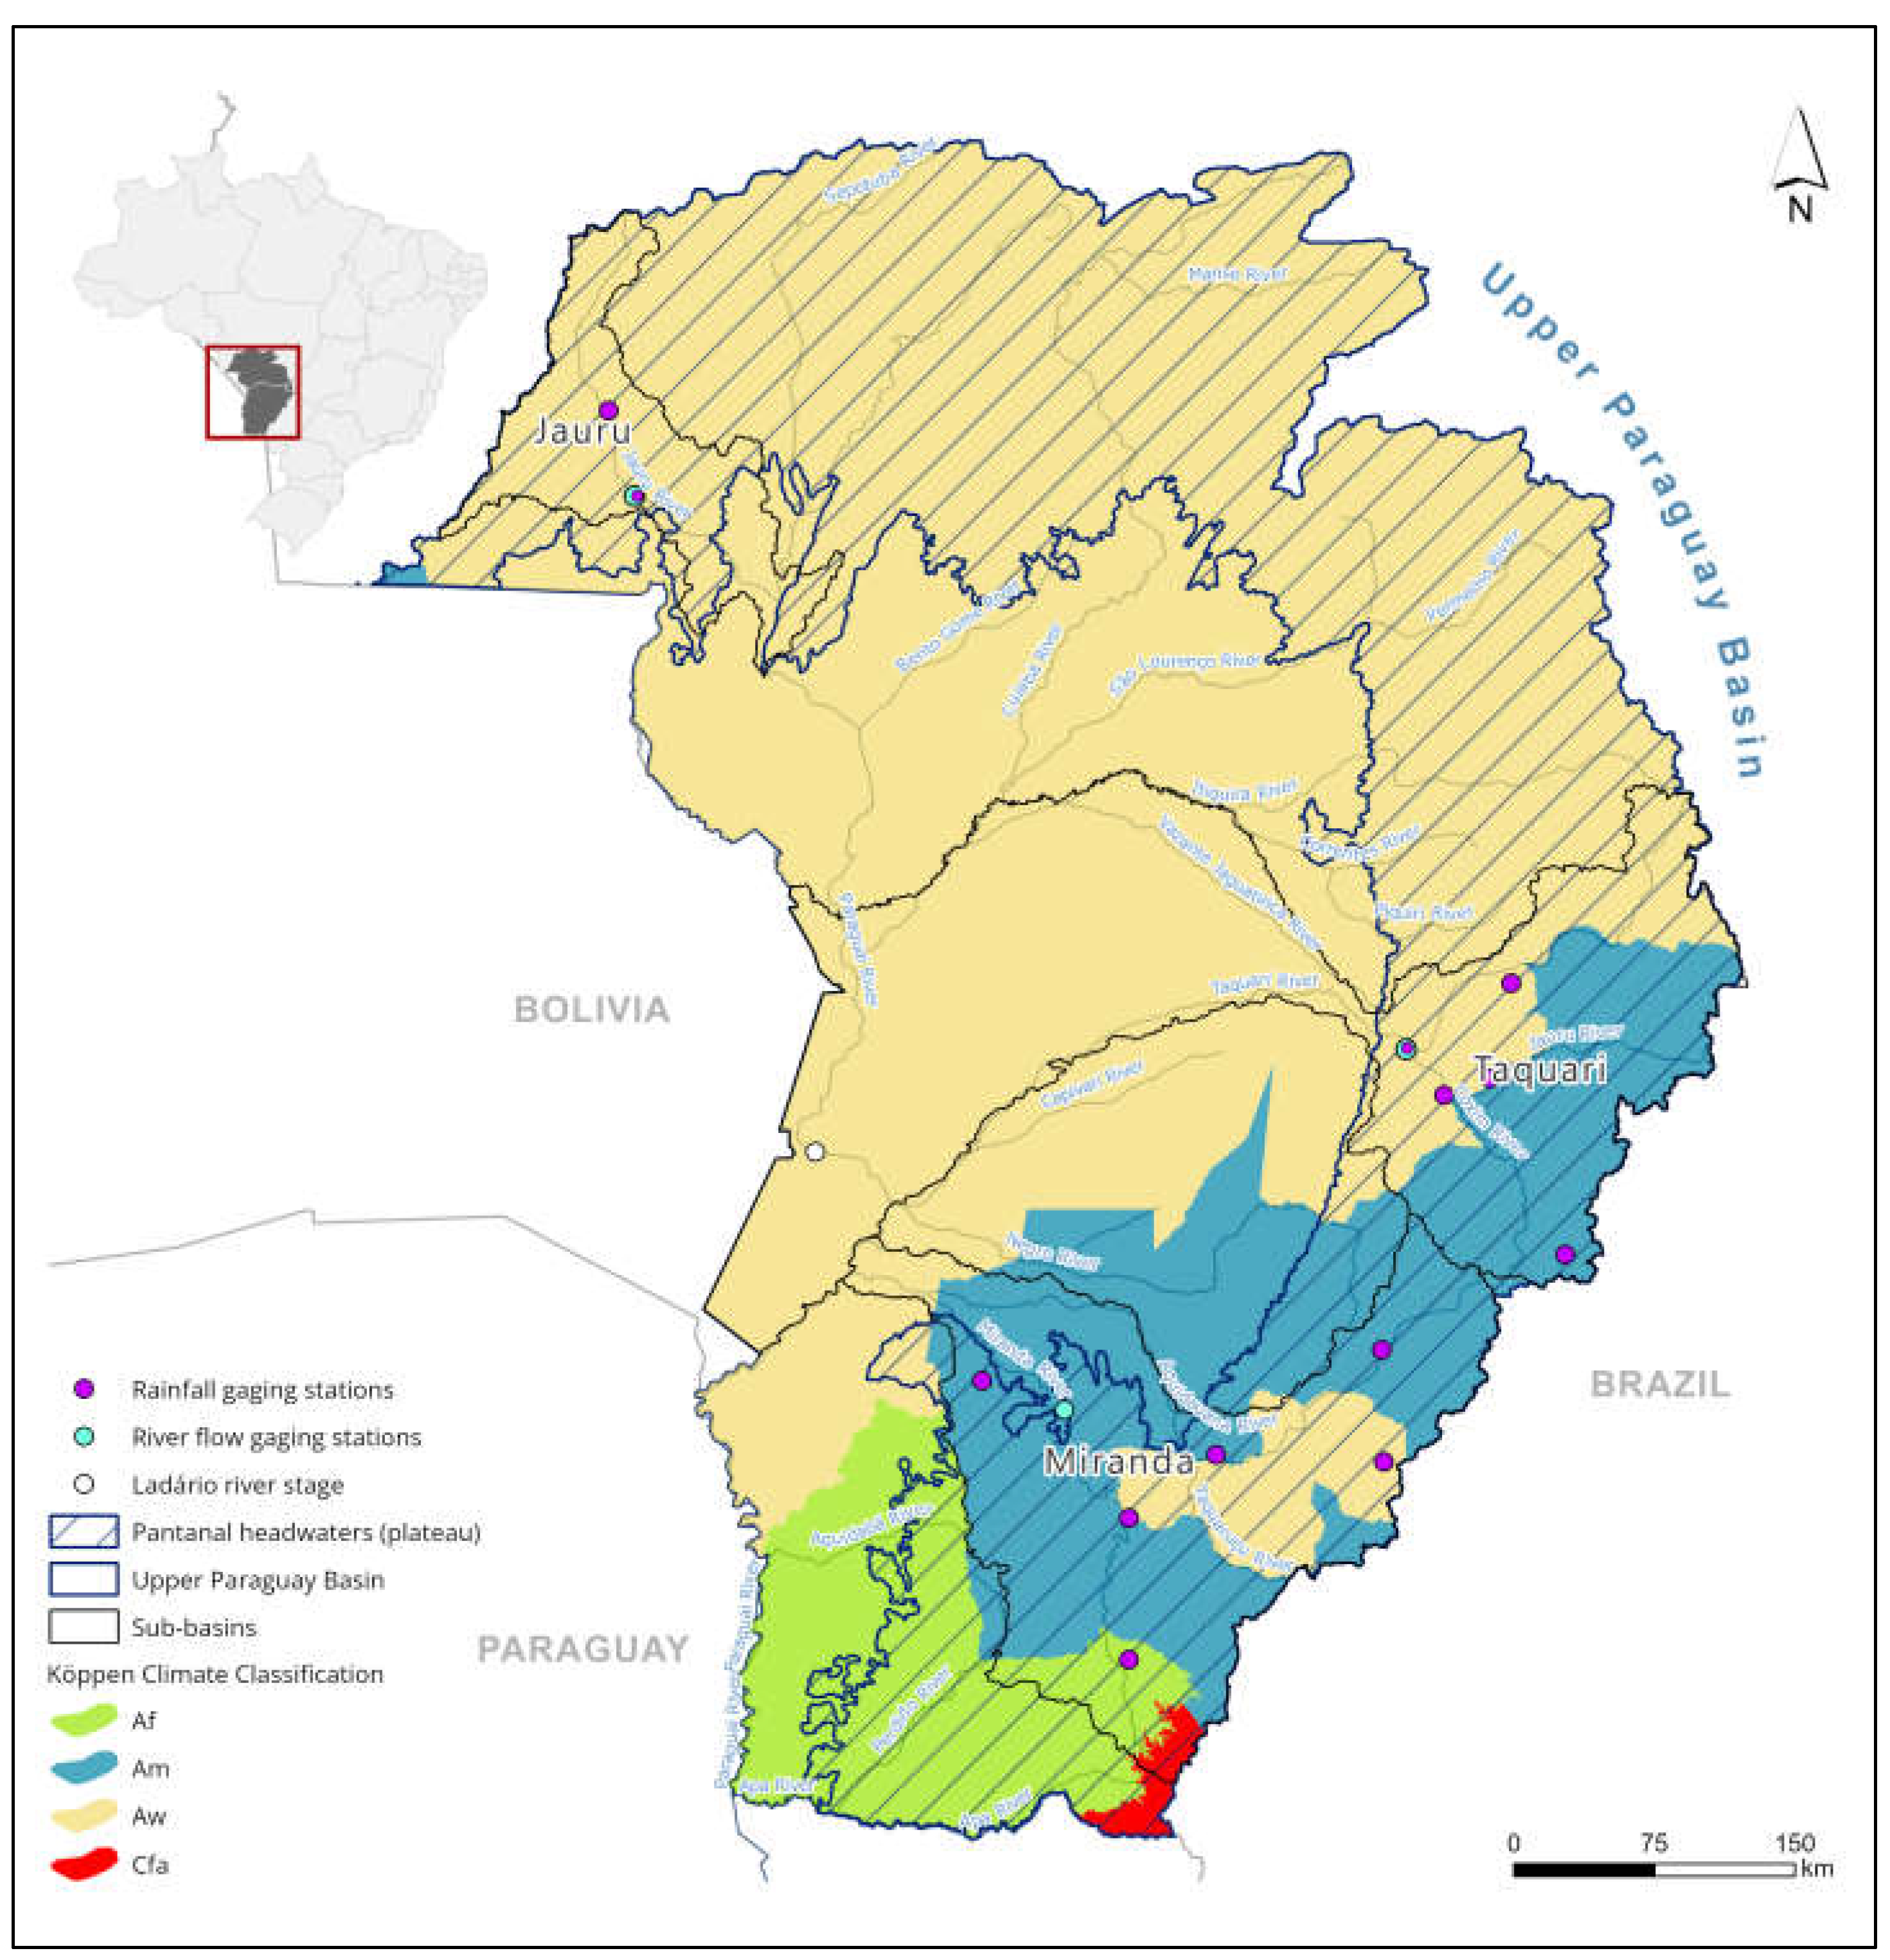
Figure 4.
Time series if annual rainfall (a) and discharge (b) of the Jauru basin, their correlation (c), and the time series of the downstream flooded area (d).
Figure 4.
Time series if annual rainfall (a) and discharge (b) of the Jauru basin, their correlation (c), and the time series of the downstream flooded area (d).
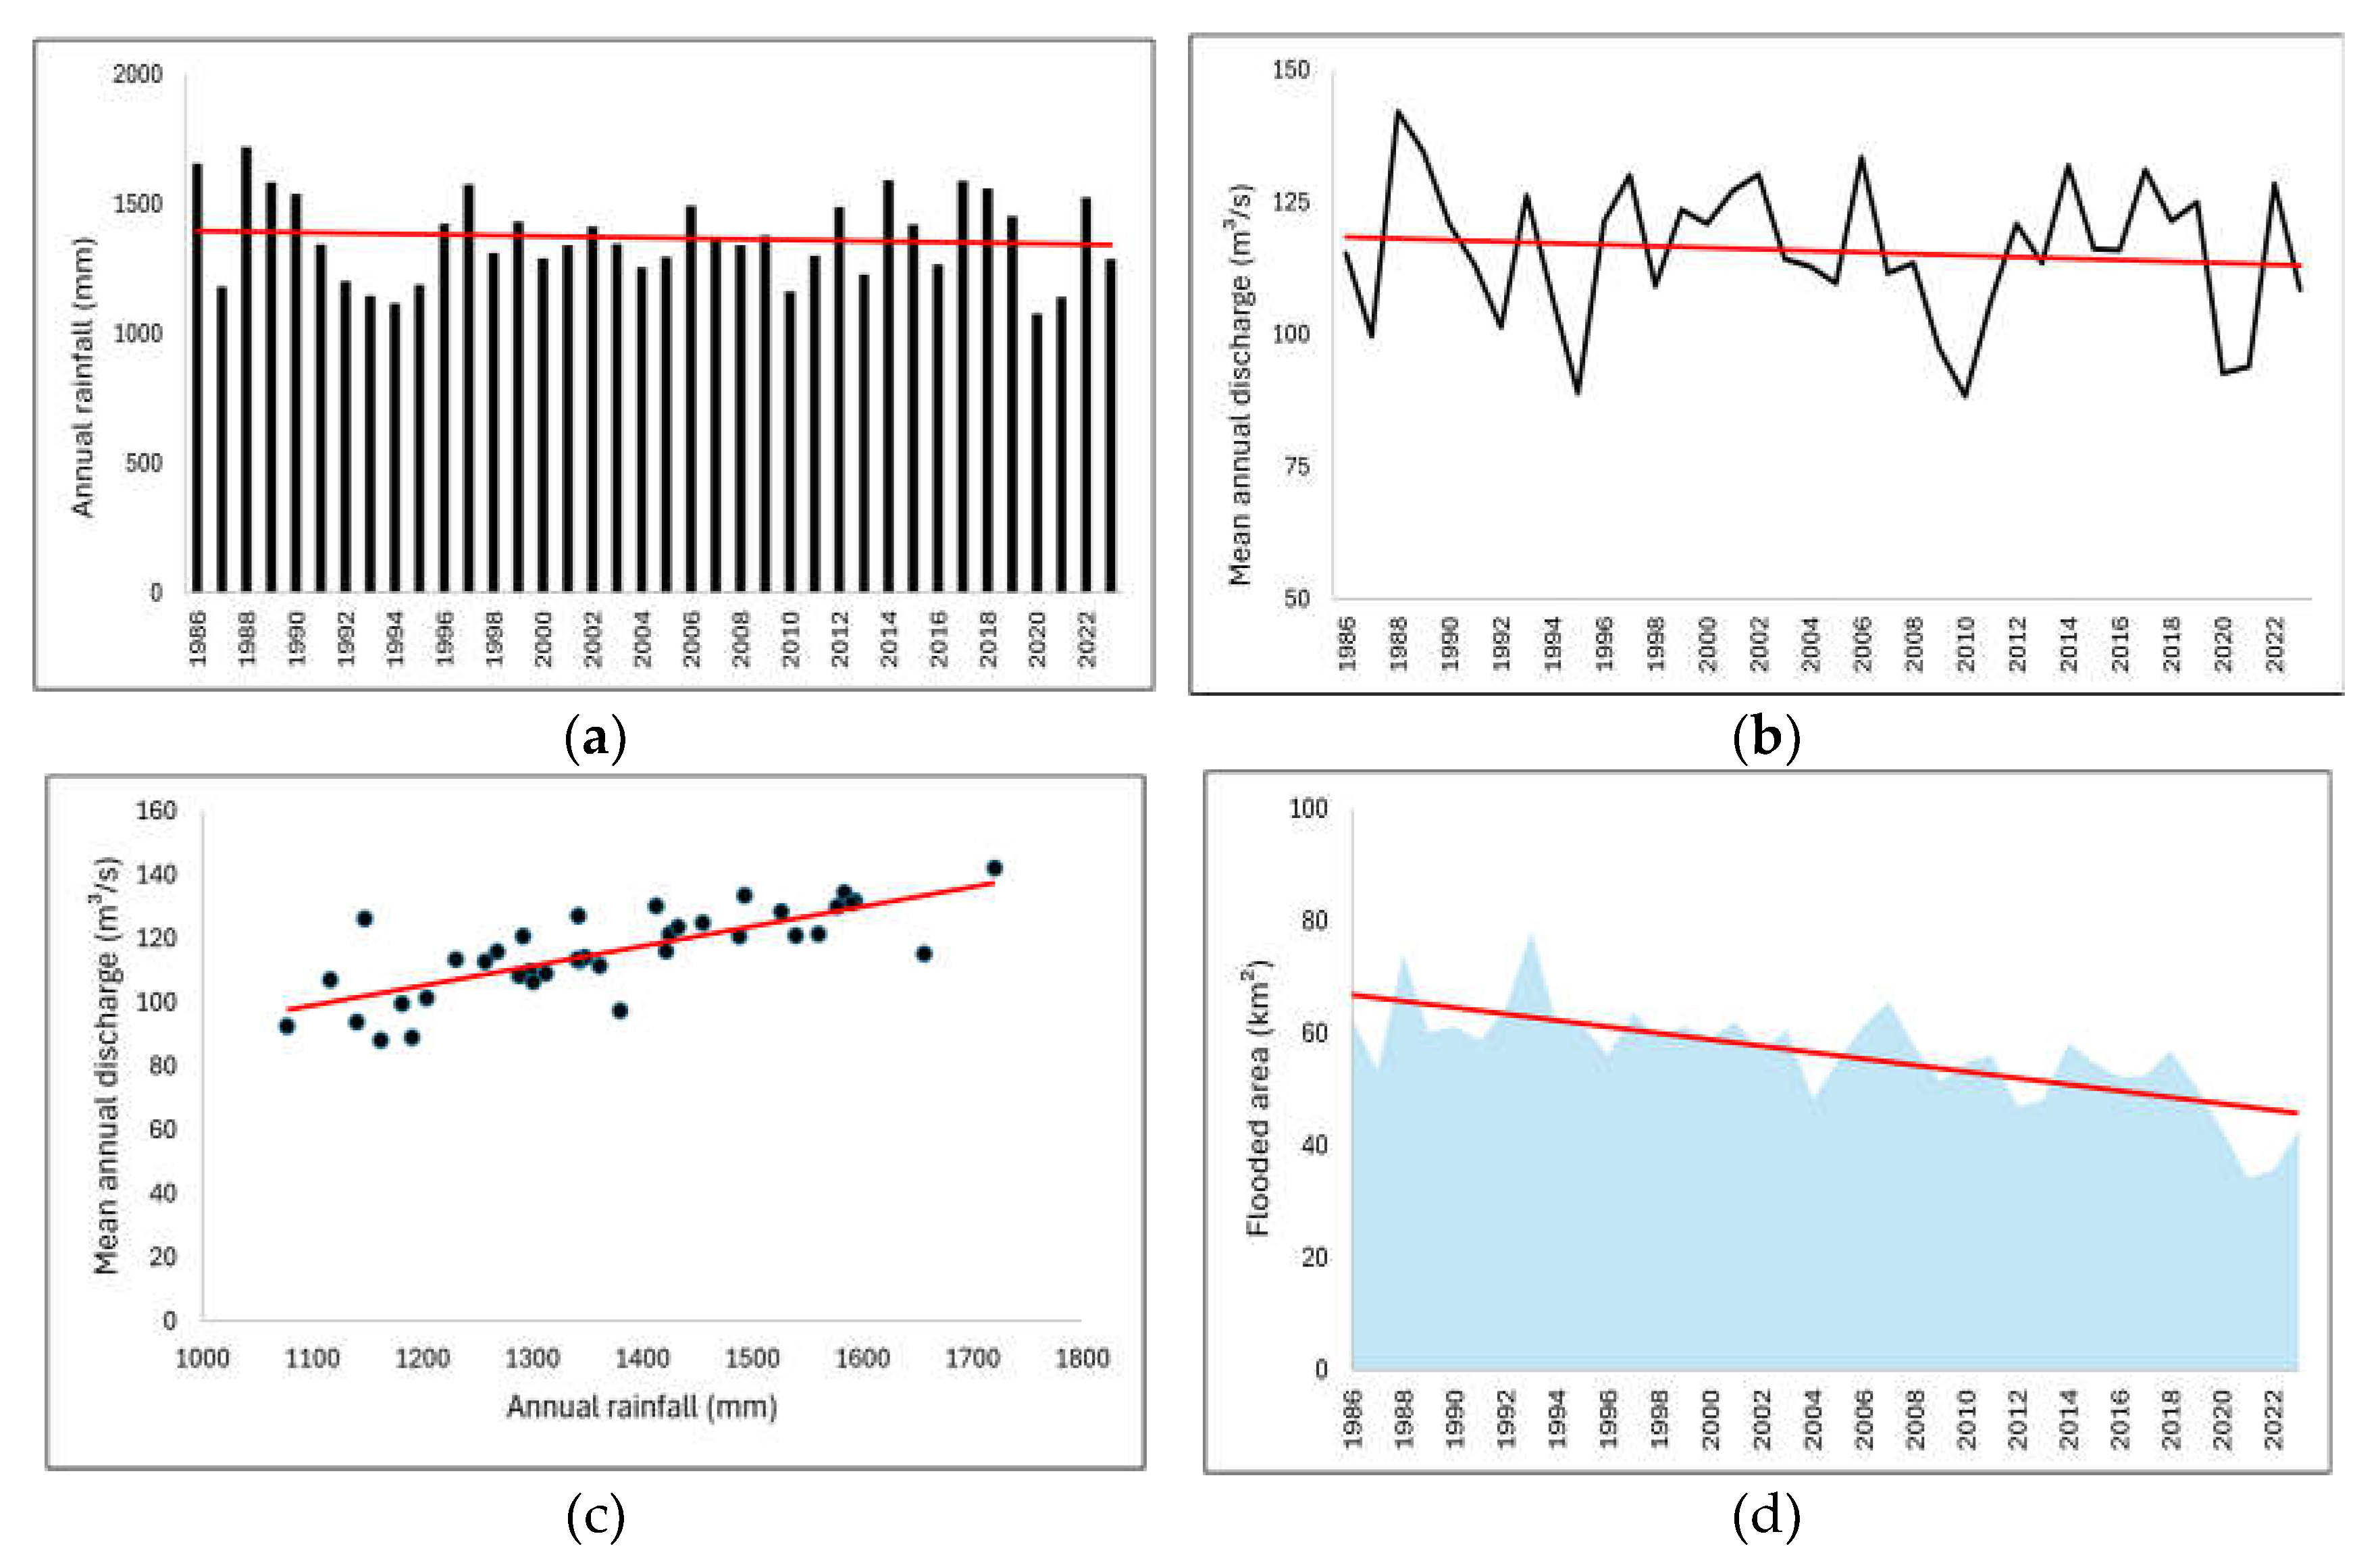
Figure 5.
Correlation between annual flooded area-AFA of the Jauru basin and its mean annual discharge upstream (inflow).
Figure 5.
Correlation between annual flooded area-AFA of the Jauru basin and its mean annual discharge upstream (inflow).
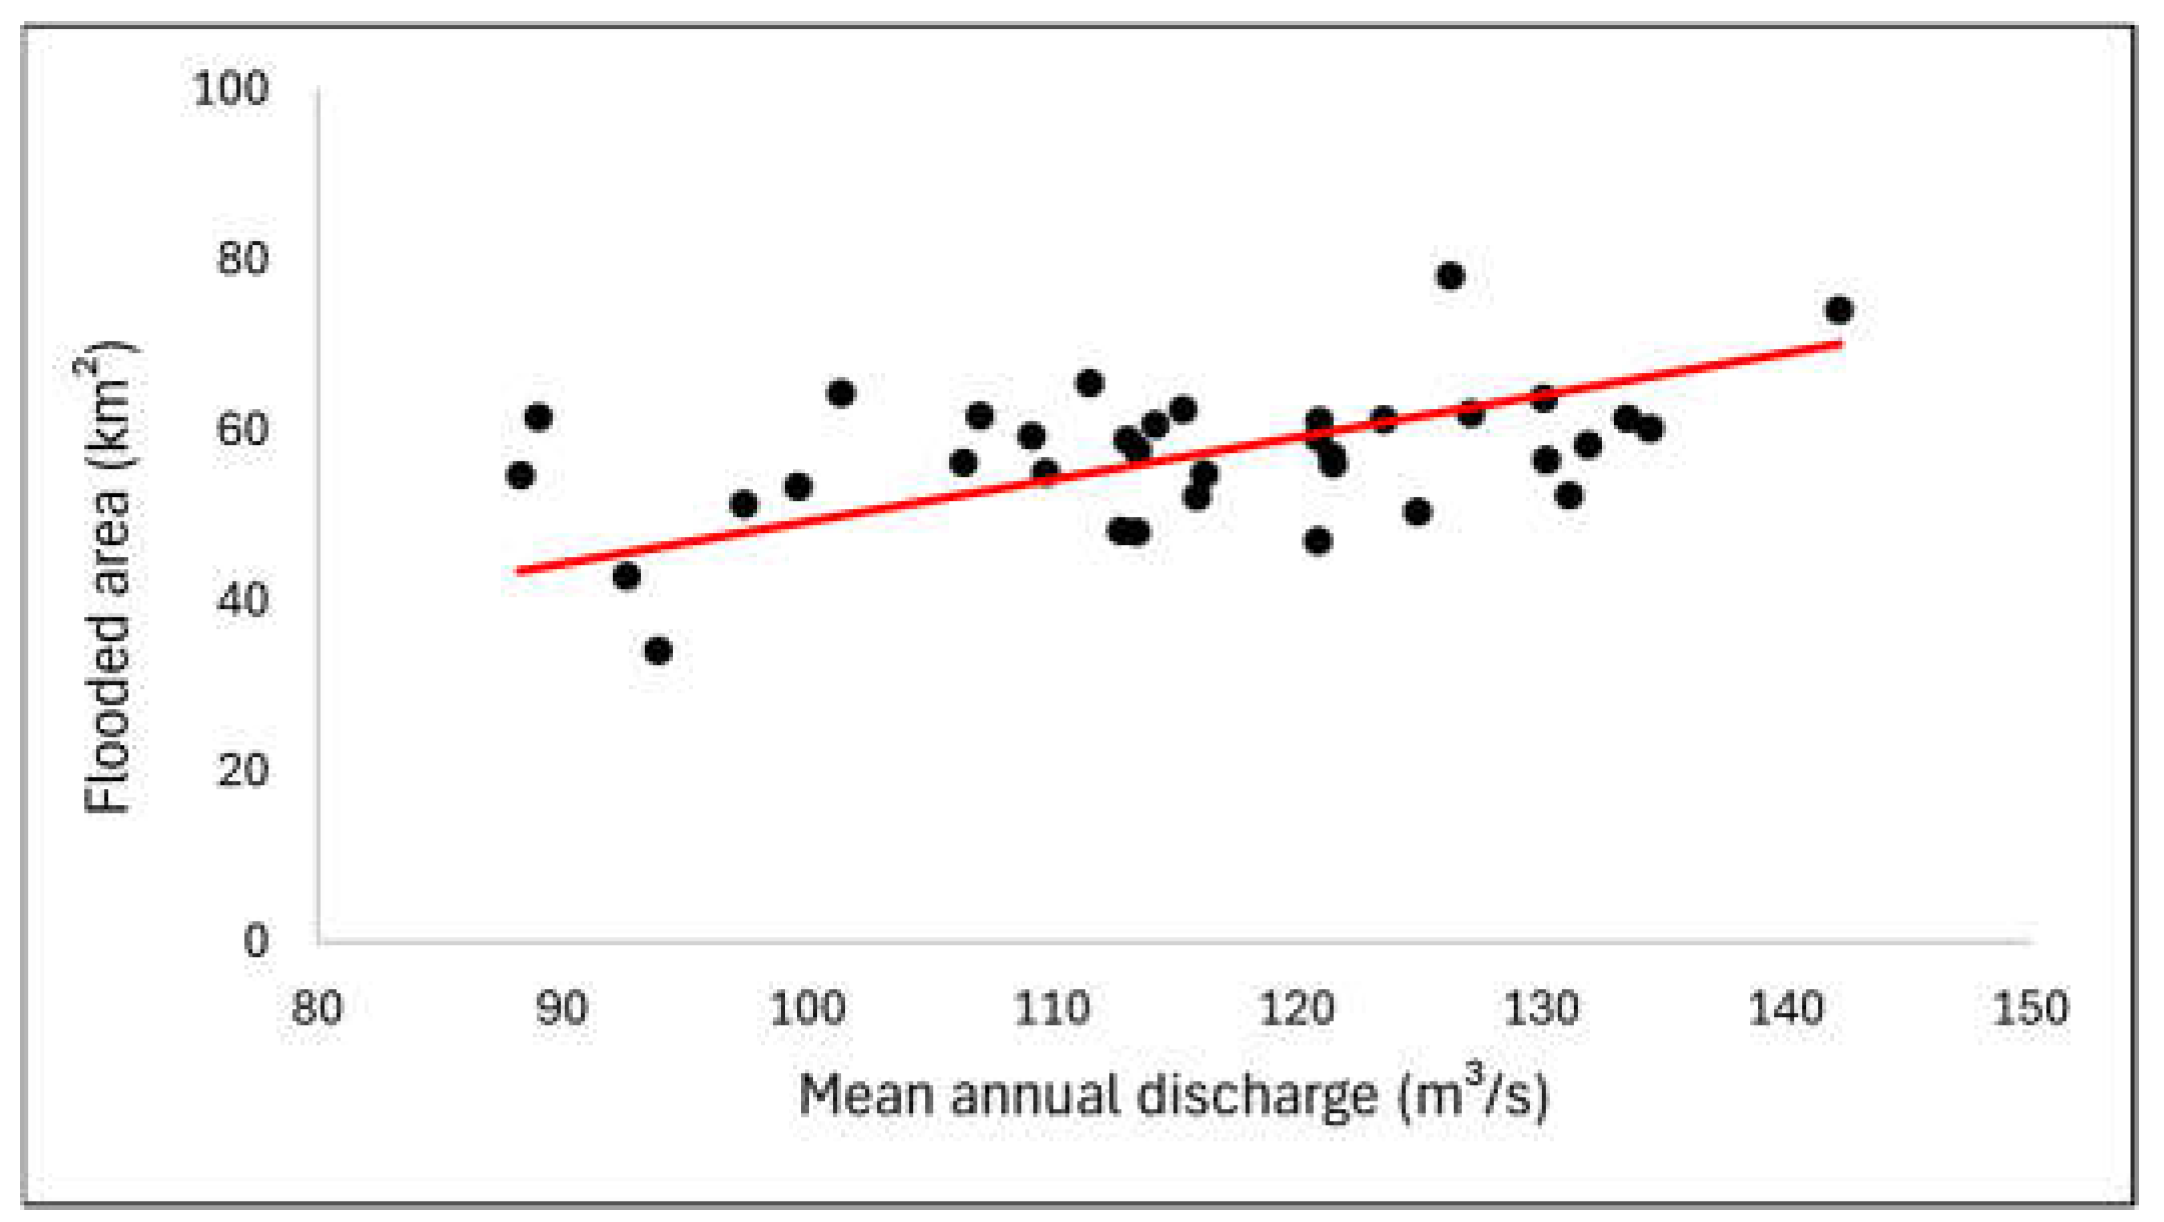
Figure 6.
Time series if annual rainfall (a) and discharge (b) of the Taquari basin, their correlation (c), and the time series of the downstream flooded area (d) between 1986 and 2023.
Figure 6.
Time series if annual rainfall (a) and discharge (b) of the Taquari basin, their correlation (c), and the time series of the downstream flooded area (d) between 1986 and 2023.
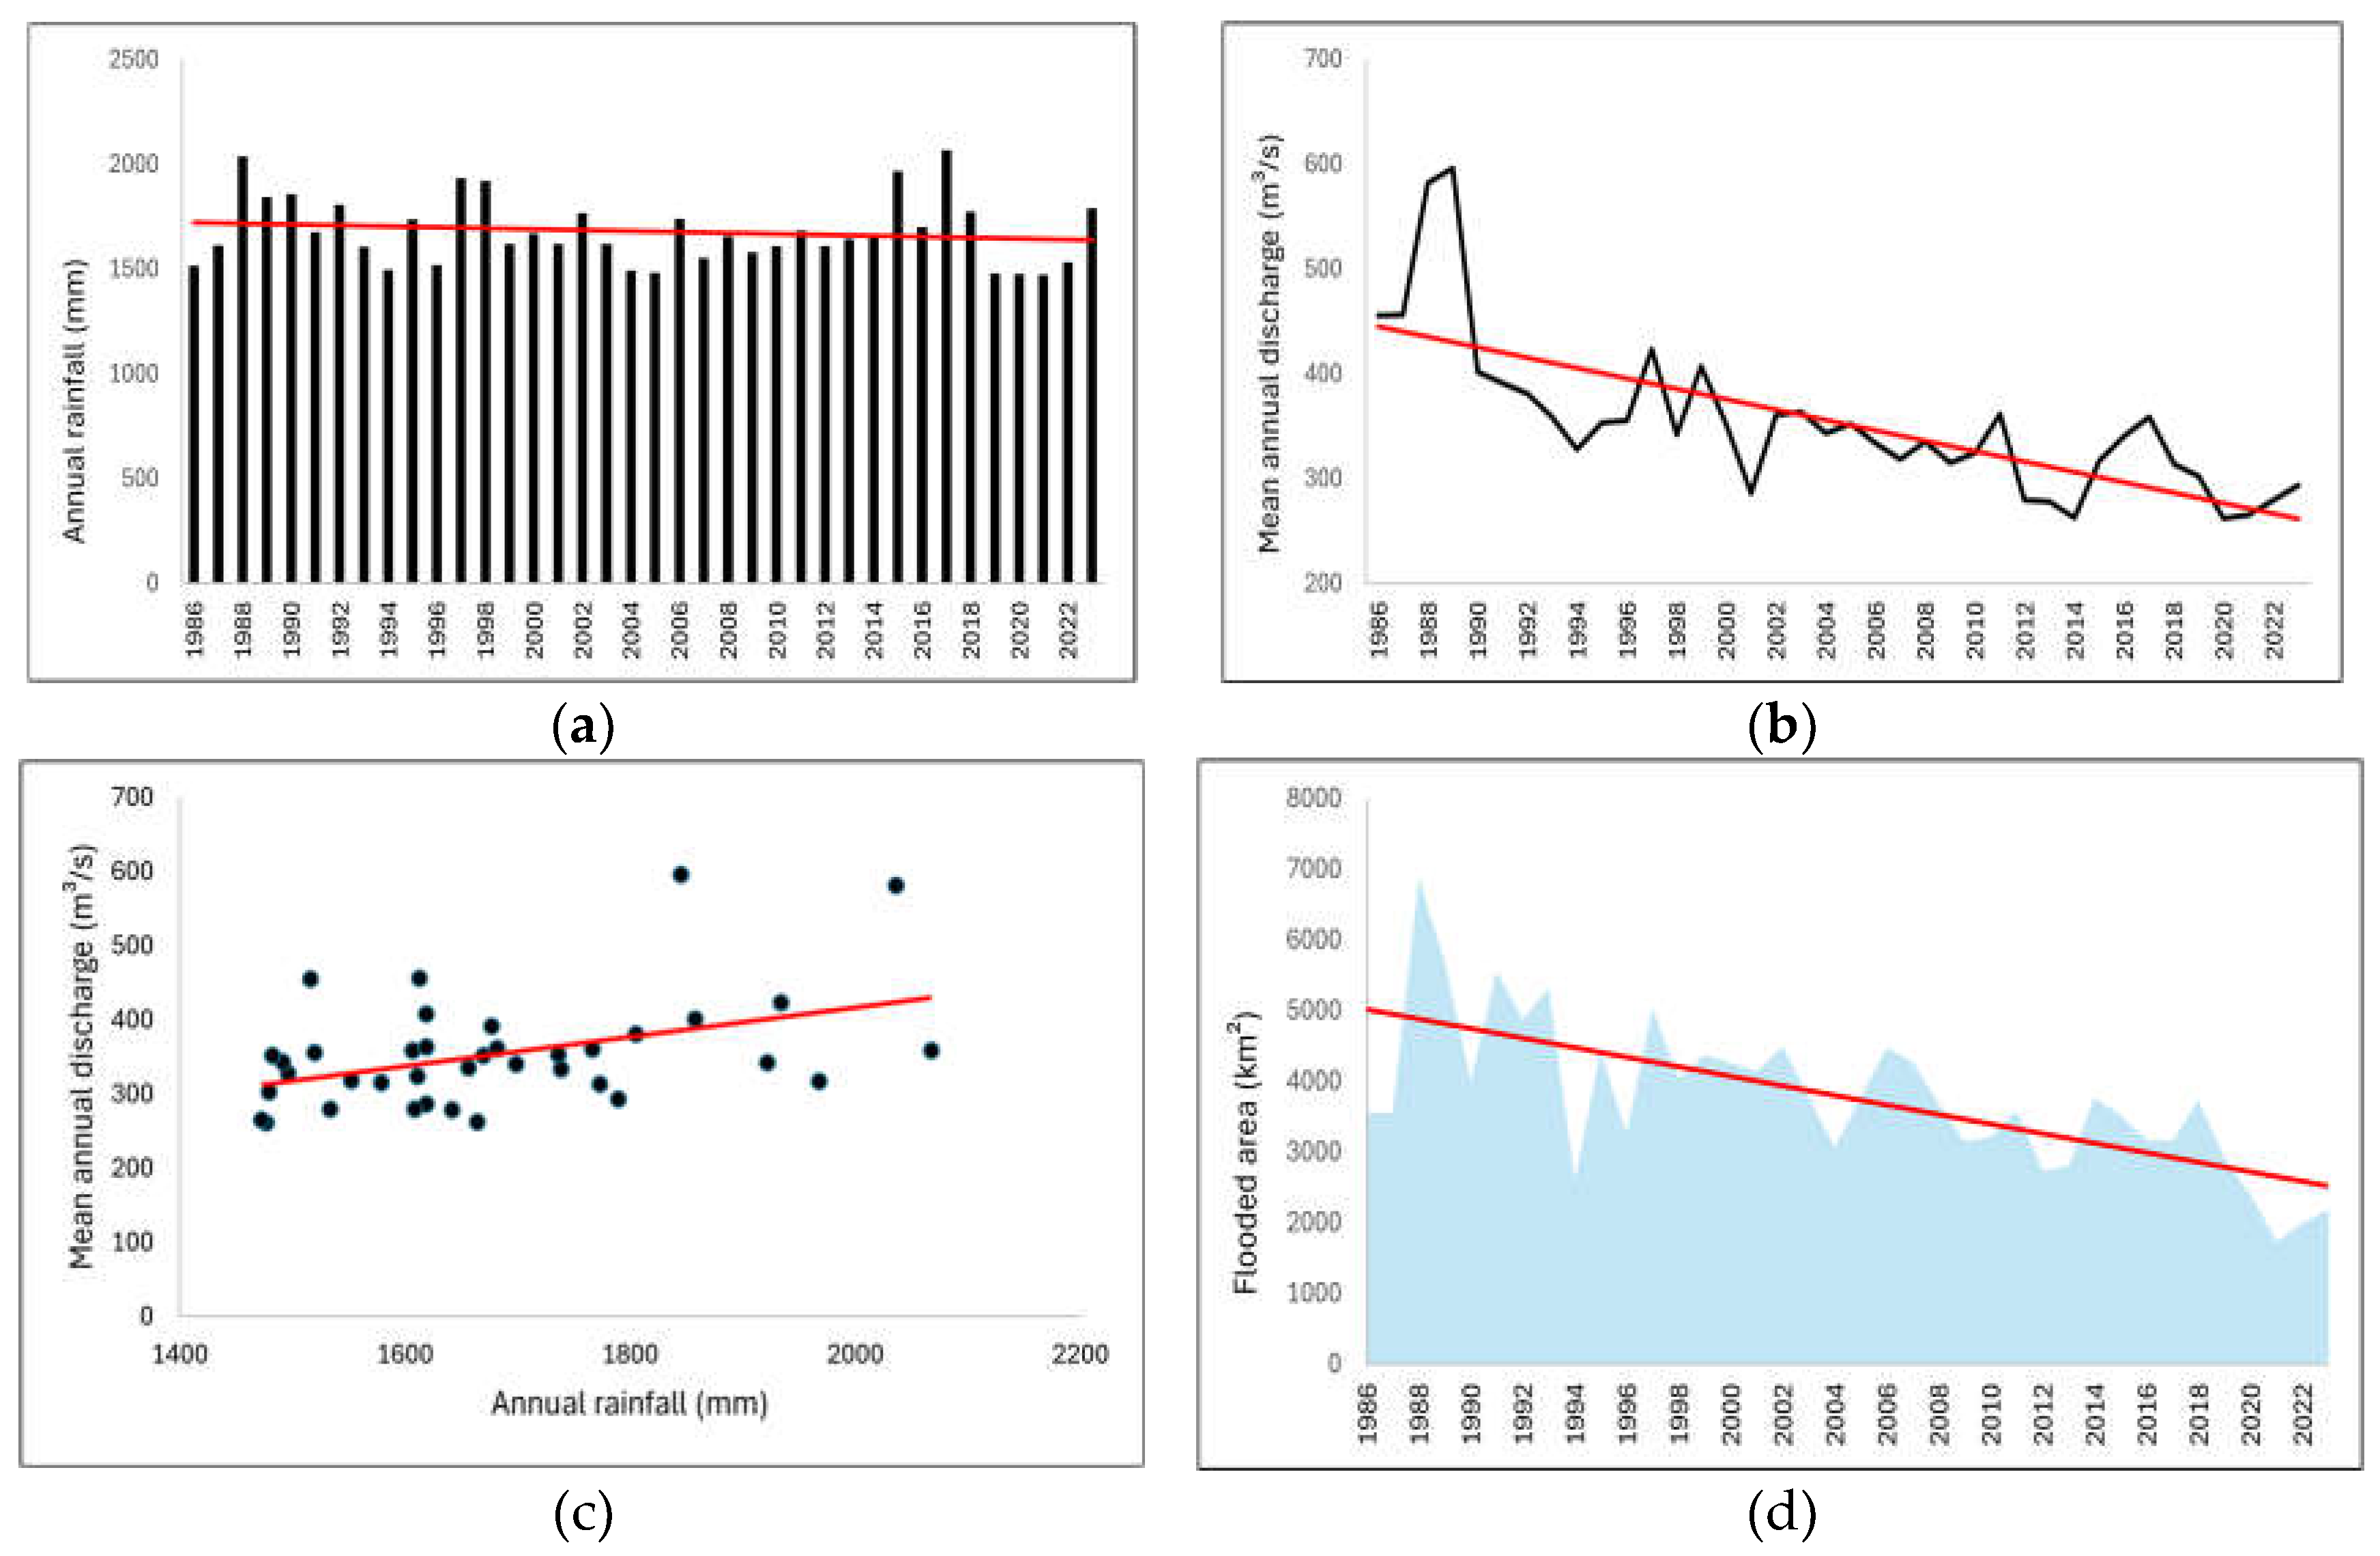
Figure 7.
Correlation between annual flooded area of the Taquari basin and its mean annual inflow (a), and between A and the mean annual river stage (Q) of the Paraguay river (b).
Figure 7.
Correlation between annual flooded area of the Taquari basin and its mean annual inflow (a), and between A and the mean annual river stage (Q) of the Paraguay river (b).
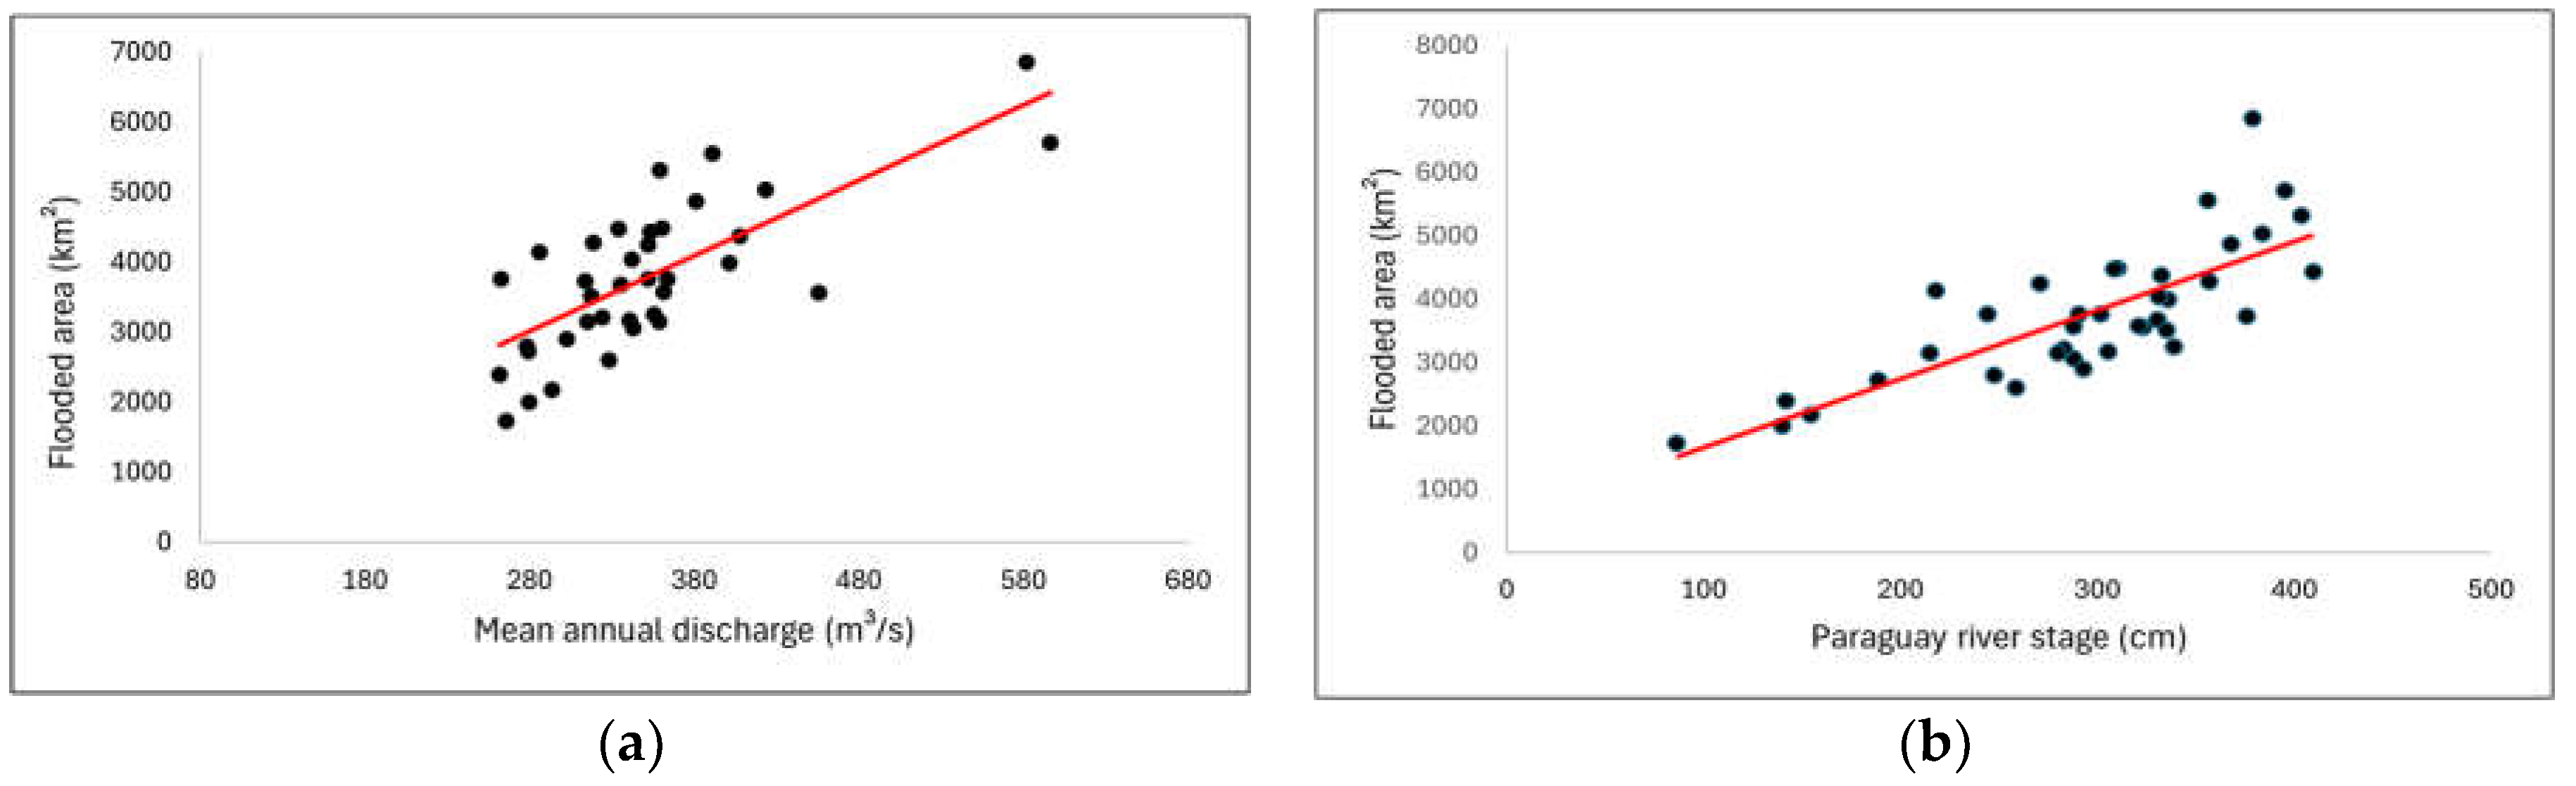
Figure 8.
Time series of annual precipitation (a) and streamflow (b) of the Taquari basin, their correlation (c), and the time series of the downstream flooded area (d), between 1986 and 2023.
Figure 8.
Time series of annual precipitation (a) and streamflow (b) of the Taquari basin, their correlation (c), and the time series of the downstream flooded area (d), between 1986 and 2023.
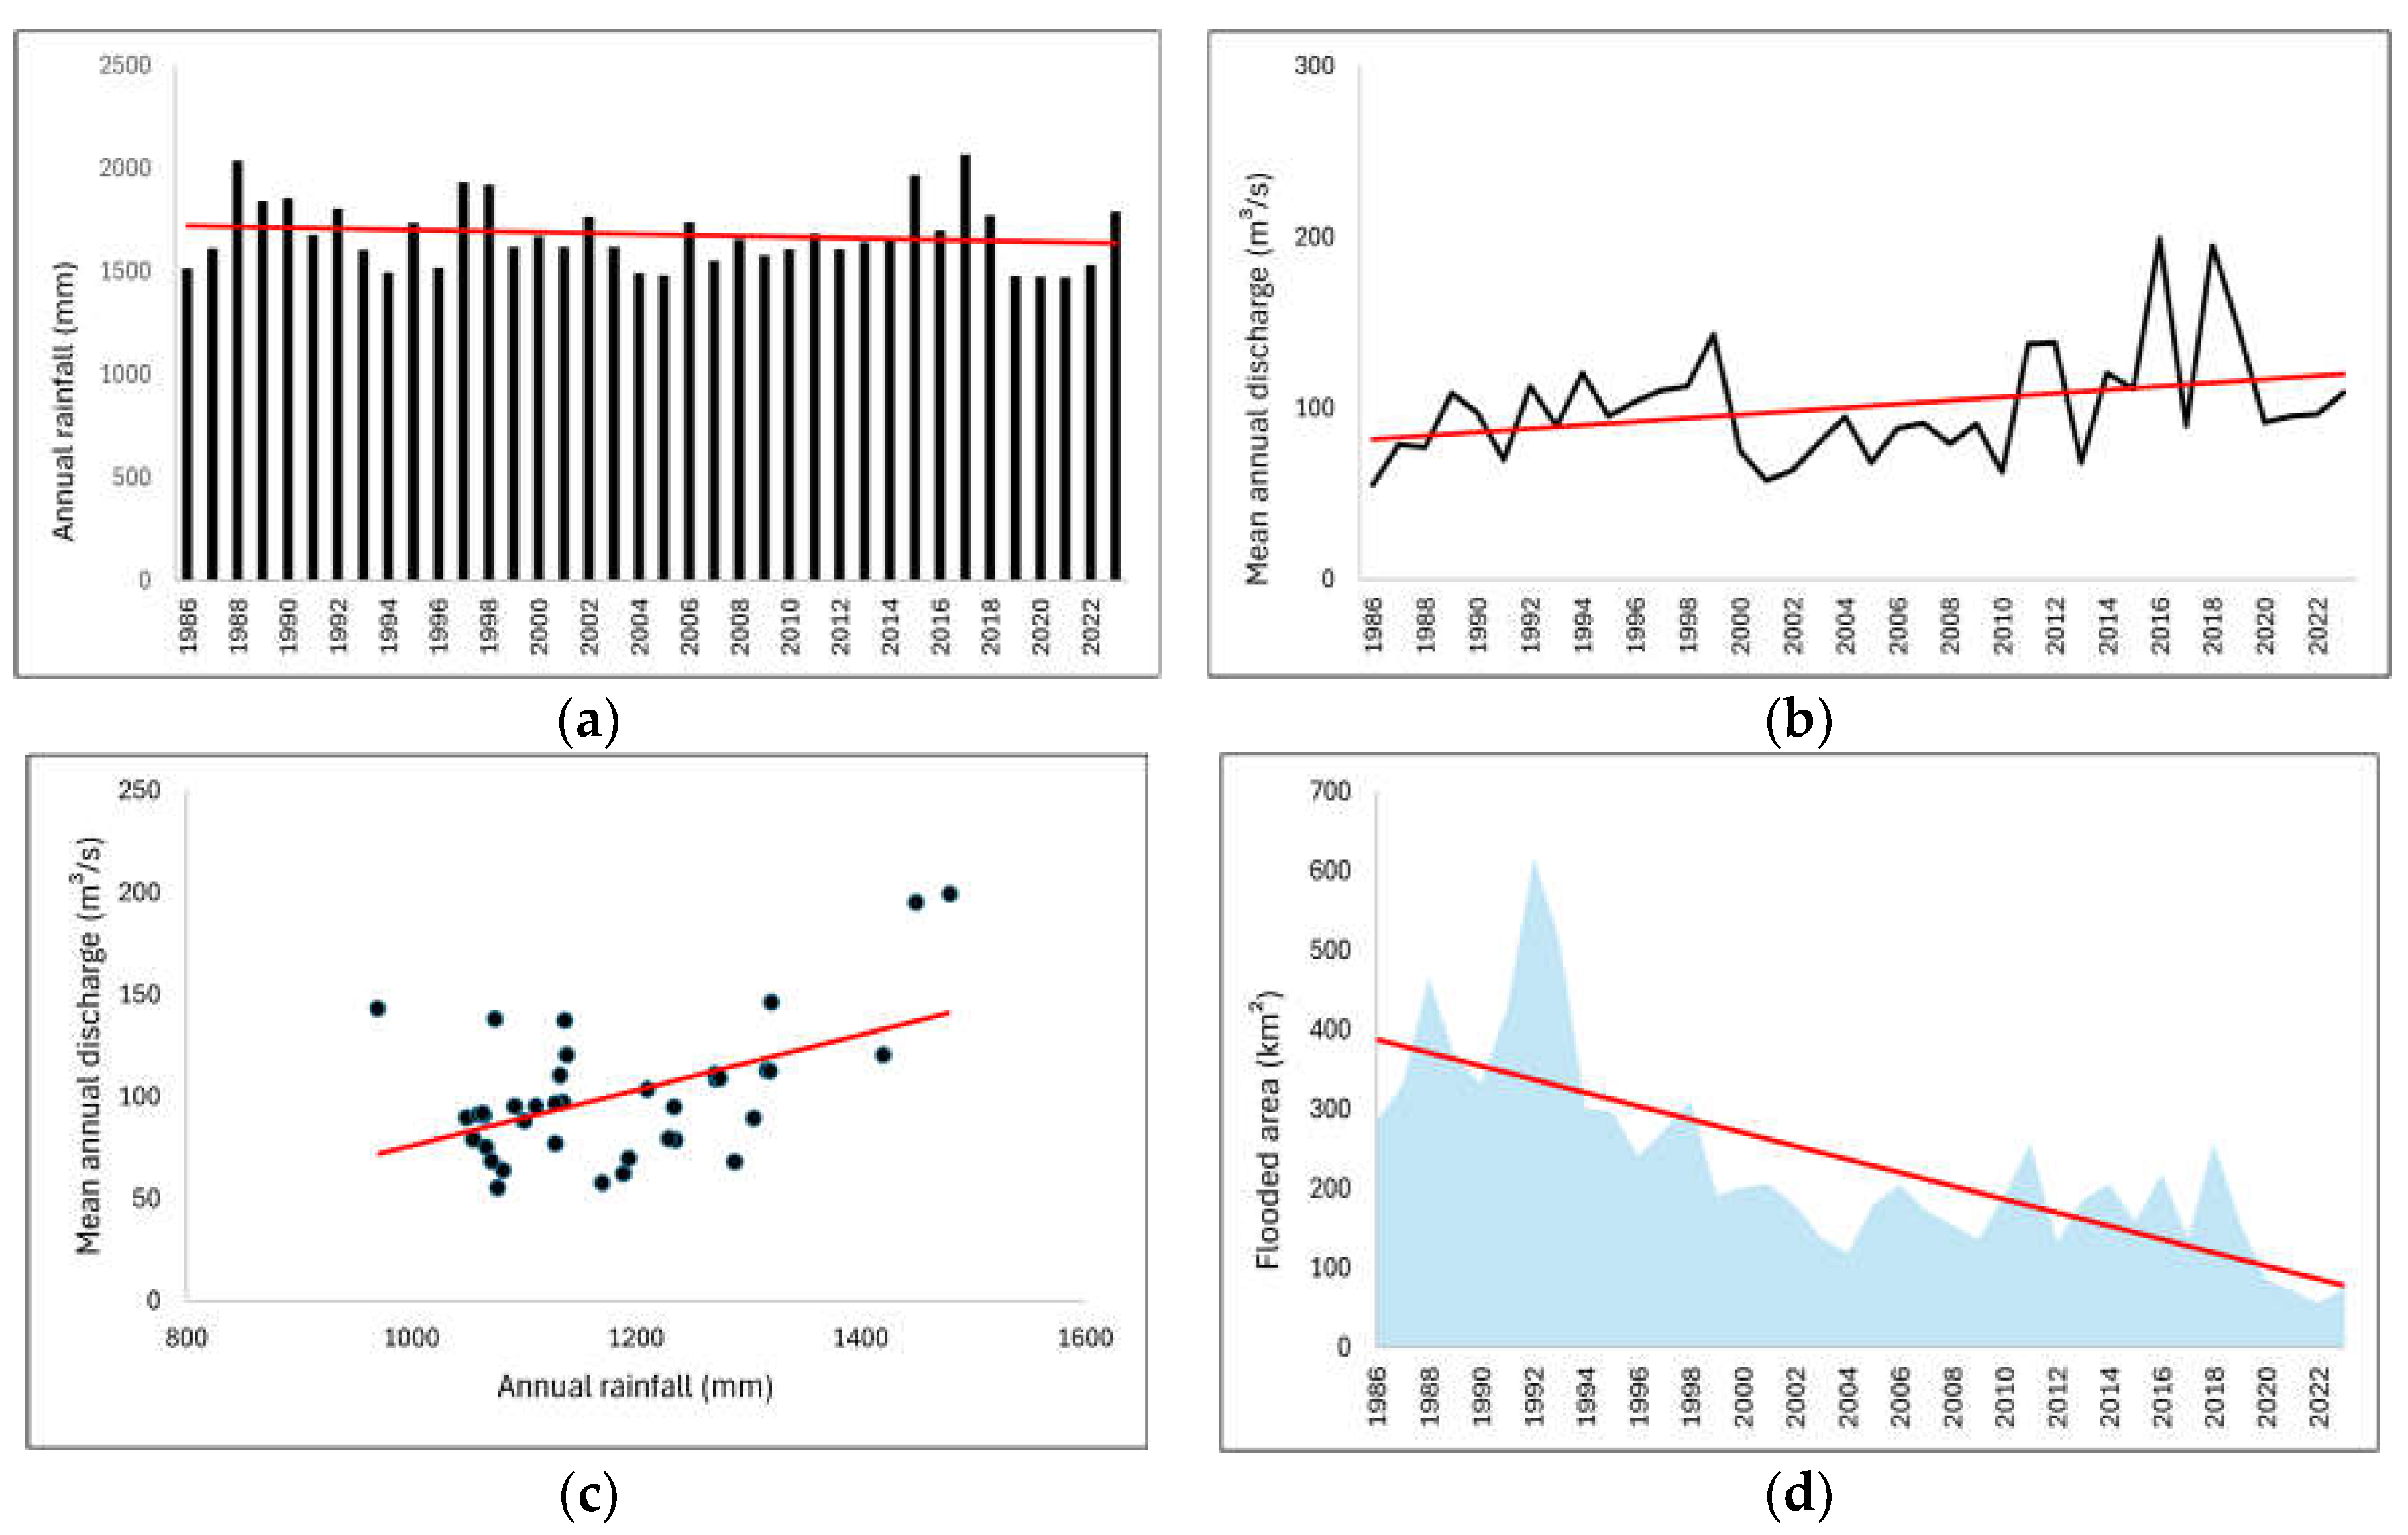
Figure 9.
Correlation between the Miranda Basin flooded area with the Paraguay river stage (a), the upland streamflow (b), and the time-series of the Paraguay river stage (c).
Figure 9.
Correlation between the Miranda Basin flooded area with the Paraguay river stage (a), the upland streamflow (b), and the time-series of the Paraguay river stage (c).
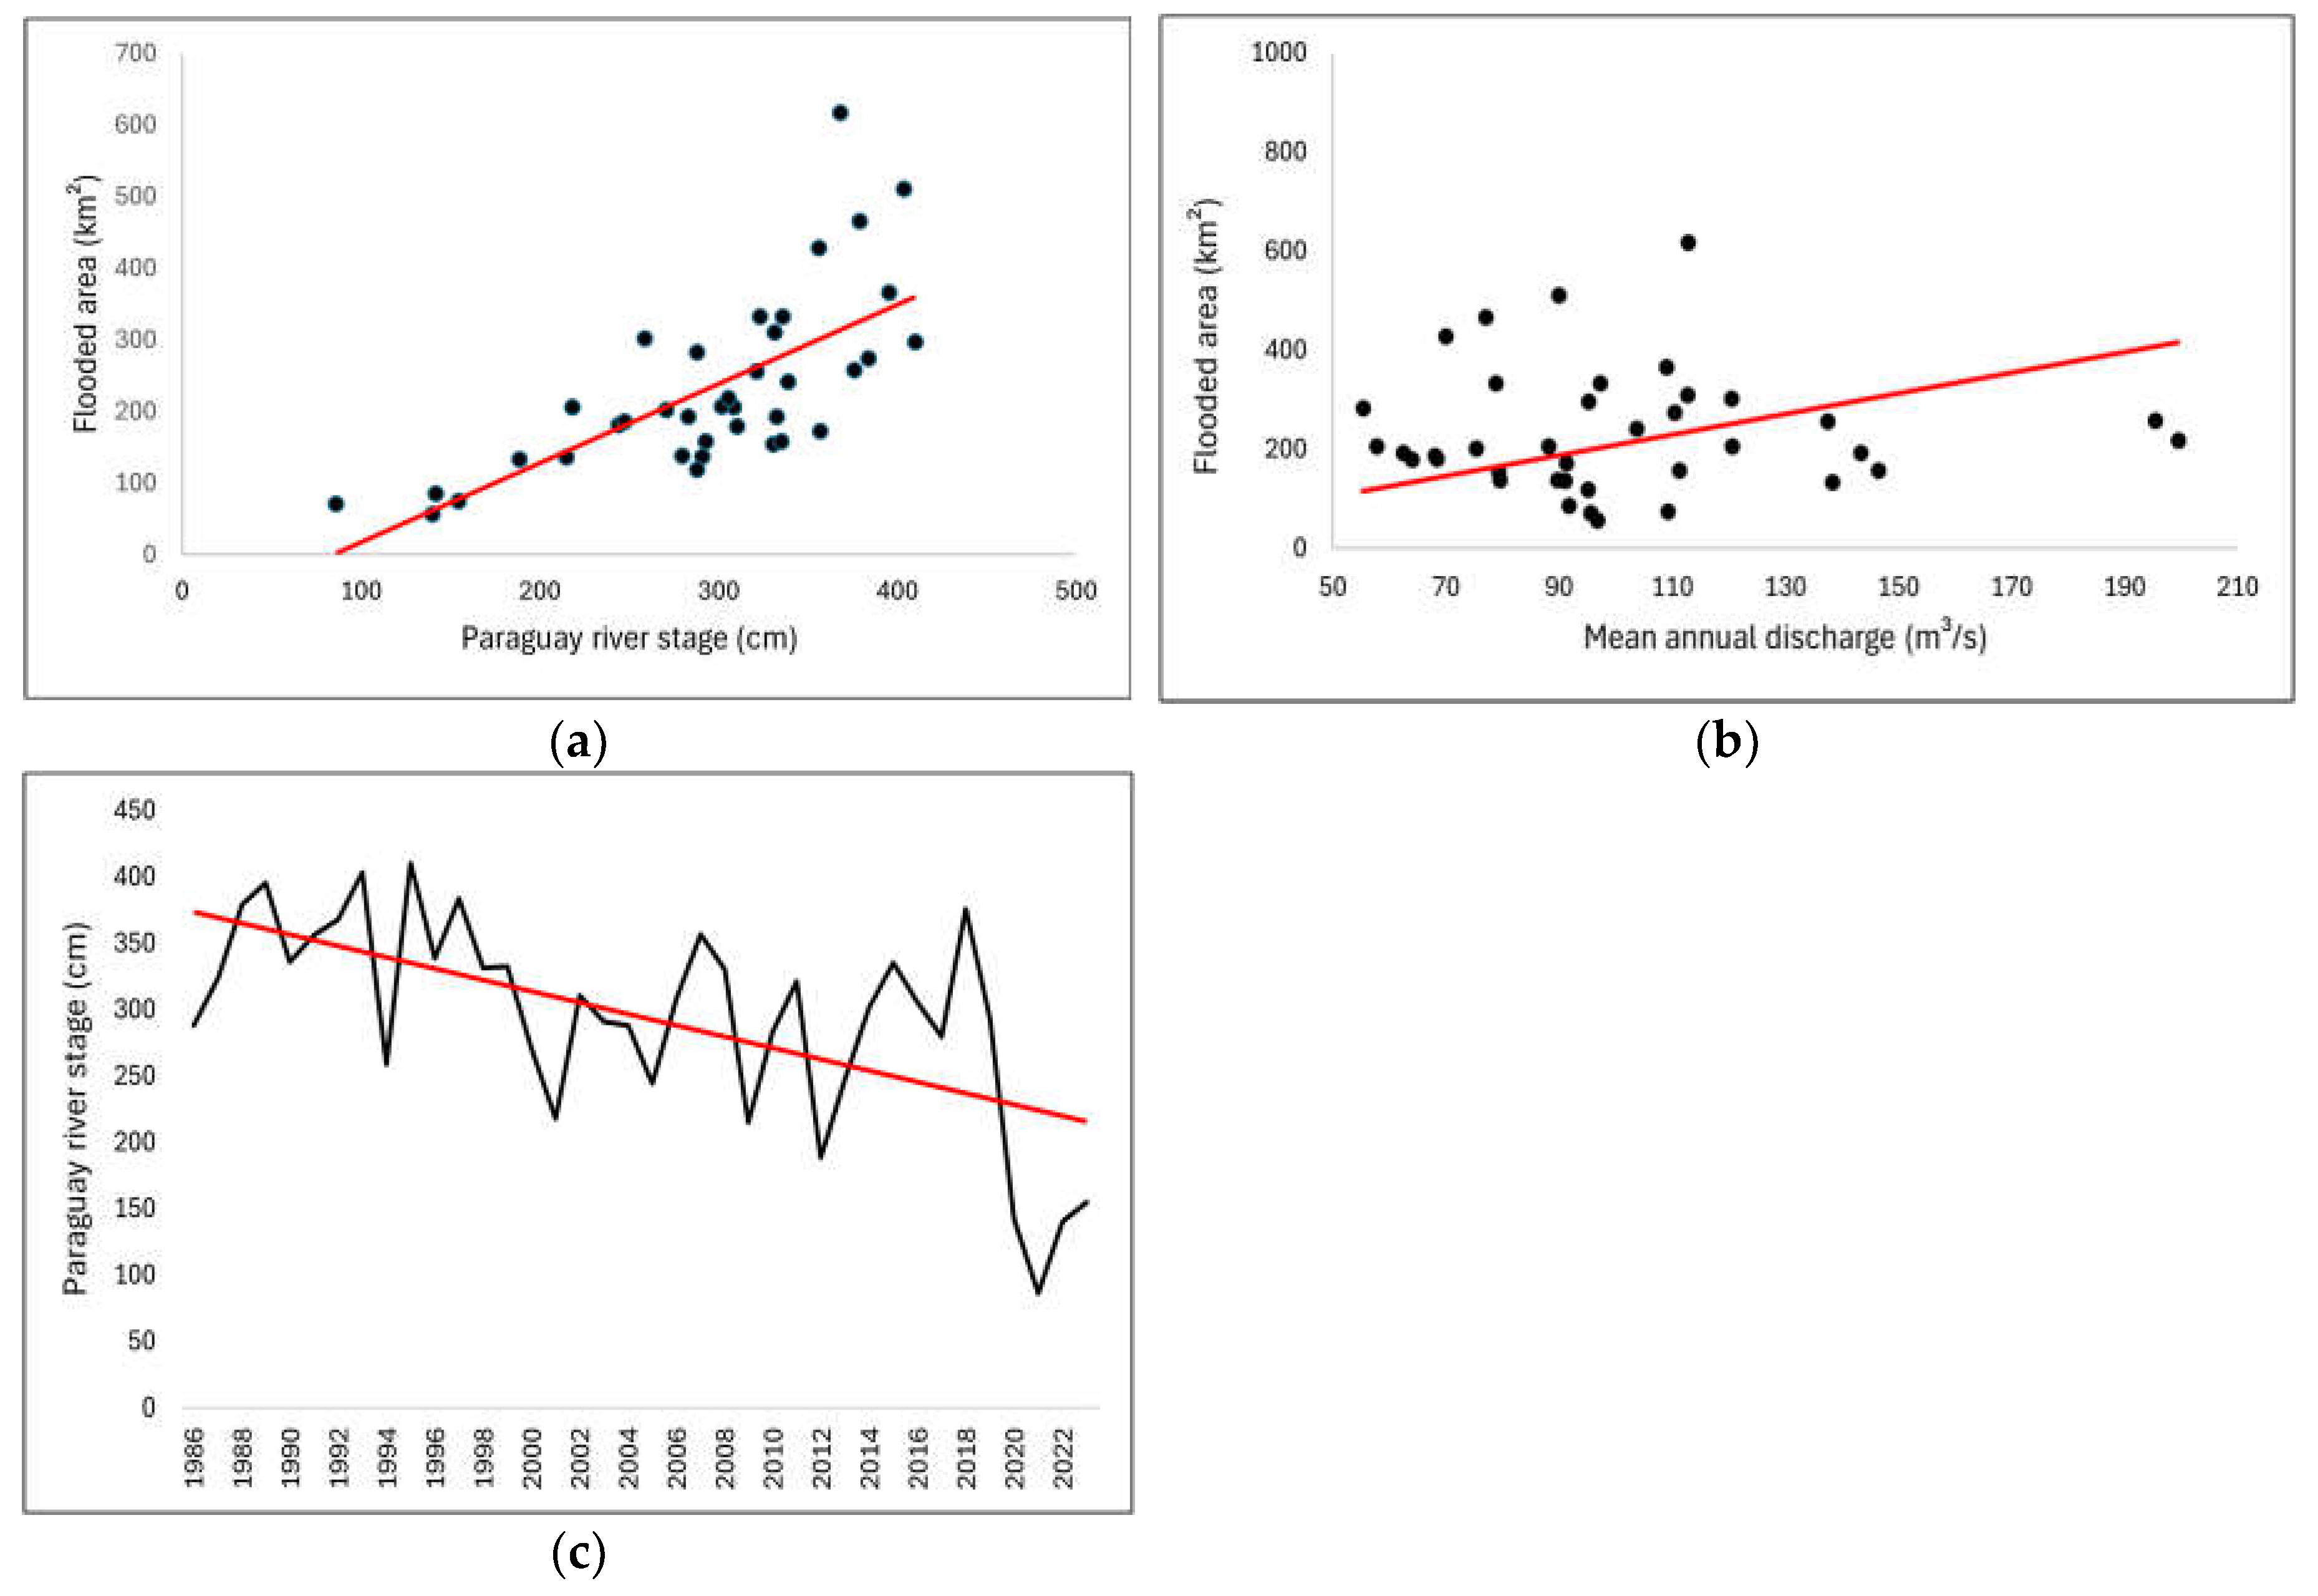
Figure 10.
Frequency of flooded areas in the UPRB, with dark blue colors indicating permanent flooded areas.
Figure 10.
Frequency of flooded areas in the UPRB, with dark blue colors indicating permanent flooded areas.
Disclaimer/Publisher’s Note: The statements, opinions and data contained in all publications are solely those of the individual author(s) and contributor(s) and not of MDPI and/or the editor(s). MDPI and/or the editor(s) disclaim responsibility for any injury to people or property resulting from any ideas, methods, instructions or products referred to in the content. |
© 2025 by the authors. Licensee MDPI, Basel, Switzerland. This article is an open access article distributed under the terms and conditions of the Creative Commons Attribution (CC BY) license (http://creativecommons.org/licenses/by/4.0/).
Copyright: This open access article is published under a Creative Commons CC BY 4.0 license, which permit the free download, distribution, and reuse, provided that the author and preprint are cited in any reuse.


