Submitted:
09 April 2025
Posted:
12 April 2025
You are already at the latest version
Abstract
Dietary exposure to a high-dose cadmium (Cd) ≥ 100 µg/day for at least 50 years or a lifetime intake of Cd ≥ 1 g causes severe damage to kidneys and bones. Alarmingly, however, exposure to a dose of Cd between 10 and 15 µg/day increases worldwide prevalence of non-communicable diseases, including chronic kidney disease (CKD), non-alcoholic fatty liver disease, fragile bones, diabetes, and cancer. Because such a low-dose Cd exposure, results in urinary Cd excretion rates < 1 µg/g creatinine, it has cast considerable doubt on a “tolerable” Cd exposure of 58 µg/day for a 70 kg person, while questioning a threshold level at urinary Cd excretion rate at 5.24 µg/g creatinine. The present review addresses many unmet challenges in a threshold-based risk assessment for Cd. Special emphasis is given to the benchmark dose (BMD) methodology to estimate the Cd exposure limit that aligns with a no-observed adverse effect level (NOAEL). Reported results of BMDL modeling of Cd exposure levels using different nephrotoxicity endpoints are summarized to identify the most sensitive sign on which exposure guidelines should be based. It also aims to demonstrate that a health-protective exposure guideline for Cd should employ the most recent scientific research data, and the dose-response curves, constructed from an unbiased exposure indicator, and clinically relevant adverse effects such as proteinuria and a decrease in estimated glomerular filtration rate. These are signs of developing CKD and its progression to end stage, when dialysis or a kidney transplant is required for survival.
Keywords:
cadmium
; benchmark dose
; dose-response
; eGFR
; NOAEL
; threshold-based risk assessment
1. Introduction
The conventional toxicological risk assessment for any health hazardous substance is reliant on dose-response curves, constructed from series of experimentation, which typically involves daily administration of 4-5 different doses for 90 days, referred to as sub-chronic exposure conditions in humans [1,2,3,4,5]. The dose-response curves are used to define the lower bound “no observed adverse effect level” (NOAEL) and the upper bound “lowest observed adverse effect level” (LOAEL) from which a point of departure (POD) is established. Subsequently, the POD value forms a basis to estimate health guidance values, which presently are known as a minimal risk level (MRL), a toxicological reference value (TRV), tolerable weekly intake (TWI), tolerable monthly intake (TMI) and a reference dose (RfD) [1,2,3,4,5,6]. These different terms create unnecessary confusions and stumble blocks.
The NOAEL value derived from experimental animal dosing regimens is the highest dose tested that produces a statistically insignificant effect, compared to controls. In some instances, this NOAEL value is translated to benchmark dose (BMD) with an inclusion of uncertainty factors to compensate for species differences and human variability [1]. Notably the BMD approach has now been applied to human population data from which to the benchmark dose limit (BMDL) value is identified and employed as a replacement of the experimental NOAEL [1,2,3,4,5]. This BMDL methodology overcomes the shortcomings of traditional dosing experiments, which requires a compensation for animal-to-human extrapolation.
The POD-based health guidance values; MRL, TRV, TWI, TMI, and RfD all rely on the premise that a threshold level of exposure exists, below which an adverse effect can be discernable [1]. In effect, an exposure level derived from the most sensitive endpoint would be protective against all other adverse effects [1]. A notable limitation is that threshold-based risk assessment is not applicable to cancer endpoints [1,5]. An evaluation of the carcinogenic risk of a suspected entity involves different dosing regimens and an observation over a life-span such as a two-year rodent/murine bioassay [7,8,9].
The present review has its focus on a metal contaminant cadmium (Cd), which is found in most foodstuffs [10,11,12,13], tobacco smoke, and airborne particle pollution [14,15]. An extremely slow excretion rate means that Cd is retained within cells of nearly all tissues and organs in the body [16,17]. Concerningly, Cd is a designated cancer-causing agent in humans; epidemiological studies have linked increased risks of developing cancer in the lung, kidney, pancreas, breast, and liver to chronic Cd exposure [7,8,9,18]. These data are in line with the two-year bioassay that revealed Cd as a multi-tissue carcinogen [7]. Furthermore, the ability of Cd to induce non-tumorigenic human cells to undergo malignant transformation has been unambiguously demonstrated [18,19].
The first objective of this review is to discuss current health guidance values derived for environmental Cd exposure, and highlight their shortcomings and inadequacy to protect human health. It reiterates a total imprecision in measuring exposure and/or adverse outcomes, which biases dose-response relationships toward the null [20], and consequently leading to an underappreciation of the health effects of Cd by a large magnitude or even a miss. The second objective is to illustrates non-differential errors imposed to dataset, when the urinary excretion of Cd (ECd), an indicator of body burden, is adjusted to creatinine excretion (Ecr). These errors can be eliminated by normalizing ECd to creatinine clearance (Ccr), the surrogate of functioning nephrons. It accentuates a continuing effort to identify the most sensitive non-cancer endpoint to be used as a basis to formulate a meaningful health guideline value for Cd exposure. As a third objective, it provides fundamental and practical knowledges on BMD methodology and together with a summary of reported BMD modeling results and their interpretation.
2. Existing Dietary Cd Exposure Guidelines
This section provides health guidance values for exposure to Cd in the diet together with exposure threshold levels that have been estimated. Because nearly all food types contain Cd as a contaminant, exposure to Cd is through a normal human diet [10,11,12,13] and foods which are consumed frequently in a large quantity, like staples, contribute the most to total amount of Cd consumed [11].
Consumption of rice heavily contaminated with Cd is a known cause of “itai-itai” disease with severely damaged kidneys and bones as its dominant pathologies, leading to multiple bone fractures due to osteoporosis and osteomalacia [21,22]. These Cd-induced pathologies have been replicated in ovariectomized cynomolgus monkeys [23], which mimicked the female preponderance feature of the toxicity of a high-dose Cd (≥100 µg /day) for 50 years or longer). Consequently, kidneys and bones have been employed as the critical targets for Cd toxicity for which permissible exposure and threshold levels have been determined [24].

Table 1.
Exposure guidelines for Cd in the diet based on kidney and/or bone effects.
| Target/ Endpoint | Tolerable Intake/Exposure Threshold Level | Reference |
|---|---|---|
| Kidneys, β2M excretion rate ≥ 300 µg/g creatinine. |
A tolerable intake level of 0.83 μg/kg body weight/day (58 µg per day for a 70 kg person). A cumulative lifetime intake of 2 g. Assumed Cd absorption rate of 3–7%. Threshold level of 5.24 μg/g creatinine. |
JECFA [25] |
| Kidneys, β2M excretion rate ≥ 300 µg/g creatinine. |
A reference dose of 0.36 μg/kg body weight per day (25.2 µg per day for a 70 kg person) Threshold level of 1 μg /g creatinine |
EFSA [26,27] |
| Kidneys, β2M and NAG excretion rates |
A tolerable intake level of 0.28 μg/ kg body weight per day; 16.8 µg/day for a 60 kg person. Threshold levels for the β2M and NAG effects were 3.07 and 2.93 μg/g creatinine, respectively. An average dietary Cd exposure in China was 30.6 μg/day. |
Qing et al. 2021 [28] |
| Bones, Bone mineral density |
A tolerable Cd intake of 0.64 μg/kg body weight per day. Threshold level of 1.71 μg/g creatinine. |
Qing et al. 2021 [29] |
| Bones, Bone mineral density |
A tolerable intake level of 0.35 μg/kg body weight per day. Assumed threshold level of 0.5 μg/g creatinine. |
Leconte et al. 2021 [30] |
| Kidneys and bones, Reverse dosimetry PBPK modeling |
Toxicological reference values were 0.21 and 0.36 μg/ kg body weight per day, assuming a similar threshold level for effects on kidneys and bones of 0.5 μg/g creatinine. | Schaefer et al. 2023 [31] |
NAG, N-acetyl-β-D-glucosaminidase; PBPK, physiologically based pharmacokinetics [32].
As data in Table 1 indicate, there is no consensus on a “safe” exposure level even though the same endpoints were used; the dietary Cd exposure limits range between 0.28 and 0.83 μg/ kg body weight per day with Cd exposure threshold levels varying from 1.0 to 5.24 µg/g creatinine for the β2M and/or ENAG endpoint. In a study on Chinese population data, Qing et al. (2021) reported a tolerable Cd intake to be 0.64 μg/kg body weight per day for the bone mineral density endpoint with a corresponding threshold level of 1.71 μg/g creatinine [29].
In addition to those enlisted in Table 1, POD-based health guidance values for Cd exposure, called MRLs have also been identified for oral and inhalational exposure scenarios. Using experimental dosing data [33,34,35], Faroon et al. (2017) reported the MRL for oral exposure to Cd in an intermediate exposure duration (15−365 days) to be 0.5 µg/kg body weight per day for decreased bone mineral density endpoint [36]. Based on experimental dosing data from the Fisher rats [37], the MRL for an acute inhalational exposure to Cd for the duration between 1 and 14 days was 0.03 μg/m3 when alveolar histiocytic infiltration and focal inflammation in alveolar septa were employed as endpoints [36].
3. Imprecisions in Measuring Internal Cd Doses and Adverse Outcomes
The practice of toxicological risk assessment involves measuring two key parameters; exposure and effect indicators. This section focuses on factors which affect the estimation of internal dose of Cd, which account for an underestimation of an effect size. Uses of blood Cd concentrations and urinary excretion rates of Cd are highlighted along with the purposes of adjusting urinary concentrations of Cd and all other excreted biomarkers of Cd effects to creatinine excretion (Ecr) and creatinine clearance (Ccr).
3.1. Assimilation of Cd and Its Determinants
From foods, Cd enters the bloodstream through multiple mechanisms such as transcytosis [38], receptor-mediated endocytosis [39,40] and specialized transport proteins for essential metals, namely iron (Fe), zinc (Zn), and calcium (Ca) [41,42,43,44]. Cd can be expected to be assimilated at rates higher than each individual essential metal Fe, Zn and Ca, consistent with the absorption rate of Cd reported for Japanese women to be between 24 and 45% [45,46]. Conceivably, the internal dose of Cd and health risk imposed will be markedly underestimated, when Cd absorption rate is assumed to be 3 to 7% as in the JECFA provisional tolerable intake model for Cd [25].
Peng et al. (2023) conducted a systematic review and observed inverse associations of zinc and body iron stores with blood Cd concentrations [48]. Higher blood and urinary Cd levels in children and adolescent females [49], and women of reproductive age [51,52] have been linked to lower body iron stores, evident from serum ferritin ≤ 30 µg/L. Like iron, marginal dietary zinc intake and subclinical zinc deficiency are highly prevalent worldwide [53,54,55], which means a significant proportion of population is more likely to experience the nephrotoxicity of Cd.
3.2. Use of Blood Cd Concentration in Toxicological Risk Assessment
Through the gut and lungs, Cd in foodstuffs and airborne particle pollution, enter the systemic circulation. Hence, the blood concentration of Cd can reflect recent exposure to the metal. Because most of Cd in the blood stream is in the cytosol of red blood cells which have a 3-month lifespan, blood Cd concentration reflects exposure in the past three months.
As noted in Section 3.1, and reviewed by Cirovic and Cirovic (2024) [56], the amount of Cd that reaches target tissues and organs depends on many factors, which include absorption rate, nutritional zinc status, and body iron store, not just the amount of Cd in the diet. Consequently, neither blood Cd concentration nor an amount of Cd in the diet can be a precise predictor of an internal dose of Cd. For example, Van Maele-Fabry et al. (2016) reported that breast cancer risk among postmenopausal women was not associated with dietary Cd exposure levels [57]. In comparison, Cd exposure was found to be a strong risk factor for breast cancer in studies in which Cd excretion was used as an exposure indicator [58,59]. In a study by Larsson et al. (2015), risk of having breast cancer increased 66% for each 0.5-µg/g creatinine increase of urinary Cd excretion [58]. Lin et al. (2016) reported that breast cancer risk was not associated with dietary Cd exposure, but it was elevated 2.24-fold among women who had urinary Cd excretion rates in the top quartile, compared to those with urinary Cd in the lowest quartile [59].
Non-association between blood Cd and diabetes has been reported in a recent case-control study from Thailand by Adokwe et al. (2025) [60]. However, in three U.S. population studies, risks of having prediabetes and diabetes both were associated with urinary Cd excretion rates [61,62,63]. In a study by Schwartz et al. (2003), respective risk of having prediabetes and diabetes rose 48% and 24% at Cd excretion rates of 1–2 μg/g creatinine after smoking and other confounding factors were adjusted [61]. In a study by Wallia et al. (2010), a significant increase in risk of prediabetes was observed at Cd excretion rates ≥ 0.7 µg/g creatinine after adjustment for covariates [62]. In a study by Jiang et al. (2018), risk of having prediabetes was increased 3.4-fold in obese U.S. men who had urinary Cd excretion rate in the top quartile, compared to those with a normal weight and having urinary Cd excretion rate in the bottom quartile [63]. Risks of having break cancer, prediabetes and diabetes all have been found to be associated with urinary Cd excretion rates lower than 5.24 µg/g creatinine, a threshold level identified from the β2M excretion rate ≥ 300 µg/g creatinine (Section 2.1).
3.3. Urinary Cd Excretion as an Indicator of Body Burden
It is well established that excretion of Cd can be used as a cumulative long-term exposure to the metal [64,65]. Precisely, a urinary Cd concentration reflects kidney burden because most acquired Cd can be found in the proximal tubular cells (PTCs) of kidneys which release Cd complexed with metallothionein (MT) into the lumen and then appears in urine, when they are injured or die from any cause [47].
In human population studies, urine samples are often collected at a single time point (a voided urine sample), and consequently adjusting of the urinary concentrations of Cd and all other urinary biomarkers to creatinine excretion (Ecr) has been used as a method to correct for differences in urine dilution among people. However, this Ecr-normalization creates a large statistical uncertain to datasets, resulting in an underestimation of an effect size of Cd, detailed further in Section 4. To circumvent such a problem created by Ecr-adjustment practice, normalization of Cd and other excreted substances to creatinine clearance (Ccr) has been used to simultaneously correct for interindividual differences in urine dilution, and the functioning nephrons. This Ccr-normalization has unveiled an unambiguous effect of Cd on eGFR [66] and the excretion of β2M, albumin and total proteins, discussed further in Section 4. Normalization of urinary concentrations of Cd and any excreted substance to Ecr and Ccr can be undertaken using equations below.
Excretion of x (Ex) was normalized to Ecr as [x]u/[cr]u, where x= Cd or any excreted biomarker; [x]u = urine concentration of x (mass/volume) and [cr]u = urine creatinine concentration (mg/dL). Ex/Ecr was expressed as an amount of x excreted per g of creatinine.
Excretion of x (Ex) was normalized to creatinine clearance (Ccr) as Ex/Ccr = [Cd]u[cr]p/[cr]u, where x = Cd or any excreted biomarker; [x]u = urine concentration of x (mass/volume); [cr]p = plasma creatinine concentration (mg/dL); and [cr]u = urine creatinine concentration (mg/dL). Ex/Ccr was expressed as an amount of x excreted per volume of the glomerular filtrate [67].
3.4. Use of Urinary β2M in Measuring Cd effect on Tubular Reabsorptive Function
Under normal physiologic conditions, blood perfuses the kidneys at the rate of 1 L per minute, and all renal blood flow is directed through afferent arterioles into glomeruli [68]. The plasma entering the glomerulus is filtered into Bowman’s space, and 99.9% of the filtered protein is reabsorbed by tubules in an approximate of 40–50 g each day [68].
The protein β2M with the molecular weight of 11800 Daltons is expressed on the surface of most nucleated cells and is released into the bloodstream [69,70]. As Figure 1 depicts, β2M undergoes glomerular filtration, readily passes through the glomerular membrane to tubular lumen due to its small mass, and is reabsorbed and degraded by proximal tubular cells [69].
As previously discussed, β2M excretion rate of 300 µg/g creatinine was used to signify a tubular effect of Cd [25]. Current evidence, however, suggests that excretion of β2M is not a reliable tubular effect marker, and that the fractional tubular degradation of β2M should be used instead of β2M excretion [71]. Thus, the use of β2M as a basis to estimate a Cd exposure limit is inappropriate and a tolerable intake as high as 58 µg/day is not protective of human health.
The risk of developing CKD, signified by a decrease in eGFR to one third of the normal range or there is albuminuria which persists for at least 3 months [72,73,74] have been linked to dietary Cd exposure of ≥ 16.7 µg/day [75] and urinary Cd excretion of 0.27-0.37 µg/g creatinine [76,77,78]. A new health-protective exposure limit for Cd is needed.
4. Benchmark Dose Modeling of Cd Exposure and Its Nephrotoxicity
In this section, an application the BMD methodology to define a Point of Departure (POD) and a Cd-exposure threshold level is highlighted with a focus on functional kidney outcomes. Its primary aim is to identify the nephrotoxicity endpoint that can be considered as the most sensitive to Cd exposure. Its secondary aim is to illustrate the imprecision in determining internal Cd dose and its effect size, and the underestimation of the severity of an effect of Cd on eGFR and proteinuria, caused by the conventional normalization of excretion rate of nephrotoxicity biomarkers, such as β2M (Eβ2M), NAG (ENAG), albumin (Ealb) and urinary total protein (Epro), to creatinine excretion (Ecr).
4.1. Mathematical Models for Dose-Response Relationship Appraisal
Many mathematical dose–response models, namely inverse exponential, natural logarithmic, exponential, and Hill models, can be applied to continuous variables [1,3,4,5]. The mathematical dose–response models applicable to dichotomized or quantal datasets are two-stage, logarithmic logistic, Weibull, logarithmic probability, gamma, exponential, and Hill models [1,2]. Modeling of exposure-effect data can be done manually or using dose-response software programs, like the PROAST software (https://proastweb.rivm.nl) and the U.S. EPA’s Benchmark Dose Software (BMDS) (https://www.epa.gov/bmds). Application of the PROAST software for continuous and quantal (prevalence) data are exemplified in Section 4.3.
4.1.1. Identification of POD, BMDL/BMDU, and NOAEL Equivalent of Cd Exposure
The main purpose of BMD modeling of continuous exposure-effect datasets is to define the lower bound (BMDL) and upper bound (BMDU) of the 95% confidence interval (CI) of BMD [1]. The lower bound (BMDL) value derived when the benchmark dose response (BMR) is set at 5% could reflect a Point of Departure (POD) or a reference point [1,3,4,5]. It is also referred to as the NOAEL equivalent, meaning the level of exposure below which an adverse effect of such exposure can be discernable. The upper bound (BMDU) is for computing the BMDU/BMDL ratio, which reflects the uncertainty in the BMD estimates. The wider difference between BMDL and BMDU values, the higher statistical uncertainty in the dataset [1,3,4,5,6].
4.1.2. Exposure Threshold Identification, BMDL5/BMDL10
The main purpose of BMD modeling of exposure-outcome prevalence datasets is to define the lower bound (BMDL) and upper bound (BMDU) of the 95% confidence interval (CI) of BMD [1,2,6]. The BMDL/BMDU values computed at 5% and 10% prevalence rates of an adverse effect are respectively designated as BMDL5/BMDU5 and BMDL10/BMDU10. The BMDL5 could reflect a threshold level of exposure, defined as an exposure level below which the prevalence of adverse effect to be ≤ 5%.
4.2. Dose-Response Relationship
A significant relationship between exposure doses and outcomes should be first established before any reliable toxicological risk evaluation can be undertaken. However, as Grandjean and Budtz-Jørgensen (2007) noted that non-differential errors in the measurement of exposure and outcomes, termed total imprecision, can result in a failure to establish a dose-response relationship [19], which would otherwise be established, when such errors are eliminated [19]. The concept of imprecision in measurement of Cd exposure levels and its effects on kidneys have already evident from two meta-analyses, published in 2016 [79] and 2021 [80], leading to erroneous conclusion that there was no evidence that Cd exposure produced an effect on eGFR nor it contributed to progressive deterioration of eGFR among Cd-exposed individuals [79,80]. A dose-response relationship between eGFR and Cd has been unveiled in the latest meta-analysis by Doccioli et al. (2024) [81].
Table 3 provides results from an analysis of data from 917 Thai subjects [76], where an effect size of Cd on eGFR was found to be smaller when ECd was normalized to Ecr ; doubling of ECd/Ecr increased the risk of having low eGFR by 1.47-fold after adjustment for potential confounding factors. In comparison, the risk of having low eGFR rose 1.96-fold per doubling of and ECd/Ccr. This was after similar adjustments for other variables.
Further evidence that ECd/Ecr created non-differential errors can be found in Table 4, where results from a study on 409 Thai subjects are provided [82]. In this study, effects of Cd on risks of eGFR and proteinuria were both evaluated to compare the impact of Ecr and Ccr normalization of ECd and Epro.
For Ecr-normalized datasets (model A), risk of having low eGFR was not statistically associated with ECd/Ecr (p = 0.058), while risk of having proteinuria rose 3.7-fold as ECd/Ecr rose 10-fold (p = 0.045). Similar results were obtained in a meta-analysis by Jalili et al. (2021), who found an association of eGFR and ECd/Ecr was insignificant, while the risk of proteinuria rose by 35% only, when the top category of Cd dose metrics was compared with the bottom Cd exposure category [80]. Thus, the risk of having proteinuria was reduced when ECd and Epro data were normalized to Ecr, while the risk of having low eGFR was markedly diminished as such it became statistically insignificantly in Ecr normalized data.
For Ccr-normalized datasets, (model B), risks of having low eGFR and proteinuria rose 12-fold (p < 0.001) and 7-fold (p = 0.001), when there was a 10-fold increase in ECd/Ccr.
In summary, adjusting the urinary concentrations of Cd and urinary biomarkers of kidney effects, like total protein to Ecr appeared to generate non-differential errors that bias the dose-response relationship toward the null. As data in Table 4 illustrate, a dose-response relationship could not be established between eGFR and ECd/Ecr, while the strength of an association between EPro/Ecr and ECd/Ecr was weak. Consequently, Cd exposure limits cannot not reliably be derived from Ecr-adjusted datasets.
4.3. The PROAST Software for BMD Modeling
Typically, a single or two dose-response models are used in manual BMD computation, which is cumbersome. The BMD software program like the PROAST is increasingly been used as it is freely accessible (web-based), and it offers several advantages; there are many dose-response models to choose and it employs the Akaike information criterion (AIC), which objectively compare the relative goodness of fit of different models [6]. The dose-response curve in which the data best fit offers an insight into the shape and steepness of the slope describing an effect size of Cd. Outputs from the PROAST software applied to continuous and quantal data from the same 409 individuals [82] shown in Table 4 are recapitulated in Figure 3 and Figure 4.
For ECd/Ecra and Epro/Ecr datasets (Figure 3), the mathematical dose-response models used were exponential, Hill, natural logarithmic, and inverse exponential. Based on the model weights, the exponential model carried the highest weight (0.6840), followed by Hill model (0.2794), while natural logarithmic model (0.0386) and inverse exponential model (0.0017) carried much less weights. By model averaging, the BMDL value or the NOAEL equivalent of ECd/Ecr was 0.0536 µg/g for Epro endpoint. Notably, the BMDL value of ECd/Ecr for Epro endpoint will be unreliable if only Hill model is applied.
For ECd/Ecra and proteinuria prevalence datasets (Figure 4), the mathematical dose-response models used were two-stage, logarithmic logistic, Weibull, logarithmic probability, gamma, exponential, and Hill model. By model averaging, BMDL5 value of ECd/Ecr for proteinuria endpoint was 1.86 µg/g creatinine. This represented a threshold level for proteinuria. The ECd/Ecr-CKD prevalence curve fit moderately logarithmic probability (0.3501), followed by Hill (0.1482) and logarithmic logistic models (0.1452).
The same seven dose-response models were applied to ECd/Ecra-low eGFR (CKD) prevalence datasets (Figure 4). The BMDL5 value of ECd/Ecr for CKD was 1.19 µg/g creatinine. The ECd/Ecr-CKD prevalence curve fit predominantly exponential model (0.8740), meaning that a small change in ECd/Ecr will result in a large increase in CKD prevalence. Thus, CKD prevalence rate was more sensitive to Cd than proteinuria prevalence.
4.4. Comparing Reposretd BMD Values for Different Nephrotoxic Endpoints
Health-based exposure guidance value for Cd exposure, derived from different “POD” figures like MRL, TRV, TWI, TMI, and RfD, all assumes that a threshold level of exposure exists [1]. In theory, an exposure level derived from the most sensitive endpoint or the one with the lowest BMDL value would be protective against all other adverse effects [1]. Thus, the lowest BMDL value of ECd/Ecr should be used to define Cd exposure guidance value. To identify the most sensitive endpoint for an effect of Cd on the functional integrity of kidneys. reported results of BMD modeling of continuous and quantal data; BMDL/BMDU, BMDL5/BMDU5 and BMDL10/BMDU10 of ECd/Ecr are compared.
Current Cd exposure guidelines range from 0.21 and 0.83 µg/ kg body weight per day have been determined (Table 1). These were based on different endpoints and methodologies. However, most countries employ the JECFA “tolerable” exposure level of Cd at 0.83 µg/ kg body weight per day and BMDL5, a threshold level of 5.24 µg/g creatinine. Indeed, the Cd exposure threshold or BMDL5 value of ECd/Ecr of 5.24 µg/g creatinine was based solely on the β2M endpoint. Qing et al. (2023) reported that average dietary Cd exposure in China was 34.3 μg/day, varying between 22.6 and 54.5 μg/day across regions, and that dietary Cd exposure recorded for 15.4% of study population exceeded the JECFA tolerable intake level of 49.8 µg/day for a 60 kg person [83].
Many BMDL5 values of ECd/Ecr have now been determined using other kidney tubular biomarkers, like excretion of retinal binding protein (RBP) and NAG, together with the β2M. Findings from two meta-analyses, summarized below showed that BMDL5 values of ECd/Ecr for nephrotoxicity were lower than 5.24 µg/g creatinine.
Liu et al. (2016), applied the BMD modeling to the Cd exposure and NAG data recorded in 30 publications, and they identified BMDL5 value of ECd/Ecr to be 1.67 μg/g creatinine [84]. Based on data from 13 publications, Woo et al. (2015) found BMDL5 value of ECd/Ecr for the β2M endpoint to be 4.88, 3.13 and 1.9 μg/g creatinine, depending on the cut-off values for β2M used. The BMDL5 value of ECd/Ecr of 1.9 μg/g creatinine was obtained, when β2M ≤ 400 µg/g creatinine were used as a cut-off value [85].
Many more BMDL, BMDL5 values of ECd/Ecr derived from various nephrotoxicity endpoints can be found in Table 5.
As typical, Wang et al. (2016) reported BMDL (BMD) values of ECd/Ecr for markers of tubular toxicity, namely RBP, β2M and NAG [87]. Surprisingly, a few studies have applied BMD methodology to the data on eGFR although low eGFR is a diagnostic criterion for CKD. There is only one paper involved BMD modeling of total protein excretion although this parameter is a predictor of continued nephron destruction, resulting in progressive decline of eGFR [82]. Interestingly, Cd exposure has been causally related to a rapid fall of eGFR in a prospective cohort study from Switzerland (n = 4704) [90]. Respective BMDL5 value of ECd/Ecr were 1.86 and 1.19 µg/g creatinine, when proteinuria and low eGFR were used as endpoints [82].
It is notable that BMD values of ECd/Ecr for effects on the glomerular filtration rate (GFR) and tubular injury/dysfunction were marginally different, meaning these two effects are intertwined. A study on Swedish women by Suwazono et al. (2006) reported BMD values of ECd/Ecr for effects on eGFR together with ENAG/Ecr [86]. The BMDL values of ECd/Ecr in Swedish women were 0.5 and 0.7 μg/g creatinine for the tubular injury (ENAG/Ecr) and eGFR endpoints [86]. Satarug et al. (2022) reported BMD values of ECd/Ecr for effects on eGFR, ENAG/Ecr plus Eβ2M/Ecr using Thai population data [89]. Hayashi et al. (2024) reported the BMDL values of ECd/Ecr in Japanese women were 3.9 and 3.5 μg/g creatinine for a 10% decrease in tubular reabsorption of β2M) and Ccr effect, respectively [88].
Another notable result comes from Thai population data, suggesting that the nephrotoxicity of Cd occurs at a very low body burden. Respective NOAEL equivalents of ECd/Ecr in men and women were 0.060 and 0.069 µg/g creatinine for a 5% increase in ENAG/Ecr [89]. The NOAEL equivalent of ECd/Ecr was as little as 0.054 µg/g creatinine, when a 5% increase in total protein excretion was used as an endpoint [82].
The BMDL5/BMDL10 values of ECd/Ecr for proteinuria were 1.86 and 4.47 µg/g creatinine, meaning that the prevalence of Cd-related proteinuria would increase from 5% to 10% when population mean value of ECd/ECd increases from 1.86 to 4.47 µg/g creatinine. For the low eGFR endpoint, BMDL5/BMDL10 values of ECd/Ecr were 1.19 and 1.35 µg/g creatinine, meaning that the prevalence of Cd-related low eGFR would increase from 5% to 10% when population mean value of ECd/ECd increases from 1.19 to 1.35 µg/g creatinine. Apparently, an effect size of Cd on eGFR decline was larger than proteinuria.
4.5. BMDL5 and BMDL10 Values of Cd Exposure Derived from Ecr- and Ccr Normalized Data
To demonstrate that normalization of ECd and Ealb to Ccr was superior to a conventional adjustment of ECd and Ealb to Ecr, the quantal BMD modeling outputs of the PROAST software can be found in Table 6.
Due to a high degree of statistical uncertainty, indicated by the BMDU/BMDL ratios ≥ 200, the BMDL5 and BMDL10 values of ECd/Ecr could not be reliably defined for albuminuria endpoint. However, when 5% and 10% CKD prevalence rates were endpoints, the BMDL5 and BMDL10 values of ECd/Ecr were determined with certainty. In women the BMDL5 and BMDL10 values of ECd/Ecr for CKD endpoint were 1.93, and 5.31 µg/g creatinine, respectively. Corresponding BMDL5 and BMDL10 values of ECd/Ecr in men were 1.47, and 3.92 µg/g creatinine. Lower BMDL5 and BMDL10 values of ECd/Ecr in men, compared to women were due to higher creatinine excretion rates in men, attributable to a universally higher muscle mass in men than women of similar age.
In comparison BMDL5 and BMDL10 values of Cd exposure levels were determined with certainty for both albuminuria and CKD prevalence endpoints when Ccr-normalized data were analyzed. For the CKD (low eGFR) prevalence endpoint, BMDL5 and BMDL10 in men and women were not different statistically. In theory, the basic mechanism of the Cd toxicity in PTCs should be the same as such the toxic exposure level of Cd can be expected to be the same for both genders. These data strengthen the superior of Ccr-normalization of the urinary Cd concentration because excreted Cd originated from PTCs. Indeed, applying Ccr-normalization to urinary Cd and NAG concentrations, independent effects of age and Cd exposure on the rate of loss of tubular cells per nephron has been determined [92].
5. Conclusions
In many populations, Cd exposure level has now reached toxic levels in a significant proportion of people, and yet there is no consensus on a safe exposure level for the metal. The main route of Cd exposure in non-smokers and non-occupationally exposed people is a normal diet. However, current dietary exposure guidelines are not low enough to protect kidney health. An elevation of β2M excretion used as a basis for derivation of a tolerable Cd exposure level is not a reliable indicator of kidney tubular dysfunction. The fractional tubular degradation of β2M has been emerged as a measure of tubular dysfunction and thus should be employed for such a purpose.
A practice of adjusting urinary Cd, β2M, NAG, albumin, and total proteins to creatinine excretion (Ecr) incorporates a conceptual flaw, which creates non-differential errors and bias the dose-response relationship toward the null. These errors and total imprecision can be eliminated by adjusting urinary Cd to creatinine clearance (Ccr). This Ccr-normalization practice does not require timed urine collection. The BMDL (NOAEL equivalent), BMDL5 and BMDL10 values for Cd exposure computed from Ccr-normalized data should thus be used in health-based exposure guidelines for Cd.
Using ENAG/Ecr and Epro/Ecr as endpoints, respective NOAEL equivalents of ECd/Ecr identified from Thai population datasets were 0.060 and 0.054 µg/g creatinine. These figures are 10-fold below mean ECd/Ecr recorded for the general populations in many countries of 0.5-0.6 µg/g creatinine. Using population prevalence of CKD as an endpoint, an exposure threshold level of Cd (BMD5 value of ECd/Ecr) was 1.19 µg/g creatinine below which the prevalence of Cd-related CKD is expected to be ≤ 5%.
Based on the above BMD modeling data, and there is no theoretical reason to believe that a decrease in eGFR due to nephron destruction by Cd is irreversible, new dietary Cd exposure guidelines should be established to preserve kidney functional integrity and to minimize disease progression toward kidney failure. Public health measures should be developed to minimize Cd contamination of food chains and maintain the lowest achievable Cd levels in food crops, especially staples. An effective chelation therapy to remove Cd from the kidneys does not exist. Avoidance of foods containing high Cd and smoking cessation are essential preventive measures as is the maintenance of an optimal body content of essential metals, notably zinc and iron to reduce Cd assimilation and kidney burdens to the lowest achievable level.
Funding
This research received no external funding.
Institutional Review Board Statement
Not applicable.
Informed Consent Statement
Not applicable.
Data Availability Statement
Not applicable.
Acknowledgments
The author thanks Aleksandar Cirovic for his assistance in designing Figures 1 and 2. The author also thanks Aleksandra Buha Đorđević for her professional BMD modeling. The work was supported with resources of Centre for Kidney Disease Research, Translational Research Institute, and Department of Kidney and Transplant Services, Princess Alexandra Hospital, QLD, Australia.
Conflicts of Interest
The author declares no conflicts of interest.
References
- Moffett, D.B.; Mumtaz, M.M.; Sullivan, D.W., Jr.; Whittaker, M.H. Chapter 13, General Considerations of Dose-Effect and Dose-Response Relationships. In Handbook on the Toxicology of Metals, 5th ed.; Volume I: General Considerations; Nordberg, G., Costa, M., Eds.; Academic Press: Cambridge, MA, USA, 2022; pp. 299–317. [Google Scholar]
- Sand, S.; Filipsson, A.F.; Victorin, K. Evaluation of the benchmark dose method for dichotomous data: model dependence and model selection. Regul. Toxicol. Pharmacol. 2002, 36, 184–197. [Google Scholar] [CrossRef] [PubMed]
- Slob, W.; Moerbeek, M.; Rauniomaa, E.; Piersma, A.H. A statistical evaluation of toxicity study designs for the estimation of the benchmark dose in continuous endpoints. Toxicol. Sci. 2005, 84, 167–185. [Google Scholar] [CrossRef]
- Slob, W.; Setzer, R.W. Shape and steepness of toxicological dose-response relationships of continuous endpoints. Crit. Rev. Toxicol. 2014, 44, 270–297. [Google Scholar] [CrossRef] [PubMed]
- Slob, W. A general theory of effect size, and its consequences for defining the benchmark response (BMR) for continuous endpoints. Crit. Rev. Toxicol. 2017, 47, 342–351. [Google Scholar]
- EFSA Scientific Committee. Update: Use of the benchmark dose approach in risk assessment. EFSA J. 2017, 15, 4658. [Google Scholar]
- Waalkes, M.P.; Rehm, S. Chronic toxic and carcinogenic effects of cadmium chloride in male DBA/2NCr and NFS/NCr mice: Strain-dependent association with tumors of the hematopoietic system, injection site, liver, and lung. Fundam. Appl. Toxicol. 1994, 23, 21–31. [Google Scholar]
- Huff, J.; Lunn, R.M.; Waalkes, M.P.; Tomatis, L.; Infante, P.F. Cadmium-induced cancers in animals and in humans. Int. J. Occup. Environ. Health 2007, 13, 202–212. [Google Scholar] [CrossRef]
- Tokar, E.J.; Benbrahim-Tallaa, L.; Waalkes, M.P. Metal ions in human cancer development. Met. Ions Life Sci. 2011, 8, 375–401. [Google Scholar]
- Callan, A.; Hinwood, A.; Devine, A. Metals in commonly eaten groceries in Western Australia: A market basket survey and dietary assessment. Food Addit. Contam. Part A Chem. Anal. Control Expo. Risk Assess. 2014, 31, 1968–1981. [Google Scholar]
- Watanabe, T.; Kataoka, Y.; Hayashi, K.; Matsuda, R.; Uneyama, C. Dietary Exposure of the Japanese General Population to Elements: Total Diet Study 2013-2018. Food Saf. (Tokyo) 2022, 10, 83–101. [Google Scholar]
- Pokharel, A.; Wu, F. Dietary exposure to cadmium from six common foods in the United States. Food Chem. Toxicol. 2023, 178, 113873. [Google Scholar] [CrossRef]
- Boon, P.E.; Pustjens, A.M.; Te Biesebeek, J.D.; Brust, G.M.H.; Castenmiller, J.J.M. Dietary intake and risk assessment of elements for 1- and 2-year-old children in the Netherlands. Food Chem Toxicol. 2022, 161, 112810. [Google Scholar] [CrossRef]
- Almerud, P.; Zamaratskaia, G.; Lindroos, A.K.; Bjermo, H.; Andersson, E.M.; Lundh, T.; Ankarberg, E.H.; Lignell, S. Cadmium, total mercury, and lead in blood and associations with diet, sociodemographic factors, and smoking in Swedish adolescents. Environ. Res. 2021, 197, 110991. [Google Scholar] [CrossRef]
- Hill, D.T.; Jandev, V.; Petroni, M.; Atallah-Yunes, N.; Bendinskas, K.; Brann, L.S.; Heffernan, K.; Larsen, D.A.; MacKenzie, J.A.; Palmer, C.D.; et al. Airborne levels of cadmium are correlated with urinary cadmium concentrations among young children living in the New York state city of Syracuse, USA. Environ. Res. 2023, 223, 115450. [Google Scholar] [CrossRef] [PubMed]
- Satarug, S.; Vesey, D.A.; Gobe, G.C.; Phelps, K.R. Estimation of health risks associated with dietary cadmium exposure. Arch. Toxicol. 2023, 97, 329–358. [Google Scholar] [CrossRef] [PubMed]
- Egger, A.E.; Grabmann, G.; Gollmann-Tepeköylü, C.; Pechriggl, E.J.; Artner, C.; Türkcan, A.; Hartinger, C.G.; Fritsch, H.; Keppler, B.K.; Brenner, E.; et al. Chemical imaging and assessment of cadmium distribution in the human body. Metallomics 2019, 11, 2010–2019. [Google Scholar] [CrossRef] [PubMed]
- Cirovic, A.; Satarug, S. Toxicity Tolerance in the Carcinogenesis of Environmental Cadmium. Int. J. Mol. Sci. 2024, 25, 1851. [Google Scholar] [CrossRef]
- Satarug, S.; Garrett, S.H.; Somji, S.; Sens, M.A.; Sens, D.A. Aberrant Expression of ZIP and ZnT Zinc Transporters in UROtsa Cells Transformed to Malignant Cells by Cadmium. Stresses 2021, 1, 78–89. [Google Scholar] [CrossRef]
- Grandjean, P.; Budtz-Jørgensen, E. Total imprecision of exposure biomarkers: implications for calculating exposure limits. Am. J. Ind. Med. 2007, 50, 712–719. [Google Scholar] [CrossRef]
- Aoshima, K. Epidemiology of renal tubular dysfunction in the inhabitants of a cadmium-polluted area in the Jinzu River basin in Toyama Prefecture. Tohoku J. Exp. Med. 1987, 152, 151–172. [Google Scholar] [CrossRef]
- Horiguchi, H.; Aoshima, K.; Oguma, E.; Sasaki, S.; Miyamoto, K.; Hosoi, Y.; Katoh, T.; Kayama, F. Latest status of cadmium accumulation and its effects on kidneys, bone, and erythropoiesis in inhabitants of the formerly cadmium-polluted Jinzu River Basin in Toyama, Japan, after restoration of rice paddies. Int. Arch. Occup. Environ. Health 2010, 83, 953–970. [Google Scholar] [CrossRef] [PubMed]
- Kurata, Y.; Katsuta, O.; Doi, T.; Kawasuso, T.; Hiratsuka, H.; Tsuchitani, M.; Umemura, T. Chronic cadmium treatment induces tubular nephropathy and osteomalacic osteopenia in ovariectomized cynomolgus monkeys. Vet. Pathol. 2014, 51, 919–931. [Google Scholar] [CrossRef] [PubMed]
- Wong, C.; Roberts, S.M.; Saab, I.N. Review of regulatory reference values and background levels for heavy metals in the human diet. Regul. Toxicol. Pharmacol. 2022, 130, 105122. [Google Scholar] [CrossRef]
- JECFA. Summary and Conclusions. In Proceedings of the Joint FAO/WHO Expert Committee on Food Additives and Contaminants, Seventy-Third Meeting, Geneva, Switzerland, 8–17 June 2010; JECFA/73/SC. Food and Agriculture Organization of the United Nations/World Health Organization: Geneva, Switzerland, 2011. Available online: https://apps.who.int/iris/handle/10665/44521 (accessed on 22 March 2025).
- European Food Safety Authority (EFSA) Scientific opinion on cadmium in food. EFSA J. 2009, 980, 1–139.
- European Food Safety Authority (EFSA) Statement on tolerable weekly intake for cadmium. EFSA J. 2011, 9, 1975.
- Qing, Y.; Yang, J.; Zhu, Y.; Li, Y.; Zheng, W.; Wu, M.; He, G. Dose-response evaluation of urinary cadmium and kidney injury biomarkers in Chinese residents and dietary limit standards. Environ. Health 2021, 20, 75. [Google Scholar] [CrossRef] [PubMed]
- Qing, Y.; Yang, J.; Chen, Y.; Shi, C.; Zhang, Q.; Ning, Z.; Yu, Y.; Li, Y. Urinary cadmium in relation to bone damage: Cadmium exposure threshold dose and health-based guidance value estimation. Ecotoxicol. Environ. Saf. 2021, 226, 112824. [Google Scholar] [CrossRef]
- Leconte, S.; Rousselle, C.; Bodin, L.; Clinard, F.; Carne, G. Refinement of health-based guidance values for cadmium in the French population based on modelling. Toxicol. Lett. 2021, 340, 43–51. [Google Scholar] [CrossRef]
- Schaefer, H.R.; Flannery, B.M.; Crosby, L.M.; Pouillot, R.; Farakos, S.M.S.; Van Doren, J.M.; Dennis, S.; Fitzpatrick, S.; Middleton, K. Reassessment of the cadmium toxicological reference value for use in human health assessments of foods. Regul. Toxicol. Pharmacol. 2023, 144, 105487. [Google Scholar] [CrossRef]
- Pouillot, R.; Farakos, S.S.; Spungen, J.; Schaefer, H.R.; Flannery, B.M.; Van Doren, J.M. Cadmium physiologically based pharmacokinetic (PBPK) models for forward and reverse dosimetry: Review, evaluation, and adaptation to the U.S. population. Toxicol. Lett. 2022, 367, 67–75. [Google Scholar] [CrossRef]
- Brzóska, M.M.; Moniuszko-Jakoniuk, J. Disorders in bone metabolism of female rats chronically exposed to cadmium. Toxicol. Appl. Pharmacol. 2005, 202, 68–83. [Google Scholar] [CrossRef] [PubMed]
- Brzóska, M.M.; Moniuszko-Jakoniuk, J. Bone metabolism of male rats chronically exposed to cadmium. Toxicol. Appl. Pharmacol. 2005, 207, 195–211. [Google Scholar] [CrossRef] [PubMed]
- Brzóska, M.M.; Moniuszko-Jakoniuk, J. Effect of low-level lifetime exposure to cadmium on calciotropic hormones in aged female rats. Arch. Toxicol. 2005, 79, 636–646. [Google Scholar] [CrossRef]
- Faroon, O.; Keith, S.; Mumtaz, M.; Ruiz, P. Minimal Risk Level Derivation for Cadmium: Acute and Intermediate Duration Exposures. J. Exp. Clin. Toxicol. 2017, 1, 1–12. [Google Scholar] [CrossRef] [PubMed]
- NTP, NIH Publication 95–3388: NTP technical report on toxicity studies of cadmium oxide (CAS No. 1306–19-0) Administered by Inhalation to F344/N Rats and B6C3F1 Mice, U.S. Department of Health and Human Services. National Institutes of Health. National Toxicology Program, Research Triangle Park, NC, 1995.
- Fujita, Y.; el Belbasi, H.I.; Min, K.S.; Onosaka, S.; Okada, Y.; Matsumoto, Y.; Mutoh, N.; Tanaka, K. Fate of cadmium bound to phytochelatin in rats. Res. Commun. Chem. Pathol. Pharmacol. 1993, 82, 357–365. [Google Scholar]
- Langelueddecke, C.; Roussa, E.; Fenton, R.A.; Thévenod, F. Expression and function of the lipocalin-2 (24p3/NGAL) receptor in rodent and human intestinal epithelia. PLoS ONE 2013, 8, e71586. [Google Scholar] [CrossRef]
- Langelueddecke, C.; Lee, W.K.; Thévenod, F. Differential transcytosis and toxicity of the hNGAL receptor ligands cadmium-metallothionein and cadmium-phytochelatin in colon-like Caco-2 cells: Implications for in vivo cadmium toxicity. Toxicol. Lett. 2014, 226, 228–235. [Google Scholar] [CrossRef]
- Schneider, S.N.; Liu, Z.; Wang, B.; Miller, M.L.; Afton, S.E.; Soleimani, M.; Nebert, D.W. Oral cadmium in mice carrying 5 versus 2 copies of the Slc39a8 gene: Comparison of uptake, distribution, metal content, and toxicity. Int. J. Toxicol. 2014, 33, 14–20. [Google Scholar] [CrossRef]
- Fujishiro, H.; Himeno, S. New insights into the roles of ZIP8, a cadmium and manganese transporter, and its relation to human diseases. Biol. Pharm. Bull. 2019, 42, 1076–1082. [Google Scholar] [CrossRef]
- Thévenod, F.; Fels, J.; Lee, W.K.; Zarbock, R. Channels, transporters and receptors for cadmium and cadmium complexes in eukaryotic cells: Myths and facts. Biometals 2019, 32, 469–489. [Google Scholar] [CrossRef]
- Ohta, H.; Ohba, K. Involvement of metal transporters in the intestinal uptake of cadmium. J. Toxicol. Sci. 2020, 45, 539–548. [Google Scholar] [CrossRef] [PubMed]
- Kikuchi, Y.; Nomiyama, T.; Kumagai, N.; Dekio, F.; Uemura, T.; Takebayashi, T.; Nishiwaki, Y.; Matsumoto, Y.; Sano, Y.; Hosoda, K.; et al. Uptake of cadmium in meals from the digestive tract of young non-smoking Japanese female volunteers. J. Occup. Health 2003, 45, 43–52. [Google Scholar] [CrossRef] [PubMed]
- Horiguchi, H.; Oguma, E.; Sasaki, S.; Miyamoto, K.; Ikeda, Y.; Machida, M.; Kayama, F. Comprehensive study of the effects of age, iron deficiency, diabetes mellitus, and cadmium burden on dietary cadmium absorption in cadmium-exposed female Japanese farmers. Toxicol. Appl. Pharmacol. 2004, 196, 114–123. [Google Scholar] [CrossRef]
- Satarug, S.; Vesey, D.A.; Ruangyuttikarn, W.; Nishijo, M.; Gobe, G.C.; Phelps, K.R. The Source and Pathophysiologic Significance of Excreted Cadmium. Toxics 2019, 7, 55. [Google Scholar] [CrossRef]
- Peng, X.; Li, C.; Zhao, D.; Huang, L. Associations of micronutrients exposure with cadmium body burden among population: A systematic review. Ecotoxicol. Environ. Saf. 2023, 256, 114878. [Google Scholar] [CrossRef]
- Silver, M.K.; Lozoff, B.; Meeker, J.D. Blood cadmium is elevated in iron deficient U.S. children: A cross-sectional study. Environ Health 2013, 12, 117. [Google Scholar] [CrossRef]
- Schildroth, S.; Friedman, A.; Bauer, J.A.; Claus Henn, B. Associations of a metal mixture with iron status in U.S. adolescents: Evidence from the National Health and Nutrition Examination Survey. New Dir. Child Adolesc. Dev. 2022, 2022, 67–89. [Google Scholar] [CrossRef] [PubMed]
- Flanagan, P.R.; McLellan, J.S.; Haist, J.; Cherian, G.; Chamberlain, M.J.; Valberg, L.S. Increased dietary cadmium absorption in mice and human subjects with iron deficiency. Gastroenterol. 1978, 74 Pt 1, 841–846. [Google Scholar] [CrossRef]
- Meltzer, H.M.; Brantsaeter, A.L.; Borch-Iohnsen, B.; Ellingsen, D.G.; Alexander, J.; Thomassen, Y.; Stigum, H.; Ydersbond, T.A. Low iron stores are related to higher blood concentrations of manganese, cobalt and cadmium in non-smoking, Norwegian women in the HUNT 2 study. Environ. Res. 2010, 110, 497–504. [Google Scholar] [CrossRef]
- King, J.C.; Brown, K.H.; Gibson, R.S.; Krebs, N.F.; Lowe, N.M.; Siekmann, J.H.; Raiten, D.J. Biomarkers of nutrition for development (BOND)-zinc review. J. Nutr. 2015, 146, 858S–885S. [Google Scholar] [CrossRef]
- Trame, S.; Wessels, I.; Haase, H.; Rink, L. A short 18 items food frequency questionnaire biochemically validated to estimate zinc status in humans. J. Trace Elem. Med. Biol. 2018, 49, 285–295. [Google Scholar] [CrossRef]
- Lowe, N.M.; Hall, A.G.; Broadley, M.R.; Foley, J.; Boy, E.; Bhutta, Z.A. Preventing and controlling zinc deficiency across the life course: A call to action. Adv. Nutr. 2024, 15, 100181. [Google Scholar] [CrossRef] [PubMed]
- Cirovic, A.; Cirovic, A. Factors moderating cadmium bioavailability: Key considerations for comparing blood cadmium levels between groups. Food Chem Toxicol. 2024, 191, 114865. [Google Scholar] [CrossRef] [PubMed]
- Van Maele-Fabry, G.; Lombaert, N.; Lison, D. Dietary exposure to cadmium and risk of breast cancer in postmenopausal women: A systematic review and meta-analysis. Environ. Int. 2016, 86, 1–13. [Google Scholar] [CrossRef]
- Larsson, S.C.; Orsini, N.; Wolk, A. Urinary cadmium concentration and risk of breast cancer: A systematic review and dose-response meta-analysis. Am. J. Epidemiol. 2015, 182, 375–380. [Google Scholar] [CrossRef] [PubMed]
- Lin, J.; Zhang, F.; Lei, Y. Dietary intake and urinary level of cadmium and breast cancer risk: A meta-analysis. Cancer Epidemiol. 2016, 42, 101–107. [Google Scholar] [CrossRef]
- Adokwe, J.B.; Pouyfung, P.; Kuraeiad, S.; Wongrith, P.; Inchai, P.; Yimthiang, S.; Satarug, S.; Khamphaya, T. Concurrent Lead and Cadmium Exposure Among Diabetics: A Case-Control Study of Socio-Demographic and Consumption Behaviors. Nutrients 2025, 17, 710. [Google Scholar] [CrossRef]
- Schwartz, G.G.; Il’yasova, D.; Ivanova, A. Urinary cadmium, impaired fasting glucose, and diabetes in the NHANES III. Diabetes Care 2003, 26, 468–470. [Google Scholar] [CrossRef]
- Wallia, A.; Allen, N.B.; Badon, S.; El Muayed, M. Association between urinary cadmium levels and prediabetes in the NHANES 2005-2010 population. Int. J. Hyg. Environ. Health 2014, 217, 854–860. [Google Scholar] [CrossRef]
- Jiang, F.; Zhi, X.; Xu, M.; Li, B.; Zhang, Z. Gender-specific differences of interaction between cadmium exposure and obesity on prediabetes in the NHANES 2007-2012 population. Endocrine 2018, 61, 258–266. [Google Scholar] [CrossRef]
- Barregard, L.; Fabricius-Lagging, E.; Lundh, T.; Mölne, J.; Wallin, M.; Olausson, M.; Modigh, C.; Sallstenm, G. Cadmium, mercury, and lead in kidney cortex of living kidney donors: Impact of different exposure sources. Environ. Res. 2010, 110, 47–54. [Google Scholar] [CrossRef] [PubMed]
- Akerstrom, M.; Barregard, L.; Lundh, T.; Sallsten, G. The relationship between cadmium in kidney and cadmium in urine and blood in an environmentally exposed population. Toxicol. Appl. Pharmacol. 2013, 268, 286–293. [Google Scholar]
- Satarug, S.; Vesey, D.A.; Nishijo, M.; Ruangyuttikarn, W.; Gobe, G.C.; Phelps, K.R. The Effect of Cadmium on GFR Is Clarified by Normalization of Excretion Rates to Creatinine Clearance. Int. J. Mol. Sci. 2021, 22, 1762. [Google Scholar] [CrossRef]
- Phelps, K.R.; Gosmanova, E.O. A generic method for analysis of plasma concentrations. Clin. Nephrol. 2020, 94, 43–49. [Google Scholar] [CrossRef]
- Navar, L.G.; Maddox, D.A.; Munger, K.A. Chapter 3: The renal circulations and glomerular filtration. In Brenner and Rector’s the Kidney, 11th ed.; Elsevier: Philadelphia, PA, USA, 2020; pp. 80–114. [Google Scholar]
- Argyropoulos, C.P.; Chen, S.S.; Ng, Y.-H.; Roumelioti, M.-E.; Shaffi, K.; Singh, P.P.; Tzamaloukas, A.H. Rediscovering Beta-2 Microglobulin As a Biomarker across the Spectrum of Kidney Diseases. Front. Med. 2017, 4, 73. [Google Scholar]
- Sivanathan, P.C.; Ooi, K.S.; Mohammad Haniff, M.A.S.; Ahmadipour, M.; Dee, C.F.; Mokhtar, N.M.; Hamzah, A.A.; Chang, E.Y. Lifting the Veil: Characteristics, Clinical Significance, and Application of β-2-Microglobulin as Biomarkers and Its Detection with Biosensors. ACS Biomater. Sci. Eng. 2022, 8, 3142–3161. [Google Scholar] [CrossRef]
- Phelps, K.R.; Yimthiang, S.; Pouyfung, P.; Khamphaya, T.; Vesey, D.A.; Satarug, S. Homeostasis of β2-Microglobulin in Diabetics and Non-Diabetics with Modest Cadmium Intoxication. Scierxiv 2025, 2025, 60. [Google Scholar] [CrossRef]
- Murton, M.; Goff-Leggett, D.; Bobrowska, A.; Garcia Sanchez, J.J.; James, G.; Wittbrodt, E.; Nolan, S.; Sörstadius, E.; Pecoits-Filho, R.; Tuttle, K. Burden of Chronic Kidney Disease by KDIGO Categories of Glomerular Filtration Rate and Albuminuria: A Systematic Review. Adv. Ther. 2021, 38, 180–200. [Google Scholar]
- Kalantar-Zadeh, K.; Jafar, T.H.; Nitsch, D.; Neuen, B.L.; Perkovic, V. Chronic kidney disease. Lancet 2021, 398, 786–802. [Google Scholar] [PubMed]
- Farrell, D.R.; Vassalotti, J.A. Screening, identifying, and treating chronic kidney disease: Why, who, when, how, and what? BMC Nephrol. 2024, 25, 34. [Google Scholar] [CrossRef] [PubMed]
- Shi, Z.; Taylor, A.W.; Riley, M.; Byles., J.; Liu, J.; Noakes, M. Association between dietary patterns, cadmium intake and chronic kidney disease among adults. Clin. Nutr. 2018, 37, 276–284. [Google Scholar]
- Satarug, S.; Đorđević, A.B.; Yimthiang, S.; Vesey, D.A.; Gobe, G.C. The NOAEL equivalent of environmental cadmium exposure associated with GFR reduction and chronic kidney disease. Toxics 2022, 10, 614. [Google Scholar] [CrossRef] [PubMed]
- Feng, X.; Zhou, R.; Jiang, Q.; Wang, Y.; Chen, C. Analysis of cadmium accumulation in community adults and its correlation with low-grade albuminuria. Sci. Total Environ. 2022, 834, 155210. [Google Scholar]
- Grau-Perez, M.; Pichler, G.; Galan-Chilet, I.; Briongos-Figuero, L.S.; Rentero-Garrido, P.; Lopez-Izquierdo, R.; Navas-Acien, A.; Weaver, V.; García-Barrera, T.; Gomez-Ariza, J.L.; et al. Urine cadmium levels and albuminuria in a general population from Spain: A gene-environment interaction analysis. Environ. Int. 2017, 106, 27–36. [Google Scholar]
- Byber, K.; Lison, D.; Verougstraete, V.; Dressel, H.; Hotz, P. Cadmium or cadmium compounds and chronic kidney disease in workers and the general population: A systematic review. Crit. Rev. Toxicol. 2016, 46, 191–240. [Google Scholar]
- Jalili, C.; Kazemi, M.; Cheng, H.; Mohammadi, H.; Babaei, A.; Taheri, E.; Moradi, S. Associations between exposure to heavy metals and the risk of chronic kidney disease: A systematic review and meta-analysis. Crit. Rev. Toxicol. 2021, 51, 165–182. [Google Scholar]
- Doccioli, C.; Sera, F.; Francavilla, A.; Cupisti, A.; Biggeri, A. Association of cadmium environmental exposure with chronic kidney disease: A systematic review and meta-analysis. Sci. Total Environ. 2024, 906, 167165. [Google Scholar]
- Satarug, S.; Vesey, D.A.; Đorđević, A.B. The NOAEL equivalent for the cumulative body burden of cadmium: focus on proteinuria as an endpoint. J. Environ. Expo. Assess. 2024, 3, 26. [Google Scholar]
- Qing, Y.; Li, Y.; Cai, X.; He, W.; Liu, S.; Ji, Y.; Jiang, M.; Yang, L.; Wang, J.; Ping, S.; et al. Assessment of Cadmium Concentrations in Foodstuffs and Dietary Exposure Risk Across China: A Metadata Analysis. Exposure and Health 2023, 15, 951–961. [Google Scholar]
- Liu, C.; Li, Y.; Zhu, C.; Dong, Z.; Zhang, K.; Zhao, Y.; Xu, Y. Benchmark dose for cadmium exposure and elevated N-acetyl-β-D-glucosaminidase: A meta-analysis. Environ. Sci. Pollut. Res. Int. 2016, 23, 20528–20538. [Google Scholar]
- Woo, H.D.; Chiu, W.A.; Jo, S.; Kim, J. Benchmark Dose for Urinary Cadmium based on a Marker of Renal Dysfunction: A Meta-Analysis. PLoS One 2015, 10, e0126680. [Google Scholar]
- Suwazono, Y.; Sand, S.; Vahter, M.; Filipsson, A.F.; Skerfving, S.; Lidfeldt, J.; Akesson, A. Benchmark dose for cadmium-induced renal effects in humans. Environ. Health Perspect. 2006, 114, 1072–1076. [Google Scholar]
- Wang, X.; Wang, Y.; Feng, L.; Tong, Y.; Chen, Z.; Ying, S.; Chen, T.; Li, T.; Xia, H.; Jiang, Z.; et al. Application of the benchmark dose (BMD) method to identify thresholds of cadmium-induced renal effects in non-polluted areas in China. PLoS ONE 2016, 11, e0161240. [Google Scholar]
- Hayashi, T.; Nogawa, K.; Watanabe, Y.; Kido, T.; Sakurai, M.; Nakagawa, H.; Suwazono, Y. Benchmark Dose of Urinary Cadmium for Assessing Renal Tubular and Glomerular Function in a Cadmium-Polluted Area of Japan. Toxics 2024, 12, 836. [Google Scholar] [CrossRef]
- Satarug, S.; Vesey, D.A.; Gobe, G.C.; Đorđević, A.B. The Validity of Benchmark Dose Limit Analysis for Estimating Permissible Accumulation of Cadmium. Int. J. Environ. Res. Public. Health 2022, 19, 15697. [Google Scholar]
- Xie, S.; Perrais, M.; Golshayan, D.; Wuerzner, G.; Vaucher, J.; Thomas, A.; Marques-Vidal, P. Association between urinary heavy metal/trace element concentrations and kidney function: a prospective study. Clin. Kidney J. 2024, 18, sfae378. [Google Scholar]
- Satarug, S.; Vesey, D.A.; Gobe, G.C.; Yimthiang, S.; Buha Đorđević, A. Health Risk in a Geographic Area of Thailand with Endemic Cadmium Contamination: Focus on Albuminuria. Toxics 2023, 11, 68. [Google Scholar] [CrossRef]
- Satarug, S. Urinary N-acetylglucosaminidase in People Environmentally Exposed to Cadmium Is Minimally Related to Cadmium-Induced Nephron Destruction. Toxics 2024, 12, 775. [Google Scholar] [CrossRef]
Figure 1.
The pathway for cadmium in food to its toxic manifestation in kidneys. From the gut, Cd is delivered to liver via the portal blood system, before reaching the systemic circulation and transported to tissues and organs throughout the body. Due to a lack of excretory mechanism, Cd is retained within cells after entrance, notably the proximal tubular epithelial cells. The manifestation of toxic Cd accumulation in kidneys such as tubulointerstitial inflammation may incapacitate the glomerular filtration rate. Cd appears in urine after being released from injured or dying kidney tubular cells. Thus, it is argued that the excretion rate of Cd (ECd) should be normalized to creatinine clearance (Ccr) to depict the amount of Cd exiting the kidneys per nephron [47].
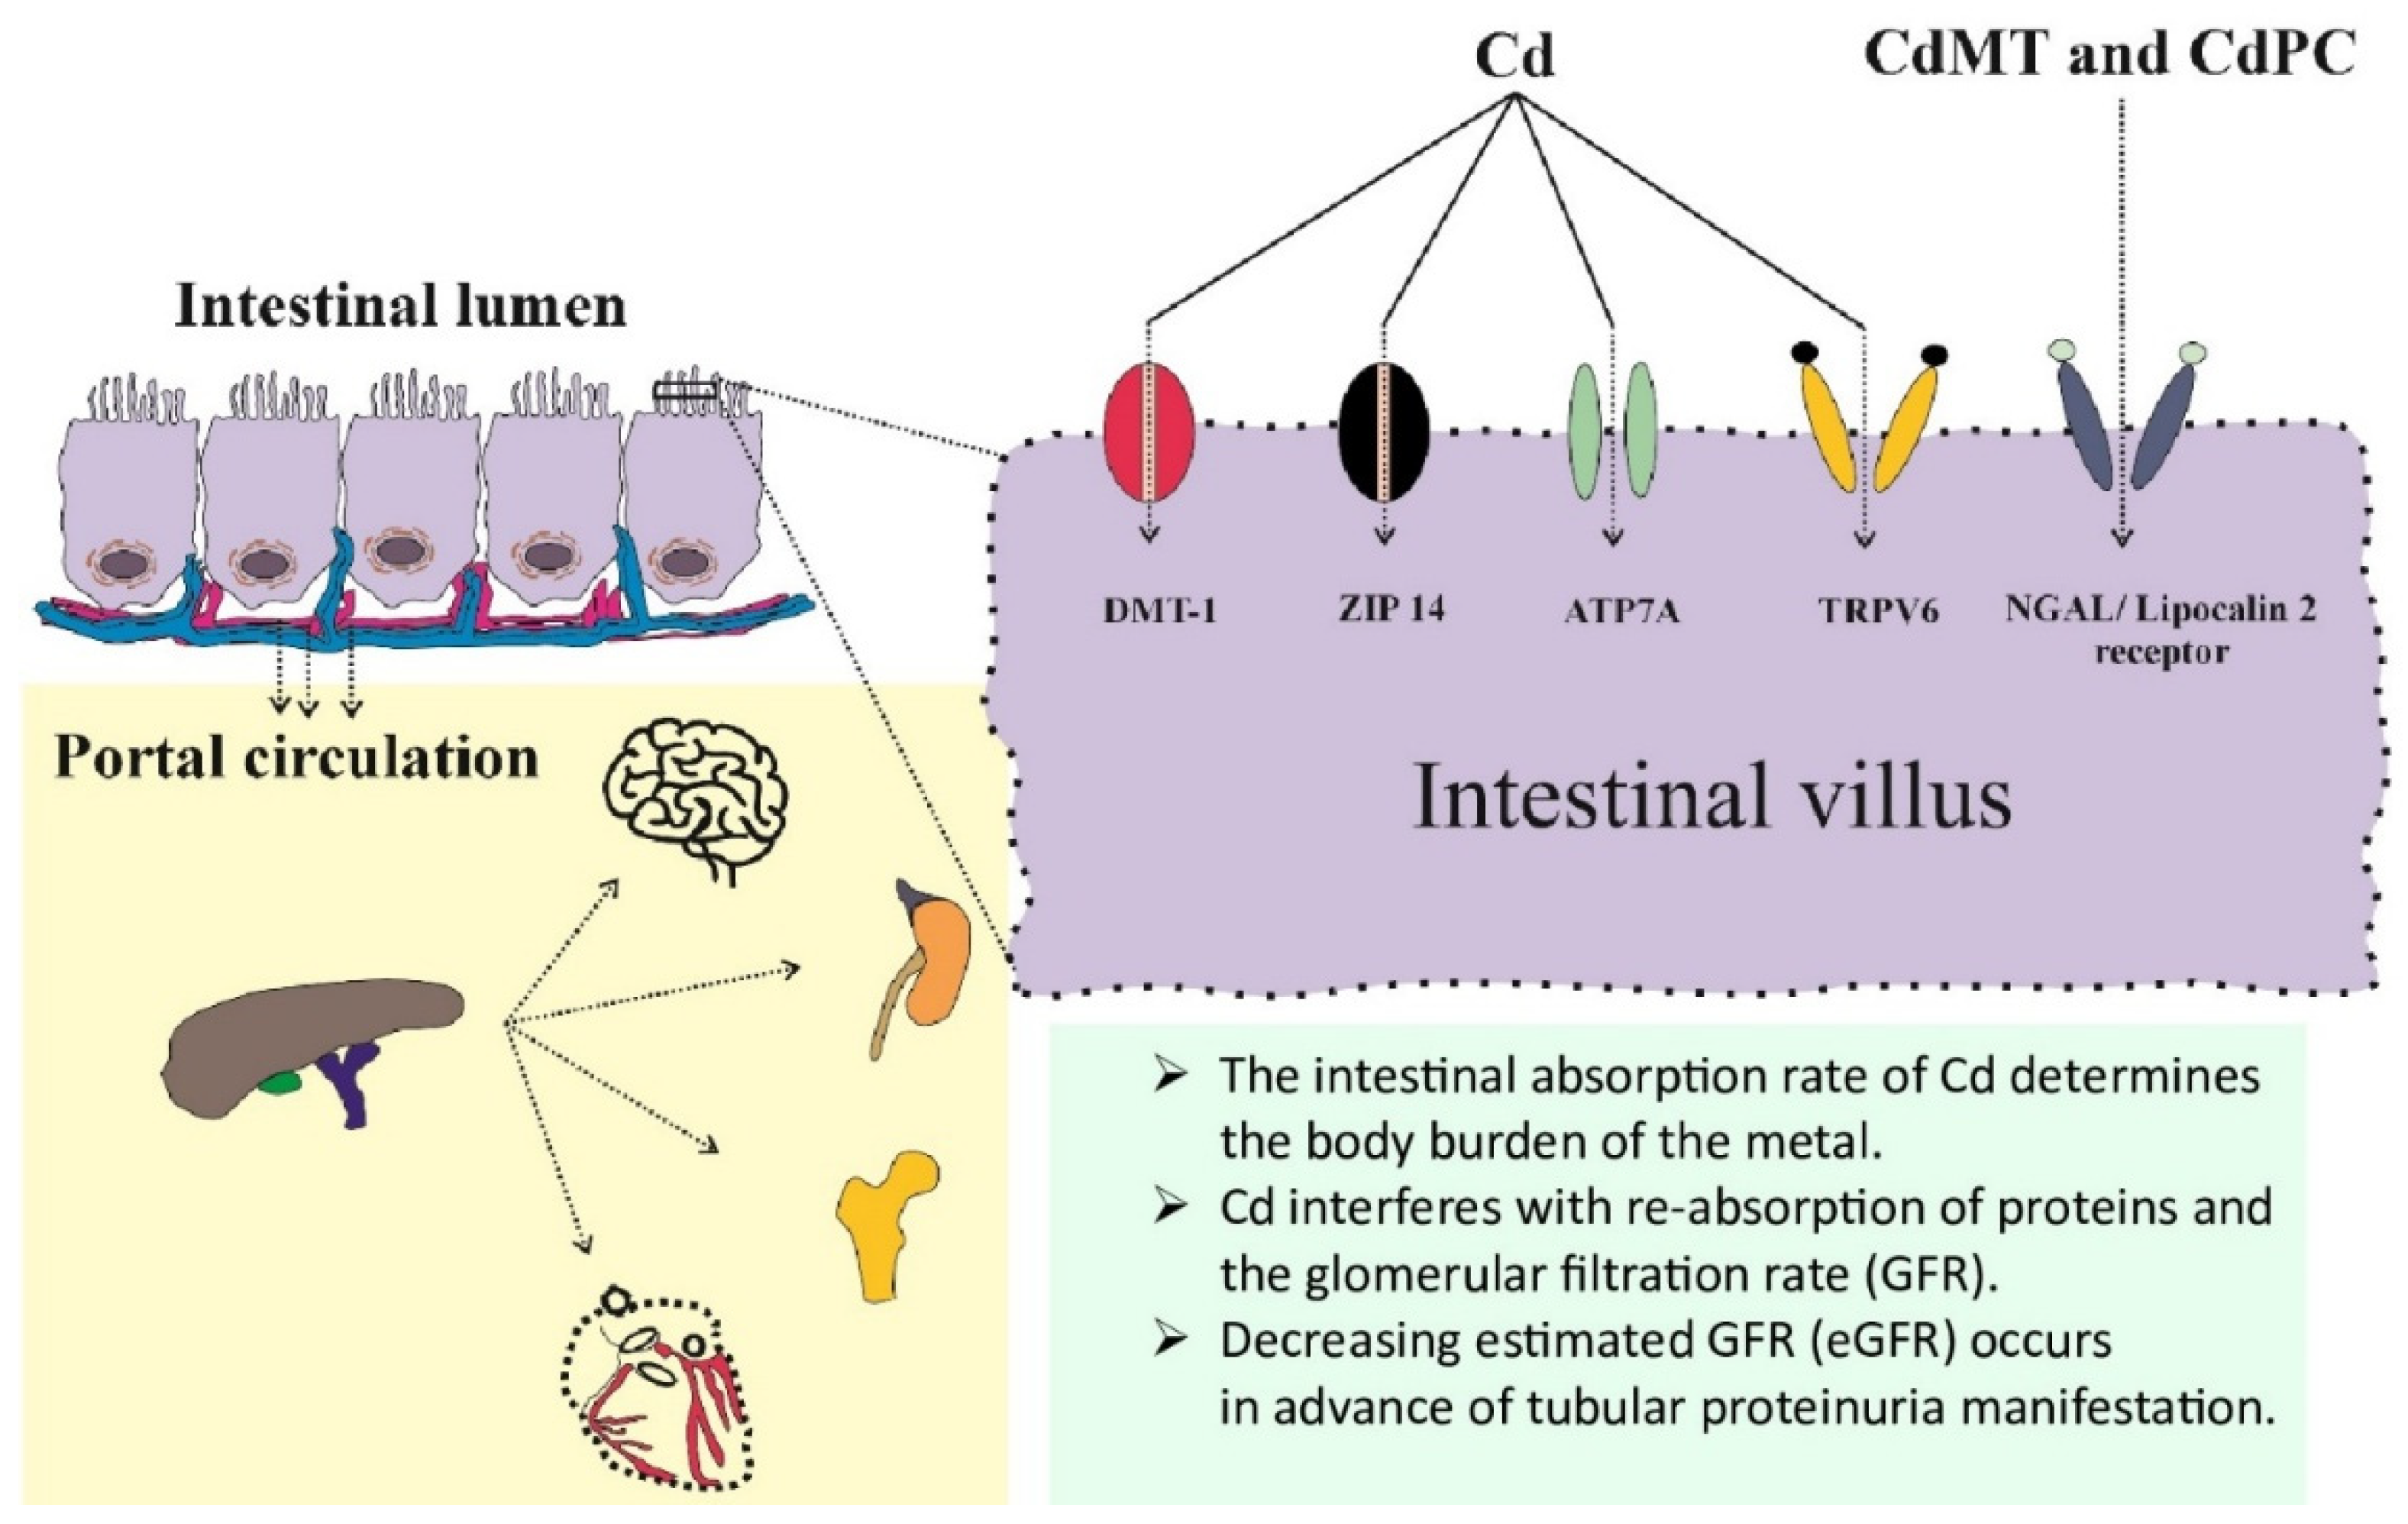
Figure 2.
Measuring of an effect of Cd on tubular reabsorption of β2M. The reabsorption of β2M occurs mostly in the S1 segment via receptor-mediated endocytosis, involving megalin. Fractional tubular reabsorption of β2M has emerged as a reliable parameter for assessment of tubular dysfunction [71].
Figure 2.
Measuring of an effect of Cd on tubular reabsorption of β2M. The reabsorption of β2M occurs mostly in the S1 segment via receptor-mediated endocytosis, involving megalin. Fractional tubular reabsorption of β2M has emerged as a reliable parameter for assessment of tubular dysfunction [71].
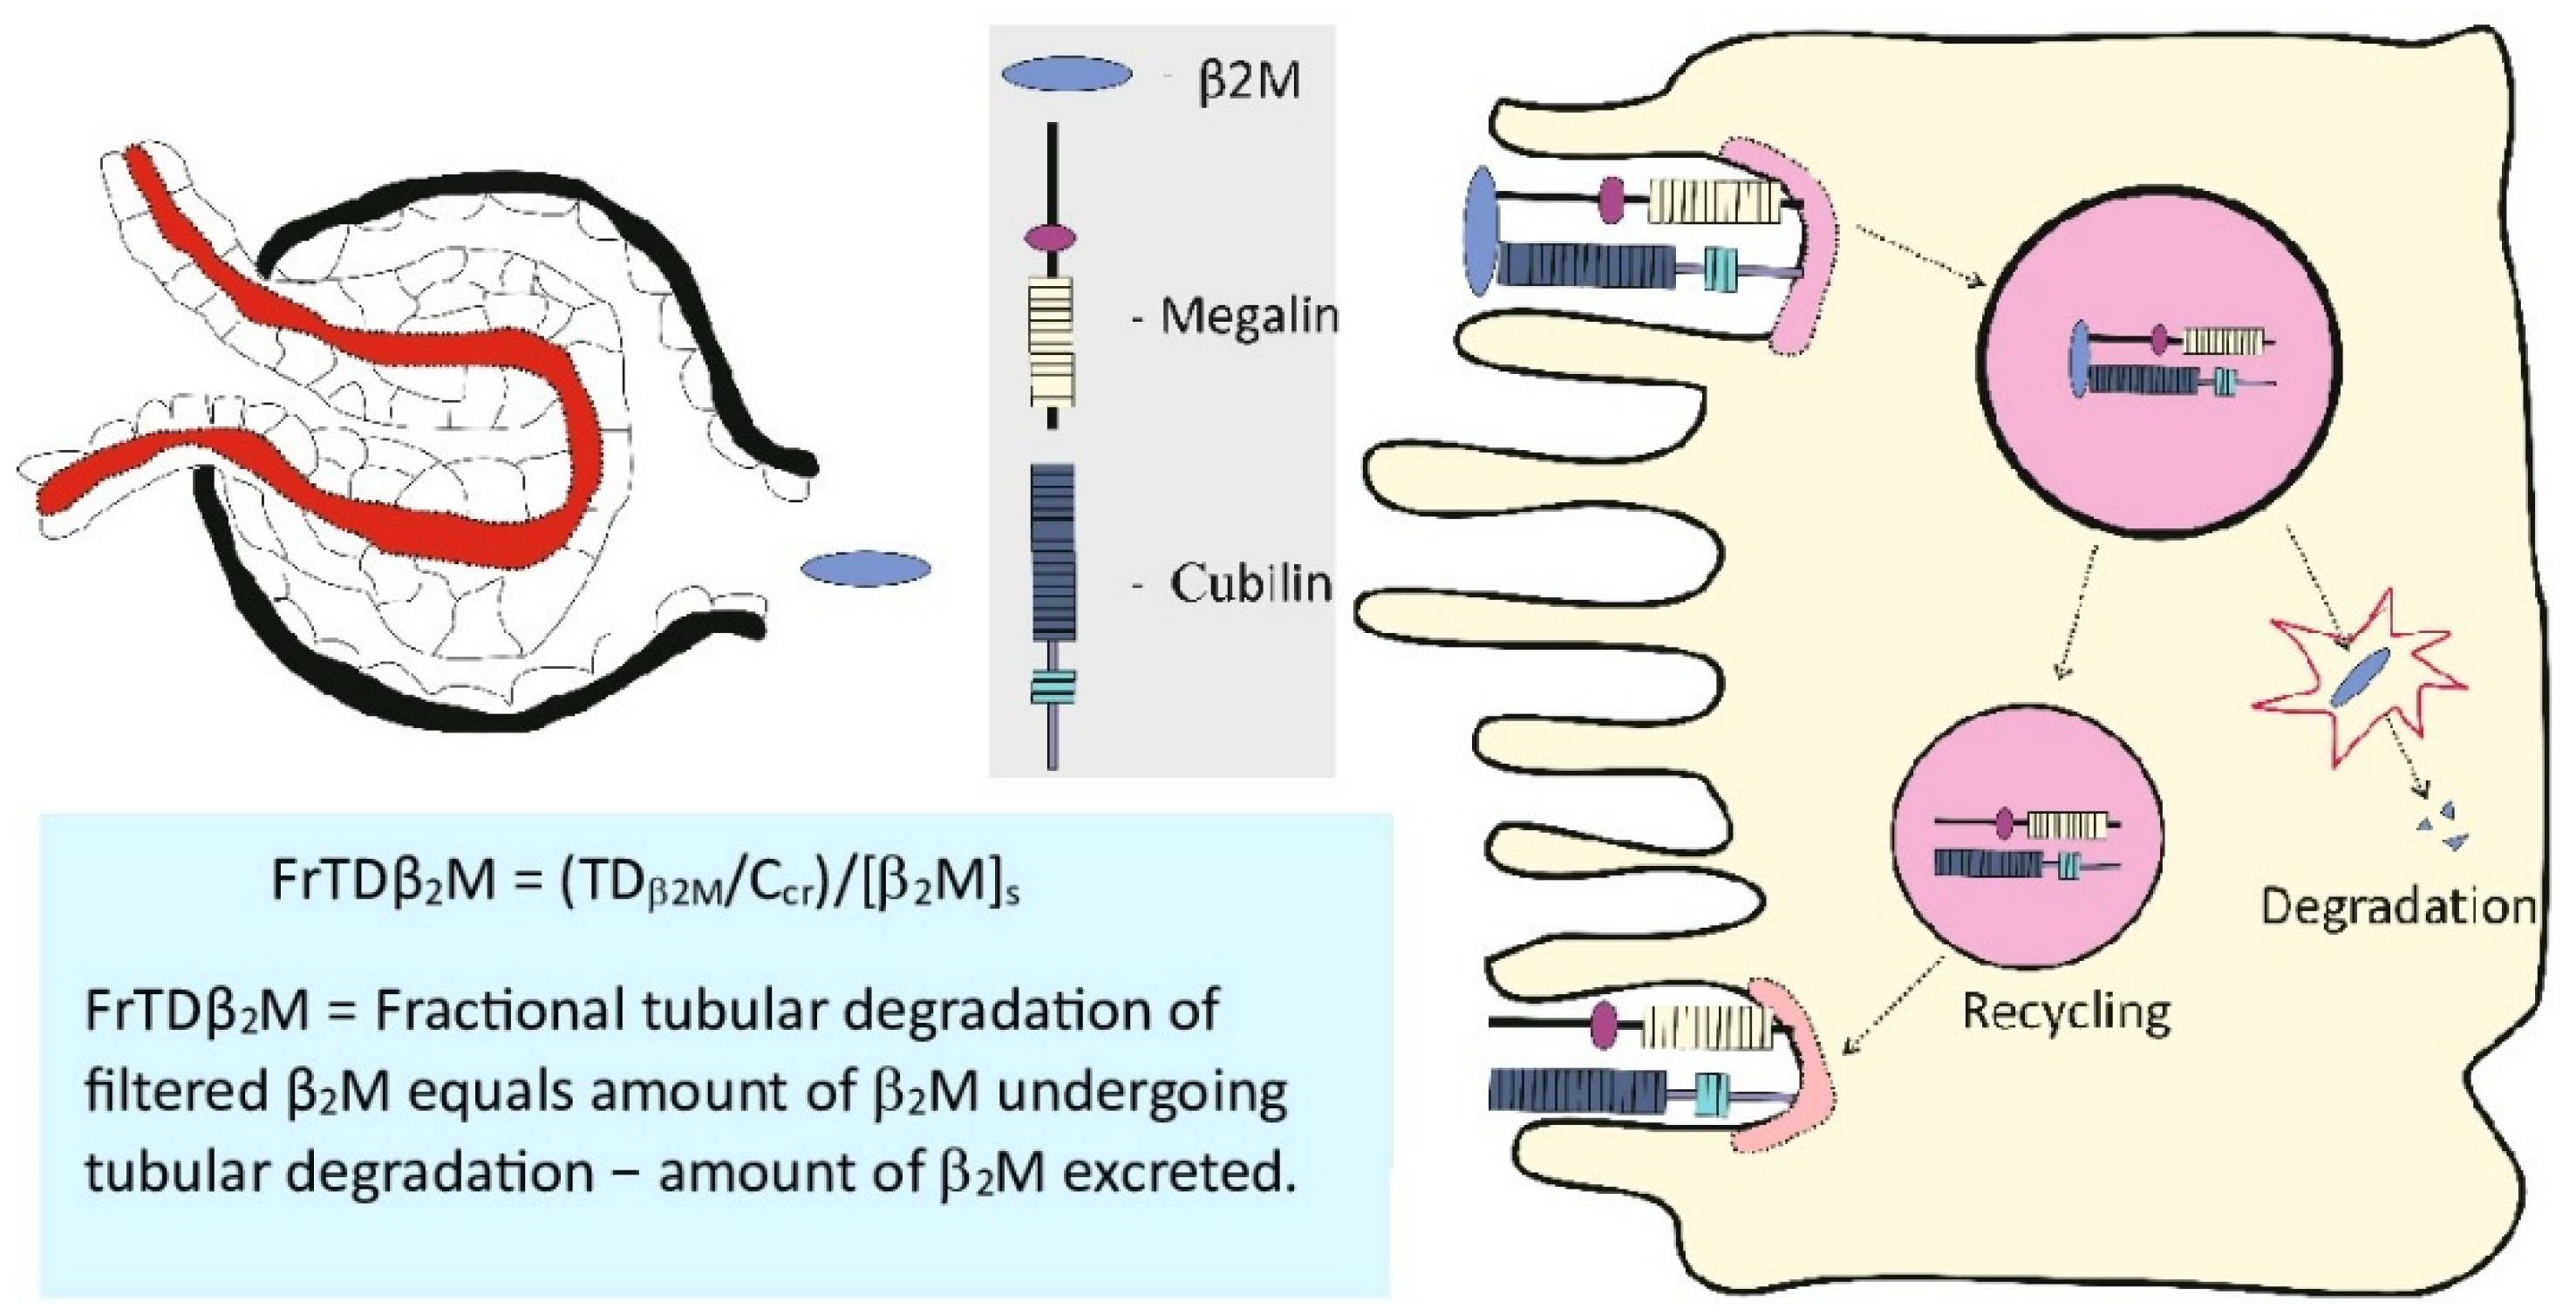
Figure 3.
Outputs from the PROAST software applied to ECd/Ecr and protein excretion datasets. The mathematical dose-response models applied to datasets are exponential (A), Hill (B), natural logarithmic (C), and inverse exponential (D). Bootstrap model averaging with 200 repeats (E), model weighing (F), BMDL and BMDU values [G]. This figure is adapted from Satarug et al. 2024 [82].

Figure 4.
Outputs from the PROAST software applied to ECd/Ecr-proteinuria and ECd/Ecr-low eGFR datasets. The mathematical dose-response models applied to prevalence datasets are two-stage, logarithmic logistic, Weibull, logarithmic probability, gamma, exponential, and Hill. This figure is adapted from Satarug et al. 2024 [82].
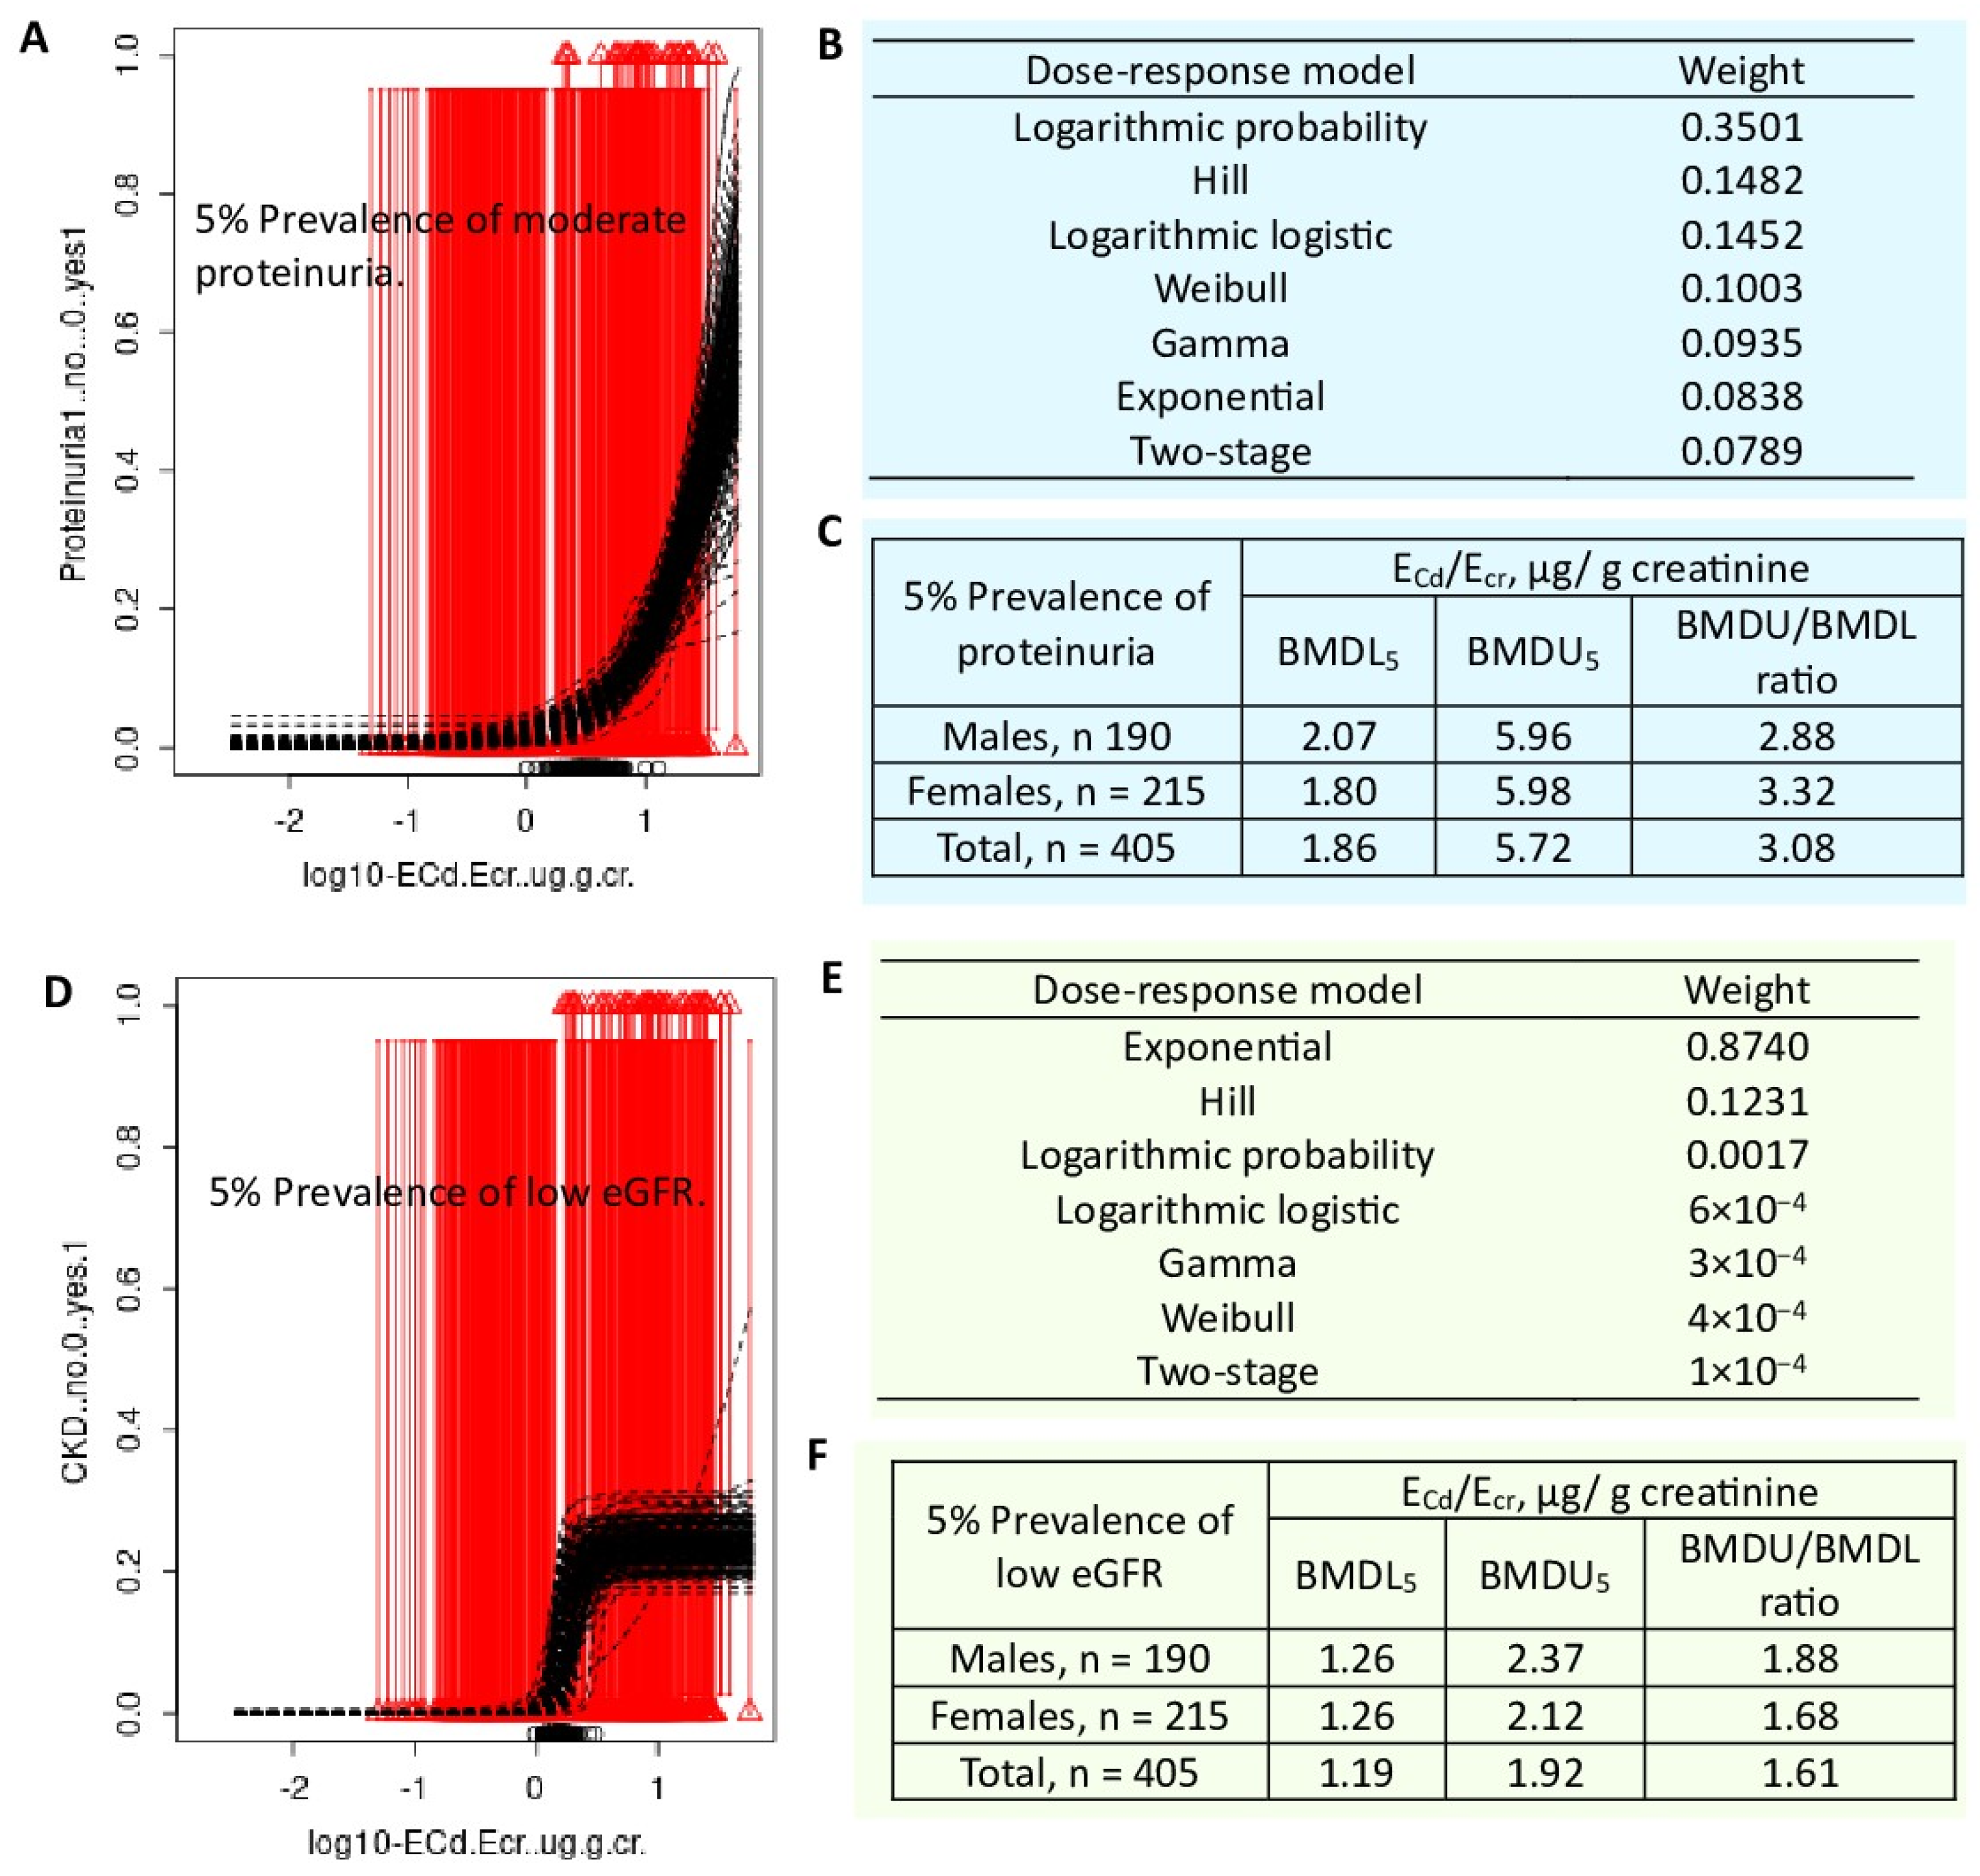
Table 3.
Effects of the normalization of Cd excretion rate on risk of having low eGFR.
| a Low eGFR | ||||
|---|---|---|---|---|
| Model A | POR | 95% CI | p | |
| Lower | Upper | |||
| Log2[(ECd/Ecr) × 103], µg/g creatinine | 1.470 | 1.276 | 1.692 | <0.001 |
| Hypertension | 1.632 | 0.885 | 3.008 | 0.117 |
| Gender | 1.029 | 0.528 | 2.002 | 0.934 |
| Smoking | 1.232 | 0.637 | 2.383 | 0.536 |
| BMI, kg/m2 | ||||
| 12-18 | Referent | |||
| 19-23 | 1.058 | 0.459 | 2.439 | 0.894 |
| ≥ 24 | 2.810 | 1.118 | 7.064 | 0.028 |
| Age, years | ||||
| 16-45 | Referent | |||
| 46-55 | 14.23 | 1.867 | 108.4 | 0.010 |
| 56-65 | 28.21 | 3.538 | 224.9 | 0.002 |
| 66-87 | 141.2 | 17.87 | 1116 | <0.001 |
| Model B | POR | Lower | Upper | p |
| Log2[(ECd/Ccr) × 105], µg/L filtrate | 1.962 | 1.589 | 2.422 | <0.001 |
| Hypertension | 1.735 | 0.916 | 3.287 | 0.091 |
| Gender | 0.840 | 0.410 | 1.719 | 0.633 |
| Smoking | 0.944 | 0.474 | 1.879 | 0.869 |
| BMI, kg/m2 | ||||
| 12-18 | Referent | |||
| 19-23 | 1.109 | 0.452 | 2.717 | 0.822 |
| ≥ 24 | 3.150 | 1.181 | 8.400 | 0.022 |
| Age, years | ||||
| 16-45 | Referent | |||
| 46-55 | 9.951 | 1.305 | 75.88 | 0.027 |
| 56-65 | 34.57 | 4.312 | 277.2 | 0.001 |
| 66-87 | 198.6 | 24.59 | 1605 | <0.001 |
a Low eGFR was defined as eGFR ≤ 60 mL/min/1.73 m2. ECd was normalized to Ecr and Ccr in models A and B, respectively. Data were from 917 subjects (562 females, 355 males),16−87 years of age [76].
Table 4.
Effects of normalization of Cd excretion rate on risk of having low eGFR and proteinuria.
| Low eGFR a | Proteinuria b | |||
|---|---|---|---|---|
| Model A | POR (95% CI) | p | POR (95% CI) | p |
| Age, years | 1.121 (1.080, 1.165) | <0.001 | 1.068 (1.028, 1.110) | 0.001 |
| Log10[(ECd/Ecr) ×103], µg/g creatinine | 2.638 (0.969, 7.182) | 0.058 | 3.685 (1.027, 13.22) | 0.045 |
| Gender | 1.082 (0.490, 2.390) | 0.845 | 1.096 (0.475, 2.528) | 0.829 |
| Smoking | 1.425 (0.596, 3.406) | 0.426 | 1.678 (0.627, 4.486) | 0.303 |
| Hypertension | 2.211 (1.017, 4.805) | 0.045 | 1.113 (0.432, 2.867) | 0.824 |
| Model B | POR (95% CI) | p | POR (95% CI) | p |
| Age, years | 1.118 (1.073, 1.165) | <0.001 | 1.061 (1.022, 1.102) | 0.002 |
| Log10[(ECd/Ccr) ×105], mg/ L filtrate | 12.24 (3.729, 40.20) | <0.001 | 7.143 (2.133, 23.92) | 0.001 |
| Gender | 0.802 (0.346, 1.861) | 0.608 | 1.117 (0.482, 2.587) | 0.796 |
| Smoking | 1.335 (0.546, 3.262) | 0.527 | 1.947 (0.725, 5.234) | 0.186 |
| Hypertension | 2.734 (1.204, 6.207) | 0.016 | 1.018 (0.410, 2.530) | 0.969 |
a Low eGFR was defined as eGFR ≤ 60 mL/min/1.73 m2. b Proteinuria was defined as Epro/Ecr ≥ 100 mg/g creatinine and (Epro/Ccr) ×100 ≥ 100 mg/L filtrate in models A and B, respectively. Data were from 405 subjects (208 females, 197 males) [82].
Table 5.
BMD modeling of Cd exposure with different nephrotoxicity endpoints.
| Endpoints/Population | Results | Reference |
|---|---|---|
| NAG and eGFR n = 790 women, 53–64 years, Sweden |
BMDL (BMD) values of ECd/Ecr were 0.5 (0.6) and 0.7 (1.1) μg/g creatinine the NAG and eGFR endpoints, respectively. |
Suwazono et al. 2006[86] |
| RBP, β2M and NAG n = 934 (469 men, 465 women), 10–71+ years, Jiangshan City, Zhejiang, China |
BMDL values of ECd/Ecr at 5% (10%) BMR in men were 0.89 (1.59), 0.62 (1.30), 0.49 (1.04) μg/g creatinine for the RBP, β2M, and NAG endpoints, respectively. Corresponding BMDL values of ECd/Ecr in women were 0.76 (1.53), 0.64 (1.34), 0.65 (1.37) μg/g creatinine for the RBP, β2M, and NAG endpoints. |
Wang et al. 2016 [87] |
| β2M, TRβ2M and eGFR (or Ccr) n = 112 (Cd-polluted area, n = 74, non-polluted area, n =38) Japan |
BMDL values of ECd/Ecr in men were 1.8, 1.8, and 3.6 μg/g creatinine for the β2M endpoint and decreases in TRβ2M by 5% and 10%, respectively. Corresponding BMDL values of ECd/Ecr in women were 2.5, 2.6, and 3.9 μg/g creatinine. BMDL values of ECd/Ecr for the eGFR (Ccr) endpoint in men and women were 2.9 and 3.5 μg/g creatinine, respectively |
Hayashi et al. 2024 [88] |
| NAG, β2M, and eGFR n = 734 (Bangkok, n = 200, Mae Sot, n = 534), 16–87 years, Thailand |
BMDL/BMDU values of ECd/Ecr in men were 0.060/0.504 µg/g creatinine for the NAG, while BMDL10/BMDU10 values were 0.469/0.973 and 3.26/7.46 µg/g creatinine for the β2-microglobulinuria and low eGFR a, respectively. Corresponding BMDL/BMDU values of ECd/Ecr in women were 0.069/0.537 µg/g creatinine for NAG, while BMDL10/BMDU10 were 0.733/1.29 and 4.98/9.68 µg/g creatinine for the β2-microglobulinuria and low eGFR. |
Satarug et al. 2022 [89] |
| Protein excretion and low eGFR n = 405 (Bangkok, n =100, Mae Sot, n = 215), 19–87 years, Thailand |
BMDL/BMDU values of ECd/Ecr for protein loss in men were 0.021/0.757 µg/g creatinine, while BMDL5/BMDU5 values for proteinuria were 2.07/5.96 µg/g creatinine. Corresponding BMDL/BMDU values of ECd/Ecr in women were 0.023/0.913 µg/g creatinine, while BMDL5/BMDU5 values for proteinuria were 1.80/5.98 µg/g creatinine. In a whole group, BMDL/BMDU values of ECd/Ecr for protein loss were 0.054/0.872 µg/g creatinine, while BMDL5/BMDU5 values were 1.86/5.72 and 1.19/1.92 µg/g creatinine for proteinuria and low eGFR, respectively. |
Satarug et al. 2024 [82] |
NAG, N-acetyl-β-D-glucosaminidase; eGFR, estimated glomerular filtration rate; RBP, retinal binding protein; β2M, β2-microglobulin; TRβ2M, tubular reabsorption of β2M. a Low eGFR was defined as eGFR ≤ 60 mL/min/1.73 m2, a diagnostic criterion for chronic kidney disease.
Table 6.
BMDL5 and BMDL10 of ECd/Ecr versus ECd/Ccr from albuminuria and CKD prevalences.
| Prevalence of Adverse Outcome |
ECd/Ecr, µg/ g creatinine | (ECd/Ccr) ×100, µg/L filtrate | ||||
|---|---|---|---|---|---|---|
| 5% Albuminuria a | BMDL5 | BMDU5 | BMDU5/BMDL5 | BMDL5 | BMDU5 | BMDU5/BMDL5 |
| Males | 3.06 ×10⁻³ | 36.7 | 1.2 ×10² | 0.163 | 13 | 80 |
| Females | 1.22 ×10⁻² | 3.05 ×10⁵ | 2.5×10⁷ | 0.718 | 154 | 60 |
| 10% Albuminuria | BMDL10 | BMDU10 | BMDU10/BMDL10 | BMDL10 | BMDU10 | BMDU10/BMDL10 |
| Males | 0.55 | 337 | 612 | 1.65 | 20 | 12 |
| Females | 2.52 | 1.74 ×10⁶ | 6.7 ×10⁵ | 3.55 | 2.12 | 60 |
| 5% CKD b | BMDL5 | BMDU5 | BMDU5/BMDL5 | BMDL5 | BMDU5 | BMDU5/BMDL5 |
| Males | 1.47 | 10.6 | 7.7 | 3.22 | 9.64 | 2.90 |
| Females | 1.93 | 15.6 | 8.08 | 3.33 | 9.20 | 2.26 |
| 10% CKD | BMDL10 | BMDU10 | BMDU10/BMDL10 | BMDL10 | BMDU10 | BMDU10/BMDL10 |
| Males | 3.92 | 15.7 | 4.00 | 5.61 | 13.4 | 2.39 |
| Females | 5.31 | 23.6 | 4.44 | 5.88 | 12.9 | 2.19 |
a Albuminuria was defined as urinary albumin-to-creatinine ratios ≥ 20 mg/g in men and ≥30 mg/g in women for Ecr-normalized data, while it was defined as (EAlb/Ccr) × 100 ≥ 20 mg/L filtrate in men and ≥ 30 mg/L filtrate in women for Ccr-normalized data. b CKD was defined as eGFR ≤ 60 mL/min/1.73 m2. Data were from 603 subjects (203 males, 400 females) [91].
Disclaimer/Publisher’s Note: The statements, opinions and data contained in all publications are solely those of the individual author(s) and contributor(s) and not of MDPI and/or the editor(s). MDPI and/or the editor(s) disclaim responsibility for any injury to people or property resulting from any ideas, methods, instructions or products referred to in the content. |
© 2025 by the authors. Licensee MDPI, Basel, Switzerland. This article is an open access article distributed under the terms and conditions of the Creative Commons Attribution (CC BY) license (http://creativecommons.org/licenses/by/4.0/).
Copyright: This open access article is published under a Creative Commons CC BY 4.0 license, which permit the free download, distribution, and reuse, provided that the author and preprint are cited in any reuse.


