
Submitted:
11 April 2025
Posted:
11 April 2025
You are already at the latest version
Abstract
Response to immune checkpoint inhibitors (ICIs) is associated with several biological pathways, including tumor immunogenicity and antitumor immunity. Identifying host factors involved in these pathways may guide personalized ICI treatment. We describe the application of chromatin conformation assays to blood from patients with advanced urothelial carcinoma from the phase 3 JAVELIN Bladder 100 trial (NCT02603432). This trial demonstrated a significant survival benefit with avelumab maintenance plus best supportive care (BSC) vs BSC alone following non-progression with platinum-based chemotherapy as first-line therapy. Blood-based chromatin conformation markers (CCMs) were screened for associations with high/low immune effector gene expression in tumors and for interactions with outcomes and tumor mutation burden. Candidate CCMs included genes involved in several immune response pathways, such as POU2F2, which encodes a transcription factor that regulates B-cell maturation. Our findings suggest that polygenic host factors may affect response to ICIs and support further investigation of chromatin conformation assays.
Keywords:
Urothelial carcinoma
; immune checkpoint inhibitors
; avelumab
; chromatin conformation
; epigenetics
; spatial transcriptomics
Introduction
Exploratory analyses of biomarkers from clinical trials of immune checkpoint inhibitors (ICIs) have highlighted diverse biological pathways associated with response to ICI treatment; however, identifying biomarker assays that provide optimal predictive response value remains a major challenge [1,2]. In the phase 3 JAVELIN Bladder 100 trial, avelumab first-line (1L) maintenance plus best supportive care (BSC) significantly prolonged overall survival (OS) and progression-free survival (PFS) vs BSC alone in patients with advanced urothelial carcinoma (UC) without disease progression after 1L platinum-based chemotherapy [3]. Based on these results, avelumab 1L maintenance was established as a standard of care in patients with advanced UC [4,5].
Exploratory tumor biomarker analyses from JAVELIN Bladder 100 revealed complex relationships with treatment outcomes, with both innate and adaptive immune biomarkers showing enrichment for response [2]. Assays for individual biomarkers such as programmed death ligand 1 (PD-L1) and tumor mutation burden (TMB) did not optimally identify patients who were significantly more likely to benefit from avelumab 1L maintenance [2]. Exploratory (hypothesis-generating) analysis suggested that patients with low PD-L1 expression may not have significant OS benefit with avelumab 1L maintenance plus BSC (avelumab plus BSC) vs BSC alone if TMB scores were low (hazard ratio [HR],1.27 [95% CI, 0.799-2.006]), but had significant benefit if TMB scores were high (HR, 0.44 [95% CI, 0.251-0.768]). In contrast, patients with high PD-L1 expression had significant OS benefit even with low TMB (HR, 0.60 [95% CI, 0.382-0.955]), suggesting that elevated anti-tumor immunity (high PD-L1 expression) could, in part, compensate for low tumor immunogenicity (low TMB) [2]. However, no molecular biomarkers are currently used to select patients for avelumab 1L maintenance in clinical practice.
As highlighted in the recently updated cancer immunity cycle [6], non-transformed cell types in the tumor microenvironment, including stromal and myeloid cells, have emerged as important modulators of anti-tumor immunity released by ICIs. These findings, made possible through the application of novel technologies, such as spatial transcriptomics, support hypotheses that response to ICI may be contingent on host factors such as germline single nucleotide polymorphisms [7], microbiomes [8], and epigenetic modification of the 3-dimensional (3D) structure of chromatin [9,10,11,12,13]. EpiSwitch is an established 3D genomic biomarker platform, based on the original chromosome conformation capture approach, that has demonstrated promising utility in various disease settings [14,15,16,17,18,19], including response to avelumab observed in a retrospective study [20].
We employed the EpiSwitch platform to evaluate the hypothesis that epigenetic host factors measurable in peripheral blood may modulate immune activity in the tumor microenvironment of patients enrolled in the JAVELIN Bladder 100 trial. A 3-stage process was used: (1) identification of chromatin conformation markers (CCMs) associated with tumor immune gene expression signature; (2) statistical modeling to rank CCMs’ association with TMB and OS following avelumab plus BSC vs BSC alone; and (3) characterization of the expression and function of genes covered by the highest-ranked CCMs.
Materials and Methods
Study Cohort
JAVELIN Bladder 100 (NCT02603432) was a randomized phase 3 trial evaluating avelumab 1L maintenance (administered every 2 weeks) plus BSC vs BSC alone in patients with advanced UC whose cancer had not progressed after 4-6 cycles of 1L platinum-based chemotherapy [3]. Patients received treatment until disease progression, unacceptable toxicity, or withdrawal of consent. OS (primary endpoint) and PFS (secondary endpoint) were significantly prolonged with avelumab plus BSC vs BSC alone. Peripheral blood was collected from patients 4-10 weeks after the date of administration of the last dose of chemotherapy but before treatment with avelumab plus BSC or BSC alone. Blood samples from 496 patients satisfied quality and consent criteria and were subjected to further evaluation, as shown in Supplementary Figure S1a. Characteristics and outcomes in the biomarker analysis set compared with the full analysis set are shown in Supplementary Table S1 and Supplementary Figure S2, respectively. The biomarker analysis set did not differ significantly from the full analysis set.
Identification of Candidate CCMs Using the EpiSwitch Platform
Preparation of 3D genomic templates. EpiSwitch 3D libraries, with chromosome conformation analytes converted to sequence-based tags, were prepared from frozen whole-blood samples using EpiSwitch protocols following the manufacturer's instructions for EpiSwitch Explorer Array kits (Oxford BioDynamics Plc). Samples were processed on the Freedom EVO 200 robotic platform (Tecan Group Ltd). Briefly, the whole-blood sample was diluted and fixed with a formaldehyde-containing EpiSwitch buffer. Density cushion centrifugation was used to purify intact nuclei. Following a short detergent-based step to permeabilize the nuclei, restriction enzyme digestion and proximity ligation were used to generate the 3D libraries. Samples were centrifuged to pellet the intact nuclei before purification with an adapted protocol from the QIAamp DNA FFPE Tissue kit (Qiagen) eluting in 1× TE buffer (pH 7.5). 3D libraries were quantified using the Quant-iT Picogreen dsDNA Assay kit (Invitrogen) and normalized to 5 ng/mL prior to interrogation by PCR.
Array design. Custom microarrays were designed using the EpiSwitch pattern recognition algorithm, which operates on Bayesian modeling and provides a probabilistic score for a region’s involvement in long-range chromatin interactions. The algorithm was used to annotate the GRCh38 human genome assembly across approximately 1.1 million sites with the potential to form long-range chromosome conformations. The most probable interactions were identified and filtered on probabilistic score and proximity to protein, long non-coding RNA, or microRNA coding sequences. Predicted interactions were limited to EpiSwitch sites that were ≥10 kb and <300 kb apart. Repeat masking and sequence analysis was used to ensure unique CCM sequences for each interaction. The EpiSwitch Explorer Array (Agilent Technologies, Product Code X-HS-AC-02) containing 60-mer oligonucleotide probes was designed to interrogate potential 3D genomic interactions. In total, 964,631 experimental probes and 2,500 control probes were added to a 1 × 1 comparative genomic hybridization microarray slide design. The experimental probes were placed on the design in singlicate, with the controls in groups of 250. The control probes consisted of 6 different EpiSwitch interactions that are generated during the extraction processes and used for monitoring library quality. An additional 4 external inline control probe designs were added to detect a non-human (Arabidopsis thaliana) spike in DNA added during the sample labeling protocol to provide a standard curve and control for labeling. The external spike DNA consists of 400-bp single-stranded DNA fragments from genomic regions of Arabidopsis thaliana. Array-based comparisons were performed as described previously, with the modification of only 1 sample being hybridized to each array slide in the Cy3 channel.
Translation of array-based 3D genomic markers to PCR readouts. Stepwise diagnostic biomarker discovery process using EpiSwitch technology and data analysis EpiSwitch technology platform (Oxford Biodynamics, Oxford, UK) pairs high-resolution chromosome conformation capture results with regression analysis and a machine learning algorithm to develop disease classifications [21,22,23]. To select epigenetic biomarkers, patient samples for each class were screened for statistically significant differences in conditional and stable profiles of genome architecture. All samples used for the nested PCR biomarker discovery were processed per the manufacturer’s instructions using the proprietary EpiSwitch reagents and standard protocols [24]. A PCR product was detected only if the corresponding CCM was detected. To account for variable marker stability in assay conditions, 3 template concentrations (1×, 2×, and 4×) were evaluated.
Genomic mapping. Mapping was performed using the Bedtools closest function [21] for the 3 closest protein-coding loci: upstream, downstream, and within the long-range chromosome interaction (Gencode v33). All markers were visualized using the EpiSwitch analytical portal.
Identification of top 25 CCMs associated with tumor JAV-Immuno scores. Analyses for marker prioritization were performed using libraries developed for the R Statistical Language (R version 4.1.2). JAV-Immuno includes the following genes: CCL5, CD2, CD244, CD247, CD3E, CD3G, CD6, CD8B, CD96, CST7, EOMES, GFI1, GPR18, GRAP2, IL7R, ITK, KCNA3, KLRD1, NLRC3, PRF1, PSTPIP1, SH2D1A, SIT1, THEMIS, TRAT1, and XCL2. Candidate markers were identified using EpiSwitch whole-genome arrays comparing 20 patients whose tumors were JAV-Immunohi (greater than the median) and 20 patients whose tumors were JAV-Immunolo (less than the median). The data were normalized, quality controlled, and statistically analyzed using the EpiSwitch array pipeline powered by the LIMMA package. The top 150 EpiSwitch markers were selected based on their corrected p value (false discovery rate) and directionality/interaction frequency for JAV-Immuno. Feature engineering with the selected EpiSwitch CCMs was performed using the same samples used in the array discovery, with an additional 20 samples each of the JAV-Immunohi and JAV-Immunolo classes. A reduced set of 25 CCMs was generated using the univariate EXACT test (contingency testing), binary weighting and multivariant analyses, permutated glmnet, VSURF, Boruta, and varSelRF. An XGBoost algorithm model was used for further refinement of the CCM list [22]. Shapley additive explanations values, used to characterize the contribution of each feature in a model to the final prediction and final model selection, were used to confirm marker prioritization [23].
Prioritization of Candidate CCMs Based on Estimated Interactions with TMB and OS
The starting feature set comprised 25 CCMs, each measured at 3 dilution levels for a total of 75 features, and was assessed in 496 patients for its association with OS.
Model development. In step 1, features were filtered out prior to modeling if <40 subjects were included in either the present or absent categories and <15 subjects in any of the 4 subgroups (avelumab present, avelumab absent, BSC present, BSC absent). This filter removed 15 features.
In step 2, due to high correlation among CCMs measured at multiple dilution levels, further screening was performed to either select 1 dilution level per CCM or remove the CCM from subsequent multivariate modeling. The screening assessed each feature in association with OS using 3 nested Cox proportional hazards models. The first model assessed the feature as a main effect; the second included the main effect and 2-way interaction with treatment; and the third included the main effect, 2-way interactions with both treatment and TMB, and the 3-way interaction among feature, treatment, and TMB. For each CCM, this resulted in 3 models for each dilution level. The p values derived from the 3-way interaction, 2-way interaction, and main effect terms were sequentially evaluated for each CCM. The dilution level with the lowest 3-way interaction p value of <0.1 was selected. If none were <0.1, the process was repeated for the 2-way interaction and main effect p values. If none of these p values were <0.1, then the CCM was eliminated from downstream modeling.
Finally, in step 3, the remaining 16 features were fed into an elastic net Cox proportional hazards model–building procedure to select a final feature set. The elastic net [25], a regularized regression method using a weighted sum of the L1 and L2 penalty terms for the lasso [26] and ridge [27] regression, was used for statistical model building (R package: glmnet). The hyperparameters α and λ, which control the weight applied to each of the penalty terms and the amount of shrinkage on the coefficients, were tuned using repeated 5-fold cross-validation (CV). For each round of 5-fold CV, a pair of α and λ associated with the optimal model performance (C-index) was determined (Supplementary Figure S3). The same procedure was iterated 1,000 times using different random data partitions to account for potential CV error. The most frequently selected hyperparameter pairs were chosen as optimal and applied to the full dataset to obtain the final models. All but 1 of the 16 input features were retained by this process, generating the list of 15 CCMs (Supplementary Table S2).
Assessment of Potential CCM Gene Expression
Public data on genes labeled using Human Genome Organization nomenclature have been compiled into a knowledge graph [28] by Data4Cure (www.data4cure.com). Knowledge graph associations between genes and specific biomedical entity domains (eg, cell types or pathways) summarize evidence from thousands of publicly available datasets and millions of publications linking biomedical entities.
Visium Data Processing
SpaceRanger 2.0.1 was used to align raw reads to the GrCh38 genome and feature count generation using the Human Transcriptome probe set v2.0. Visium data resolution was enhanced 6-fold by inferring pseudospots using the BayesSpace method [29]. Briefly, using the BayesSpace R package Visium Space Ranger, the outs folder was processed with seed 102, spatialPreprocess(sceobj, platform="Visium", n.PCs=15, n.HVGs=2000, log.normalize=T), followed by spatialCluster(sceobj, q=8, d=15, platform="Visium", init.method="mclust", model="t", gamma=1, nrep=10000, burn.in=100, save.chain=F), and then spatialEnhance(sceobj, q=8, platform="Visium", d=15, model="t", gamma=1, jitter_prior=0.3, jitter_scale=3.5, nrep=100000, burn.in=100, save.chain=F). Enhanced features and spatial coordinates for the full expression matrix were computed using enhanceFeatures and output for subsequent visualization using the Data4Cure platform [30] (www.data4cure.com).
For the expression signatures of each pseudospot, the Data4Cure platform was used to compute the gene signature score as the mean normalized average expression value across the signature genes. The spot-level signature scores were plotted heat map style using the pseudospot coordinates and overlayed on the approximate corresponding region of the H&E image as a background image. An unmarked, blinded H&E image was annotated by a pathologist for lymphoid aggregates (numbered and circled in green).
Results
Study Cohort and Methodology
The JAVELIN Bladder 100 study included 496 patients with tumor transcriptome data whose blood could be analyzed by EpiSwitch (Supplementary Figure S1a). A 26-gene signature (JAV-Immuno), identified in JAVELIN Renal 101 and validated in JAVELIN Bladder 100 [2,31], displayed modulation of the interaction between TMB, OS, and treatment (avelumab plus BSC vs BSC alone) comparable to that of PD-L1 (Figure 1a). In the avelumab plus BSC arm, a significant OS benefit was associated with JAV-Immuno levels (high vs low) in patients with low TMB (HR, 0.52 [95% CI, 0.351-0.773]; p=0.0012) but not in patients with high TMB (HR, 1.22 [95% CI, 0.756-1.957]; p=0.42). No association was found between either biomarker and OS in the BSC alone arm. JAV-Immuno was therefore chosen as the measure of tumor immune response to probe for CCMs.
Identification of Candidate CCMs
The CCM discovery process was conducted as previously described (Figure 1b; see Methods for details) [32]. Patient samples were classified as JAV-Immunohi if the corresponding tumor expression was greater than the sample median and JAV-Immunolo if it was less or equal than the median. Nuclei templates from 20 JAV-Immunohi and 20 JAV-Immunolo specimens were hybridized to an array of >900K oligonucleotides spanning the human genome, thereby identifying 150 loci that could be either positively or negatively associated with the JAV-Immuno classification. Nested polymerase chain reaction (PCR) assays designed to give a positive reading only if the PCR primer targets were juxtaposed by chromatin conformation were applied to 40 JAV-Immunohi and 40 JAV-Immunolo samples (Supplementary Figure S1a). These nested PCR data were used as a training set to build JAV-Immunohi/lo classifier models. PCR data from the remaining 416 samples were used to refine and test the classifier models. The models with optimal test accuracy (0.68) contained 25 CCMs (Figure 1c). Univariate analysis of CCM association with JAV-Immuno scores indicated that individual CCMs could be either positively or negatively associated with JAV-Immuno, depending on the detection titer dilution, suggesting complex relationships between the CCMs and expression of individual genes. The candidate CCMs were further evaluated for association with TMB and OS using Cox proportional hazards and elastic net models (see Methods for details). The 15 CCMs selected in the final model were subjected to further biological annotation (Supplementary Table S2).
Biological Annotation of Genes Covered by the CCMs
The 15 CCMs in the final model were distributed across the human genome (Supplementary Table S2). These CCMs were detected in <20% to >70% of the patients in the analysis population (Supplementary Figure S1b-i), and no linkage disequilibrium was observed (Supplementary Figure S1b-ii). Twelve of the 15 CCMs covered distinct regions, and 3 overlapped in a ≈290kb region on chromosome 22:20707691-20999032 (Supplementary Table S2 and Supplementary Figure S1c). Forty-four major genes in the Human Protein Atlas [33] were mapped to these 15 CCMs, of which 29 genes (66%) were covered by >1 CCM in the final model. In contrast, only 95 of the 323 genes (29%) mapping to the remaining CCMs in the original set were covered by >1 CCM. Thus, the final model enriched for loci that were covered by multiple CCMs, consistent with possible functional relevance. Only 1 of the genes in the original 26-gene JAV-Immuno signature (CD6) [31] was present in the 367 genes mapped to the original set, and it was not present in the 15 CCMs from the final model. Individual genes from these 15 CCMs (Table 1) showed both positive and negative associations with JAV-Immuno (Figure 1d), suggesting that host factors may either enhance or diminish anti-tumor immunity.
We evaluated potential expression of genes mapping to the 15 CCMs using the Tabula Sapiens single-cell transcriptomic atlas [34], which contains single-cell sequencing data from almost 500,000 cells, representing over 400 cell types and 4 major cell lineages (immune, endothelial, stromal, and epithelial) assessed in approximately 22 distinct anatomical locations collected from multiple donors. Supplementary Figure S4 shows expression patterns by cell type for 6 genes mapping to chromosome 22:20707691-20999032, which was covered by 3 CCMs in the final model (Supplementary Table S2). Substantial variability in gene expression across cell types was observed, suggesting that cell-specific gene-regulatory machinery operates in conjunction with regulation of chromatin conformation.
We performed a comprehensive analysis of associations between genes and cell types reported in the literature and public databases using the Data4Cure knowledge graph and platform [30]. Genes in the JAV-Immuno signature were predominantly associated with lymphocytes, including T cells, B cells, and natural killer (NK) cells (Figure 2a), as previously described [31]. Genes covered by the selected CCMs were associated with endothelial and fibroblast cell types, in addition to lymphocytes (Figure 2b). Myeloid lineages, including monocytes, neutrophils, and macrophages, were associated with genes in both signatures (Figure 2a,b). JAV-Immuno genes were predominantly associated with Gene Ontology Biological Processes related to lymphocyte activation (Figure 2c) [35]; in contrast, genes mapping to the selected CCM set were associated with a wide range of biological processes (Figure 2d). These findings suggest that the chromatin conformations represented by the selected CCMs may exert both distal and proximal effects on lymphocyte activation.
Spatial Profiling
Spatial transcriptomic data were used to explore the topographic expression of genes represented by JAV-Immuno and the selected CCMs. A procured bladder cancer specimen was selected for initial evaluation due to its robust representation of immune and non-immune cell types [2]. Figure 3a-i shows a hematoxylin and eosin (H&E)–stained image of the specimen identifying the position of lymphoid aggregates. Spatial indexing of transcriptomic data from this specimen identified 8 clusters by BayesSpace (Supplementary Figure S5a-i). Similarities in the histology and distribution of predefined gene signatures (Supplementary Figure S5a-c) suggested that the 8 clusters represented 4 functional regions, labeled as epithelial, stromal, transitional, and lymphoid aggregates (Figure 3a-ii). Figure 3b-i depicts the spatial distribution of genes characteristic of tertiary lymphoid structures (TLS), originally identified in patients with melanoma treated with ICIs [36]. The highest overall expression of the component genes was observed in the functional region labeled as lymphoid aggregates (Figure 3b-ii and -iii), suggesting that this region could be a locus of immune activation and maturation in the tumor microenvironment. Enrichment of gene expression signatures characteristic of T follicular helper cells, mature B-cells, cytotoxic T-cells, and dendritic cells recruitment further support the lymphoid aggregate regions as a site for priming and maturation of anti-tumor lymphocytes (Supplementary Figure S5c-i-v).
The spatial distribution of genes comprising the JAV-Immuno signature was strongly correlated with those in the TLS signature, suggesting that JAV-Immuno is distinctly associated with TLS function (Figure 3c-i-iii, Supplementary Figure S5d). To assess the potential generalizability of these findings, expression of JAV-Immuno genes was evaluated in a collection of specimens representing TLS from bladder, renal, and breast cancers. All 25 genes in the JAV-Immuno signature were positively associated with the presence of TLS in these regions (Figure 3c-iv). Overall, JAV-Immuno appears to be more closely associated with TLS than other signatures associated with ICI response [2,37,38,39,40].
The expression of 33 of the 35 major genes mapped to the 15 CCMs was assessed in the bladder specimen and appeared to be distributed broadly throughout the specimen, with slightly lower overall expression in the stromal region (Figure 3d-i). Hierarchical clustering of the genes by distribution between the 4 annotated regions identified subsets of genes that were prominent in the lymphoid aggregate and epithelial regions, as well as the stromal region (Figure 3d-ii and 3d-iii). Ten of the 15 selected CCMs in Supplementary Table S2 contained ≥1 gene that was more highly expressed in the lymphoid aggregate region relative to the epithelial region (Figure 3d-ii).
As for JAV-Immuno (Figure 3b), potential generalizability of the CCM findings was assessed by evaluating expression of the genes in the TLS specimen collection (Figure 3d-iv). Several genes positively associated with JAV-Immuno (Figure 1d) and expressed in the lymphoid aggregate region (Figure 3d-ii) were associated with TLS regions in the collection (Figure 3d-iv), including POU2F2, MBNL1, ABI3BP, VPS13C, and CPEB1. Other genes, including CMPK2, RSAD2, RNF144A, and SUCNR1, were positively associated with JAV-Immuno but were expressed more prominently outside the lymphoid aggregate regions (Figure 3d-ii) and were not as strongly associated with TLS in the collection (Figure 3d-iv). Participation in antiviral and antibacterial responses has been described for RSAD2 [41,42] and CMPK2 [42,43]. Reduced levels of RNF144A have been associated with PD-L1 stabilization and tumorigenesis in mouse bladder cancer models [44] and poor prognosis in patients with breast cancer [45]. SUCNR1 has been linked to altered immune infiltration of tumors in ovarian cancer [46] and renal cancer [47]. The adaptive immune processes represented by JAV-Immuno may thus be tuned by responses to stimuli in the tumor microenvironment that are outside of the lymphoid aggregates.
Associations Between POU2F2, TMB, and OS
Potential relationships between genes covered by the CCMs with TMB and OS with avelumab plus BSC were assessed using a 3-way interaction test (Figure 4a). This analysis was done in genes that were expressed in >50% of tumor samples and/or had a coefficient of variation of >5% (Supplementary Figure S6). The strongest positive monogenic association was seen with POU2F2, which also showed a positive association with JAV-Immuno (Figure 1d). POU2F2 is a transcription factor involved in B-cell differentiation and collaboration between B-cells and T-cells and is expressed in multiple cell types involved in antigen presentation, including B cells and monocytes (Figure 2b) [48,49]. The presence of the corresponding CCM was associated with low POU2F2 gene expression and decreased expression of POU2F2 target genes, suggesting that the CCM negatively regulates POU2F2 and downstream processes, including generation of mature B cells and TLS formation (Figure 4b).
We then explored relationships between the POU2F2 CCM, TMB, and OS in the avelumab plus BSC and BSC arms. POU2F2 CCM interactions with TMB and OS were more pronounced in the avelumab plus BSC arm than in the BSC arm (Table 2). The absence vs presence of the POU2F2 CCM was associated with a positive effect on OS in patients treated with avelumab plus BSC whose tumors displayed low TMB (less than the median value of 7.66 nonsynonymous single nucleotide variants per megabase); median OS was 37 vs 18 months (HR, 0.46 [95% CI, 0.24-0.89]; p=0.02). These findings suggest that the effect of CCM modulation on POU2F2 expression may be strongest when the treatment effect is contingent on immune responses to limited tumor immunogenicity.
Discussion
Data from the JAVELIN Bladder 100 trial are particularly valuable for investigating complex biomarker interactions in advanced UC. This is because avelumab 1L maintenance was associated with significant OS and PFS benefit and because avelumab was compared with BSC rather than an active treatment control. Exploratory analyses of associations between immune gene expression in tumor tissue, host chromatin structure, and outcomes from the JAVELIN Bladder 100 trial demonstrate the potential for circulating epigenetic biomarkers to predict response to ICI. In particular, systemic host chromatin structure may affect the composition of the tumor microenvironment by influencing host expression of immune response genes, including those affecting the formation of tertiary lymphoid structures. The interaction between TMB and a CCM covering POU2F2, a master regulator transcription factor for maturation of immune responses, in the avelumab plus BSC arm but not the BSC alone arm illustrates the potential for host modulation of immune responses to tumor immunogenicity.
Such modulation may explain why tumor types with similar tumor mutation profiles might respond differently to immunotherapy [50]. While the identification of epigenetic host factors influencing response to ICIs adds a new level of complexity to biomarker analyses, it also provides an opportunity for therapeutic targeting. Studies with combinations of epigenetic agents and ICIs are ongoing, and measurement of chromatin biomarkers may potentially help predict response [6]. Our work also underlines the great opportunity to address the challenges of using single tumor-based biomarkers, such as PD-L1 or TMB, by incorporating assessment of host factors.
Our findings are subject to known caveats related to exploratory post hoc analyses, including the possibility of false discovery and the lack of statistical power to detect all meaningful associations. As such, our results are hypothesis-generating; the clinical validity and utility of the POU2F2-containing CCM and other CCMs reported in this study should be evaluated further in prospective clinical studies. In addition, the generalizability and clinical utility of the spatial transcriptomic observations need to be confirmed in larger datasets. However, our observations support further evaluation of epigenetic and other blood-based biomarkers and substantiate the hypothesis that polygenic host factors may contribute to ICI activity. This knowledge could potentially help optimize the design of ICI-based treatment regimens for patients with advanced UC.
Supplementary Materials
The following supporting information can be downloaded at the website of this paper posted on Preprints.org.
Author Contributions
Conceptualization: TP, CD. Data curation: JP, KC, RN, EH, RR, JD. Formal Analysis: JP, EH. Investigation: TP, SS, JB, CS, PG, AD. Methodology: EH, MS, RP, AD, JG, AA, RN, KC, JP, SD, CD, RR, JD, DF, RA. Project administration: CD. Software: EH, RR, JD. Validation: EH, MS, RP, JG, AA, CH. Writing – original draft: TP, CD. Writing – review & editing: TP, SS, PG, KC, CD.
Data Availability Statement
Any requests for data by qualified scientific and medical researchers for legitimate research purposes will be subject to Merck’s Data Sharing Policy. All requests should be submitted in writing to Merck’s data sharing portal (https://www.merckgroup.com/en/research/our-approach-to-research-and-development/healthcare/clinical-trials/commitment-responsible-data-sharing.html). When Merck has a co-research, co-development, or co-marketing or co-promotion agreement, or when the product has been out-licensed, the responsibility for disclosure might be dependent on the agreement between parties. Under these circumstances, Merck will endeavor to gain agreement to share data in response to requests.
Acknowledgments
This study was sponsored by Merck (CrossRef Funder ID: 10.13039/100009945) and was previously conducted under an alliance between Merck and Pfizer. Medical writing support was provided by Katherine Quiroz-Figueroa of Nucleus Global and was funded by Merck. Mehrnoush Dezfouli, Benedict Egan, Paulina Brajer, Catriona Williams, and Tomas Lavin conducted EpiSwitch platform sample processing for detection of CCMs.
Conflicts of Interest
T. Powles has served in consulting or advisory roles for Astellas Pharma, AstraZeneca, Bristol Myers Squibb, Eisai, Exelixis, Incyte, Ipsen, Johnson & Johnson, Merck, MSD, Novartis, Pfizer, Roche, and Seagen; and has received travel and accommodations expenses from Pfizer. S. S. Sridhar has served in consulting or advisory roles for Astellas Pharma, AstraZeneca, Bayer, Bicycle Therapeutics, Bristol Myers Squibb, Eisai, Gilead, Ipsen, Janssen, MSD, Pfizer, and Seagen; and has received institutional research funding from Bayer, Merck, Janssen, and Seagen. J. Bellmunt has served in consulting or advisory roles for Astellas Pharma, AstraZeneca/MedImmune, Bristol Myers Squibb, Genentech, Novartis, Pfizer, Pierre Fabre, and Merck; has received travel and accommodation expenses from Ipsen, MSD, and Pfizer; reports patents, royalties, and other intellectual property from UpToDate; reports stock and other ownership interests in Rainier Therapeutics; has received honoraria from UpToDate; and has received institutional research funding from Millennium, Pfizer, Sanofi, and Merck. C. N. Sternberg has served in consulting or advisory roles for Bayer, Merck , MSD, Pfizer, Roche, Amgen, Incyte, Bristol Myers Squibb, AstraZeneca, Medscape, UroToday, Astellas Pharma, Sanofi, Genzyme, Gilead Sciences, and Foundation Medicine. P. Grivas has served in consulting or advisory roles for Merck, Bristol Myers Squibb, AstraZeneca, Pfizer, Janssen, Roche, Astellas Pharma, Gilead Sciences, Fresenius Kabi, G1 Therapeutics, Aadi Bioscience, CG Oncology, Bicycle Therapeutics, MSD, Strata Oncology, ImmunityBio, AbbVie, and Asieris Pharmaceuticals; and has received institutional research funding from Bristol Myers Squibb, Merck, QED Therapeutics, Mirati Therapeutics, MSD, G1 Therapeutics, Genentech, Gilead Sciences, Acrivon Therapeutics, and ALX Oncology. E. Hunter, M. Salter, R. Powell, A. Dring, J. Green, and A. Akoulitchev are employees of Oxford Biodynamics. A. Akoulitchev is the company director of Oxford BioDynamics. R. Ronen and J. Dutkowski are employees of Data4Cure. R. Amezquita and J. Pu were employees of Pfizer at the time of the study. C.-H. Huang, D. Fernandez, R. Nameki, K. A. Ching, S. Deng, A. di Pietro, and C. B. Davis are employees of and report stock or other ownership interests in Pfizer.
References
- Banchereau, R.; et al. Molecular determinants of response to PD-L1 blockade across tumor types. Nat Commun 2021, 12, 3969. [Google Scholar] [CrossRef] [PubMed]
- Powles, T.; et al. Avelumab maintenance in advanced urothelial carcinoma: biomarker analysis of the phase 3 JAVELIN Bladder 100 trial. Nat Med 2021, 27, 2200–2211. [Google Scholar] [CrossRef]
- Powles, T.; et al. Avelumab Maintenance Therapy for Advanced or Metastatic Urothelial Carcinoma. N Engl J Med 2020, 383, 1218–1230. [Google Scholar] [CrossRef] [PubMed]
- Powles, T.; et al. ESMO Clinical Practice Guideline interim update on first-line therapy in advanced urothelial carcinoma. Ann Oncol 2024, 35, 485–490. [Google Scholar] [CrossRef]
- Grivas, P.; et al. Avelumab first-line maintenance treatment for advanced urothelial carcinoma: review of evidence to guide clinical practice. ESMO Open 2023, 8, 102050. [Google Scholar] [CrossRef]
- Mellman, I.; et al. The cancer-immunity cycle: Indication, genotype, and immunotype. Immunity 2023, 56, 2188–2205. [Google Scholar] [CrossRef]
- Khan, Z.; et al. Polygenic risk for skin autoimmunity impacts immune checkpoint blockade in bladder cancer. Proc Natl Acad Sci U S A 2020, 117, 12288–12294. [Google Scholar] [CrossRef] [PubMed]
- Dizman, N.; et al. Nivolumab plus ipilimumab with or without live bacterial supplementation in metastatic renal cell carcinoma: a randomized phase 1 trial. Nat Med 2022, 28, 704–712. [Google Scholar] [CrossRef]
- Cuartero, S.; Stik, D.; Stadhouders, R. Three-dimensional genome organization in immune cell fate and function. Nat Rev Immunol 2023, 23, 206–221. [Google Scholar] [CrossRef]
- Johanson, T.M.; et al. Genome organization in immune cells: unique challenges. Nat Rev Immunol 2019, 19, 448–456. [Google Scholar] [CrossRef]
- Tordini, F.; et al. The genome conformation as an integrator of multi-omic data: the example of damage spreading in cancer. Front Genet 2016, 7, 194. [Google Scholar] [CrossRef] [PubMed]
- Bonev, B.; Cavalli, G. Organization and function of the 3D genome. Nat Rev Genet 2016, 17, 661–678. [Google Scholar] [CrossRef]
- Tien, F.-M.; et al. Epigenetic remodeling of the immune landscape in cancer: therapeutic hurdles and opportunities. J Biomed Sci 2023, 30, 3. [Google Scholar] [CrossRef] [PubMed]
- Kempfer, R.; Pombo, A. Methods for mapping 3D chromosome architecture. Nat Rev Genet 2020, 21, 207–226. [Google Scholar] [CrossRef]
- Dekker, J.; et al. Capturing chromosome conformation. Science 2002, 295, 1306–11. [Google Scholar] [CrossRef] [PubMed]
- Jakub, J.W.; et al. A pilot study of chromosomal aberrations and epigenetic changes in peripheral blood samples to identify patients with melanoma. Melanoma Res 2015, 25, 406–11. [Google Scholar] [CrossRef]
- Carini, C.; et al. Chromosome conformation signatures define predictive markers of inadequate response to methotrexate in early rheumatoid arthritis. J Transl Med 2018, 16, 18. [Google Scholar] [CrossRef]
- Alshaker, H.; et al. Chromatin conformation changes in peripheral blood can detect prostate cancer and stratify disease risk groups. J Transl Med 2021, 19, 46. [Google Scholar] [CrossRef]
- Pchejetski, D.; et al. Circulating chromosome conformation signatures significantly enhance PSA positive predicting value and overall accuracy for prostate cancer detection. Cancers 2023, 15, 821. [Google Scholar] [CrossRef]
- Hunter, E.; et al. Development and validation of blood-based predictive biomarkers for response to PD-1/PD-L1 checkpoint inhibitors: evidence of a universal systemic core of 3D immunogenetic profiling across multiple oncological indications. Cancers 2023, 15, 2696. [Google Scholar] [CrossRef]
- Quinlan, A.R. BEDTools: the Swiss-army tool for genome feature analysis. Curr Protoc Bioinformatics 2014, 47, 11.12–1. [Google Scholar] [CrossRef] [PubMed]
- Chen, T.; Guestrin, C. XGBoost: a scalable tree boosting system, in Proceedings of the 22nd ACM SIGKDD International Conference on Knowledge Discovery and Data Mining. 2016, Association for Computing Machinery: San Francisco, California, USA. pp. 785–794.
- Biecek, P.; Burzykowski, T. Shapley Additive Explanations (SHAP) for Average Attributions; 2021; pp. 95–106. [Google Scholar]
- Salter, M.; et al. Initial identification of a blood-based chromosome conformation signature for aiding in the diagnosis of amyotrophic lateral sclerosis. EBioMedicine 2018, 33, 169–184. [Google Scholar] [CrossRef] [PubMed]
- Zou, H.; Hastie, T. Regularization and variable selection via the elastic net. J R Stat Soc Series B Stat Methodol 2005, 67, 301–320. [Google Scholar] [CrossRef]
- Tibshirani, R. Regression shrinkage and selection via the Lasso. J R Stat Soc Series B Stat Methodol 1996, 58, 267–288. [Google Scholar] [CrossRef]
- Hoerl, A.E.; Kennard, R.W. Ridge regression: applications to nonorthogonal problems. Technometrics 1970, 12, 69–82. [Google Scholar] [CrossRef]
- Tiddi, I.; Schlobach, S. Knowledge graphs as tools for explainable machine learning: A survey. Artificial Intelligence 2022, 302, 103627. [Google Scholar] [CrossRef]
- Zhao, E.; et al. Spatial transcriptomics at subspot resolution with BayesSpace. Nat Biotechnol 2021, 39, 1375–1384. [Google Scholar] [CrossRef]
- Hu-Lieskovan, S.; et al. Association of tumor mutational burden and immune gene expression with response to PD-1 blockade by sasanlimab across tumor types and routes of administration. Targeted Onco 2021, 16, 773–787. [Google Scholar] [CrossRef]
- Motzer, R.J.; et al. Avelumab plus axitinib versus sunitinib in advanced renal cell carcinoma: biomarker analysis of the phase 3 JAVELIN Renal 101 trial. Nat Med 2020, 26, 1733–1741. [Google Scholar] [CrossRef]
- Yan, H.; et al. Epigenetic chromatin conformation changes in peripheral blood can detect thyroid cancer. Surgery 2019, 165, 44–49. [Google Scholar] [CrossRef]
- Karlsson, M.; et al. A single-cell type transcriptomics map of human tissues. Sci Adv 2021, 7. [Google Scholar] [CrossRef] [PubMed]
- Tabula Sapiens Consortium, et al. The Tabula Sapiens: a multiple-organ, single-cell transcriptomic atlas of humans. Science 2022, 376, eabl4896. [CrossRef]
- Ashburner, M.; et al. Gene ontology: tool for the unification of biology. The Gene Ontology Consortium. Nat Genet 2000, 25, 25–9. [Google Scholar] [CrossRef]
- Helmink, B.A.; et al. B cells and tertiary lymphoid structures promote immunotherapy response. Nature 2020, 577, 549–555. [Google Scholar] [CrossRef] [PubMed]
- Higgs, B.W.; et al. Interferon gamma messenger RNA signature in tumor biopsies predicts outcomes in patients with non-small cell lung carcinoma or urothelial cancer treated with durvalumab. Clin Cancer Res 2018, 24, 3857–3866. [Google Scholar] [CrossRef]
- Fehrenbacher, L.; et al. Atezolizumab versus docetaxel for patients with previously treated non-small-cell lung cancer (POPLAR): a multicentre, open-label, phase 2 randomised controlled trial. Lancet 2016, 387, 1837–46. [Google Scholar] [CrossRef] [PubMed]
- Eckstein, M.; et al. Cytotoxic T-cell-related gene expression signature predicts improved survival in muscle-invasive urothelial bladder cancer patients after radical cystectomy and adjuvant chemotherapy. J Immunother Cancer 2020, 8, e000162. [Google Scholar] [CrossRef]
- Ayers, M.; et al. IFN-γ-related mRNA profile predicts clinical response to PD-1 blockade. J Clin Invest 2017, 127, 2930–2940. [Google Scholar] [CrossRef]
- Wiedemann, G.M.; et al. Cutting edge: STAT1-mediated epigenetic control of Rsad2 promotes clonal expansion of antiviral NK cells. J Immunol 2020, 205, 21–25. [Google Scholar] [CrossRef]
- Arnold, N.; et al. Genomic and functional analysis of the host response to acute simian varicella infection in the lung. Sci Rep 2016, 6, 34164. [Google Scholar] [CrossRef]
- Larsson, I.; et al. Genome-scale metabolic modeling of glioblastoma reveals promising targets for drug development. Front Genet 2020, 11, 381. [Google Scholar] [CrossRef] [PubMed]
- Ho, S.R.; et al. RNF144A deficiency promotes PD-L1 protein stabilization and carcinogen-induced bladder tumorigenesis. Cancer Lett 2021, 520, 344–360. [Google Scholar] [CrossRef]
- Yang, Y.L.; et al. RNF144A functions as a tumor suppressor in breast cancer through ubiquitin ligase activity-dependent regulation of stability and oncogenic functions of HSPA2. Cell Death Differ 2020, 27, 1105–1118. [Google Scholar] [CrossRef]
- Zhang, J.; et al. Association between succinate receptor SUCNR1 expression and immune infiltrates in ovarian cancer. Front Mol Biosci 2020, 7, 150. [Google Scholar] [CrossRef] [PubMed]
- Najm, R.; Hachim, M.Y.; Kandasamy, R.K. Divulging a pleiotropic role of succinate receptor SUCNR1 in renal cell carcinoma microenvironment. Cancers (Basel) 2022, 14, 6064. [Google Scholar] [CrossRef]
- Hodson, D.J.; et al. Regulation of normal B-cell differentiation and malignant B-cell survival by OCT2. Proc Natl Acad Sci U S A 2016, 113, E2039–E2046. [Google Scholar] [CrossRef] [PubMed]
- Corcoran, L.; et al. Oct2 and Obf1 as facilitators of B:T cell collaboration during a humoral immune response. Front Immunol 2014, 5, 108. [Google Scholar] [CrossRef]
- Powles, T.; et al. Clinical efficacy and biomarker analysis of neoadjuvant atezolizumab in operable urothelial carcinoma in the ABACUS trial. Nat Med 2019, 25, 1706–1714. [Google Scholar] [CrossRef]
Figure 1.
Blood chromatin markers associated with JAV-Immuno in tumor and interactions between TMB, treatment, and OS. A. Modulation of TMB interactions with treatment based on OS outcome by JAV-Immuno score. Kaplan-Meier plots of high baseline TMB (≥median) vs low baseline TMB (<median) are shown for subgroups defined by treatment (avelumab plus BSC or BSC) and baseline JAV-Immuno scorehi/lo (based on median split). A Cox proportional hazards model with no adjustment for baseline covariates was used. A 2-sided Wald test was used to determine p values. B. Discovery of CCMs using EpiSwitch platform. i. DNA from fixed and permeabilized nuclei was digested with restriction enzymes and hybridized to an oligonucleotide array designed to detect sequences brought in proximity by chromatin conformation. ii. Nested PCR assays were designed for 150 sequences that could potentially differentiate between patients with JAV-Immunohi and JAV-Immunolo tumors. iii. PCR product indicated whether a given chromatin marker was present or absent. Predictive models based the presence or absence of chromatin marker PCR products and built using methods such as XGBoost were used to narrow the list of candidate markers to 25. C. Associations between blood chromatin markers and tumor JAV-Immuno levels. Univariate associations are shown between JAV-Immuno score and the status of 25 markers (present vs absent) detected by PCR assay across 3 template dilution levels (1×, 2×, and 4×). The x-axis represents magnitude and direction of differences in mean JAV-Immuno levels. A Wilcoxon rank-sum test comparing JAV-Immuno scores between the presence and absence of each marker was performed at each dilution level. The y-axis represents the log10 of 2-sided p values based on the test. Markers and dilutions that were selected in the final model are labeled. D. Correlations between individual genes covered by selected CCM markers and JAV-Immuno signature scores in tumor are plotted as Pearson coefficients with log10(p value). Genes with uncorrected p≤0.001 are labeled. BSC, best supportive care; CCM, chromatin conformation marker; HR, hazard ratio; NE, not evaluable; OS, overall survival; PCR, polymerase chain reaction; TMB, tumor mutation burden.
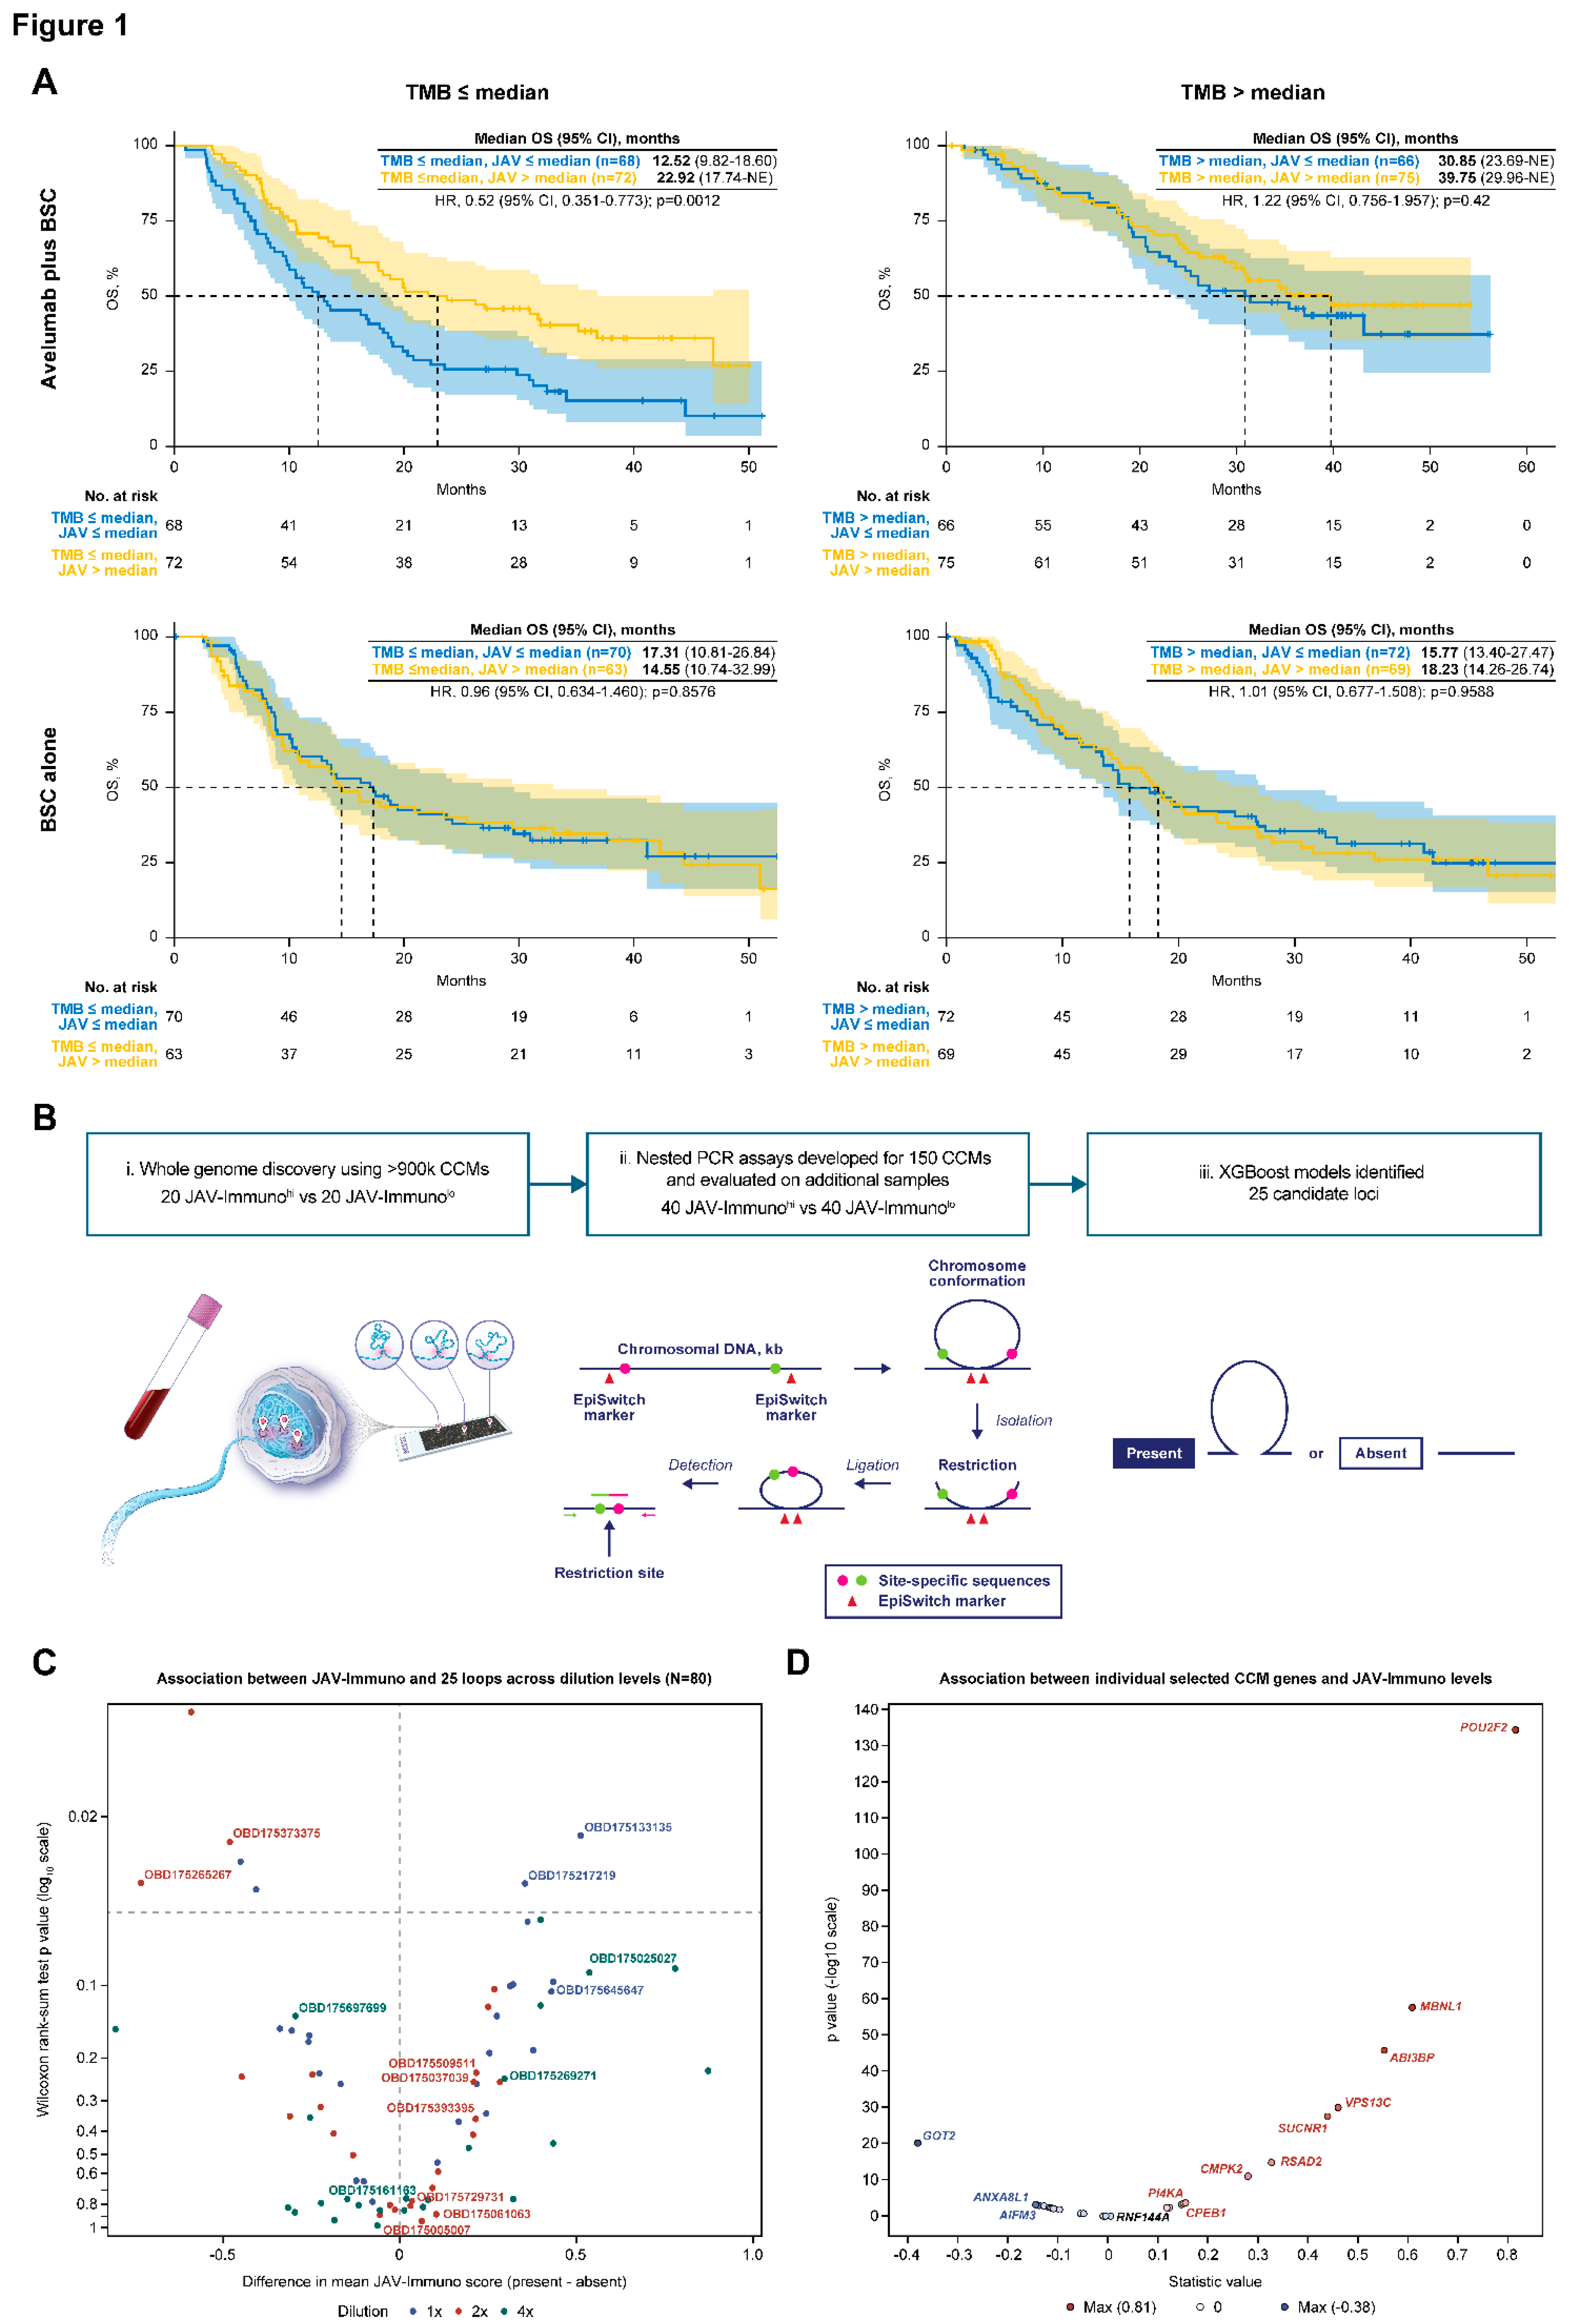
Figure 2.
Cell types and functions of genes covered by the selected EpiSwitch CCM. The heat maps display aggregated associations between genes (rows) and cell types (columns in A and B) or functions (columns in C and D) across public data represented in the Data4Cure CURIE knowledge graph. The association score summarizes data and literature evidence from publicly available datasets and publications linking biomedical entities. Hierarchical clustering was applied to associations to generate the heat map. Association between cell types and genes in the JAV-Immuno signature (A) and the selected CCM set (B). Only genes with mean scores of ≥0.1 for at least 4 cell types are included. T cells and NK cells are strongly associated with JAV-Immuno, whereas genes in the selected CCMs display more diverse associations, including with endothelial cells, fibroblasts, B cells, and monocytes, as well as NK and T cells. Comparison of Gene Ontology biological processes associated with JAV-Immuno (C) and the selected CCM set (D). JAV-Immuno displays strong connections with T-cell processes, whereas selected CCM genes are associated with more diverse processes. CCM, chromatin conformation marker; NK, natural killer.
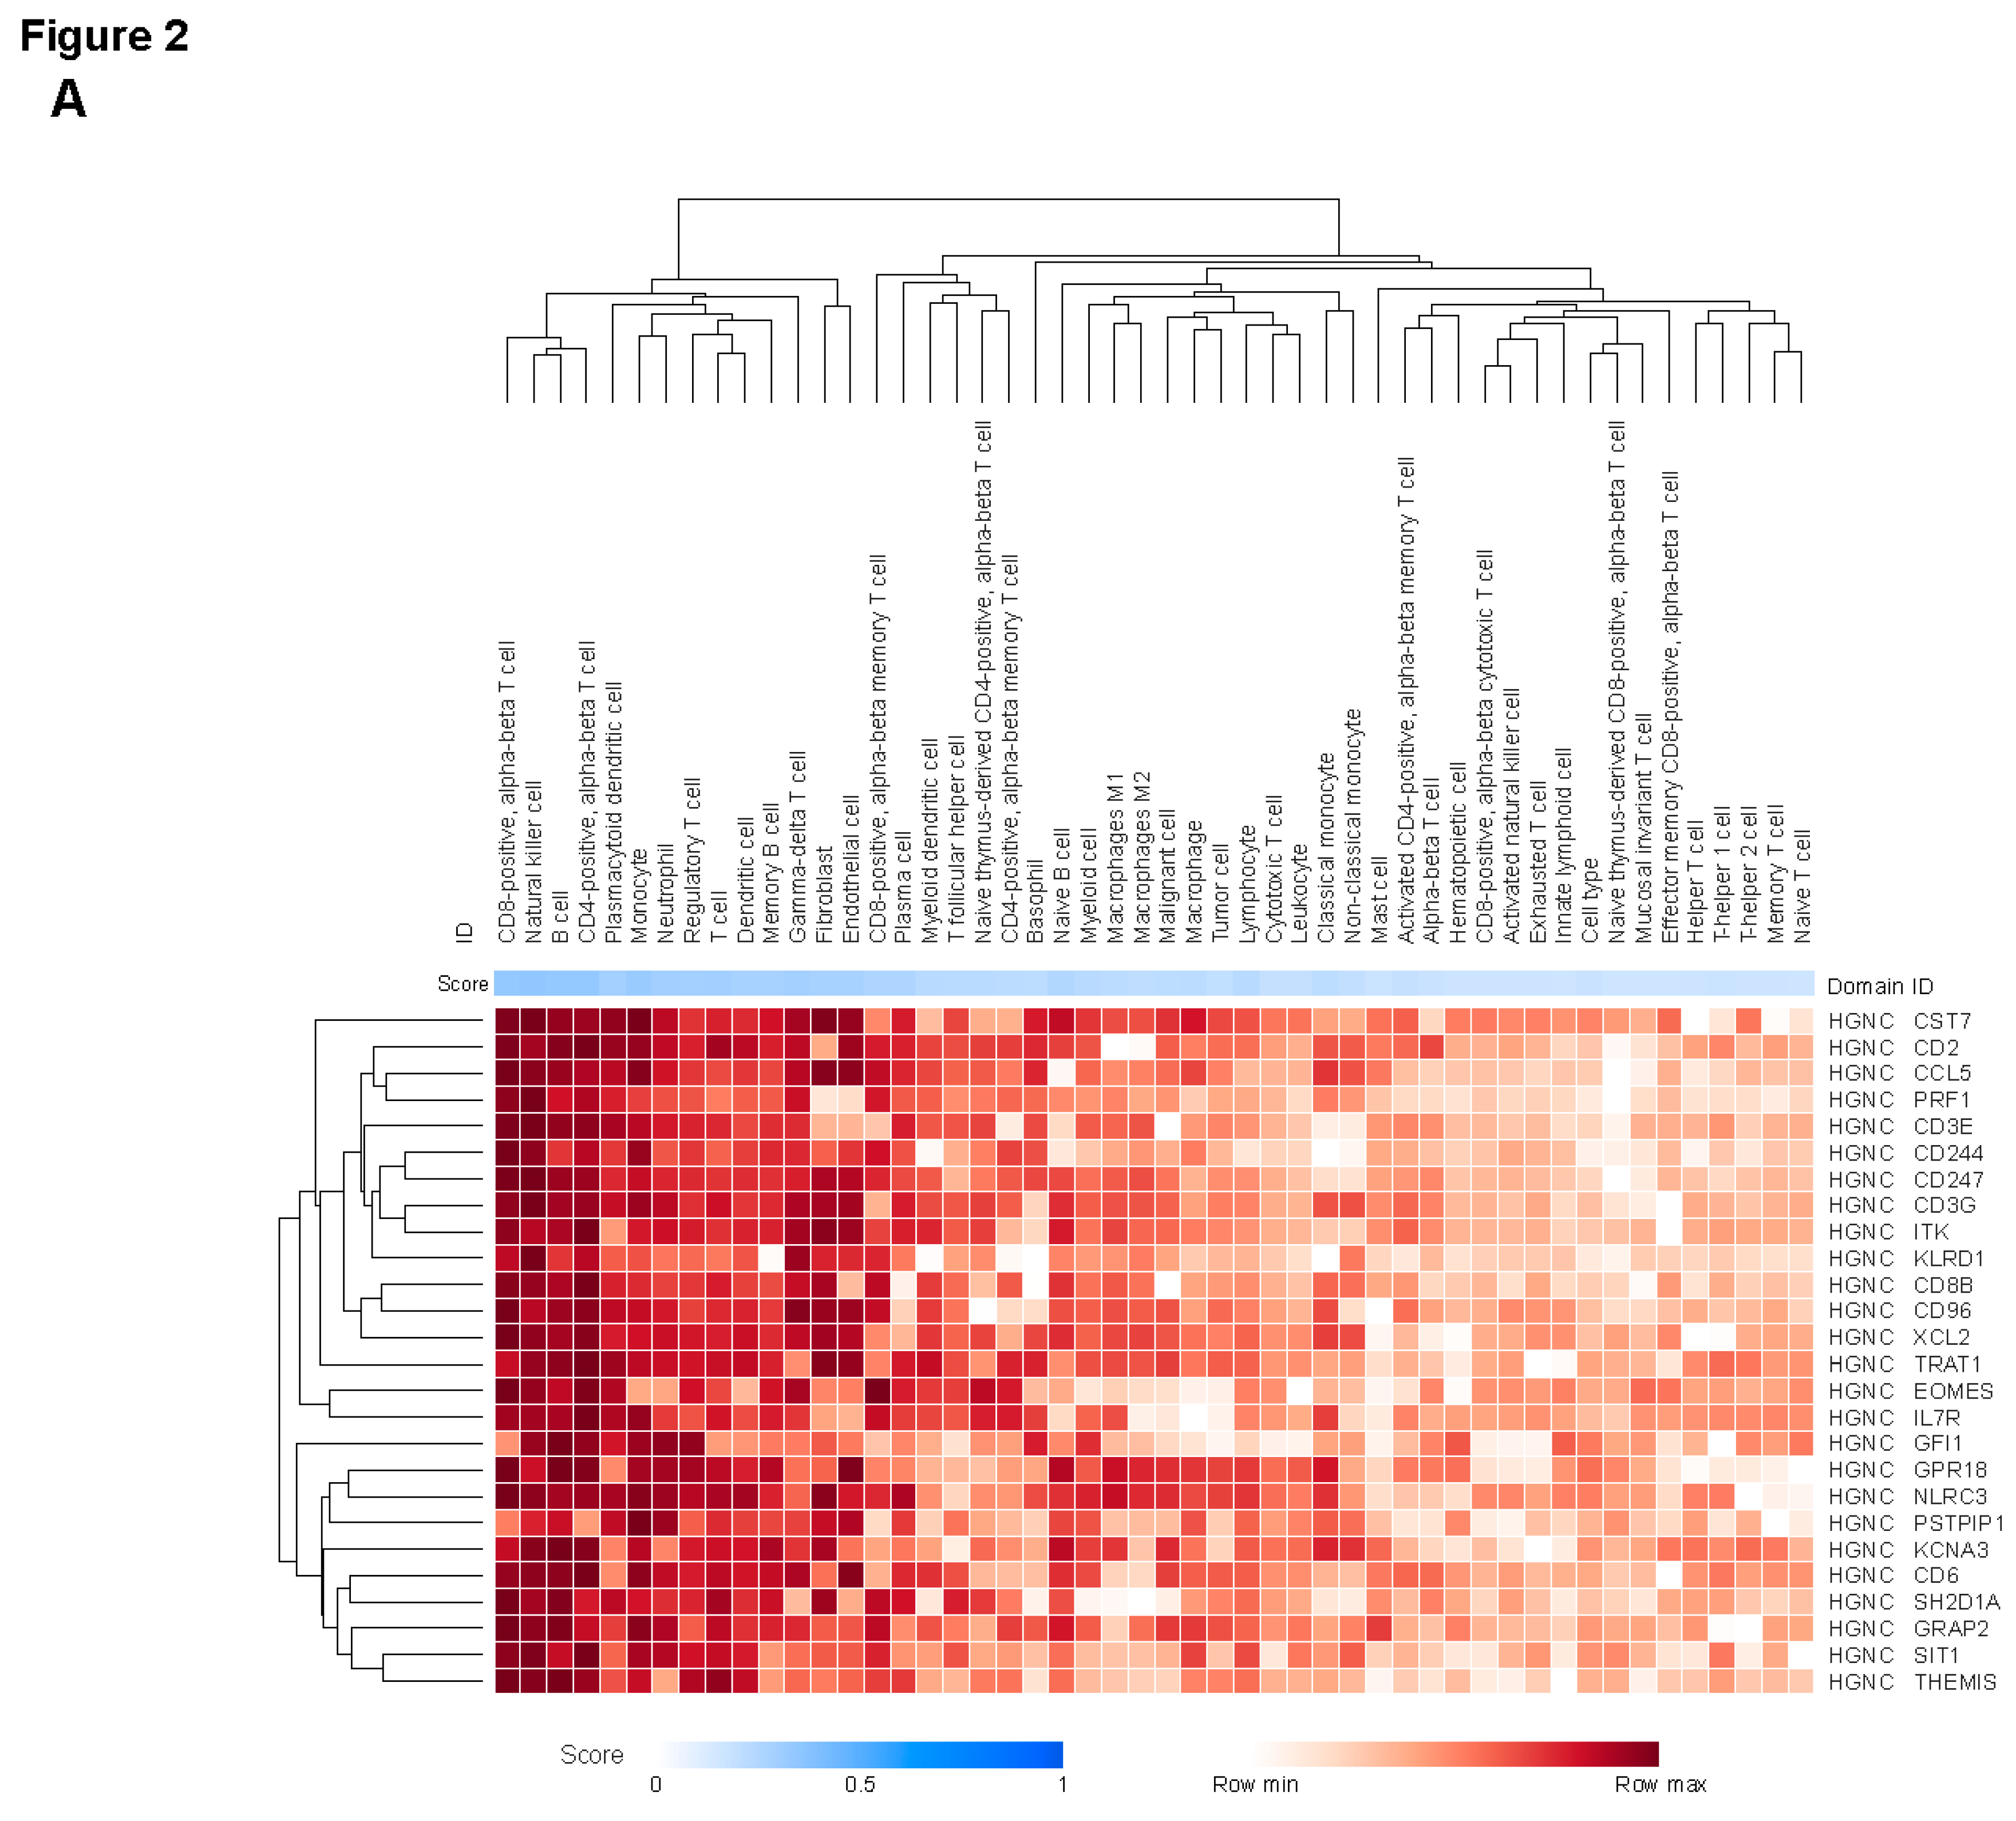
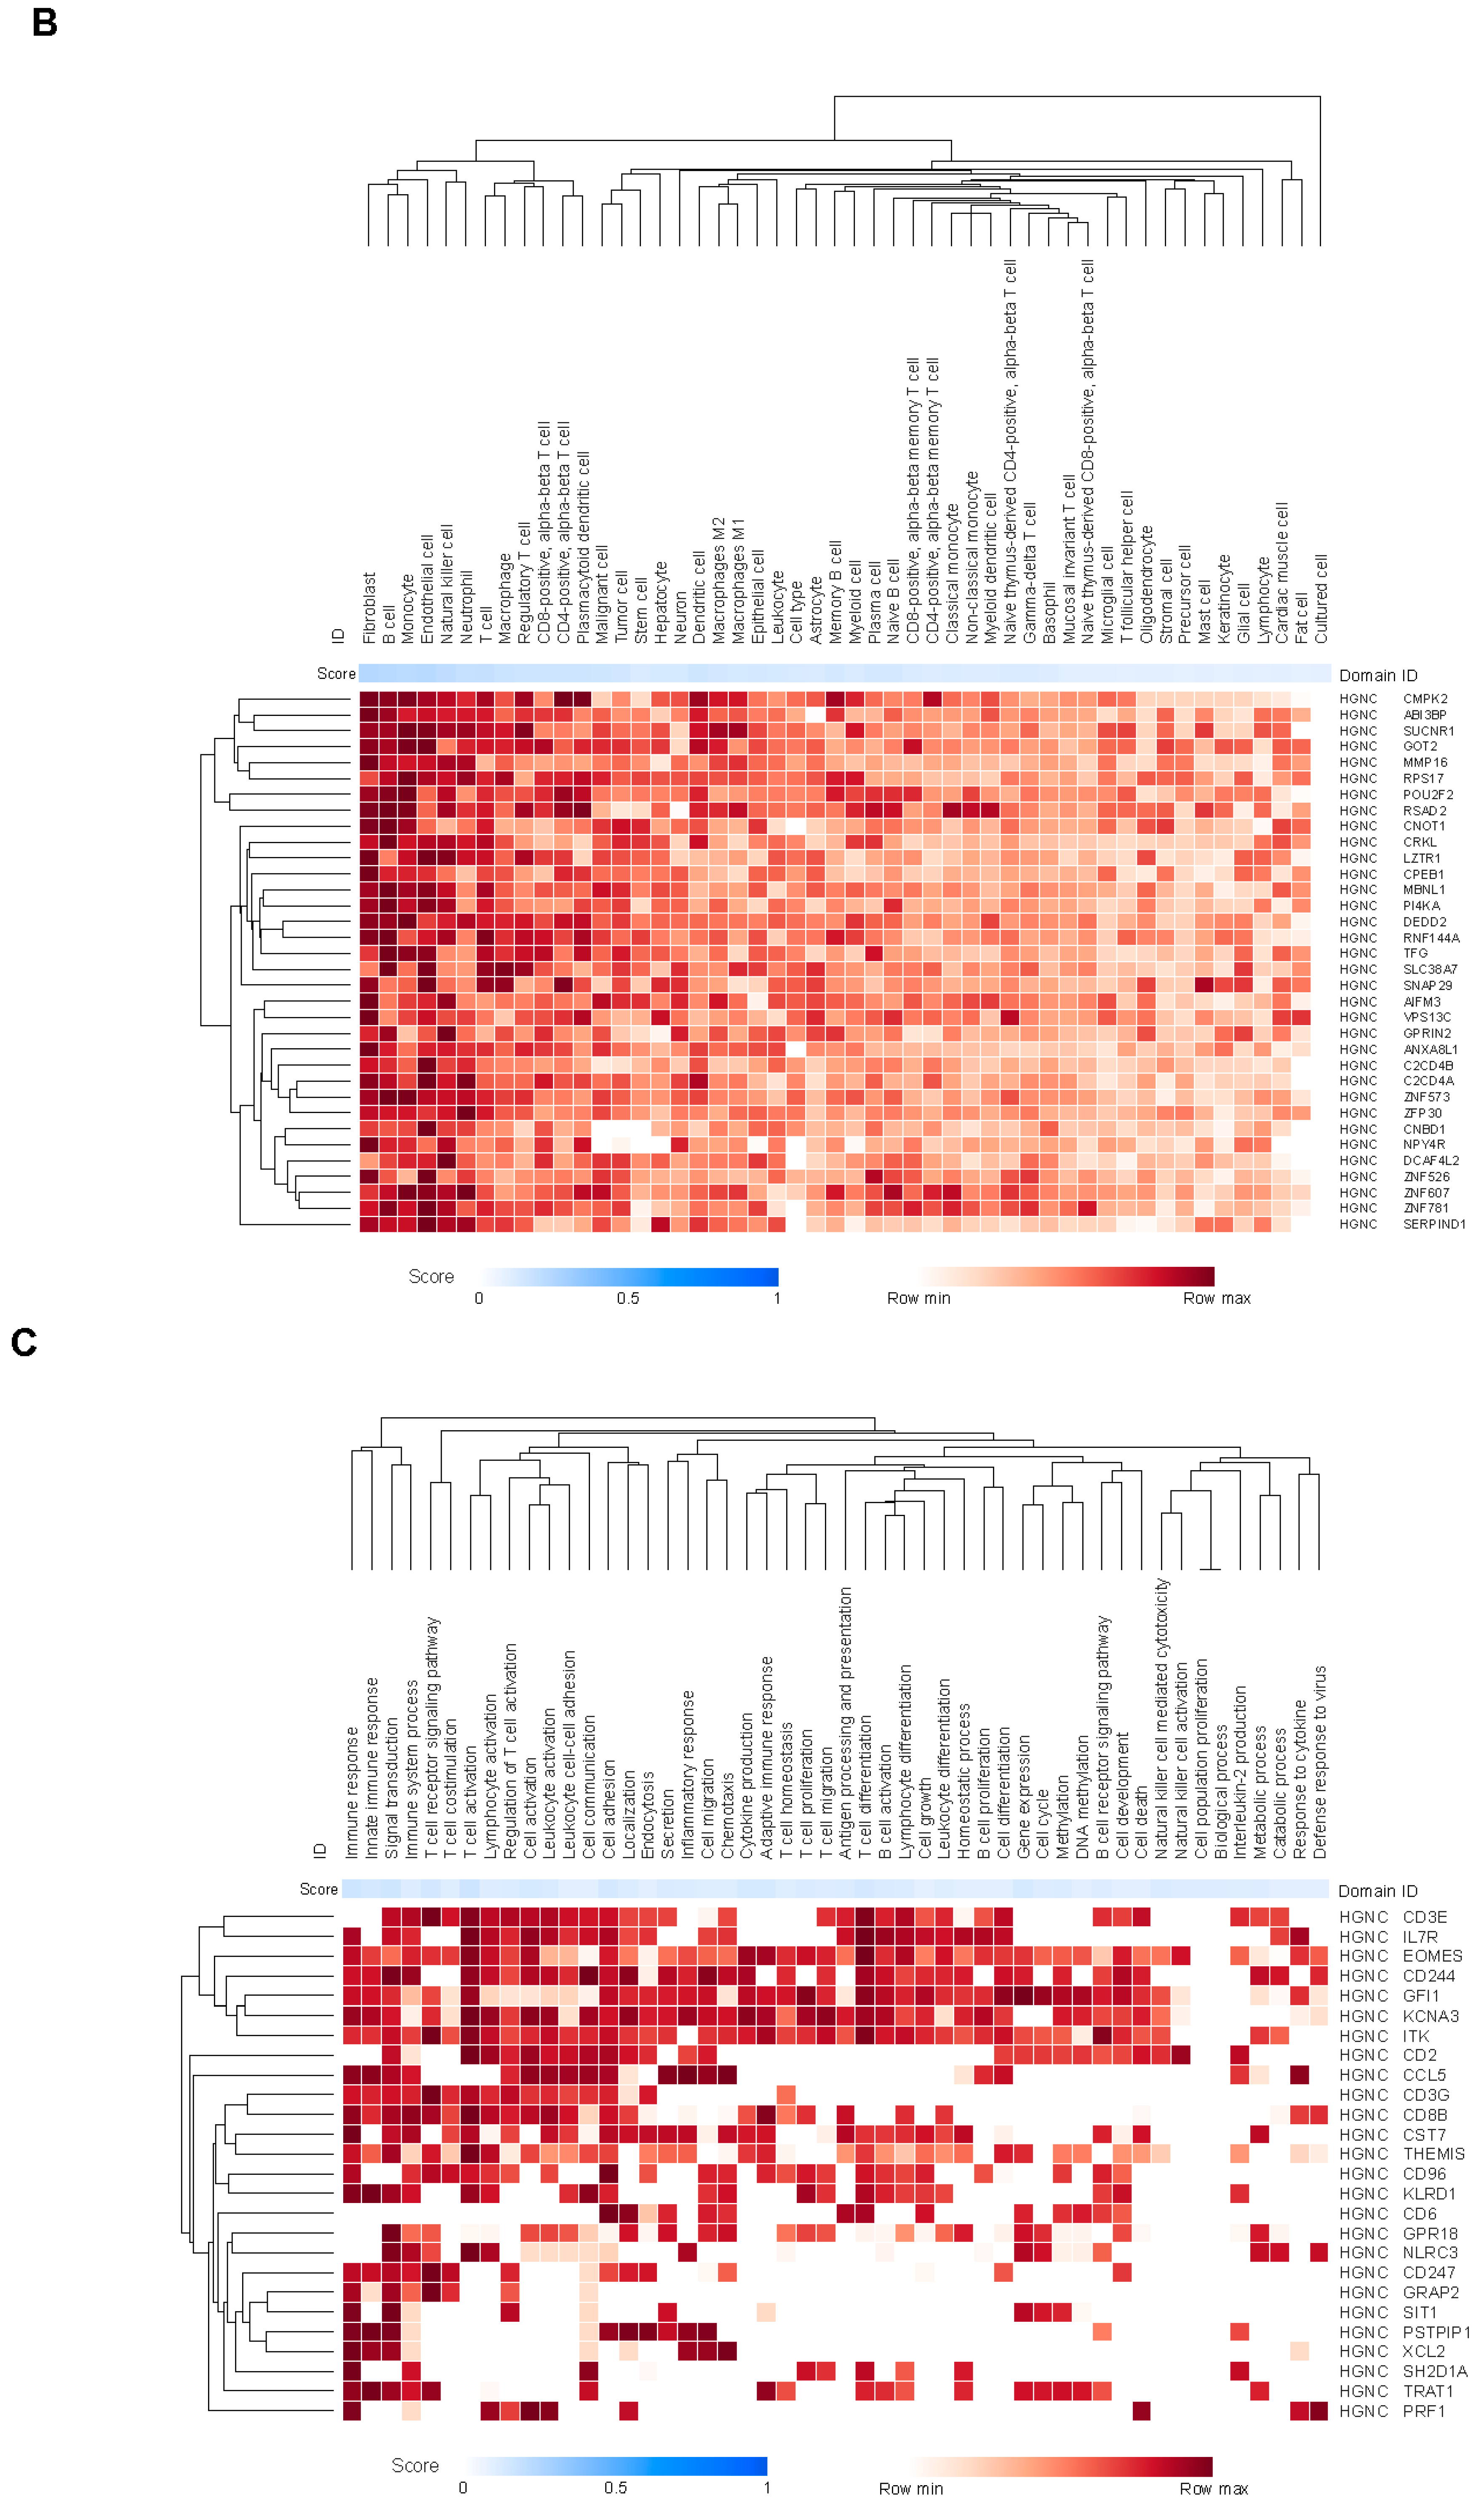
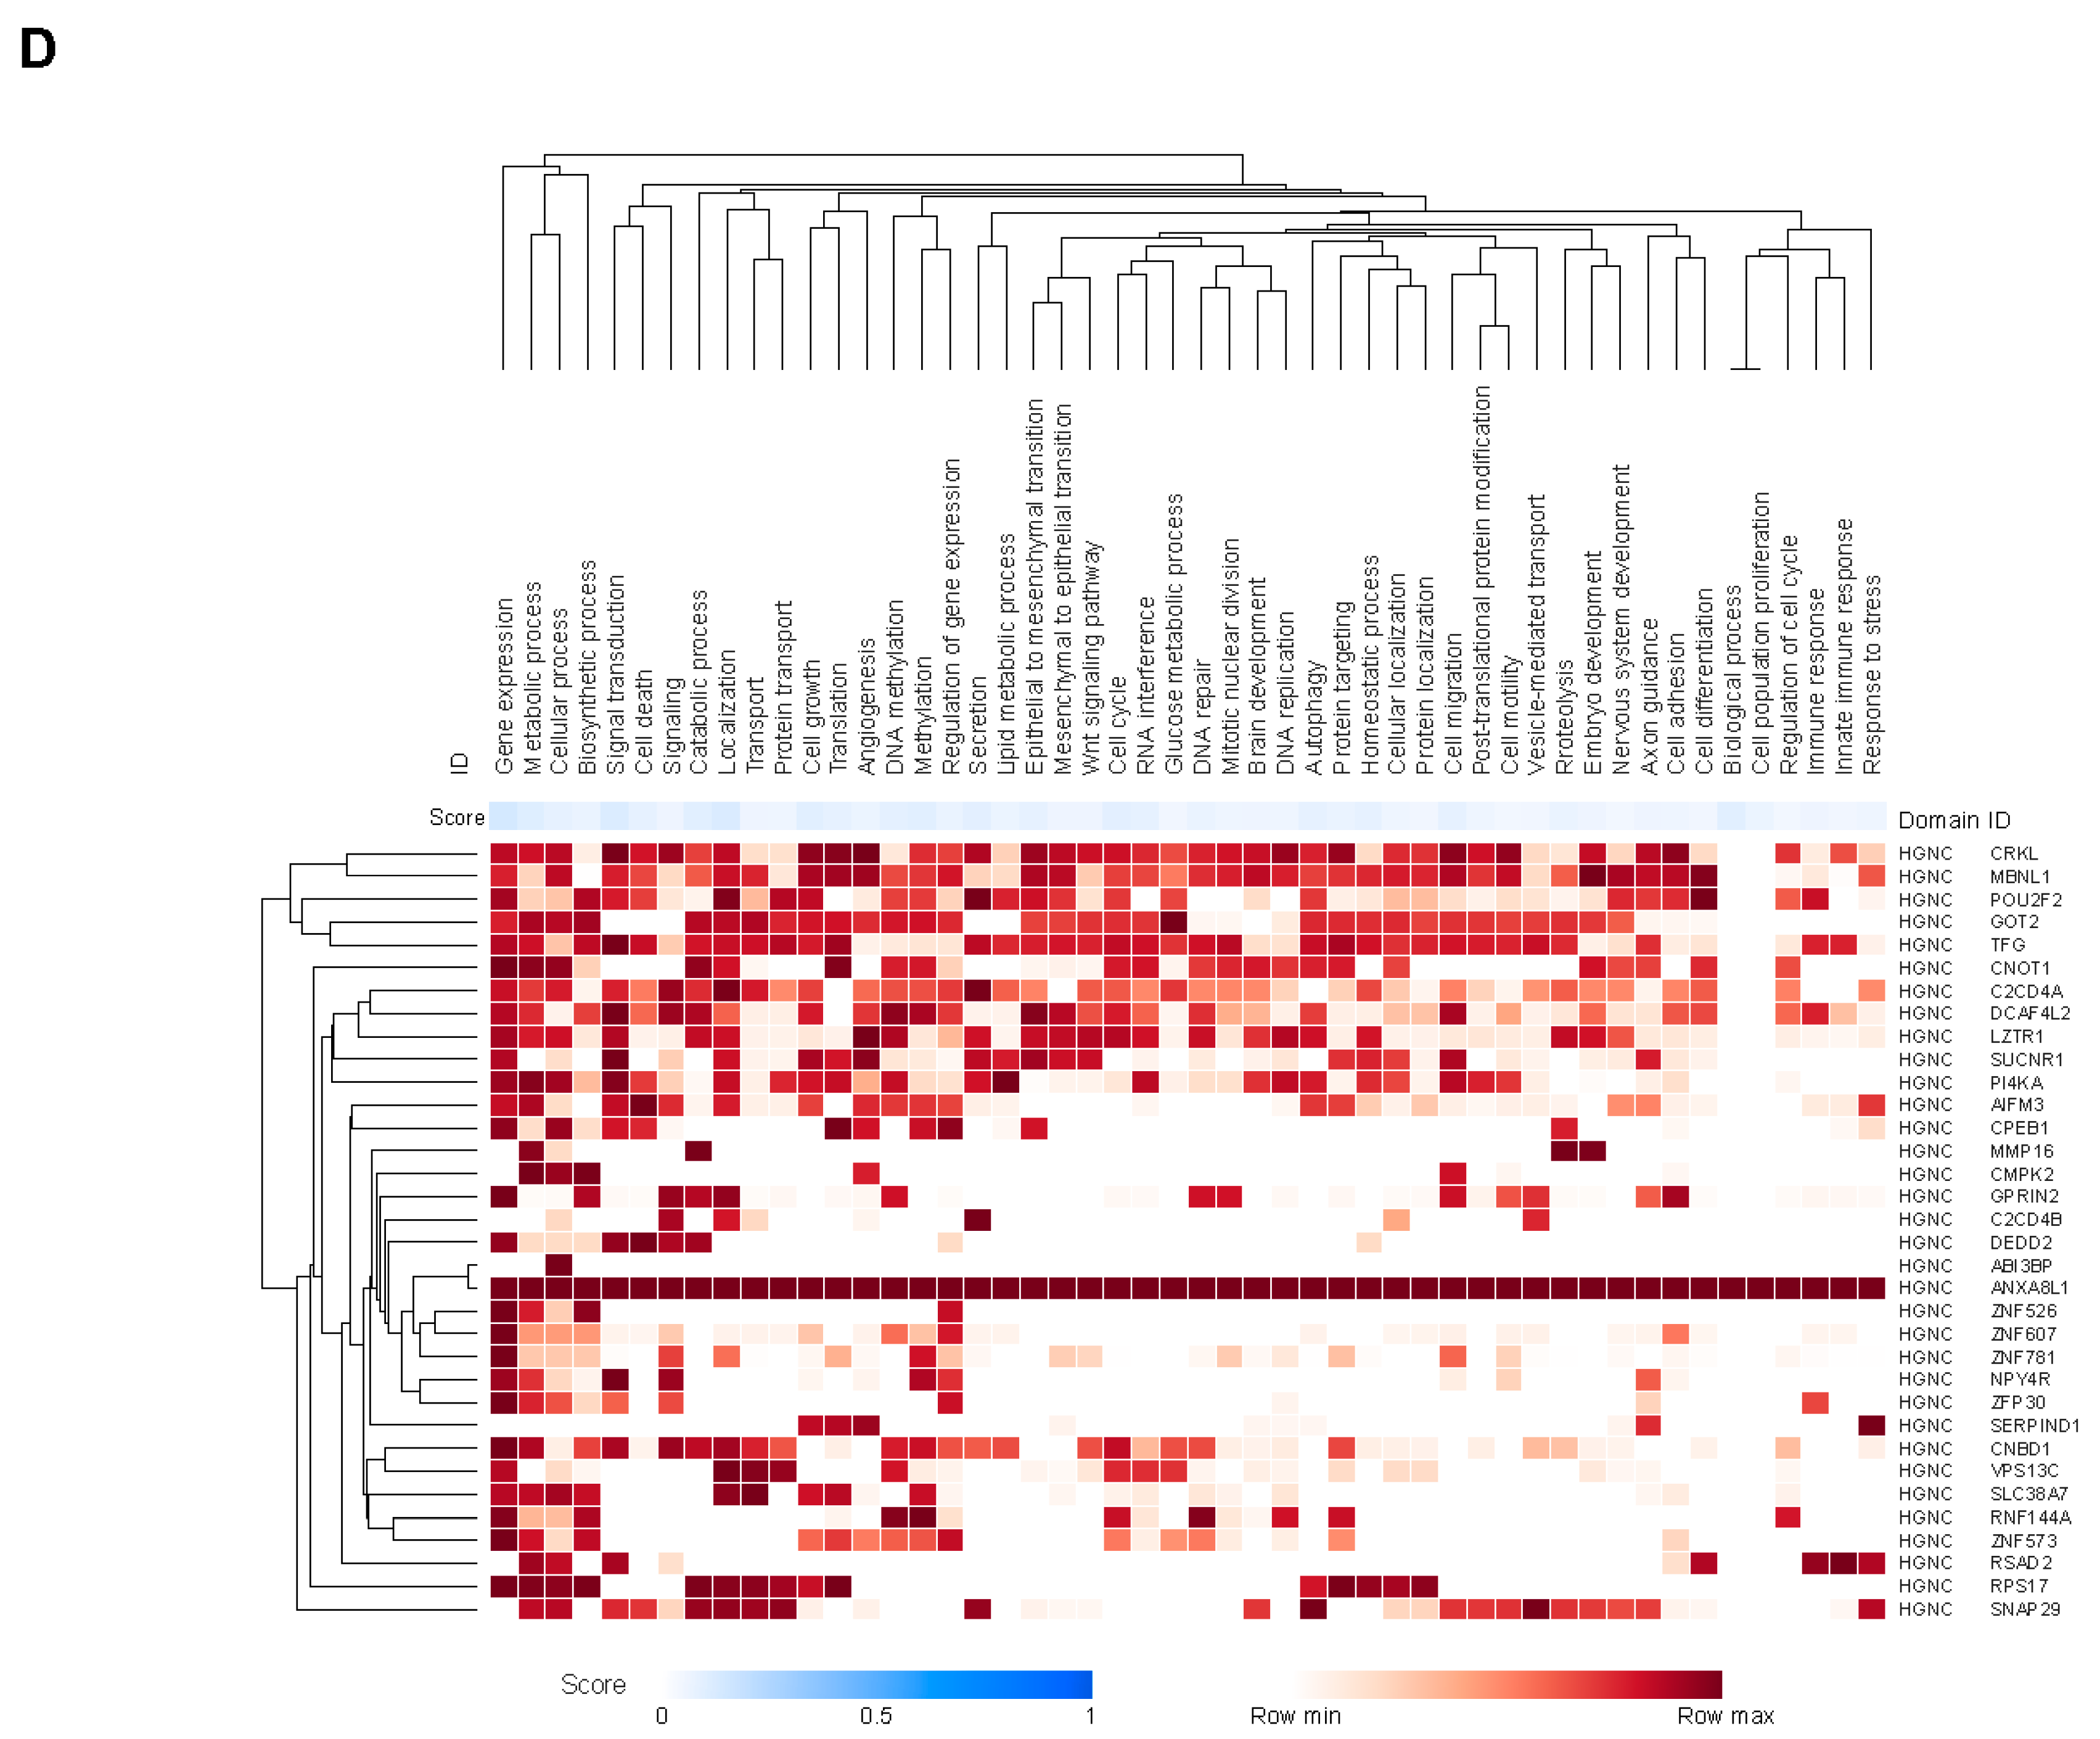
Figure 3.
Spatial transcriptomic analysis in bladder cancer sections of marker set genes compared with JAV-Immuno genes. A. i. Hematoxylin and eosin stain of an index bladder cancer section (A1-1) showing the position of lymphoid aggregates annotated by a pathologist. ii. Spatial indexing transcriptomic data (Visium) from the same specimen processed by BayesSpace. Eight regions identified by BayesSpace were manually merged into 4 functional regions and annotated by majority cell type and histology. B. i. The A1-1 bladder specimen was annotated according to average expression of a published TLS signature [36] per spot. ii. Average expression level of the TLS signature over the 4 main regions. iii. Heat map depicting individual gene expression across the 4 regions. Color represents aggregation by mean of values normalized by z-score. Note that most genes in the signature are expressed predominantly in the lymphoid aggregate region. C. i. A1-1 specimen annotated according to average expression of JAV-Immuno per spot. ii. Average expression level of JAV-Immuno over the 4 main regions. iii. Heat map depicting individual gene expression across the 4 regions. Note that most genes in the JAV-Immuno signature are also expressed predominantly in the lymphoid aggregate region. iv. Concordance between JAV-Immuno genes localized to lymphoid aggregates in the A1-1 bladder specimen and TLS-high regions in the bladder/renal/breast cancer collection. D. i. Average expression level of the CCM model genes over the 4 regions. ii. Heat map depicting individual gene expression across clusters based on distribution of expression between regions. Approximately half of the marker-set genes are expressed in lymphoid aggregates. iii. The A1-1 bladder specimen annotated according to average expression of the CCM model genes per spot. Separate spatial images are shown for the epithelial and lymphoid regions. iv. Concordance between genes localized to lymphoid aggregates in the A1-1 bladder specimen and TLS-high regions in the bladder/renal/breast cancer collection. CCM, chromatin conformation marker; TLS, tertiary lymphoid structures.
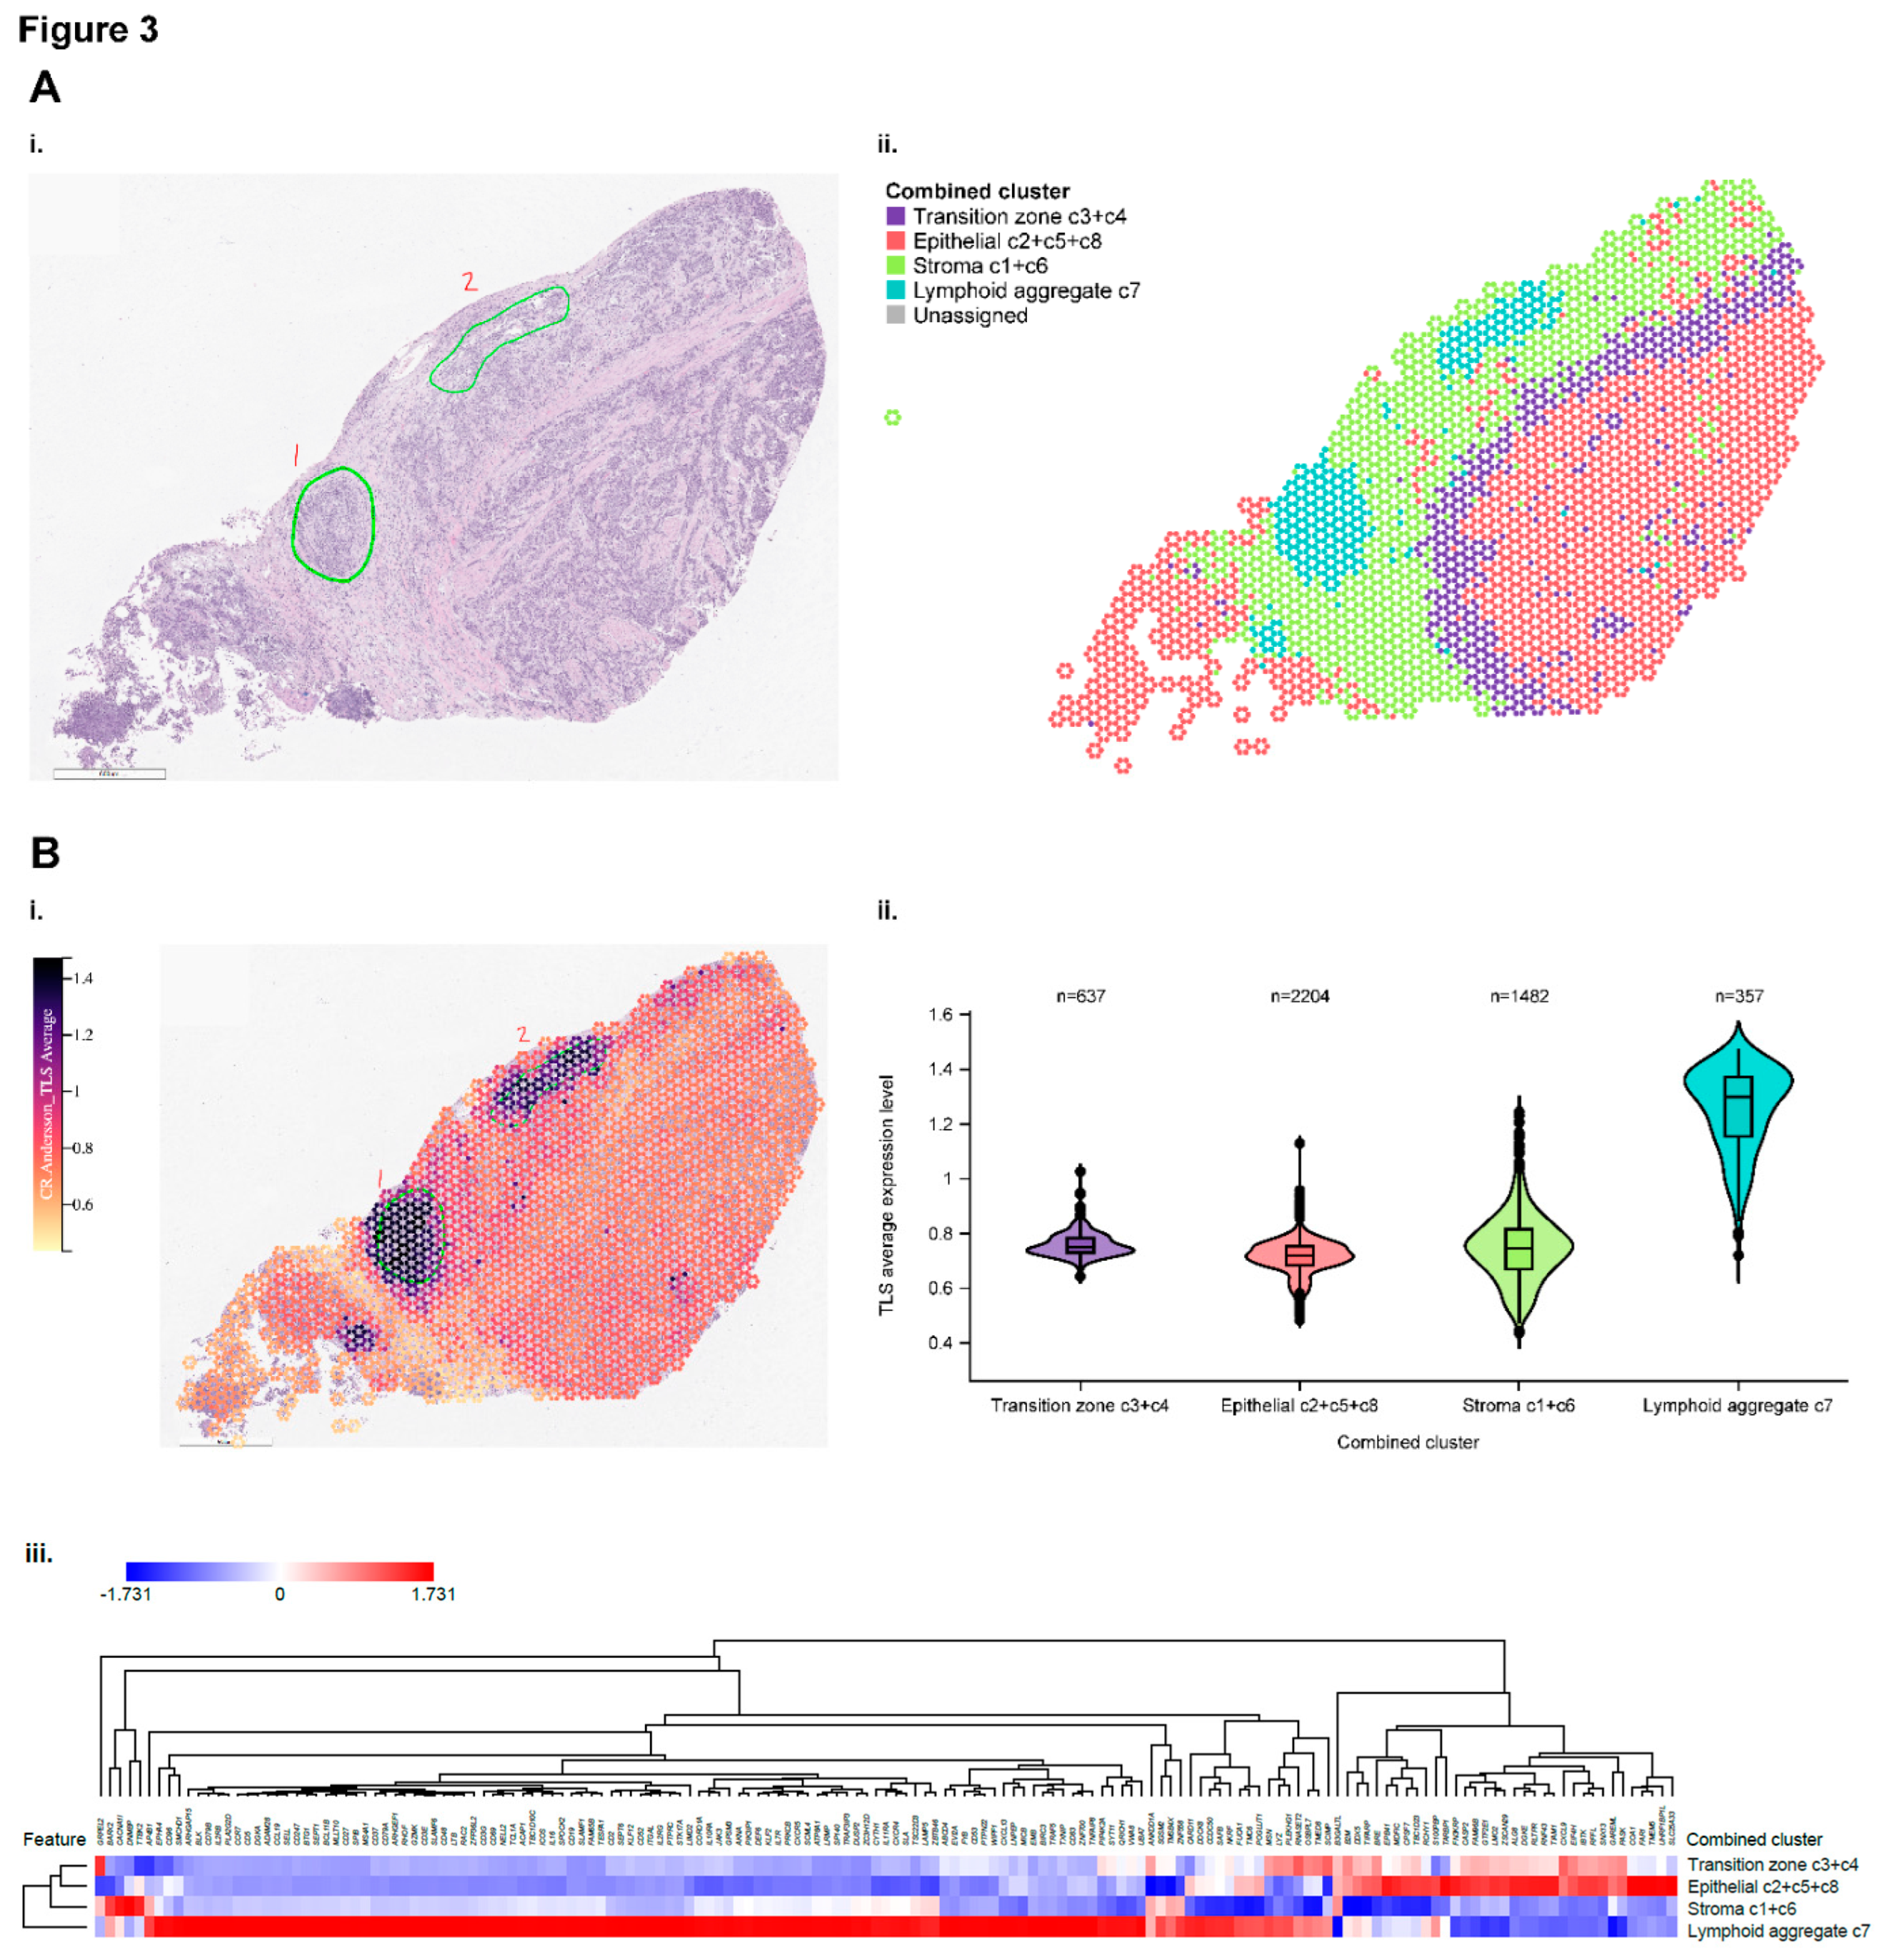
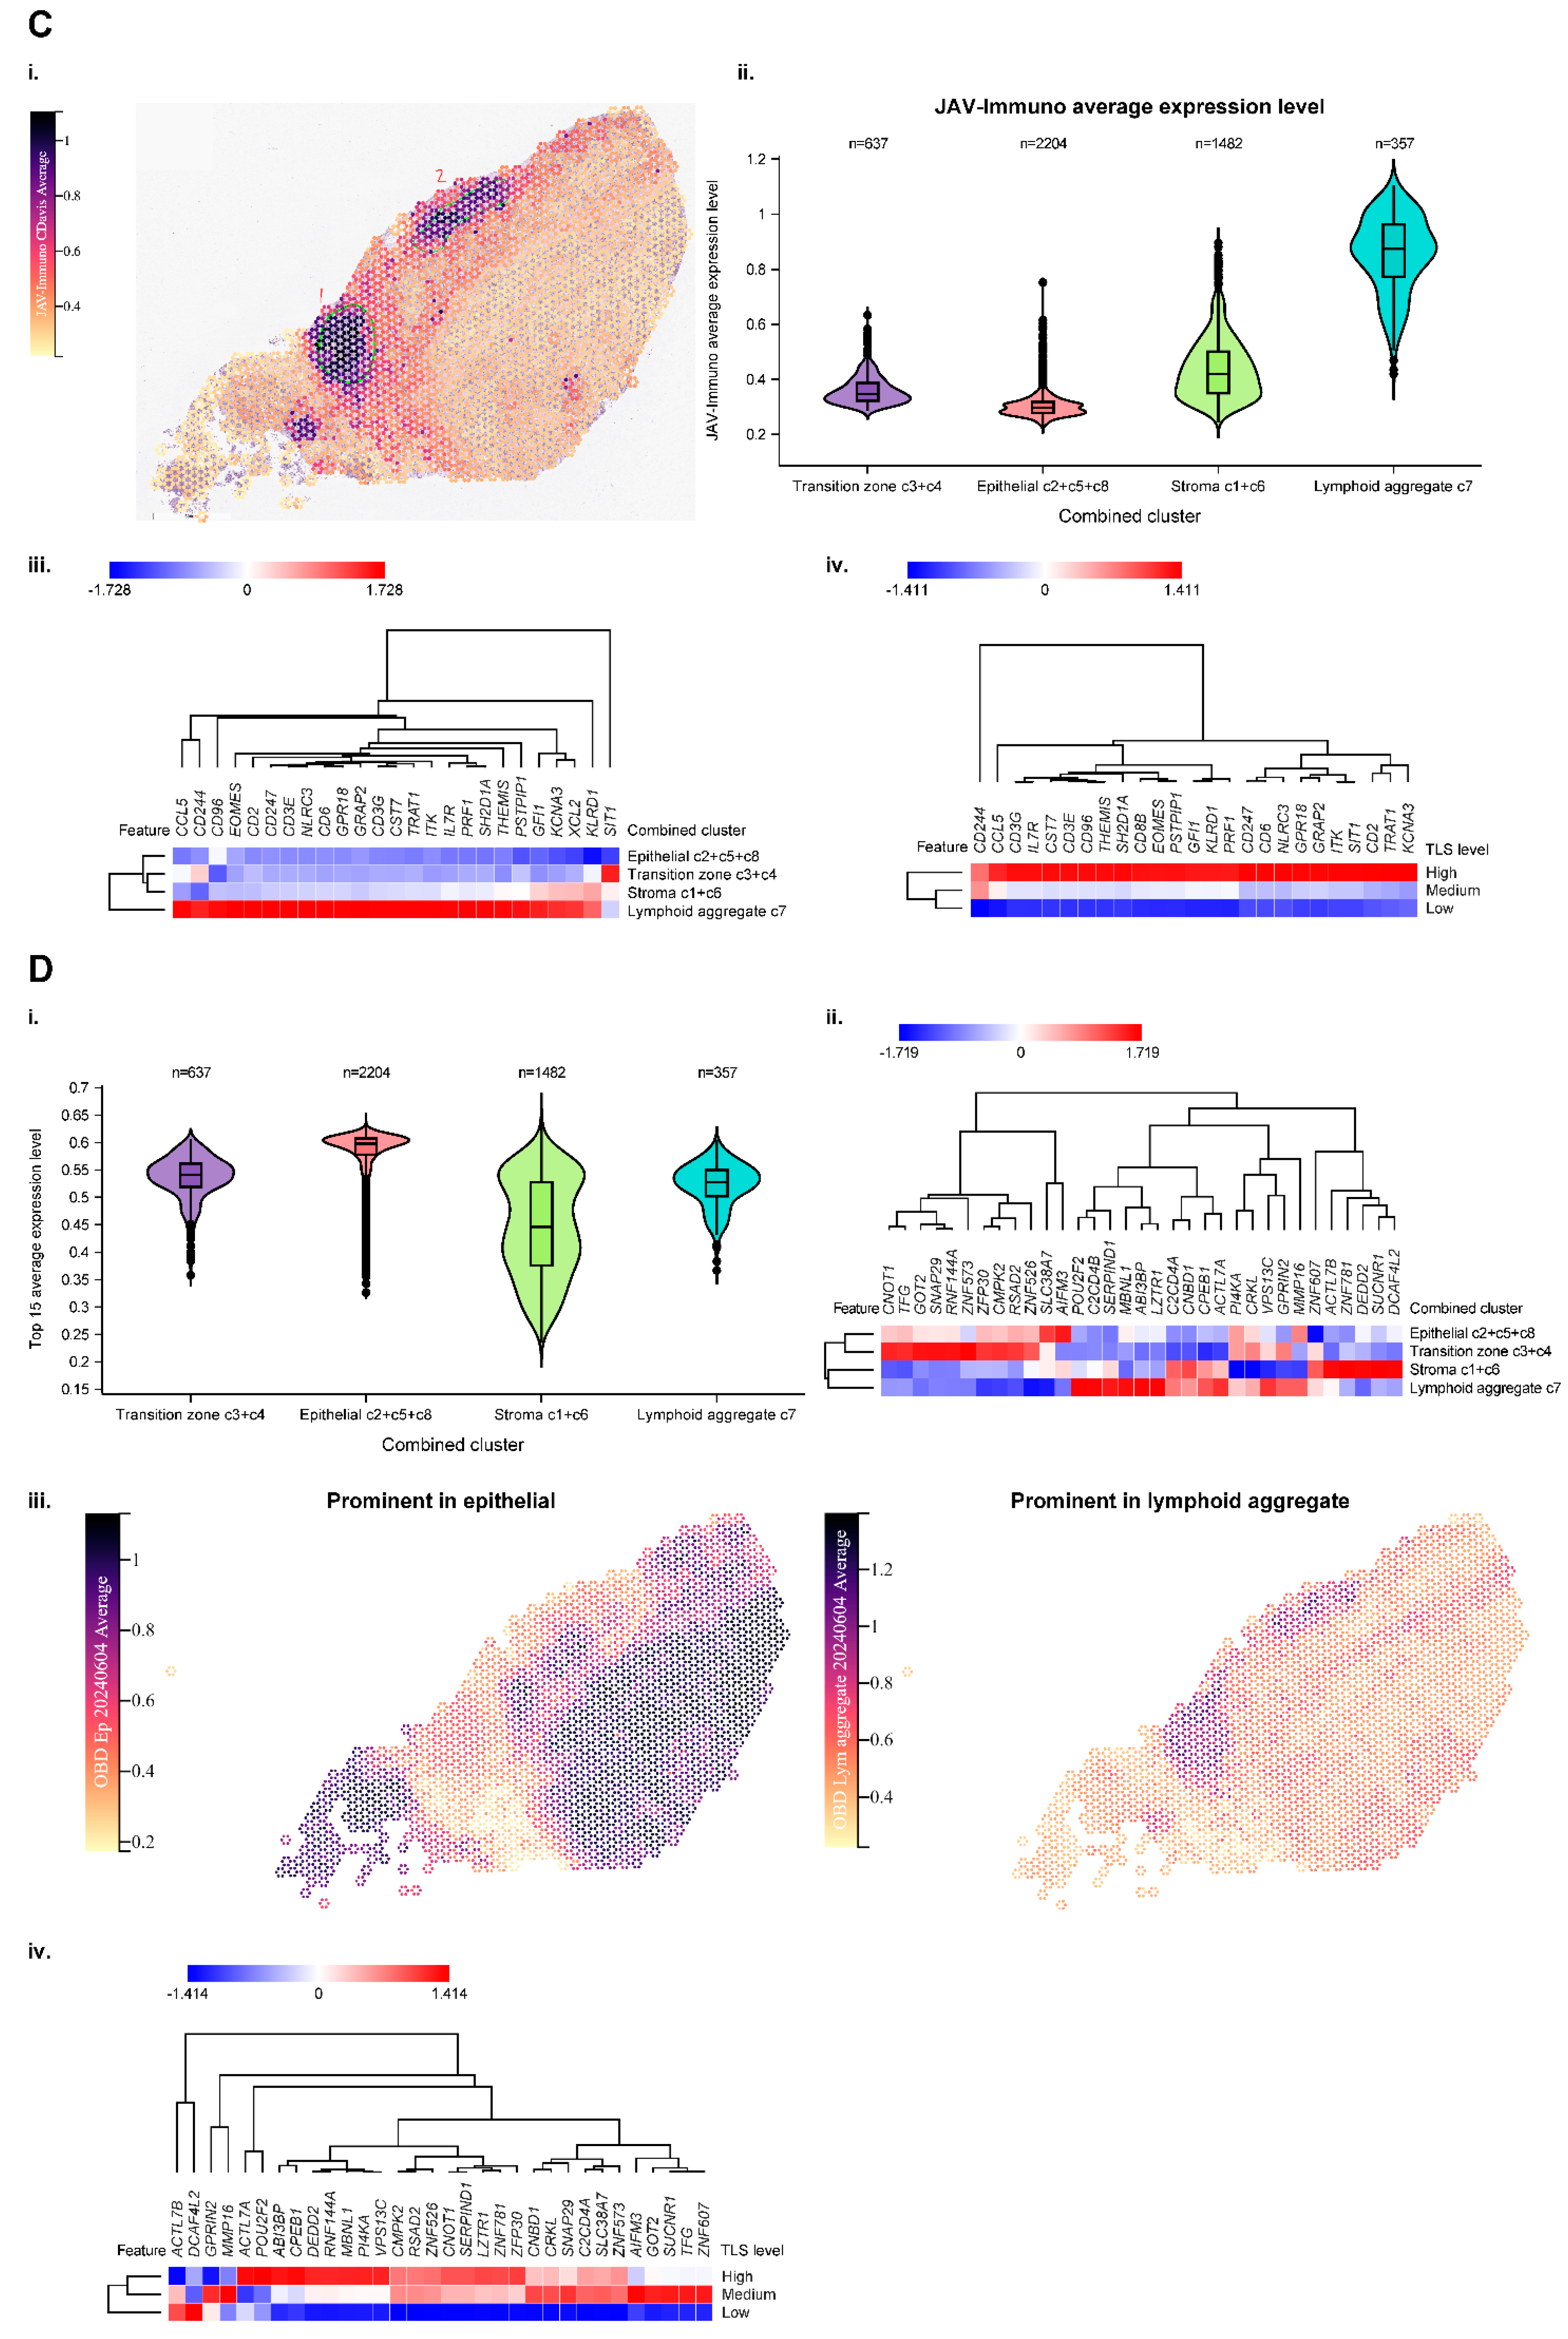
Figure 4.
Modulation of interactions between TMB and OS by POU2F2. A. Three-way interactions between POU2F2 expression in tumor, TMB, and treatment on OS outcome. Continuous measures of TMB and gene expression (log2 TPM) were used in the analysis. Genes that were expressed in ≤50% of samples or had a coefficient of variation of ≤5 for expression were excluded from the analysis. The estimated coefficients for the 3-way interaction and the p value on the y-axis were calculated based on a Cox model containing the gene*TMB*treatment interaction term and all the related lower-order terms. Note that POU2F2 showed the strongest monogenic effect. B. Presence of the blood marker encompassing POU2F2 is associated with reduced expression of POU2F2, downstream target genes, and gene expression signatures characteristic of TLS. OS, overall survival; TLS, tertiary lymphoid structures; TMB, tumor mutation burden; TPM, transcript count per million.
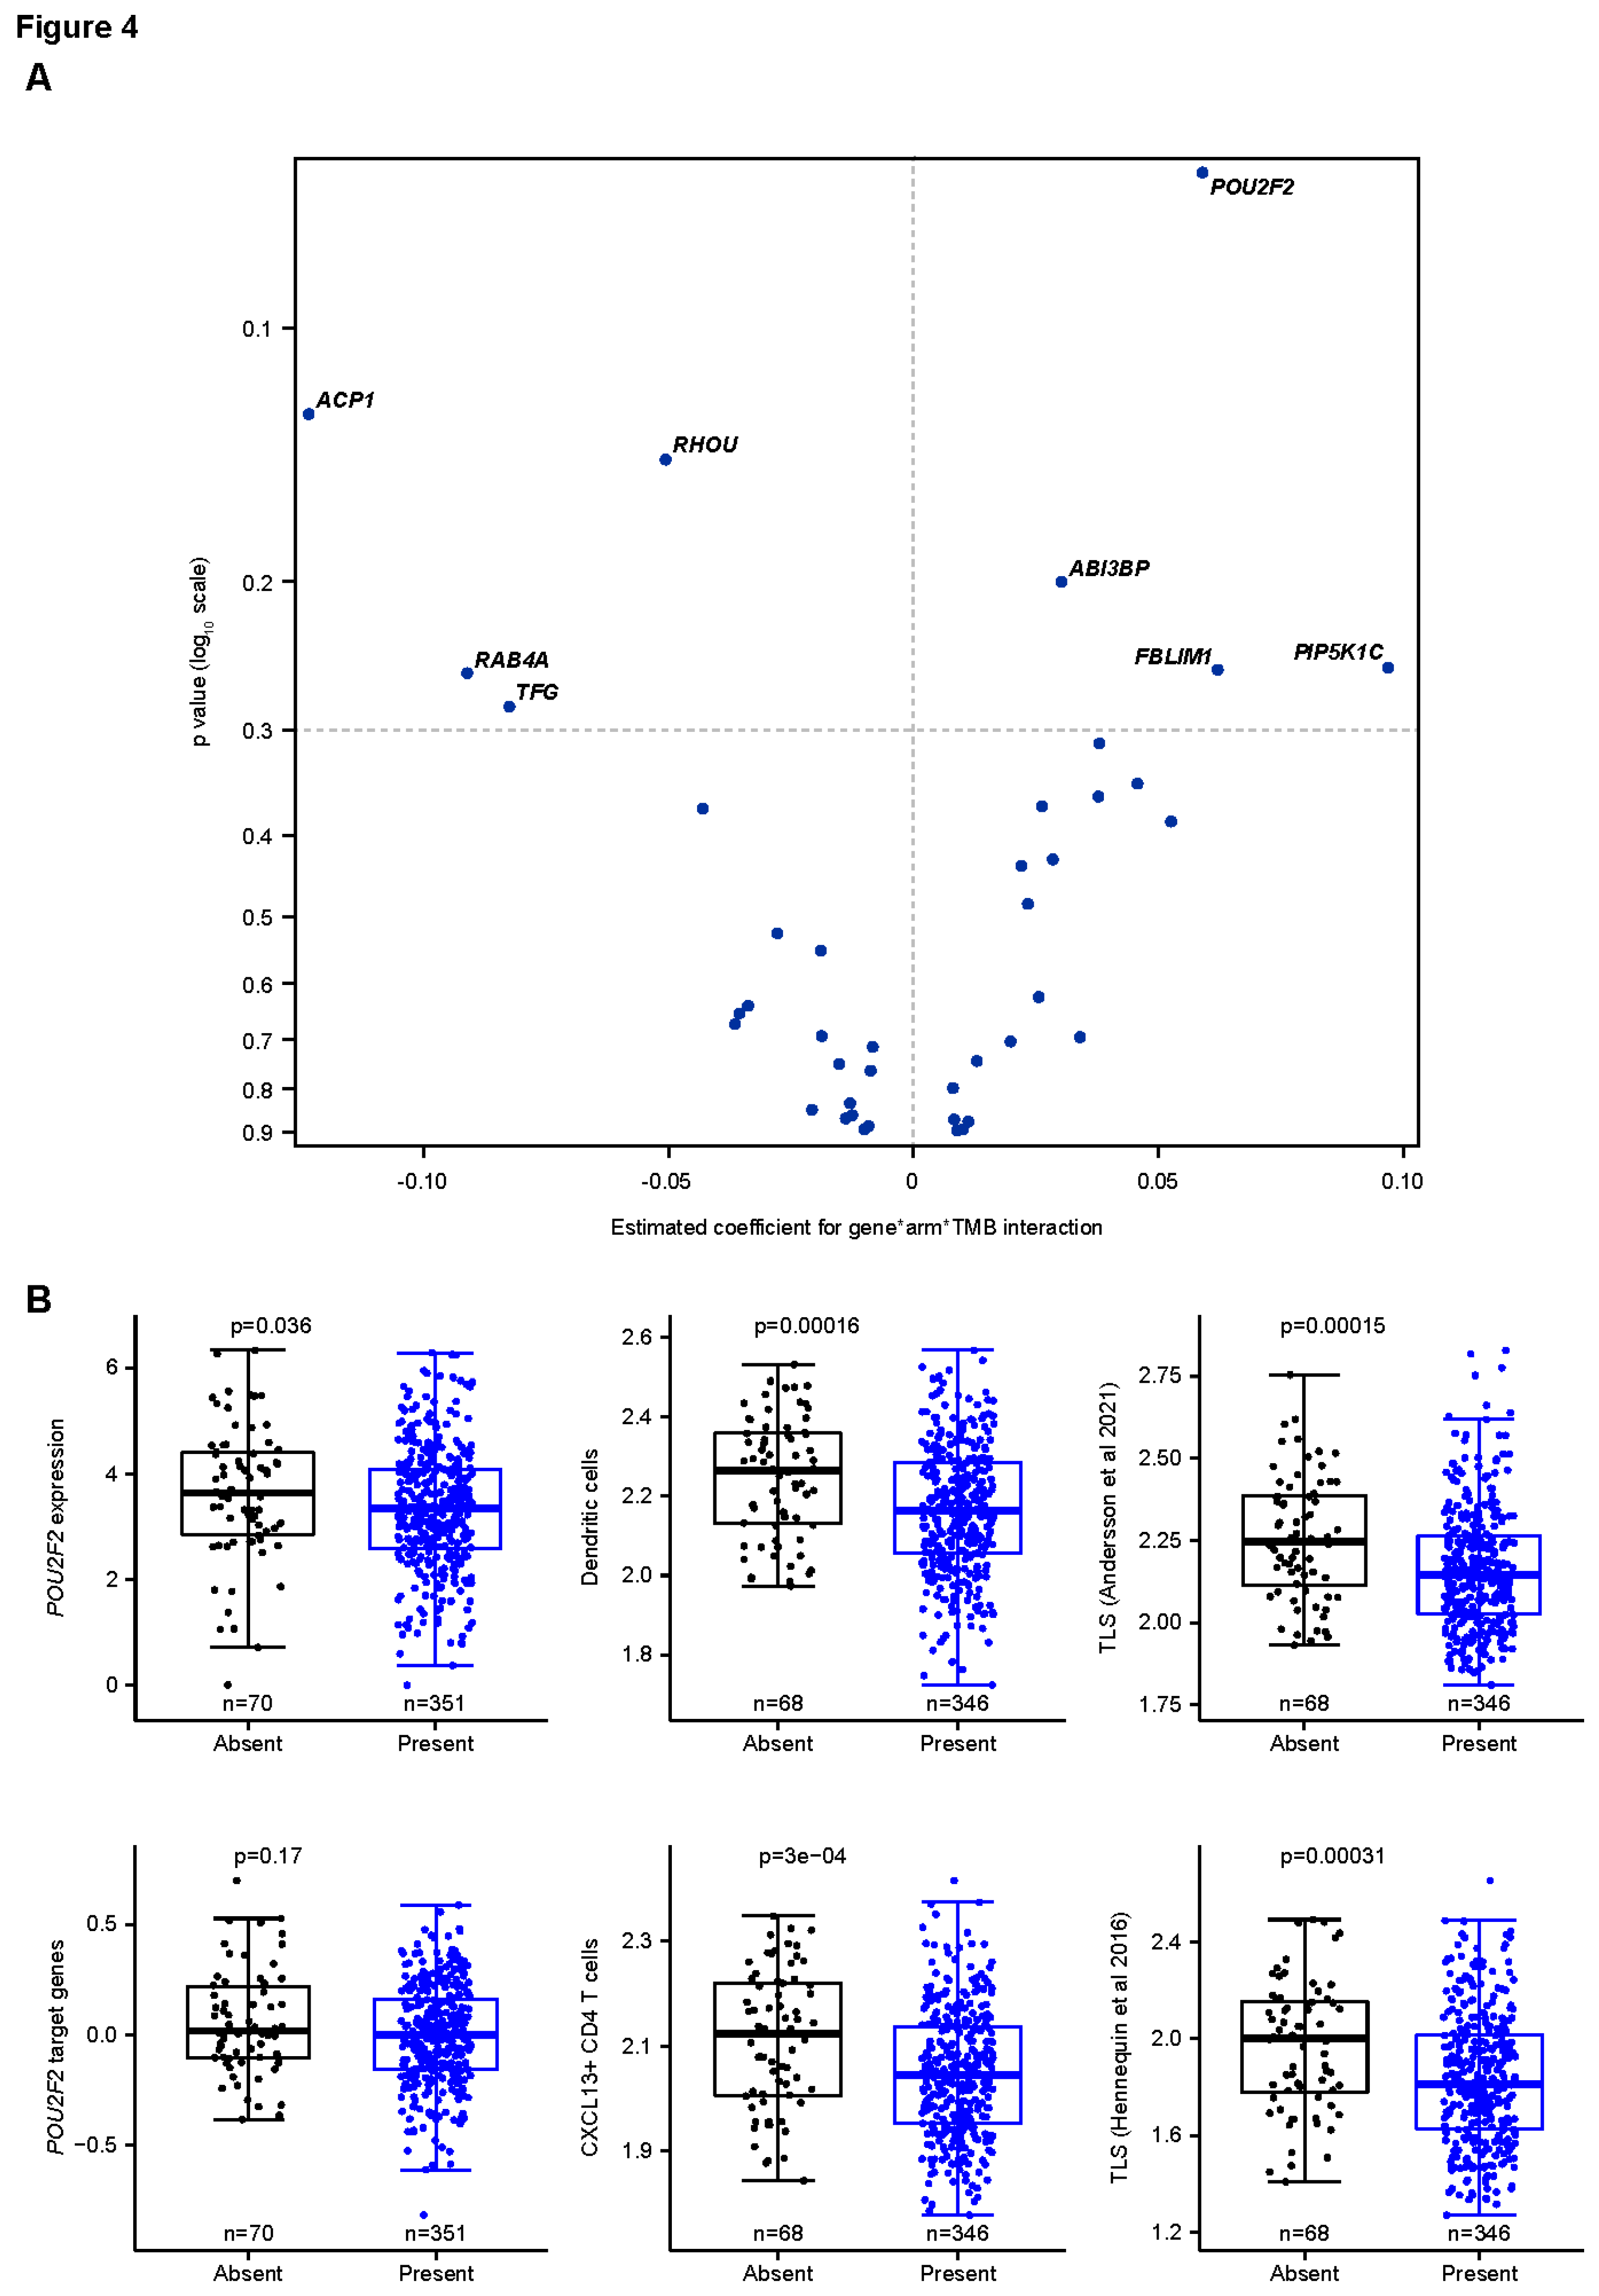

Table 1.
Compiled relationship between genes in the selected CCM set and JAV-Immuno, or entities in the CURIE knowledge graph. Values reported in the cell type, immune compartment, and immune process columns represent aggregated association scores between the individual genes and selected entities in the Data4Cure CURIE Knowledge Graph. The association score summarizes data and literature evidence from publicly available datasets and publications linking biomedical entities. CCM, chromatin conformation marker; MHC, major histocompatibility complex.
| Association between tumor gene expression and JAV-Immuno score | Cell type | Immune compartment | Immune process | |||||||||||||
|---|---|---|---|---|---|---|---|---|---|---|---|---|---|---|---|---|
| Gene | Gene description | Statistic value | p value | q value | Endothelial cell | Fibroblast | B cell | Monocyte | Natural killer cell | Dendritic cell | Cytotoxic T cell | Lymph node | Germinal center | MHC class I antigen presentation | MHC class II antigen presentation | Response to stress |
| POU2F2 | POU class 2 homeobox 2 | 0.8141921 | 2.75E−135 | 4.96E−134 | 0.09011 | 0.2449 | 0.2558 | 0.2563 | 0.228 | 0.2125 | 0.02845 | 0.09261 | 0.09931 | 0 | 0.04072 | 0.004806 |
| MBNL1 | Muscle blindlike splicing regulator 1 | 0.6073972 | 2.31E−58 | 2.77E−57 | 0.2185 | 0.222 | 0.2186 | 0.2325 | 0.07344 | 0.04999 | 0.02845 | 0 | 0 | 0.008677 | 0.008505 | 0.1479 |
| ABI3BP | ABI family member 3 binding protein | 0.5517624 | 2.09E−46 | 1.88E−45 | 0.212 | 0.2435 | 0.2236 | 0.1964 | 0.1889 | 0.1974 | 0.02832 | 0.07382 | 0 | 0 | 0 | 0 |
| VPS13C | Vacuolar protein sorting 13 homolog C | 0.4595461 | 6.43E−31 | 4.63E−30 | 0.07422 | 0.1806 | 0.05065 | 0.06594 | 0.06424 | 0.05733 | 0.02213 | 0 | 0 | 0 | 0 | 0 |
| SUCNR1 | Succinate receptor 1 | 0.4390713 | 4.48E−28 | 2.69E−27 | 0.2147 | 0.2118 | 0.1985 | 0.2108 | 0.2092 | 0.208 | 0.15 | 0.09239 | 0 | 0.003451 | 0.00712 | 0.0858 |
| RSAD2 | Radical S-adenosyl methionine domain containing 2 | 0.3267927 | 1.49E−15 | 6.72E−15 | 0.2266 | 0.2148 | 0.234 | 0.2137 | 0.2234 | 0.229 | 0.1652 | 0.09274 | 0.07864 | 0 | 0.06117 | 0.1613 |
| CMPK2 | Cytidine/uridine monophosphate kinase 2 | 0.2787244 | 1.47E−11 | 5.89E−11 | 0.2066 | 0.2194 | 0.2099 | 0.2243 | 0.1865 | 0.2063 | 0.1437 | 0.07898 | 0.06812 | 0 | 0.0499 | 0.08855 |
| PI4KA | Phosphatidylinositol 4-kinase alpha | 0.152742 | 0.000265 | 0.000954 | 0.2101 | 0.2087 | 0.2186 | 0.1967 | 0.197 | 0.04704 | 0.02591 | 0 | 0 | 0.01603 | 0 | 0 |
| RNF144A | Ring finger protein 144A | 0.1471635 | 0.000444 | 0.00145 | 0.09449 | 0.2008 | 0.1847 | 0.1624 | 0.06401 | 0.1495 | 0.08942 | 0.07085 | 0.01967 | 0 | 0 | 0 |
| CPEB1 | Cytoplasmic polyadenylation element binding protein 1 | 0.1458114 | 0.000502 | 0.0015 | 0.1894 | 0.2084 | 0.1893 | 0.1863 | 0.07279 | 0.05963 | 0 | 0 | 0 | 0 | 0 | 0.01358 |
| NPY4R | Neuropeptide Y receptor Y4 | 0.1201768 | 0.00419 | 0.00944 | 0.04041 | 0.1401 | 0.1273 | 0.1208 | 0.1318 | 0.03498 | 0 | 0 | 0 | 0.003384 | 0 | 0 |
| ZNF573 | Zinc finger protein 573 | 0.1156841 | 0.00586 | 0.0113 | 0.06559 | 0.1173 | 0.1437 | 0.1506 | 0.1212 | 0.09401 | 0.04908 | 0.02246 | 0 | 0.005744 | 0 | 0 |
| SNAP29 | Synaptosome associated protein 29 | 0.1154207 | 0.00598 | 0.0113 | 0.2049 | 0.1919 | 0.06076 | 0.06829 | 0.06407 | 0.04174 | 0.02845 | 0 | 0 | 0.006851 | 0.005367 | 0.1535 |
| ZNF781 | Zinc finger protein 781 | 0.1124934 | 0.00739 | 0.0121 | 0.1024 | 0.0865 | 0.1235 | 0.08621 | 0.09041 | 0.04321 | 0.005367 | 0.04858 | 0 | 0.003986 | 0.002624 | 0.000162 |
| SLC38A7 | Solute carrier family 38 member 7 | 0.0978701 | 0.0199 | 0.0286 | 0.1976 | 0.05722 | 0.192 | 0.06142 | 0.05257 | 0.03522 | 0.02277 | 0 | 0 | 0 | 0 | 0.08463 |
| DEDD2 | Death effector domain containing 2 | 0.0966533 | 0.0215 | 0.0297 | 0.08156 | 0.1777 | 0.1756 | 0.1643 | 0.1515 | 0.146 | 0.1052 | 0.06802 | 0 | 0 | 0.02047 | 0.06925 |
| C2CD4B | C2 calcium dependent domain containing 4B | 0.0826085 | 0.0495 | 0.066 | 0.2162 | 0.1775 | 0.154 | 0.1431 | 0.1367 | 0.05737 | 0.01532 | 0.0178 | 0 | 0 | 0 | 0 |
| TMEM14E | transmembrane protein 14E, pseudogene | 0.0678954 | 0.107 | 0.137 | 0.03418 | 0.0232 | 0.0338 | 0.03111 | 0.04544 | 0.02271 | 0.004312 | 0 | 0 | 0 | 0 | 0 |
| MMP16 | Matrix metallopeptidase 16 | 0.0639516 | 0.129 | 0.16 | 0.2134 | 0.2523 | 0.2056 | 0.2038 | 0.2085 | 0.06526 | 0.007903 | 0.09234 | 0 | 0 | 0 | 0 |
| LZTR1 | Leucine zipper like transcription regulator 1 | 0.0550683 | 0.191 | 0.222 | 0.2021 | 0.1965 | 0.06215 | 0.1714 | 0.2034 | 0.03179 | 0.01318 | 0.08179 | 0 | 0.007257 | 0.008901 | 0.006873 |
| RPS17 | Ribosomal protein S17 | 0.0165515 | 0.694 | 0.757 | 0.2079 | 0.183 | 0.2076 | 0.2269 | 0.2022 | 0.179 | 0.1641 | 0 | 0 | 0.03428 | 0.07347 | 0.1058 |
| CNBD1 | Cyclic nucleotide binding domain containing 1 | 0.0040582 | 0.923 | 0.923 | 0.1355 | 0.1114 | 0.1151 | 0.1164 | 0.1073 | 0.09581 | 0.01741 | 0.04782 | 0 | 0.003208 | 0.003264 | 0.00432 |
| C2CD4A | C2 calcium dependent domain containing 4A | −0.004789 | 0.909 | 0.923 | 0.171 | 0.1587 | 0.1331 | 0.1213 | 0.1156 | 0.05684 | 0.004867 | 0.04788 | 0 | 0 | 0.003982 | 0.08443 |
| DCAF4L2 | DDB1 and CUL4 associated factor 4 like 2 | −0.008794 | 0.835 | 0.884 | 0.06324 | 0.03736 | 0.06659 | 0.09815 | 0.1282 | 0.05735 | 0 | 0.06016 | 0 | 0.00528 | 0.01013 | 0.00442 |
| ZNF526 | Zinc finger protein 526 | −0.048678 | 0.248 | 0.279 | 0.1291 | 0.1437 | 0.07571 | 0.06573 | 0.04032 | 0.03047 | 0.004803 | 0 | 0 | 0 | 0 | 0 |
| CNOT1 | CCR4-NOT transcription complex subunit 1 | −0.055119 | 0.19 | 0.222 | 0.0678 | 0.21 | 0.2023 | 0.2026 | 0.03454 | 0.1721 | 0.01716 | 0 | 0 | 0.01848 | 0.003042 | 0.09112 |
| ZFP30 | ZFP30 zinc finger protein | −0.098922 | 0.0186 | 0.0279 | 0.1219 | 0.1227 | 0.1167 | 0.1308 | 0.1257 | 0.07336 | 0.02253 | 0 | 0 | 0 | 0 | 0 |
| ZNF607 | Zinc finger protein 607 | −0.110554 | 0.00848 | 0.0133 | 0.04603 | 0.0471 | 0.06989 | 0.08244 | 0.1002 | 0.03778 | 0.0391 | 0.02276 | 0 | 0.004409 | 0.003307 | 0.01889 |
| GPRIN2 | G protein regulated inducer of neurite outgrowth 2 | −0.112585 | 0.00734 | 0.0121 | 0.06067 | 0.1465 | 0.1516 | 0.03462 | 0.1517 | 0.04801 | 0.00213 | 0.05896 | 0.02013 | 0 | 0.01973 | 0.00166 |
| TFG | Trafficking from ER to golgi regulator | −0.114673 | 0.00631 | 0.0114 | 0.2094 | 0.1879 | 0.2205 | 0.2067 | 0.06115 | 0.02826 | 0.02845 | 0.08952 | 0 | 0.003158 | 0.00423 | 0.005551 |
| SERPIND1 | Serpin family D member 1 | −0.116083 | 0.00569 | 0.0113 | 0.2145 | 0.1994 | 0.189 | 0.1905 | 0.05945 | 0.1672 | 0 | 0.09033 | 0 | 0 | 0.004157 | 0.1498 |
| CRKL | CRK like proto-oncogene, adaptor protein | −0.130329 | 0.00189 | 0.00454 | 0.2009 | 0.2036 | 0.2249 | 0.1969 | 0.2029 | 0.1667 | 0.0242 | 0.09401 | 0 | 0.02339 | 0.02136 | 0.02151 |
| AIFM3 | Apoptosis inducing factor mitochondria associated 3 | −0.138936 | 0.000919 | 0.00236 | 0.19 | 0.1729 | 0.05 | 0.06931 | 0.0611 | 0.05562 | 0.006126 | 0.08887 | 0 | 0.0107 | 0.004403 | 0.1262 |
| ANXA8L1 | Annexin A8 like 1 | −0.14415 | 0.000582 | 0.00161 | 0.1466 | 0.1922 | 0.1392 | 0.1212 | 0.1354 | 0.1276 | 0.02692 | 0.0607 | 0 | 0 | 0 | 0 |
| GOT2 | Glutamic-oxaloacetic transaminase 2 | −0.381291 | 5.01E−21 | 2.58E−20 | 0.2346 | 0.2296 | 0.2188 | 0.2172 | 0.07141 | 0.1993 | 0.1728 | 0.09115 | 0.07472 | 0 | 0.006362 | 0.09641 |
Table 2.
Associations between POU2F2 marker and OS. BSC, best supportive care; HR, hazard ratio; NE, not estimable; OS, overall survival; TMB, tumor mutation burden.
Table 2.
Associations between POU2F2 marker and OS. BSC, best supportive care; HR, hazard ratio; NE, not estimable; OS, overall survival; TMB, tumor mutation burden.
| Treatment | TMB | POU2F2 marker | No. of patients (N=457) | No. of events | OS, median (95% CI), months | HR (POU2F2 marker absent vs present) (95% CI) | p value |
|---|---|---|---|---|---|---|---|
| Avelumab plus BSC | ≤Median | Absent | 22 | 10 | 36.99 (18.17-NE) | 0.46 (0.240-0.894) | 0.0218 |
| Avelumab plus BSC | ≤Median | Present | 112 | 82 | 17.77 (13.34-22.34) | ||
| Avelumab plus BSC | >Median | Absent | 11 | 7 | 19.25 (17.81-NE) | 1.38 (0.623-3.048) | 0.4281 |
| Avelumab plus BSC | >Median | Present | 98 | 48 | 35.12 (26.05-NE) | ||
| BSC alone | ≤Median | Absent | 18 | 13 | 13.68 (8.8-NE) | 1.14 (0.622-2.071) | 0.6788 |
| BSC alone | ≤Median | Present | 89 | 60 | 16.07 (10.25-24.18) | ||
| BSC alone | >Median | Absent | 21 | 14 | 14.78 (11.5-NE) | 1.14 (0.635-2.044) | 0.6608 |
| BSC alone | >Median | Present | 86 | 58 | 17.81 (13.54-26.64) |
Disclaimer/Publisher’s Note: The statements, opinions and data contained in all publications are solely those of the individual author(s) and contributor(s) and not of MDPI and/or the editor(s). MDPI and/or the editor(s) disclaim responsibility for any injury to people or property resulting from any ideas, methods, instructions or products referred to in the content. |
© 2025 by the authors. Licensee MDPI, Basel, Switzerland. This article is an open access article distributed under the terms and conditions of the Creative Commons Attribution (CC BY) license (http://creativecommons.org/licenses/by/4.0/).
Copyright: This open access article is published under a Creative Commons CC BY 4.0 license, which permit the free download, distribution, and reuse, provided that the author and preprint are cited in any reuse.


