
Submitted:
10 April 2025
Posted:
11 April 2025
You are already at the latest version
Abstract
Epilepsy is a neurological disorder that affects millions of people worldwide and causes severe suffering. By providing opportunities for early intervention and seizure management, early detection of seizures can significantly enhance the quality of life for epileptic patients. Over the past few decades, significant efforts have been made to explore non-invasive methodologies for predicting seizures. Recent advancements have highlighted the potential of Electrocardiogram (ECG), particularly Heart Rate Variability (HRV) analysis, as a valuable biomarker for seizure prediction. However, the effectiveness of these approaches can vary, making it difficult to select the most appropriate strategy. Unlike previous reviews that have mostly focused on methods related to HRV analysis from medical perspectives, we aim to provide a comprehensive review of the machine learning techniques that have been applied to ECG data for predicting epileptic seizure attacks. In this study, we explore the relationship between the cardiovascular system and seizure activity, including the physiological effects of epileptic seizures and their implications for predictive modeling. Additionally, we provide a detailed comparison of available seizure prediction techniques, including a review of public datasets, common methodologies, key components, and evaluation metrics. Finally, the study highlights the strengths and limitations of various approaches while discussing existing challenges and future opportunities. We believe our work lays a basis for developing more sophisticated methods on utilizing the ECG signal for better seizure prediction.
Keywords:
epilepsy
; seizure prediction
; electrocardiogram
; Hear Rate Variability
; classification
; anomaly detection
1. Introduction
Epilepsy is a chronic condition that affects the central nervous system, leading to a tendency of the brain to produce sudden, excessive, and uncontrolled bursts of electrical activity, resulting in seizures [1]. In spite of advances in medical treatment, there is still a substantial percentage of epileptic patients who continue to experience seizures after receiving treatment. In spite of their best efforts, many of these patients are not able to achieve complete control over their seizures, which negatively affects their quality of life. Therefore, accurate seizure prediction models and algorithms are essential in managing epileptic patients, as they allow for early intervention and better seizure management.
According to recently published literature reviews on this subject [2,3], Electroencephalogram (EEG) data have been used as a primary source of information for seizure prediction for a long time. Based on the distinctive brain electrical patterns preceding seizures, EEG-based approaches have played a pivotal role in seizure prediction research. By analyzing EEG signals, the researchers are able to estimate the pre-ictal markers that could signal an impending seizure. One such study, conducted by Ghiasvand et al. [4], utilized a combination of spectral, temporal, and spatial features with deep learning models to enhance seizure prediction. By effectively leveraging these advanced features alongside deep learning, their approach demonstrates the potential for more accurate and timely seizure prediction in clinical settings. However, the inherent variability of EEG signals, influenced by factors like patient-specific brain activity, medication, and environmental conditions poses significant challenges. Furthermore, EEG signals are highly susceptible to noise and artifacts, such as muscle movements or electrode placement issues, which can result in inaccurate measurements of the EEG signals. Additionally, long-term EEG monitoring is impractical and challenging for patients. The difficulty in consistently isolating patterns across different patients and seizure types limited the accuracy and generalizability of EEG-based models. Due to these limitations, researchers began exploring alternative data sources to develop and enhance seizure prediction models and increase their clinical applicability. Among various methods, an emerging and highly promising approach that can leverage the potential of wearable devices is the utilization of Electrocardiogram (ECG) signals [5]. The incorporation of ECG signals for seizure prediction has shown to be effective in detecting autonomic function changes minutes prior to seizure onset [6]. The ECG signal is less susceptible to artifacts associated with physical activity than the EEG signal. It can also be monitored continuously, making it an excellent choice in certain prediction scenarios. With the emergence of wearable devices equipped with ECG sensors, there have been new possibilities for seamless and non-invasive data acquisition, allowing for the development of more accurate and accessible frameworks [7]. As a result, ECG-based approaches are increasingly being investigated as an alternative method for predicting seizure activity.
The relationship between epilepsy and cardiovascular function is complex and influenced by both acute and chronic physiological changes caused by seizures. Seizures can disrupt the Autonomic Nervous System (ANS), particularly through the Central Autonomic Network (CAN), which includes cortical and subcortical brain regions responsible for regulating heart activity. This disruption can lead to acute cardiac effects such as ictal tachycardia, bradycardia, or even asystole, as well as post-ictal arrhythmias and ventricular repolarization changes. Over time, epileptic patients may experience chronic cardiac changes, including reduced Heart Rate Variability (HRV) and prolonged ventricular repolarization. These acute and chronic effects are considered significant contributors to the risk of sudden unexpected death in epilepsy, highlighting the importance of understanding and monitoring the cardiovascular implications of epilepsy [8,9]. The term HRV refers to fluctuations in the time intervals between consecutive heartbeats, which is influenced by the ANS.
In the past, several studies have demonstrated a clear link between seizures and the cardiovascular system, indicating their complex relationship. In particular, a comprehensive investigation conducted by Costagliola et al. [10], provided further insight into this association and showed that seizures have significant correlations with several cardiovascular parameters. These include HRV variations, increased susceptibility to arrhythmias, and other transient cardiac effects. These findings emphasize the profound impact of seizures on cardiac function, affecting both HRV and the potential for sudden arrhythmic events. Furthermore, several studies including those conducted by Ufongene et al. [11], Myers et al. [12], and Sevcencu et al. [13], have further explored HRV variations regarding seizure activity. These investigations have highlighted the potential of HRV as a promising biomarker for detecting autonomic function alterations during different seizure stages in epileptic patients. Additionally, Hashimoto et al. [14] demonstrated that analyzing the fluctuations in the RR interval (RRI) of heart rate can be used to predict epileptic seizures. Monitoring HRV parameters, such as RRI, makes it possible to identify changes in autonomic function and predict the occurrence of seizures, which can be valuable in effective seizure detection and prediction.
In recent years, several review papers have explored the application of machine learning techniques for seizure prediction and detection, with particular emphasis on the analysis of HRV parameters [15,16]. Furthermore, a more in-depth review by Seth et al. [17] examined cardiac parameters, such as heart rate, to investigate the development of reliable seizure detection and prediction methods using non-invasive wearable devices. Accordingly, to the authors’ knowledge, no previous review has provided a comparative analysis of these approaches from a machine learning perspective, which motivates the need for this study.
This review paper aims to provide a comprehensive analysis of current machine learning methodologies for predicting epileptic seizures. Specifically, we focus on two primary approaches:
- Classification: Studies that develop models to classify seizure states by leveraging heart rate features to discriminate initial seizure states.
- Anomaly Detection: Studies that explore anomalies in heart rate linked to pre-ictal ANS activity as early indicators of impending seizures.
For a thorough and comprehensive search of the relevant literature, we have carefully developed a search strategy. This strategy involves utilizing a combination of highly relevant keywords, including "seizure prediction", "heart rate variability", "pre-ictal identification", and "electrocardiogram". By incorporating these specific terms, we aim to optimize the efficiency and effectiveness of our search, ensuring that we capture all appropriate information in the field.
By exploiting the existing body of research, our aim is to lay a solid foundation for future investigations and identify promising avenues for further research in the field. Additionally, this study emphasizes the importance of pursuing additional research endeavors in order to maximize the efficiency and utility of ECG signals in clinical practice. By fostering a deeper understanding of the potential and limitations of utilizing heart rate data, better strategies and approaches may be developed for epileptic seizure detection, prediction, and management.
As a general outline, the paper is structured as follows. A review of the basic concepts of seizures and heart rate is presented in Section 2, along with a discussion of the different seizure prediction approaches as well as the effect of seizure type on seizure prediction. Next, in Section 3, we take a deep look at the required steps of a seizure prediction process. These steps include data acquisition, preprocessing, feature extraction and selection, and modeling, as well as metrics for evaluating and comparing results. In Section 4, we discuss the challenges and limitations associated with ECG-based seizure prediction as well as future prospects and potential research directions. Finally, in Section 5, we summarize the key findings of the paper that can lead to accurate and timely seizure prediction in the future.
2. Epileptic Seizure and Cardiovascular System
2.1. Physiological Impacts of Epileptic Seizures
Epileptic seizures can significantly impact the cardiovascular system due to complex interactions between the brain and the heart. Understanding the physiological mechanisms behind this interaction is critical for comprehending why ECG signals are useful for seizure prediction. Here’s an overview of the main reasons for this connection:
2.1.1. Autonomic Nervous System Dysfunction
The ANS plays a crucial role in regulating cardiovascular function, and seizures can disturb this regulatory mechanism. The ANS consists of the sympathetic (fight-or-flight response) and parasympathetic (rest-and-digest response) systems, which control heart rate, blood pressure, and heart rhythm. Epileptic activity in certain brain regions, particularly the insula, amygdala, and hypothalamus, which have strong links to autonomic control centers, can cause abnormal autonomic outputs during seizure stages. This dysregulation manifests itself as tachycardia, bradycardia, or even cardiac arrhythmias, which can be identified during ECG analysis [9].
During seizures, particularly generalized tonic-clonic seizures, the activation of the Sympathetic Nervous System (SNS) can cause tachycardia, increased blood pressure, and elevated HRV and potentially prolonged QT intervals, which can increase the risk of cardiac arrhythmias [18]. On the other hand, seizure activity can also provoke excessive parasympathetic (vagal) activation, leading to bradycardia and in severe cases, asystole (complete cessation of heart activity for several seconds), particularly in focal seizures. This imbalance in autonomic control highlights why seizures might manifest as cardiovascular abnormalities visible on ECG [19]. The imbalance between the sympathetic and parasympathetic responses during and after seizures underscores the critical role of the ANS in cardiovascular instability, making ECG monitoring particularly useful for predicting seizures and preventing severe outcomes like sudden unexpected death in epilepsy [20].
2.1.2. Catecholamine Surge During Seizures
Seizures trigger the release of stress hormones like catecholamines (epinephrine and norepinephrine) from the adrenal glands, which are part of the body’s response to stress. This release stimulates beta-adrenergic receptors in the heart, leading to an increased heart rate and myocardial contractility. This surge in catecholamines can be seen on ECG as prolonged QT intervals and can predispose patients to life-threatening arrhythmias [20]. These changes are particularly evident in generalized tonic-clonic seizures, which can result in excessive catecholamine release, increasing the likelihood of ventricular arrhythmias and sudden cardiac death. Consequently, due to the possibility that these ECG changes could be a sign of an impending seizure, ECG signals would be a valuable source for seizure prediction.
2.1.3. Direct Cortical and Subcortical Effects on Cardiovascular Regulation
Epileptic discharges originating from or spreading to brain regions involved in cardiovascular regulation can directly affect heart function. For example, the insular cortex plays a critical role in autonomic and cardiovascular regulation. Seizures that involve the insula can cause severe autonomic disturbances, leading to arrhythmias such as sinus tachycardia, bradycardia, or atrioventricular block [21]. As another example, the amygdala and hypothalamus, key regions involved in emotional and autonomic responses, are often implicated in seizure-related cardiovascular changes. Seizures in these areas can lead to abnormal heart rhythms and significant blood pressure fluctuations, highlighting their role in seizure-related cardiac risks [13].
2.1.4. Respiratory Compromise and Acidosis
Seizures, particularly generalized tonic-clonic types, often lead to respiratory dysfunction, which can cause hypoxemia (decreased oxygen levels in the blood) and hypercapnia (increased carbon dioxide levels). This respiratory distress can cause acidosis, a condition that further stresses the cardiovascular system. In response to hypoxemia, the heart may compensate by increasing heart rate (tachycardia) and other compensatory cardiovascular responses. In severe cases, hypoxemia may also predispose patients to arrhythmias due to increased autonomic instability and myocardial oxygen demand, which are observable on ECG [19].
2.2. Seizures Activities and Heart Rate
In seizure prediction, the primary objective is to identify patterns that can assist in predicting the likelihood of an upcoming seizure. This can greatly benefit epileptic patients as it allows them to take precautionary measures or receive prompt medical attention in order to prevent injury or minimize the effects of seizure onset. For many years, seizure prediction studies have been based on the EEG signals. Even though EEG recording devices have been substantially improved, certain limitations and disadvantages of EEG-based methods have encouraged researchers to explore alternative approaches. One such alternative method is the utilization of ECG signals, which measure the electrical activity of the heart. In recent years, researchers have discovered that ECG can also be used to provide valuable insight into seizure disorders, as specific physiological changes occur during different stages of a seizure. Indeed, studies have shown that seizures can affect the autonomic system. As a result, parasympathetic and sympathetic responses are invoked, leading to alterations in cardiac parameters such as heart rate and blood pressure [22]. Heart Rate (HR) and Heart Rate Variability (HRV) are interrelated physiological measures that offer several advantages for seizure identification compared to other biomarkers. These biomarkers can be easily measured or estimated, making them accessible and practical in clinical settings. HR represents the number of heartbeats per minute and is a fundamental indicator of cardiovascular function, whereas HRV captures variations in the intervals between consecutive heartbeats. The fluctuations in these measures can provide valuable insights into the physiological dynamics associated with seizures in the cardiovascular system. Therefore, they may serve well as indicators of impending seizure onset [23].
2.3. Seizure Stages and Heart Rate
There has been growing interest in the relationship between seizure stages and heart rate variation, as changes in autonomic function are closely associated with different stages of seizure activity [11]. Each stage of a seizure (as illustrated in Figure 1) is marked by specific physiological responses, particularly involving heart rate changes. These autonomic changes can provide valuable insights into seizure detection, prediction, and management procedures. Here is a brief overview of how seizures affect the heart rate.
2.3.1. Pre-Ictal Phase
Occurring before the onset of a seizure, pre-ictal is often accompanied by autonomic changes that could signal the approach of a seizure. One of the most common changes observed in this stage is an increase in heart rate, known as tachycardia. According to the study conducted by Sevcencu et al. [13], the heart rate of patients may be elevated minutes or even hours in advance of experiencing a seizure. This pre-ictal tachycardia is believed to be caused by the abnormal activity of the sympathetic nervous system in anticipation of the upcoming seizure. Detecting these heart rate variations early may provide an opportunity to develop predictive models which alert caregivers and patients to impending seizures, allowing early intervention and prevention.
2.3.2. Ictal Phase
During the ictal phase, when the seizure is actively occurring, heart rate changes become more pronounced and variable. Tachycardia is the most frequently observed autonomic response during this phase, with the heart rate often increasing significantly as a result of the seizure’s direct impact on the ANS. Studies, such as those conducted by Jansen et al. [24] and Sevcencu et al. [13], have shown that patients experience ictal tachycardia during seizures. This increase in heart rate can serve as a key marker for the ictal period, providing crucial information during continuous monitoring. In contrast, some seizure onsets, particularly those affecting the brain stem or vagus nerve, may lead to bradycardia (a significant slowing of the heart rate), which is relevant in cases of focal seizures or those that affect specific autonomic areas in the brain.
2.3.3. Post-Ictal Phase
The post-ictal stage follows the cessation of seizure activity and is often characterized by an initial drop-in heart rate after the heightened levels during the ictal phase. The autonomic system begins to restore balance, leading to normalization of heart rate, although fluctuations can persist depending on the severity and duration of the seizure [24].
2.3.4. Inter-Ictal Phase
The inter-ictal phase, which refers to the period between seizures, typically shows more stable heart rates. However, subtle variations in autonomic function and heart rate can still be present in some epileptic patients. These variations are often not as pronounced as during the other stages but may provide valuable data for long-term monitoring. In particular, inter-ictal HRV has been studied as a marker of autonomic dysfunction in epileptic patients [25]. The abnormal HRV patterns observed during the inter-ictal period may indicate underlying autonomic disorders, which are associated with a greater risk for epilepsy or may indicate chronic autonomic dysfunction.
2.4. Impact of Seizure Types on Prediction
In terms of the characteristics and the region of the brain they affect, seizures can be classified into various types. In general, seizures can be categorized into two main categories: focal seizures and generalized seizures [26]. Focal seizures, also known as partial seizures, originate in a specific region of the brain and have the potential to spread to other parts. On the other hand, generalized seizures are characterized by widespread neuronal activity throughout the brain from the moment the seizure begins. These two types can further be sub-classified into various seizure sub-types, each having unique attributes and underlying mechanisms [27].
Several studies have examined the effects of seizure type on heart rate dynamics. The effects of seizures on the heart rate patterns and the activity of the ANS are dependent on the type of seizure. In a review conducted by Eggleston et al. [28], focal seizures were found to be associated with specific cardiac alterations preceding seizure onset, including increased heart rate complexity and sympathetic activity. Similarly, generalized seizures, although less studied, have also been linked with a significant increase in heart rate. By incorporating the patterns in heart rate associated with different seizure types, researchers can propose effective approaches for early seizure detection with enhanced precision and effectiveness.
3. Epileptic Seizure Prediction
In previous studies, it has been shown that seizure prediction can be achieved using ECG signals in two main ways: discriminating between inter-ictal and pre-ictal intervals, and identifying the pre-ictal stage of the seizure. The first approach focuses on recognizing the difference between inter-ictal and pre-ictal intervals. This process involves selecting a pre-ictal interval, extracting HRV features, and applying classification methods to identify patterns indicative of an impending seizure. This approach requires careful consideration of several factors, such as choosing the appropriate pre-ictal interval and selecting relevant HRV features to optimize prediction accuracy. As an alternative approach, we can apply anomaly detection methods to identify the pre-ictal interval to discover abnormal patterns that may signal impending seizure onsets. This involves training on a dataset of normal data to establish baseline patterns. These baseline patterns are then used to detect deviations in real-time, which may indicate the onset of an upcoming seizure.
In this section, we cover the main components and steps of developing a seizure prediction procedure. As shown in Figure 2, we begin by discussing the techniques used to prepare the input signal for analysis. Next, we analyze the process of extracting and selecting features from ECG signals. Afterward, we examine the different approaches and algorithms used for seizure prediction and highlight their strengths and weaknesses through introducing different evaluation metrics.
3.1. Data Acquisition
In order to ensure the accuracy of seizure prediction models, quality and diversity of the datasets used for training as well as validation are important factors. To establish an ideal scenario, it is essential to acquire datasets that contain a rich collection of EEG or ECG signal recordings, accurately synchronized with seizure events. These datasets should encompass a wide range of modalities and be sourced from a diverse and sizable population of patients. Additionally, it is crucial to include comprehensive information about the specific types of seizures experienced by each individual. Including these elements will enhance seizure prediction and analysis accuracy by providing a more comprehensive and representative dataset. However, it should be noted that although many of the presented datasets may be of high quality and representative, there can still be considerable variation in their final quality. Factors such as the number and duration of recordings, sampling frequency, and methods used for identifying and categorizing seizure events can significantly impact dataset quality. Therefore, to ensure the validity and generalizability of seizure prediction models, careful selection and thorough analysis of datasets are imperative.
A number of relevant datasets are currently used by researchers in the field. Some of them are publicly available, e.g., the University of Siena dataset [29,30,31] and the Post-Ictal Heart Rate Oscillations in Partial Epilepsy (PIHROPE) dataset [31,32]. These datasets provide valuable data for studying seizure dynamics and developing predictive models. On the other hand some datasets are not publicly available, such as those from the European Database on Epilepsy (EPILEPSIA) [33,34], Tokyo Medical and Dental University (TMDU) [35], and University Hospital of Heraklion [36]. These restricted datasets often contain detailed clinical information and are used in more controlled research settings. Detailed information regarding the size and specifications of these databases is summarized in Table 1.
3.2. Data Preprocessing
The ECG signal is a non-invasive and periodic measurement that captures time-varying trends, providing crucial diagnostic information about the heart’s function [37]. As illustrated in Figure 3, the ECG signal is consists of a complex called PQRST, which includes several distinct peaks and valleys, representing the electrical activity of different parts of the heart. However, these signals are often contaminated by various types of noise and artifacts. As a result, preprocessing is essential to remove these unwanted components and improve signal quality for more accurate analysis and diagnosis. In the following sections, we will explore the key steps involved in preprocessing ECG signals.
3.2.1. Denoising and Filtering
ECG signals are susceptible to various types of noise, which can severely impact diagnosis accuracy and abnormality detection. The most common sources of noise in ECG signals include powerline interference, Electromyographic (EMG) noise, baseline wander, and electrode motion artefacts [38].
A variety of signal processing techniques have been employed to mitigate noise effects in ECG signals. These techniques include the use of digital filters, Empirical Mode Decomposition (EMD), and Wavelet Transforms [39]. Generally, filters are used to remove noise based on frequency characteristics, whereas EMD is effective for denoising non-stationary signals. Additionally, Wavelet Transforms have shown to be effective in reducing noise and enhancing the identification of features within ECG signals [40]. Recent advances in machine learning and deep learning algorithms have opened up a number of new avenues for denoising ECG signals. These algorithms have demonstrated remarkable outcomes, resulting in substantial enhancements in improving diagnosis and detection accuracy. For instance, Romero et al. [41], employed Fully Convolutional Networks (FCN) within their study to effectively eliminate baseline wander noise. Similarly, Nurmaini et al. [42], applied Stacked Denoising Autoencoders as a noise reduction phase for ECG heartbeat classification.
Table 2 presents a comprehensive summary of the prevalent types of noise in ECG signals, including their sources, frequency ranges, and common approaches for mitigating them.
3.2.2. Data Segmentation
Identifying meaningful features from time series is the key to analyzing ECG signals. In addition to reducing artifacts and noise in ECG analysis, segmentation allows shorter time intervals to detect changes in the ANS associated with specific physiological conditions.
In the field of signal segmentation, sliding window techniques are typically used, in which a window moves along the time series and ECG related features (such as HRV) are extracted from each window. Choosing the right window size affects the trade-off between temporal resolution and accuracy [43]. In ECG analysis, researchers often test different window sizes and assess their performance using trial-and-error [14]. Typical window sizes for analysis are anything between three and five minutes. This is because ECG signals can capture short-term changes in the ANS [44,45].
3.2.3. Pre-Ictal Interval Selection
Seizure prediction using classification methods requires identification of the pre-ictal interval. The pre-ictal interval refers to the time between the onset of certain symptoms and the occurrence of a seizure. In general, pre-ictal intervals differ from patient to patient, and it is not possible to establish a standard pre-ictal interval that can be applied to all patients. As a result, it is essential to determine the pre-ictal interval for each patient in order to improve the accuracy of seizure prediction. Most studies such as the one conducted by Bandarabadi et al. [46] on seizure prediction have focused on using EEG data to estimate the pre-ictal interval. However, in recent studies such as [47,48], the use of ECG data for identifying the pre-ictal intervals have been explored. Even though these methods appear promising, they still require further investigation and testing to evaluate their effectiveness and reliability.
3.3. Feature Extraction
Feature extraction involves detecting the interval between successive R-peaks in the ECG signal. In some cases, some abnormal or ectopic beats might be incorrectly identified as R-peaks, so the output of this stage may require to be corrected. Finally, features can be extracted from the detected heartbeats.
3.3.1. RR Interval Detection
Heart rate is a physiological parameter that indicates the activity of the ANS and can be calculated from the interval between successive heartbeats, as shown by the RR interval or the normal form of it, called Normal-to-Normal Interval (NNI). An important measure of ANS activity is HRV which measures the variation between successive heartbeats. From the HRV signal, features including time domain, frequency domain, time-frequency domain, and non-linear domain measurements can be extracted [49,50]. These features can be used to diagnose abnormal heart rhythms and other cardiac conditions that are useful in seizure prediction.
Over the years, as the field is constantly evolving, several methods have been proposed for RRI detection. Review papers like those published by Maghfiroh et al. [51] and Amani et al. [52] provide an overview of traditional and modern methods for detecting RRIs. The traditional methods of peak detection include template matching [53], peak detection algorithms such as the Pan-Tompkins algorithm [54], adaptive thresholding [55], and wavelet transform [56], whereas the newer methods of peak detection include the use of machine learning and deep learning algorithms, such as convolutional neural networks [57] and autoencoders [58]. Despite the fact that machine learning methods have shown promising results in RRI detection, peak detection and thresholding algorithms, such as the Pan-Tompkins algorithm and its variations [59,60], remain a common approach to this task due to their simplicity and computational efficiency.
Moreover, it should be noted that traditional methods are sensitive to noise and may not perform well in certain situations [61]. Therefore, researchers continue to study and refine both traditional and modern RRI detection methods. When assessing these methods, factors such as the application type and the quality of the ECG signal should be taken into account.
3.3.2. RR Interval Correction
Analyzing HRV is a difficult task due to the presence of noise and artifacts, such as ectopic beats. This may result in error in R-peak detection. Consequently, these errors must be corrected in order to be able to carry out an accurate analysis of the RR interval series. Previous reviews by Nabil et al. [62] and Peltola et al. [63] have emphasized the importance of RR interval correction and outlined various effective methods. These methods include the deletion of incorrect data [64], the use of interpolation algorithms [65] such as linear, cubic spline, and non-linear predictive interpolation, as well as outlier detection [66] and adaptive filtering [67]. The use of these comprehensive techniques provides researchers with reliable HRV data that can be used for a wide range of clinical and research purposes.
3.3.3. HRV Features
As illustrated in Figure 4, HRV features are categorized into four primary groups: time domain, frequency domain, time-frequency domain, and non-linear features. Each of these groups captures different aspects of heart rate fluctuations and provides valuable insights into ANS function [49]. These types of features can find numerous applications across diverse fields in healthcare and medical research. In particular, they have been extensively employed for seizure detection and prediction [50] to estimate the outcomes in patients with various conditions.
Time Domain Features
These features provide valuable insight into ANS function and are widely utilized due to their simplicity. Therefore, they are effective measures for monitoring changes in heart rate over time, and they can also be used to assess the overall health of cardiovascular system. According to a previous review conducted by Pham et at. [50], time domain features are typically calculated using deviation-based, difference-based, or geometric methods.
- Deviation-based features are based on the deviations between Interbeat Intervals (IBIs) from a moving average. These features can provide insight into the balance between the sympathetic and parasympathetic nervous systems.
- Difference-based features make use of variations or differences between successive heart rate intervals. An analysis of these features may be useful for determining the patterns and trends of changes in HRV over time.
- Geometric features analyze the geometric patterns and structures of HRV and provide valuable knowledge about the overall dynamics of HRV, including short-term and long-term variations.
Table 3 highlights significant time domain features and their corresponding characteristics.
Frequency Domain Features
These features refer to the analysis of HRV in the frequency domain, which is done by decomposing the HRV signal into different frequency bands, typically by using spectral analysis techniques such as the Fourier transform or the autoregressive model. These frequencies are commonly classified as high-frequency (HF), low-frequency (LF), and very-low-frequency (VLF). It is believed that the HF band is primarily influenced by parasympathetic (vagal) activity, reflecting respiratory sinus arrhythmia modulation by HRV. The LF band is influenced by both sympathetic and parasympathetic activity and is regarded as an indicator of sympathetic (vagal) balance. VLF is primarily affected by sympathetic activity, suggesting that this band may reflect long-term regulation mechanisms [49].
According to Pham et al. [50], frequency domain features are divided into absolute power and normalized power. Absolute power refers to the amount of power present within every frequency band, whereas normalized power illustrates the percentage of power within each frequency band as compared to the total power within all frequency bands. Table 4 highlights significant frequency domain features and their corresponding characteristics.
Time-Frequency Domain Features
Time-frequency analysis involves a range of techniques that combine the time and frequency domains to provide a more detailed understanding of HRV patterns. These techniques allow us to explore changes in HRV over time and their relationship to specific frequencies in a highly detailed manner, which would not be possible by analyzing the time or frequency domains alone [68].
One commonly used time-frequency technique in HRV analysis is the Short-Time Fourier Transform (STFT), which analyzes the changes in the frequency content of the HRV signal over short time intervals. Another technique is the Wavelet Transform, which enables us to analyze HRV at different scales by decomposing the signal into a series of wavelets. By employing these techniques, we can gain valuable insights into the dynamics of the ANS, such as the underlying mechanisms of HRV. This can be used to enhance our understanding of the cardiovascular system and detect early signs of diseases before they manifest by developing personalized and predictive models [50].
Non-Linear Domain Features
These types of features are a set of measures that assess the complex and non-linear dynamics of the ANS, which is responsible for regulating HRV [49]. Unlike traditional time and frequency domain HRV measures, which rely on linear analysis methods, non-linear features use advanced mathematical techniques to capture the detailed patterns of HRV signals. Examples of non-linear HRV features include approximate entropy, sample entropy, detrended fluctuation analysis, and Poincaré plot measures such as the short-term fractal scaling exponent [50]. The Poincaré plot is a two-dimensional graph that plots each RR interval against the preceding RR interval [69]. The plot’s shape can reveal patterns of HRV, such as whether the variability is primarily due to parasympathetic or sympathetic activity, and whether the variability is random or follows a specific pattern. From the Poincaré plot, it is also possible to derive two non-linear HRV features called the Cardiac Sympathetic Index (CSI) and the Cardiac Vagal Index (CVI). These features are derived from the plot’s ellipse shape and provide additional insight into the non-linear dynamics of the ANS. CSI measures sympathetic activity, while CVI measures parasympathetic activity, and both provide valuable information about autonomic balance [23].
In general, non-linear HRV measures are based on concepts such as complexity, randomness, and self-similarity, which reflect the complex and irregular nature of the ANS that traditional linear HRV measurements cannot capture. Furthermore, non-linear HRV measures can help detect subtle changes in autonomic function that are difficult to detect using other methods.
It should be noted that non-linear HRV analysis is a complex and computationally intensive process, which may require specialized software. However, with the availability of advanced analytical tools and computational resources, non-linear HRV analysis is becoming more accessible to researchers and clinicians, potentially improving our understanding of how the ANS interacts with health [49]. A summary of the most important non-linear features is presented in Table 5.
3.4. Feature Selection
Feature selection is the process of choosing the most relevant features from a dataset to build a model. This is important because the more irrelevant features a model has, the more prone it is to overfitting and potentially making incorrect predictions. One commonly used feature selection method in HRV analysis is Principal Component Analysis (PCA). PCA is a mathematical technique that involves transforming a large set of variables into a smaller set of uncorrelated variables, known as principal components [70]. This can help reduce the dimensionality of the dataset and make it easier to identify the most relevant features.
There are several other feature selection methods that can also be used in HRV analysis. For example, Stepwise Regression Analysis (SRA) is a method that involves adding or removing features from a model based on their statistical significance in regression [71,72]. This can help identify the most relevant features for predicting seizures. Another method is Minimum Redundancy Maximum Relevance (MRMR), which involves selecting features that have a high degree of correlation with the target variable but are minimally redundant with each other [73]. This can help ensure that the selected features provide unique information and are not highly correlated with each other. In non-parametric statistics, Kruskal-Wallis is used to identify the most significant features based on their ability to show differences between groups [74].
By applying appropriate feature selection methods, HRV analysis can accurately identify the most relevant features for predicting seizures.
3.5. Seizure Prediction Models
The topic of seizure prediction has long captivated the medical community due to its potential to significantly improve the quality of life for epileptic patients. Recent studies, as illustrated in Figure 5, have highlighted two primary approaches to seizure prediction. The majority of these studies have primarily focused on anomaly detection methods, which typically utilize statistical techniques to identify abnormal patterns in physiological signals indicative of pre-ictal intervals. In contrast, the second approach employs classification methods to distinguish between different stages of seizure activity, such as inter-ictal, pre-ictal, and ictal stages. This approach aims to accurately discriminate between these states, thereby providing more precise seizure predictions.
To provide a comprehensive overview of the field, Table 7 summarizes previous studies, detailing the approaches used and the results reported in the literature. This analysis outlines the various strategies for achieving accurate seizure prediction and offers valuable insights into advancements in this field. By examining the range of methodologies and their outcomes, researchers and clinicians can better understand the current state-of-the-art and identify potential directions for future research and development. In the remainder of this section, we will first discuss the key evaluation metrics commonly used to assess seizure prediction methods. We will then provide a comprehensive analysis of both primary approaches, exploring their underlying mechanisms, evaluating their strengths and limitations, and discussing the challenges encountered during their implementation.
3.5.1. Performance Evaluation
Evaluating the performance of a seizure prediction model is essential for comparing it to previous works and identifying areas for improvement. Various metrics can be used to assess the effectiveness of a model, including accuracy, precision, recall, specificity, sensitivity, false positive rate (FPR), and F-measure [75,76].
To facilitate a comprehensive understanding of these metrics, Table 6 presents a summary of their definitions and commonly used formulas for evaluating seizure prediction models. In addition to the commonly used evaluation metrics, Seizure Occurrence Period (SOP) and Seizure Prediction Horizon (SPH) should be considered for a comprehensive analysis [77]. While these metrics may be less commonly employed and monitored, they provide valuable insights into seizure prediction over time. As illustrated in Figure 6, SOP refers to the specific time window during which a seizure is expected to occur. It provides a defined interval for predicting the seizure onset. On the other hand, SPH measures the duration between the anticipated seizure and its actual onset. These metrics play crucial roles in understanding the temporal aspects of seizure prediction and providing insights into the accuracy and efficiency of predictions.

Table 6.
The Evaluation Metrics of Seizure Prediction Models
| Metric | Definition | Formula |
|---|---|---|
| Accuracy | Percentage of correct predictions out of total predictions | |
| Precision | Percentage of true positive predictions out of all positive predictions | |
| Recall (Sensitivity) | Percentage of true positive predictions out of all actual positive cases | |
| Specificity | Percentage of true negative predictions out of all actual negative cases | |
| False Positive Rate (FPR) | Percentage of false positive predictions out of all actual negative cases | |
| F-measure | Harmonic mean of precision and recall |
Note: The TP and TN refer to the number of positive and negative instances that have been correctly classified. Meanwhile, the FP and FN indicate the number of misclassified cases of positive and negative classification, respectively.
Table 7.
A detailed overview of studies conducted in the past.
| Authors | Year | Dataset | Patients | Features | Feature Selection | Window Size | Model | Evaluation | Detection time prior to onset | ||
|---|---|---|---|---|---|---|---|---|---|---|---|
| Specificity (%) | Sensitivity (%) | FPR (hr) | |||||||||
| Pre-Ictal Identification using Anomaly Detection Methods | |||||||||||
| Hashimoto et al. [14] | 2013 | TMDU | 5 | meanHR, SDNN, RMSSD, NN50, pNN50, HTI Total Power, LF, HF, LF/HF |
- | 3 min | Multivariate Statistical Process Control | - | - | - | At least one minute |
| Fujiwara et al. [78] | 2014 | TMDU | 5 | meanHR, SDNN, RMSSD, NN50, HTI Total Power, LF, HF, LF/HF |
- | 3 min | One-Class SVM | - | - | - | At least three minutes |
| Fujiwara et al. [79] | 2016 | Local | 14 | meanHR, SDNN, RMSSD, NN50 Total Power, LFnu, HFnu, LF/HF |
PCA | 3 min | Multivariate Statistical Process Control | - | 91% | 0.7/h | Up to 15 minutes |
| Behbahani et al. [80] | 2016 | EPILEPSIA | 16 | mean RRI HF, LF, LF/HF SD2/SD1 |
- | 5 min | Thresholding | - | 78.59% | 0.21/h | - |
| Smirnov et al. [81] | 2017 | Local | 31 | meanHR, SDNN, RMSSD, NN50 Total Power, LFnu, HFnu, LF/HF |
- | 3 min | One-Class SVM | 92% | 100% | - | - |
| Moridani et al. [82] | 2017 | PIHROPE | 7 | meanHR LF, HF, LF/HF Poincaré plot features |
- | 5 min | Thresholding | 86.20% | 88.30% | - | - |
| Yamakawa et al. [45] | 2020 | Local | 7 | meanHR, SDNN, RMSSD, NN50 Total Power, LF, HF, LF/HF |
- | 3 min | Multivariate Statistical Process Control | - | 85.70% | 0.62/h | About five minutes |
| Gagliano et al. [83] | 2020 | Local | 9 | meanHR, SDNN, RMSSD, NN50, pNN50, SDSD | - | - | 2-Class K-Means | - | - | - | Between 3.5 and 6.5 minutes |
| Ode et al. [84] | 2022 | Local | 39 | RRI | - | 45 sec | Self-Attentive Autoencoder | - | 74% | 0.85/h | - |
| Karasmanoglou et al. [85] | 2023 | PIHROPE | 7 | RMSSD SampEn, Poincaré Plot Features, KFD LF, HF, LF/HF, LFPeak, HFPeak |
PCA | - | Local Outlier Factor Minimum Covariance Determinant One-Class SVM |
93.1% 87.8% 96.6% |
95.6% 91.1% 92.4% |
- | Between 6 and 30 minutes |
| Behbahani et al. [69] | 2024 | EPILEPSIA | 16 | Poincaré Plot | - | 1-6 min | Thresholding | - | 80.42%, 75.19% | 0.15 | - |
| Discrimination between Inter-Ictal and Pre-Ictal using Classification Methods | |||||||||||
| Popov et al. [47] | 2017 | Local | 14 | 112 Features including Statistical Features Power Spectral Density-Based Features Non-Linear Features |
- | 1-10 min | SVM | 72.52% | 72.52% | - | - |
| Pavei et al. [48] | 2017 | Local PIHROPE |
12 | SDNN, RMSSD LF, HF SampEn, CSI and CVI from Lorenz Plot |
PCA | - | SVM | - | 94.10% | 0.49 | - |
| Billeci et al. [86] | 2018 | Siena | 15 | 20 Features including Statistical Features Frequency Features Non-Linear Features |
SRA | 3 min 1 min overlap |
Cost-Sensitive SVM | 89.34% | 89.06% | 0.41 | - |
| Giannakakis et al. [36] | 2019 | Heraklion | 9 | SDNN Total Power, LF/HF, LFnu, HFnu |
MRMR | - | SVM | Accuracy of 77.1% | 21.8 seconds | ||
| Perez-Sanchez et al. [87] | 2020 | PIHROPE | 7 | Wavelet Packet Transform (WPT) 17 Statistical Time Features |
KW | 1 min | Decision Tree | Accuracy of 100% | 15 minutes | ||
| Hadipour et al. [88] | 2021 | PIHROPE | 7 | meanHR, SDNN, RMSSD, total power past, next RRI, meanRRI, Five past Plus Five next RRI |
- | Assess iteratively | LSTM | 92% | 99% | - | - |
| Perez-Sanchez et al. [89] | 2024 | PIHROPE | 7 | Wavelet Packet Transform, Homogeneity Index | KW | 1 min | KNN | Accuracy of 93.25% | 20 minutes | ||
3.5.2. Anomaly Detection
It has been confirmed that seizure attacks can have an impact on the ANS, which can affect the heart rate. Therefore, monitoring heart rate data can provide valuable insights into predicting seizure onset. As previously discussed, certain changes during the pre-ictal interval can signal an impending seizure. By training a model on normal heart rate data and assessing its performance on data preceding a seizure, effective prediction methods can be developed to alert patients or caregivers in advance.
Hashimoto et al. [35] were among the first to explore HRV features for seizure prediction. They extracted HRV time and frequency domain features from the TMDU dataset and employed Multivariate Statistical Process Control (MSPC) to monitor seizure onsets [14]. They observed significant changes in RR intervals (RRIs) shortly after seizure onset, underscoring the influence of seizures on the ANS. Building on this, Fujiwara et al. [78] improved seizure prediction by employing a One-Class Support Vector Machine (OCSVM) to capture non-linear boundaries, extending the prediction window to at least three minutes before seizure onset. In a subsequent study, Fujiwara et al. [79], involved using Principal Component Analysis (PCA) for feature selection, which enabled the model to predict seizures up to fifteen minutes in advance.
Following these advancements, Behbahani et al. [80] introduced an adaptive decision threshold method that incorporated time and frequency domain features alongside Poincaré plot analysis. Their study demonstrated significant alterations in meanHR, RRI, LF/HF ratio, and SD2/SD1 ratio occurring 15 to 30 minutes before seizure onset, further highlighting the potential of HRV analysis for seizure prediction. Expanding on these findings, Smirnov et al. [81] applied Singular Value Decomposition (SVD) to preprocess features and tested an OCSVM model with various window sizes. They achieved a sensitivity of 100% and a specificity of 92% for a window size of 6 to 7 minutes. Similarly, Moridani et al. [82] focused on identifying the optimal window size for HRV analysis in seizure prediction. By comparing features across different window sizes using a sample T-test, they found that significant changes in meanHR, SD2/SD1 ratio, and LF/HF ratio occurred 5 to 10 minutes before seizure onset. These results underscore the critical importance of selecting an appropriate window size in HRV analysis for effective seizure prediction.
Clustering is another approach commonly used in anomaly detection. Gagliano et al. [83] utilized a 2-Class K-Means algorithm to analyze pre-ictal time and frequency HRV signatures in epileptic patients. They also computed Pearson’s correlation coefficient to explore the linear correlation between HRV changes and seizure duration. The study highlighted significant variability in pre-ictal HRV changes, both between and within patients, occurring 3.5 to 6.5 minutes before seizure onset. In a similar vein, Leal et al. [44] investigated the efficacy of various clustering algorithms, including K-means, Agglomerative Hierarchical Clustering (AHC), Density-Based Spatial Clustering of Applications with Noise (DBSCAN), and Expectation-Maximization (EM) using Gaussian Mixture Models (GMMs), in analyzing HRV features in the pre-ictal state. Their findings indicated that 41% of seizures and 90% of patients showed distinguishable pre-ictal behavior, with half of the pre-ictal intervals being detected up to 40 minutes before seizure onset. These results emphasize the effectiveness of clustering methods in deepening our understanding of the pre-ictal stage and its relevance to seizure prediction and management. Further advancements were made by Behbahani et al. [69], who developed a novel method using lagged Poincaré Plots from HRV features across six different time lags. By analyzing the angles and densities of RR intervals, they identified significant HRV changes within 15 minutes of seizure onset. Utilizing a threshold-based algorithm, their approach predicted seizure onsets with a sensitivity of 80.42% for the angle feature and 75.19% for the density feature. These findings suggest that HRV analysis can be an effective alternative to traditional EEG-based methods, especially with potential applications in wearable sensor technology.
In the latest study, Karasmanoglou et al. [85], explored various anomaly detection models, including One-Class SVM (OCSVM), Minimum Covariance Determinant (MCD) estimator, and Local Outlier Factor (LOF), to assess abnormalities in the pre-ictal interval. Evaluating these models using the Area Under the Curve (AUC) metric, the OCSVM model emerged as the most effective, successfully identifying pre-ictal changes within a 3 to 30-minute window before seizure onset. These results further validate the utility of OCSVM in accurate and timely seizure prediction. Moreover, Yamakawa et al. [45] leveraged wearable devices to capture ECG data, extracting relevant features and employing MSPC to identify fundamental heart rate patterns indicative of seizures. Their model was capable of predicting seizure onset five minutes in advance, showcasing the practicality of anomaly detection methods in real-life scenarios.
Deep learning models have also demonstrated significant promise in anomaly detection. Ode et al. [84] developed a Self-Attentive Autoencoder (SA-AE) tailored for detecting abnormal heart rates. They first calculated and corrected RRIs to ensure data accuracy before applying the SA-AE model, which used reconstruction error as an anomaly score to classify data points. Their study found that deep learning models, particularly the SA-AE, were highly effective in identifying anomalies in physiological data, such as heart rate signals, providing a robust tool for seizure prediction.
3.5.3. Classification
One promising approach for seizure prediction involves using classification algorithms to distinguish between inter-ictal and pre-ictal intervals based on heart rate data. This method includes feature extraction, selection of pre-ictal intervals, and data labeling. However, the effectiveness of these models relies heavily on the availability of labeled data and the careful selection of appropriate pre-ictal intervals for accurate classification.
An initial study on this approach was conducted by Popov et al. [47]. In their study, they employed grid search to determine the optimal window size for feature extraction and pre-ictal interval selection. After analyzing heart rate data, they extracted features from both the time and frequency domains, as well as non-linear features. A Support Vector Machine (SVM) model was then developed to predict seizure onset. In the study, it was found that extending the pre-ictal interval may enhance the likelihood of accurately predicting an upcoming seizure. Building on this work, Pavei et al. [48] used a point of interest-based method [90] to identify inter-ictal and pre-ictal intervals. They extracted various features, including time and frequency domain features and non-linear features like Entropy, CSI, and CVI, from selected windows. To reduce the feature set’s dimensionality, PCA was employed for selecting the most relevant features, which were then fed into the SVM model. Using leave-one-out cross-validation, they successfully predicted seizure onset 5 minutes in advance. To further enhance this approach, Billeci et al. [86] focused on the pre-ictal interval from 15 minutes before seizure onset to the actual onset. After feature extraction, they employed stepwise regression for feature selection. To address the class imbalance in the dataset, a cost-sensitive SVM model was used as the classifier [91], resulting in improved overall performance compared to previous studies.
In a similar vein, Giannakakis et al. [36], applied Minimum Redundancy Maximum Relevance technique to reduce the feature dimension. Subsequently, a Partial Least-Squares Regression model was utilized to fit the features and generate a regressive time-series response known as the "epileptic index", which reflects heart activity that increases as a seizure approaches [92]. This index provided a significant indication of seizure onset, with meanHR, SDNN, LF/HF, LFnu, HFnu, and the upper envelope emerging as key features distinguishing between pre-ictal and ictal periods.
For further improvement, Perez-Sanchez et al. [87] employed Wavelet Packet Transform (WPT) to decompose and analyze the input signal in the time-frequency domain. They extracted statistical time features from the WPT and applied the Kruskal-Wallis test to identify the most significant features. A Decision Tree classifier was then employed, which achieved a remarkable accuracy of 100% in predicting seizures 15 minutes before their occurrence. This study demonstrated the potential of combining WPT, statistical features, and machine learning algorithms for high-accuracy seizure prediction. Expanding on these findings, Perez-Sanchez et al. [89], utilized Maximal Overlap Discrete Wavelet Packet Transform (MODWPT) to decompose ECG signals into frequency bands and then applied Homogeneity Index (HOI) to extract features from the decomposed signals. The Kruskal-Wallis analysis was then used to select the most discriminative features, which were fed into a K-Nearest Neighbors classifier. This method achieved an accuracy of 93.25% for predicting seizures 20 minutes before onset, highlighting that non-linear features selected by HOI can extend the prediction window compared to linear features.
Deep learning methods have emerged as powerful tools for classification tasks, often outperforming traditional machine learning approaches. Hadipoor et al. [88] employed wavelet transform for signal decomposition and feature extraction. These features were then input into a Long Short-Term Memory (LSTM) model, which accurately differentiated between inter-ictal and pre-ictal states, demonstrating the effectiveness of deep learning models in identifying seizure stages.
4. Discussion
4.1. Challenges and Limitations
Whether using classification or anomaly detection algorithms, several challenges and limitations are present in the field of seizure prediction using ECG signals. In this section we explore common challenges associated with both approaches.
4.1.1. Limitation of Classification-Based Approaches
One significant challenge in classification-based approaches is the issue of imbalanced datasets, where the number of seizure instances is considerably fewer than non-seizure instances [86]. This imbalance can lead to biased models that struggle to generalize well to unseen data, often favoring the majority class. Although techniques such as oversampling, downsampling, and weighted loss functions have been proposed, effectively addressing this imbalance remains an ongoing challenge. Further research is needed to develop more efficient strategies for managing imbalanced data [93]. Another limitation is the difficulty in identifying a reliable pre-ictal interval, essential for accurate seizure prediction. Despite multiple efforts to identify optimal pre-ictal intervals, variability between individuals complicates the ability to capture consistent intervals. As a result, classification-based methods lack a universally applicable fixed interval, which hinders their practicality and effectiveness in real-world applications.
4.1.2. Limitation of Anomaly Detection-Based Approaches
Anomaly detection methods also face several challenges. One of the primary issues is the difficulty in obtaining a comprehensive and representative dataset of normal heart rate patterns for training purposes. Factors such as age, health conditions, and external influences make it challenging to develop robust and accurate models. Furthermore, timely detection of anomalies is crucial for effective intervention, but current models struggle to detect subtle changes that may lead to seizure onsets. This limitation highlights the need for advanced forecasting techniques capable of capturing these subtle variations in heart rate [94]. Another challenge is finding an optimal threshold for anomaly detection. Determining the correct threshold for classifying a heart rate pattern as an anomaly involves careful consideration. If the threshold is too high, the model may miss seizures, while a low threshold could lead to an excessive number of false positives. Finding the right balance between sensitivity and specificity remains an open problem [80]. As a final point, interpreting and explaining detected anomalies in data can be challenging and complex. Anomalies can result from various factors, including physiological changes or artifacts in data collection. To achieve reliable seizure prediction, further investigation into the underlying causes of these anomalies is necessary [94].
4.2. Future Prospects
In spite of the challenges mentioned above, the future of ECG-based seizure prediction is promising. Researchers are exploring a variety of innovative approaches for improving the accuracy, personalization, and clinical applicability of ECG-based predictions. Below are some promising research directions for the future.
T-Wave Heterogeneity as a Biomarker
Recent studies suggest that T-wave heterogeneity, a measure of variability in the shape and morphology of T-waves on an ECG (see Figure 3), can serve as a reliable biomarker for predicting seizures. According to Pang et al. [95], analyzing changes in T-wave heterogeneity allows for the development of models capable of detecting pre-ictal patterns. This approach has the potential to revolutionize seizure management by providing non-invasive, early warning systems for epileptic patients, thereby enhancing their quality of life and reducing the risk of sudden unexpected death in epilepsy.
Data Labeling and Representation Learning
Advancements in data labeling and representation learning are opening new avenues for seizure prediction. Self-supervised learning models, which can autonomously learn meaningful data representations and generate labeled data from unlabeled datasets, are one of the most promising approaches. This approach significantly improves the efficiency of data annotation processes, reduces the need for extensive manual labeling, and enhances the performance of machine learning models in predicting seizures [96,97]. By leveraging these techniques, researchers can better handle the large volumes of ECG data required for training robust predictive models. Additionally, these techniques can be used to develop automated systems that can detect and alert medical professionals about upcoming seizures.
Anomaly Detection with Advanced Deep Learning Models
In traditional anomaly detection methods, complex relationships inherent in physiological data are often difficult to capture. Advanced deep learning models, such as Graph Neural Networks (GNNs), offer a powerful alternative by representing data as graphs and learning intricate connections between different entities. When applied to seizure prediction, GNNs can improve the accuracy and efficiency of detecting anomalous patterns in heart rate data, thereby enhancing early seizure prediction and enabling timely interventions [94].
Automated Threshold Selection
Selecting optimal thresholds for anomaly detection is a critical aspect of improving prediction models’ reliability and accuracy. With the help of self-supervised models, automated threshold selection provides a robust solution in which the data learns the statistical properties of the data without the need for predefined labels. By leveraging the inherent structures and patterns in the data, these models can calibrate thresholds automatically, reducing the need for manual intervention and enhancing the adaptability of decision-making systems across various applications, including medical diagnostics and anomaly detection [97].
Increasing Interpretability of the Decision-Making Process
Interpretability is an important factor in gaining clinical acceptance and trust for machine learning models. Explainable Artificial Intelligence (XAI) techniques have emerged as a valuable tool for researchers to understand and interpret the decision-making processes underlying complex machine learning models. In the context of seizure prediction, interpretability holds crucial significance as it allows clinicians to gain valuable insights into the physiological mechanisms driving seizure occurrences. While previous studies have focused on EEG-based algorithms, extending XAI techniques to ECG-based methods remains a promising and relatively unexplored area. This could enhance the transparency, trust, and usability of seizure prediction models in clinical settings, ultimately leading to improved patient outcomes and more effective management of epilepsy [94,98,99,100].
5. Conclusion
The field of epileptic seizure prediction has advanced considerably in recent years. Among different data modalities, heart rate data obtained from ECG signals have attracted more attention. This shift from the exclusive reliance on EEG to incorporating ECG offers a non-invasive and more accessible approach for seizure detection and prediction, and hence enhances the monitoring and intervention practices. Within this context, anomaly detection and seizure stage classification have emerged as two key approaches, each with its distinct strengths and limitations. Researchers have developed a variety of algorithms and techniques to enhance the accuracy of predictions within these frameworks. The comprehensive array of methods and strategies discussed in this review lays a solid foundation for future research. Continued advancements in these approaches, especially through the integration of novel biomarkers, machine learning techniques, and personalized models, have the potential to significantly improve the precision and reliability of seizure predictions based on ECG signals. These improvements will not only enhance the management and treatment of epilepsy but also greatly improve the quality of life for individuals living with this condition.
References
- Robert S. Fisher, Carlos Acevedo, Alexis Arzimanoglou, Alicia Bogacz, J. Helen Cross, Christian E. Elger, Jerome Engel, Lars Forsgren, Jacqueline A. French, Mike Glynn, Dale C. Hesdorffer, B. I. Lee, Gary W. Mathern, Solomon L. Moshé, Emilio Perucca, Ingrid E. Scheffer, Torbjörn Tomson, Masako Watanabe, and Samuel Wiebe. ILAE Official Report: A Practical Clinical Definition of Epilepsy. Epilepsia, 55(4):475–482, 2014. [CrossRef]
- Milind Natu, Mrinal Bachute, Shilpa Gite, Ketan Kotecha, and Ankit Vidyarthi. Review on Epileptic Seizure Prediction: Machine Learning and Deep Learning Approaches. Computational and Mathematical Methods in Medicine, 2022:7751263, 2022. ISSN 1748-670X. [CrossRef]
- Elie Bou Assi, Laura Gagliano, Sandy Rihana, Dang K. Nguyen, and Mohamad Sawan. Bispectrum Features and Multilayer Perceptron Classifier to Enhance Seizure Prediction. Scientific Reports, 8(1):15491, 2018. [CrossRef]
- Nazanin Mohammadkhani Ghiasvand and Foad Ghaderi. Epileptic Seizure Prediction from Spectral, Temporal, and Spatial Features of EEG Signals Using Deep Learning Algorithms. The Neuroscience Journal of Shefaye Khatam, 9(1):110–119, 2020. [CrossRef]
- Sándor Beniczky, Philippa Karoly, Ewan Nurse, Philippe Ryvlin, and Mark Cook. Machine Learning and Wearable Devices of the Future. Epilepsia, 62 Suppl 2:S116–S124, 2021. S: 2. [CrossRef]
- Maeike Zijlmans, Danny Flanagan, and Jean Gotman. Heart Rate Changes and ECG Abnormalities During Epileptic Seizures: Prevalence and Definition of An Objective Clinical Sign. Epilepsia, 43(8):847–854, 2002. [CrossRef]
- Rachel E. Stirling, David B. Grayden, Wendyl D’Souza, Mark J. Cook, Ewan Nurse, Dean R. Freestone, Daniel E. Payne, Benjamin H. Brinkmann, Tal Pal Attia, Pedro F. Viana, Mark P. Richardson, and Philippa J. Karoly. Forecasting Seizure Likelihood with Wearable Technology. Frontiers in Neurology, 12:704060, 2021. [CrossRef]
- Roland D Thijs. The Autonomic Signatures of Epilepsy: Diagnostic Clues and Novel Treatment Avenues. Clinical Autonomic Research, 29:131–133, 2019. [CrossRef]
- Raffaele Manni, Gianpaolo Toscano, and Michele Terzaghi. Epilepsy and Cardiovascular Function: Seizures and Antiepileptic Drugs Effects. Brain and heart dynamics, pages 507–515, 2020. [CrossRef]
- Giorgio Costagliola, Alessandro Orsini, Monica Coll, Ramon Brugada, Pasquale Parisi, and Pasquale Striano. The Brain-Heart Interaction in Epilepsy: Implications for Diagnosis, Therapy, and SUDEP Prevention. Annals of Clinical and Translational Neurology, 8(7):1557–1568, 2021. [CrossRef]
- Claire Ufongene, Rima El Atrache, Tobias Loddenkemper, and Christian Meisel. Electrocardiographic Changes Associated with Epilepsy Beyond Heart Rate and Their Utilization in Future Seizure Detection and Forecasting Methods. Clinical Neurophysiology, 131(4):866–879, 2020. [CrossRef]
- Kenneth A. Myers, Shobi Sivathamboo, and Piero Perucca. Heart Rate Variability Measurement in Epilepsy: How Can We Move from Research to Clinical Practice? Epilepsia, 59(12):2169–2178, 2018. [CrossRef]
- Cristian Sevcencu and Johannes J. Struijk. Autonomic Alterations and Cardiac Changes in Epilepsy. Epilepsia, 51(5):725–737, 2010. [CrossRef]
- Hirotsugu Hashimoto, Koichi Fujiwara, Yoko Suzuki, Miho Miyajima, Toshitaka Yamakawa, Manabu Kano, Taketoshi Maehara, Katsuya Ohta, Tetsuo Sasano, Masato Matsuura, et al. Heart Rate Variability Features for Epilepsy Seizure Prediction. In 2013 Asia-Pacific Signal and Information Processing Association Annual Summit and Conference, pages 1–4. IEEE, 2013. [CrossRef]
- Federico Mason, Anna Scarabello, Lisa Taruffi, Elena Pasini, Giovanna Calandra-Buonaura, Luca Vignatelli, and Francesca Bisulli. Heart Rate Variability as a Tool for Seizure Prediction: A Scoping Review. Journal of Clinical Medicine, 13(3):747, 2024. [CrossRef]
- Soroor Behbahani. A Review of Significant Research on Epileptic Seizure Detection and Prediction Using Heart Rate Variability. Türk Kardiyoloji Derneği Arşivi, 46(5), 2018. [CrossRef]
- Eryse Amira Seth, Jessica Watterson, Jue Xie, Alina Arulsamy, Hadri Hadi Md Yusof, Irma Wati Ngadimon, Ching Soong Khoo, Amudha Kadirvelu, and Mohd Farooq Shaikh. Feasibility of Cardiac-Based Seizure Detection and Prediction: A Systematic Review of Non-Invasive Wearable Sensor-Based Studies. Epilepsia Open, 9(1):41–59, 2024. [CrossRef]
- Marije Van der Lende, Rainer Surges, Josemir W Sander, and Roland D Thijs. Cardiac Arrhythmias During or After Epileptic Seizures. Journal of Neurology, Neurosurgery & Psychiatry, 87(1):69–74, 2016. [CrossRef]
- Fergus J Rugg-Gunn, Robert J Simister, Mark Squirrell, Diana R Holdright, and John S Duncan. Cardiac Arrhythmias in Focal Epilepsy: A Prospective Long-Term Study. The Lancet, 364(9452):2212–2219, 2004. [CrossRef]
- S Shmuely, M Van der Lende, RJ Lamberts, JW Sander, and Roland D Thijs. The Heart of Epilepsy: Current Views and Future Concepts. Seizure, 44:176–183, 2017. [CrossRef]
- Stephen M Oppenheimer and David F Cechetto. Cardiac Chronotropic Organization of the Rat Insular Cortex. Brain research, 533(1):66–72, 1990. [CrossRef]
- Adriana Leal, Maria da Graça Ruano, Jorge Henriques, Paulo de Carvalho, and César Teixeira. On the Viability of ECG Features for Seizure Anticipation on Long-Term Data. In 2017 IEEE 3rd International Forum on Research and Technologies for Society and Industry (RTSI), pages 1–5. IEEE, 2017. [CrossRef]
- Andrea Romigi and Nicola Toschi. Cardiac Autonomic Changes in Epilepsy. Complexity and Nonlinearity in Cardiovascular Signals, pages 375–386, 2017. [CrossRef]
- K. Jansen and L. Lagae. Cardiac Changes in Epilepsy. Seizure, 19(8):455–460, 2010. [CrossRef]
- Fedele Dono, Giacomo Evangelista, Valerio Frazzini, Catello Vollono, Claudia Carrarini, Mirella Russo, Camilla Ferrante, Vincenzo Di Stefano, Luciano P Marchionno, Maria V De Angelis, et al. Interictal Heart Rate Variability Analysis Reveals Lateralization of Cardiac Autonomic Control in Temporal Lobe Epilepsy. Frontiers in neurology, 11:842, 2020. [CrossRef]
- H. Lüders, J. Acharya, C. Baumgartner, S. Benbadis, A. Bleasel, R. Burgess, D. S. Dinner, A. Ebner, N. Foldvary, E. Geller, H. Hamer, H. Holthausen, P. Kotagal, H. Morris, H. J. Meencke, S. Noachtar, F. Rosenow, A. Sakamoto, B. J. Steinhoff, I. Tuxhorn, and E. Wyllie. A New Epileptic Seizure Classification Based Exclusively on Ictal Semiology. Acta Neurologica Scandinavica, 99(3):137–141, 1999. ISSN 1600-0404. [CrossRef]
- Renzo Guerrini and Carmen Barba. Classification, Clinical Symptoms, and Syndromes. Oxford Textbook of Epilepsy and Epileptic Seizures, pages 70–80, 2013. [CrossRef]
- Katherine S. Eggleston, Bryan D. Olin, and Robert S. Fisher. Ictal Tachycardia: The Head-Heart Connection. Seizure, 23(7):496–505, 2014. [CrossRef]
- Paolo Detti. Siena Scalp EEG Database. PhysioNet, 10:493, 2020. [CrossRef]
- Paolo Detti, Giampaolo Vatti, and Garazi Zabalo Manrique de Lara. EEG Synchronization Analysis for Seizure Prediction: A Study on Data of Noninvasive Recordings. Processes, 8(7):846, 2020. [CrossRef]
- Ary L. Goldberger, Luis an Amaral, Leon Glass, Jeffrey M. Hausdorff, Plamen Ch Ivanov, Roger G. Mark, Joseph E. Mietus, George B. Moody, Chung-Kang Peng, and H. Eugene Stanley. Physiobank, Physiotoolkit, And Physionet: Components of A New Research Resource for Complex Physiologic Signals. circulation, 101(23):e215–e220, 2000. [CrossRef]
- I. C. Al-Aweel, K. B. Krishnamurthy, J. M. Hausdorff, J. E. Mietus, J. R. Ives, A. S. Blum, D. L. Schomer, and A. L. Goldberger. Postictal Heart Rate Oscillations in Partial Epilepsy. Neurology, 53(7):1590–1592, 1999. [CrossRef]
- Matthias Ihle, Hinnerk Feldwisch-Drentrup, César A. Teixeira, Adrien Witon, Björn Schelter, Jens Timmer, and Andreas Schulze-Bonhage. EPILEPSIAE - A European Epilepsy Database. Computer Methods and Programs in Biomedicine, 106(3):127–138, 2012. [CrossRef]
- Juliane Klatt, Hinnerk Feldwisch-Drentrup, Matthias Ihle, Vincent Navarro, Markus Neufang, Cesar Teixeira, Claude Adam, Mario Valderrama, Catalina Alvarado-Rojas, Adrien Witon, Michel van Quyen, Francisco Sales, Antonio Dourado, Jens Timmer, Andreas Schulze-Bonhage, and Bjoern Schelter. The EPILEPSIAE Database: An Extensive Electroencephalography Database of Epilepsy Patients. Epilepsia, 53(9):1669–1676, 2012. [CrossRef]
- Hirotsugu Hashimoto, Koichi Fujiwara, Yoko Suzuki, Miho Miyajima, Toshitaka Yamakawa, Manabu Kano, Taketoshi Maehara, Katsuya Ohta, Tetsuo Sasano, Masato Matsuura, and Eisuke Matsushima. Epileptic Seizure Monitoring by Using Multivariate Statistical Process Control. IFAC Proceedings Volumes, 46(31):249–254, 2013. [CrossRef]
- Giorgos Giannakakis, Manolis Tsiknakis, and Pelagia Vorgia. Focal Epileptic Seizures Anticipation Based on Patterns of Heart Rate Variability Parameters. Computer Methods and Programs in Biomedicine, 178:123–133, 2019. [CrossRef]
- Iwona Cygankiewicz and Wojciech Zareba. Heart Rate Variability. Handbook of clinical neurology, 117:379–393, 2013. [CrossRef]
- Sarang L Joshi, Rambabu A Vatti, and Rupali V Tornekar. A Survey on ECG Signal Denoising Techniques. In 2013 International Conference on Communication Systems and Network Technologies, pages 60–64. IEEE, 2013. [CrossRef]
- Shubhojeet Chatterjee, Rini Smita Thakur, Ram Narayan Yadav, Lalita Gupta, and Deepak Kumar Raghuvanshi. Review of Noise Removal Techniques in ECG Signals. IET Signal Processing, 14(9):569–590, 2020. ISSN 1751-9675. [CrossRef]
- Rahul Kher and Vallabh Vidyanagar. Signal Processing Techniques for Removing Noise from ECG Signals. Biomedical Engineering and Research, 3(1):1–9, 2019.
- Francisco P. Romero, David C. Piñol, and Carlos R. Vázquez-Seisdedos. DeepFilter: An ECG Baseline Wander Removal Filter Using Deep Learning Techniques. Biomedical Signal Processing and Control, 70:102992, 2021. [CrossRef]
- Siti Nurmaini, Annisa Darmawahyuni, Akhmad Noviar Sakti Mukti, Muhammad Naufal Rachmatullah, Firdaus Firdaus, and Bambang Tutuko. Deep Learning-Based Stacked Denoising and Autoencoder for ECG Heartbeat Classification. Electronics, 9(1):135, 2020. [CrossRef]
- Qiang Yin, Dai Shen, and Qian Ding. Influence of Sliding Time Window Size Selection Based on Heart Rate Variability Signal Analysis on Intelligent Monitoring of Noxious Stimulation under anesthesia. Neural Plasticity, 2021:6675052, 2021. ISSN 2090-5904. [CrossRef]
- Adriana Leal, Mauro F. Pinto, Fábio Lopes, Anna M. Bianchi, Jorge Henriques, Maria G. Ruano, Paulo de Carvalho, António Dourado, and César A. Teixeira. Heart Rate Variability Analysis for the Identification of the Preictal Interval in Patients with Drug-Resistant Epilepsy. Scientific Reports, 11(1):5987, 2021. [CrossRef]
- Toshitaka Yamakawa, Miho Miyajima, Koichi Fujiwara, Manabu Kano, Yoko Suzuki, Yutaka Watanabe, Satsuki Watanabe, Tohru Hoshida, Motoki Inaji, and Taketoshi Maehara. Wearable Epileptic Seizure Prediction System with Machine-Learning-Based Anomaly Detection of Heart Rate Variability. Sensors (Basel, Switzerland), 20(14), 2020. [CrossRef]
- Mojtaba Bandarabadi, Jalil Rasekhi, César A Teixeira, Mohammad R Karami, and António Dourado. On the Proper Selection of Preictal Period for Seizure Prediction. Epilepsy & Behavior, 46:158–166, 2015. [CrossRef]
- Anton Popov, Oleg Panichev, Yevgeniy Karplyuk, Yaroslav Smirnov, Sebastian Zaunseder, and Volodymyr Kharytonov. Heart Beat-To-Beat Intervals Classification for Epileptic Seizure Prediction. In 2017 Signal Processing Symposium (SPSympo), pages 1–4. IEEE, 2017. [CrossRef]
- Jonatas Pavei, Renan G. Heinzen, Barbora Novakova, Roger Walz, Andrey J. Serra, Markus Reuber, Athi Ponnusamy, and Jefferson L. B. Marques. Early Seizure Detection Based on Cardiac Autonomic Regulation Dynamics. Frontiers in Physiology, 8:765, 2017. [CrossRef]
- M. Malik, J. T. Bigger, A. J. Camm, R. E. Kleiger, A. Malliani, A. J. Moss, and P. J. Schwartz. Heart Rate Variability: Standards of Measurement, Physiological Interpretation, and Clinical Use. European Heart Journal, 17(3):354–381, 1996. ISSN 0195-668X. [CrossRef]
- Tam Pham, Zen Juen Lau, S. H. Annabel Chen, and Dominique Makowski. Heart Rate Variability in Psychology: A Review of HRV Indices and an Analysis Tutorial. Sensors (Basel, Switzerland), 21(12):3998, 2021. [CrossRef]
- Anita Miftahul Maghfiroh, Syevana Dita Musvika, Levana Forra Wakidi, Lamidi Lamidi, Sumber Sumber, Muhmmad Ridha Mak’ruf, Andjar Pudji, and Dyah Titisari. State-of-the-Art Method to Detect R-Peak on Electrocardiogram Signal: A Review. In Proceedings of the 1st International Conference on Electronics, Biomedical Engineering, and Health Informatics: ICEBEHI 2020, 8-9 October, Surabaya, Indonesia, pages 321–329. Springer, 2021. [CrossRef]
- TI Amani, SSN Alhady, UK Ngah, and ARW Abdullah. A Review of ECG Peaks Detection and Classification. In 5th Kuala Lumpur International Conference on Biomedical Engineering 2011: (BIOMED 2011) 20-23 June 2011, Kuala Lumpur, Malaysia, pages 398–402. Springer, 2011. [CrossRef]
- STEVEN E. DOBBS, NEIL M. SCHMITT, and HALUK S. OZEMEK. QRS Detection by Template Matching Using Real-Time Correlation on A Microcomputer. Journal of Clinical Engineering, 9(3):197, 1984. ISSN 0363-8855. [CrossRef]
- J. Pan and W. J. Tompkins. A Real-Time QRS Detection Algorithm. IEEE transactions on bio-medical engineering, 32(3):230–236, 1985. ISSN 0018-9294. [CrossRef]
- Ivaylo I. Christov. Real Time Electrocardiogram QRS Detection Using Combined Adaptive Threshold. BioMedical Engineering OnLine, 3(1):28, 2004. ISSN 1475-925X. [CrossRef]
- L. V. Rajani Kumari, Y. Padma Sai, and N. Balaji. R-Peak Identification in ECG Signals using Pattern-Adapted Wavelet Technique. IETE Journal of Research, pages 1–10, 2021. ISSN 0377-2063. [CrossRef]
- Jaeseong Jang, Seongjae Park, Jin-Kook Kim, Junho An, and Sunghoon Jung. CNN-Based Two Step R Peak Detection Method: Combining Segmentation and Regression. In 2022 44th Annual International Conference of the IEEE Engineering in Medicine & Biology Society (EMBC), pages 1910–1914. IEEE, 2022. [CrossRef]
- Mohamed Amine Belkadi, Abdelhamid Daamouche, and Farid Melgani. A Deep Neural Network Approach to QRS Detection Using Autoencoders. Expert Systems with Applications, 184:115528, 2021. [CrossRef]
- Xueyu Wu, Zhonghua Wang, Bo Xu, and Xibo Ma. Optimized Pan-Tompkins Based Heartbeat Detection Algorithms. In 2020 Chinese Control And Decision Conference (CCDC), pages 892–897. IEEE, 2020. [CrossRef]
- L Sathyapriya, L Murali, and T Manigandan. Analysis and Detection R-Peak Detection Using Modified Pan-Tompkins Algorithm. In 2014 IEEE International Conference on Advanced Communications, Control and Computing Technologies, pages 483–487. IEEE, 2014. [CrossRef]
- M. A. Z. Fariha, R. Ikeura, S. Hayakawa, and S. Tsutsumi. Analysis of Pan-Tompkins Algorithm Performance with Noisy ECG Signals. Journal of Physics: Conference Series, 1532(1):012022, 2020. ISSN 1742-6596. [CrossRef]
- Dib Nabil and F. Bereksi Reguig. Ectopic Beats Detection and Correction Methods: A Review. Biomedical Signal Processing and Control, 18:228–244, 2015. [CrossRef]
- Mirja A. Peltola. Role of Editing of R-R Intervals in the Analysis of Heart Rate Variability. Frontiers in Physiology, 3:148, 2012. ISSN 1664-042X. [CrossRef]
- N. Lippman, K. M. Stein, and B. B. Lerman. Comparison of Methods for Removal of Ectopy in Measurement of Heart Rate Variability. The American journal of physiology, 267(1 Pt 2):H411–8, 1994. ISSN 0002-9513. [CrossRef]
- Davide Morelli, Alessio Rossi, Massimo Cairo, and David A Clifton. Analysis of the Impact of Interpolation Methods of Missing RR-intervals Caused by Motion Artifacts on HRV Features Estimations. Sensors, 19(14):3163, 2019. [CrossRef]
- Marcus Karlsson, Rolf Hörnsten, Annika Rydberg, and Urban Wiklund. Automatic Filtering of Outliers in RR Intervals Before Analysis of Heart Rate Variability in Holter Recordings: A Comparison with Carefully Edited Data. BioMedical Engineering OnLine, 11(1):2, 2012. ISSN 1475-925X. [CrossRef]
- Laurita dos Santos, Joaquim J. Barroso, Elbert E. N. Macau, and Moacir F. de Godoy. Application of An Automatic Adaptive Filter for Heart Rate Variability Analysis. Medical Engineering & Physics, 35(12):1778–1785, 2013. ISSN 1350-4533. [CrossRef]
- M. B. Malarvili, Mostefa Mesbah, and Boualem Boashash. Time-Frequency Analysis of Heart Rate Variability for Neonatal Seizure Detection. Australasian physical & engineering sciences in medicine, 29(1):67–72, 2006. ISSN 0158-9938. [CrossRef]
- Soroor Behbahani, Nader Jafarnia Dabanloo, Ali Motie Nasrabadi, and Antonio Dourado. Epileptic Seizure Prediction Based on Features Extracted from Lagged Poincaré Plots. International Journal of Neuroscience, 134(4):381–397, 2024. [CrossRef]
- Svante Wold, Kim Esbensen, and Paul Geladi. Principal Component Analysis. Chemometrics and Intelligent Laboratory Systems, 2(1-3):37–52, 1987. ISSN 0169-7439. [CrossRef]
- R. R. Hocking. A Biometrics Invited Paper. The Analysis and Selection of Variables in Linear Regression. Biometrics, 32(1):1, 1976. ISSN 0006341X. [CrossRef]
- Gary Smith. Step away from stepwise. Journal of Big Data, 5(1):1–12, 2018. ISSN 2196-1115. [CrossRef]
- Chris Ding and Hanchuan Peng. Minimum Redundancy Feature Selection from Microarray Gene Expression Data. Journal of bioinformatics and computational biology, 3(2):185–205, 2005. ISSN 0219-7200. [CrossRef]
- William H. Kruskal and W. Allen Wallis. Use of Ranks in One-Criterion Variance Analysis. Journal of the American Statistical Association, 47(260):583, 1952. ISSN 01621459. [CrossRef]
- Hossin M and Sulaiman M.N. A Review on Evaluation Metrics for Data Classification Evaluations. International Journal of Data Mining & Knowledge Management Process, 5(2):01–11, 2015. ISSN 2231-007X. ISSN 2231-007X. [CrossRef]
- Ž Vujović et al. Classification Model Evaluation Metrics. International Journal of Advanced Computer Science and Applications, 12(6):599–606, 2021. [CrossRef]
- Thomas Maiwald, Matthias Winterhalder, Richard Aschenbrenner-Scheibe, Henning U. Voss, Andreas Schulze-Bonhage, and Jens Timmer. Comparison of Three Nonlinear Seizure Prediction Methods by Means of the Seizure Prediction Characteristic. Physica D: Nonlinear Phenomena, 194(3-4):357–368, 2004. ISSN 0167-2789. [CrossRef]
- Koichi Fujiwara, Erika Abe, Yoko Suzuki, Miho Miyajima, Toshitaka Yamakawa, Manabu Kano, Taketoshi Maehara, Katsuya Ohta, and Tetsuo Sasano. Epileptic Seizure Monitoring by One-Class Support Vector Machine. In Signal and Information Processing Association Annual Summit and Conference (APSIPA), 2014 Asia-Pacific, pages 1–4. IEEE, 2014. [CrossRef]
- Koichi Fujiwara, Taeko Sasai-Sakuma, Tetsuo Sasano, Masato Matsuura, Eisuke Matsushima, Miho Miyajima, Toshitaka Yamakawa, Erika Abe, Yoko Suzuki, Yuriko Sawada, Manabu Kano, Taketoshi Maehara, and Katsuya Ohta. Epileptic Seizure Prediction Based on Multivariate Statistical Process Control of Heart Rate Variability Features. IEEE Transactions on Biomedical Engineering, 63(6):1321–1332, 2015. [CrossRef]
- Soroor Behbahani, Nader Jafarnia Dabanloo, Ali Motie Nasrabadi, and Antonio Dourado. Prediction of Epileptic Seizures Based on Heart Rate Variability. Technology and Health Care, 24(6):795–810, 2016. [CrossRef]
- Yaroslav Smirnov, Anton Popov, Oleg Panichev, Yevgeniy Karplyuk, and Volodymyr Kharytonov. Epileptic Seizure Prediction Based on Singular Value Decomposition of Heart Rate Variability Features. In 2017 Signal Processing Symposium (SPSympo), pages 1–4. IEEE, 2017. [CrossRef]
- M. K. Moridani and H. Farhadi. Heart Rate Variability as A Biomarker for Epilepsy Seizure Prediction. Bratislavske lekarske listy, 118(1):3–8, 2017. [CrossRef]
- Laura Gagliano, E Bou Assi, Dènahin Hinnoutondji Toffa, Dang Khoa Nguyen, and Mohamad Sawan. Unsupervised Clustering of HRV Features Reveals Preictal Changes in Human Epilepsy. In 2020 42nd Annual International Conference of the IEEE Engineering in Medicine & Biology Society (EMBC), pages 698–701. IEEE, 2020. [CrossRef]
- Rikumo Ode, Koichi Fujiwara, Miho Miyajima, Toshikata Yamakawa, Manabu Kano, Kazutaka Jin, Nobukazu Nakasato, Yasuko Sawai, Toru Hoshida, Masaki Iwasaki, Yoshiko Murata, Satsuki Watanabe, Yutaka Watanabe, Yoko Suzuki, Motoki Inaji, Naoto Kunii, Satoru Oshino, Hui Ming Khoo, Haruhiko Kishima, and Taketoshi Maehara. Development of An Epileptic Seizure Prediction Algorithm Using R-R Intervals with Self-Attentive Autoencoder. Artificial Life and Robotics, pages 1–7, 2022. [CrossRef]
- Apostolos Karasmanoglou, Marios Antonakakis, and Michalis Zervakis. ECG-Based Semi-Supervised Anomaly Detection for Early Detection and Monitoring of Epileptic Seizures. International Journal of Environmental Research and Public Health, 20(6):5000, 2023. [CrossRef]
- Lucia Billeci, Daniela Marino, Laura Insana, Giampaolo Vatti, and Maurizio Varanini. Patient-Specific Seizure Prediction Based on Heart Rate Variability and Recurrence Quantification Analysis. PLOS ONE, 13(9):e0204339, 2018. [CrossRef]
- Andrea V. Perez-Sanchez, Carlos A. Perez-Ramirez, Martin Valtierra-Rodriguez, Aurelio Dominguez-Gonzalez, and Juan P. Amezquita-Sanchez. Wavelet Transform-Statistical Time Features-Based Methodology for Epileptic Seizure Prediction Using Electrocardiogram Signals. Mathematics, 8(12):2125, 2020. [CrossRef]
- Sarah Hadipour, Ala Tokhmpash, Bahram Shafai, and Carey Rappaport. Seizure Prediction and Heart Rate Oscillations Classification in Partial Epilepsy. In Advances in Computer Vision and Computational Biology: Proceedings from IPCV’20, HIMS’20, BIOCOMP’20, and BIOENG’20, pages 473–483. Springer, 2021. [CrossRef]
- Andrea V Perez-Sanchez, Juan P Amezquita-Sanchez, Martin Valtierra-Rodriguez, and Hojjat Adeli. A New Epileptic Seizure Prediction Model Based on Maximal Overlap Discrete Wavelet Packet Transform, Homogeneity Index, And Machine Learning Using ECG signals. Biomedical Signal Processing and Control, 88:105659, 2024. [CrossRef]
- Ronald L. Allen and Duncan Mills. Signal Analysis: Time, Frequency, Scale, and Structure. John Wiley & Sons, 2004.
- Yuchun Tang, Yan-Qing Zhang, Nitesh V Chawla, and Sven Krasser. SVMs Modeling for Highly Imbalanced Classification. IEEE Transactions on Systems, Man, and Cybernetics, Part B (Cybernetics), 39(1):281–288, 2008. [CrossRef]
- Paul Geladi and Bruce R Kowalski. Partial Least-Squares Regression: A Tutorial. Analytica chimica acta, 185:1–17, 1986. [CrossRef]
- Sotiris Kotsiantis, Dimitris Kanellopoulos, Panayiotis Pintelas, et al. Handling Imbalanced Datasets: A Review. GESTS international transactions on computer science and engineering, 30(1):25–36, 2006.
- Gen Li and Jason J. Jung. Deep Learning for Anomaly Detection in Multivariate Time Series: Approaches, Applications, And Challenges. Information Fusion, 91:93–102, 2023. ISSN 1566-2535. [CrossRef]
- Trudy D Pang, Bruce D Nearing, Richard L Verrier, and Steven C Schachter. T-Wave Heterogeneity Crescendo in the Surface EKG is Superior to Heart Rate Acceleration for Seizure Prediction. Epilepsy & Behavior, 130:108670, 2022. [CrossRef]
- Yuanhao ZOU, Yufei ZHANG, and Xiaodong ZHAO. Self-Supervised Time Series Classification Based on LSTM and Contrastive Transformer. Wuhan University Journal of Natural Sciences, 27(6):521–530, 2022. ISSN 1993-4998. [CrossRef]
- Yikai Yang, Nhan Duy Truong, Jason K. Eshraghian, Armin Nikpour, and Omid Kavehei. Weak Self-Supervised Learning for Seizure Forecasting: A Feasibility Study. Royal Society Open Science, 9(8):220374, 2022. [CrossRef]
- Yikai Gao, Aiping Liu, Lanlan Wang, Ruobing Qian, and Xun Chen. A Self-Interpretable Deep Learning Model for Seizure Prediction Using a Multi-Scale Prototypical Part Network. IEEE Transactions on Neural Systems and Rehabilitation Engineering, 31:1847–1856, 2023. [CrossRef]
- Imene Jemal, Neila Mezghani, Lina Abou-Abbas, and Amar Mitiche. An Interpretable Deep Learning Classifier for Epileptic Seizure Prediction Using EEG Data. IEEE Access, 10:60141–60150, 2022. ISSN 2169-3536. [CrossRef]
- Mauro Pinto, Tiago Coelho, Adriana Leal, Fábio Lopes, António Dourado, Pedro Martins, and César Teixeira. Interpretable EEG Seizure Prediction Using a Multiobjective Evolutionary Algorithm. Scientific Reports, 12(1):4420, 2022. ISSN 2045-2322. [CrossRef]
Figure 1.
Epileptic seizures are typically divided into four stages. Note that the depicted time intervals are estimates and may vary across individual patients and their health conditions.
Figure 1.
Epileptic seizures are typically divided into four stages. Note that the depicted time intervals are estimates and may vary across individual patients and their health conditions.
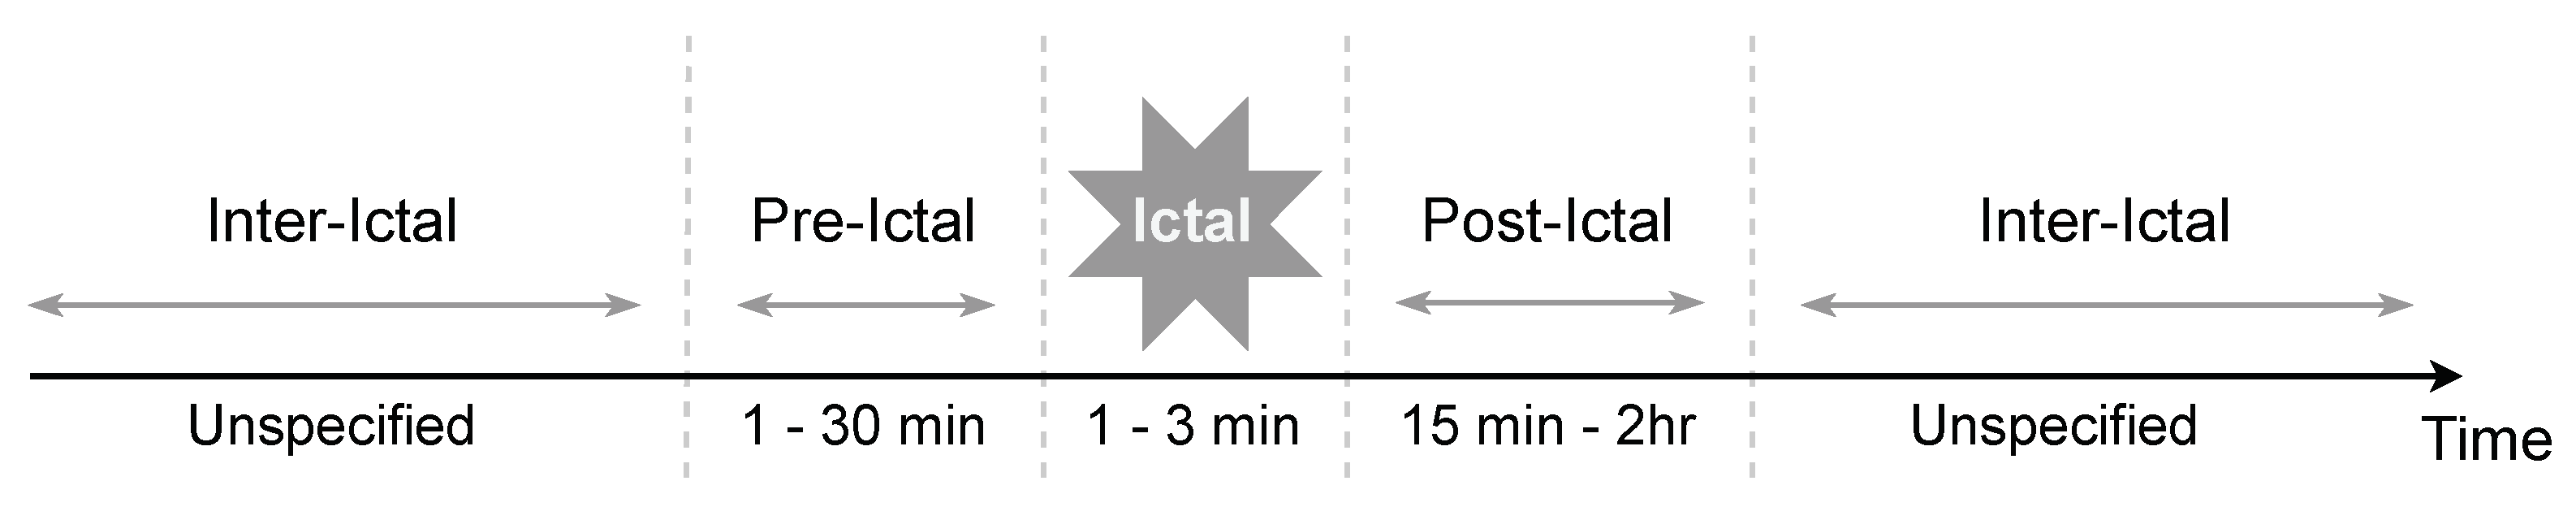
Figure 2.
A General Methodology of Seizure Prediction Process.
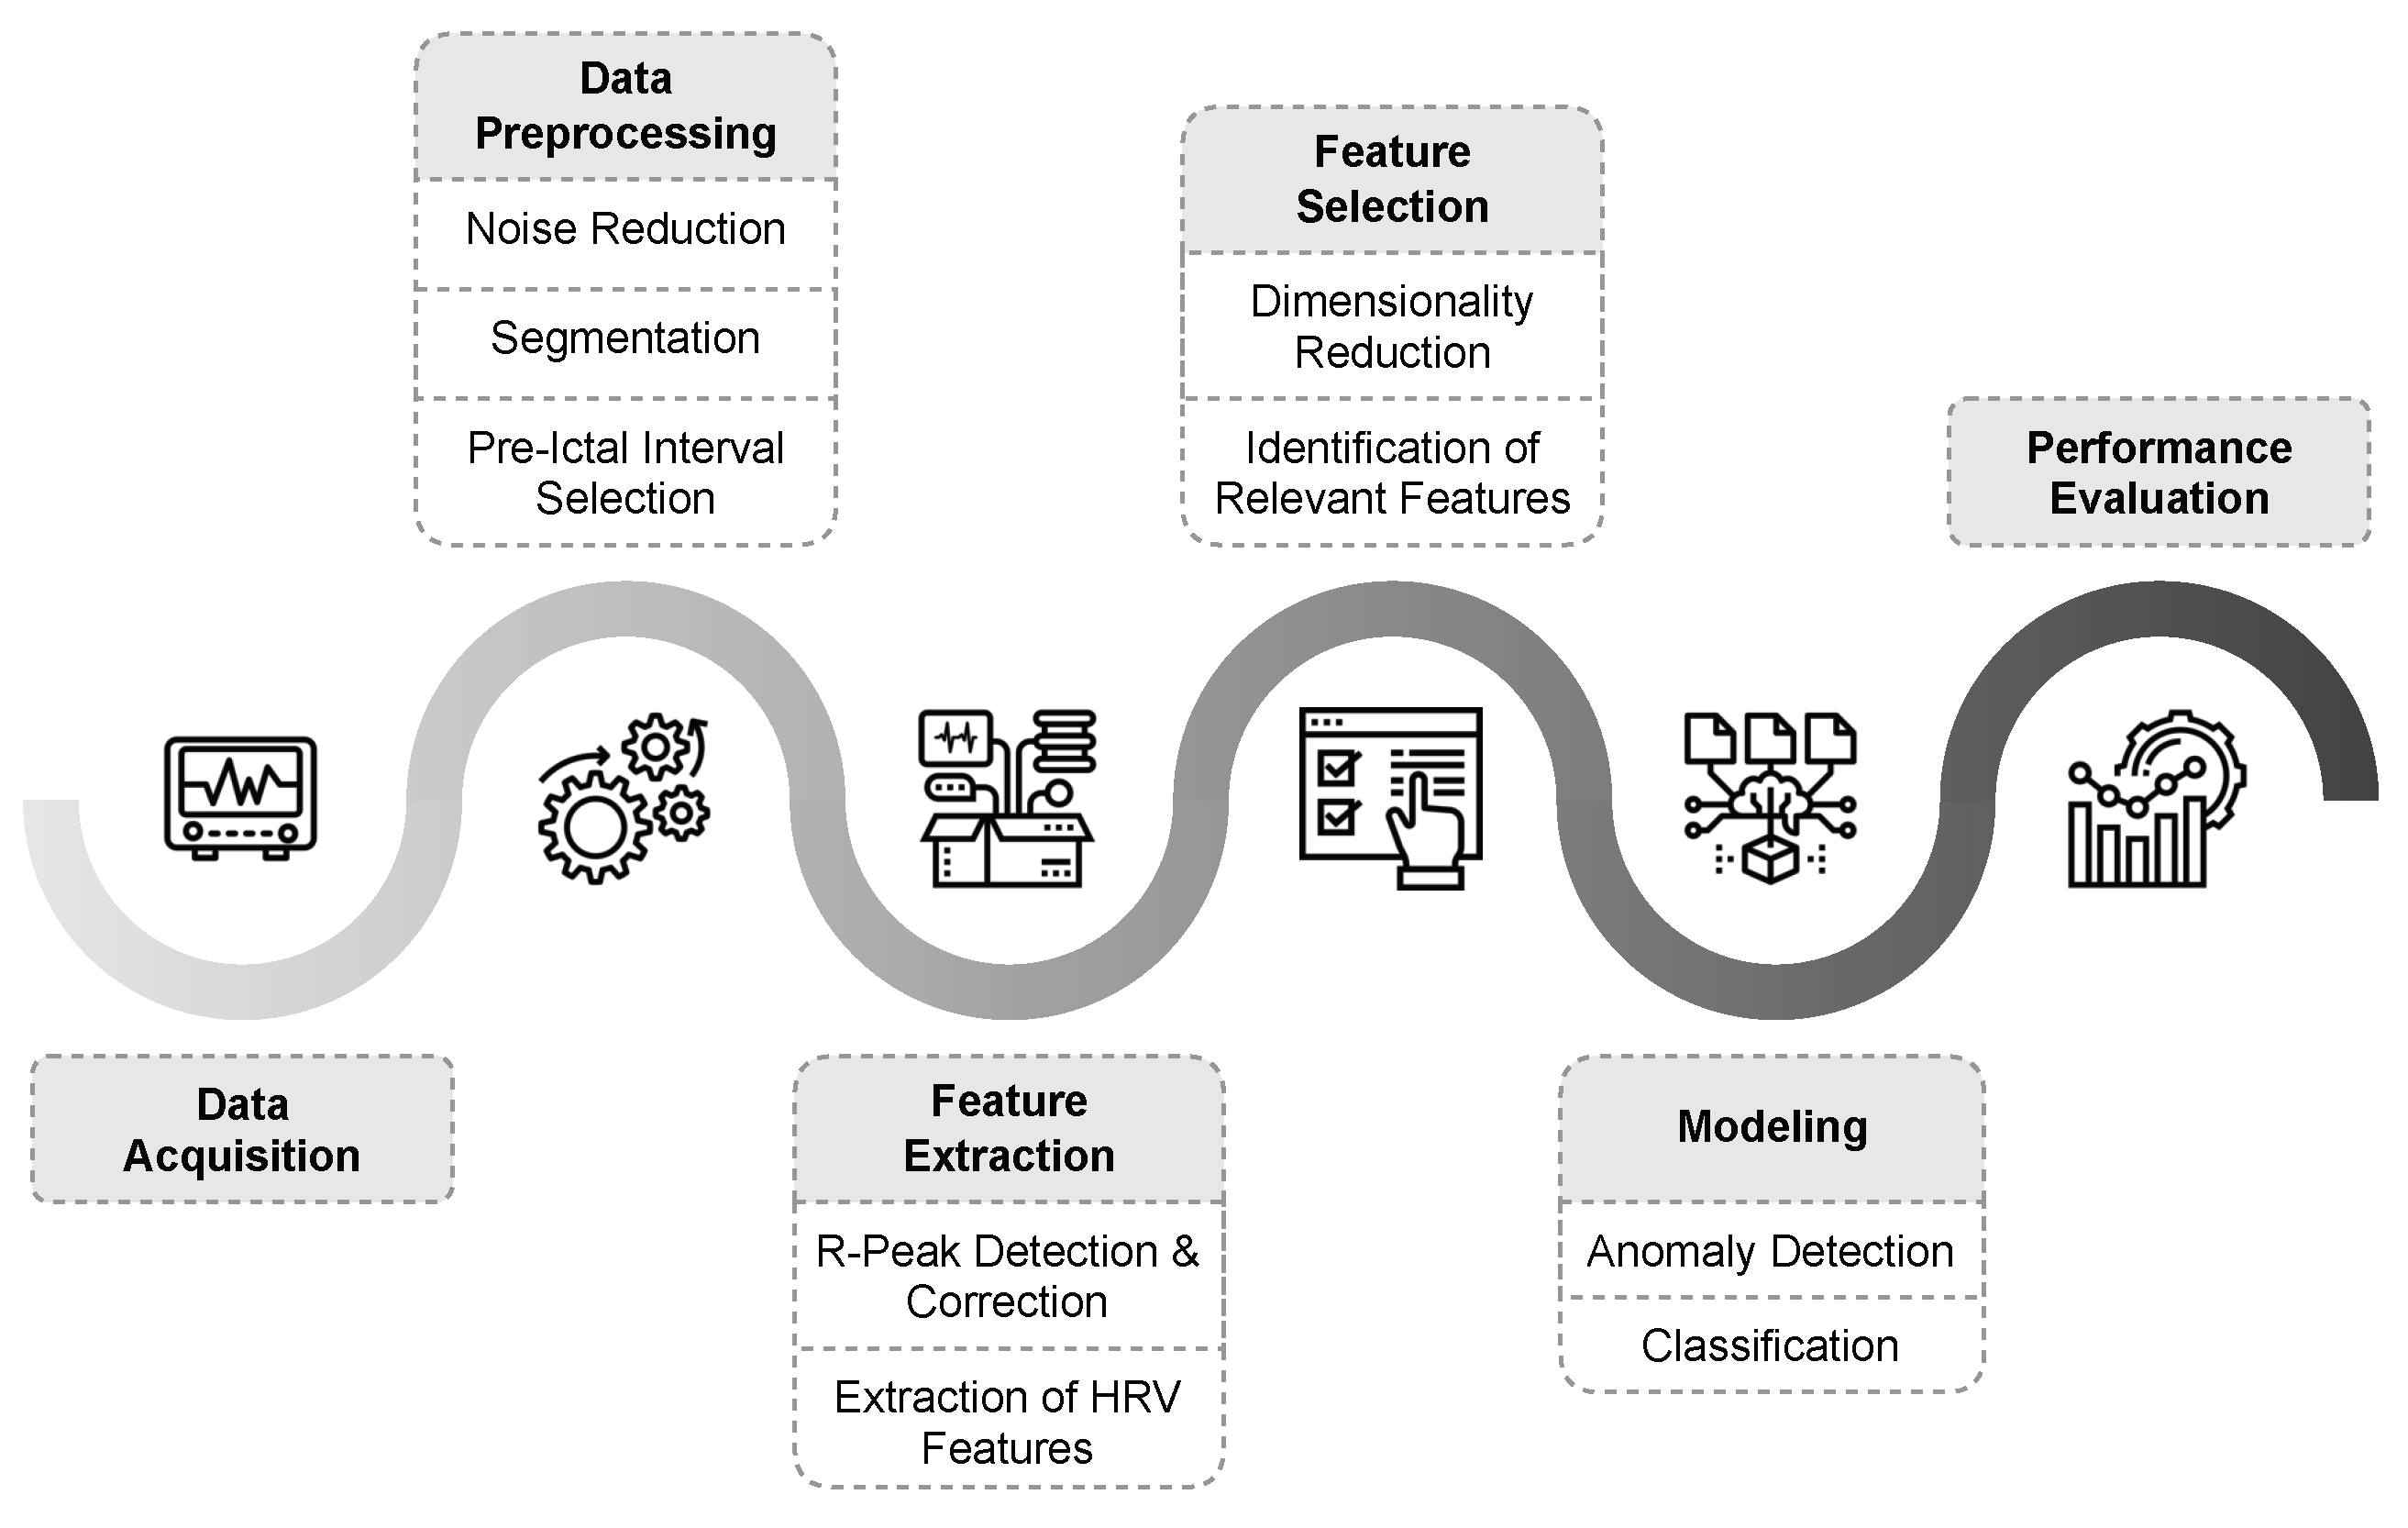
Figure 3.
A Normal PQRST Complex of ECG.
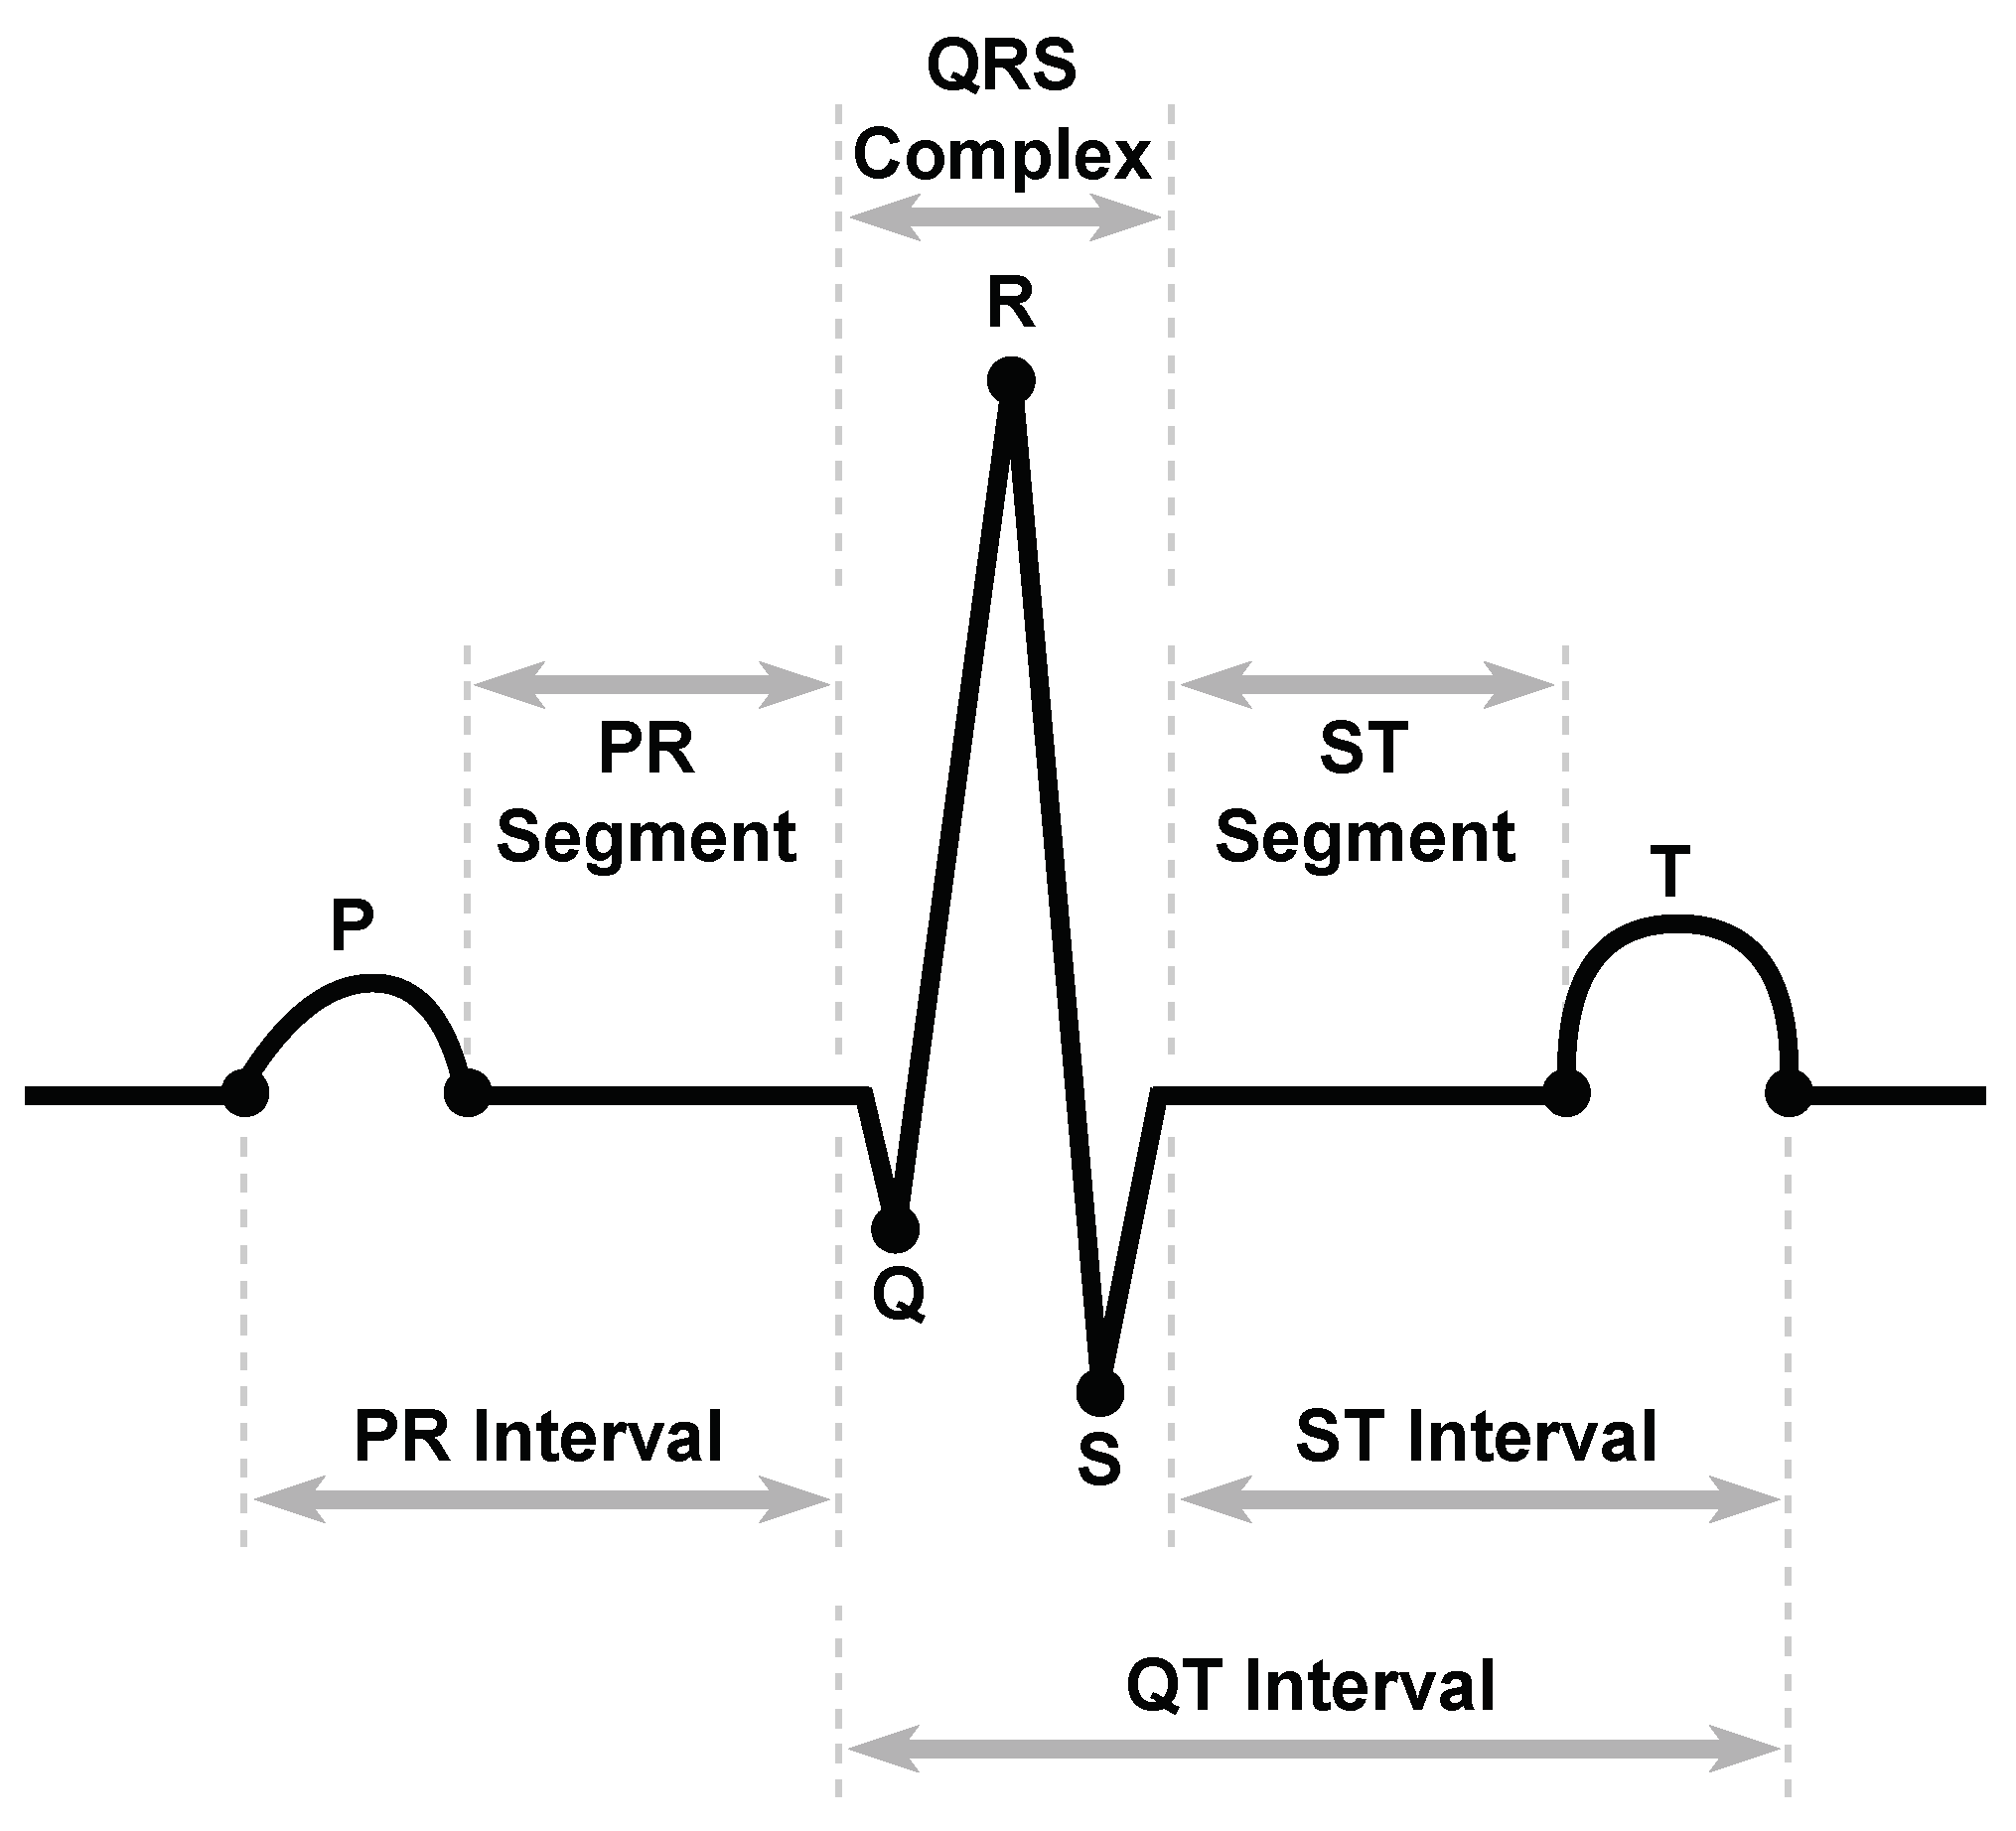
Figure 4.
Summary of HRV Features.
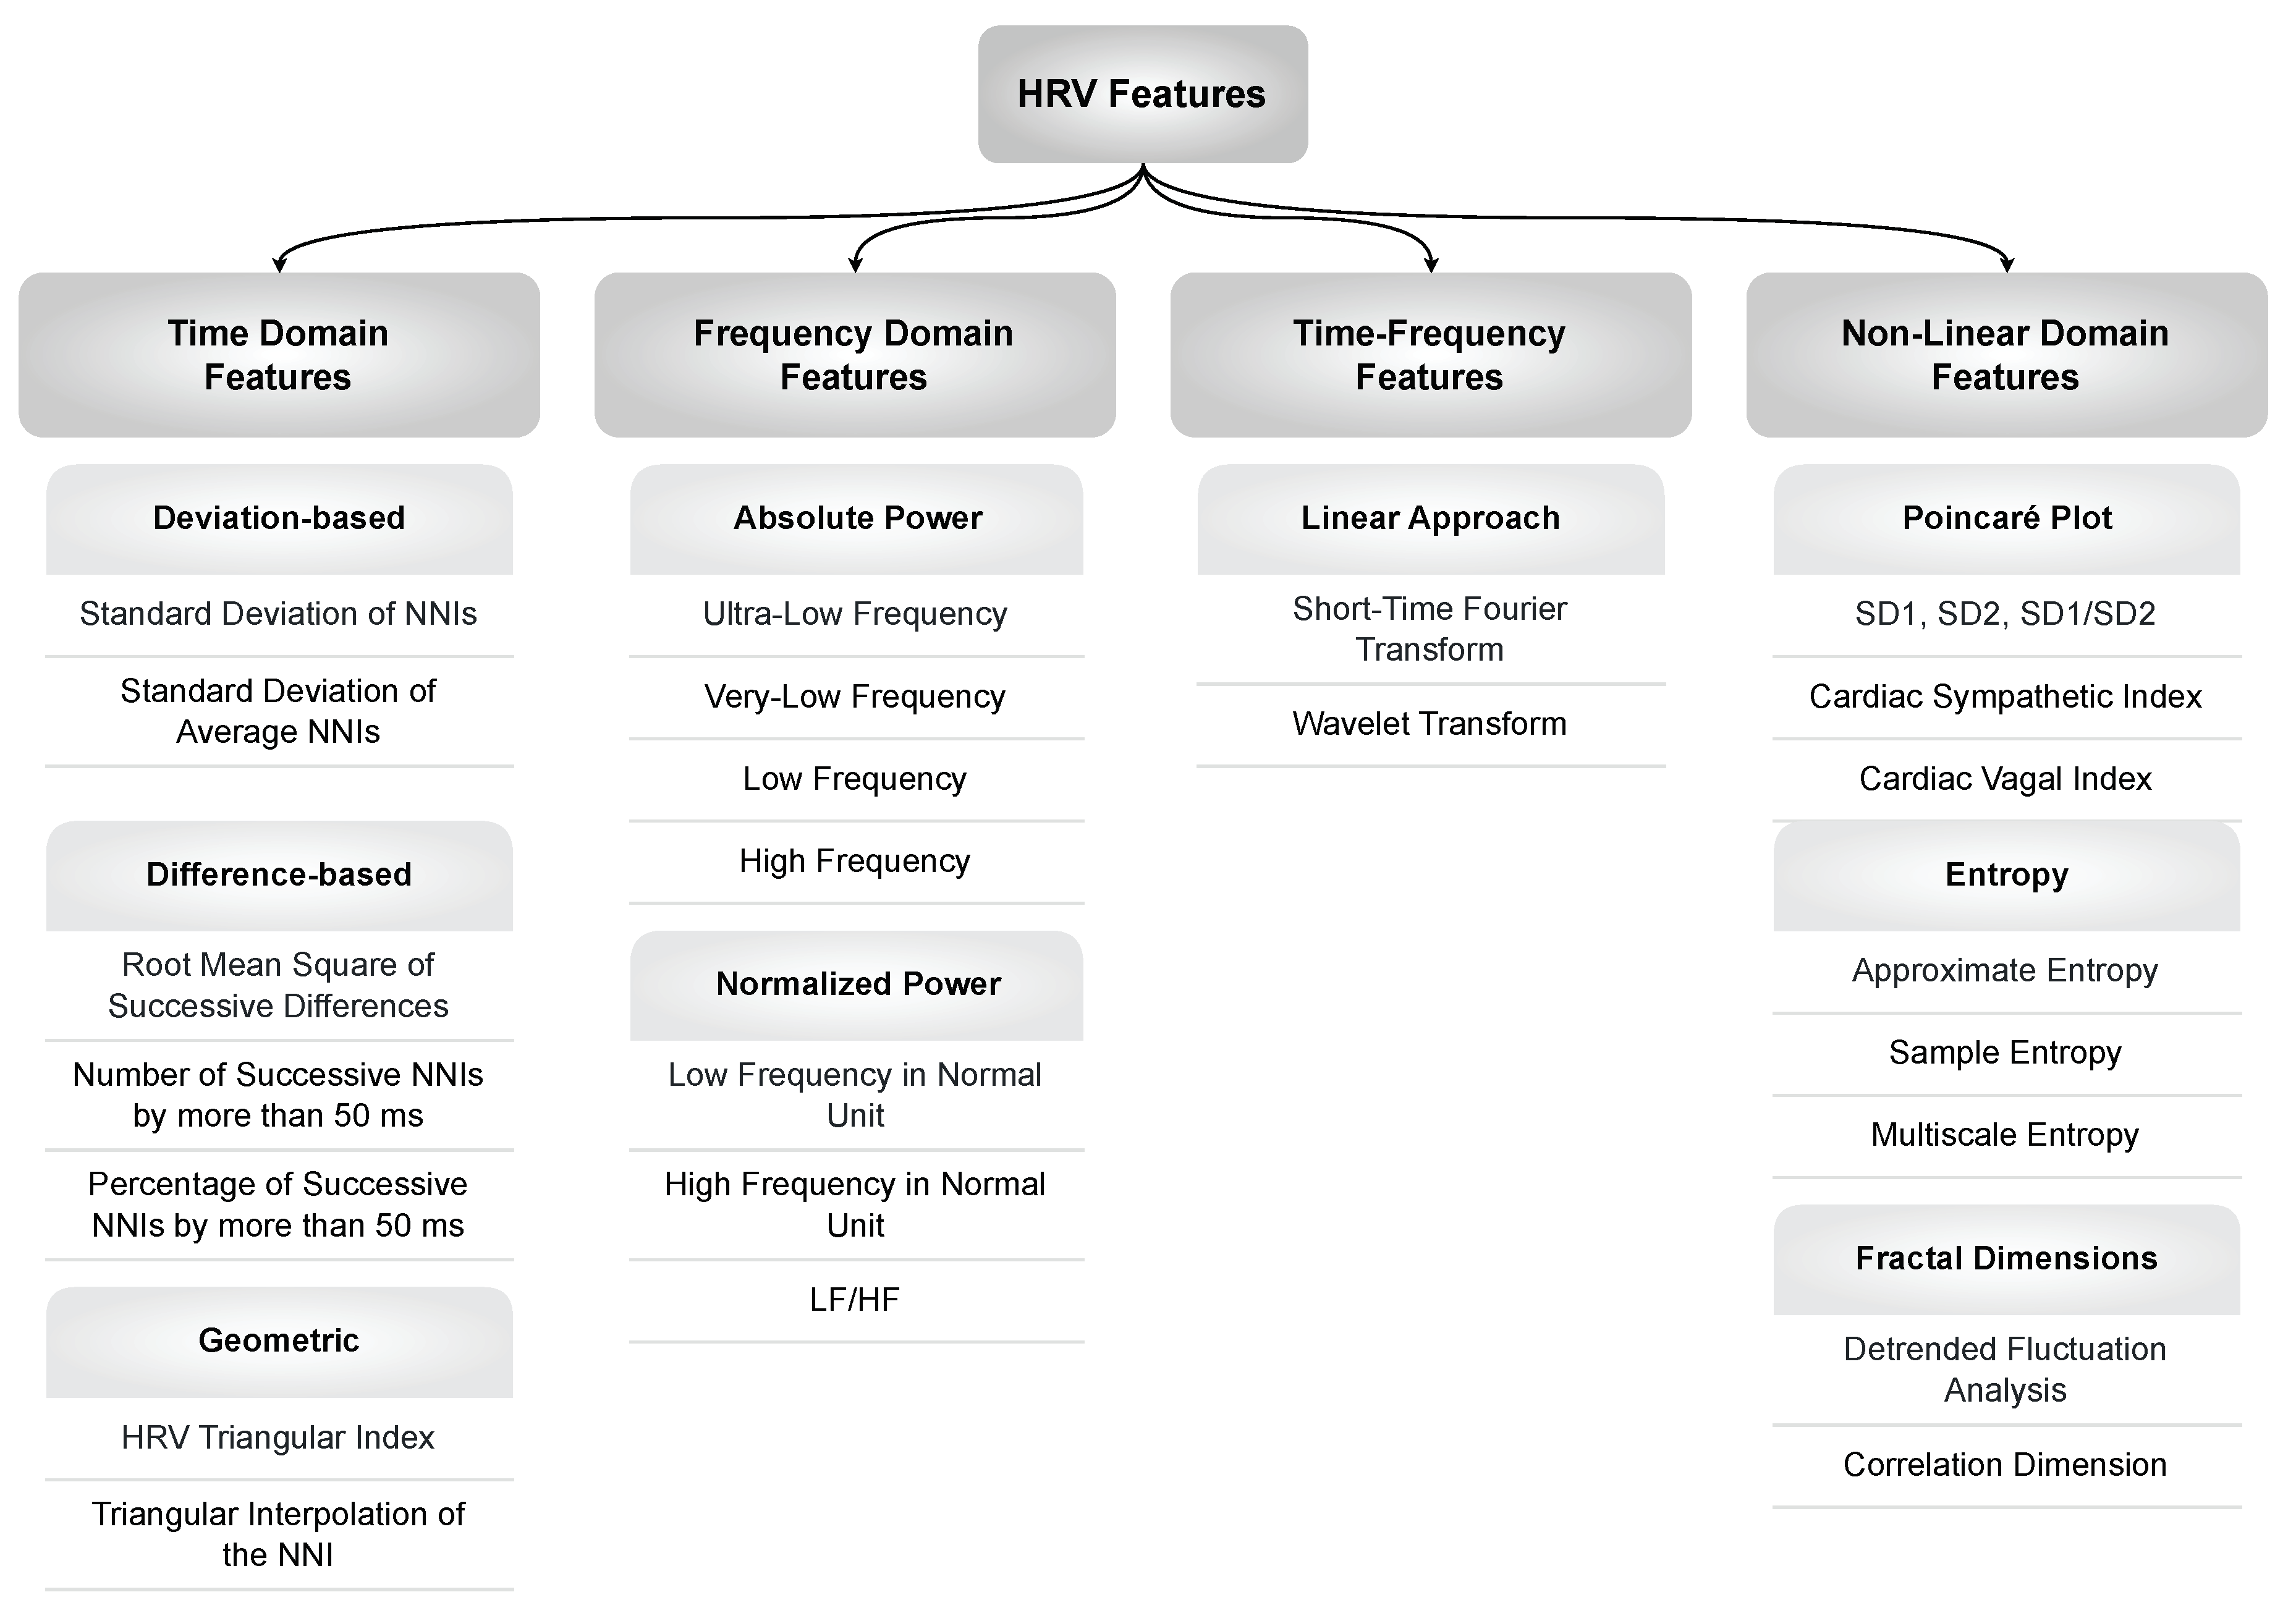
Figure 5.
Overview of Used Models in Seizure Prediction
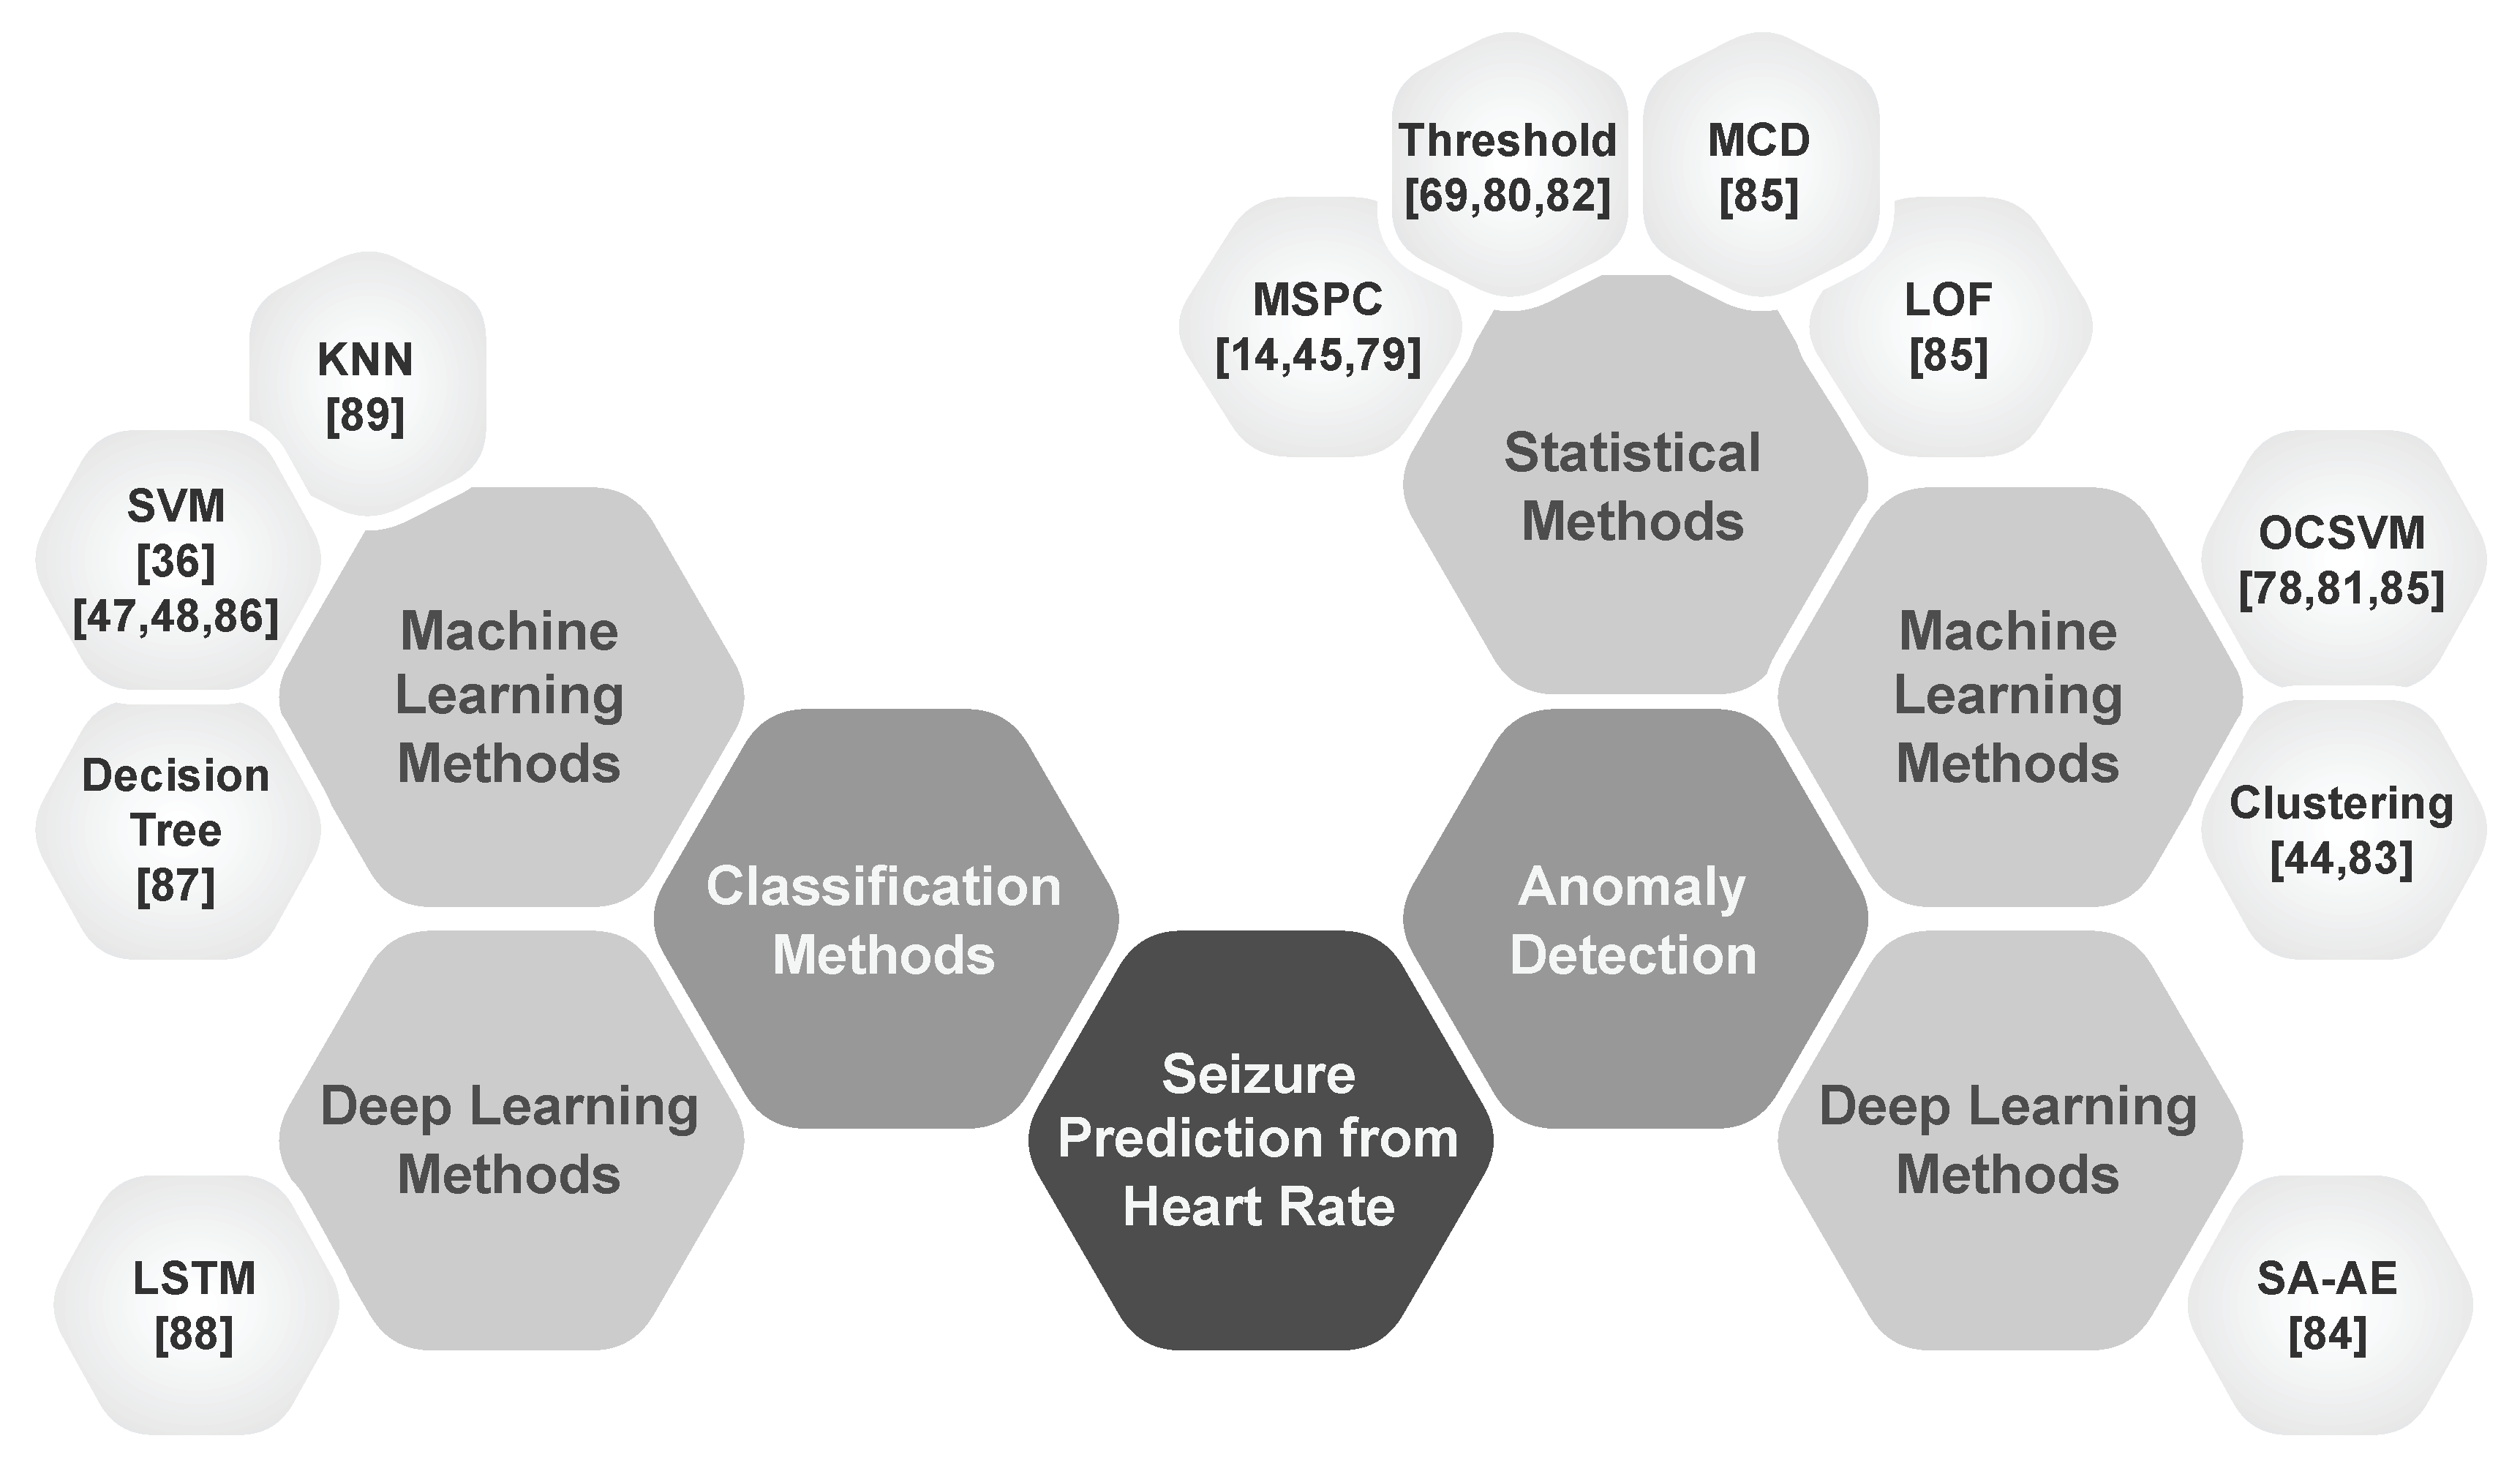
Figure 6.
Definition of Seizure Occurrence Period (SOP) and Seizure Prediction Horizon (SPH). A correct prediction is indicated when the seizure onset occurs after the SPH and within the SOP.
Figure 6.
Definition of Seizure Occurrence Period (SOP) and Seizure Prediction Horizon (SPH). A correct prediction is indicated when the seizure onset occurs after the SPH and within the SOP.
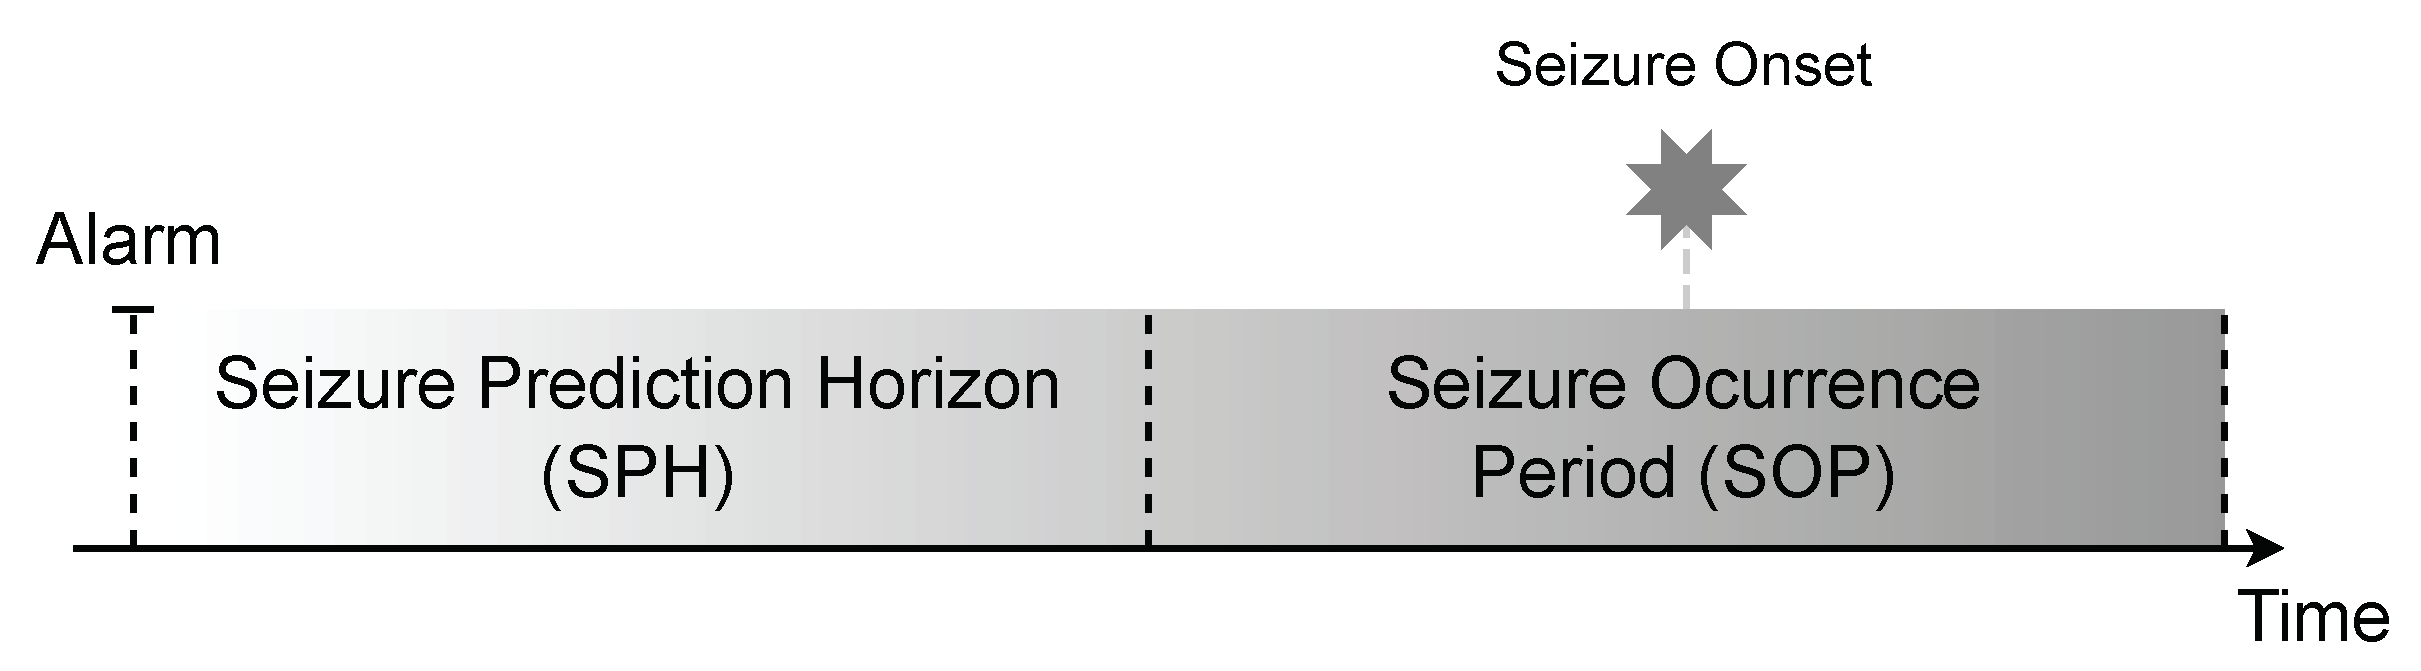
Table 1.
Seizure Prediction Datasets.
| Datasets | Year | Recording Types |
Number of Patients |
Number of Seizures |
Seizure Types |
Sampling Frequency (Hz) |
Total Duration (H) |
Ref |
|---|---|---|---|---|---|---|---|---|
| Siena | 2020 | EEG ECG |
14 | 47 | Focal | 512 | 128 | [29,30,31] |
| PIHROPE | 2000 | ECG | 7 | 10 | Partial | 200 | > 16 | [31,32] |
| EPILEPSIA | 2010 | EEG ECG |
275 | > 2400 | Focal Generalized |
250 - 2500 | > 40000 | [33,34] |
| Heraklion | 2019 | ECG | 9 | 42 | Focal | 256 | > 1900 | [36] |
Table 2.
Noise types with sources, frequency ranges, and filters to denoise.
| Noise Type | Noise Source | Frequency Range (Hz) | Common Solution |
|---|---|---|---|
| Powerline Interference | Electrical appliances | 50/60 and harmonics | Notch filter |
| Baseline Wander | Body movement and Respiration | < 0.5 | High-Pass Filter |
| Electromyographic | Muscle activity | > 100 | Low-Pass or Band-Stop Filter |
| Electrode Motion | Electrode displacement | < 200 | Electrode Placement |
Table 3.
Overview of important time domain features of HRV.
| Features | Unit | Description |
|---|---|---|
| Key Features | ||
| HR | bpm | The average number of heartbeats per minute. |
| RRI | ms | The time interval between two consecutive R-peaks |
| NNI | ms | Similarly, the time interval between two consecutive normal heartbeats. |
| Deviation-Based Features | ||
| SDNN | ms | Standard deviation of NN intervals |
| SDANN | ms | Standard deviation of short-term segments calculated from average NNIs. |
| Deviation-Based Features | ||
| RMSSD | ms | Root mean square of successive NN interval differences |
| NN50 | count | Counts the number of pairs of adjacent NNIs that differ by more than 50 ms. |
| pNN50 | % | Percentage of NNIs that differ by more than 50 ms. |
| Geometric Features | ||
| HTI | - | Integral of the density of the NN interval histogram divided by its height |
| TINN | ms | Baseline width of the triangular interpolation of the highest peak of all NN intervals |
Table 4.
Overview of important frequency domain features of HRV.
| Features | Unit | Description | Frequency Range |
|---|---|---|---|
| Key Features | |||
| TP | Total variance of HRV | ≤ 0.4 Hz | |
| Absolute Power | |||
| ULF | Power in the range of ultra-low frequencies | ≤ 0.003 Hz | |
| VLF | Power in the range of very low frequencies | 0.003 - 0.04 Hz | |
| LF | Power in the range of low frequencies | 0.04 - 0.15 Hz | |
| HF | Power in the range of high frequencies | 0.15 - 0.4 Hz | |
| Normalized Power | |||
| LFnu | % | Normalized power in the low frequency band | - |
| HFnu | % | Normalized power in the high frequency band | - |
| LF/HF | - | Ratio of LF to HF power | - |
Table 5.
Summary of important non-linear features of HRV.
| Non-linear Domain Feature | Description |
|---|---|
| Poincaré Plot | |
| Standard Deviation 1 (SD1) | Represents the dispersion of points along the identity line in the Poincaré plot. |
| Standard Deviation 2 (SD2) | Represents the dispersion of points perpendicular to the identity line in the Poincaré plot. |
| SD1/SD2 ratio | The ratio of short-term to long-term variability in the Poincaré plot. |
| Cardiac Sympathetic Index (CSI) | Measures the irregularity of HRV dynamics. |
| Cardiac Vagal Index (CVI) | Reflects the tendency of the heart to transition from stable to unstable dynamics. |
| Entropy | |
| Approximate Entropy (ApEn) | Quantifies the regularity and complexity of HRV time series. |
| Sample Entropy (SampEn) | Similar to ApEn, quantifies HRV irregularity and complexity, robust to noise. |
| Multiscale Entropy (MSE) | Measures HRV complexity over multiple timescales, including short and long-term dynamics. |
| Fractal Dimensions | |
| Detrended Fluctuation Analysis (DFA) | Identifies fluctuations in HRV correlations, providing insight into long-term self-similarity. |
| Correlation Dimension (CD) | Characterize HRV complexity and structure using phase space reconstruction. |
Disclaimer/Publisher’s Note: The statements, opinions and data contained in all publications are solely those of the individual author(s) and contributor(s) and not of MDPI and/or the editor(s). MDPI and/or the editor(s) disclaim responsibility for any injury to people or property resulting from any ideas, methods, instructions or products referred to in the content. |
© 2025 by the authors. Licensee MDPI, Basel, Switzerland. This article is an open access article distributed under the terms and conditions of the Creative Commons Attribution (CC BY) license (http://creativecommons.org/licenses/by/4.0/).
Copyright: This open access article is published under a Creative Commons CC BY 4.0 license, which permit the free download, distribution, and reuse, provided that the author and preprint are cited in any reuse.


