
Submitted:
11 April 2025
Posted:
11 April 2025
You are already at the latest version
Abstract
The increase in livestock numbers and insufficient precipitation have led to a decline in pasture biomass, resulting in grassland carrying capacity (GCC) and pasture degradation. In this study, net primary productivity (NPP) data, which were derived from the Global Land Surface Satellite (GLASS) and Moderate Resolution Imaging Spectroradiometer (MODIS) datasets spanning from 1982 to 2020, were firstly converted into aboveground biomass (AGB) and then used to estimate and assess long-term trends of GCC across Mongolia. Between 1982 and 2020, Mongolia's climate exhibited a warming and drying trend. Although livestock number have generally increased since 1982, certain years experienced declines due to winter dzud and summer droughts. These climatic changes reduce net primary productivity (NPP), further weakening the regenerative capacity of grasslands. Simultaneously, the increasing livestock number intensifies grazing pressure, surpassing the GCC. Finally, this grassland carrying capacity exceeded (GCCe) leads to reduced vegetation cover and desertification of grassland. Spatially, vegetation productivity and precipitation exhibited a declining gradient from north to south, whereas temperature increased progressively from to north to south. GCC assessments revealed that the eastern region of Mongolia could support current livestock number sustainably. In contrast, the western and southern regions, as well as parts of northern Mongolia, exhibited moderate to critical levels of grassland utilization. This study enabled a detailed analysis of grassland dynamics and climatic impacts, providing an assessment of temporal changes in Mongolia's GCC.
Keywords:
GCC
; NPP
; biomass
; livestock number
; Mongolia
1. Introduction
Grassland ecosystems, covering nearly 50% of the global terrestrial surface, are naturally distributed across all continents except Antarctica. [1,2,3,4]. Grasslands deliver essential ecosystem services, support rich biodiversity, and underpin the livelihoods of millions globally. [5,6,7]. Since the middle of the 20th century, grassland ecosystems have been subject to major environmental pressures due to climate change and intensive and extensive human activities [8]. Studying the relationship between grassland productivity and livestock production is important for ensuring the balance of forage and livestock, proper use of ecological safety and grassland[9,10,11]. The grassland carrying capacity (GCC) is defined as the maximum livestock number that the grassland resources of a given area can support sustainably [12]. There have been many studies on GCC in vast arid and semi-arid areas[13,14]. These studies have suggested that overgrazing is the main factor affecting grassland [15].
Impact factor analysis revealed the influence of livestock number contributed the most to the acceleration of over-exploitation of grassland in Mongolia [16]. Significant attention has been directed toward maintaining the balance between grassland productivity and livestock number. Vegetation productivity is a key indicator of grassland health and also serves as a fundamental parameter in calculating GCC [17,18,19]. The human impacts, such as overgrazing, agricultural expansion, forest utilization, and land cover changes, may contribute to grassland degradation [20,21,22]. Additionally, recent studies using remote sensing data have shown that climate change, including global warming and changes in precipitation regimes, has a significant impact on plant growth in grasslands[23,24,25]. GCC is primarily calculated based on forage biomass, with Mongolia relying on labor-intensive ground-based observations to measure aboveground biomass. Utilizing remote sensing data for estimating biomass and net primary productivity (NPP) offers significant advantages for future applications. Nevertheless, it remains essential for evaluating spatio-temporal patio-temporal variability of GCC in Mongolia.
Remote sensing via satellites was initiated in the late 1950s and further advanced during the early 1960s, with the first satellites launched in the early 1970s to collect data on Earth's surface and its resources [26,27]. Satellite-based vegetation data, such as NPP and NDVI, are widely used in grassland studies because of their advantages of frequent temporal coverage, global scale applicability, and cost-effectiveness [28,29]. Aboveground biomass (AGB) is closely related to NPP, making satellite-based NPP models valuable tools for estimating standing biomass. Once this process (due to the rigorous requirements for data verification and quality assessment, which are time-intensive and labor-intensive) is completed, a new phase can be initiated to compare the outputs of the NPP model with ground-based observations. Biomass estimation is particularly significant in dry and semi-arid regions, which are highly susceptible to environmental change [30,31,32,33,34]. Estimating GCC in the administrative unit level and vegetation zones is essential for effective livestock number management, ensuring the sustainable livelihoods of herders, and developing strategies for sustainable development. In this study, based on remote sensing data products, we estimate the GCC of Mongolia in the vegetation zone level. The main objectives were to; 1) explore the temporal and spatial variation of NPP and its relation to climate factors across Mongolia; 2) estimate the correlation between multi-year average GLASS NPP and MODIS NPP products and their comparison to field studies; 3) quantitatively determine whether current livestock grazing levels exceed the theoretical GCC.
2. Materials and Methods
2.1. Study Area
Mongolia is a landlocked nation situated between China to the south and Russia to the north. Its land area is 1564000 km2, The location of Mongolia is between 40o 30'-52o 10' of north latitude and 87o 44'-119o 58' of east latitude. The four distinct seasons: spring, summer, autumn, and winter, vary significantly in characteristics (National Statistic Book, 2018). Most part of Mongolia has a dry and cool continental monsoon climate. Mean annual precipitation is approximately 230 mm, of which 85-90% falls in summer months [11]. The natural zones mainly include alpine meadows and tundra, mountain taiga, forest steppe, high mountain, steppe, semi-desert, desert and water body [35] (Figure 1). As of the end of 2020 year, grassland and forest respectively account for 73.4% and 9.2% of the total land area in Mongolia, the remaining 17.4% of land belongs to urban land (0.5%), road and network (0.3%), water body (0.4%), and other land cover [36]. The Mongolian vast steppes have preserved the tradition of nomadic pastoralism for a long history. (Shagdar, 2002). As of 2020, there are population of 3.2 million, and 67068486 head of livestock number (114411412.7 sheep unit, SU).
2.2. Data Sources
Remote sensing products used in this study include: land surface temperature (LST), precipitation, Moderate Resolution Imaging Spectroradiometer (MODIS) MOD17 (GPP, NPP), and Global LAnd Surface Satellite (GLASS (GPP, NPP) data from 1982 to 2020. We obtained the statistics of all livestock number, grassland area and classification of vegetation zones from the Agency of Land Administration and Management, Geodesy and Cartography and National Statistics Committee of Mongolia (www.1212.mn). The administrative unit is used as a soum border.
2.2.1. Climate Data
Climate has an important effect on grassland quality. Excessive temperature increases harm plant growth while Precipitation has a positive effect on grassland productivity in particular, playing a greater role in grassland productivity [37,38,39]. LST serves as a reliable proxy for surface energy balance, as it reflects critical land surface processes across both regional and global scales [40]. In this study, LST data are obtained from MOD11C3, downloaded from the National Aeronautics and Space Administration (NASA) (https://lpdaac.usgs.gov/products/). MODIS/Terra LST Monthly L3 Version 041 with a resolution of 0.05 degrees (MOD11C3) was used. Monthly average precipitation data from 1982 to 2020 were downloaded from www.cds.climate.copernicus.eu. The dataset has a spatial resolution of 0.1x0.1 and has been rescaled to 0.05°x0.05°.
2.2.2. GLASS and MODIS Products
The GLASS GPP and NPP products were developed by Nana et al., (2023), and these data are available online at their website (http://www.glass. umd.edu/). This study used the annual NPP products with 0.05◦ spatial resolution. NPP, is the reduction of GPP after autotrophic respiration, i.e., the net carbon gain by plants [41]. Therefore, NPP derived from satellite data is usually used to evaluate the responses of ecological processes to global change [42].
The MODIS GPP and NPP products can be estimated under different time and climate conditions and are consistent with field measurements of NPP [41]. Moreover, the NPP/GPP ratio remained stable regardless of variations in carbon availability and temperature for both herbaceous and woody vegetation [43,44]. NPP is a useful product to accurately measure plant growth [45,46]. This study used the 500m*500m annual NPP products of GLASS (http://www.glass.umd.edu/index.html). The GLASS NPP products are long-term products, while MODIS NPP have high spatial resolution and are continuous over a wide area since 2000.
2.2.3. Field Data
In 2019, we collected 295 ground biomass samples along a 900 km stretch of railway in Mongolia, between latitudes 43°N and 50°N. Samples were taken both inside the railway’s protective fence and from adjacent areas outside the fence. The sampling locations encompassed various grassland types, including forest steppe, steppe, semi desert and desert regions (Figure 1).
2.2.4. Vegetation Zone
There is a spatial variability in GCC across vegetation zones. The vegetation in the territory of Mongolia was first classified in 1950 by the Soviet scientist A.A. Yunatov and later in 1979 by Yunatov and Dashnyam who made the 1:1500000 scale of the vegetation map of the Mongolia. In this study, we used the vegetation categories of Mongolia from[47], including high mountain, forest steppe, steppe, desert steppe and desert zones. The vegetation zone level is separated by the soum border. Within these zones, annual vegetation biomass production and the daily grass biomass consumption per livestock are calculated differently
2.3. Methodology
We represented multi-year average grassland biomass data estimated from GLASS NPP and MODIS NPP products, while data of grazing duration, daily forage intake per sheep and grassland area were from the Agency for Land Administration, Geodesy and Cartography and the coefficients for converting livestock to sheep unit (SU) were from [48].
2.3.1. Estimate of GCC
GCC means the livestock number that grazes the in grassland for a certain duration that does not negatively impact grassland vegetation increase, development and regeneration [49]. When current livestock number exceed theoretical grazing capacity, plant productivity declines, soil erosion increases, and ecosystem stability is compromised. To assess forage sufficiency, supply, and grazing capacity, livestock number are converted to sheep units. In consideration of the large variations in live weight and production among livestock number (camel, goat, horse, sheep and cattle), they were converted to the sheep unit (SU) using conversion factors: 5.0 for camel (Ca), 0.9 for goat (G), 7.0 for horse (H), 1.0 for sheep (S), and 6.0 for cattle (Co) [50]. Thus, the actual total livestock number (NSU) is calculated with (Eq. 1). Sheep unit (SU) was used to standardize grazing demand of biomass in dry weight among different herbivore species. The daily forage intake per sheep unit varies according to vegetation zone, ecological region, and season, with estimates of 1.7 kg/d in forest steppe zones, 1.5 kg/d in high mountain zones, 1.6 kg/d in steppe zones and 1.3 kg/d in desert steppe and desert zones.
This study examines vegetation changes in Mongolia over the past 38 years from 1982 to 2020, using remote sensing products. GCC is usually estimated based on grass production derived from the remote sensing NPP data of grassland. Predicted aboveground biomass (AGB) was estimated from the GLASS NPP and MODIS NPP products[26,51]. Previous studies on AGB derived from GLASS data have demonstrated that this approach achieves reliable accuracy for analyzing vegetation growth trends and biomass fluctuations and evaluating carrying capacity across various spatial extents [32,52,53]. [52]reported that MODIS NPP data are already validated and extensively applied in ecosystem productivity assessments and carbon flux analyses, and used in examining large-scale environmental transformations. MODIS and GLASS data processing and mapping modeling were implemented in PyCharm and ArcGIS. Therefore, in this study, we estimated grassland biomass by utilizing GLASS and MODIS NPP products. Subsequently, the GCC is calculated using (Eq. 2):
where AGB (kg·ha⁻¹·yr⁻¹) is the annual aboveground biomas, A (m2) is the grassland area for each vegetation zone, Int is the daily biomass intake of one standard sheep unit (kg/d). D is the number of grazing days (d) and is set to the whole year of grazing in Mongolia. AGB in each vegetation zone and in each soum was calculated. It is calculated using the conversion coefficient (fc) from NPP to biomass. The AGB utilization factor is based only on available biomass.
The imbalance between the number of livestock and GCC results in what is sometimes termed ‘‘GCCe’’ i.e., when the requirements of livestock number seriously exceed the GCC and lead to the destruction of vegetation, soil erosion, and pasture degradation. The GCC excess () is defined as the ratio of the livestock number and GCC in each vegetation zone (Eq. 3) [54,55,56].
where is the grassland carrying capacity excess (%), LN is total livestock number in sheep unit (SU). The indicates the grazing conditions as follows: <0.5 (0-50%), reserve of grassland; = 0.5-1 (50-100%), light grazing; = 1.0-3.0 (100-300%), moderate grazing; 3.0-5.0 (300%-500%), overgrazing; and > 5.0 (500%), extremely overgrazing [48,57].
2.3.2. Correlation Analysis of the NPP and Climate Variables
In this study, the Pearson correlation coefficient was computed at the pixel level to quantify the strength and direction of the linear relationship between net primary productivity (NPP) and climate variables across Mongolia during the study period (1982–2020), as defined in (Eq. 4). This statistical measure assesses the degree of association between two continuous variables.
where , is the correlation coefficient, , represents the number of years (1982–2020), and are the annual NPP and climate variable values in year , and and denote their respective long-term means. A positive indicates a direct relationship, a negative value indicates an inverse relationship, and a value of zero denotes no linear association [58].
2.3.3. Estimate of AGB:
Biomass estimation based on NPP indicates the total organic matter produced within an ecosystem over a defined period. This is derived by deducting autotrophic respiration (R) from GPP as shown in (Eq. 5). Estimating aboveground biomass plays a fundamental role in evaluating grassland carrying capacity and is applicable across different global ecosystems. When directly converting NPP to biomass, some regions apply a straight forward conversion factor of 0.475, while in others, the conversion coeficient varies depending on geographic zone, plant species, climate, and environmental conditions [11,51,59,60,61,62] (Eq. 6). In this study, we applied a fc of 0.57 for forest and high mountain zones, 0.65 for steppe zones, and 0.67 for desert and desert-steppe zones, based on the biomass estimation framework for each vegetation zone approved by the Government of Mongolia in 2019.
(5)
2.3.4. Biomass Field Sample Data
Biomass calculations were performed according to the methodology outlined in Section 2.3.2. The accuracy of the 2019 NPP predictions was evaluated by calculating the annual average NPP for that year, following the evaluation procedure described earlier. Then in the field survey, collected samples were averaged according to each corresponding MODIS pixel, and biomass was calculated. For permanent vegetation, the above-ground biomass was harvested from 1 m² quadrats, dried, and weighed. The geographic coordinates of each plot were recorded using a GPS device.
2.3.5. Mann-Kendall Trend Test
To evaluate temporal changes in biomass derived from remote sensing data, the Mann-Kendall (MK) trend test was applied. This non-parametric method identifies monotonic trends, with values ranging from −1 (indicating a strong negative trend) to +1 (indicating a strong positive trend). The rate of change for each pixel was computed using Sen’s slope estimator, which quantifies the trend magnitude assuming a linear progression. Significance levels were set at 0.01 (strong), 0.05 (medium), and 0.1 (low) [58,63,64].
3. Results
3.1. Comparison GLASS and MODIS Products and Their Spatiotemporal Variations
Both MODIS NPP and GLASS NPP products were used for assessing status or dynamic of grassland vegetation in time and space scales in Mongolia. GLASS products differed from MODIS products in spatial and temporal resolutions. In terms of the correlation coefficient (R) and coefficient of determination (R²) of the two products since 2000 is highly correlated (R = 0.82, R² = 0.90 NPP, p < 0.001). The trend of GLASS NPP products decreased, while the MODIS NPP products showed an increasing trend in Mongolian territory (Figure 2A–C). The long-term average growth exhibited spatial discrepancy between the GLASS and MODIS products. This may be due to the differences in temporal and spatial resolution of these satellite products.
Table 1 shows the Multi-year average NPP increase for different vegetation zones in Mongolia. It was higher in forest-steppe regions and lower in desert and desert steppe regions. During the study period, the increase in multi-year average grassland biomass (GLASS NPP) was 0.56 kg·ha⁻¹·yr⁻¹, while MODIS NPP increased annually on average by 1.0 kg·ha⁻¹·yr⁻¹. These rates of biomass increase varied across different regions of Mongolia. For the GLASS product, notable significant variations were observed primarily in the northern forest-steppe zone, as well as in the southern and southwestern regions of Mongolia, which include desert, desert steppe, and high mountain vegetation zones. Within these areas, a distinct greening trend was evident in the southern and western regions, whereas significant vegetation decline was observed in the eastern and central parts of the country. For the MODIS product, a significant increase in vegetation growth was observed in most parts of Mongolia, particularly in the northern and eastern regions.
The long-term average aboveground biomass (AGB) generally decreased from north to south. The northern forest-steppe region had the highest AGB of 682 kg·ha⁻¹·yr⁻¹, while the southern desert and semi-desert steppe regions had the lowest AGB of 0.0 kg·ha⁻¹·yr⁻¹, with more than 70% of the total area yielding 0–50 kg·ha⁻¹·yr⁻¹ of biomass (Figure 3).
3.2. Validation of Aboveground Biomass.
Figure 3 illustrates the significant regional variations in NPP across Mongolian grasslands. The most productive grasslands, with NPP values of 651 kg·ha⁻¹·yr⁻¹ (GLASS) and 682 kg·ha⁻¹·yr⁻¹ (MODIS) of dry biomass per hectare, are found in the northern and eastern parts of Mongolia. In contrast, the western and southern regions, which consist of dry mountains, deserts, and semi-desert steppes, exhibited lower productivity, with NPP values reaching as low as 0 kg·ha⁻¹·yr⁻¹ in some areas. MODIS NPP data from 2019 indicate that the specific plot where field biomass was measured showed a field biomass value (289 kg·ha⁻¹·yr⁻¹) that was 44% higher than the average NPP (160 kg·ha⁻¹·yr⁻¹) of the associated heterogeneous MODIS pixel (comparison R2=0.32, R=0.57, P<0.001). The field sample's 2019 analysis was determined to be 53% higher than the multi-year average GLASS NPP pixel and 49% higher than the multi-year average MODIS NPP pixel (Figure 4).
3.3. Influences of Climate Factors on Grassland Productivity
The climatic variables in Mongolia from 1982 to 2020 exhibited various trends based on the multi-year averages. Over the past 38 years, the slope of the precipitation trend decreased by -0.0054 mm/year (R2 = 0.34, p=0.01), while temperature has increased by 0.0478 ℃/year (R2 = 0.28, p=0.01). At the national scale in Mongolia, the relationship between precipitation and grassland productivity is positive, with a correlation coefficient exceeding 0.80, while the relationship between grassland productivity and temperature is negative, with a coefficient smaller than -0.60 (Figure 5). The above analysis clearly indicates that both precipitation and temperature influence NPP, with precipitation exerting a more pronounced impact compared to temperature.
3.4. Multi-Year Trends of Livestock Number
Statistical records show that Mongolia’s livestock population, primarily consisting of five main (sheep, goat, cattle, horse and camel) domestic species reached 67,603,539 SU. Between 1982 and 2020, it exhibited an average annual growth of 1,620,819 SU, with a moderate upward trend (R² = 0.5798). Among them, horses were the most numerous, accounting for 26.9%; the numbers of cattle, goats, and sheeps accounted for 26.7%, 17.3%, and 25.8%, respectively and camels were the least numerous, with only 3%. The livestock number in Mongolia has consistently increased nearly 2.2 times from 50,767.4 SU in 1982 to 114,411.3 SU in 2020.
Spatially, significant variations in livestock distribution were observed across vegetation zones. The forest-steppe zone experienced the largest increase, with 27,248,735 SU (42%), while the desert zone saw the smallest increase, with 3,467,634 SU (5%). The livestock number was 8,582,882 SU (13%) in high mountain zone, 16,431,843 SU (25%) in the steppe zone, and 9,360,832 SU (14%) in the desert-steppe zone, respectively. The increase in Mongolia's livestock number has intensified the utilization of grassland resources. The multi-year average increase in livestock numbers ranged from a minimum of 25,000 to a maximum of 600,000.
Only 6-7% of Mongolia's total land area had the capacity to support more than 300,000 SU (Table 2). These regions demonstrated a high potential for grazing, offering substantial grassland resources that can sustain more herds without exceeding the theoretical GCC.
3.5. Spatiotemporal Variations of GCC
The MODIS NPP and GLASS NPP products facilitate a detailed spatial and temporal analysis of forage availability across various regions. There was a significant variability in grazing capacity across Mongolia’s diverse vegetation zone. Our studies have quantified the extent to which grazing intensity surpasses theoretical GCC in various regions. The spatial patterns of current grassland use, based on estimated GCC and GCCe, indicate that grasslands in eastern Mongolia are sustainable. In contrast, GCC in the central and western regions exhibits significant spatial variability. The steppe and forest-steppe areas have the highest GCC, whereas the desert and semi-desert regions display much lower GCC, primarily due to lower NPP and limited forage availability (Figure 6). This disparity can result from variations in climatic and vegetative environments across the two areas. Although grazing capacity has been exceeded in most regions of Mongolia, some areas remain below their theoretical GCC, particularly in the eastern region. This suggests that these grasslands have the potential to support a larger livestock number.
4. Discussion
4.1. Comparison of GLASS and MODIS Products and Their Biomass
Remote sensing data has been proved to advance the monitoring of biomass and NPP of ecosystem. The precision of the biomass calculation method relies primarily on the NPP estimation error [64,65,66]. The GLASS NPP product was validated with field measurements in 2010 and 2011, and the error was found to be less than 15% [67]. It is reported that MODIS NPP data are already validated and extensively applied in estimating vegetation biomass at both global and regional scales, as well as in studies of carbon cycling and climate change. (e.g., [32,53,68]). There are several models developed to estimate aboveground biomass (AGB) during July–August on the Mongolian Plateau. Validation results demonstrated satisfactory performance, with R² and RMSE values of 0.68 and 76.9 g/m², respectively 0.68 and 76.9 g/m2 [11,69]. [33] found that the relationship between GLASS NPP and field measurements was between R=0.60-0.80. While validation outcomes varied across studies depending on data sources and methodologies, they demonstrated consistent agreement within acceptable margins of error [11]. These research results were comparable to the NPP and AGB observations, indicating that they can be effectively utilized for analyzing changes in grassland productivity and GCC variations in Mongolia. The significant variation in precipitation and temperature, along with the geographically unique environment and different natural zones, further complicates the relationship between NPP and biomass calculation [70].
Our study found that the agreement between field studies and RS products is 45-55 percent, with low consistency in terms of R² and RMSE. Moreover, incorrect biomass estimates could lead to inaccurate assessments of grassland carrying capacity. Therefore, using plant growth periods for calculations is considered a more reliable approach [12,71].
4.2. Influence of Climate Factors on Grassland Productivity
Grassland productivity is influenced by through the interaction of precipitation and temperature, with a stronger correlation observed when both factors are considered together rather than individually. This suggests that while precipitation promotes grassland growth, high temperatures impose a limiting effect. Productivity was inversely related to temperature and positively related to precipitation, with lower NPP occurring during hot-dry intervals and higher during cool-wet periods [38,72]. To be brief, precipitation is higher in the northern forest-steppe region of Mongolia and lower in the desert and arid steppe regions, temperature exhibits the opposite pattern. Our findings also confirm a negative relationship between temperature and grassland NPP (or GPP), as well as a positive relationship between precipitation and NPP (or GPP). Research conducted in Mongolia highlights that precipitation is the only factor demonstrating a significant positive correlation with NPP in grassland [73]. The findings of this research aligned with those of previous investigations into the connections among precipitation, temperature, and NPP. Additional information is available in e.g, [11,74].
4.3. Influences of Livestock Number Size on GCC
Livestock number are the primary factor influencing GCC and livestock number have increased across Mongolia [48]. The livestock number is far beyond theoretical GCC, and subsequently the plant growth is strongly restricted across the country. Increase in livestock number potentially influence changes in the GCC in national level and vegetation zones. Immediate measures should prioritize both herd reduction and optimized grassland productivity to restore ecological balance [75,76]. However, these patterns are not consistent in different vegetation zones. A large livestock number on grassland does not necessarily indicate that the grazing capacity is exceeded. In the forest-steppe region, high precipitation enhances vegetation growth, thereby providing sufficient forage for livestock. Furthermore, the recent decline in vegetation productivity, especially in the transitional zone between grasslands and the Gobi desert in Mongolia, is primarily attributed to rising livestock populations and intensified grazing pressure [77]. Over the study period, widespread livestock mortality occurred across Mongolia's vast territory due to the occurrence of severe summer drought and winter dzud (extreme weather) events of 1999–2000, 2000–2001, 2001–2002 and 2009–2010. These events caused significant economic losses, leading to a substantial decrease in livestock number [48,78]. Addressing the imbalance between livestock density and GCC is essential for sustaining grassland productivity and preventing exceedance of GCC.
4.4. Regional GCC and Grazing Management
Grassland NPP is a key indicator of biomass and one of the main factors limiting and affecting GCC [73,79]. Our findings indicate that in the eastern regions of Mongolia, particularly in the steppe zones, grassland resources are generally sufficient. In contrast, the desert steppe and desert zones often face significant grassland shortage. Excessive grazing in transitional zones may result in the contraction of grassland areas and the expansion of the Gobi desert, subsequently reducing vegetation productivity and grassland degradation [74]. These regional differences in GCC reflect the variability in grassland productivity and livestock densities across Mongolia and highlight the need for focal interventions in overgrazed areas. The widespread overgrazing, particularly in the central and western regions, underscores the pressing need for policies focused on reducing livestock number and implementing effective grassland management strategies. Additionally, the combination of summer droughts and excessive livestock increase has led to a significant reduction in grassland biomass. As a result, more than half of Mongolia's land area is currently experiencing overgrazing, with the GCC being exceeded in many regions [48,80].
The extent to which grassland forage is utilized significantly influences its availability and is generally defined to promote sustainable resource management and avoid ecological deterioration [17,81] generally recommended maintaining a forage utilization rate of 50% to preserve grassland health [82,83] advised limiting the forage utilization rate to 30%. Similarly, [9,84] concluded that utilizing 25% of the forage production is advisable to ensure sustainable forage availability reduce shortage and prevent grassland degradation [11]. These results may change depending on the remote sensing data and field survey validation. Furthermore, in regions with plenty grassland resources, additional livestock could be grazed, while in overgrazed areas, livestock number should be reduced to ensure sustainable grassland management. However, there remains room for improving the precision of GCC assessments in the future.
5. Conclusions
Based on MODIS NPP and GLASS NPP and climate and livestock datasets, this study estimated the multi-year average GCC in Mongolia from 1982 to 2020. It explored the spatiotemporal patterns of GCC and examined the main factors influencing these patterns within the context of vegetation zonation. Our analysis reveals pronounced spatial disparities in GCC and grazing resources, influenced by vegetation conditions, livestock number, and climate change. Approximately 30-40% of Mongolia's total territory is sustainable in terms of GCC, and only 7% of the area capable of supporting over 300,000 SU. From a vegetation zone perspective, the steppe zone contains the largest areas with adequate grazing capacity, whereas the desert and desert-steppe zones have the lowest grazing capacity. These findings demonstrate that dynamic, evidence-based stewardship is essential for mitigating overgrazing impacts and safeguarding Mongolia's pastoral ecosystems. Finally, the assessment using both MOD NPP and GLASS NPP can provide a comprehensive understanding of the GCC across Mongolia.
Author Contributions
R.Boldbayar; Conceptualization, Formal analysis, methodology, software, validation, investigation, writing—original draft preparation, writing—review and editing, Shenggong Li; Conceptualization, formal analysis, project administration, funding acquisition, supervision, writing—original draft preparation Qun Guo; data curation, funding acquisition Ch.Javzandolgor; resources, visualization, M.Urtnasan, B.Dul; investigation, A.Dashtseren, resources. All authors have read and agreed to the published version of the manuscript.
Data Availability Statement
The data used in satellite data is open access, field research data used in the article are available from the author.
Acknowledgments
This research was supported by the National Key Research & Development Plan (2024YFF1306101), the National Natural Science Foundation of China (31961143022, 32171555) and the Mongolian Foundation for Science and Technology (MFST 2022/176).
Conflicts of Interest
The authors declare no conflict of interest.
References
- J. M. Suttie, S. G. J. M. Suttie, S. G. Reynolds, and C. Batello., Grasslands of the World. 2005.
- J. Latham, R. J. Latham, R. Cumani, I. Rosati, and M. Bloise, “FAO Global Land Cover SHARE,” Database Beta-Release Verion 1.0, p. 40, 2014, [Online]. Available: http://www.glcn.org/downs/prj/glcshare/GLC_SHARE_beta_v1.0_2014.
- & F. ILRI, I. & F. ILRI, I. and L. ILC, W. UNEP, Rangelands Atlas. 2021.
- S. A. Lemaire and L. Russell, “Epidemiology of thoracic aortic dissection,” Nat. Rev. Cardiol., vol. 8, no. 2, pp. 2011. [CrossRef]
- J. Bengtsson et al., “Grasslands—more important for ecosystem services than you might think,” Ecosphere, vol. 10, no. 2019; 2. [CrossRef]
- S. Sala, E. S. Sala, E. Crenna, M. Secchi, and R. Pant, “Global normalisation factors for the environmental footprint and Life Cycle Assessment.,” no. December, pp. 1–16, 2017.
- N. Sunjidmaa, C. Mendoza-Lera, S. Hille, C. Schmidt, D. Borchardt, and D. Graeber, “Carbon limitation may override fine-sediment induced alterations of hyporheic nitrogen and phosphorus dynamics,” Sci. Total Environ., vol. 837, no. May, p. 15 5689, 2022. [CrossRef]
- Z. Han, W. Z. Han, W. Song, X. Deng, and X. Xu, “Grassland ecosystem responses to climate change and human activities within the Three-River Headwaters region of China /704/844/841 /704/844/682 /704/844/685 /134 /141 article,” Sci. Rep., vol. 8, no. 1, pp. 2018; 13. [Google Scholar] [CrossRef]
- Xu Min-yun and He Jin-sheng, “A review of grassland carrying capacity: definition, theoretical consideration and model,” 2014.
- Q. Zhang, F. Cui, L. Dai, B. Feng, Y. Lu, and H. Tang, “Pastoralists’ perception of and adaptation strategies for climate change: associations with observed climate variability,” Nat. Hazards, vol. 96, no. 3, pp. 1387– 1412, 2019. [CrossRef]
- N. Yan et al., “Assessment of the grassland carrying capacity for winter-spring period in Mongolia,” Ecol. Indic., vol. 146, no. January, p. 10 9868, 2023. [CrossRef]
- J. de Leeuw et al., “Int J Appl Earth Obs Geoinformation Application of the MODIS MOD 17 Net Primary Production product in grassland carrying capacity assessment,” Int J Appl Earth Obs Geoinf., vol. 78, no. 18, pp. 20 March 2019; 76. [CrossRef]
- H. K. Zhou, X. Q. H. K. Zhou, X. Q. Zhao, L. Zhou, Y. Tang, W. Liu, and Y. Shi, “Application of analytic hierarchy process on the alpine grassland degradation in the source region of the Yangtze and Yellow rivers,” Resour. Sci., vol. 27, no. 4, pp. 63–70, 2005.
- J. Kioko, J. W. J. Kioko, J. W. Kiringe, and S. O. Seno, “Impacts of livestock grazing on a savanna grassland in Kenya,” J. Arid Land, vol. 4, no. 1, pp. 2012; 35. [Google Scholar] [CrossRef]
- J. Umuhoza et al., “The analysis of grassland carrying capacity and its impact factors in typical mountain areas in Central Asia—A case of Kyrgyzstan and Tajikistan,” Ecol. Indic., vol. 131, p. 10 8129, 2021. [CrossRef]
- Y. Nana et al., “Assessment of the grassland carrying capacity for winter-spring period in Mongolia,” Ecol. Indic., vol. 146, no. October 2022, p. 10 9868, 2023. [CrossRef]
- J. L. Holechek, “An Approach for Setting the Stocking Rate,” Rangelands, vol. 10, no. February, pp. 10–14, 1988.
- E. R. Hunt and B. A. Miyake, “Comparison of stocking rates from remote sensing and geospatial data,” Rangel. Ecol. Manag., vol. 59, no. 1, pp. 2006; 18. [CrossRef]
- L. YU, L. L. YU, L. ZHOU, W. LIU, and H. K. ZHOU, “Using Remote Sensing and GIS Technologies to Estimate Grass Yield and Livestock Carrying Capacity of Alpine Grasslands in Golog Prefecture, China,” Pedosphere, vol. 20, no. 3, pp. 2010. [Google Scholar] [CrossRef]
- C. Gang, W. C. Gang, W. Zhao, T. Zhao, Y. Zhang, X. Gao, and Z. Wen, “The impacts of land conversion and management measures on the grassland net primary productivity over the Loess Plateau, Northern China,” Sci. Total Environ., vol. 645, pp. 2018. [Google Scholar] [CrossRef]
- Y. Zhao, W. Chi, W. Kuang, Y. Bao, and G. Ding, “Ecological and environmental consequences of ecological projects in the Beijing–Tianjin sand source region,” Ecol. Indic., vol. 112, no. January, p. 10 6111, 2020. [CrossRef]
- Y. Cai, M. Zhao, Y. Shi, and I. Khan, “Assessing restoration bene fi t of grassland ecosystem incorporating preference heterogeneity empirical data from Inner Mongolia Autonomous Region,” Ecol. Indic., vol. 117, no. June, p. 10 6705, 2020. [CrossRef]
- J. Chen et al., “Estimation of nitrogen and carbon content from soybean leaf reflectance spectra using wavelet analysis under shade stress,” Comput. Electron. Agric., vol. 156, no. 17, pp. 20 December 2019. [CrossRef]
- Y. Liu et al., “Assessing the effects of climate variation and human activities on grassland degradation and restoration across the globe,” Ecol. Indic., vol. 106, no. June, p. 10 5504, 2019. [CrossRef]
- N. Yang, L. N. Yang, L. Chen, W. Wang, and Z. Shen, “The land carrying capacity and environmental risk assessment of livestock and poultry breeding considering crop planting,” pp. 51356–51368, 2021.
- S. M. de Jong, F. D. S. M. de Jong, F. D. van der Meer, and J. G. P.. Clevers, “Basics of Remote Sensing,” pp. 2004; 15. [Google Scholar] [CrossRef]
- N. C. Coops and T. R. Tooke, “Learning Landscape Ecology,” Learn. Landsc. Ecol. 2017. [CrossRef]
- S. K. Langley, H. M. S. K. Langley, H. M. Cheshire, and K. S. Humes, “A comparison of single date and multitemporal satellite image classifications in a semi-arid grassland,” J. Arid Environ., vol. 49, no. 2, pp. 2001. [Google Scholar] [CrossRef]
- C. He, Q. C. He, Q. Zhang, Y. Li, X. Li, and P. Shi, “Zoning grassland protection area using remote sensing and cellular automata modeling - A case study in Xilingol steppe grassland in northern China,” J. Arid Environ., vol. 63, no. 4, pp. 2005. [Google Scholar] [CrossRef]
- G. J. Ikenberry, “A More Secure World: Our Shared Responsibility,” Foreign Aff., vol. 84, no. 3, p. 2005. [CrossRef]
- YY. A. Titlyanova, I. P. YY. A. Titlyanova, I. P. Romanova, N. P. Kosykh, N. P. Mironycheva-Tokareva, and N. P. & Kosykh, “International Association of Vegetation Science Pattern and Process in Above-Ground and Below-Ground Components of Grassland Ecosystems Pattern and process in above-ground and below-ground components of grassland ecosystems,” Source J. Veg. Sci., vol. 10, no. 3, pp. 307–320, 1999.
- Rasmus, Fensholt, I. Sandholt, M. S. Rasmussen, S. Stisen, and A. Diouf, “Evaluation of satellite based primary production modelling in the semi-arid Sahel,” Remote Sens. Environ., vol. 105, no. 3, pp. 2006. [CrossRef]
- C. Eisfelder, I. C. Eisfelder, I. Klein, A. Bekkuliyeva, C. Kuenzer, M. F. Buchroithner, and S. Dech, “Above-ground biomass estimation based on NPP time-series − A novel approach for biomass estimation in semi-arid Kazakhstan,” Ecol. Indic., vol. 72, pp. 2017; 22. [Google Scholar] [CrossRef]
- L. Nanzad et al., “Analyzing npp response of different rangeland types to climatic parameters over mongolia,” Agronomy, vol. 11, no. 2021; 4. [CrossRef]
- M. A. of Sciences., National atlas of Mongolia. Ulaanbaatar, 2022.
- “Consolidated Report on Mongolia’s Unified Land Fund 2018,” 2019.
- L. Nanzad, J. L. Nanzad, J. Zhang, B. Tuvdendorj, M. Nabil, S. Zhang, and Y. Bai, “NDVI anomaly for drought monitoring and its correlation with climate factors over Mongolia from 2000 to 2016,” J. Arid Environ., vol. 164, no. January, pp. 2019; 77. [Google Scholar] [CrossRef]
- E. Munkhtsetseg, R. E. Munkhtsetseg, R. Kimura, J. Wang, and M. Shinoda, “Pasture yield response to precipitation and high temperature in Mongolia,” J. Arid Environ., vol. 70, no. 1, pp. 2007. [Google Scholar] [CrossRef]
- M. E. Fernández-Giménez, N. H. M. E. Fernández-Giménez, N. H. Venable, J. Angerer, S. R. Fassnacht, R. S. Reid, and J. Khishigbayar, “Exploring linked ecological and cultural tipping points in Mongolia,” Anthropocene, vol. 17, pp. 2017; 69. [Google Scholar] [CrossRef]
- Z. WAN, “MODIS Land-Surface Temperature Algorithm Basis Document (LST ATBD) : version 3.3,” http://modis.gsfc.nasa.gov/data/atbd, 1999, Accessed: Jul. 10, 2023. [Online]. Available: https://cir.nii.ac.jp/crid/1572824500773083392.bib?
- Y. Zhang, M. Y. Zhang, M. Xu, H. Chen, and J. Adams, “Global pattern of NPP to GPP ratio derived from MODIS data: Effects of ecosystem type, geographical location and climate,” Glob. Ecol. Biogeogr., vol. 18, no. 3, pp. 2009. [Google Scholar] [CrossRef]
- C. 2016. S. Dugarsuren, N. C. 2016. S. Dugarsuren, N. & Lin, “Simulation of Net Primary Productivity in Mongolia Using CASA Model, During 2000-2004,” Mong. J. Biol. Sci., vol. 14, no. 2016; 2. [Google Scholar] [CrossRef]
- B. D. Cook et al., “Using LiDAR and quickbird data to model plant production and quantify uncertainties associated with wetland detection and land cover generalizations,” Remote Sens. Environ., vol. 113, no. 11, pp. 2366– 2379, 2009. [CrossRef]
- M. Guo, X. Wang, J. Li, K. Yi, G. Zhong, and H. Tani, “Assessment of global carbon dioxide concentration using MODIS and GOSAT data,” Sensors (Switzerland), vol. 12, no. 12, pp. 16368–1 6389, 2012. [CrossRef]
- C. D. Keeling, J. F. S. C. D. Keeling, J. F. S. Chin, and T. P. Whorf, “Increased activity of northern vegetation inferred from atmospheric CO2 measurements,” Nature, vol. 382, no. 6587. pp. 146–148, 1996. [CrossRef]
- P. P. Tans, P. S. P. P. Tans, P. S. Bakwin, and D. W. Guenther, “A feasible Global Carbon Cycle Observing System: A plan to decipher today’s carbon cycle based on observations,” Glob. Chang. Biol., vol. 2, no. 3, pp. 1996. [Google Scholar] [CrossRef]
- “Methodology of estimate for grassland carrying capacity in Mongolia,” 2019, [Online]. Available: https://downloads.1212.mn/1616736153165.
- B. Nandintsetseg, M. B. Nandintsetseg, M. Shinoda, and B. Erdenetsetseg, “Contributions of multiple climate hazards and overgrazing to the 2009/2010 winter disaster in Mongolia,” Nat. Hazards, vol. 92, pp. 2018. [Google Scholar] [CrossRef]
- D. Cheng, S. D. Cheng, S. Peili, Z. Xianzhou, Z. Ning, C. Xi, and G. Shoubao, “The Rangeland Livestock Carrying Capacity and Stocking Rate in the Kailash Sacred Landscape in China The Rangeland Livestock Carrying Capacity and Stocking Rate in the Kailash Sacred Landscape in China,” vol. 8, no. 6, pp. 2017. [Google Scholar] [CrossRef]
- B. Nandintsetseg et al., “Risk and vulnerability of Mongolian grasslands under climate change,” Environ. Res. Lett., vol. 16, no. 2021; 3. [CrossRef]
- S. W. Running and M. Zhao, “Daily GPP and Annual NPP (MOD17A2/A3) products NASA Earth Observing System MODIS Land Algorithm (User’s guide V3),” User Guid., p. 28, 2015.
- F. Zhao et al., “Remote sensing estimates of grassland aboveground biomass based on MODIS Net Primary Productivity (NPP): A case study in the Xilingol grassland of northern China,” Remote Sens., vol. 6, no. 6, pp. 5368– 5386, 2014. [CrossRef]
- D. P. Turner et al., “Evaluation of MODIS NPP and GPP products across multiple biomes,” Remote Sens. Environ., vol. 102, no. 3–4, pp. 2006. [CrossRef]
- L. Rinehart, “Pasture, Rangeland and Grazing Management,” Management, p. 20, 2008.
- J. J. M. and A. W. H. J.C.Sanlan, G.M. J. J. M. and A. W. H. J.C.Sanlan, G.M.Mceon, K.A.Day, “ESTIMATING SAFE CARRYING CAPACITIES OF EXTENSIVE CATTLE- GRAZING PROPERTIES WITHIN TROPICAL, SEMI-ARID WOODLANDS OF NORTH-EASTERN AUSTRALIA.,” Budid. AYAM RAS PETELUR (Gallus sp.), vol. 21, no. 58, pp. 99–104, 1994, [Online]. Available: https://www.unhcr.org/publications/manuals/4d9352319/unhcr-protection-training-manual-european-border-entry-officials-2-legal.html? 1989. [Google Scholar]
- S. Desta and D. L. Coppock, “Cattle population dynamics in the southern Ethiopian,” J. Range Manag., vol. 55, no. September, pp. 439–451, 2002.
- B. Dashpurev, “Anthropogenic impact on ecosystems and land degradation in the Eastern Mongolian Steppe,” p. 128, 2022.
- S. Tong et al., “Spatial and temporal variations of vegetation cover and the relationships with climate factors in Inner Mongolia based on GIMMS NDVI3g data,” J. Arid Land, vol. 9, no. 3, pp. 2017. [CrossRef]
- C. Chu et al., “Does climate directly influence NPP globally?,” Glob. Chang. Biol., vol. 22, no. 1, pp. 2016; 24. [CrossRef]
- J. M. O. Scurlock, W. J. M. O. Scurlock, W. Cramer, R. J. Olson, W. J. Parton, and S. D. Prince, “Terrestrial NPP: Toward a consistent data set for global model evaluation,” Ecol. Appl., vol. 9, no. 3, pp. 1999. [Google Scholar] [CrossRef]
- G. Bao et al., “Modeling net primary productivity of terrestrial ecosystems in the semi-arid climate of the Mongolian Plateau using LSWI-based CASA ecosystem model,” Int. J. Appl. Earth Obs. Geoinf., vol. 46, pp. 2016; 93. [CrossRef]
- J. Wang et al., “New Global MuSyQ GPP/NPP Remote Sensing Products from 1981 to 2018,” IEEE J. Sel. Top. Appl. Earth Obs. Remote Sens., vol. 14, pp. 5596– 5612, 2021. [CrossRef]
- Pranab Kumar Sen, “Estimates of the Regression Coefficient Based on Kendall ’ s Tau,” J. Am. Stat. Assoc., no. 13, pp. 37–41, 2012. 20 April.
- B. Dashpurev, M. B. Dashpurev, M. Dorj, T. N. Phan, J. Bendix, and L. W. Lehnert, “Estimating fractional vegetation cover and aboveground biomass for land degradation assessment in eastern Mongolia steppe : combining ground vegetation data and remote sensing,” Int. J. Remote Sens., vol. 44, no. 2, pp. 2023. [Google Scholar] [CrossRef]
- P. Qin et al., “Estimation of Grassland Carrying Capacity by Applying High Spatiotemporal Remote Sensing Techniques in Zhenglan,” 2021.
- M. Claverie et al., “The Harmonized Landsat and Sentinel-2 surface reflectance data set,” Remote Sens. Environ., vol. 219, no. September, pp. 2018. [CrossRef]
- ZHENG Y, SHEN R, WANG Y, “Improved estimate of global gross primary production for reproducing its long-term variation, 1982–2017[J].” Earth System Science Data, 2020.
- Z. Jiping, Z. Z. Jiping, Z. Linbo, L. I. U. Weiling, Q. I. Yue, and W. O. Xiao, “Livestock-carrying capacity and overgrazing status of alpine grassland in the Three-River Headwaters region, China,” vol. 24, no. 201109030, pp. 2014. [Google Scholar] [CrossRef]
- R. John et al., “Grassland canopy cover and aboveground biomass in Mongolia and Inner Mongolia: Spatiotemporal estimates and controlling factors,” Remote Sens. Environ., vol. 213, no. April, pp. 2018; 48. [CrossRef]
- F. Ji et al., “Estimating Grassland Carrying Capacity in the Source Area of Nujiang River and Selinco Lake, Tibetan Plateau (2001–2020) Based on Multisource Remote Sensing,” Remote Sens., vol. 16, no. 2024; 20. [CrossRef]
- J. Wang, J. J. Wang, J. Wang, H. Zhou, and Z. Xiao, “Detecting forest disturbance in Northeast China from GLASS LAI time series data using a dynamic model,” Remote Sens., vol. 9, no. 2017; 12. [Google Scholar] [CrossRef]
- S. Dorligjav, “Heat and moisture regime for plant growth stages in Bayan-Ulgii province, Mongolia,” no. October, 2021.
- Y. Yang et al., “Comparative assessment of grassland degradation dynamics in response to climate variation and human activities in China, Mongolia, Pakistan and Uzbekistan from 2000 to 2013,” J. Arid Environ., vol. 135, pp. 2016. [CrossRef]
- G. Bao et al., “Variations and climate constraints of terrestrial net primary productivity over Mongolia,” Quat. Int., vol. 537, no. June, pp. 2020. [CrossRef]
- N. Alexandratos and J. B. Fao, “World Agriculture Towards 2030 / 2050 The 2012 Revision ESA Working Paper Rome,” Fao, no. 12, pp. 1–155, 2012. 20 October.
- YY. Munkhzul et al., “Grazing Effects on Mongolian Steppe Vegetation—A Systematic Review of Local Literature,” Front. Ecol. Evol., vol. 9, no. October, pp. 2021; 13. [CrossRef]
- T. Hilker, E. T. Hilker, E. Natsagdorj, R. H. Waring, A. Lyapustin, and Y. Wang, “Satellite observed widespread decline in Mongolian grasslands largely due to overgrazing,” Glob. Chang. Biol., vol. 20, no. 2, pp. 2014. [Google Scholar] [CrossRef]
- YY. Chadraabal, U. Odkhuu, M. Shinoda, and Y. Suzuki, “Social Causes of Dzuds in Mongolia Since the 1990s,” J. Disaster Res., vol. 17, no. 7, pp. 1183– 1191, 2022. [CrossRef]
- Y. Liu et al., “Resistance and resilience of grasslands to drought detected by SIF in inner Mongolia, China,” Agric. For. Meteorol., vol. 308–309, no. August 2020, 2021. [CrossRef]
- Y. Dong, H. YAN, W. DU, and Y. HU, “Spatio-temporal analysis of grassland carrying capacity in Mongolian Plateau based on supply-consumption relationship,” J. Nat. Resour., vol. 34, no. 5, p. 1093, 2019. [CrossRef]
- D. M. Cheng Linag, D.L. D. M. Cheng Linag, D.L.Michalk, “The ecology and growth patterns of Cleistogenes species in degraded grasslands of eastern Inner Mongolia, China,” J. Appl. Ecol., vol. 39, pp. 584–594, 2002.
- Z. Wang et al., “Impact of stocking rate and rainfall on sheep performance in a Desert Steppe,” Rangel. Ecol. Manag., vol. 64, no. 3, pp. 2011. [CrossRef]
- S. Sainnemekh, ; Densambuu, ; Bestelmeyer, ; Barrio, and ; Aradóttir, “Rangeland degradation in Mongolia-using State and Transition Models to help understand rangeland dynamics,” vol. 112, pp. 1–4, 2021, [Online]. Available: https://www.grocentre.
- X. M. Xu MinYun, G. L. X. M. Xu MinYun, G. L. Gao LiJie, and L. Y. Li YunQi, “A review on grassland carrying capacity (II): parameters and calculation methods.,” 2014.
Figure 1.
Figure 1. Map of Mongolian natural zones (National Atlas of Mongolia, 2020). Field sampling sites in vegetation investigation in 2019 are also showed.
Figure 1.
Figure 1. Map of Mongolian natural zones (National Atlas of Mongolia, 2020). Field sampling sites in vegetation investigation in 2019 are also showed.
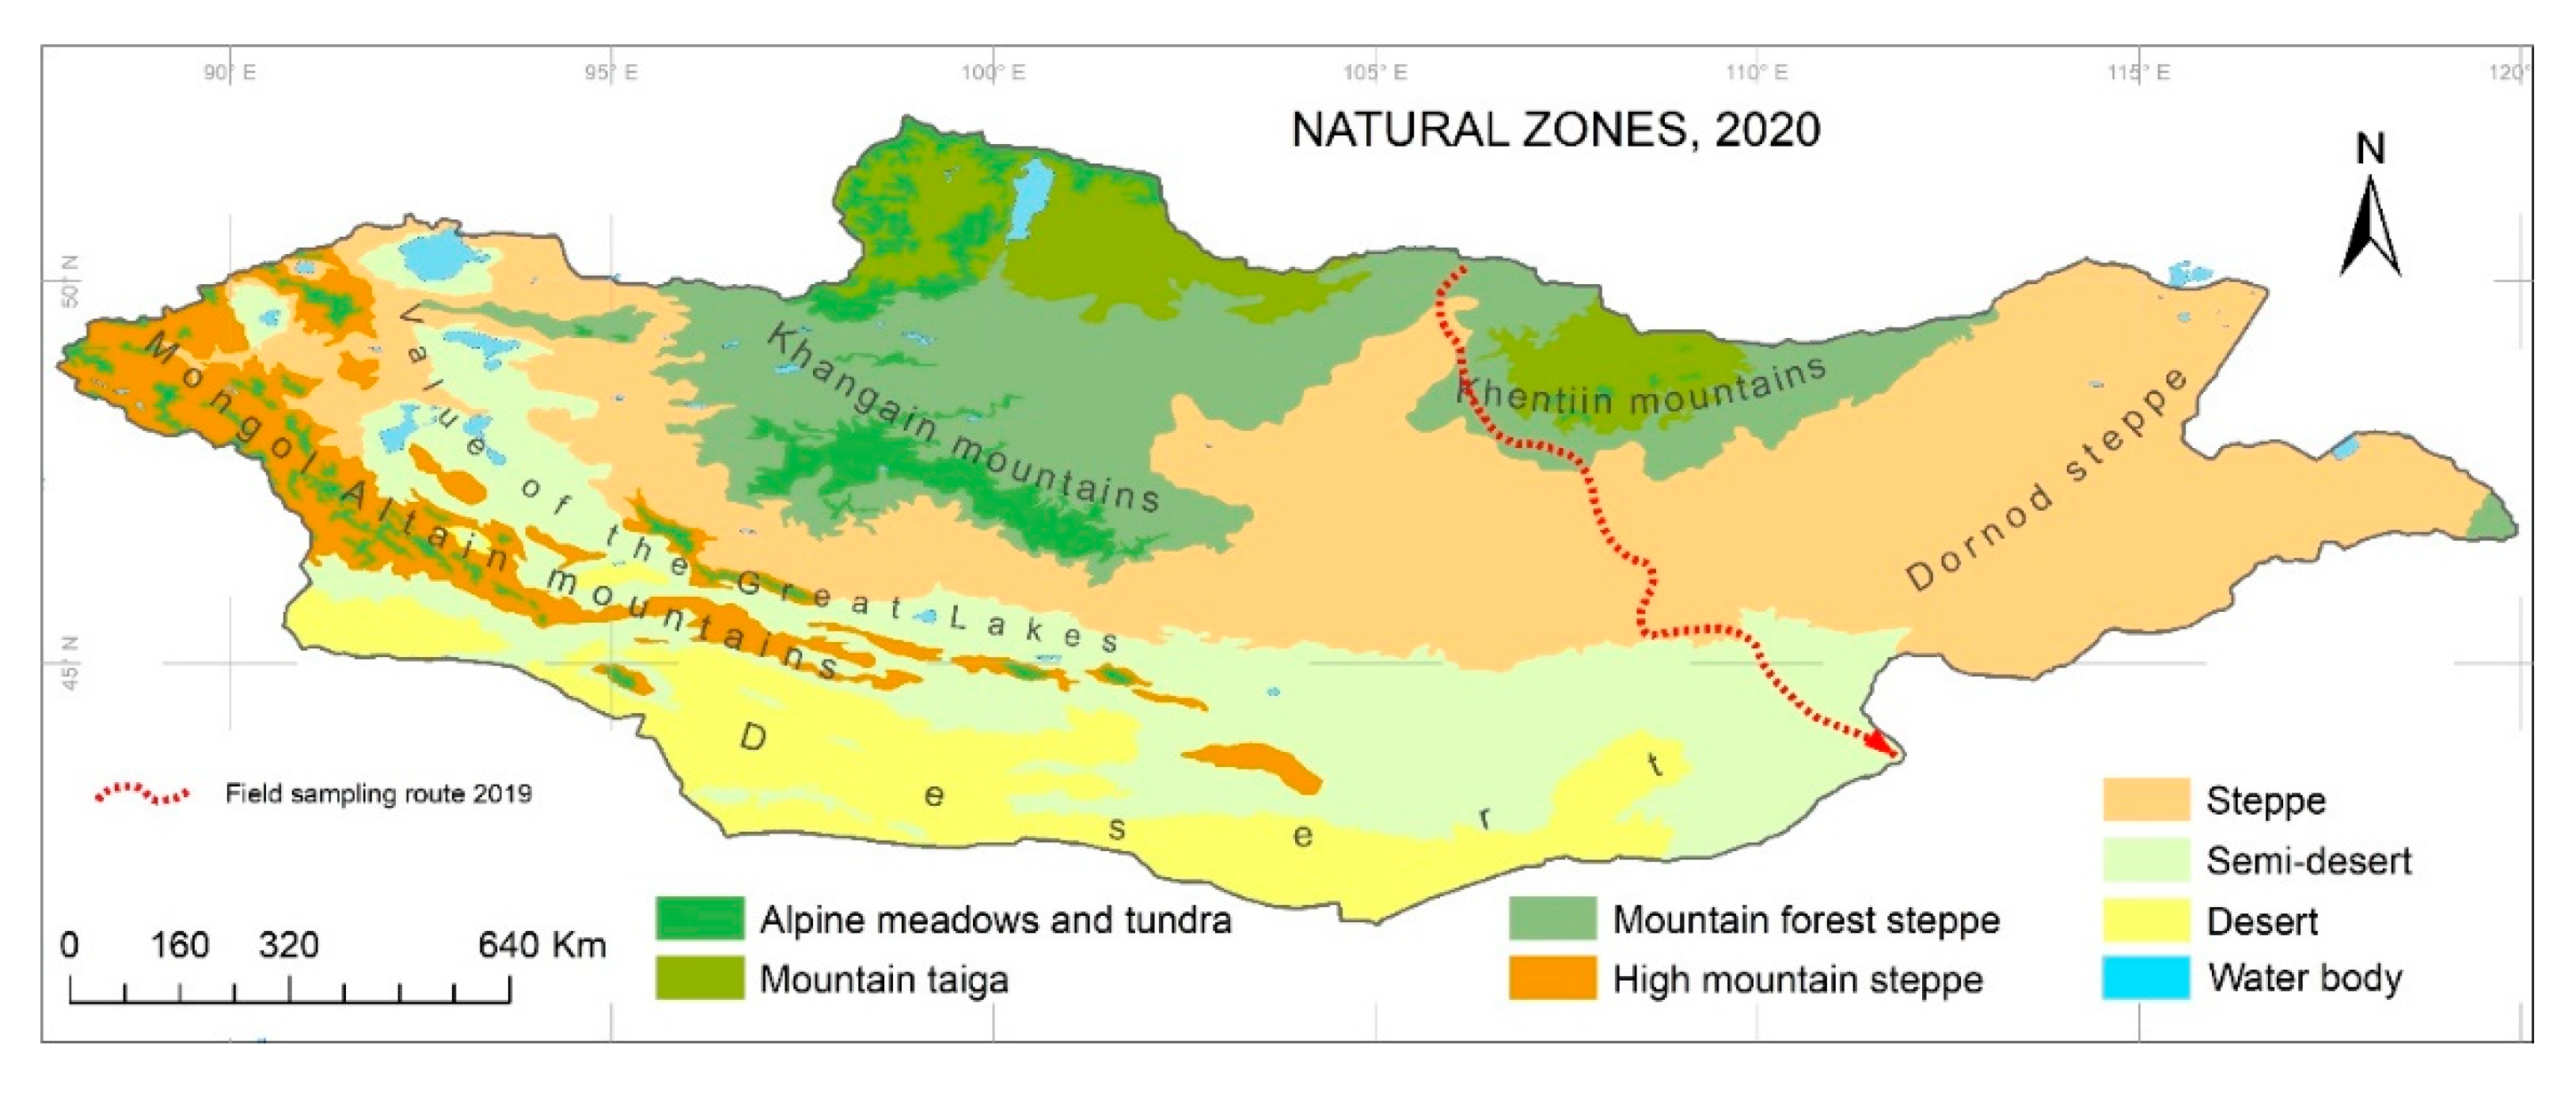
Figure 2.
Temporal (A) and spatial (2B, 2C) variations of multi-year average GLASS NPP, MODIS NPP for Mongolian grasslands. (B) GLASS NPP, (C) MODIS NPP. (a) Multi-year average value, (b) The M-K mutation recognition/detection, (c) Spatial variations and area proportion, (d) p-value.
Figure 2.
Temporal (A) and spatial (2B, 2C) variations of multi-year average GLASS NPP, MODIS NPP for Mongolian grasslands. (B) GLASS NPP, (C) MODIS NPP. (a) Multi-year average value, (b) The M-K mutation recognition/detection, (c) Spatial variations and area proportion, (d) p-value.
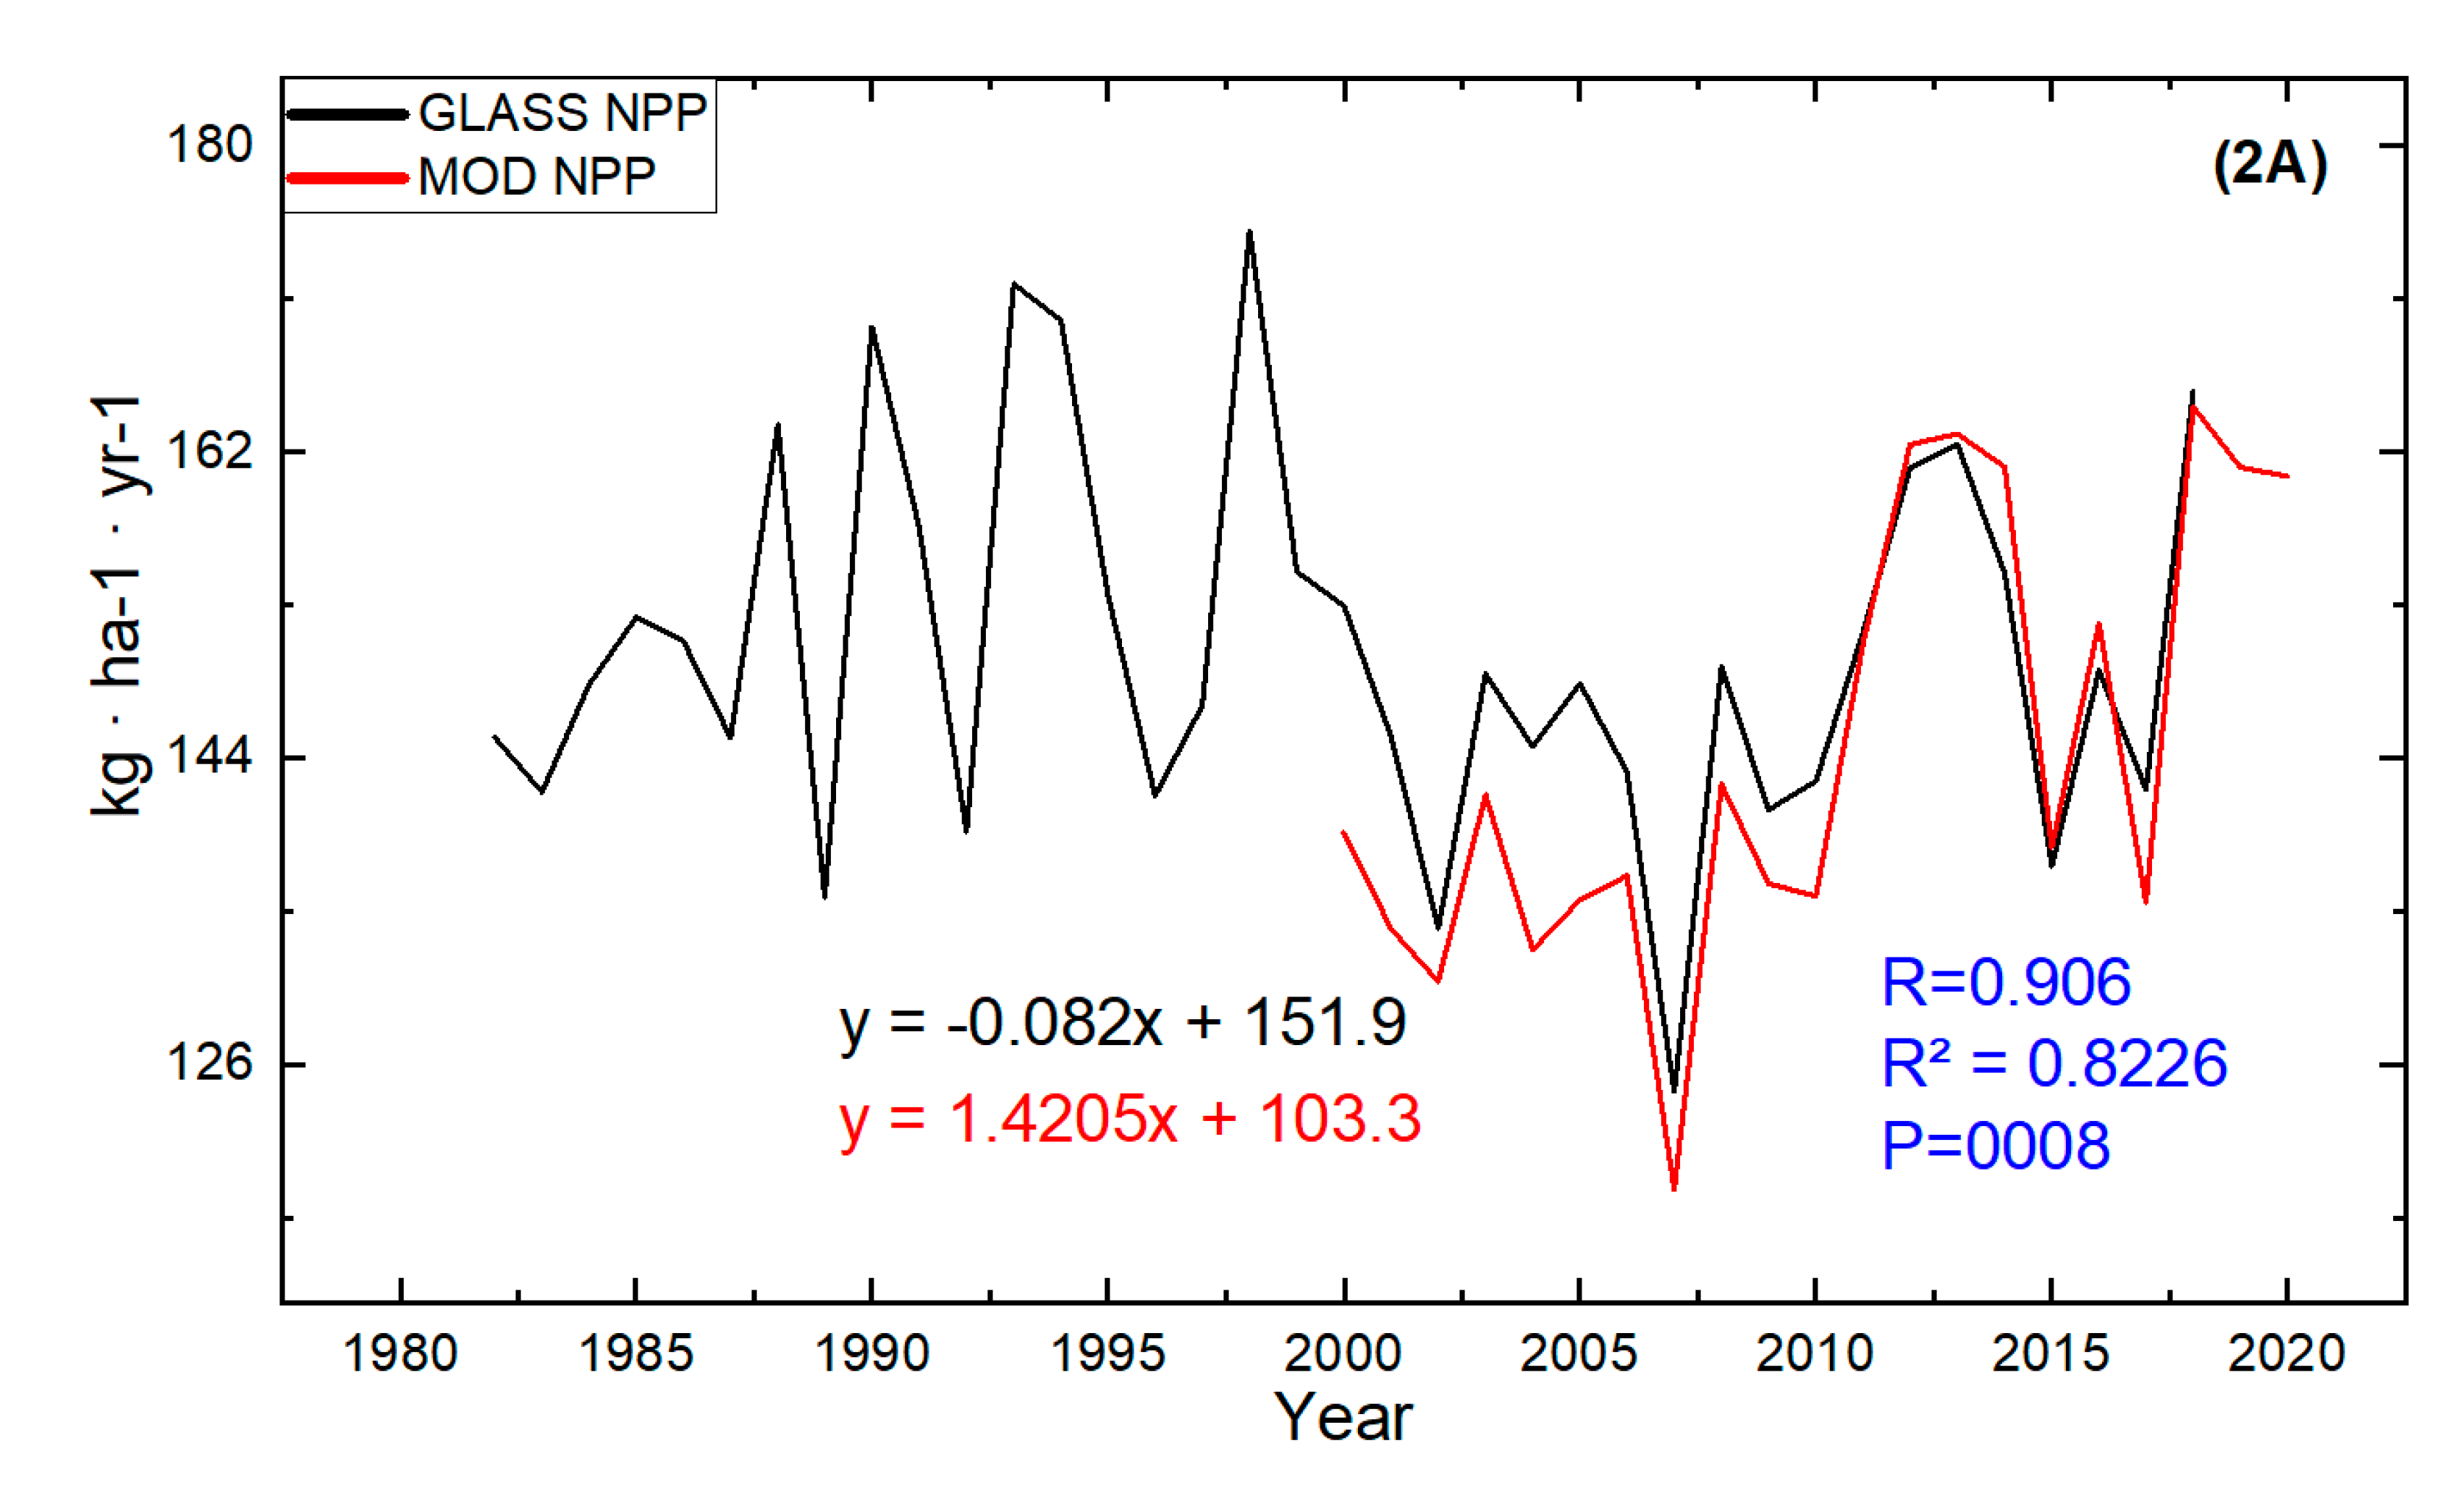
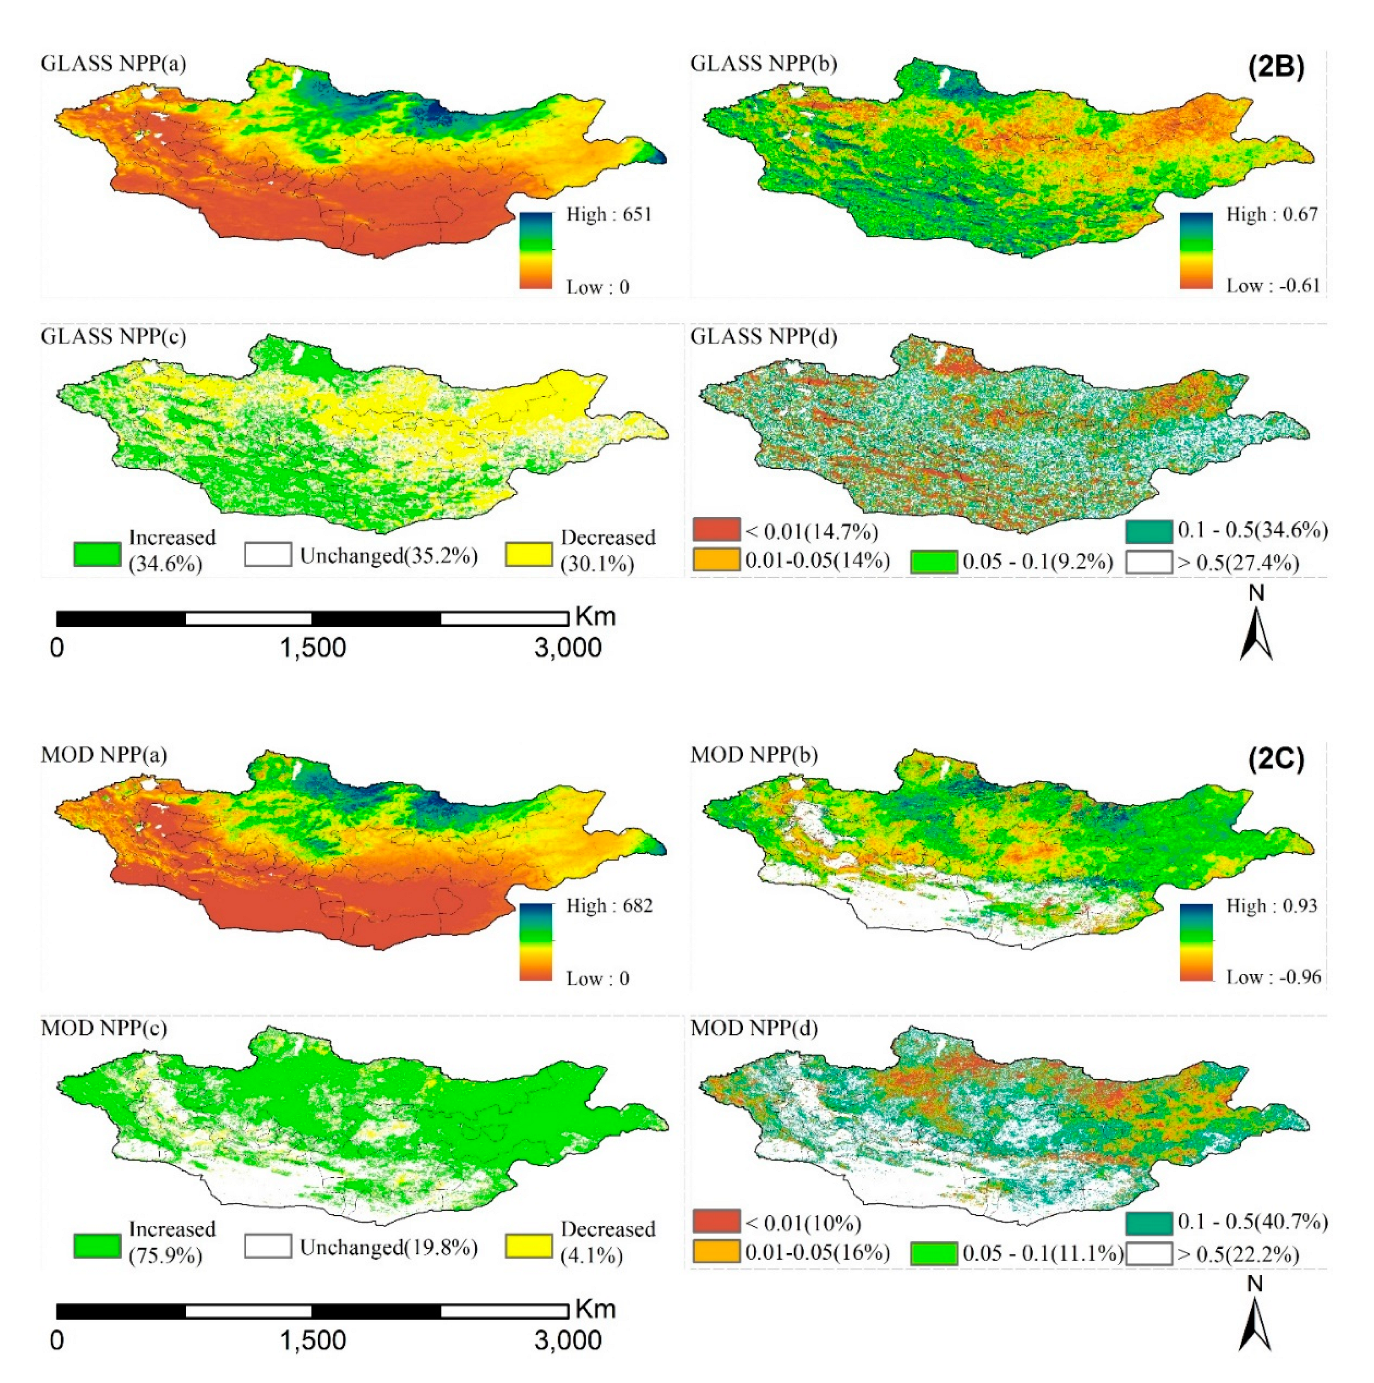
Figure 3.
Areal fractions (%) of different NPP groups (>500, 300-500, 200-300, 100-200, 50-100 and 0-50 kg·ha⁻¹·yr⁻¹) in each vegetation zone. Left panel(first): MODIS NPP; Right panel(second): GLASS NPP.
Figure 3.
Areal fractions (%) of different NPP groups (>500, 300-500, 200-300, 100-200, 50-100 and 0-50 kg·ha⁻¹·yr⁻¹) in each vegetation zone. Left panel(first): MODIS NPP; Right panel(second): GLASS NPP.
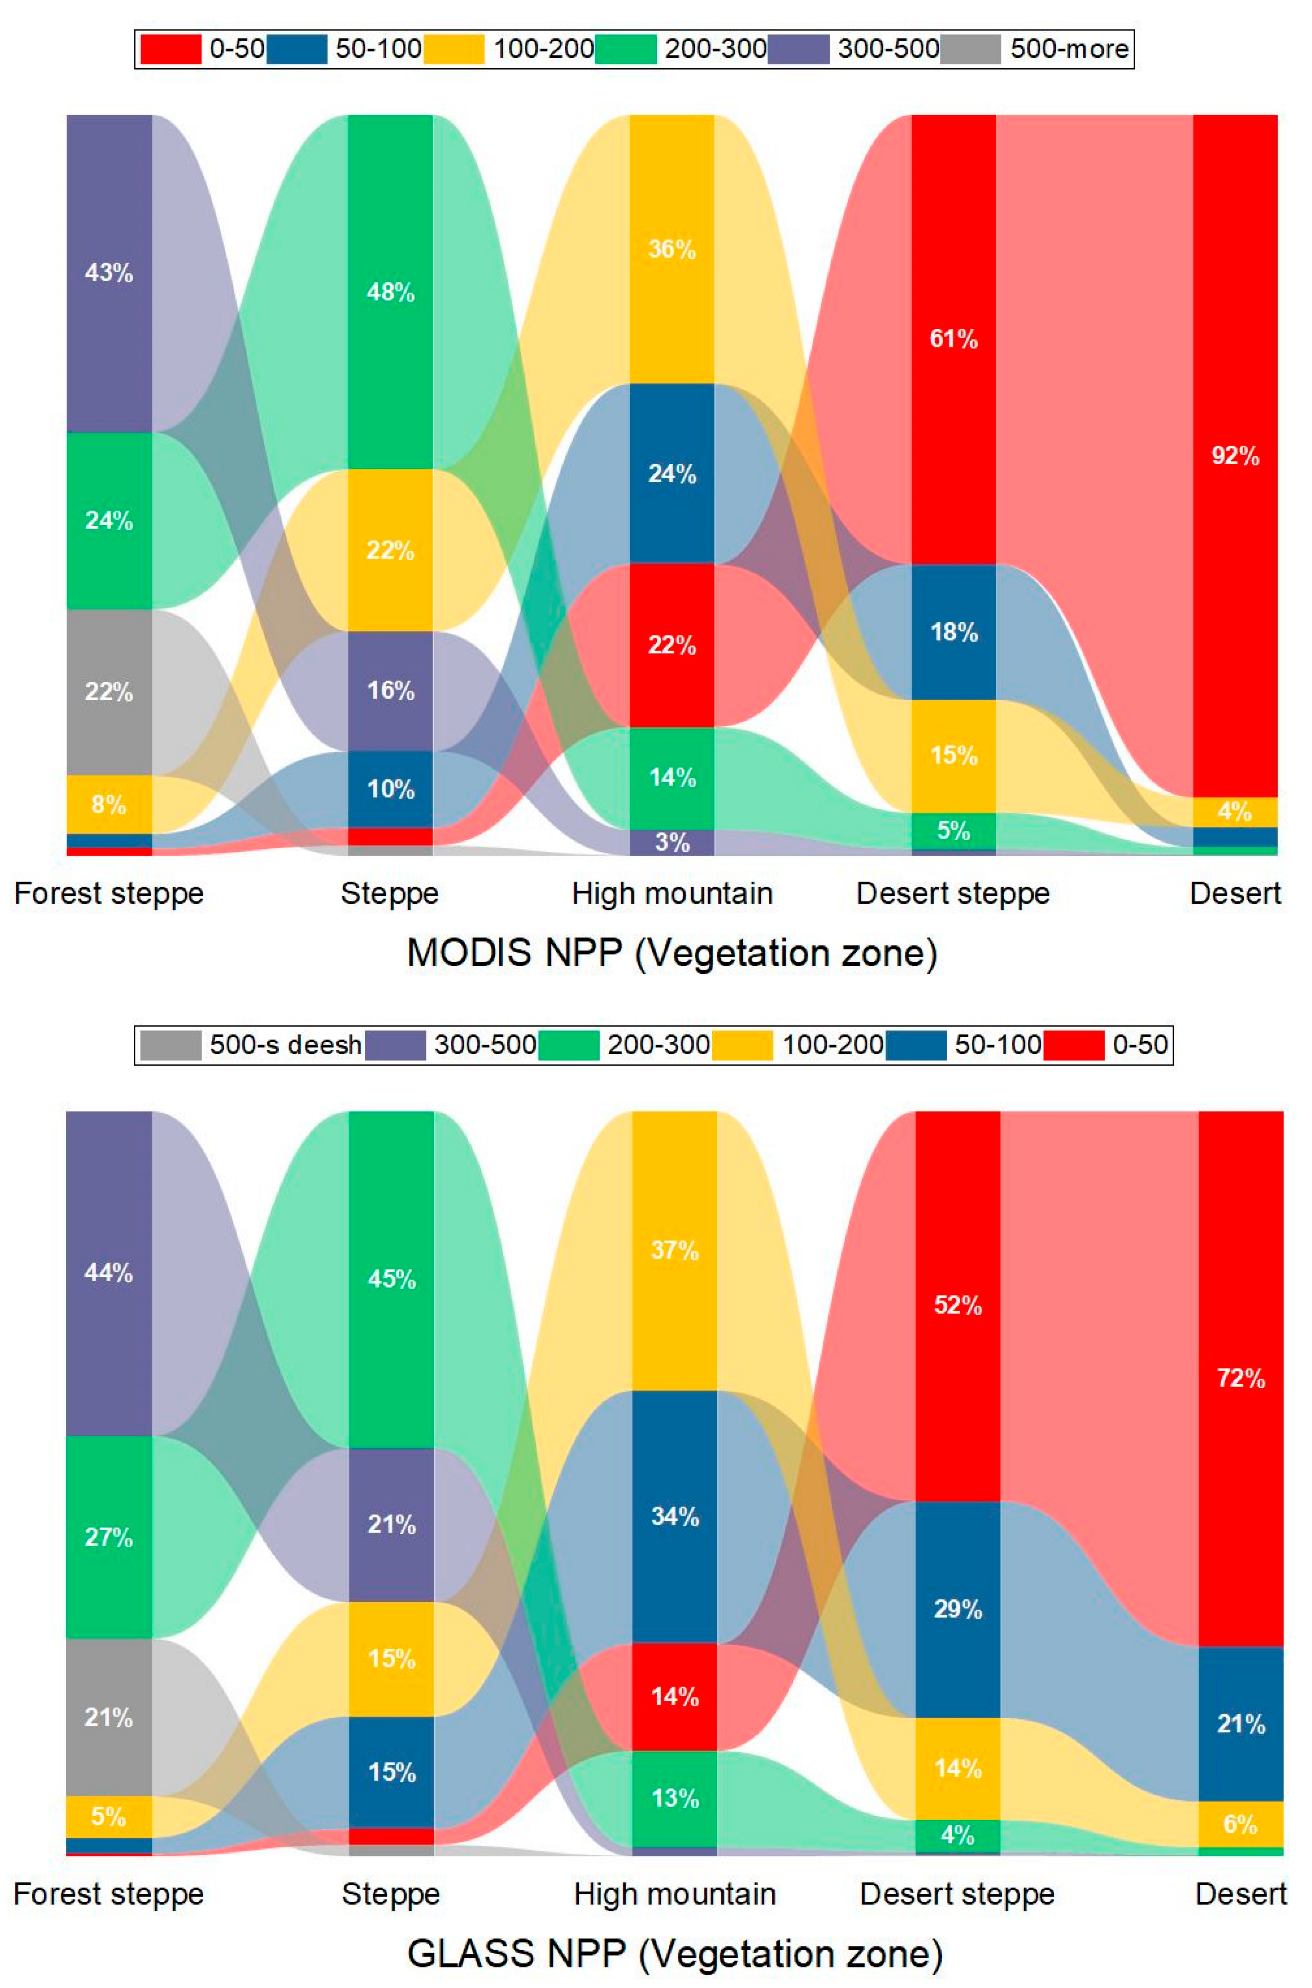
Figure 4.
Field survey sampling points and RS pixels (A), correlation (B).
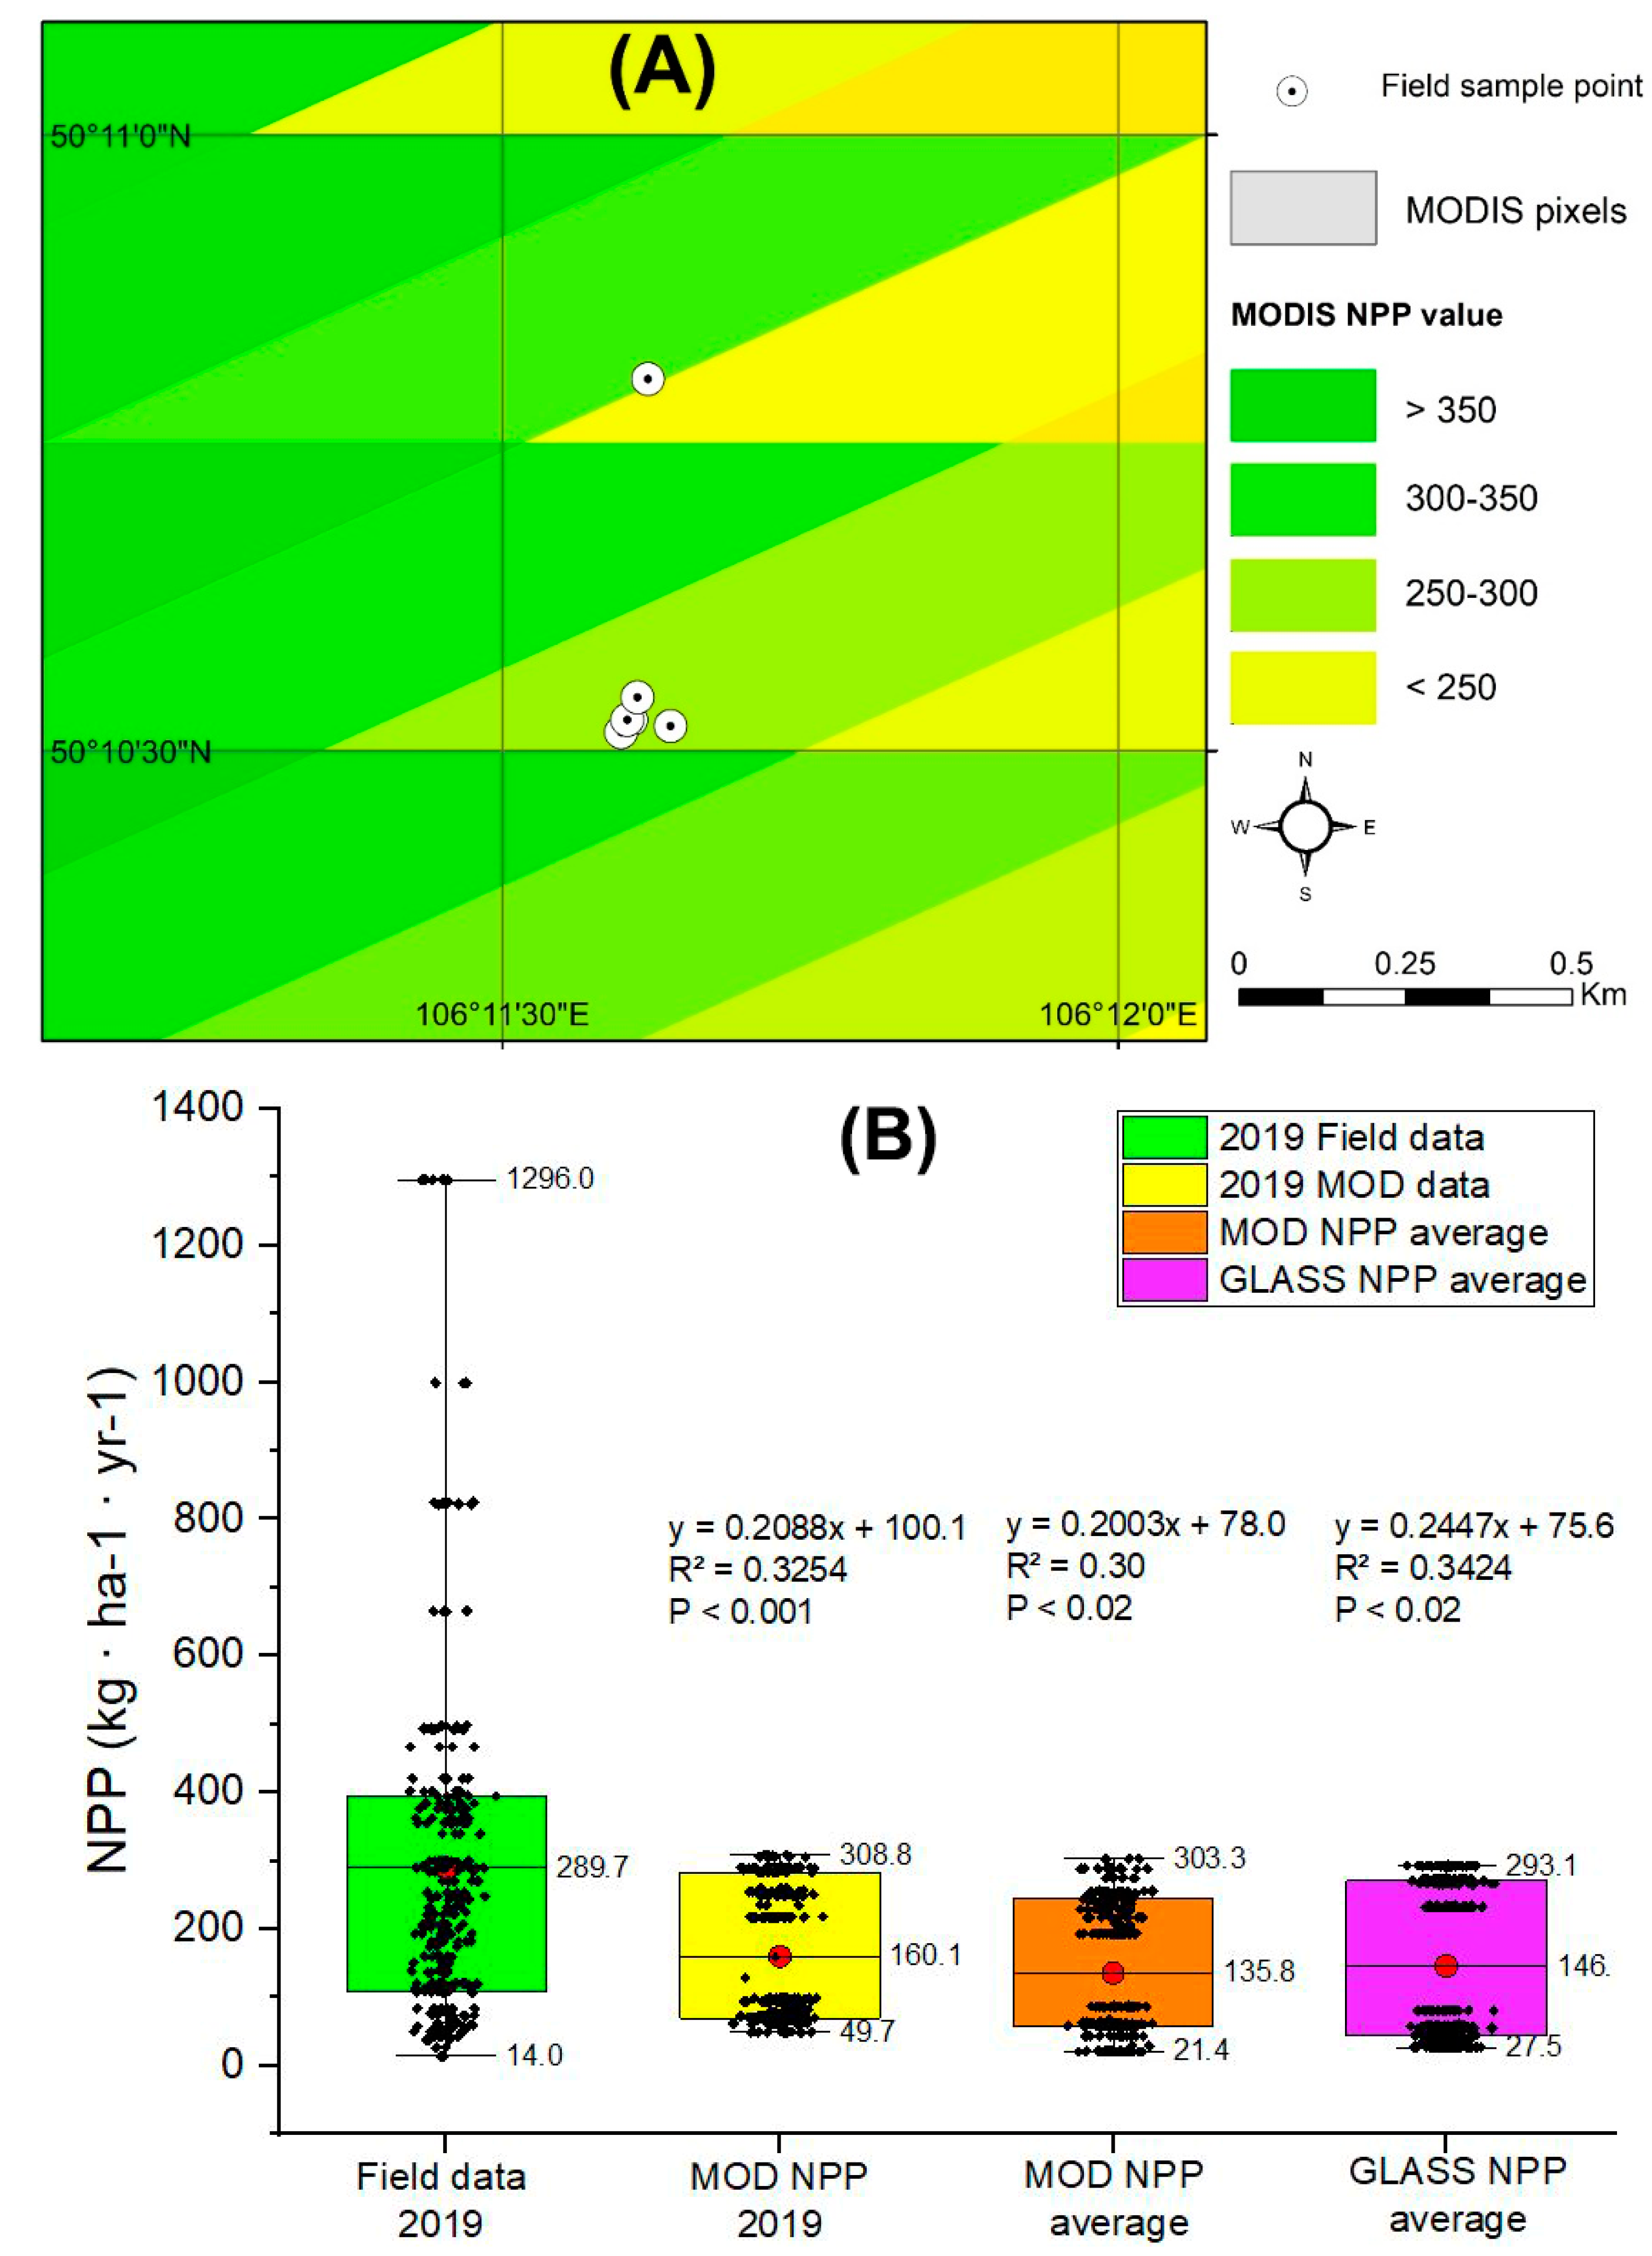
Figure 5.
Relationship between GLASS/MODIS NPP and precipitation and between GLASS/MODIS NPP and temperature for the grassland in Mongolia.
Figure 5.
Relationship between GLASS/MODIS NPP and precipitation and between GLASS/MODIS NPP and temperature for the grassland in Mongolia.
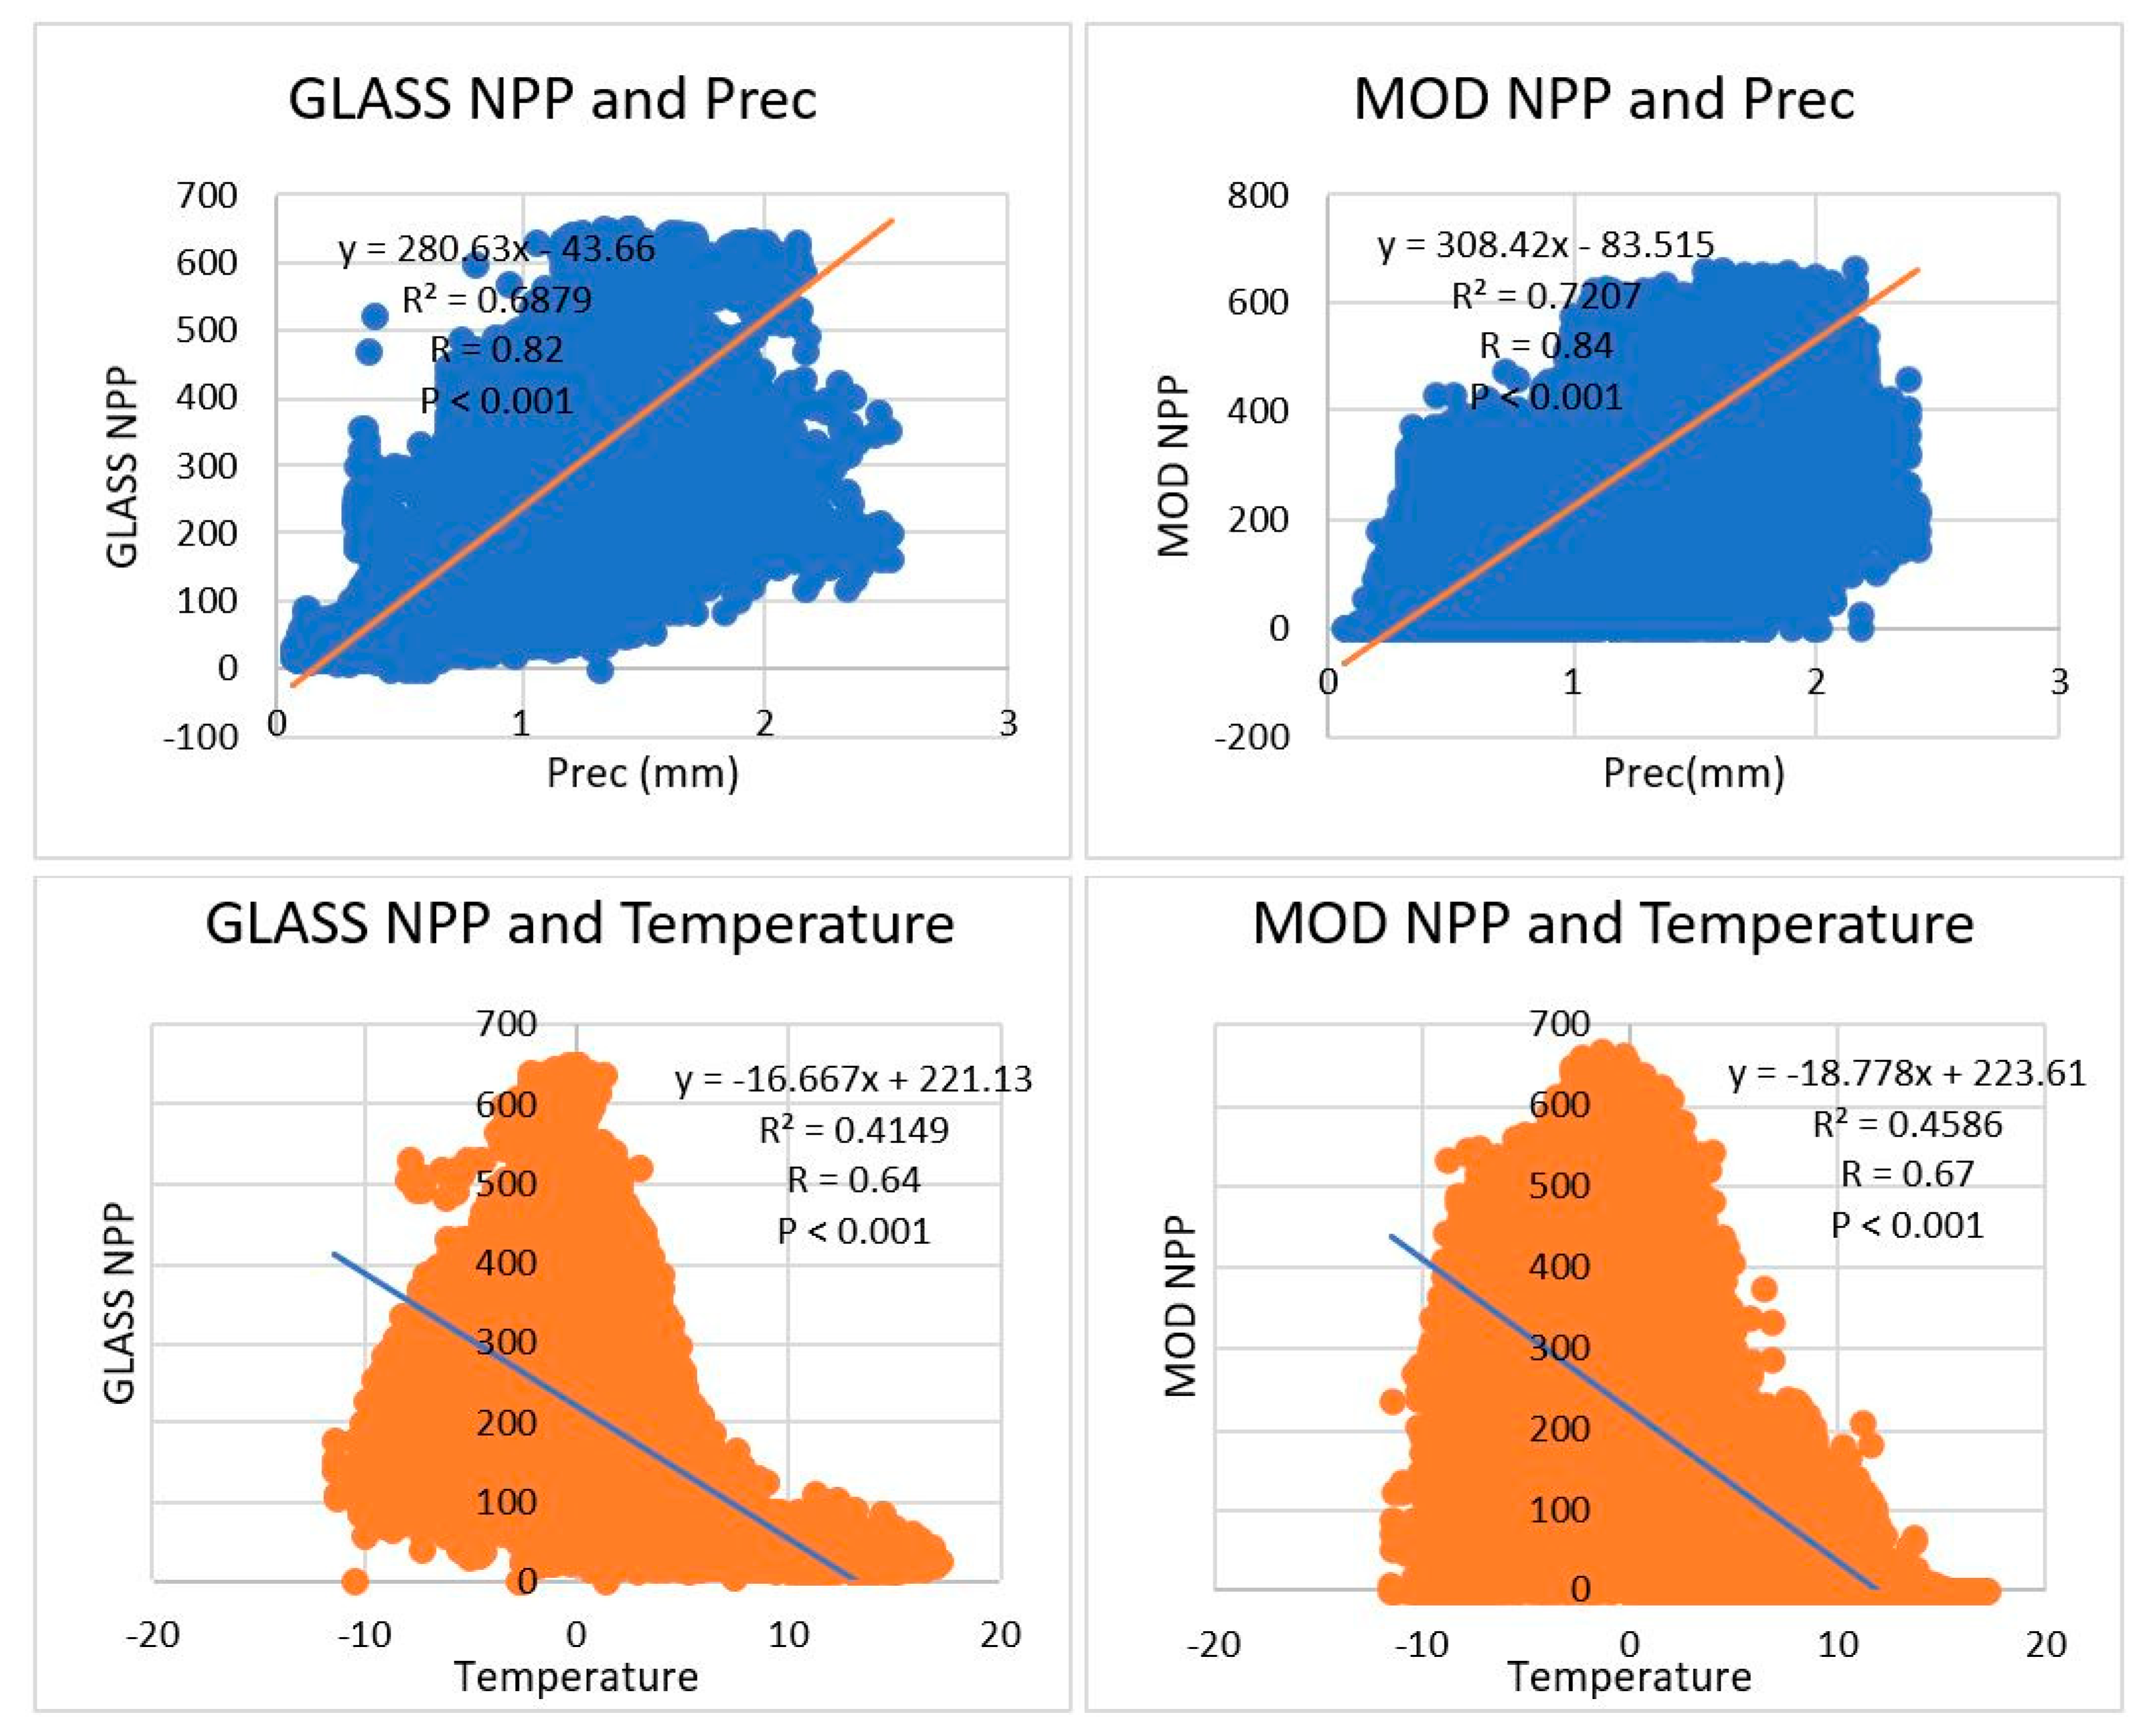
Figure 6.
Grassland carrying capacity (GCC) estimated from GLASS NPP product (a) and from MOD NPP product (b).
Figure 6.
Grassland carrying capacity (GCC) estimated from GLASS NPP product (a) and from MOD NPP product (b).
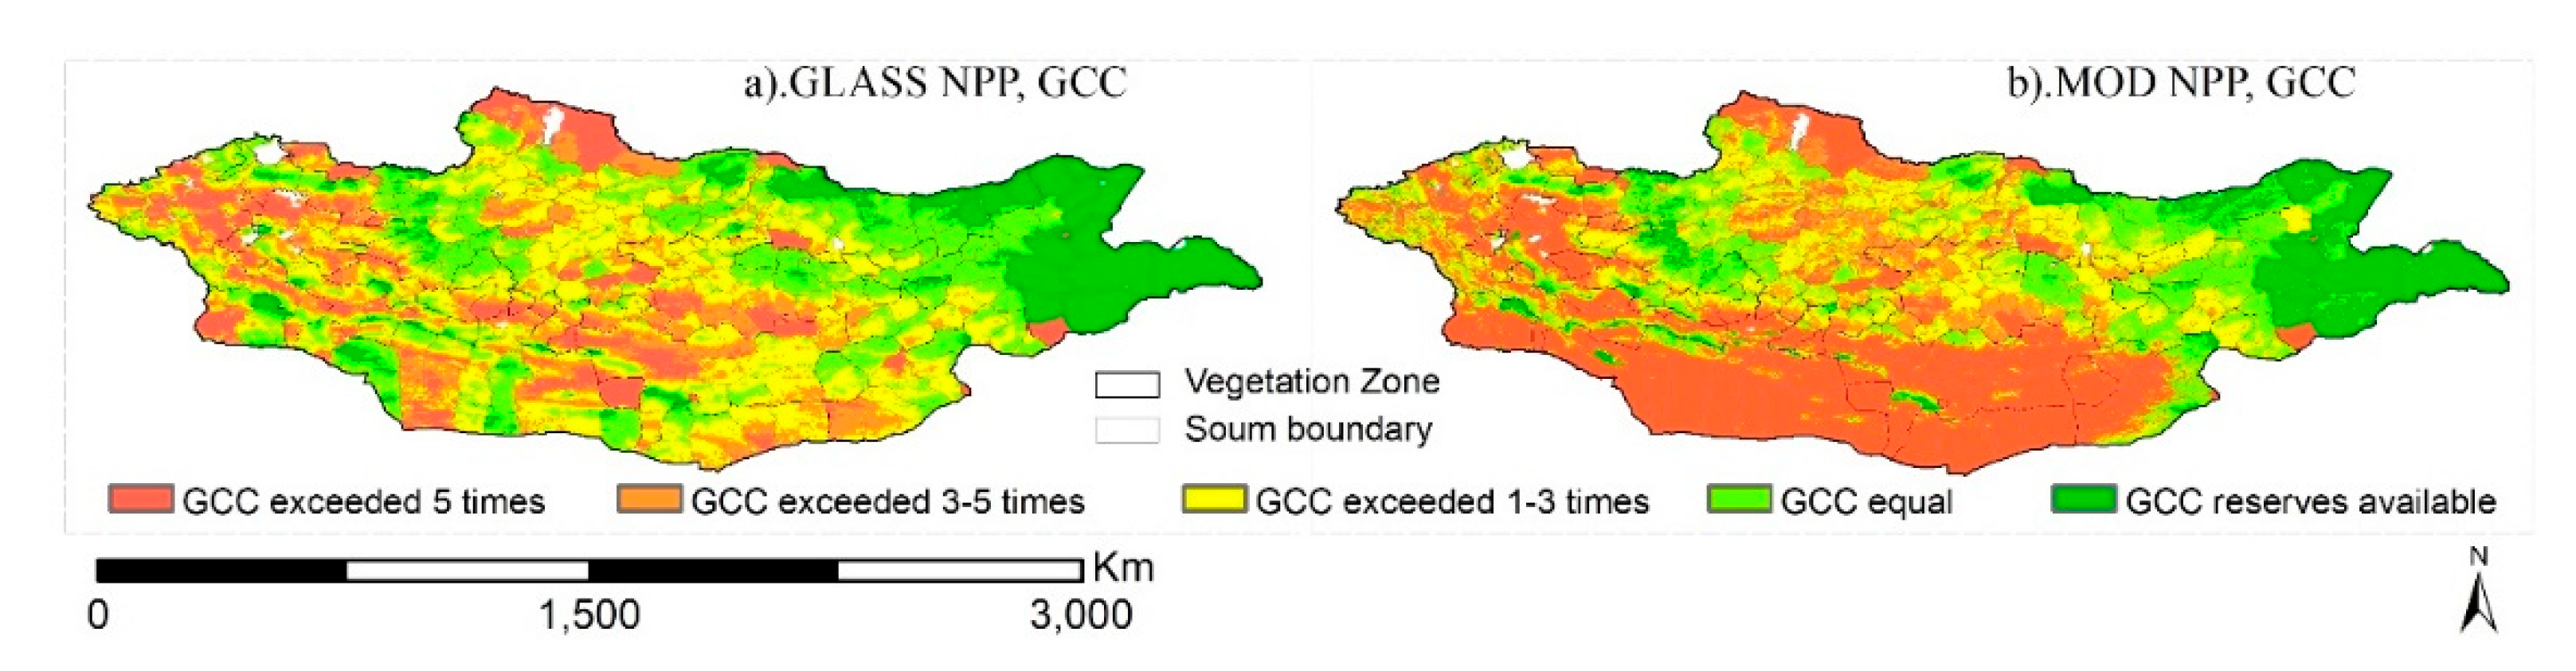
Figure 7.
Multi-year average temporal(graphic) and spatial(figure) changes. The units on the X-axis of the graphs are kg·ha⁻¹·yr⁻¹. The regions where current GCC exceeded the GCC estimated from GLASS NPP products (left panel) and from MODIS NPP products (right panel) in terms of areal percentatge and vegetation zones in Mongolia: a) forest steppe, b) steppe, c) high mountain, d) desert steppe, e) desert.
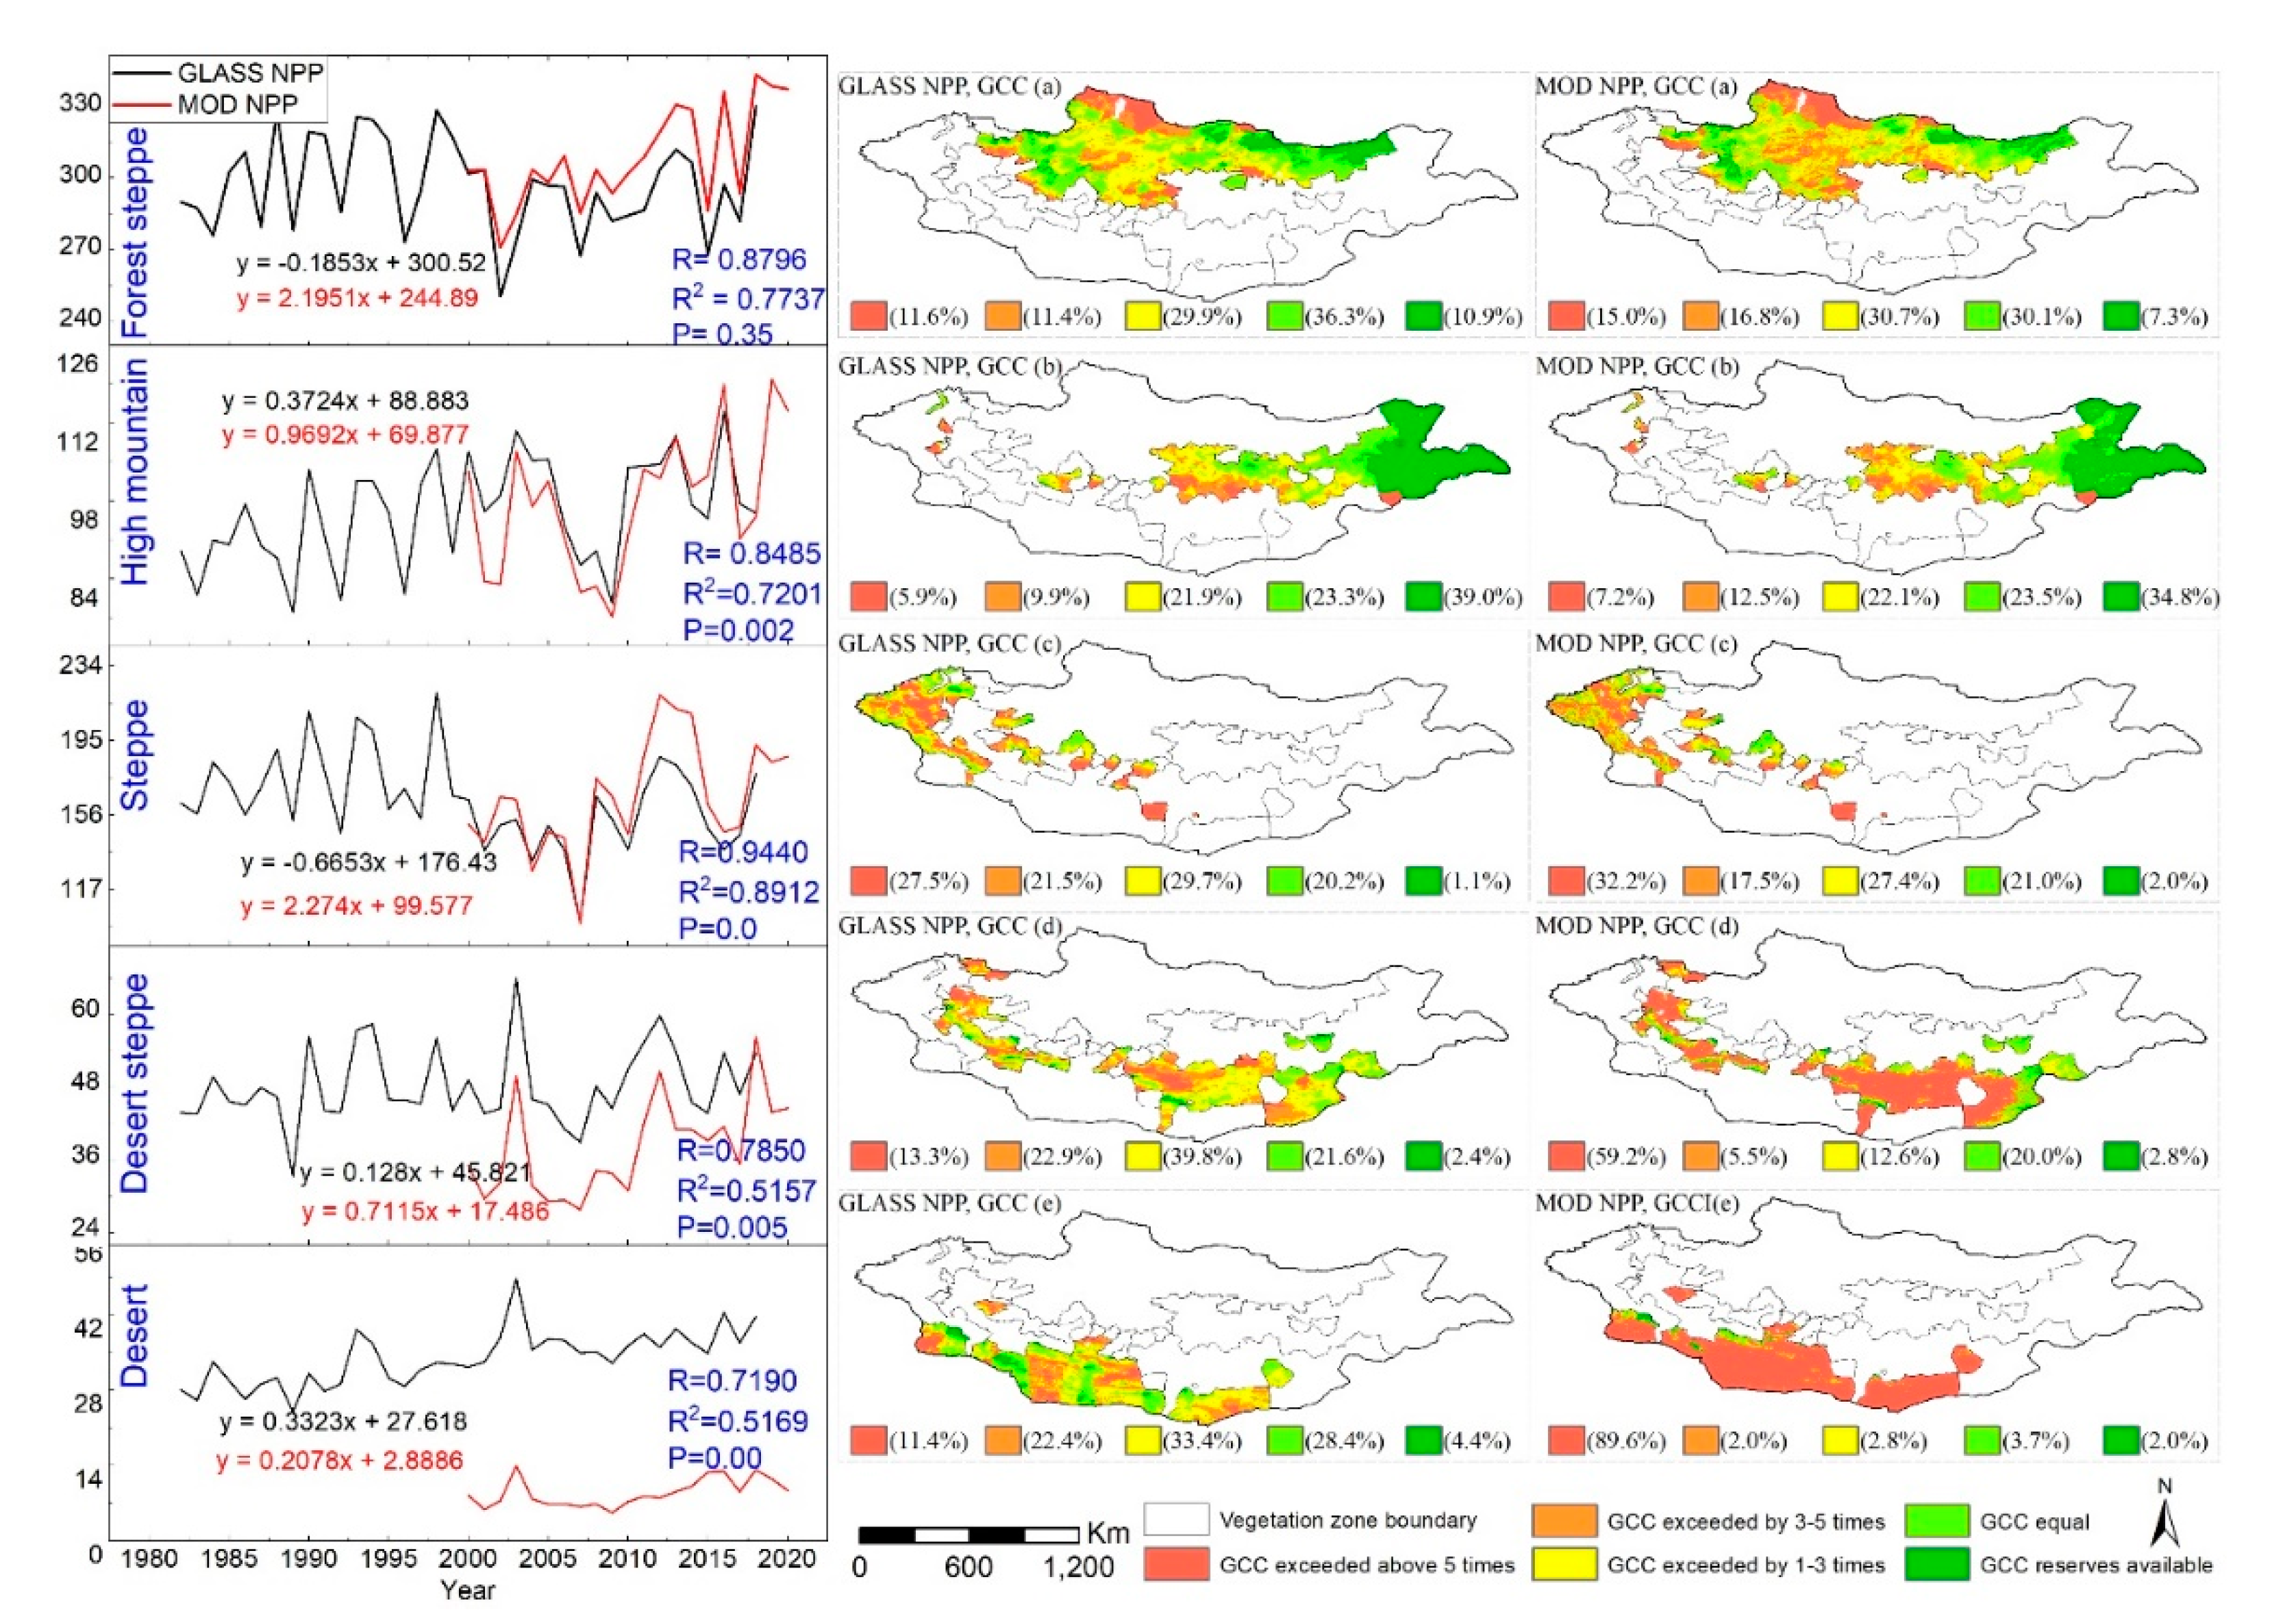

Table 1.
Table 1. Multi-year average NPP increase for different vegetation zones in Mongolia.
| Vegetation zone | GLASS NPP (kg·ha⁻¹·yr⁻¹) | MOD NPP (kg·ha⁻¹·yr⁻¹) |
|---|---|---|
| Forest steppe | 1.1 | 1.6 |
| Steppe | 0.4 | 1.7 |
| High mountain | 0.1 | 0.5 |
| Desert steppe | 0.2 | 0.4 |
| Desert | 0.3 | 0.04 |
Table 2.
Table 2. Areal fraction (%) that can support livestock in terms of the group of livestock number in Mongolia.
Table 2.
Table 2. Areal fraction (%) that can support livestock in terms of the group of livestock number in Mongolia.
| The livestock number that can be fed (%) | ||
|---|---|---|
| Livestock number (SU) | GLASS (%) | MOD (%) |
| <50000 | 24.5 | 41.6 |
| 50001-150000 | 53.3 | 35.0 |
| 150001-300000 | 15.3 | 16.4 |
| 300001-500000 | 3.5 | 3.6 |
| >500001 | 3.4 | 3.3 |
Table 3.
Table 3. The ratio of the actual livestock number (LN) and grassland carrying capacity (GCC) (GCCe) estimated from GLASS and MODIS NPP data in Mongolia.
Table 3.
Table 3. The ratio of the actual livestock number (LN) and grassland carrying capacity (GCC) (GCCe) estimated from GLASS and MODIS NPP data in Mongolia.
| GCCe | Grazing conditions | GLASS (%) | MOD (%) |
|---|---|---|---|
| >5 | Extremely overgrazing | 12.4 | 37.5 |
| 3-5 | Overgrazing | 16.3 | 10.9 |
| 1-3 | Moderate grazing | 30.6 | 19.7 |
| 0.5-1 | Light grazing | 27.3 | 20.8 |
| 0-0.5 | Reserve | 13.4 | 11.1 |
Disclaimer/Publisher’s Note: The statements, opinions and data contained in all publications are solely those of the individual author(s) and contributor(s) and not of MDPI and/or the editor(s). MDPI and/or the editor(s) disclaim responsibility for any injury to people or property resulting from any ideas, methods, instructions or products referred to in the content. |
© 2025 by the authors. Licensee MDPI, Basel, Switzerland. This article is an open access article distributed under the terms and conditions of the Creative Commons Attribution (CC BY) license (http://creativecommons.org/licenses/by/4.0/).
Copyright: This open access article is published under a Creative Commons CC BY 4.0 license, which permit the free download, distribution, and reuse, provided that the author and preprint are cited in any reuse.


