
Submitted:
15 April 2025
Posted:
16 April 2025
You are already at the latest version
Abstract
Background: A good understanding of the demand for health services requires not only an analysis of the current and historical volume of health care provided but also relies on accurate forecasting of trends in the future. Such trends provide invaluable information for needs assessment, resource planning, facility evaluation and policy formulation. We set the task of assessing the load on the healthcare system of Kazakhstan in the next decade using indicators of general morbidity, outpatient visits, the need for medical personnel and financial costs of medical care. Methods: This study applies a dynamic Markov chain model to forecast population dynamics and ARIMAX method for healthcare demand forecasting. Results: In the next decade, the population of Kazakhstan is expected to grow by an average of 1.4% per year, reaching 23,334,397 people by 2033. The population growth will lead to an increase in the overall morbidity of the population in absolute values. The growth rate for children will be 1.6%, for adults - 0.8% per year. In this regard, the number of visits to medical specialists will increase by approximately 1.5% per year. Therefore, the demand for internists will increase by an average of 4.7% per year. The need for labour and material resources will entail an increase in financial costs. Total costs by 2033 will increase by 11.6% compared to 2023. Conclusions: Understanding the demand for health services requires not only the analysis of past and current health data but also relies on accurate forecasting of future trends. Assessing such trends provides invaluable information for identifying needs, planning resources, evaluating facilities, and formulating policies.
Keywords:
public health
; population forecasting
; healthcare demand
; time series forecasting
1. Introduction
The concept of supply of health services includes such categories as health care resources (number of health workers, hospitals, equipment, drugs and others), cost of production services, government regulation and policy, technological level, geographical distribution.
In an ideal health care system, every need for health care would generate a demand for the corresponding service, and the supply of services would meet each demand. There would be no shortage or excess of services. In real health care systems, unfortunately, need, demand, and supply often do not match. Health care systems are often stressed by the uncertainty in the demand for health services in society over time. The sources of these uncertainties are changing economic, political, demographic, environmental and other conditions in which the population lives. Managing scarce resources requires forecasting various health situations [1].
Forecasting applications can be useful for both short-term (e.g., monthly) and long-term (e.g., years) management and planning. Insufficient resources can lead to unavailability or long waits for health care, deterioration in the quality of services. Excess and unused resources entail unnecessary costs and become unsustainable. A good understanding of the demand for health services requires not only an analysis of the current and historical volume of health care provided, but also relies on accurate forecasting of trends in the near future. Such trends provide invaluable information for needs assessment, resource planning, facility evaluation and policy formulation [2].
Currently, there are many tools for modeling and forecasting the needs of the healthcare system for various resources: human [3], financial [4], pharmaceuticals [5], organizational [6].
Population based forecasting plays a key role in healthcare, as it allows for long-term projections by incorporating trends like aging populations or population growth, which are critical for strategic healthcare planning over decades [7]. The method integrates prevalence and incidence rates of diseases within a population, enhancing the ability to predict demand for specific services (e.g., chronic disease management or emergency care) [2]. By identifying healthcare needs based on population size and structure, this approach helps avoid unnecessary expenditures on unneeded infrastructure or staffing, optimizing budget use [8]. The method is adaptable to different geographic scales (local, regional, national), making it versatile for diverse healthcare systems and population densities [9]. By forecasting population health trends, the method aids in prioritizing preventive measures, reducing future demand through early interventions [8]. It relies on readily available population data (e.g., census data), making it a practical, evidence-based tool for policymakers and healthcare administrators [10].
There are many different methods for making a population forecast. Among them, the most commonly used method is the cohort component method [11]. To make a population forecast using the cohort component method, a lot of data on the population is required. They include population censuses for each age and sex, crude birth rates, age-specific fertility rates, death rates, life expectancy at birth, sex ratios at birth and migration rates.
The cohort component method, being deterministic in nature, does not take into account the influence of various external factors that can lead to extreme scenarios (e.g. a sharp decline in the birth rate, a pandemic outbreak, mass migration). In this regard, stochastic [12] and probabilistic [13] methods have been proposed. Stochastic forecasts create different possible trajectories of the future, which is useful for strategic planning. Probabilistic forecasts allow one to choose a baseline (most probable), optimistic, and pessimistic scenario.
Population forecasting must take proper account of all three of these components of demographic change, which are mortality, fertility, and migration.
Mortality forecasting has received considerable attention in recent years. The Lee-Carter method has become the benchmark approach for forecasting mortality. The method and its extensions have found wide application in scientific research [14]. The functional approach to data proposed by Hyndman and Ullah was developed as an alternative to the Lee-Carter model. This approach includes higher-order principal components and nonparametric smoothing and provides a more realistic future age structure of mortality [15]. Both models are also used to predict the fertility rate [16,17]
In recent decades, a significant amount of research has focused on the development and application of time series models in population forecasts, focusing on either overall population growth or individual growth components. Much of the research on the evaluation of time series models for forecasting fertility and mortality has focused on ARIMA time series models [18,19].
Currently, machine learning techniques have assumed an increasingly central role in many areas of research, from computer science to medicine, including actual science. We can point to some works devoted to the analysis of mortality [20], fertility [21], and population size [22,23].
The Markov chain approach relies on a probabilistic framework that is relatively easy to understand and implement. It assumes that the future state of a system depends only on its current state, not its entire history, which simplifies calculations and modeling [24]. The method models population dynamics through probabilities of transitions between different states (e.g., age groups, birth rates, or mortality rates). This makes it well-suited for analyzing changes in population structure [25]. Since Markov chains work with probabilities, they handle situations where data is incomplete or uncertain effectively, which is common in demographic forecasting [26]. The method allows for the determination of a long-term equilibrium (stationary distribution) that a population might reach if current trends persist, which is valuable for strategic planning [27]. Markov chains can be used to forecast overall population size or to analyze specific subgroups (e.g., by gender, age, or region), making the method versatile [28]. This approach can be combined with other statistical or mathematical methods to improve forecast accuracy, such as incorporating external factors (e.g., migration, economic conditions) [29].
The Ministry of Health of the Republic of Kazakhstan is actively introducing various tools for planning and forecasting material and labor resources under the auspices of WHO, World Bank, Asian Development Bank [30,31]. But, unfortunately, the scientific community still pays little attention to the issues of scientific substantiation of society's needs for health services and forecasting them for the short-term long-term [32]. In the literature available to us, we did not find works by Kazakhstani scientists devoted to these problems. Some publication activity in this area was observed during the COVID-19 pandemic, but they were devoted to planning emergency measures in an extreme situation [33,34].
There are some scientific challenges in forecasting the volume of healthcare services. Among them:
- -
- Uncertainty and quality of data: Accurate forecasting relies on complete, reliable, and up-to-date data on morbidity, demographics, and healthcare accessibility. However, data is often incomplete, outdated, or error-prone, particularly in developing countries or when accounting for informal healthcare sectors [35]
- -
- Dynamic variability of factors: The volume of healthcare services depends on factors like income levels, government policies, epidemiological conditions, and technological innovations, which can change rapidly. Traditional models often assume stability, reducing their applicability in real-world settings [36]
- -
- Complexity of human behavior: Patient behavior (e.g., seeking care, choosing between public and private services, self-treatment) is difficult to predict and formalize, posing challenges for models that cannot fully integrate subjective factors [30]
- -
- Limitations of existing forecasting methods: Methods like time series, exponential smoothing, or Markov chains have inherent weaknesses. For instance, time series struggle with long-term forecasts when trends shift, while Markov chains assume constant transition probabilities, which is rarely realistic in healthcare [37]
- -
- Integration of new technologies and their impact: The rapid rise of artificial intelligence (AI), telemedicine, and wearable devices is reshaping healthcare demand, but their effects are insufficiently studied and hard to quantify in models. [38]
- -
- Regional and social heterogeneity: Differences in healthcare access across regions and social groups (e.g., income, education levels) complicate the development of universal models. Forecasts based on averaged data often fail to reflect local specifics [29]
- -
- Impact of external shocks and crises: Economic downturns, sanctions, epidemics, or conflicts drastically alter healthcare supply and demand. Most models are not equipped to handle such disruptions [27]
- -
- Ethical and legal constraints: Using big data and AI for forecasting faces restrictions related to patient privacy and healthcare regulations, limiting data access and model development [39]
- -
- Possible solutions to these problems include the creation of centralized databases with regular updates and integration of information from different sources (public clinics, private sector, insurance companies), combining traditional methods with machine learning to account for nonlinear dependencies and adapt to changes, developing forecasts taking into account different scenarios (e.g. economic downturn, epidemic) to increase the sustainability of models, as well as developing regional models taking into account the specifics of infrastructure and demographics.
In recent years, the availability of data necessary for analyzing the state of the healthcare system has significantly improved in Kazakhstan. Socioeconomic indicators, as well as indicators of the health status of the population and indicators of the performance of healthcare institutions can be found on the websites of WHO, the World Bank, and on domestic websites https://stat.gov.kz, http://www.medinfo.kz, https://www.nrchd.kz. In this regard, the possibilities for developing and implementing methods for planning and forecasting the volume of medical care for the population, taking into account the specifics of the national healthcare system, have improved.
We set the task of assessing the load on the healthcare system of Kazakhstan in the next decade using indicators of general morbidity, outpatient visits, the need for medical personnel and financial costs of medical care. The simplest and most reliable way to do this is to use auto-regressive integrated moving average (ARIMA) models with exogenous variables [40]. As such an exogenous factor, we used the population, for forecasting which there are sufficiently reliable methods.
Our actions included the following steps:
- -
- age-specific mortality rate forecasting
- -
- birth rate forecasting
- -
- population forecasting
- -
- total morbidity forecasting
- -
- Internists and Pediatricians forecasting
- -
- financial need calculation
2. Materials and Methods
2.1. Data Sources
The dataset includes statistical data of Kazakhstan:
- -
- Historical population data (1991–2023), disaggregated by age, sex, and year.
- -
- Annual birth rates per 1,000 total population for the same period.
- -
- Age-specific mortality rates per 1,000 population for each year from 1991 to 2023.
- -
- Annual number of internal medicine physicians (internists) for 1991-2023
- -
- Annual number of pediatricians for 1991-2023
- -
- Annual total healthcare costs per capita for 1991-2023 (US$)
- -
- These data were sourced from Kazakhstan national statistics bureau.
2.2. Markov Chain-Based Population Forecasting Methodology
This study applies a dynamic Markov chain model to forecast population dynamics for the period 2024–2033. The methodology integrates historical demographic data, birth rates, and mortality rates while using dynamically updated transition matrices to model age-group transitions.
The Markov chain approach models population changes as a stochastic process, where the population state at time t+1 depends solely on its state at time t.
The population is stratified into 18 age groups (‘0-4’, ‘5-9’, ..., ‘85+’) and divided by sex (male, female). The transition probabilities are derived from age-specific mortality rates.
For each year, a transition matrix was constructed to describe the probabilities of individuals:
- -
- remaining in the same age group.
- -
- transitioning to the next age group due to aging.
- -
- exiting the system due to mortality.
The probability of staying in the same age group was calculated as:
The probability of transitioning to the next age group was:
where:
MortalityRatei is the age-specific mortality rate,
Duration of Age Group = 5 years (except for the last group).
Children born are added to the age group "0-4". The number of births is divided between boys and girls based on the historical ratio (approximately 50% boys and 50% girls).
2.3. Birth Rate Forecasting
To forecast birth rate for 2024-2033, we used ARIMA with stationarity checking and selection of the best parameters. For model implementation data from 1991 to 2013 were used. The number of births was calculated using the annual birth rate and the total population size.
2.4. Age-specific Mortality Rate Forecasting
To forecast mortality rate for 2024-2033 Hyndman-Ullah model (HU) was used [16].
This model can be expressed as:
where:
mx,t is the mortality rate for age x at time t,
μ(x) is the mean function of mortality over time,
βk(x) are the functional principal component (FPC) loadings, capturing age-specific patterns of mortality change,
κk,t are the time-varying coefficients (scores) associated with each FPC, reflecting the temporal variation in mortality,
ε(x,t) is the error term.
The principal component scores were forecasted with ARIMA methods and then they were used for mortality forecasting.
2.5. Population Forecasting
The population vector for year t+1 was estimated by applying the transition matrix for year t:
where:
Nt = population vector at time t,
Tt = transition matrix at time t.
This process was repeated iteratively for each forecasted year (2024–2033).
We did not include the migration indicator in the model, since its level in the country is very low. Thus, in 2023, the migration balance was 6,656 people, with a population of about 20 million people. At present, there are no expectations that this migration level will change significantly.
2.6. Healthcare Demand Forecasting
To forecast the general morbidity, outpatient contacts, total demand for internists and pediatricians we used the ARIMA method with exogenous variables, which allows the model to consider the influence of external factors on the target variable. In our study, we chose population size as an explanatory variable.
When calculating total healthcare costs, we used data for 2022 - US$445 per capita.
2.7. Model Fitting and Validation
For each model, the time series was divided into two parts: a training timeframe (1991-2013) and a testing timeframe (2014-2023). The training timeframe was used to fit the model, while the testing timeframe was used to assess the forecasting accuracy.
To validate the model, the forecasted data was compared with actual data from the same period and accuracy metrics were calculated:
Absolute Percentage Error (APE)
where At –is the actual data, Ft – is the forecast data at time t., n - number of forecast years.
Mean Absolute Percentage Error (MAPE)
All the analysis in this study is performed using R.4.4.2
3. Results
3.1. Population Model Fitting and Validity
Based on data on population, mortality and fertility for 1991-2013 (training timeframe), a matrix of the probability of transitions from one age group to another was formed for male and female subpopulations. Transition matrices are performed in Supplementary materials (Tables S1, S2). Model performed MAPE=4.2% on the training timeframe.
Next, we tested the predictive capabilities of the model on the testing timeframe from 2014 to 2023. The APE metric was used to assess forecasting accuracy (Table 1) and MAPE was 2.8% on the testing timeframe. The results illustrate that the Markov chain model is a viable model that can perform well in terms of forecasting population.
3.2. Population Forecast to 2033
To forecast the population up to 2033 using the transition matrix, it is necessary to know the forecast values of the birth and death rates.
3.2.1. Birth Rate Forecasting Model
In order to project the birth rate change, we employed an ARIMA model. To do this, we checked the time series for stationarity and selected the best parameters. The graph in Figure 1 presents historical data (blue line), fitted data (orange line), testing data (dotted line) and forecast values (green line). On training timeframe MAPE was 2.7% and on the testing timeframe MAPE was 3.4%. The birth rate is expected to increase in the coming decade. However, the growth rate will decline from 1.5% in 2025 to 0.3% in 2033. The modeling results are detailed in Supplementary Materials, section S1.
3.2.2. Mortality Forecasting Model
For mortality analysis, we used the Hyndman and Ullah model based on Functional Principal Component Analysis (FPCA) to further reduce the dimensionality of the mortality data and retain the most significant patterns.
On the training timeframe MAPE was 3.7% and on the testing timeframe MAPE was 13.3%.
Forecasting up to 2033 was carried out both for the population as a whole and separately for male and female subpopulations. As Figure 2 shows, we expect further declines in mortality in most age groups. Only in groups over 80 years old is a slight increase in mortality predicted in the coming year, but then a downward trend will be observed again. The modeling results are detailed in Supplementary Materials, section S2.
3.3.3. Population Forecasting Model
The probability matrix and predicted values of fertility and mortality were used to forecast the population. Modelling results suggest that the number of births will continue to increase and the number of deaths will continue to decrease over the next decade (Figure 3).
We predict that the population growth trend that began in the early 2000s will continue into the future, with population reaching 23,334,397 by 2033 (Figure 4). The male to female ratio will remain at approximately 49% to 51%. Projected population data are available in Supplementary Materials, Section S3.
If we consider the age structure of the population, the share of elderly people (over 65 years old) by 2033 will be 7-8% of the population, which is comparable to the level of 2023. We expect that the share of the working population will decrease from 66.2% to 55.2%, and at the same time the share of the child population will increase from 29.5% to 37.5%.

Table 2.
Population age structure up to 2033.
| Age | 0-14 | 15-64 | 65-85+ |
| Year | % | ||
| 2023 | 29.5 | 62.2 | 8.3 |
| 2024 | 22.4 | 65.7 | 12.0 |
| 2025 | 24.3 | 64.4 | 11.3 |
| 2026 | 26.2 | 63.2 | 10.7 |
| 2027 | 28.0 | 61.9 | 10.1 |
| 2028 | 29.7 | 60.8 | 9.5 |
| 2029 | 31.4 | 59.6 | 9.0 |
| 2030 | 33.0 | 58.4 | 8.6 |
| 2031 | 34.6 | 57.3 | 8.1 |
| 2032 | 36.1 | 56.2 | 7.7 |
| 2033 | 37.5 | 55.2 | 7.3 |
3.3. Assessment of Kazakhstan Healthcare Demand to 2033
We estimated some indicators characterizing the volume of medical services that will need to be provided in the coming decade. Among these indicators are the general morbidity of the population and the general childhood morbidity in absolute values, the number of outpatient contacts, the need for internists and pediatricians, and total financial costs. For each of these indicators, we used the ARIMAX method with population size as an exogenous variable. As shown in the Figure 5A, B, C, D, for each model, a fitting was performed on the training timeframe and an assessment of the forecasting accuracy was made on the testing timeframe.
Some problems awaited us in analysing data on the number of internists. As can be seen from the Figure 5D, the number of internists gradually decreased until 2000, and then slowly increased until 2016. In 2017, there was a sudden increase in their number (from 15,701 in 2016 to 26,229 in 2017), for which we have no explanation. A possible reason is a change in the counting methodology. After 2017, the changes were already at a new level between 25,000–27,737.
We employed an ARIMAX model to address the 2017 shift, incorporating:
- Intervention Indicator: Binary variable (0 for 1991–2016, 1 for 2017 onward).
- Population: Exogenous variable for demographic influence.
Fitting and testing results for all models are performed in Table 3.
The modeling results are detailed in Supplementary Materials, sections S4-S8. All models showed high predictive ability, the error (MAPE) on the test section was from 2.8 to 7%. This allowed us to use the models to assess the dynamics of the studied indicators for 10 years until 2033. The data obtained are summarized in Table 4.
4. Discussion
4.1. Main Findings
The world population is growing at a staggering rate, which is creating a significant burden on healthcare. The rate of population growth affects long-term planning of public healthcare and health facilities. Changes in age structure, internal migration of racial or industrial groups, changes in population density, and urban-rural migration require ongoing adaptation of the healthcare program to address the new problems thus created. These challenges are also relevant for Kazakhstan, where a clear trend towards population growth has emerged in recent years. The tasks of planning and forecasting healthcare resources are one of the priorities of regulatory authorities. In this regard, we set the goal of assessing healthcare needs up to 2033 in the context of a growing population.
Modelling has become one of the methods that is widely used in health care. In particular, it can be used to predict the impact of changes in access to services and to calculate the volume of services required given levels of demand and use.
In the first stage of this study, we were faced with the task of modeling population changes. For this, we chose the Markov chain approach. Since Markov chains work with probabilities, they effectively cope with situations where the data is incomplete or uncertain. The model showed high prediction accuracy on the test timeframe - MAPE in the ten-year period was 2.8%. However, to forecast up to 2033, we needed data on fertility and mortality. The ARIMA model with the best parameters was used to forecast birth rate for 10 years. We tested the model to assess its accuracy. It was shown that MAPE in testing timeframe is 3.4%. This allowed us to use the model to forecast the birth rate up to 2033. According to the results, it was found that in the coming decade the birth rate will increase at an average rate of 0.7% per year. Next, we conducted an analysis of the age-time-specific mortality rate. Among mortality models, the Hyndman and Ullah model is widely used. It can accommodate a variety of patterns in the data, such as different patterns and trends in mortality rates across age groups and over time. This flexibility makes it suitable for a wide range of populations and data sets with different mortality dynamics. When testing the predictive ability of this model, the obtained value of MAPE = 13.3% allowed it to be used to predict mortality in the period up to 2033. Based on the modeling results, it is assumed that the downward trend in mortality observed in the Republic in recent years will continue in the near future. As a result, the absolute number of children born will grow by an average of 2% per year, and the number of deaths will decrease annually to an average tempo of 1.4%. The number of children born will exceed the number of deaths, as a result of which further population growth is expected by an average of 1.4% annually and by 2033 the population will reach 23,334,397 people. The population growth will occur mainly due to children. If in 2023 their share in the population structure was 29.5%, then by 2033 it will be 37.5%. It is expected that the share of people of working age will decrease, and the elderly will remain unchanged.
Over the years of independence, Kazakhstan's population has grown 1.25 times. Several state healthcare development programs have been developed and adopted in the country. Medical funding is increasing, new hospitals are being built, and healthcare personnel are being trained. Further population growth poses new challenges for the state, and planning and forecasting issues play a significant role here.
One of the most popular methods used for forecasting in healthcare is ARIMA. The method is flexible in modeling, effective on small data, and easy to interpret. We used ARIMA to forecast some healthcare indicators. An extended version of the method (ARIMAX) allows us to consider an external factor, for which we chose population size. The models showed high accuracy both on training samples (from 1.6 to 5.9%) and on test samples (from 2.8 to 7%).
Based on the modeling results, we believe that, as in previous years, population growth will lead to an increase in the general morbidity of the population in absolute values. This growth will be observed among both adults and children (Figure 5A, B, Table 4). The growth rate of childhood morbidity will be higher than that of adults - an average of 1.6% and 0.8% annually, respectively. In children, high rates of disease incidence are observed during the first ten years of life. Morbidity drops sharply in late childhood and adolescence. During the period of young adulthood, the age-specific incidence curve shows a secondary peak [41].
In this regard, the number of visits to medical specialists will increase, according to our calculations, by approximately 1.5% per year (Figure 5C, Table 4). An increase in the number of visits can lead to overload of doctors, queues and a decrease in the quality of service, especially if resources (personnel, equipment) do not grow proportionally.
Internal medicine physicians (Internists) are specialists who apply scientific knowledge and clinical experience to diagnose, treat, and provide compassionate care across the spectrum of health and complex disease. The graph in Figure 5D shows that the number of such specialists has increased in previous years, and this trend is forecast to continue in the future - the demand for them will increase by an average of 4.7% per year. A slightly different picture is observed with the number of pediatricians. The graphs in Figure 5B, E show a contradiction between the growth of childhood morbidity and the decrease in the number of pediatricians. The fact is that in the late nineties the Ministry of Health decided to transfer the functions of pediatricians at Primary Health Care to general practitioners. The training of pediatricians in the bachelor's degree was discontinued, remaining only in internship and residency. In this regard, the number of pediatricians in previous years decreased (Figure 5E). However, in 2020, the training of pediatricians in the bachelor's degree was restored and, perhaps, the observed trend will change towards an increase. Therefore, the realism of our forecasts is in doubt.
The need for labor and material resources entails an increase in financial costs. In 2023, health care costs per capita amounted to $445. Based on this amount, total costs by 2033 will increase by 11.6% compared to 2023 (Table 4).
4.2. Limitations
In our study, we considered only some aspects of such a concept as "demand for medical services". This broad concept includes material and labor resources, various types of medical care, the number of procedures and interventions, coverage and availability of services, frequency, finances. Each of these aspects is the subject of a separate study.
We linked the volume of medical services provided to the growing population, since this is one of the few factors for which reliable forecasting tools exist. Other factors include economic, social, political, epidemiological, technological, and organizational ones. The impact of these factors on forecasting is difficult to assess, but in this case, the use of a scenario approach is justified.
The traditional ARIMA method was proposed as the main forecasting tool. At the same time, many researchers have implemented machine learning for medical time series forecasting. This is especially true when the time series contain nonlinear components. These methods open new possibilities in the field of forecasting in healthcare.
5. Conclusion
Public health institutions are always faced with the problem of timely and quality provision of health services. Reasonable allocation of health resources is a scientific problem that considers changes in society’s needs for health services. Understanding the demand for health services requires not only the analysis of past and current health data but also relies on accurate forecasting of trends in the near future. Evaluation of such trends is invaluable information for determining needs, planning resources, evaluating institutions, and formulating policies.
Supplementary Materials
The following supporting information can be downloaded at the website of this paper posted on Preprints.org. Supplementary File 1.
Author Contributions
Conceptualization, Methodology, BK; Software, NO; Validation, KA; Formal analysis, AK; Investigation, MM; Data curation, MM; Writing – original draft, BK; Writing – review & editing, NO.
Funding
This work received no external funding.
Institutional Review Board Statement
Not applicable. No human subjects or data were included in these analyses.
Informed Consent Statement
Not applicable.
Data Availability Statement
The data presented in this study are available on the websites of WHO, the World Bank, and on domestic websites https://stat.gov.kz, http://www.medinfo.kz, https://www.nrchd.kz.
Conflicts of Interest
The authors declare that they have no known competing financial interests or personal relationships that could have appeared to influence the work reported in this paper.
References
- Jalalpour M, Gel Y, Levin S. Forecasting demand for health services: Development of a publicly available toolbox. Operations Research for Health Care 2015;5:1–9. [CrossRef]
- Soyiri IN, Reidpath DD. An overview of health forecasting. Environ Health Prev Med 2013;18:1–9. [CrossRef]
- Lee JT, Crettenden I, Tran M, Miller D, Cormack M, Cahill M, et al. Methods for health workforce projection model: systematic review and recommended good practice reporting guideline. Hum Resour Health 2024;22:25. [CrossRef]
- Mushasha R, El Bcheraoui C. Comparative effectiveness of financing models in development assistance for health and the role of results-based funding approaches: a scoping review. Global Health 2023;19:39. [CrossRef]
- Merkuryeva G, Valberga A, Smirnov A. Demand forecasting in pharmaceutical supply chains: A case study. Procedia Computer Science 2019;149:3–10. [CrossRef]
- Keskinocak P, Savva N. A review of the healthcare-management (Modeling) literature published in manufacturing & service operations management. M&SOM [Internet]. 2020 Jan [cited 2025 Apr 1];22(1):59–72. [CrossRef]
- McRae S. Long-term forecasting of regional demand for hospital services. Operations Research for Health Care [Internet]. 2021 Mar [cited 2025 Apr 1];28:100289. Available from: https://linkinghub.elsevier.com/retrieve/pii/S2211692321000059.
- Jones SA, Joy MP, Pearson J. [No title found]. Health Care Management Science [Internet]. 2002 [cited 2025 Apr 1];5(4):297–305. [CrossRef]
- Forecasting demand for regional healthcare. In Spatial and Syndromic Surveillance for Public Health John Wiley & Sons, N-Y, 2005(pp. 123-140).
- Milner PC. Ten-year follow-up of ARIMA forecasts of attendances at accident and emergency departments in the Trent region. Statist Med 1997;16:2117–25. [CrossRef]
- Overview of the cohort-component method. In: State and Local Population Projections. Dordrecht: Kluwer Academic Publishers; 2002. p. 43–8. [CrossRef]
- Alders M, Keilman N, Cruijsen H. Assumptions for long-term stochastic population forecasts in 18 European countries: Hypothèses de projections stochastiquesàlong terme des populations de 18 pays européens. Eur J Population . 2007 Mar;23(1):33–69. Available from: https://link.springer.com/. [CrossRef]
- Raftery AE, Ševčíková H. Probabilistic population forecasting: Short to very long-term. International Journal of Forecasting . 2023 Jan;39(1):73–97. Available from: https://linkinghub.elsevier.com/retrieve/pii/S0169207021001394.
- Basellini U, Camarda CG, Booth H. Thirty years on: A review of the Lee–Carter method for forecasting mortality. International Journal of Forecasting . 2023 Jul;39(3):1033–49. Available from: https://linkinghub.elsevier.com/retrieve/pii/S0169207022001455.
- Hyndman RJ, Shahid Ullah Md. Robust forecasting of mortality and fertility rates: A functional data approach. Computational Statistics & Data Analysis . 2007 Jun;51(10):4942–56. Available from: https://linkinghub.elsevier.com/retrieve/pii/S0167947306002453.
- Nikitovic V. Functional data analysis in forecasting Serbian fertility. STANOVNISHTVO . 2011;49(2):73–89. Available from: https://idn.org.rs/ojs3/stanovnistvo/index.php/STNV/article/view/127.
- Patil RS, Ubale DrPV. A coherent functional demographic model approach for stochastic population forecasting. Int J Stat Appl Math . 2022 May 1;7(3):129–35. Available from: https://www.mathsjournal.com/archives/2022/vol7/issue3/PartB/7-3-10.
- Barker RJ, Sauer JR. Modelling population change from time series data. In: McCullough DR, Barrett RH, editors. Wildlife 2001: Populations . Dordrecht: Springer Netherlands; 1992 . p. 182–94. [CrossRef]
- Bravo, JM & Coelho, E 2019, 'Forecasting subnational demographic data using seasonal time series methods', Atas da Conferencia da Associacao Portuguesa de Sistemas de Informacao. Forecasting subnational demographic data using seasonal time series methods. / Bravo, Jorge M.; Coelho, Edviges. In: Atas da Conferencia da Associacao Portuguesa de Sistemas de Informacao, 2019.
- Levantesi S, Pizzorusso V. Application of machine learning to mortality modeling and forecasting. Risks . 2019 Feb 26 [cited 2025 Apr 1];7(1):26. Available from: https://www.mdpi.com/2227-9091/7/1/26.
- Tzitiridou-Chatzopoulou M, Zournatzidou G, Kourakos M. Predicting future birth rates with the use of an adaptive machine learning algorithm: a forecasting experiment for scotland. IJERPH . 2024 Jun 27 [cited 2025 Apr 1];21(7):841. Available from: https://www.mdpi.com/1660-4601/21/7/841.
- Tanmoy FM, Hossain Z, Tasfia O, Abrar Hamim Md, Sadekur Rahman Md, Tarek Habib Md. Machine learning modeling for population forecasting. In: Kalam A, Mekhilef S, Williamson SS, editors. Innovations in Electrical and Electronics Engineering . Singapore: Springer Nature Singapore; 2025. p. 213–28. [CrossRef]
- Şahinarslan FV, Tekin AT, Çebi F. Application of machine learning algorithms for population forecasting. IJDS 2021;6:257. [CrossRef]
- Bartholomew, D.J., Stochastic Models for Social Processes. 3rd ed., Wiley, New York, USA, 1982.
- Lee RD, Tuljapurkar S. Stochastic Population Forecasts for the United States: Beyond High, Medium, and Low. Journal of the American Statistical Association 1994;89:1175–89. [CrossRef]
- Alho, J.M., Spencer, B.D., Statistical Demography and Forecasting, Springer, New York, USA, 2005.
- Chiang, C.L., An Introduction to Stochastic Processes in Biostatistics, Wiley, New York, USA, 1980.
- Keyfitz N. On Future Population. Journal of the American Statistical Association 1972;67:347–63. [CrossRef]
- Billari FC, Prskawetz A, editors. Agent-based computational demography: using simulation to improve our understanding of demographic behaviour . Heidelberg: Physica-Verlag HD; 2003. (Müller WA, Bihn M, editors. Contributions to Economics). [CrossRef]
- https://www.undp.org/kazakhstan/press-releases/who-and-undp-join-forces-kazakhstan-new-initiative-boost-pandemic-preparedness-and-health-infrastructure.
- https://www.adb.org/projects/57315-001/main.
- Saduyeva F., Vlassova A., Kalbekov Zh. Analysis of satisfaction with hospitalization in the gynecology department: service design project. Medicine and ecology. 2024;(4):124-130. (In Russ.). [CrossRef]
- Interrupted time series analysis of the impact of the COVID-19 pandemic and compulsory social health insurance system on fertility rates: a study of live births in Kazakhstan, 2019–2023. Indira Karibayeva, Sharapat Moiynbayeva, Valikhan Akhmetov, Sandugash Yerkenova, Kuralay Shaikova, Gaukhar Moshkalova, Dina Mussayeva, Bibinur Tarakova Front Public Health. 2024; 12.
- Semenova Y, Pivina L, Khismetova Z, Auyezova A, Nurbakyt A, Kauysheva A, Ospanova D, Kuziyeva G, Kushkarova A, Ivankov A, Glushkova N. Anticipating the Need for Healthcare Resources Following the Escalation of the COVID-19 Outbreak in the Republic of Kazakhstan. J Prev Med Public Health. 2020 Nov;53(6):387-396. [PubMed]
- Smith, S.K., Tayman, J., Swanson, D.A., 2001. "State and local population projections: Methodology and analysis," Springer Science & Business Media.
- Sanderson, W.C., Scherbov, S., Lutz, W., O'Neill, B. (2004). Applications of probabilistic population forecasting. In: The End of World Population Growth in the 21st Century. Eds. Lutz, W., Sanderson, W.C. & Scherbov, S. , pp. 85-120. London, Taylor & Francis. [CrossRef]
- Land KC. Methods for National Population Forecasts: A Review. Journal of the American Statistical Association 1986;81:888–901. [CrossRef]
- Topol, E.J. High-performance medicine: the convergence of human and artificial intelligence. Nat Med 25, 44–56 (2019). [CrossRef]
- Mittelstadt BD, Floridi L. The Ethics of Big Data: Current and Foreseeable Issues in Biomedical Contexts. Sci Eng Ethics 2016;22:303–41. [CrossRef]
- Huang Y, Xu C, Ji M, Xiang W, He D. Medical service demand forecasting using a hybrid model based on ARIMA and self-adaptive filtering method. BMC Med Inform Decis Mak . 2020 Dec [cited 2025 Apr 1];20(1):237. Available from: https://bmcmedinformdecismak.biomedcentral.com/articles/10.1186/s12911-020-01256-1.
- Perrott GStJ, Holland DF. Population Trends and Problems of Public Health. Milbank Quarterly 2005;83:569–608. [CrossRef]
Figure 1.
Birth rate for 1991-2021 and forecasting to 2033.
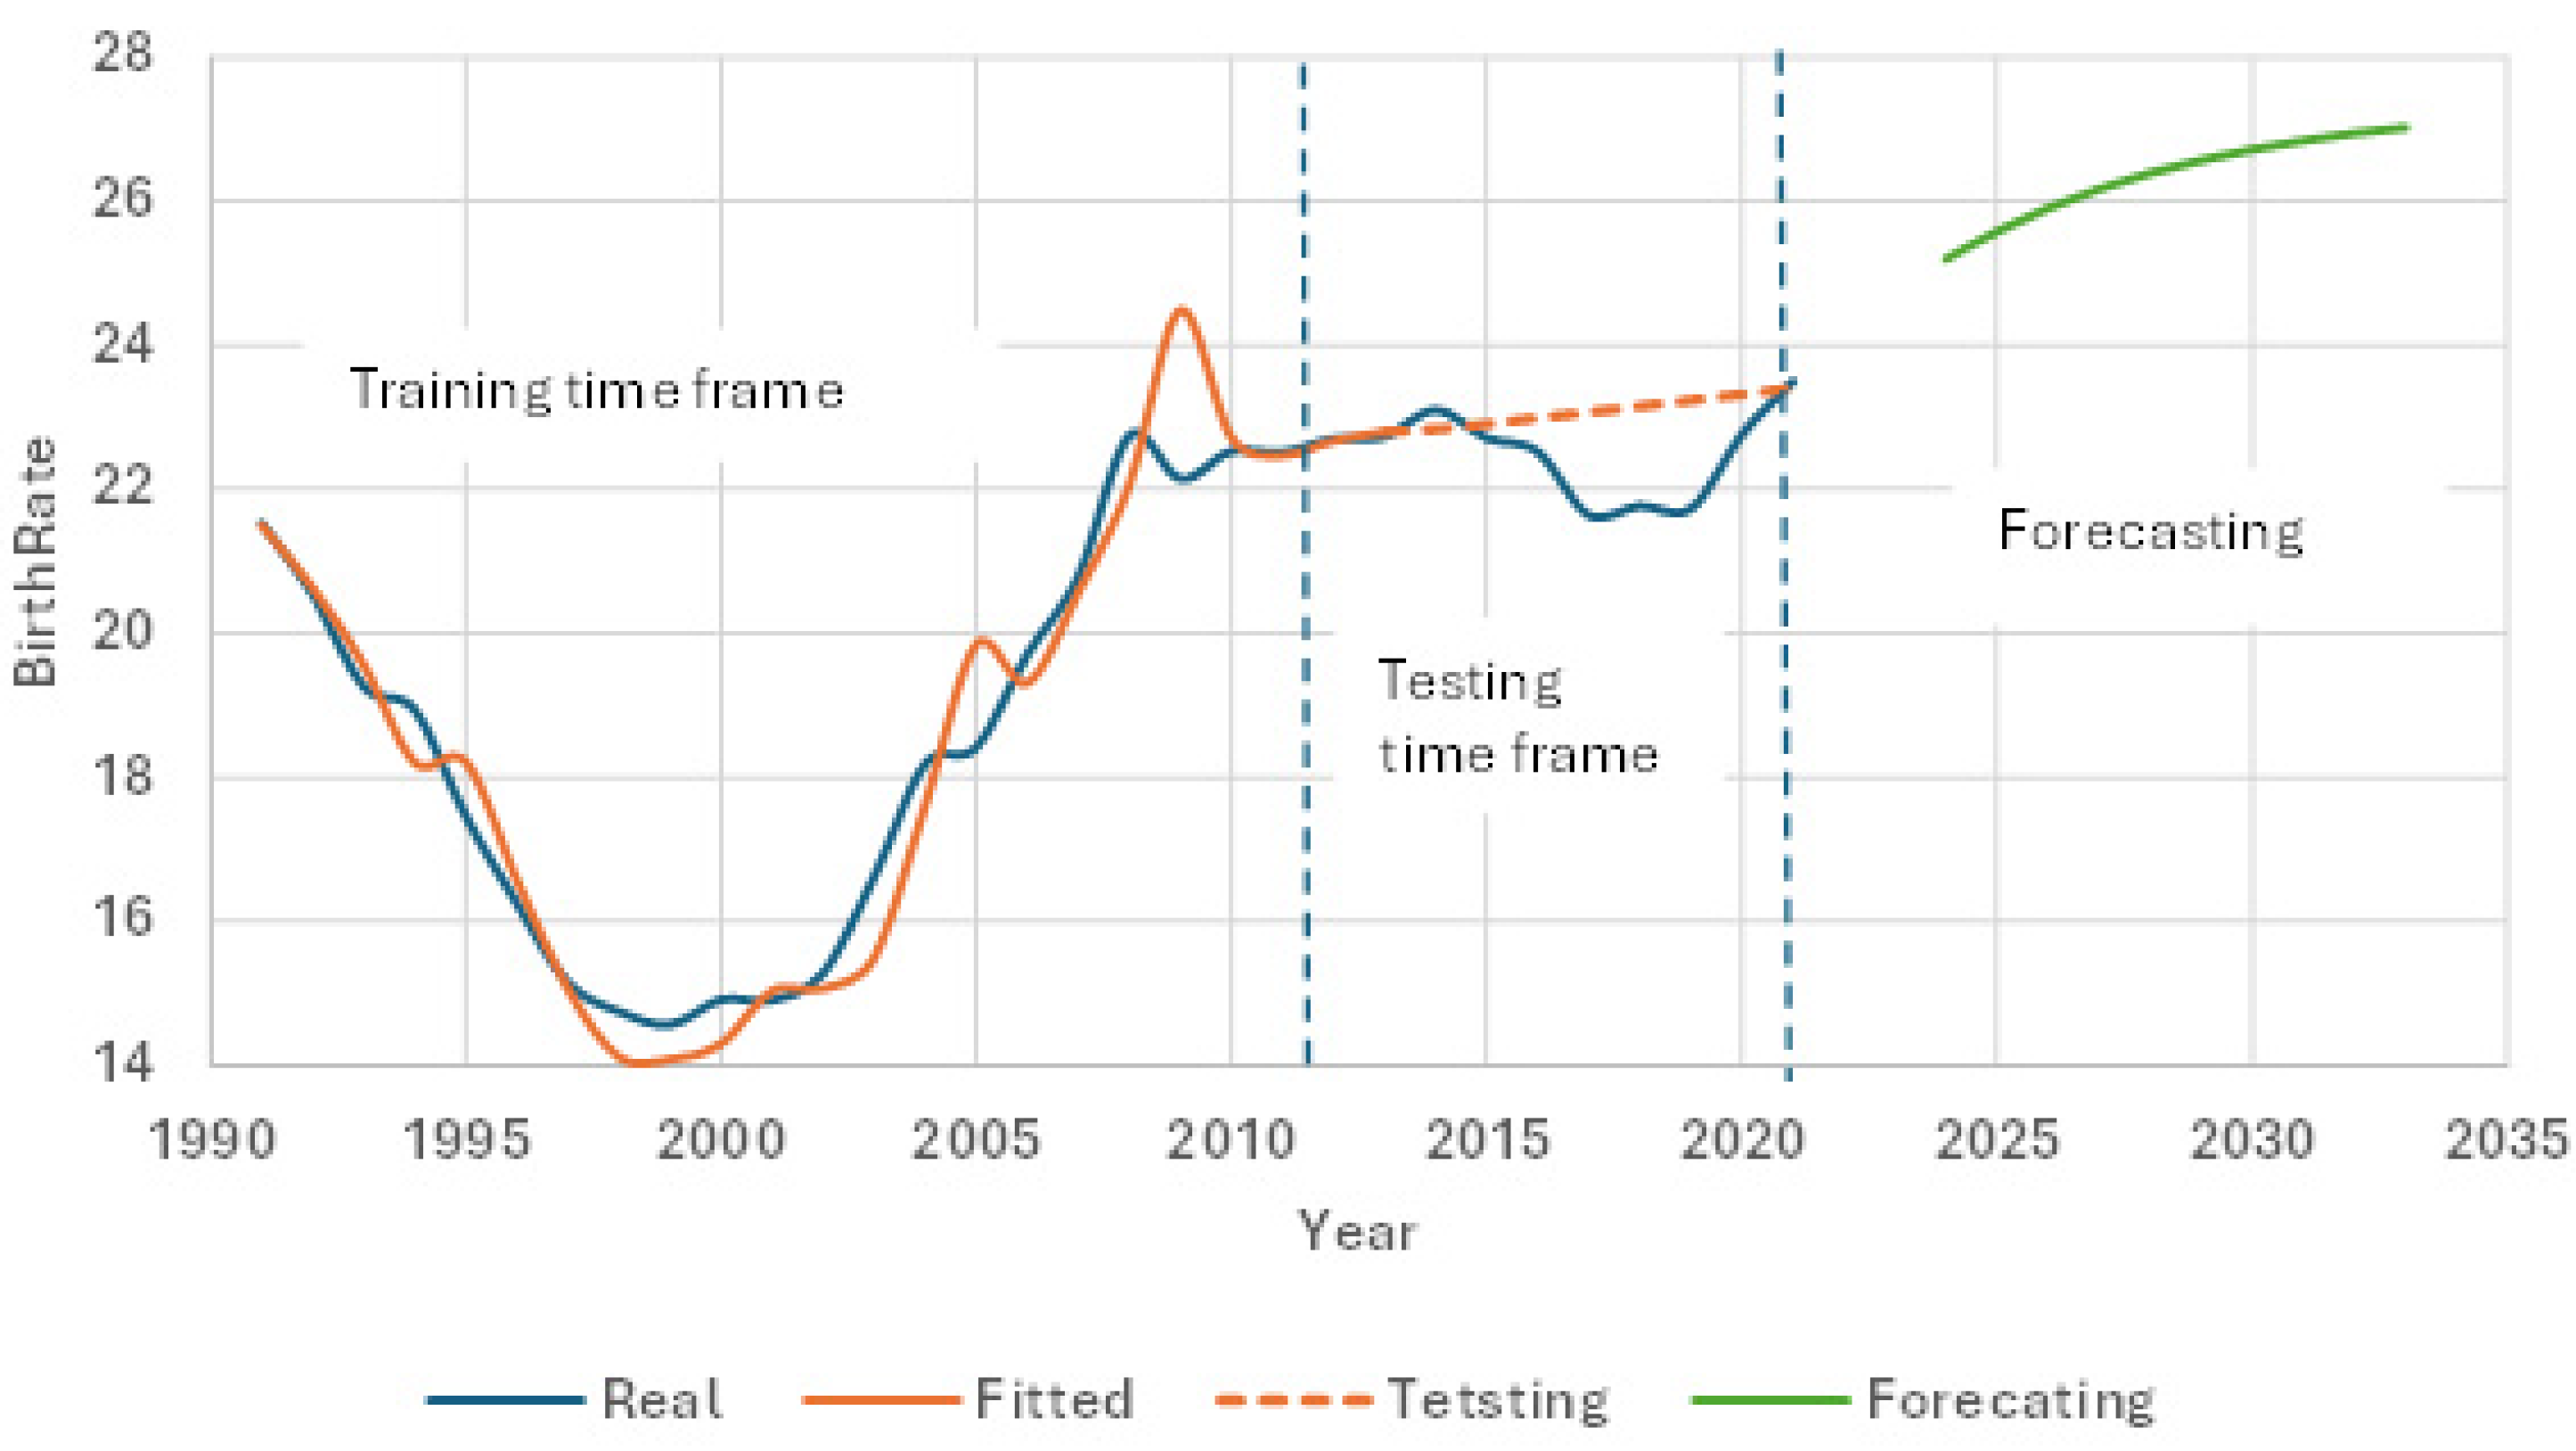
Figure 2.
Forecasting age-specific mortality rate of Kazakhstan population to 2033.
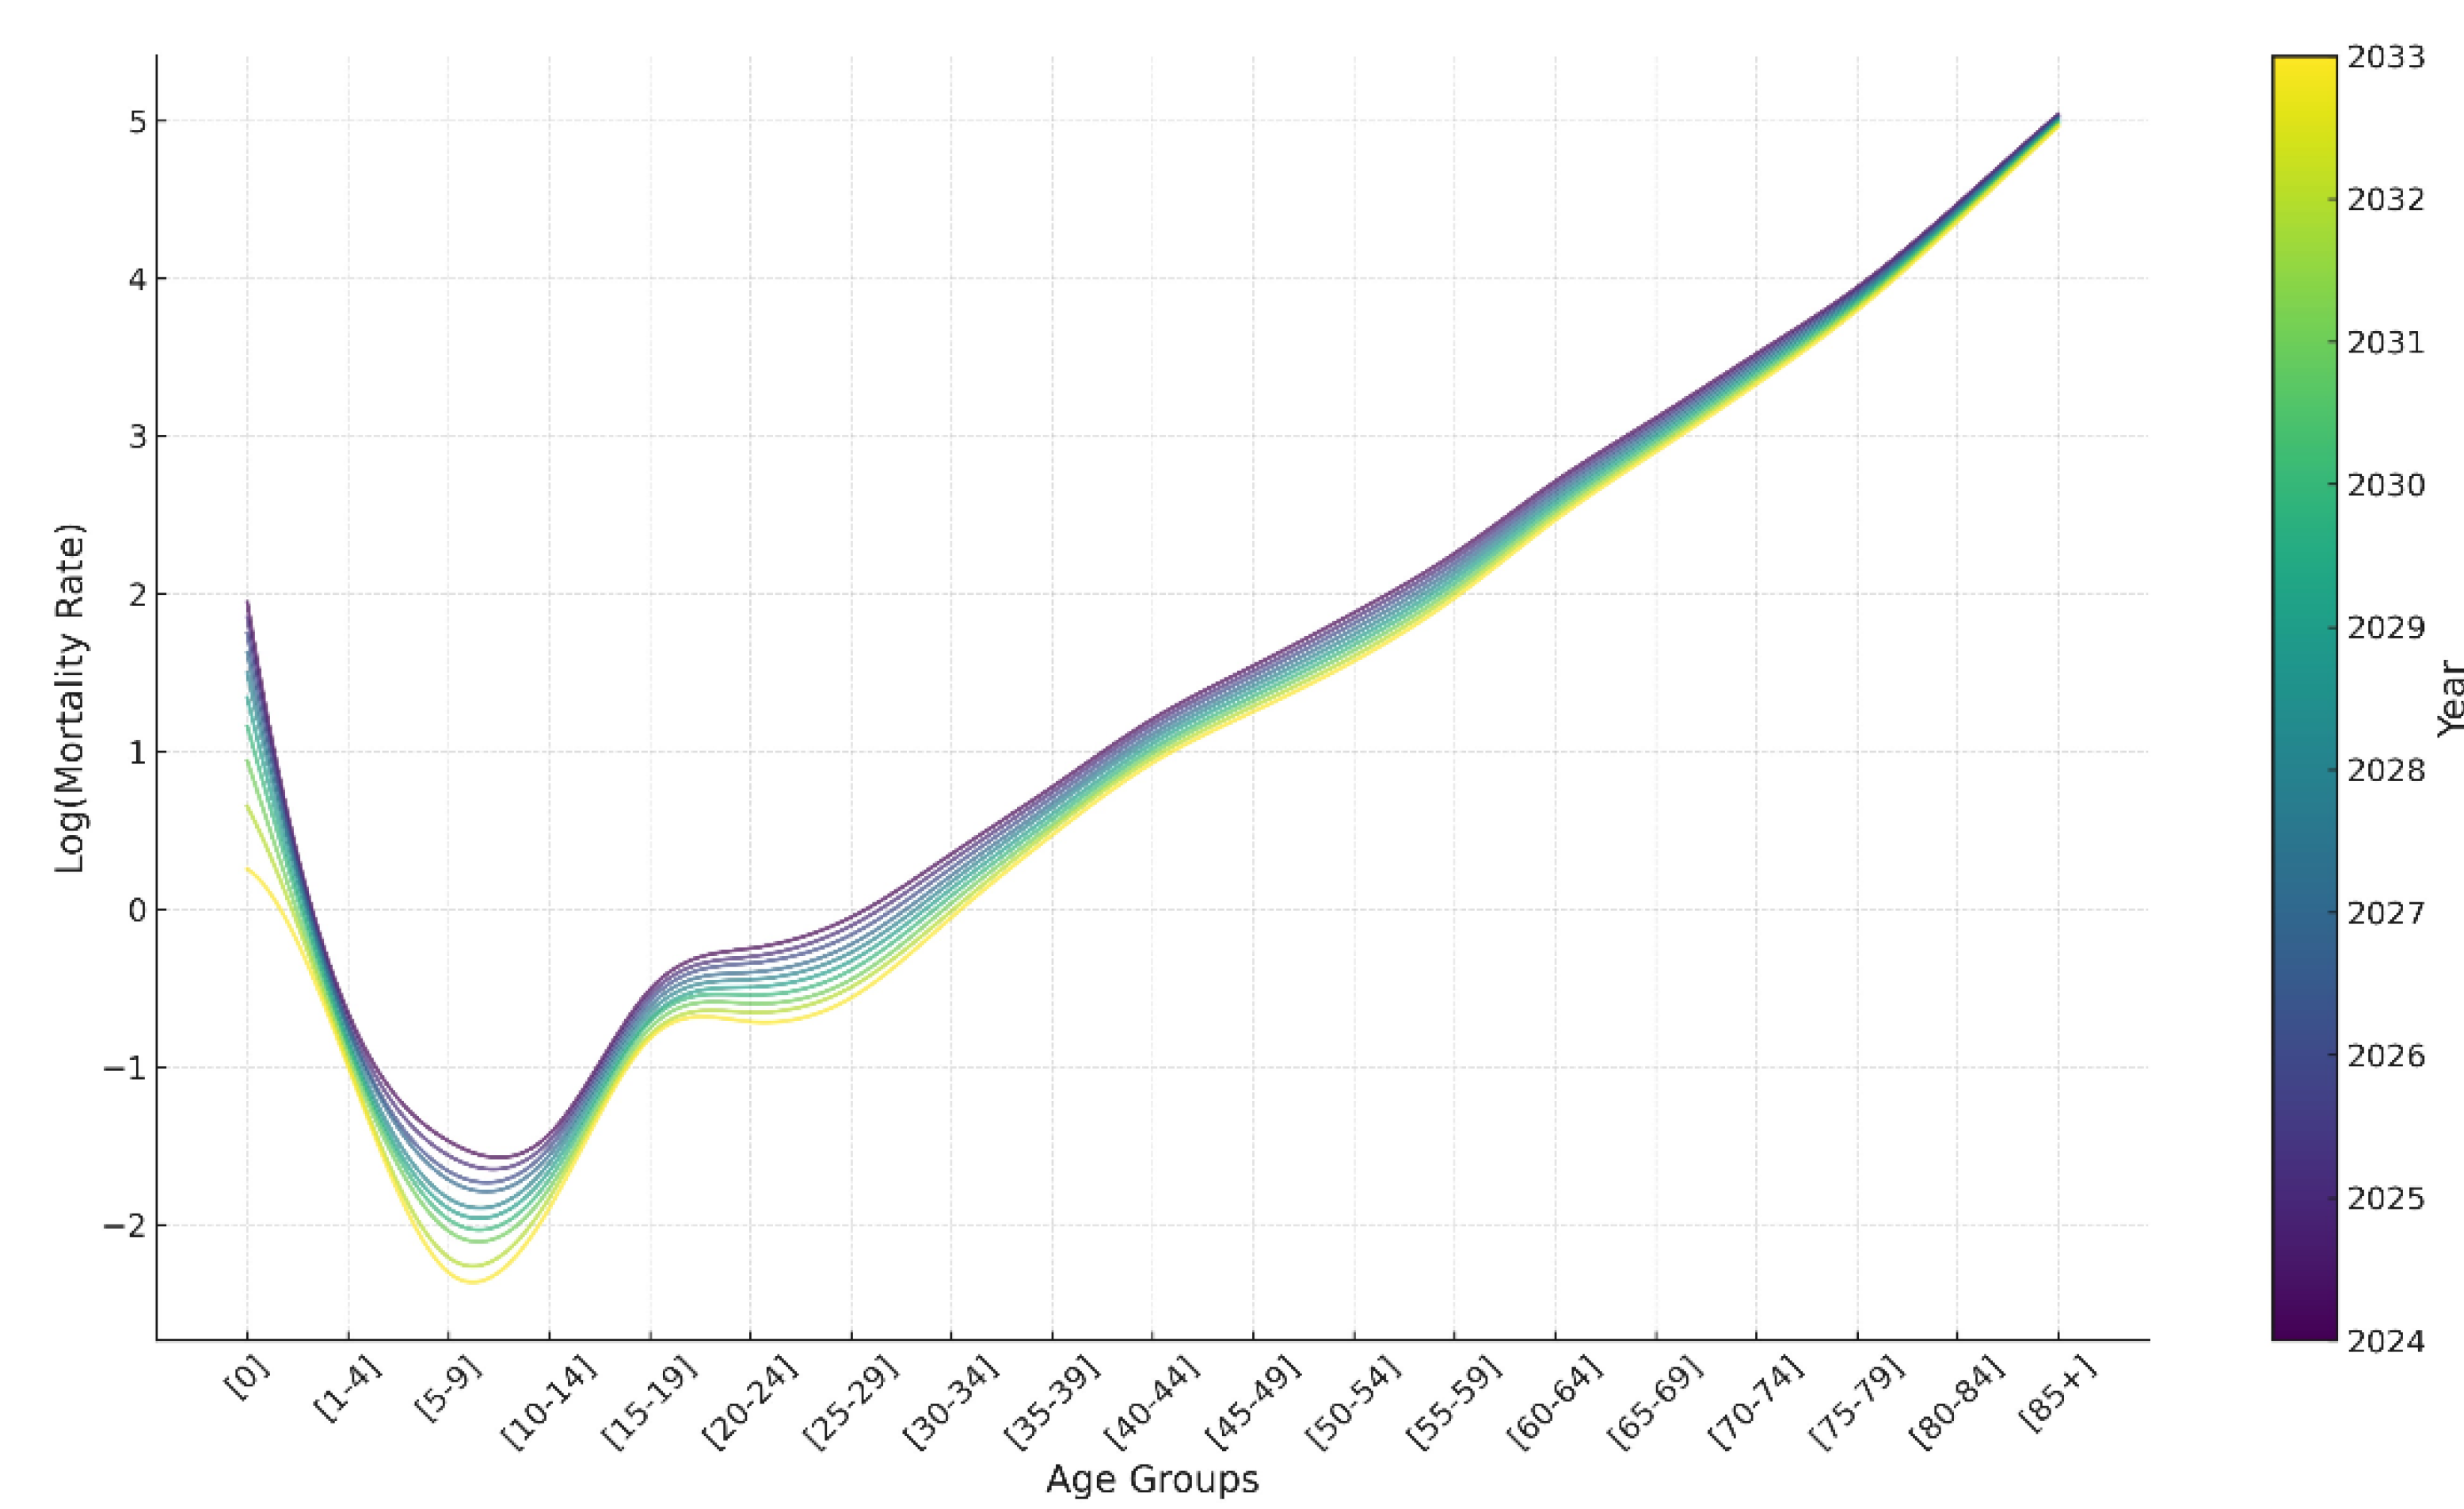
Figure 3.
Projected dynamics of the number of total births and total deaths from 2024 to 2033.
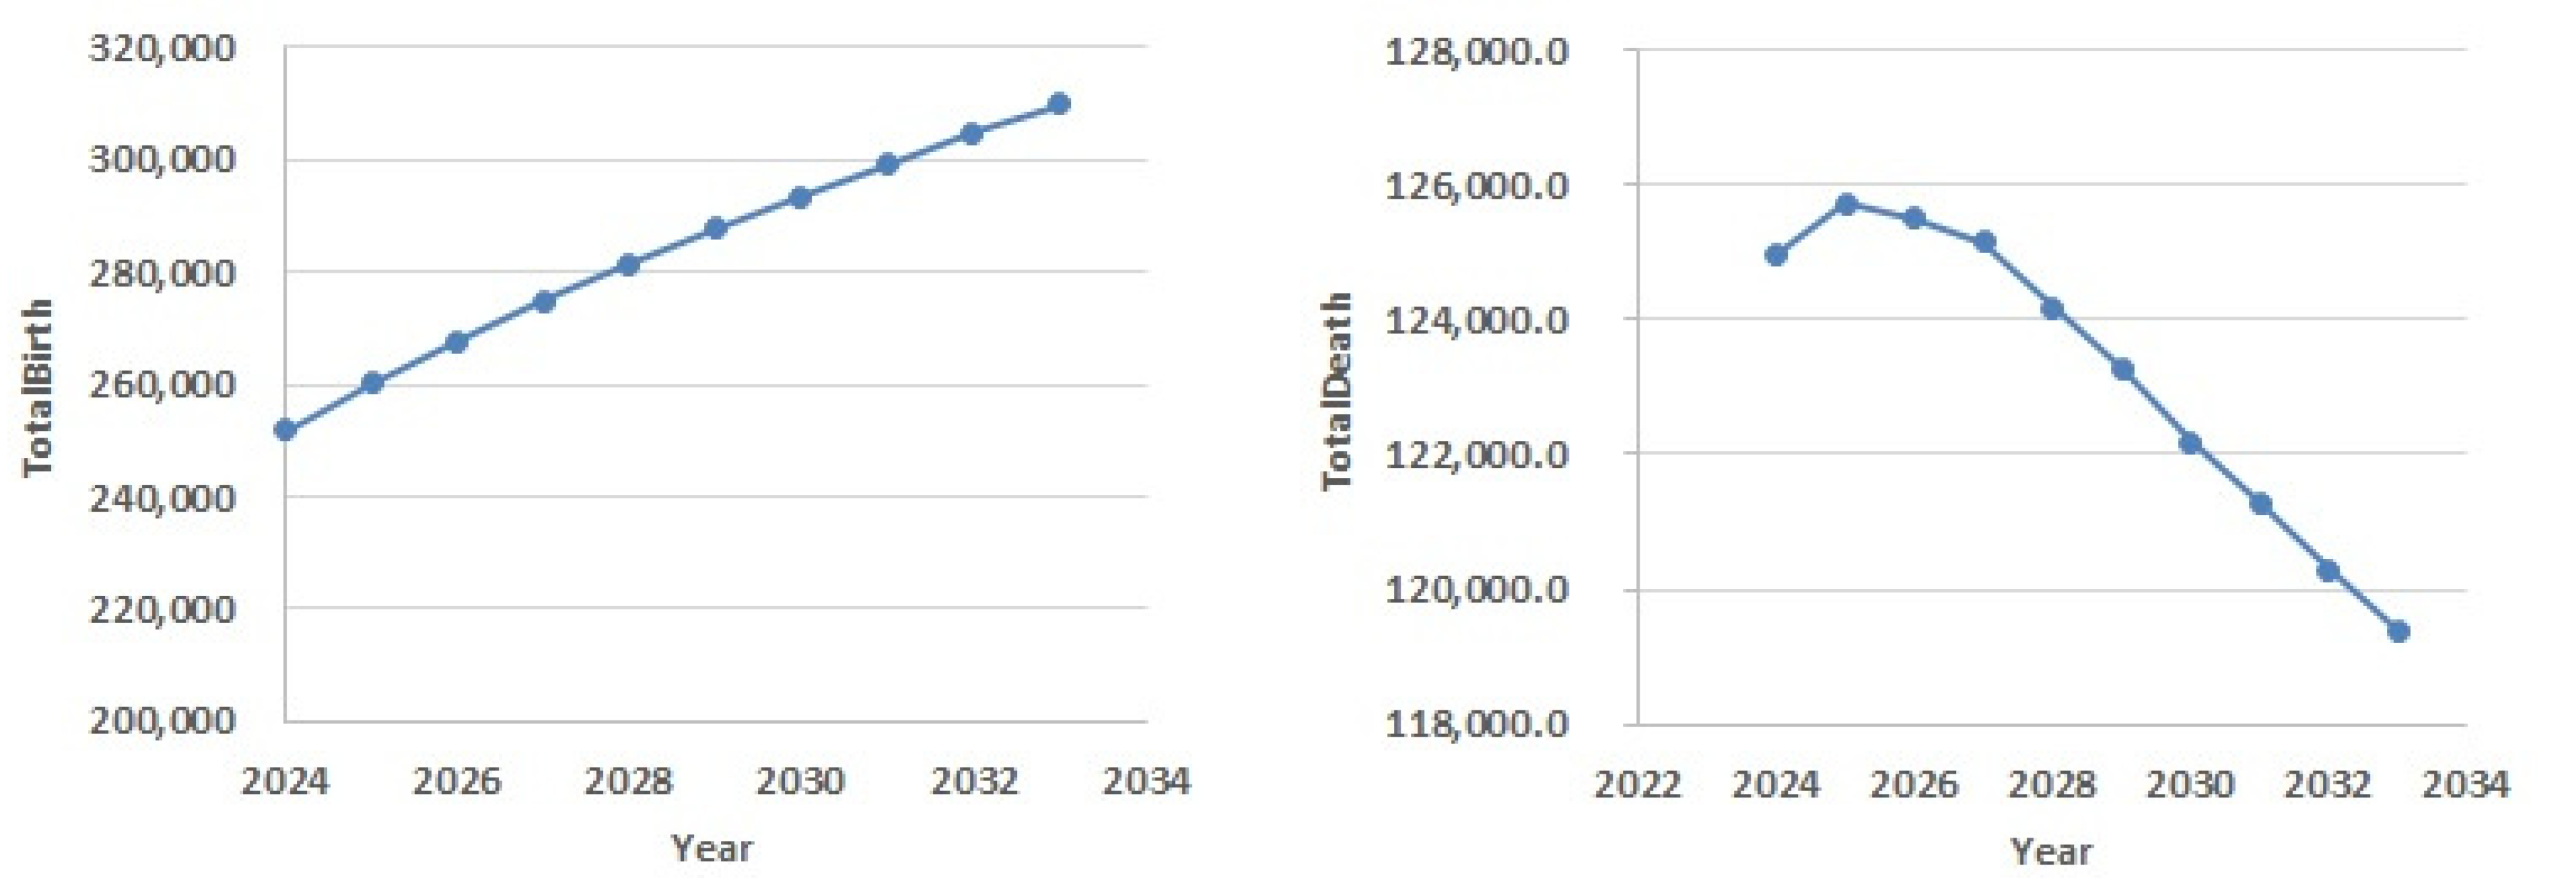
Figure 4.
Population modelling results.
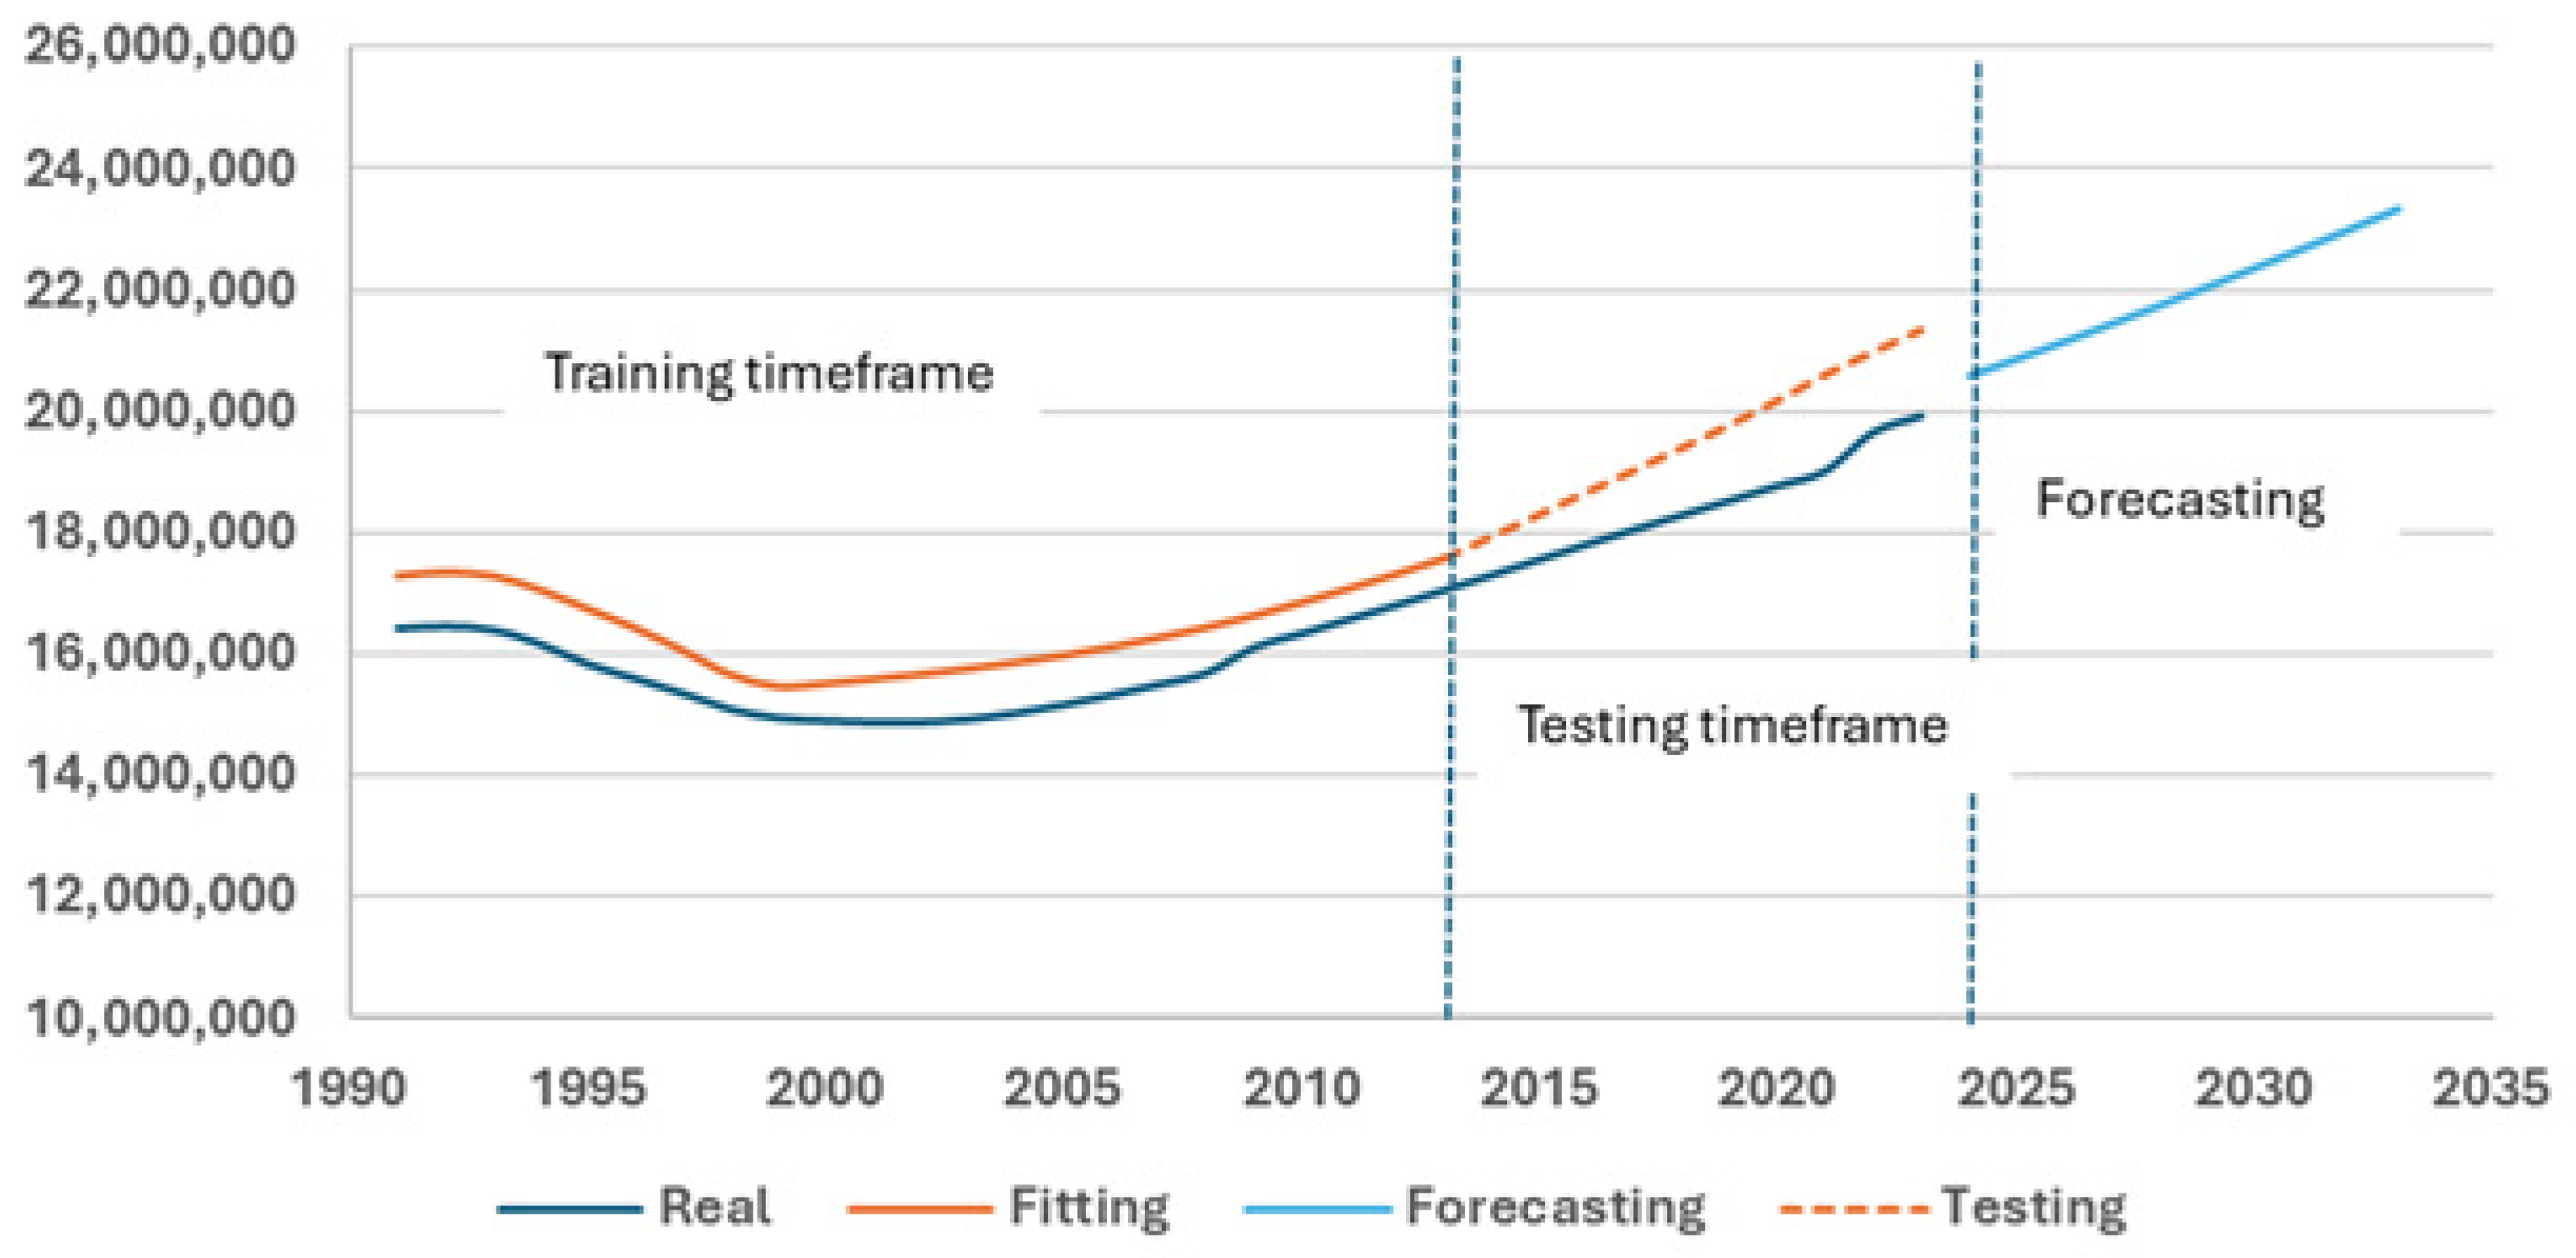
Figure 5.
Modeling results: A- general morbidity, B- childhood general morbidity, C-outpatient contacts, D- internists number, E- pediatricians number. Blue line – real data, yellow line – fitting data, dotted line – testing data, red line – forecasting data. The vertical dotted line separates training, testing and forecasting timeframes.
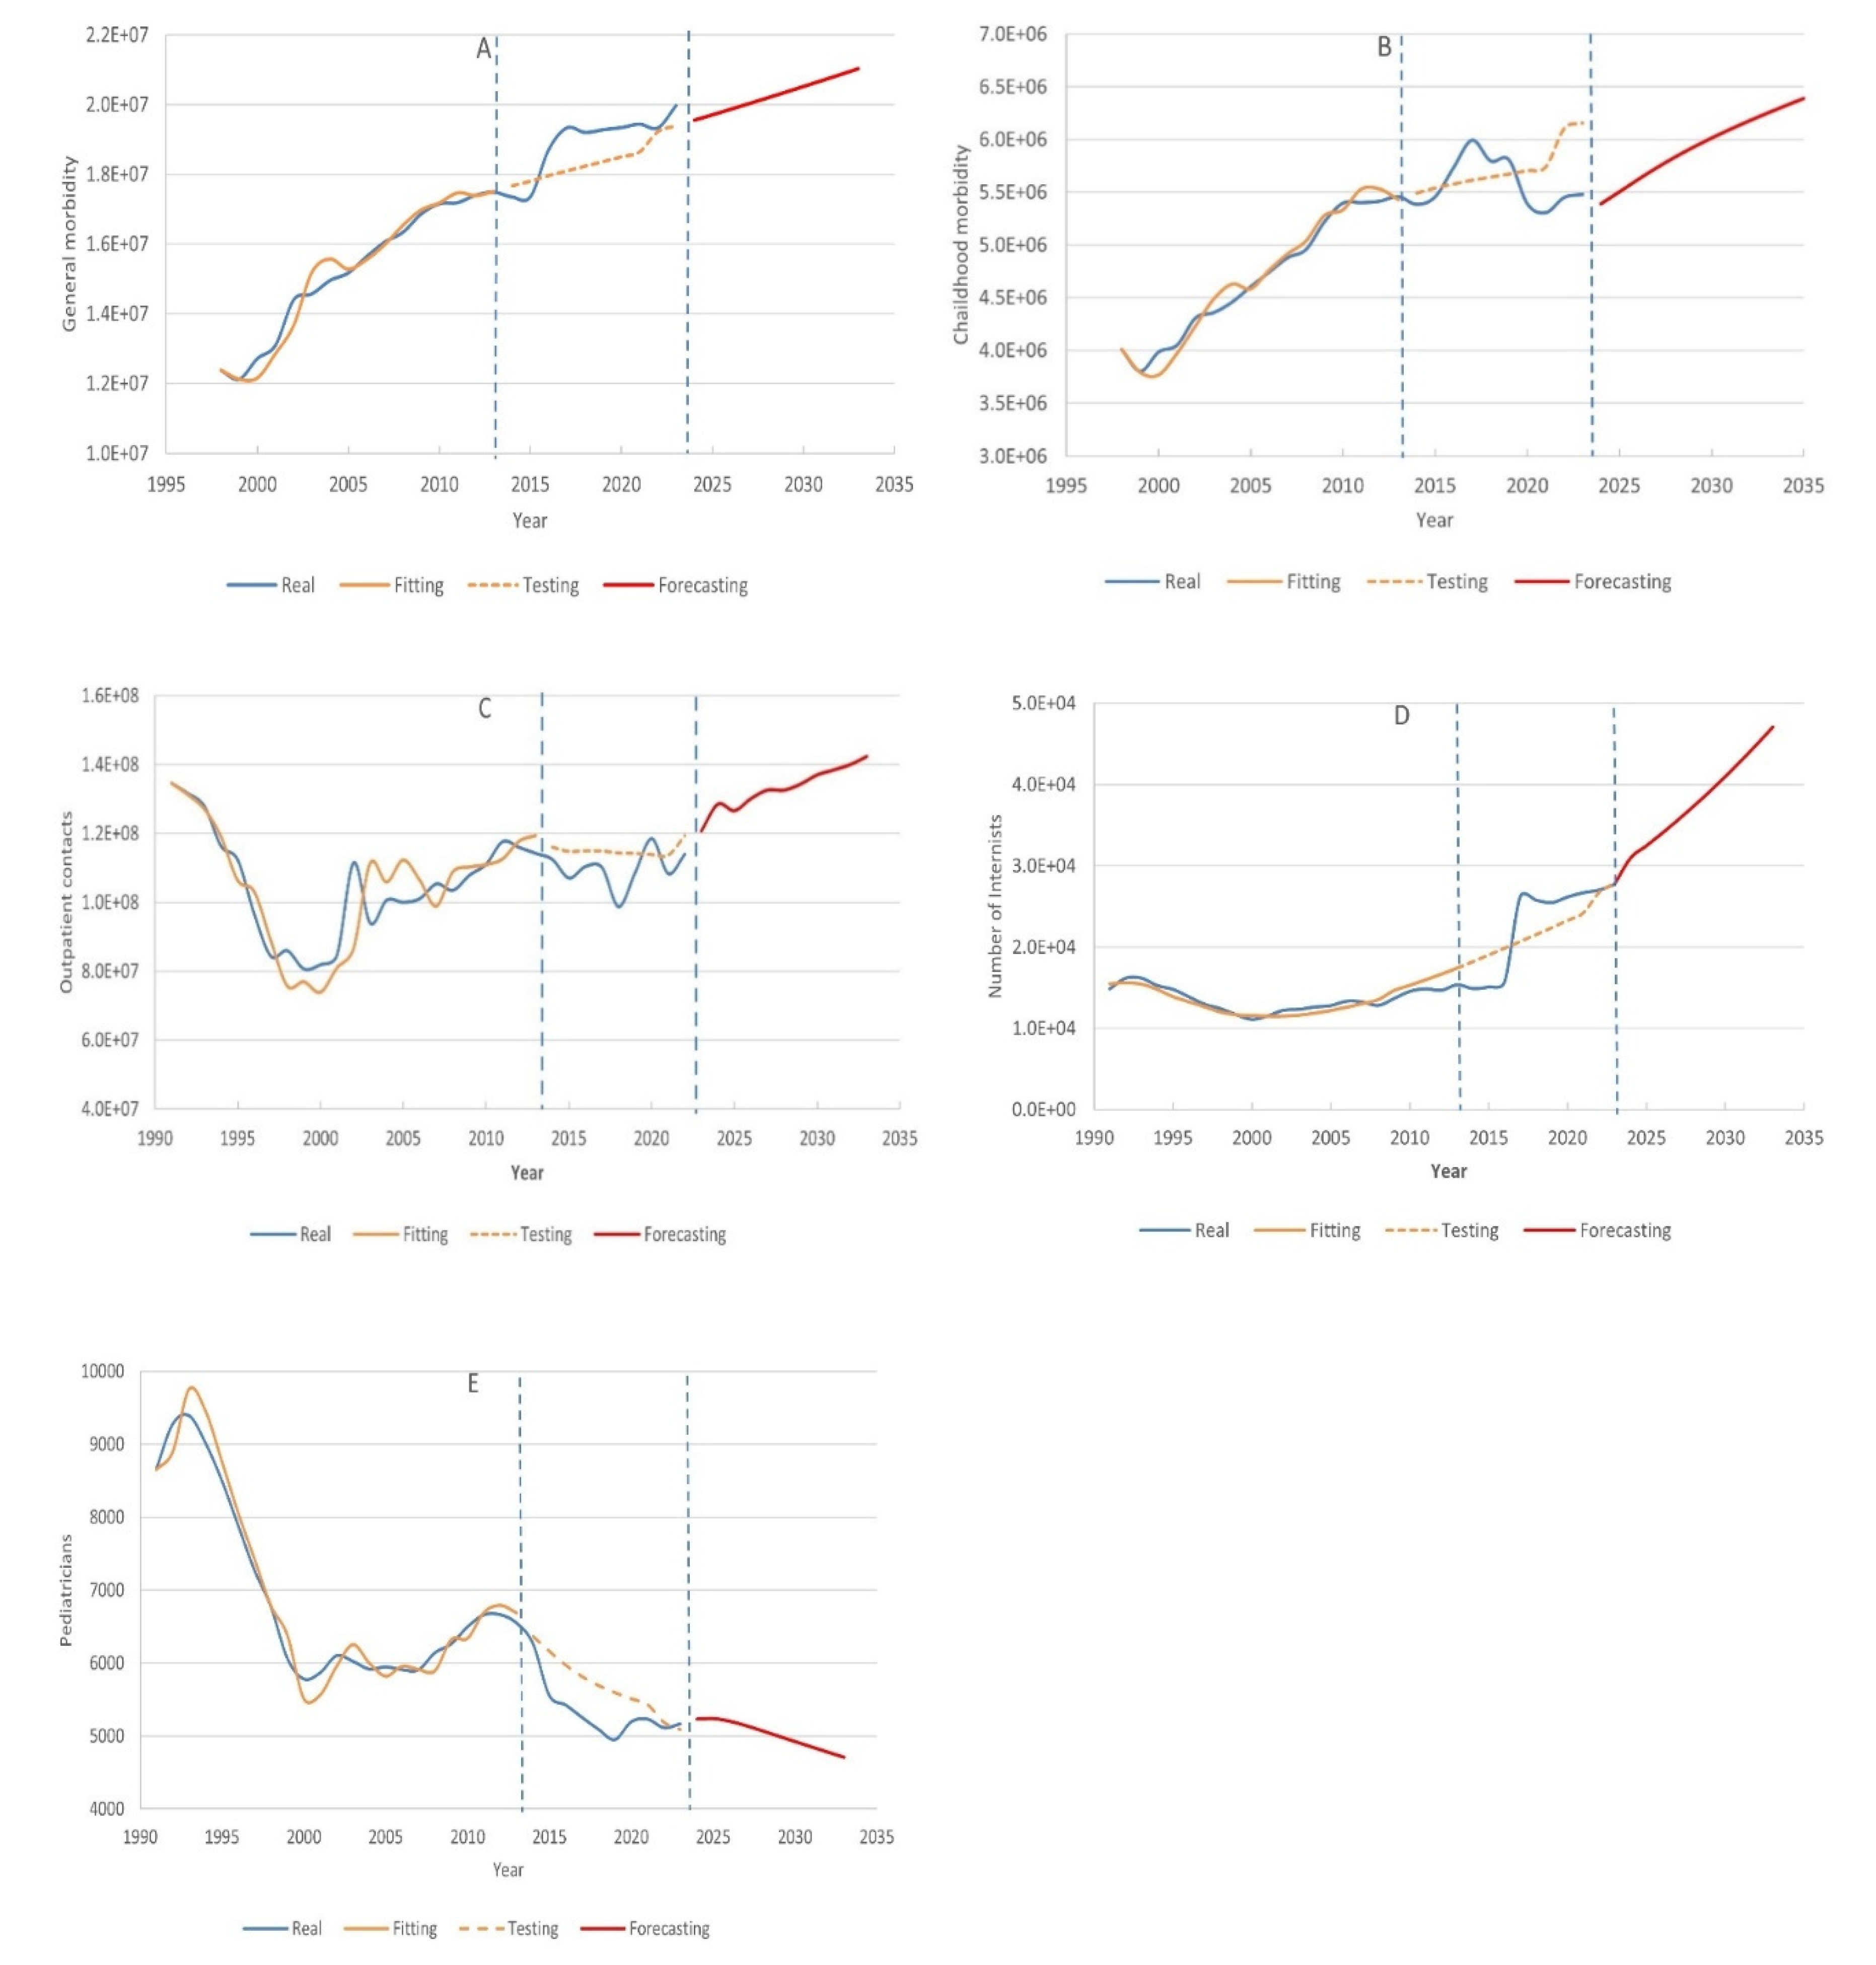
Table 1.
Accuracy of Markov chain population model.
| Year | Population | Predicted_Population | Absolute_Error | APE (%) |
| 2014 | 17816285 | 17919559.35 | 103274.3519 | 0.58 |
| 2015 | 18084169 | 18283637.78 | 199468.7808 | 1.10 |
| 2016 | 18363599.5 | 18652202.51 | 288603.0074 | 1.57 |
| 2017 | 18651931 | 19012257.6 | 360326.597 | 1.93 |
| 2018 | 18932726.5 | 19382085.49 | 449358.9948 | 2.37 |
| 2019 | 19209555 | 19758244.43 | 548689.4309 | 2.86 |
| 2020 | 19482117 | 20161328.53 | 679211.5306 | 3.49 |
| 2021 | 19743603 | 20585776.19 | 842173.1883 | 4.27 |
| 2022 | 20034609 | 20959048.86 | 924439.8649 | 4.61 |
| 2023 | 20330104 | 21317695.14 | 987591.1431 | 4.86 |
Table 3.
Models validity results.
| Model | Fitting MAPE | Testing MAPE |
| General morbidity model | 1.6 | 3.7 |
| Child morbidity model | 1.7 | 5.6 |
| Outpatient contacts model | 5.9 | 5.9 |
| Internists number model | 2.9 | 2.8 |
| Pediatricians number model | 2.2 | 7.0 |
Table 4.
Assessment of some indicators of medical services in Kazakhstan up to 2033.
| Year | Total Population | General morbidity (absolute value) | General childhood morbidity (absolute value) | Outpatient contacts | Internists number | Pediatricians | Total health care costs, US$ |
| 2024 | 20,599,934 | 13,258,205 | 16050229 | 128,445,597 | 28,744 | 5,232 | 9,166,970,630 |
| 2025 | 20,878,139 | 13,512,632 | 16275963 | 126,578,353 | 29,195 | 5,240 | 9,290,771,855 |
| 2026 | 21,163,924 | 13,773,990 | 16507847 | 130,087,539 | 29,655 | 5,204 | 9,417,946,180 |
| 2027 | 21,456,581 | 14,041,634 | 16745307 | 132,588,596 | 30,121 | 5,143 | 9,548,178,545 |
| 2028 | 21,755,514 | 14,315,017 | 16987860 | 132,562,648 | 30,594 | 5,071 | 9,681,203,730 |
| 2029 | 22,060,460 | 14,593,900 | 17235291 | 134,337,063 | 31,073 | 4,997 | 9,816,904,700 |
| 2030 | 22,370,980 | 14,877,879 | 17487245 | 137,009,352 | 31,558 | 4,923 | 9,955,086,100 |
| 2031 | 22,686,915 | 15,166,811 | 17743593 | 138,454,550 | 32,048 | 4,850 | 10,095,677,175 |
| 2032 | 23,008,129 | 15,460,571 | 18004224 | 140,018,868 | 32,543 | 4,778 | 10,238,617,405 |
| 2033 | 23,334,397 | 15,758,953 | 18268956 | 142,389,116 | 33,043 | 4,706 | 10,383,806,665 |
Disclaimer/Publisher’s Note: The statements, opinions and data contained in all publications are solely those of the individual author(s) and contributor(s) and not of MDPI and/or the editor(s). MDPI and/or the editor(s) disclaim responsibility for any injury to people or property resulting from any ideas, methods, instructions or products referred to in the content. |
© 2025 by the authors. Licensee MDPI, Basel, Switzerland. This article is an open access article distributed under the terms and conditions of the Creative Commons Attribution (CC BY) license (http://creativecommons.org/licenses/by/4.0/).
Copyright: This open access article is published under a Creative Commons CC BY 4.0 license, which permit the free download, distribution, and reuse, provided that the author and preprint are cited in any reuse.


