
Submitted:
15 April 2025
Posted:
16 April 2025
You are already at the latest version
Abstract
Oxide dispersion strengthened (ODS) steels are among the most promising candidate structural materials for fusion and Generation-IV (Gen-IV) fission reactors, but the ductility of ODS steels is inferior to its strength properties. Therefore, we investigate void nucleation, considered as the first step of ductile damage in metal, using molecular dynamics simulations. Given that the materials are subjected to extremely complex stress states within the reactor, we present the void nucleation process of 1-4 nm Y2O3 nanoclusters in bcc iron during uniaxial, biaxial, and triaxial tensile deformation. We find that the void nucleation process is divided into two stages depending on whether the dislocations are emitted. Void nucleation occurs at smaller strain in biaxial and triaxial tensile deformation in comparation to uniaxial tensile deformation. Increasing the size of clusters results in a smaller strain for void nucleation. The influence of 1nm clusters on the process of void nucleation is slight, and the void nucleation process of 1nm cluster cases is similar to that of pure iron. In addition, void nucleation is affected by both stress and strain concentration around the clusters, and the voids grow firstly in the areas of high stress triaxiality.
Keywords:
ODS steels
; void nucleation
; multi-axial tension
; molecular dynamics
1. Introduction
Oxide dispersion strengthened (ODS) steels are considered as one of the promising candidate materials for the first wall structural materials in fusion reactors and cladding materials in Generation-IV (Gen-IV) reactors [1]. Numerous experiments have been conducted on the mechanical properties of ODS steels, revealing their enhanced high temperature strength, improved creep resistance, and excellent irradiation resistance [2]. However, ODS steels exhibit lower total elongations than the steels that have been manufactured using the same production parameters but without the Y2O3 addition during ball milling [3]. Therefore, it is important to investigate the mechanism for ductility improvement in ODS steels.
Void nucleation is the first step of ductile damage in metals during the deformation process. Second-phase particles and inclusions are the most commonly observed sites for void nucleation during ductile rupture [4]. Recently, Zhao et al. [5] have found that the oxide nanoclusters are inside the dimples from the fracture surface of ODS steels. A significant quantity of nanoclusters which are distributed homogeneously in ODS steels would provide numerous nucleation sites. Therefore, it is very important to study the process of void nucleation induced by oxide nanoclusters in ODS steels, as the results are key to understanding the ductility degradation of ODS steels.
Localized plastic deformation at the interface between the particle and matrix has long been recognized as a key driver of void nucleation [4]. Thus, it is crucial to study the variations of localized plastic deformation at the interface during the process of void nucleation. Because of the experimental limitations for observing void nucleation process from atomic scales, molecular dynamics (MD) simulation is normally used to study the issues of void nucleation. MD approach can simulate the void nucleation process at the atomic scale and analyze localized plastic deformation at the interface between particle and matrix in detail. Some studies have investigated the process of void nucleation by MD simulations for Si particles in a Cu matrix [6], Al2Cu particles in an Al matrix [7], Cu, Ti, Mg particles in an Al matrix, and Ni particles in an Fe matrix [8,9,10,11]. Their investigations have greatly contributed to the understanding of the effects of particle sizes, temperatures, and strain rates on the void nucleation. However, the void nucleation issues of the oxide clusters in ODS steels remains largely unexplored. Moreover, structural metals are generally subjected to complex stress states in engineering applications [12], especially for nuclear materials which are served inside the nuclear reactors, but few studies have investigated the effect of different stress states on the void nucleation process.
In this paper, MD simulation is employed to investigate the void nucleation process of Y2O3 nanoclusters in bcc iron. The simulation setup with the different size of nanoclusters during uniaxial, biaxial, and triaxial tensile deformation. Since the size of oxide nanoclusters in current advanced ODS steel is less than 5 nm [13,14,15], so we focused on the void nucleation process of 1-4 nm nanoclusters. This paper provides significant insights into the effect of size and void nucleation process under complex stress states, which would help us to qualitatively explain the ductility degradation in ODS steels.
2. Computational Method
The MD simulations are performed using the parallel MD code large-scale atomic/molecular massively parallel simulator (LAMMPS) [16]. The pairwise potentials developed by Hammond et al. [17] are employed to describe the interaction of Y-Y, Y-O, Y-Fe, O-O and O-Fe. The Fe-Fe interaction is described by an EAM potential developed by Malerba et al. [18]. This potential set effectively describes the properties of yttria nanoclusters in bcc iron and has been validated by numerous published studies [15,19,20,21].
Figure 1 shows the snapshots of MD simulation system and the schematic of multi-axial tensile deformation. As shown in Figure 1(a), the simulation box is built with bcc iron, with the center replaced by a spherical Y2O3 cluster, which is constructed by a custom lattice based on the structure of Y2O3 [15]. The coordinate axes of the simulation box (x, y, z) and the lattice directions of Y2O3 are oriented along [100], [010], [001] direction, respectively. Multi-axial tensile deformation is applied after the model relaxation and the schematic of multi-axial tensile deformation is shown in Figure 1(b). The deformation is applied in the x-direction for uniaxial deformation, in the x-direction and y-direction for biaxial deformation, in all three directions for triaxial deformation, so we use stress-strain relationships in the x-direction for analysis.
As the number density of Y2O3 clusters is in the range of 1×10²² m-3 ~1×1024 m-3 for the sizes less than 5 nm [22,23,24,25,26,27,28,29,30], we consider a number density about 3×10²³ m-3 for the 1-4 nm clusters when building the model. The configurations of 1-4 nm spherical oxide clusters are shown in Figure 1(c). Thus, the MD block consists with 56×56×56 unit cells of iron, containing 350 000 atoms. The lattice parameter of iron is a=2.85528 Å. Periodic boundary conditions are imposed in all Cartesian directions. The whole system is relaxed using the conjugant gradient method for static relaxation to attain the minimum energy configuration. Then the temperature of system is raised to 300K and equilibrated for 30 ps with the NPT ensemble, using the time step with 0.001 ps. The structure of Y2O3 clusters after equilibration in 300K is consistent with the results of other authors [15,19]. The multi-axial tensile deformation is then applied on the relaxed configuration, and the NVT ensemble is kept for the system during tension. We have tested the different strain rates during tensile deformation and consider that a strain rates of 5×10⁸ s-1 is reasonable to investigate the void nucleation issues, and this strain rates is in the in the range of 1×10⁸ s-1 ~ 1×10¹⁰ s-1, which has been investigated by other authors for the effect of strain rates on void nucleation [6,8,9]. Analysis and visualization of the atomic configurations are performed using the dislocation extraction analysis (DXA), construct surface mesh, atomic strain and common neighbor analysis as implemented in OVITO [31].
3. Results
Figure 2 shows the stress-strain curves for bcc iron with or without 1-4 nm Y2O3 nanoclusters during tensile deformation under three different stress states. Figure 2(a), (b), and (c) represent uniaxial, biaxial and triaxial tension respectively, along with the snapshots of phase transition configurations without atoms in bcc structures. The dashed lines denote the strain at void nucleation. There is a peak stress when voids penetrate simulation box, and the strain of peak stress is called the failure strain. It can be seen that the failure strains decrease as increasing cluster size. The failure strains are the smallest in triaxial tension among the three stress states in the cases of same cluster size. If the stress-strain curves have a distinct peak before the peak stress, the curves represent bimodal distribution, and the curves represent unimodal distribution if there is only one peak. Common neighbor analysis is thus carried out and we find that the first peak in stress-strain curves corresponds to the phase transition. The initial bcc structures transform into fcc structures and hcp structures. The bimodal pattern due to phase transition has also been observed in the tensile MD simulations of pure iron [32]. We present the diagrams of phase transition configurations at the first peak for stress-strain curves exhibiting a distinct bimodal pattern. It can be seen that sheet-like of phase transition regions have been generated at the first peak of the bimodal pattern during uniaxial and biaxial tension. The phase transition regions in pure iron are distributed all over the system, but the phase transition regions are concentrated around the clusters in the systems with oxide cluster. There is no bimodal pattern in triaxial tensile deformation, indicating that it is difficult to form a large number of phase transition regions before void nucleation under triaxial tensile stress state. Our results show that there are two ways of releasing stress at the same time, one is the phase transition, and the other is the void nucleation. With increasing clusters size, void nucleation becomes the dominant way to influence stress reduction, so the stress-strain curves do not show the bimodal pattern for the 4 nm cluster cases during uniaxial tension and for the 3 nm and 4 nm clusters cases during biaxial tension.
In order to gain deeper insight into the process of void nucleation under different stress states, the construct surface mesh method was used to analyze the variation of void volume fraction in the whole system with increaing strain. Figure 3 illustrates the variation of the void volume fraction with strain, along with snapshots of voids configurations for pure iron and the 1-4 nm oxide clusters cases. Void volume fraction curves after voids penetrating simulation box are not shown. It can be seen from the curves that the dislocation emission always occur after the appearance of voids and the void volume fraction increases rapidly once the dislocation is emitted. Thus, the process of void nucleation is divided into two stages depending on whether dislocations are emitted. In the first stage of void nucleation, the atoms debond at the interface between cluster and matrix. In the second stage of void nucleation, voids grow rapidly after dislocation emission. This result aligns with the findings of void nucleation processes in other materials [6,7]. The snapshots of voids configuration in the Figure 3 are labelled as (ⅰ), (ⅲ) and (ⅴ) for void nucleation and (ⅱ), (ⅳ) and (ⅵ) for dislocation emission during uniaxial, biaxial and triaxial tensile deformation, respectively. The void identification method from reference [7] is used to identify the voids in the system, where the red atoms, whose atom volume is greater than 30 Å3 according to Voronoi analysis, represent the voids. The volume of a bcc iron atom in perfect system is calculated by us to be 11.6 Å3 at 300K.
The snapshots of voids configration show that void nucleation does not occur at the same location in pure iron cases, but voids nucleate around the clusters in 1-4 nm cases. The location of the dislocation emission is consistently around the voids. In most cases, the voids around clusters grow with increasing strain. It is noteworthy that during uniaxial and biaxial tensile deformation of 1 nm oxide clusters, as shown in Figure 3(b), the voids which nucleate around the clusters do not grow. Instead, other new voids nucleate in the matrix, which continue to grow and the dislocations are emitted around the new voids. It shows that the results for 1 nm clusters are similar with the results for pure iron, indicating that the influence of clusters below than 1 nm on the process of void nucleation is slight. Comparing the differences in void nucleation of the same size of clusters under different stress states, it can be seen that void nucleation occurs at smallest strain during triaxial tension. The strain required for void nucleation during biaxial and triaxial tension is evidently smaller than that during uniaxial tension. These results suggest that the biaxial and triaxial tensile stress state is beneficial to the void nucleation, and the process of void nucleation is strongly influenced by the stress states.
There are two different outcomes for the shape of clusters during tensile deformation [9,10]: if the cluster is softer than matrix, it will gradually deform; otherwise, if the cluster is stiffer than matrix, it will retain its original shape. To explore this further, we investigate the modulus of Y2O3 nanoclusters and the iron matrix. The bulk modulus of Y2O3 is 148.9 GPa, as determined by ultrasonic measurements [33], while that of single crystal bcc Fe is 173 GPa [34]. It indicates that the Y2O3 nanoclusters are softer than the Fe matrix. Figure 4 shows the snapshots of voids and oxide clusters configuration in detail after the void nucleation for clusters of different size. It can be seen that the Y2O3 nanoclusters gradually deform as voids grow, rather than maintaining their original shape. The deformations of the clusters are similar across different sizes and stress states. Therefore, some representative cases are selected as examples in Figure 4. The deformation of the 1 nm clusters during uniaxial and biaxial tension cases is not very significant due to the voids around the clusters do not grow continuously, as shown in Figure 4(a) and (b).
4. Discussion
In order to further investigate the mechanism of the void nucleation, we analyze the stress and strain distribution of the system before nucleation. According to the GTN model, the rate of void nucleation is affected by both stress and strain [35]. Figure 5 shows the distribution of hydrostatic stress, von Mises stress, volumetric strain, and shear strain of the Fe atoms in the system before void nucleation using 2 nm during triaxial tension as an example. The stress and strain values for different types of atoms are too disparate for direct comparison, only the stress and strain distribution for Fe atoms is presented. The hydrostatic stress is calculated by three normal stresses:
where is the hydrostatic stress of each atom, V is the volume of each atom, , and refer to the normal stresses of each atom at x, y and z direction, respectively. The von Mises stress is calculated by the expression of six stress tensors:
where is the von Mises stress of each atom, , and refer to the shear components of the stress tensors of each atom. The volumetric strain is calculated by three normal strains:
where is the volumetric strain of each atom, , and refer to the normal strains of each atom at x, y and z direction, respectively. The shear strain is calculated by the expression of six strain tensors:
where is the shear strain of each atom, , and refer to the shear components of the strain tensors of each atom.
The distribution of hydrostatic stress and von Mises stress are illustrated in Figure 5(a) and (b). Positive hydrostatic stress represents atoms under tensile forces, while negative hydrostatic stress represents atoms under compressive forces. Iron atoms experiencing hydrostatic stress greater than 26 GPa and von Mises stress greater than 50 GPa are highlighted. The iron atoms with the largest hydrostatic stress and von Mises stress are located around the cluster, indicating there is a large stress concentration around the cluster before void nucleation. Stress concentration may be one of the primary reasons for the occurrence of void nucleation. The distribution of volumetric strain and shear strain are illustrated in Figure 5(c) and (d). Positive volumetric strain indicates that the atomic volume is increasing, and negative volumetric strain indicates that the atomic volume is decreasing. We highlight the iron atoms larger than 0.2 volumetric strain and larger than 0.3 shear strain. It can be seen that the iron atoms with the largest stress are uniformly distributed around the cluster, while the iron atoms with the largest strain are concentrated in one corner of the cluster, where the void nucleation ultimately occurs. This suggests that strain concentration also contributes to void nucleation, and it is more straightforward and accurate to use volumetric strain and shear strain to identify the location of void nucleation.
The variation of nucleation strain, nucleation strength, failure strain, failure strength and the void volume fraction at penetration with oxide cluster size during multi-axial tensile deformation are shown in Figure 6(a)-(e) respectively. The strain at which void nucleation occurs is called nucleation strain, and the strength at this point is called nucleation strength. The strength of peak stress is called failure strength. It can be seen that the nucleation strain and failure strain decrease with increasing cluster size, as shown in Figure 6(a) and (c), indicating that larger clusters nucleate and failure at smaller strain, which is in agreement with both experimental and theoretical studies about void nucleation in other materials [36,37]. In addition, it can be seen that the variation of the nucleation strain and failure strain with cluster size tends to flatten from uniaxial to biaxial and then to triaxial tension, indicating that the effect of cluster size on nucleation strain and failure strain is small during biaxial and triaxial tension. From Figure 6(b) and (d), we can see that the addition of the oxide clusters reduces the nucleation strength and failure strength, and the reduction in strength has also been observed in other type of clusters during the process of void nucleation [8,9]. The nucleation strength and failure strength decrease with increasing cluster size in most of the cases. The unusual increase in nucleation strength and failure strength in relatively large clusters during uniaxial and biaxial tension is due to the change in the stress-strain curve from bimodal pattern to unimodal pattern, with fewer phase transitions to release the stress, resulting in higher nucleation and failure strength. Figure 6(e) shows that the void volume fraction at penetration decreases with increasing cluster size, and the volume fractions for 1 nm cluster and pure iron cases are similar. The void volume fractions at penetration under different stress states for the same cluster size are almost the same.
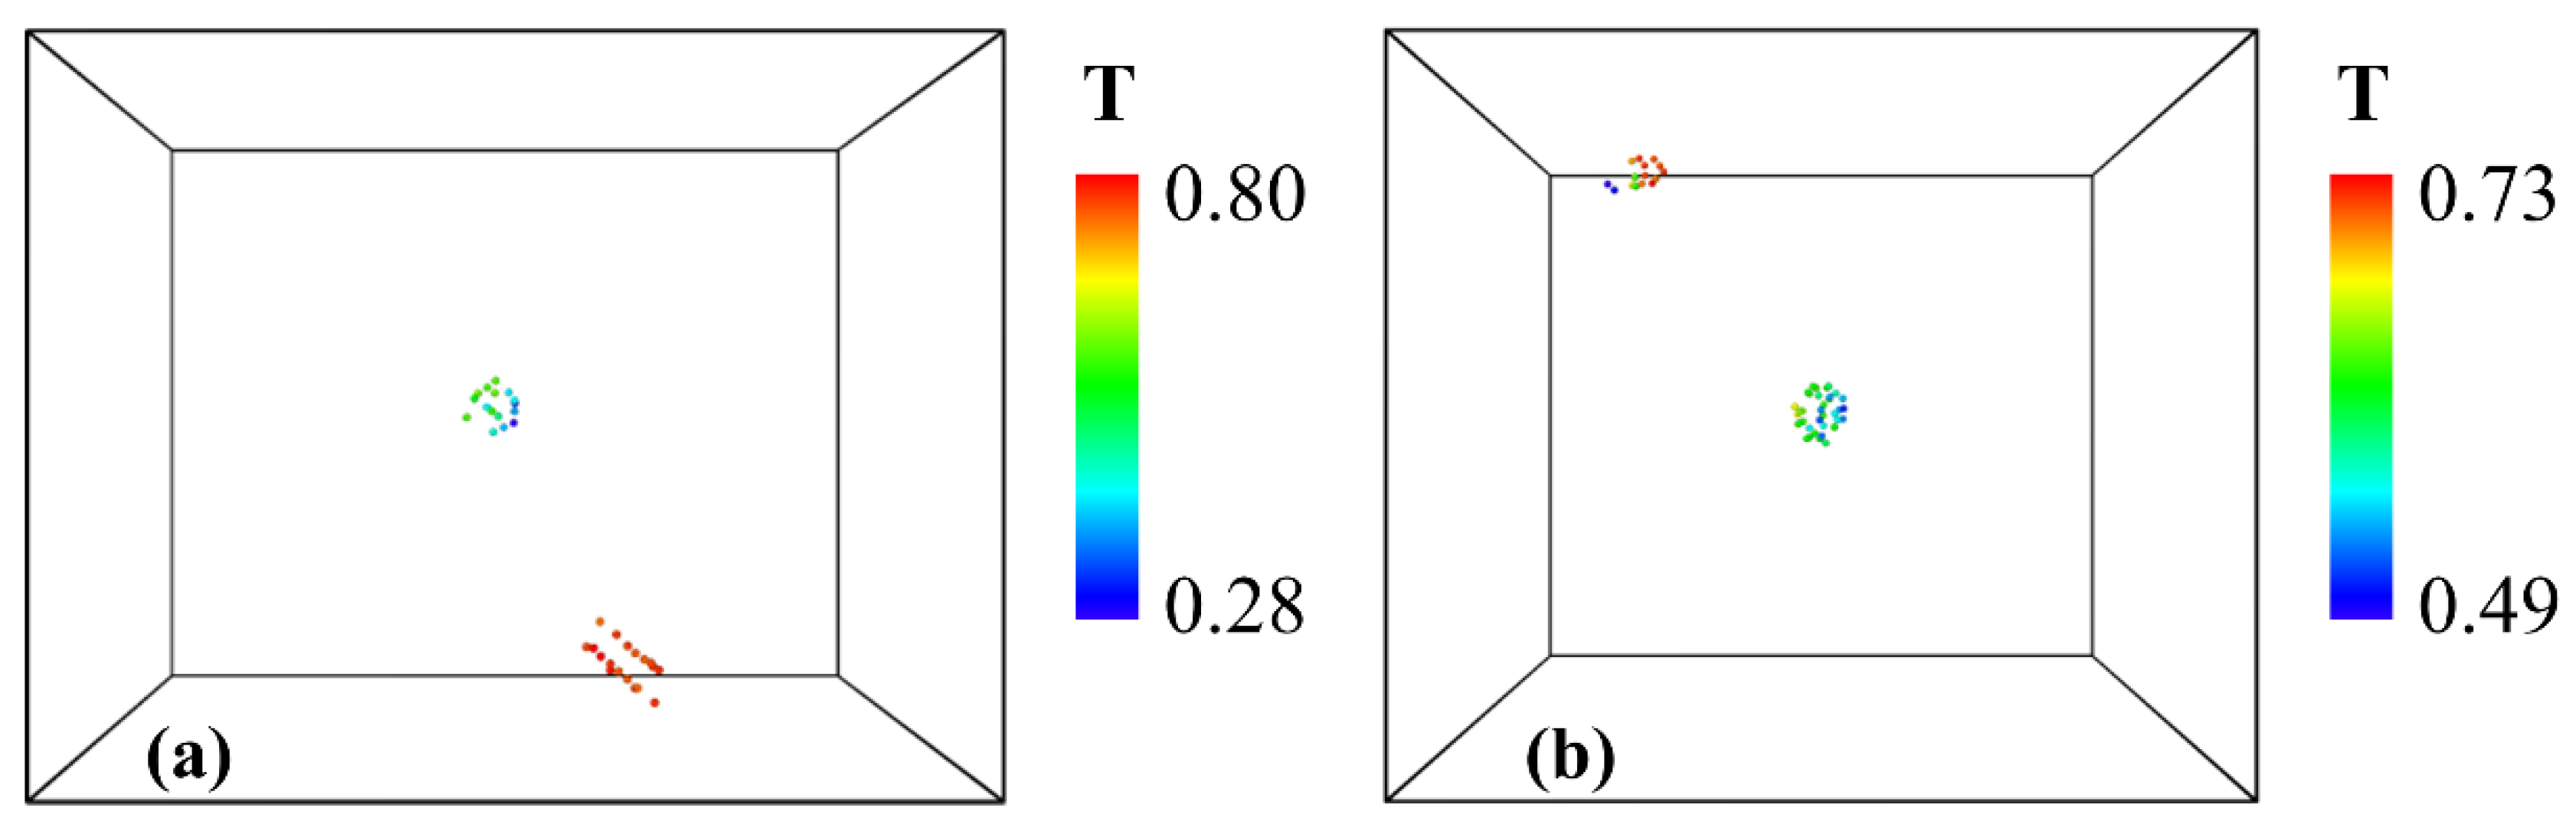
The investigation of the void nucleation process reveals that the voids initially nucleate within the iron matrix around the oxide clusters, followed by the debonding of clusters from the matrix, which aligns well with the theory of void nucleation [4]. However, in the case of 1 nm cluster during uniaxial and biaxial tensile deformation, the voids around the oxide clusters do not grow. Instead, new voids nucleate elsewhere, and these new voids are able to grow, as shown in Figure 3. Therefore, we analyze the stress triaxiality of the two voids in the system after the appearance of the second voids, as shown in Figure 7. The stress triaxiality is based on hydrostatic stress and von Mises stress:
where T is the stress triaxiality of each atom. The locations of the two voids are illustrated in Figure 7(a) and (b) for uniaxial and biaxial tension respectively, and the stress triaxiality of these atoms is calculated by averaging the stress triaxiality of each atom with its neighboring atoms. It can be seen that the stress triaxiality of the voids around the cluster is relatively low, whereas the stress triaxiality of the second void is much higher. These results are in agreement with the experimental results in other materials that the voids grow firstly at high stress triaxiality regions [38,39], and the low stress triaxiality around the first voids may be one of the reasons for its lack of grow.
With respect to the influence of the oxide clusters on the ductility degradation of ODS steels, the void nucleation is considered as the first step of ductile damage in metals during the deformation process and the second-phase particles promote void nucleation has already been used to account for the degradation of ductility [40]. According to our results, the addition of oxide clusters reduces the nucleation strain, nucleation strength, failure strain and failure strength in comparison to pure iron. The influence of 1 nm cluster on void nucleation is slight, and this influence of clusters increase with increasing cluster size, indicating that increasing cluster size would be more susceptible to ductile damage during tensile deformation. Therefore, increasing the size of oxide clusters will enhance the strength through obstacle dislocations slip [20,41,42], but it also increases the risk of void nucleation which lead ductile degradation, and the number density and size distribution of the oxide clusters in ODS steels should be chosen by considering both aspects.
5. Conclusion
The void nucleation process in a bcc iron matrix with 1-4 nm Y2O3 nanoclusters during multi-axial tensile deformation has been investigated using MD simulations. The effects of different stress states and cluster sizes on the void nucleation process have been analyzed in detail. The main outcomes of this study are as follows:
Similar to other clusters, the process of void nucleation for bcc iron matrix with Y2O3 nanoclusters is divided into two stages depending on whether the dislocations are emitted: (ⅰ) atoms debonding at the interface between the cluster and matrix, (ⅱ) rapid void growth after dislocation emission. The Y2O3 nanoclusters gradually deform during tension due to the fact that Y2O3 nanoclusters are softer than the bcc iron matrix. The void nucleation is affected by both stress and strain concentration around the clusters.
Void nucleation occurs at smaller strain in biaxial and triaxial tensile deformation compared to uniaxial tensile deformation for Y2O3 nanoclusters system. Increasing cluster size leads to a smaller strain for void nucleation, indicating that larger clusters make the material more susceptible to ductile damage during tensile deformation.
The influence of 1 nm clusters on void nucleation is slight and the void nucleation process for a bcc iron matrix with 1 nm cluster is similar to that of pure iron. In addition, voids grow firstly in the areas of high stress triaxiality instead of growing around the clusters in uniaxial and biaxial tensile deformation for 1 nm cluster cases.
Author Contributions
Conceptualization, methodology, investigation, data curation, writing—original draft, Z.W.; conceptualization, investigation, Y.S.; methodology, software, Y.H.; project administration, supervision, writing—review and editing, L.P.; resources, writing—review and editing, J.S.; writing—review and editing, Y.S., S.C. and Y.M. All authors have read and agreed to the published version of the manuscript.
Funding
This research is funded by the National Natural Science Foundation of China with Grant No. 12175231 and 11805131, and Anhui Natural Science Foundation of China with Grant No. 2108085J05.
Data Availability Statement
The datasets that support the results of this study are available from the corresponding author upon reasonable request.
Acknowledgments
The numerical calculation in this paper is supported by the supercomputing system in the Supercomputing Center of University of Science and Technology of China.
Conflicts of Interest
The authors declare no conflicts of interest.
References
- He, P.; Yao, W.; Lyu, J.; Gao, B.; Li, X. Radiation Resistance Design and Nanoscale Second-phase Particles Characterization for ODS Steels: A Review. Cailiao Daobao/Materials Review 2018, 32, 34–40. [Google Scholar] [CrossRef]
- Wharry, J.P.; Swenson, M.J.; Yano, K.H. A review of the irradiation evolution of dispersed oxide nanoparticles in the b.c.c. Fe-Cr system: Current understanding and future directions. Journal of Nuclear Materials 2017, 486, 11–20. [Google Scholar] [CrossRef]
- McClintock, D.A.; Hoelzer, D.T.; Sokolov, M.A.; Nanstad, R.K. Mechanical properties of neutron irradiated nanostructured ferritic alloy 14YWT. Journal of Nuclear Materials 2009, 386–388, 307–311. [Google Scholar] [CrossRef]
- Noell, P.J.; Sills, R.B.; Benzerga, A.A.; Boyce, B.L. Void nucleation during ductile rupture of metals: A review. PROGRESS IN MATERIALS SCIENCE 2023, 135, 101085. [Google Scholar] [CrossRef]
- Zhao, M.; Zhang, P.; Xu, J.; Ye, W.; Yin, S.; Zhao, J.; Qiao, Y.; Yan, Y. Optimization of microstructure and tensile properties for a 13Cr-1W ODS steel prepared by mechanical alloying and spark plasma sintering using pre-alloyed powder. Materials Characterization 2024, 207, 113581. [Google Scholar] [CrossRef]
- Cui, Y.; Chen, Z. Void initiation from interfacial debonding of spherical silicon particles inside a silicon-copper nanocomposite: A molecular dynamics study. Modelling and Simulation in Materials Science and Engineering 2017, 25, 025007. [Google Scholar] [CrossRef]
- Zhao, Q.Q.; Boyce, B.L.; Sills, R.B. Micromechanics of Void Nucleation and Early Growth at Incoherent Precipitates: Lattice-Trapped and Dislocation-Mediated Delamination Modes. Crystals 2021, 11, 45–65. [Google Scholar] [CrossRef]
- Pogorelko, V.V.; Mayer, A.E. Influence of copper inclusions on the strength of aluminum matrix at high-rate tension. Materials Science and Engineering: A 2015, 642, 351–359. [Google Scholar] [CrossRef]
- Pogorelko, V.V.; Mayer, A.E. Influence of titanium and magnesium nanoinclusions on the strength of aluminum at high-rate tension: Molecular dynamics simulations. Materials Science and Engineering: A 2016, 662, 227–240. [Google Scholar] [CrossRef]
- Pogorelko, V.V.; Mayer, A.E. Tensile strength of Al matrix with nanoscale Cu, Ti and Mg inclusions. Journal of Physics: Conference Series 2016, 774, 012034. [Google Scholar] [CrossRef]
- Pogorelko, V.V.; Mayer, A.E. Tensile strength of Fe–Ni and Mg–Al nanocomposites: Molecular dynamic simulations. Journal of Physics: Conference Series 2018, 946, 012043. [Google Scholar] [CrossRef]
- Qin, C.; Xu, Z.; Dou, W.; Du, Y.; Huang, F. Plastic flow properties and constitutive model of metallic materials under complex stress states. Explosion And Shock Waves 2022, 42, 091404. [Google Scholar] [CrossRef]
- Wu, Y.; Ciston, J.; Kräemer, S.; Bailey, N.; Odette, G.R.; Hosemann, P. The crystal structure, orientation relationships and interfaces of the nanoscale oxides in nanostructured ferritic alloys. Acta Materialia 2016, 111, 108–115. [Google Scholar] [CrossRef]
- Aydogan, E.; Weaver, J.S.; Carvajal-Nunez, U.; Schneider, M.M.; Gigax, J.G.; Krumwiede, D.L.; Hosemann, P.; Saleh, T.A.; Mara, N.A.; Hoelzer, D.T.; et al. Response of 14YWT alloys under neutron irradiation: A complementary study on microstructure and mechanical properties. Acta Materialia 2019, 167, 181–196. [Google Scholar] [CrossRef]
- Higgins, M.P.; Lu, C.Y.; Lu, Z.; Shao, L.; Wang, L.M.; Gao, F. Crossover from disordered to core-shell structures of nano-oxide Y2O3 dispersed particles in Fe. Applied Physics Letters 2016, 109, 031911. [Google Scholar] [CrossRef]
- Plimpton, S. Fast Parallel Algorithms for Short-Range Molecular Dynamics. Journal of Computational Physics 1995, 117, 1–19. [Google Scholar] [CrossRef]
- Hammond, K.D.; Voigt, H.-J.L.; Marus, L.A.; Juslin, N.; Wirth, B.D. Simple pair-wise interactions for hybrid Monte Carlo–molecular dynamics simulations of titania/yttria-doped iron. Journal of Physics: Condensed Matter 2013, 25, 055402. [Google Scholar] [CrossRef]
- Malerba, L.; Marinica, M.C.; Anento, N.; Björkas, C.; Nguyen, H.; Domain, C.; Djurabekova, F.; Olsson, P.; Nordlund, K.; Serra, A.; et al. Comparison of empirical interatomic potentials for iron applied to radiation damage studies. Journal of Nuclear Materials 2010, 406, 19–38. [Google Scholar] [CrossRef]
- Higgins, M.P.; Peng, Q.; Shao, L.; Gao, F. Reduction of defect generation and development of sinks at nanocluster boundary in oxide dispersion-strengthened steel. Journal of Applied Physics 2019, 126, 084302. [Google Scholar] [CrossRef]
- Azeem, M.M.; Wang, Q.; Li, Z.; Zhang, Y. Dislocation-oxide interaction in Y2O3 embedded Fe: A molecular dynamics simulation study. Nuclear Engineering and Technology 2020, 52, 337–343. [Google Scholar] [CrossRef]
- Sun, Y.Q.; Lai, W.S. Molecular dynamics simulations of cascade damage near the Y2Ti2O7 nanocluster/ferrite interface in nanostructured ferritic alloys. CHINESE PHYSICS B 2017, 26. [Google Scholar] [CrossRef]
- Emelyanova, O.V.; Gentils, A.; Borodin, V.A.; Dzhumaev, P.S.; Vladimirov, P.V.; Lindau, R.; Möslang, A. Microstructural evolution in ODS-EUROFER steel caused by high-dose He ion implantations with systematic variation of implantation parameters. Nuclear Materials and Energy 2023, 35, 101456. [Google Scholar] [CrossRef]
- Klimenkov, M.; Jäntsch, U.; Rieth, M.; Dürrschnabel, M.; Möslang, A.; Schneider, H.C. Post-irradiation microstructural examination of EUROFER-ODS steel irradiated at 300°C and 400°C. Journal of Nuclear Materials 2021, 557, 153259. [Google Scholar] [CrossRef]
- Fu, J.; Davis, T.P.; Kumar, A.; Richardson, I.M.; Hermans, M.J.M. Characterisation of the influence of vanadium and tantalum on yttrium-based nano-oxides in ODS Eurofer steel. Materials Characterization 2021, 175, 111072. [Google Scholar] [CrossRef]
- Bergner, F.; Hlawacek, G.; Heintze, C. Helium-ion microscopy, helium-ion irradiation and nanoindentation of Eurofer 97 and ODS Eurofer. Journal of Nuclear Materials 2018, 505, 267–275. [Google Scholar] [CrossRef]
- Zilnyk, K.D.; Pradeep, K.G.; Choi, P.; Sandim, H.R.Z.; Raabe, D. Long-term thermal stability of nanoclusters in ODS-Eurofer steel: An atom probe tomography study. Journal of Nuclear Materials 2017, 492, 142–147. [Google Scholar] [CrossRef]
- Klimenkov, M.; Lindau, R.; Jäntsch, U.; Möslang, A. Effect of irradiation temperature on microstructure of ferritic-martensitic ODS steel. Journal of Nuclear Materials 2017, 493, 426–435. [Google Scholar] [CrossRef]
- Rogozhkin, S.; Bogachev, A.; Korchuganova, O.; Nikitin, A.; Orlov, N.; Aleev, A.; Zaluzhnyi, A.; Kozodaev, M.; Kulevoy, T.; Chalykh, B.; et al. Nanostructure evolution in ODS steels under ion irradiation. Nuclear Materials and Energy 2016, 9, 66–74. [Google Scholar] [CrossRef]
- Rogozhkin, S.V.; Aleev, A.A.; Zaluzhnyi, A.G.; Nikitin, A.A.; Iskandarov, N.A.; Vladimirov, P.; Lindau, R.; Möslang, A. Atom probe characterization of nano-scaled features in irradiated ODS Eurofer steel. Journal of Nuclear Materials 2011, 409, 94–99. [Google Scholar] [CrossRef]
- Aleev, A.A.; Iskandarov, N.A.; Klimenkov, M.; Lindau, R.; Möslang, A.; Nikitin, A.A.; Rogozhkin, S.V.; Vladimirov, P.; Zaluzhnyi, A.G. Investigation of oxide particles in unirradiated ODS Eurofer by tomographic atom probe. Journal of Nuclear Materials 2011, 409, 65–71. [Google Scholar] [CrossRef]
- Stukowski, A. Visualization and Analysis of Atomistic Simulation Data with OVITO - the Open Visualization Tool. Modelling and Simulation in Materials Science and Engineering 2010, 18, 015012. [Google Scholar] [CrossRef]
- Wang, Y.-T.; Zeng, X.-G.; Yang, X. Molecular dynamics simulation of effect of temperature on void nucleation and growth of single crystal iron at a high strain rate. Acta Physica Sinica 2019, 68, 246102-246101–246102-246117. [Google Scholar] [CrossRef]
- Yeheskel, O.; Tevet, O. Elastic Moduli of Transparent Yttria. Journal of the American Ceramic Society 1999, 82, 136–144. [Google Scholar] [CrossRef]
- Simmons, G.; Wang, H.F. Single Crystal Elastic Constants and Calculated Aggregate Properties. A Handbook. 1971. [Google Scholar]
- Tvergaard, V.; Needleman, A. Analysis of the cup-cone fracture in a round tensile bar. Acta Metallurgica 1984, 32, 157–169. [Google Scholar] [CrossRef]
- Dighe, M.D.; Gokhale, A.M.; Horstemeyer, M.F. Effect of loading condition and stress state on damage evolution of silicon particles in an Al-Si-Mg-base cast alloy. METALLURGICAL AND MATERIALS TRANSACTIONS A-PHYSICAL METALLURGY AND MATERIALS SCIENCE 2002, 33, 555–565. [Google Scholar] [CrossRef]
- Shabrov, M.N.; Needleman, A. An analysis of inclusion morphology effects on void nucleation. MODELLING AND SIMULATION IN MATERIALS SCIENCE AND ENGINEERING 2002, 10, 163–183. [Google Scholar] [CrossRef]
- Marino, B.; Mudry, F.; Pineau, A. Experimental study of cavity growth in ductile rupture. Engineering Fracture Mechanics 1985, 22, 989–996. [Google Scholar] [CrossRef]
- Bourcier, R.J.; Koss, D.A.; Smelser, R.E.; Richmond, O. The influence of porosity on the deformation and fracture of alloys. Acta Metallurgica 1986, 34, 2443–2453. [Google Scholar] [CrossRef]
- Kumar, S.; Das, S.K. Characterization of mechanical properties and nano-porous structure of Aluminium-Magnesium alloy during multi-axial tensile deformation: An atomistic investigation. Journal of Alloys and Compounds 2018, 740, 626–638. [Google Scholar] [CrossRef]
- Mock, M.; Albe, K. Modelling of dislocation-solute interaction in ODS steels: Analytic bond-order potential for the iron-yttrium system. Journal of Nuclear Materials 2018, 509, 102–113. [Google Scholar] [CrossRef]
- Yashiro, K.; Yamaguchi, A.; Tanaka, M.; Okuda, T.; Koga, K.; Segi, T. Molecular Dynamics Simulation on Interaction between Screw Dislocation and Pseudo Yttrium Oxide in Bcc-Fe. Materials Transactions 2012, 53, 401–406. [Google Scholar] [CrossRef]
Figure 1.
The snapshots of MD simulation system. (a) The snapshot of simulation box with a 2 nm Y2O3 cluster. (b) The schematic of multi-axial tensile deformation. (c) The configurations of 1-4 nm spherical Y2O3 clusters.
Figure 1.
The snapshots of MD simulation system. (a) The snapshot of simulation box with a 2 nm Y2O3 cluster. (b) The schematic of multi-axial tensile deformation. (c) The configurations of 1-4 nm spherical Y2O3 clusters.
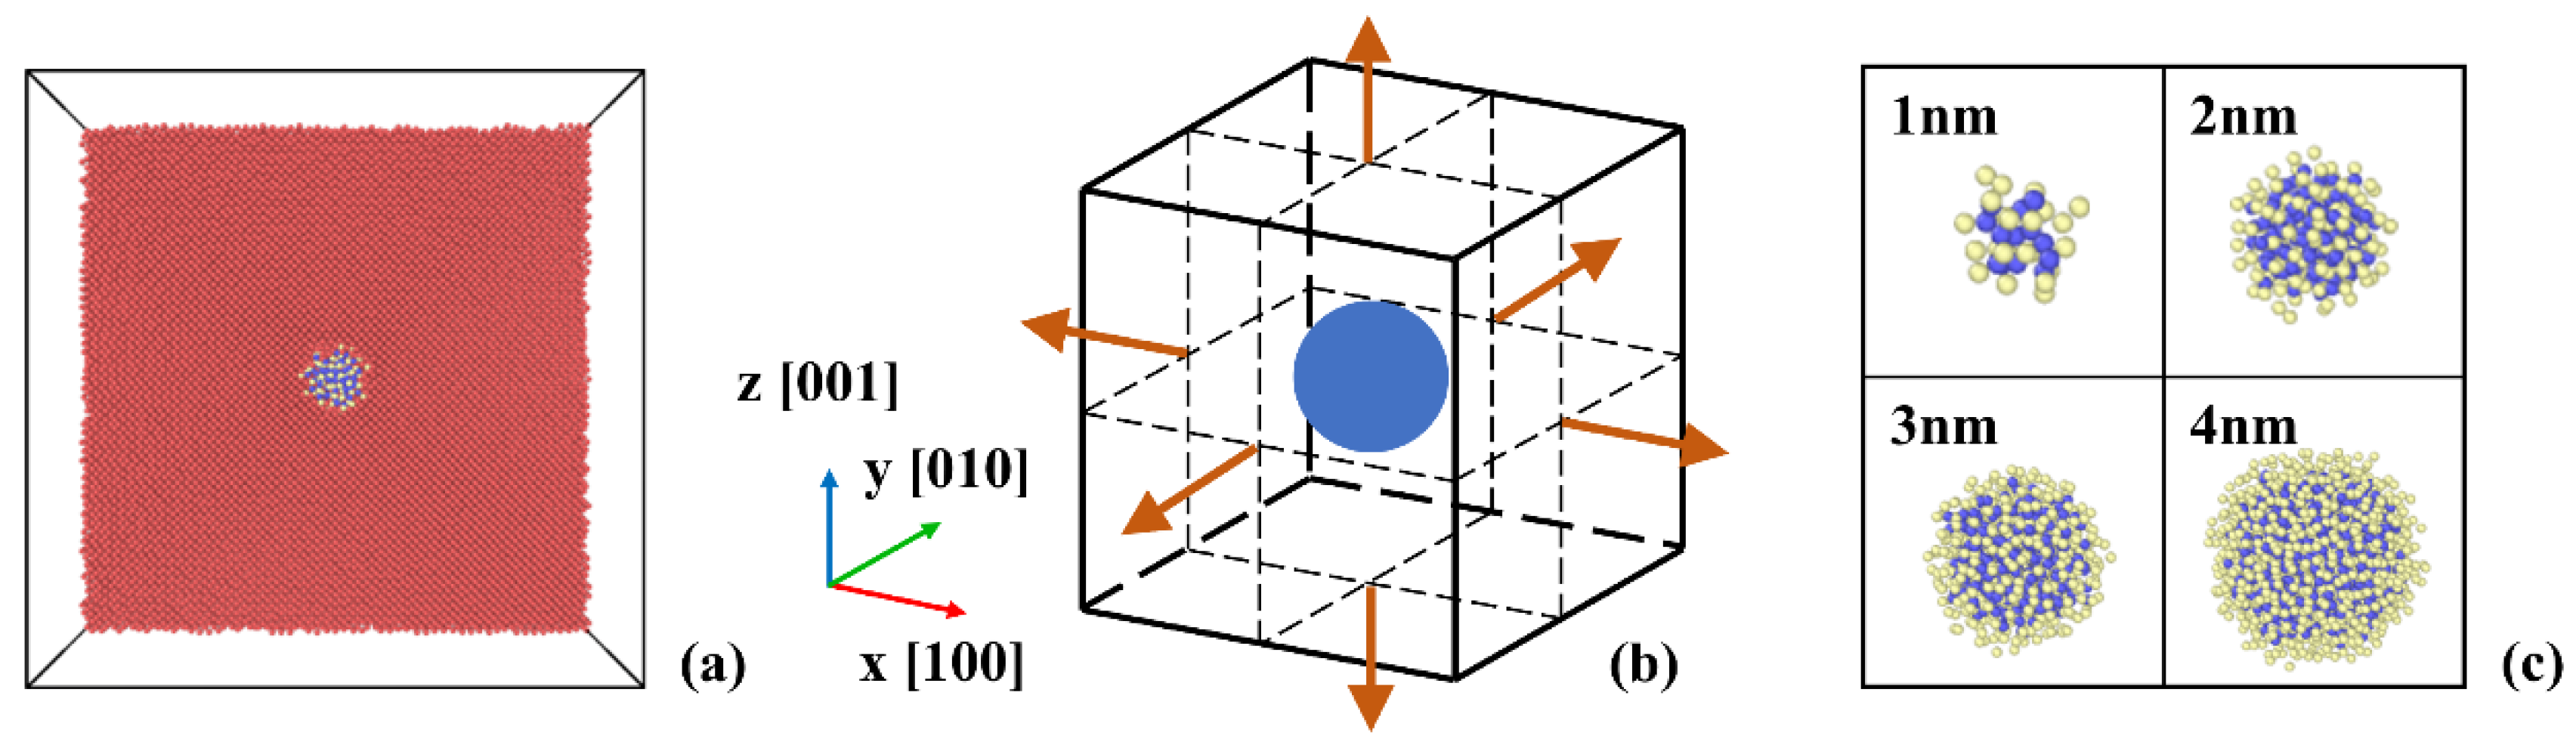
Figure 2.
The stress-strain curves for bcc iron and 1-4 nm oxide clusters during uniaxial, biaxial and triaxial tensile deformation. The snapshots of phase transition configurations are showed along with stress-strain curves. Green atoms represent fcc atoms, red atoms represent hcp atoms, white atoms represent other atoms which cannot be recognized by common neighbor analysis. The dashed lines mark the strain at void nucleation. (a) Uniaxial tensile deformation, (b) biaxial tensile deformation, and (c) triaxial tensile deformation.
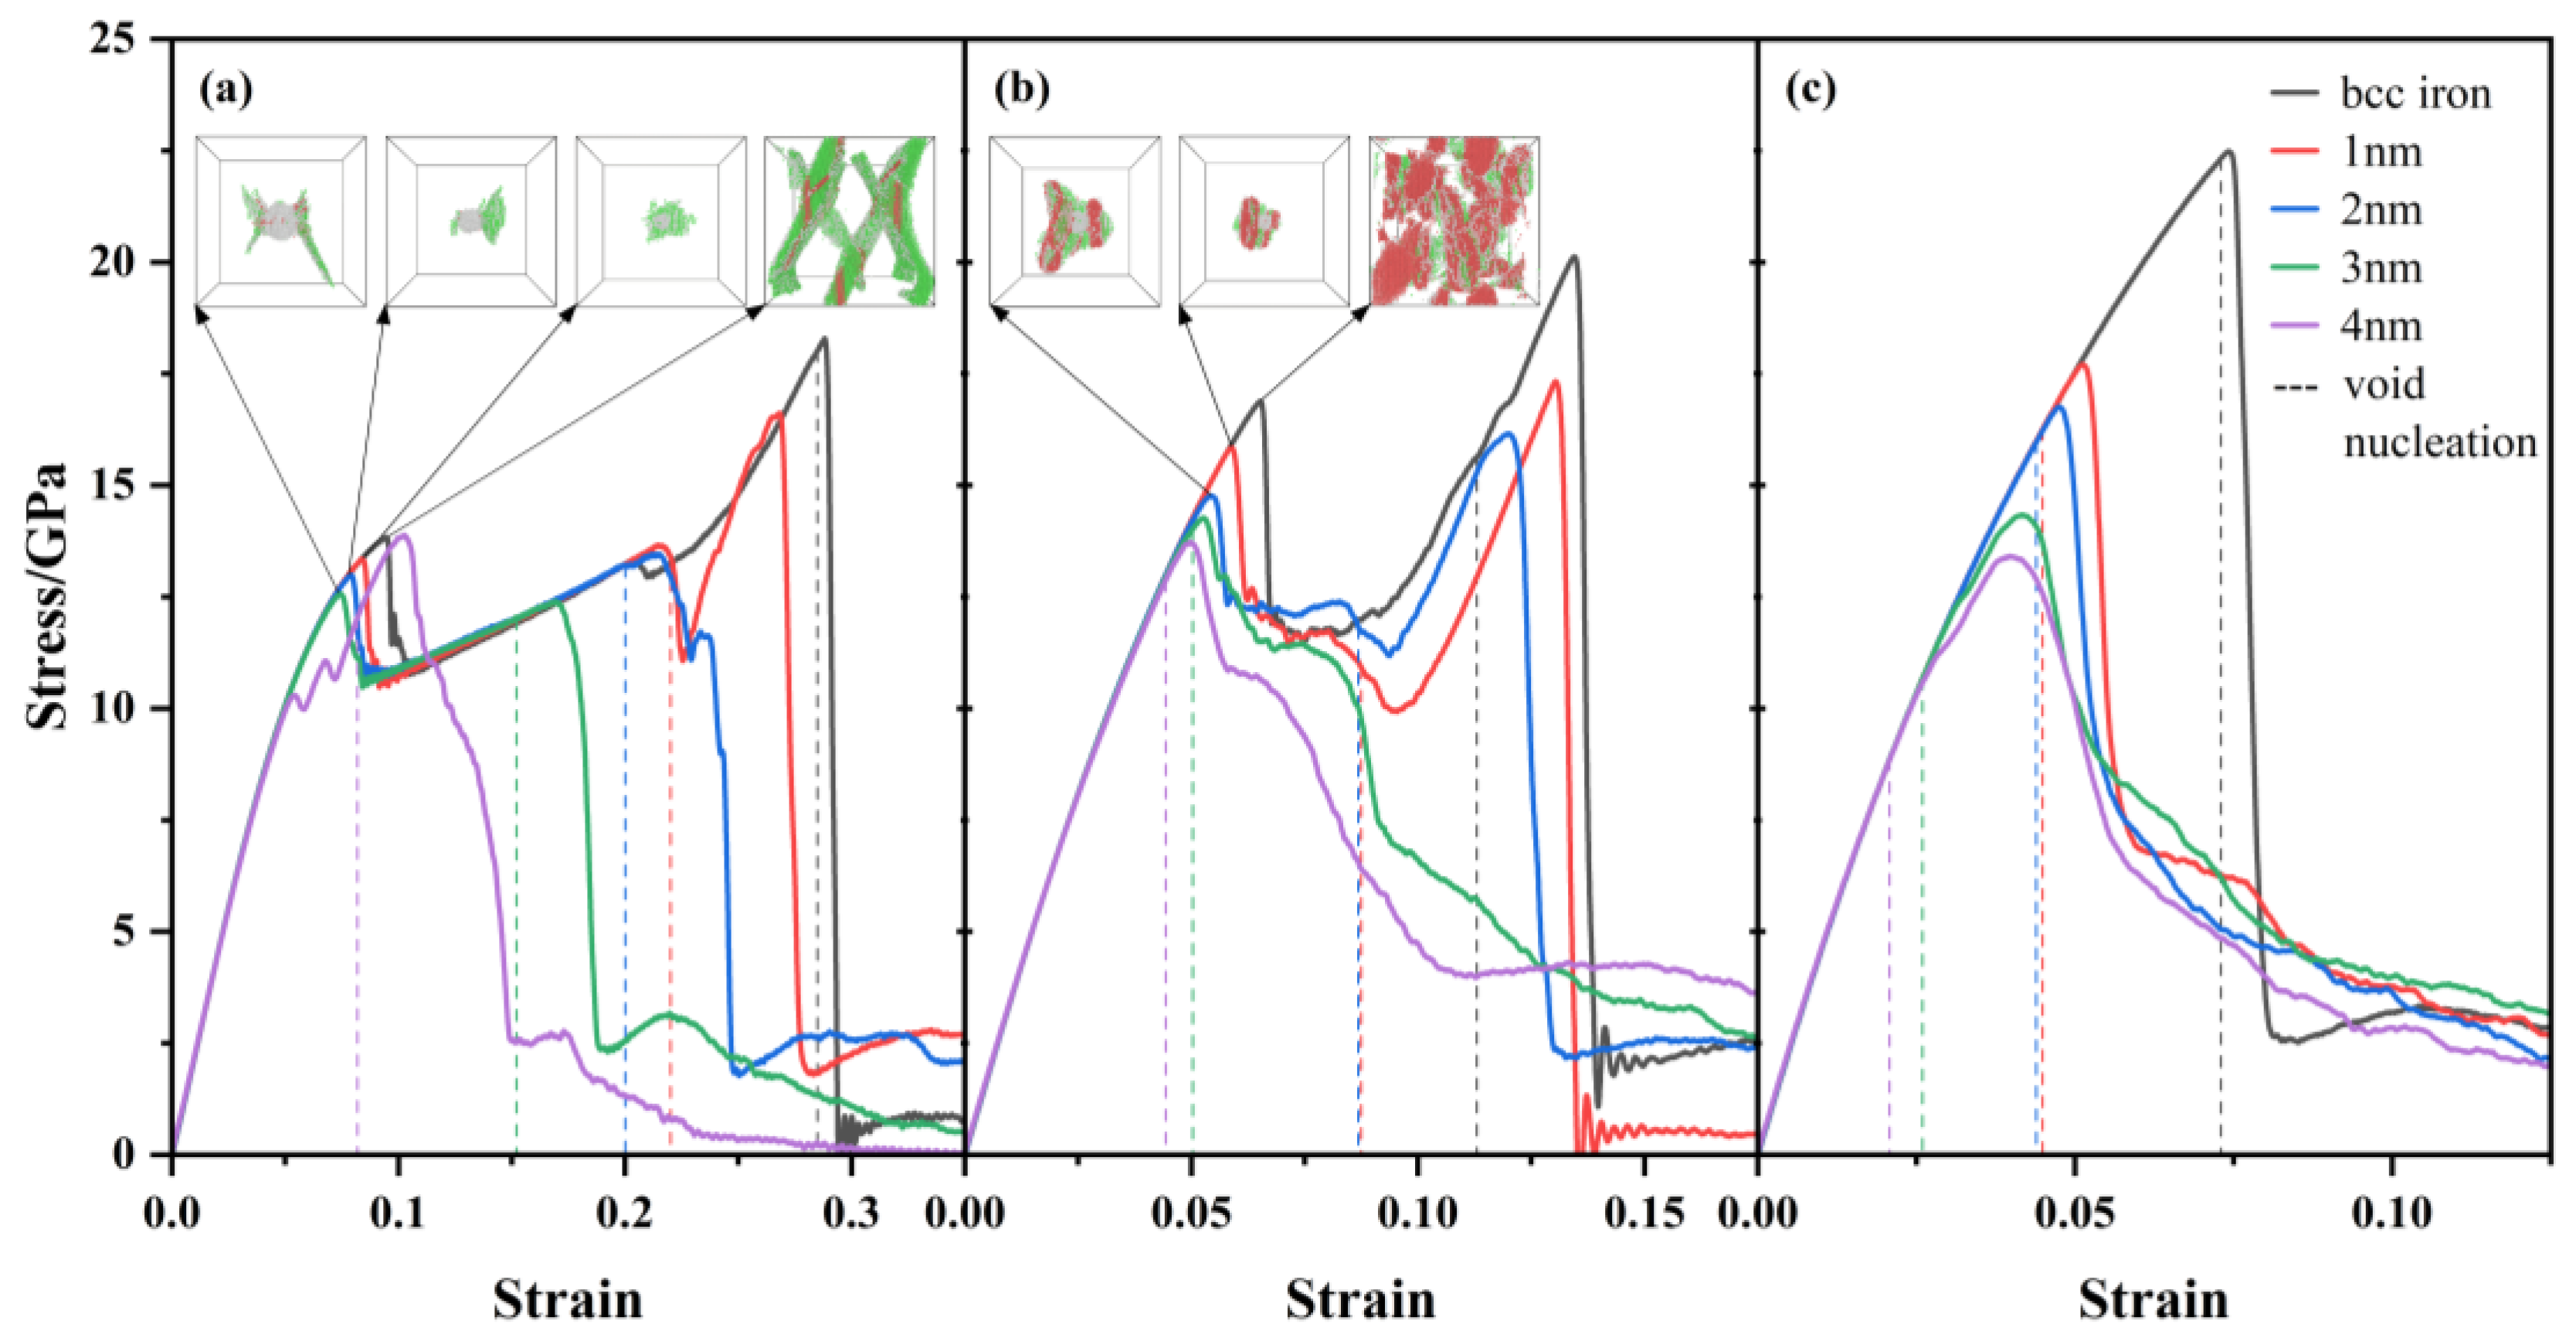
Figure 3.
Variation of the void volume fraction with strain, together with snapshots of voids configuration. Blue atoms represent Y atoms, yellow atoms represent O atoms, red atoms represent atoms of which atom volumes > 30 Å3, and green lines represent 1/2<111> dislocation lines. (a)-(e) represent pure iron and 1-4 nm oxide clusters cases, respectively.
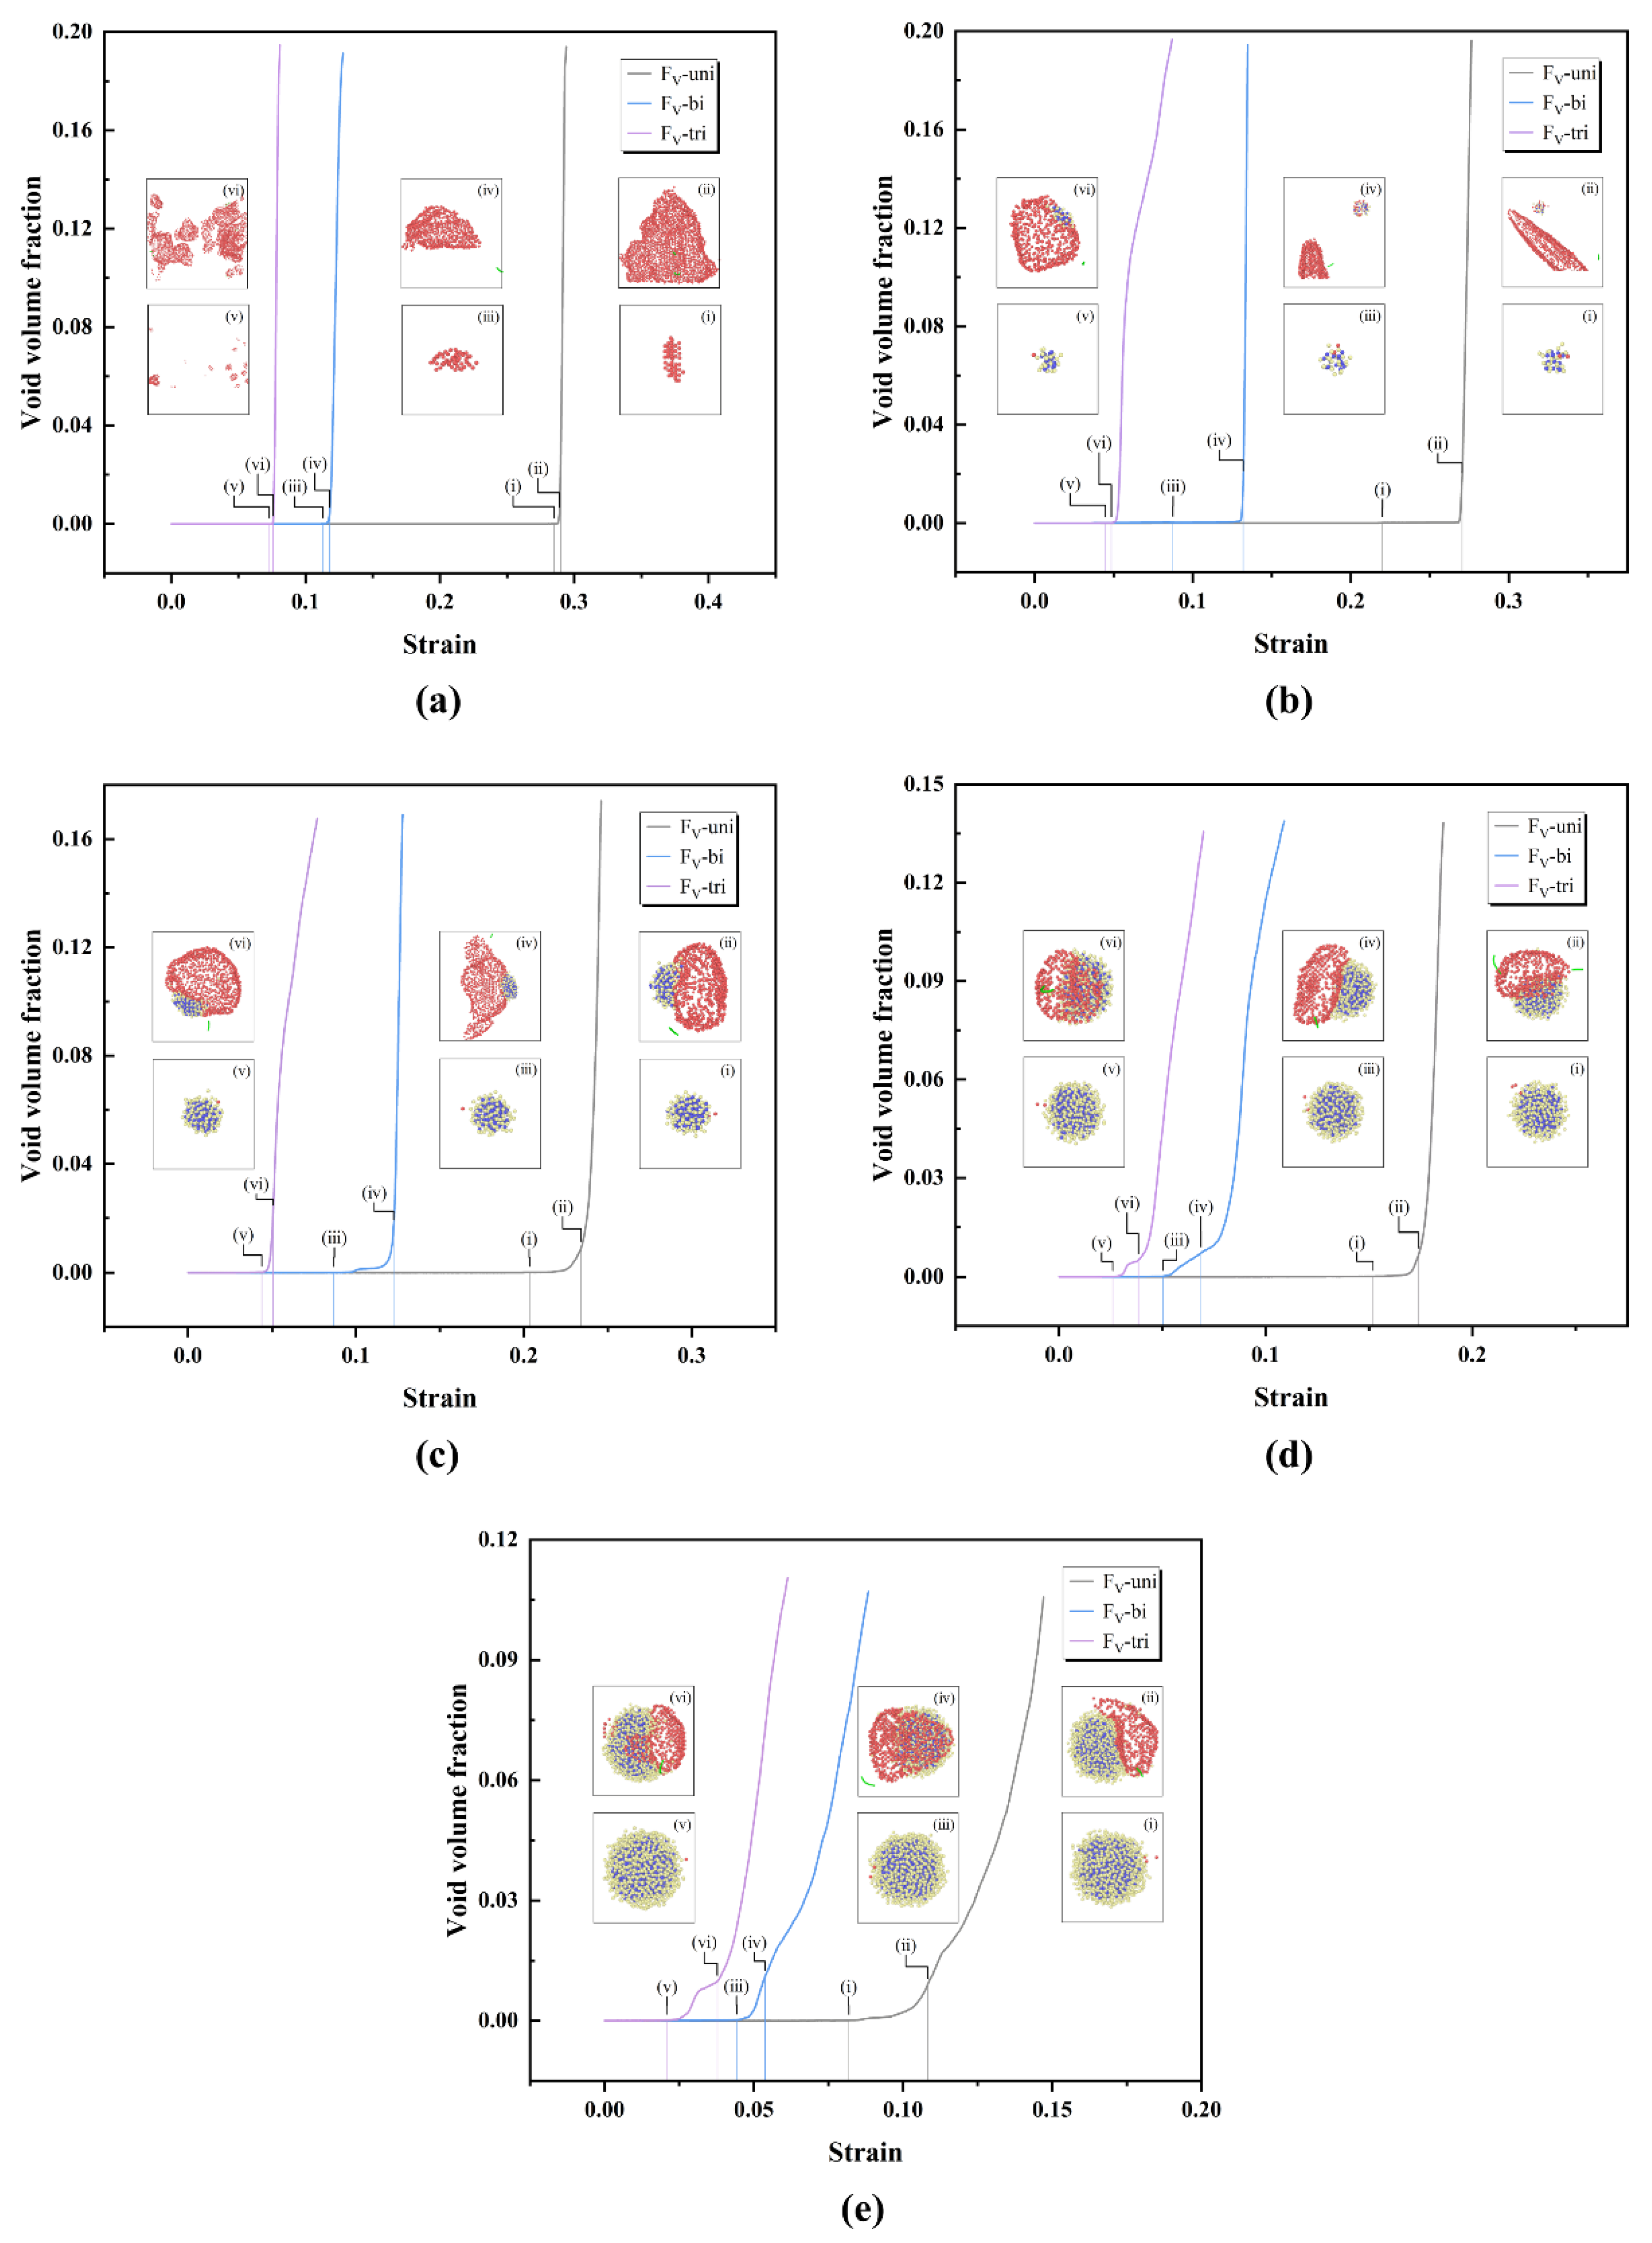
Figure 4.
The snapshots of voids and oxide clusters configuration after the void nucleation, along with the top and side views of the oxide clusters. Blue atoms represent Y atoms, yellow atoms represent O atoms, and red atoms represent atoms of which atom volume > 30 Å3. (a) 1 nm cluster during uniaxial tension, (b) 1 nm cluster during biaxial tension, (c) 1 nm cluster during triaxial tension, (d) 2 nm cluster during uniaxial tension, (e) 3 nm cluster during biaxial tension and (f) 4 nm cluster during triaxial tension.
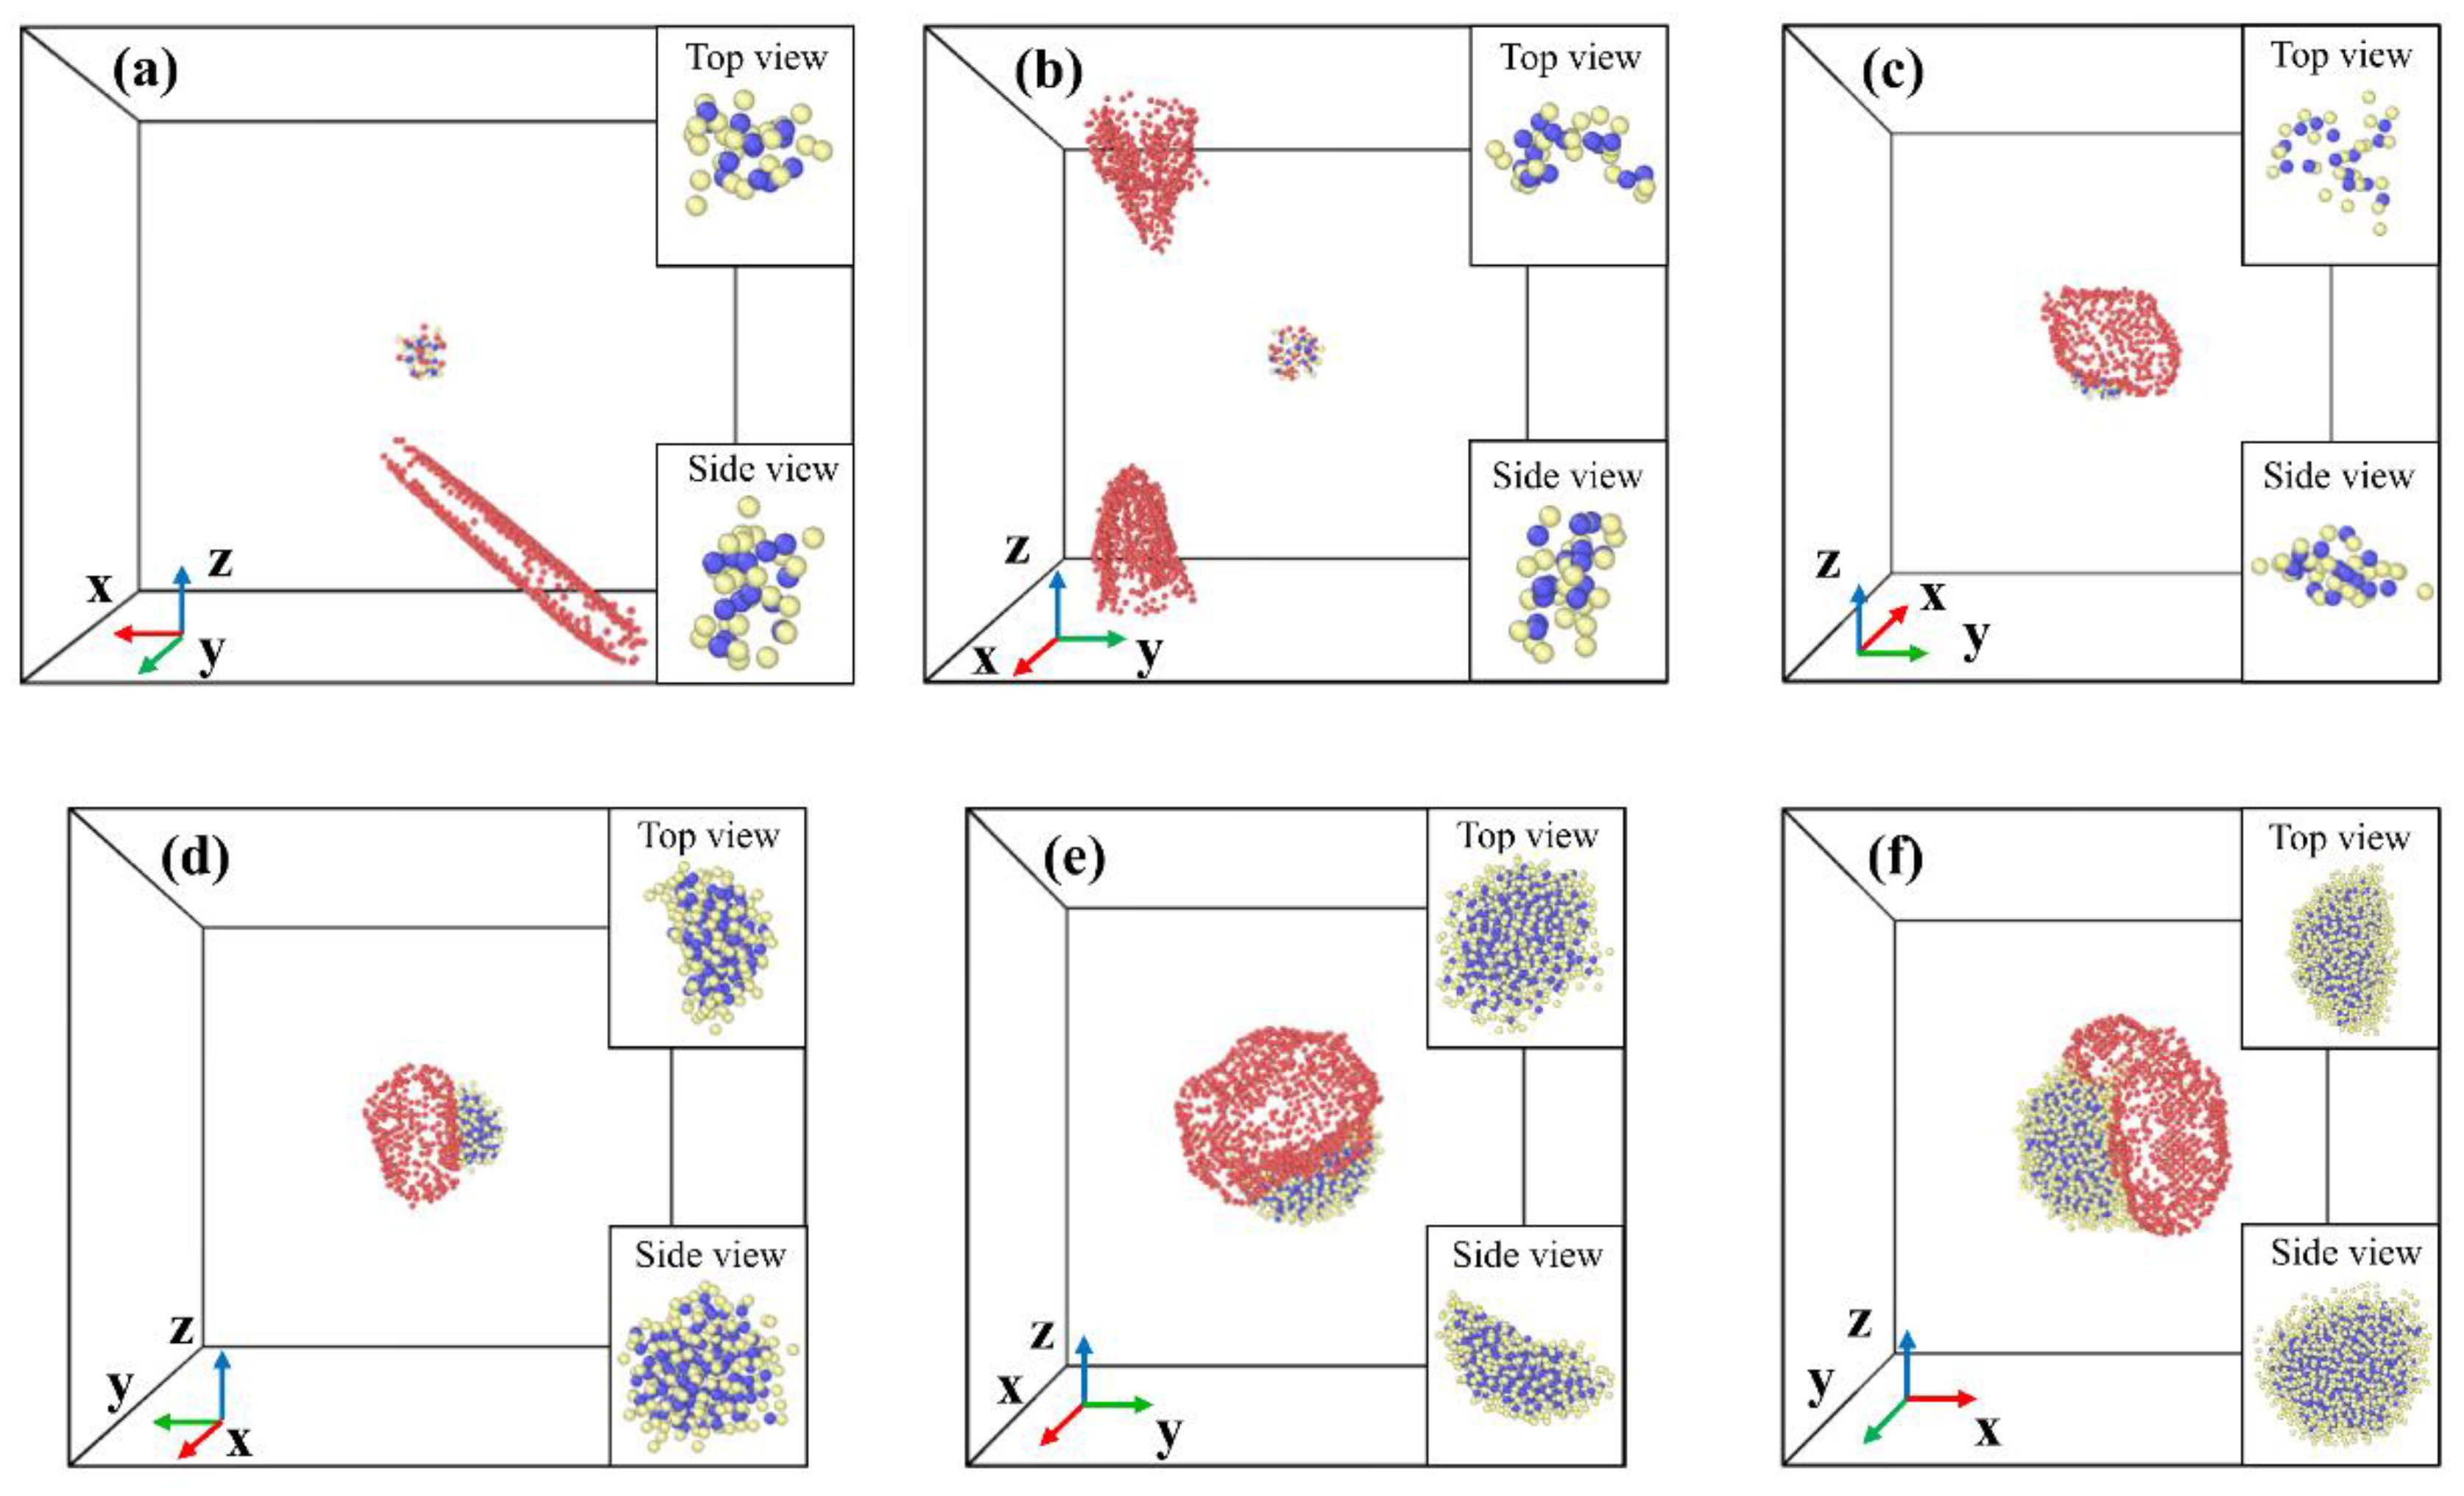
Figure 5.
The stress and strain distribution of Fe atoms in cross-section for 2 nm cluster in triaxial tensile deformation before void nucleation. (a) Hydrostatic stress distribution, (b) von Mises stress distribution, (c) volumetric strain distribution and (d) shear strain distribution.
Figure 5.
The stress and strain distribution of Fe atoms in cross-section for 2 nm cluster in triaxial tensile deformation before void nucleation. (a) Hydrostatic stress distribution, (b) von Mises stress distribution, (c) volumetric strain distribution and (d) shear strain distribution.
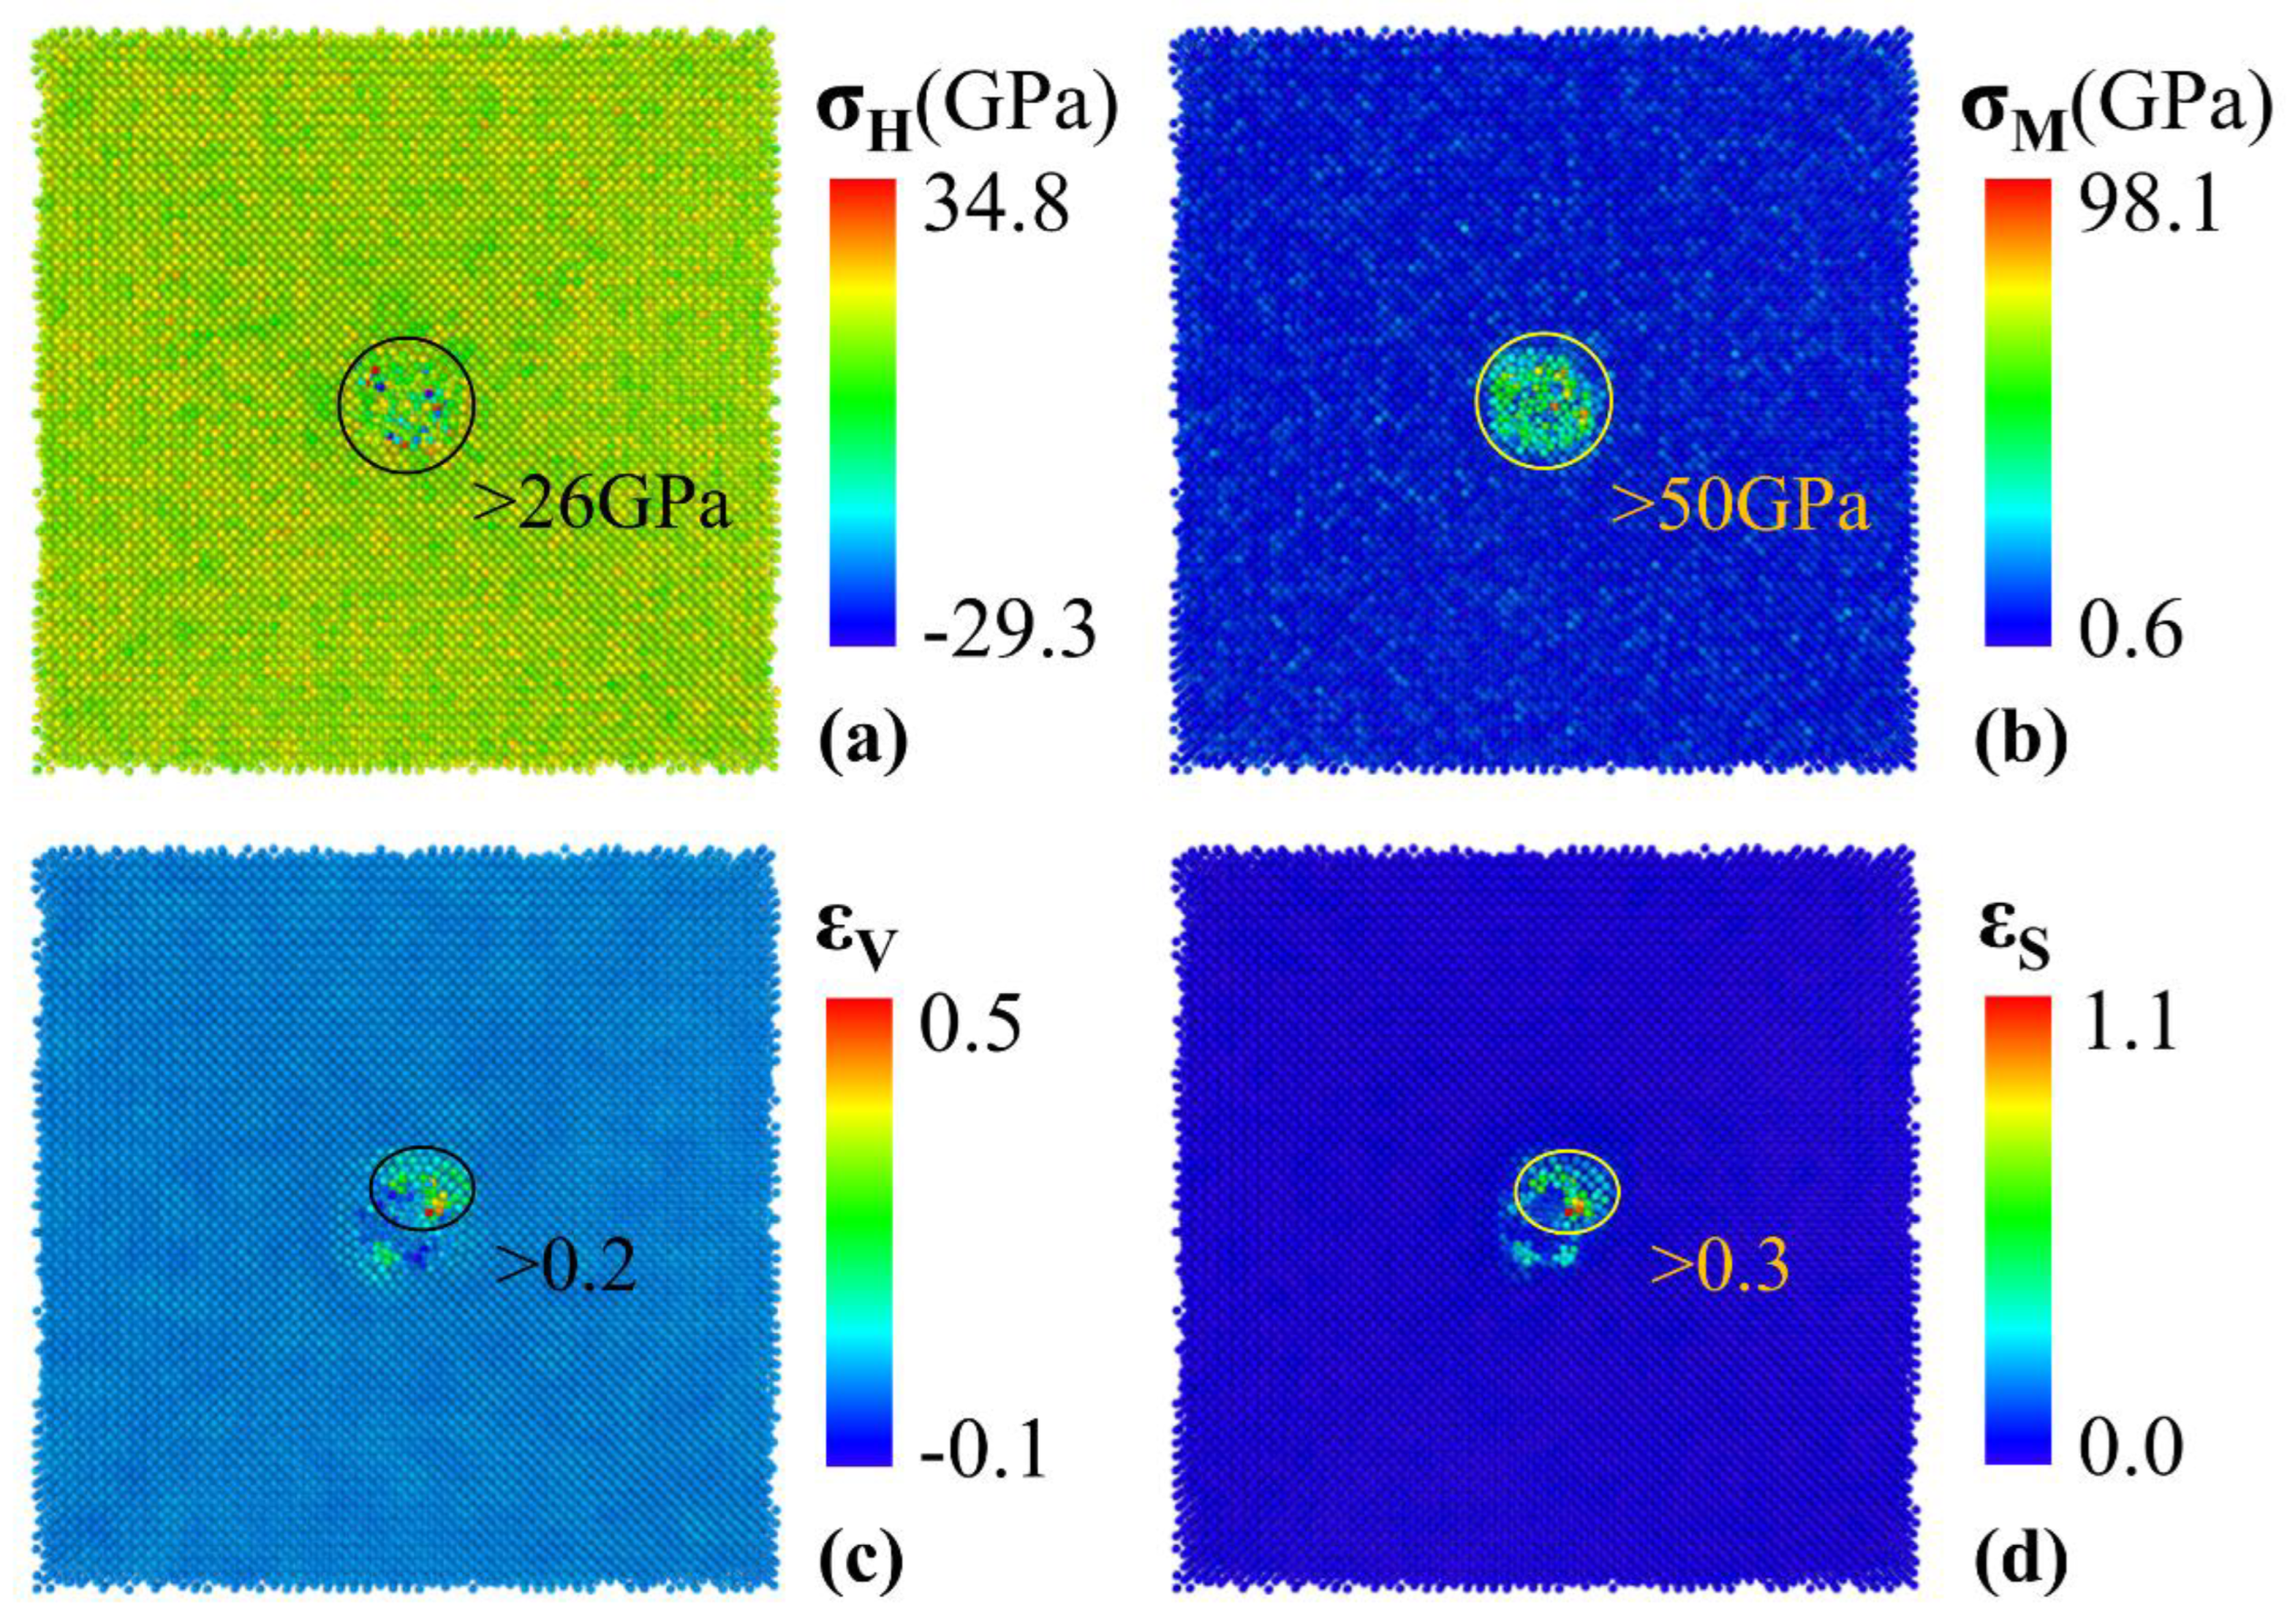
Figure 6.
The variation of nucleation strain (StrainN), nucleation strength (StrengthN), failure strain (StrainF), failure strength (StrengthF) and the void volume fraction at penetration (Fv-Penetration) with oxide cluster size during multi-axial tensile deformation: (a) nucleation strain, (b) nucleation strength, (c) failure strain, (d) failure strength and (e) void volume fraction at penetration.
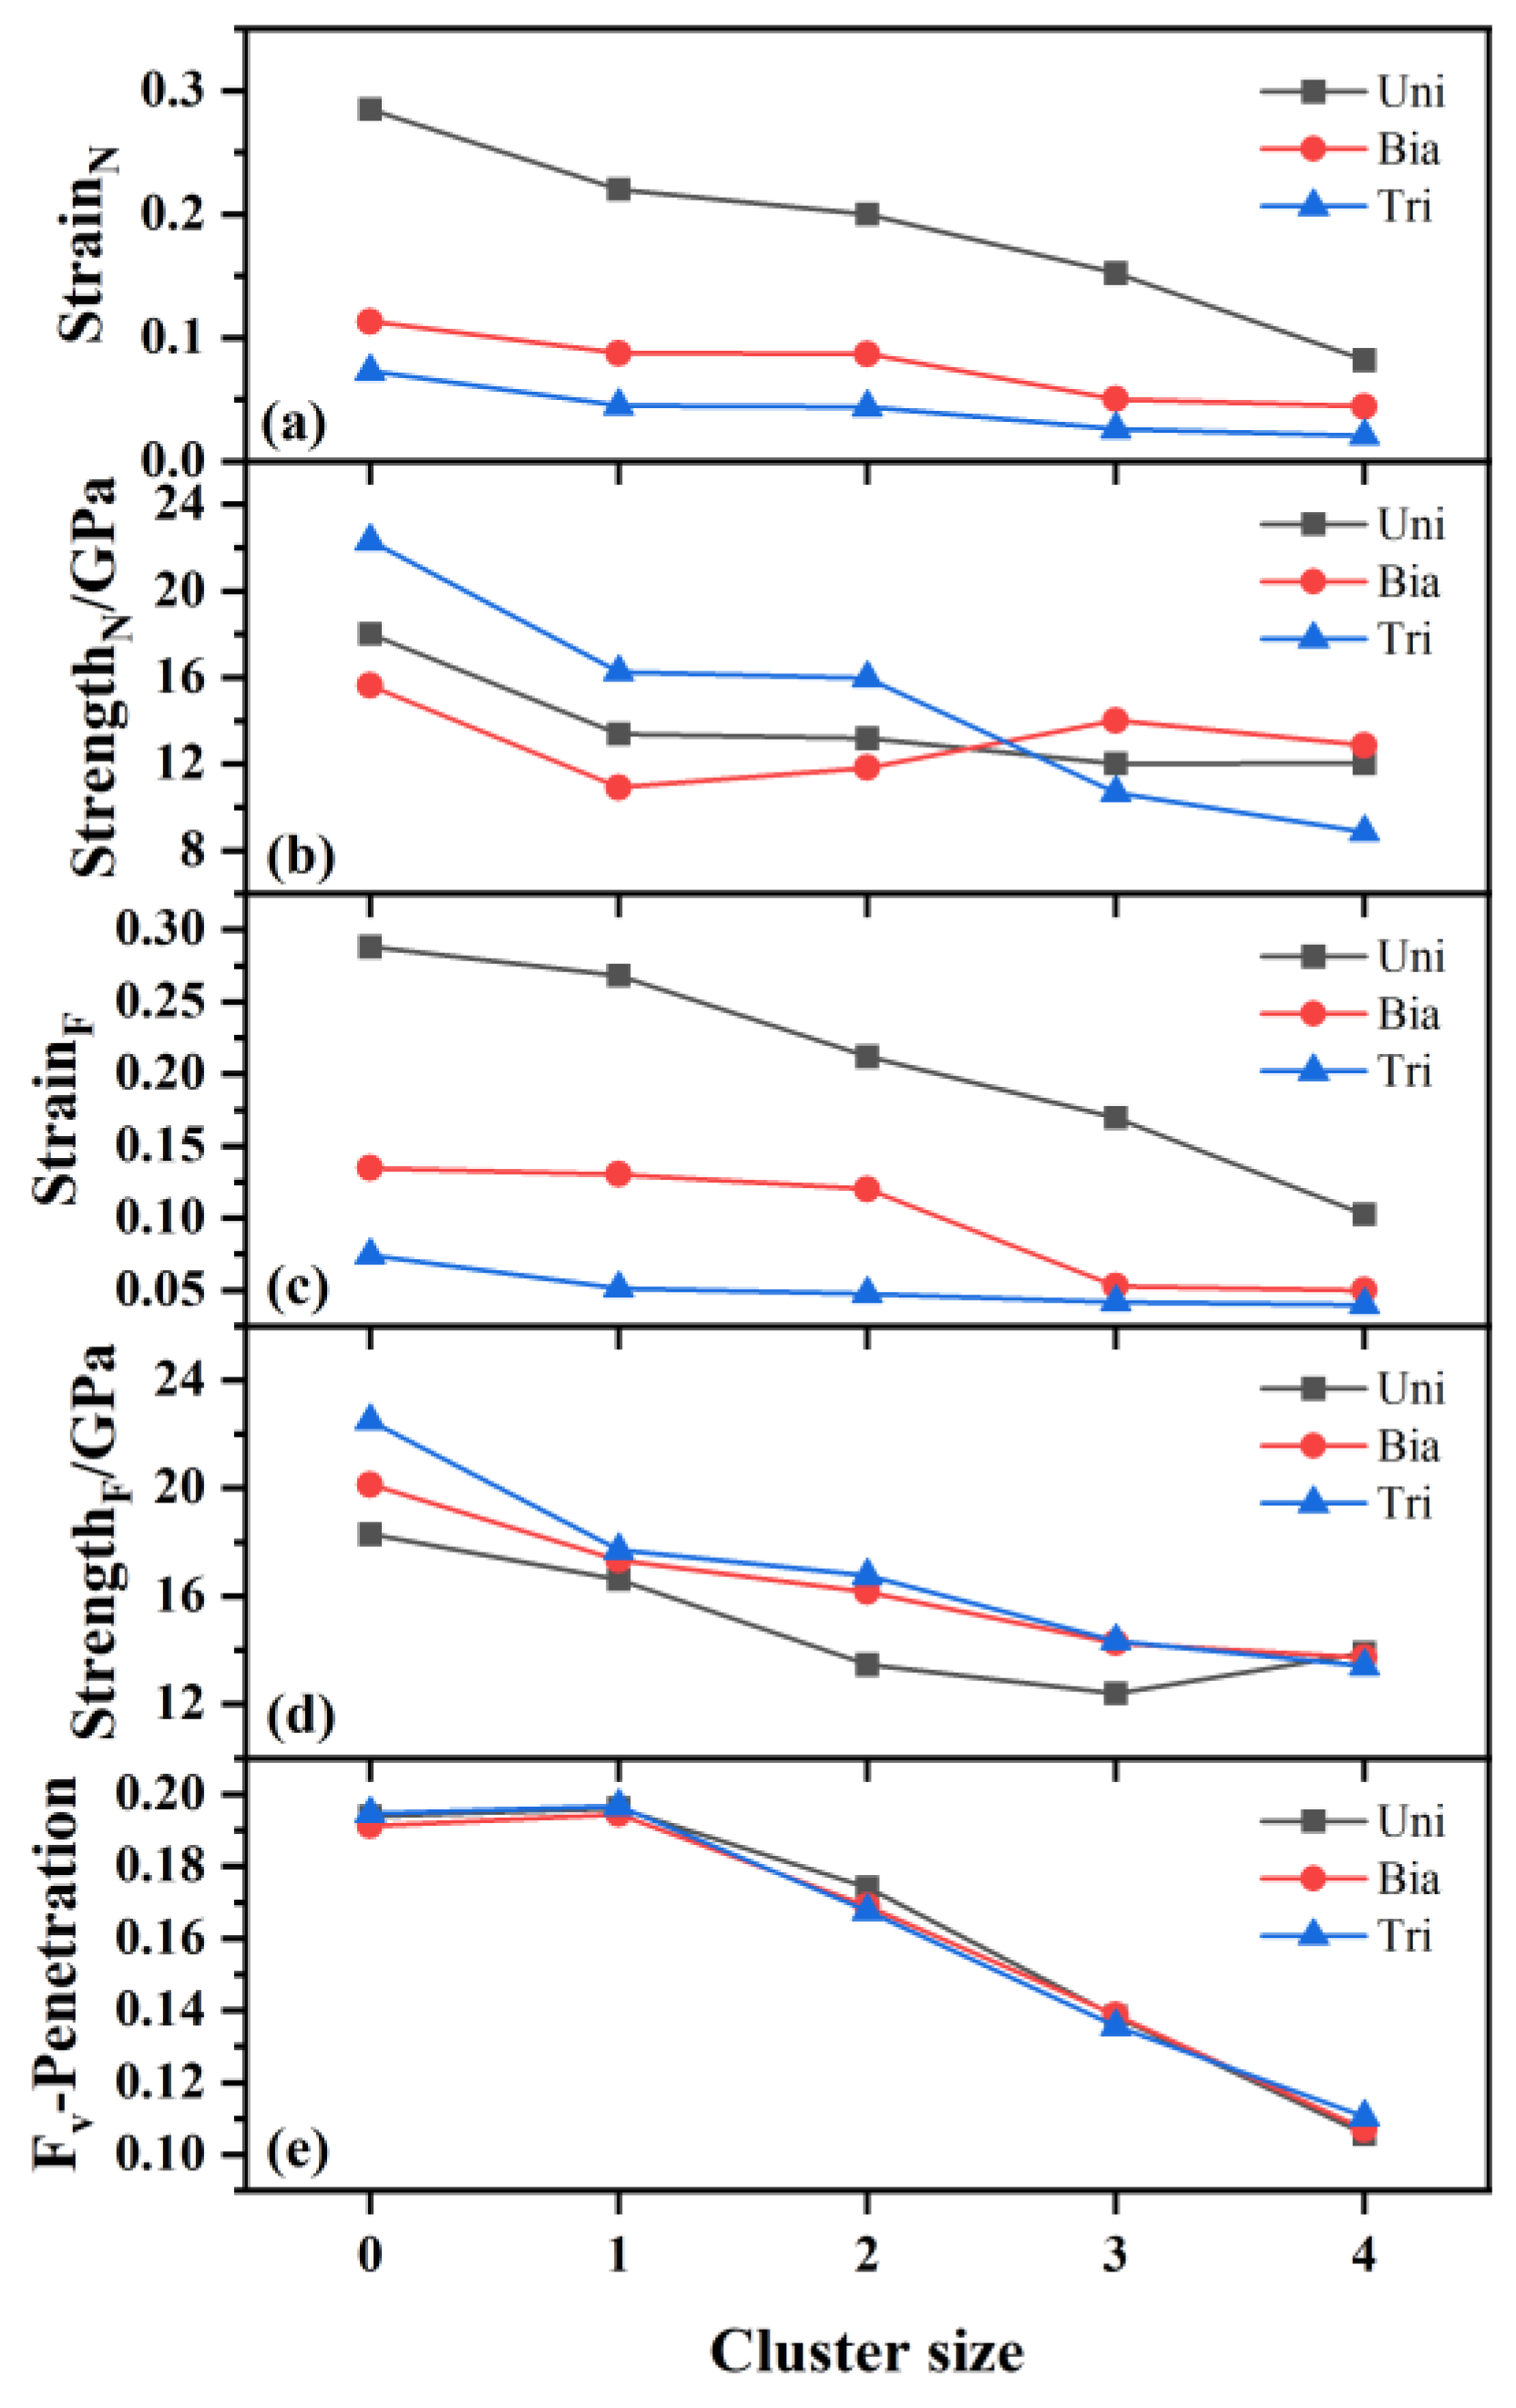
Figure 7.
The stress triaxiality distribution of the two voids in the system for 1 nm oxide cluster cases during: (a) uniaxial tension, (b) biaxial tension.
Figure 7.
The stress triaxiality distribution of the two voids in the system for 1 nm oxide cluster cases during: (a) uniaxial tension, (b) biaxial tension.
Disclaimer/Publisher’s Note: The statements, opinions and data contained in all publications are solely those of the individual author(s) and contributor(s) and not of MDPI and/or the editor(s). MDPI and/or the editor(s) disclaim responsibility for any injury to people or property resulting from any ideas, methods, instructions or products referred to in the content. |
© 2025 by the authors. Licensee MDPI, Basel, Switzerland. This article is an open access article distributed under the terms and conditions of the Creative Commons Attribution (CC BY) license (http://creativecommons.org/licenses/by/4.0/).
Copyright: This open access article is published under a Creative Commons CC BY 4.0 license, which permit the free download, distribution, and reuse, provided that the author and preprint are cited in any reuse.


