Submitted:
17 April 2025
Posted:
18 April 2025
You are already at the latest version
Abstract
The research analyzes machine learning methods for predicting diabetes through Pima Indians Diabetes Dataset analysis. The optimization of XGBoost and Logistic Regression (LR), Support Vector Machine (SVM) and Random Forest (RF) through Optuna resulted in tests on clinical features including glucose, BMI and insulin. The predictive performance of XGBoost and LR reached 82.03% accuracy and 88.24% precision due to their strong ability to detect positive cases. All four prediction models demonstrated insufficient recall performance at 41.67% which resulted in missing 58% of diabetic cases thus making them unsuitable for clinical practice. The F1-scores indicate that medical diagnostic precision and recall remain difficult to balance because XGBoost achieved 56.60% and SVM reached 54.55% and RF obtained 50.91% (XGBoost: 56.60%, SVM: 54.55%, RF: 50.91%). The clinical adoption of XGBoost ensemble methods for diabetes screening needs improved sensitivity and dataset diversity to reach practical application standards. Diabetes mellitus has developed into a major worldwide health challenge because it affects people from diverse age groups and economic levels. The condition features prolonged high blood glucose levels, which occur because the body either produces insufficient insulin or cannot efficiently use the insulin it makes. The World Health Organization (WHO) identifies diabetes as a major global health problem since the number of cases continues to increase rapidly, while being ranked as a top death-causing condition worldwide. The World Health Organization WHO, 2021) reported that diabetes affected 422 million people worldwide in 2014 while forecasting this number to grow unless effective preventive steps are adopted (WHO, 2021). The increasing number of diabetes cases demonstrates the necessity for superior diagnostic methods and early treatment approaches, and enhanced disease management to minimize long-term health complications.The medical community divides diabetes into two main subtypes, which are Type 1 and Type 2. Type 1 diabetes occurs when the immune system attacks pancreatic beta cells, which produce insulin, resulting in an absolute lack of this hormone. Children and adolescents commonly develop this type of diabetes, which needs continuous insulin treatment for survival. The majority of diabetes diagnoses worldwide belong to Type 2 diabetes, which develops because patients have both insulin resistance and insufficient insulin production. Type 2 diabetes differs from Type 1 because its origin stems from adjustable lifestyle elements like poor eating habits and lack of physical activity, together with obesity. The development of diabetes can be attributed to genetic susceptibility as well as age and specific medical conditions, including polycystic ovary syndrome (PCOS) (International Diabetes Federation, 2021).The uncontrolled nature of diabetes produces severe health complications, which become a major concern for patients. The persistent elevation of blood sugar levels creates severe health risks that produce fatal medical conditions such as cardiovascular disease and stroke and kidney failure and nerve damage (neuropathy), and vision impairment (retinopathy). Lower-limb amputations arise primarily from diabetes, while the illness simultaneously leads to substantial deterioration in patients' lifestyle quality. Early diagnosis remains essential because it enables patients to obtain prompt access to proper treatment methods combined with necessary lifestyle changes. Diagnosis of diabetes depends on testing fasting blood glucose levels and conducting oral glucose tolerance tests and measuring glycated hemoglobin (HbA1c). The diagnostic tools demonstrate effectiveness, but they possess multiple restrictions. Medical facilities with laboratories are necessary for blood tests as these procedures take longer to complete, and limited accessibility exists for people living in distant areas with low household income. People with diabetes might go without a diagnosis because their condition shows no symptoms when it first develops.Machine learning-based diagnostic tools act as affordable, convenient solutions for diabetes screening in locations that lack sufficient healthcare facilities. Predictive models generate important health risk predictions for individuals which allow them to take preventive measures that stop diabetes development. The worldwide increase in diabetes cases requires innovative data-based solutions to help identify potential problems and stop their development. The research develops a machine learning model for diabetes prediction through analysis of authentic patient clinical data to advance knowledge in this field. The research aims to develop improved detection methods that will strengthen diabetes management practices, along with advancing technological healthcare solutions for medical practice.
Keywords:
Diabetes Prediction
; Machine Learning
; XGBoost
; Hyperparameter Optimization
; Optuna
; Healthcare Analytics
Diabetes Prediction Using Machine Learning
Diabetes mellitus has developed into a major worldwide health challenge because it affects people from diverse age groups and economic levels. The condition features prolonged high blood glucose levels, which occur because the body either produces insufficient insulin or cannot efficiently use the insulin it makes. The World Health Organization (WHO) identifies diabetes as a major global health problem since the number of cases continues to increase rapidly, while being ranked as a top death-causing condition worldwide. The World Health Organization WHO, 2021) reported that diabetes affected 422 million people worldwide in 2014 while forecasting this number to grow unless effective preventive steps are adopted (WHO, 2021). The increasing number of diabetes cases demonstrates the necessity for superior diagnostic methods and early treatment approaches, and enhanced disease management to minimize long-term health complications.
The medical community divides diabetes into two main subtypes, which are Type 1 and Type 2. Type 1 diabetes occurs when the immune system attacks pancreatic beta cells, which produce insulin, resulting in an absolute lack of this hormone. Children and adolescents commonly develop this type of diabetes, which needs continuous insulin treatment for survival. The majority of diabetes diagnoses worldwide belong to Type 2 diabetes, which develops because patients have both insulin resistance and insufficient insulin production. Type 2 diabetes differs from Type 1 because its origin stems from adjustable lifestyle elements like poor eating habits and lack of physical activity, together with obesity. The development of diabetes can be attributed to genetic susceptibility as well as age and specific medical conditions, including polycystic ovary syndrome (PCOS) (International Diabetes Federation, 2021).
The uncontrolled nature of diabetes produces severe health complications, which become a major concern for patients. The persistent elevation of blood sugar levels creates severe health risks that produce fatal medical conditions such as cardiovascular disease and stroke and kidney failure and nerve damage (neuropathy), and vision impairment (retinopathy). Lower-limb amputations arise primarily from diabetes, while the illness simultaneously leads to substantial deterioration in patients’ lifestyle quality. Early diagnosis remains essential because it enables patients to obtain prompt access to proper treatment methods combined with necessary lifestyle changes. Diagnosis of diabetes depends on testing fasting blood glucose levels and conducting oral glucose tolerance tests and measuring glycated hemoglobin (HbA1c). The diagnostic tools demonstrate effectiveness, but they possess multiple restrictions. Medical facilities with laboratories are necessary for blood tests as these procedures take longer to complete, and limited accessibility exists for people living in distant areas with low household income. People with diabetes might go without a diagnosis because their condition shows no symptoms when it first develops.
Machine learning-based diagnostic tools act as affordable, convenient solutions for diabetes screening in locations that lack sufficient healthcare facilities. Predictive models generate important health risk predictions for individuals which allow them to take preventive measures that stop diabetes development.
The worldwide increase in diabetes cases requires innovative data-based solutions to help identify potential problems and stop their development. The research develops a machine learning model for diabetes prediction through analysis of authentic patient clinical data to advance knowledge in this field. The research aims to develop improved detection methods that will strengthen diabetes management practices, along with advancing technological healthcare solutions for medical practice.
Literature Review
The increase in diabetes cases motivates scientific teams to develop better methods for detecting and diagnosing conditions early. The healthcare field shows increasing interest in machine learning (ML) tools for enhancing predictive models during the current year. Numerous research investigations have examined the use of ML algorithms for diabetes detection by analyzing datasets that include vital health indicators, including glucose levels and blood pressure and body mass index (BMI), and insulin levels, and patient age. This part examines the literature regarding machine learning systems used for diabetes prediction while focusing on the selected datasets and feature selection methods, and classification algorithms.
Machine Learning in Diabetes Prediction
Machine learning diagnostics for medical applications has become more important because this technology effectively analyzes extensive datasets to detect patterns beyond human perception abilities. Medical diagnosis of diabetes currently depends on tests including fasting blood glucose tests and oral glucose tolerance tests, together with HbA1c measurements. These testing procedures function effectively, yet need medical staff supervision, and they present availability problems particularly in low-resource areas. Existing patient records serve as the basis for data-driven automatic predictions, which machine learning models deliver.
Research has investigated how ML algorithms perform in predicting diabetes conditions. The Pima Indians Diabetes Dataset (PIDD) developed by the National Institute of Diabetes and Digestive and Kidney Diseases, serves as the primary data source for numerous research studies about diabetes prediction. The PIDD serves as a standard evaluation platform for ML models because it presents structured data and essential factors for diabetes risk assessment. The prediction of diabetes receives benefits from various classification models, including decision trees, support vector machines (SVM), artificial neural networks (ANN), and ensemble learning techniques.
Sisodia and Sisodia (2018) conducted research that examined multiple machine learning classifiers working with PIDD dataset information. The research indicated that the decision tree, together with random forest, provided better results than traditional statistical methods by reaching accuracy thresholds above 80%.
Feature Selection and Data Preprocessing
The development of accurate machine learning models for diabetes prediction requires the selection of the most important features. There exist numerous cases where raw datasets contain extra information that disrupts the performance of models. Research teams use Recursive Feature Elimination (RFE), Principal Component Analysis (PCA), and correlation-based filtering methods as feature selection techniques to enhance model operational efficiency.
Li et al. (2019) performed a research investigation into how PCA affects the performance of diabetes prediction models. Decreasing the features within the analysis improved both model accuracy and interpretability levels according to research findings. The findings of Kavakiotis et al. (2017) revealed that TARGET components, including blood pressures along with age levels and Body Mass Index and blood sugar values, effectively indicate diabetic conditions.
The proper preprocessing of data is equally important to model performance with feature selection. The medical datasets contain three major problems: many values are missing, the classes are unevenly distributed, along with are inconsistent formatting standards across data types. The challenges in data quality can be resolved through research methods that combine data normalization with missing value imputation and Synthetic Minority Over-sampling Technique (SMOTE). Han et al. (2020) revealed how handling imbalanced datasets matters because improper treatment of class imbalance produces biased prediction outcomes.
Comparison of Machine Learning Algorithms for Diabetes Prediction
Research has tested various machine learning algorithms for diabetes prediction analysis because each prediction method brings a different combination of strengths and limitations. The selection of an algorithm depends on three main factors involving the dataset’s dimensions and the number of features, alongside efficiency requirements.
The binary classification model, Logistic Regression, serves as a widely adopted statistical model for its important use in various applications. Although straightforward and easy to understand due to its interpretability, the method becomes less effective when trying to analyze complex datasets with non-linear connections (Sisodia & Sisodia, 2018).
Support Vector Machines (SVM) demonstrate excellent capabilities within high-dimensional datasets because they establish optimal decision boundaries. These methods prove costly to process when operating on extensive datasets, according to Han et al. (2020).
The performance of diabetes classification results in improved outcomes when using artificial neural networks together with deep learning—neural networks, specifically CNNs and LSTMs, extract nonlinear relationships between features and patterns from the data (Aslam et al., 2021).
Methodology
1. Data Collection and Dataset Description
This research utilized a retrospective analytical design, which analyzed the Pima Indians Diabetes Dataset, which stands as a popular benchmark dataset in medical machine learning. Each record within the dataset contains 8 diagnostic predictors and 4 demographic variables, together with 3 binary outcome variables along with 3 metabolic markers, and 3 physiological measurements.
-
8 diagnostic predictors:
- ○
- Physiological measurements: Glucose, Blood Pressure, Skin Thickness, Insulin, BMI
- ○
- Metabolic markers: Diabetes Pedigree Function
- ○
- Demographic variables: Age, Pregnancies
- Binary outcome: Diabetes diagnosis (1 = positive, 0 = negative).
Inclusion Criteria:
- The dataset contains no missing values, which was validated through df.isnull().sum().
- The dataset contains no duplicated records which were confirmed through df.duplicated().sum().
2. Data Preprocessing
2.1. Data Cleaning
-
Biological Plausibility Check:
- ○
- The clinical measurement variables Glucose, Blood Pressure, and BMI underwent screening to detect impossible values, such as Glucose set at zero milligrams per deciliter.
- ○
- The current dataset lacked any values that could indicate such concepts (in contrast to the unprocessed Pima datasets).
-
Redundancy Analysis:
- ○
- The pairwise correlation analysis through Spearman’s ρ detected no significant multicollinearity since all values remained below 0.8.
2.2. Outlier Detection and Treatment
- Method: Interquartile Range (IQR) with thresholds at Q1 − 1.5×IQR and Q3 + 1.5×IQR.
-
Key Findings:
- ○
- Blood Pressure: 45 outliers (e.g., values < 38 mmHg or > 106 mmHg).
- ○
- Insulin: 34 outliers (values > 318 μU/mL).
- Handling: The model performance became skewed when outliers were removed from the data (129 cases representing 16.8% of total data).
- Rationale: The established conservative threshold criteria helped maintain uncommon yet possible cases (such as hypertension patients) within the analysis.
2.3. Feature Engineering
- Interaction Terms: The analysis did not require creating interaction terms because EDA revealed no significant multiplicative relationships.
- Scaling: Applied StandardScaler to SVM/LR for gradient-based optimization stability.
3. Exploratory Data Analysis (EDA)
Objectives:
- Identify data distributions.
- Detect class imbalance.
- Guide model selection.
Key Techniques:
-
Visualization:
- ○
- Histograms: Revealed right-skewed Insulin and DiabetesPedigreeFunction.
- ○
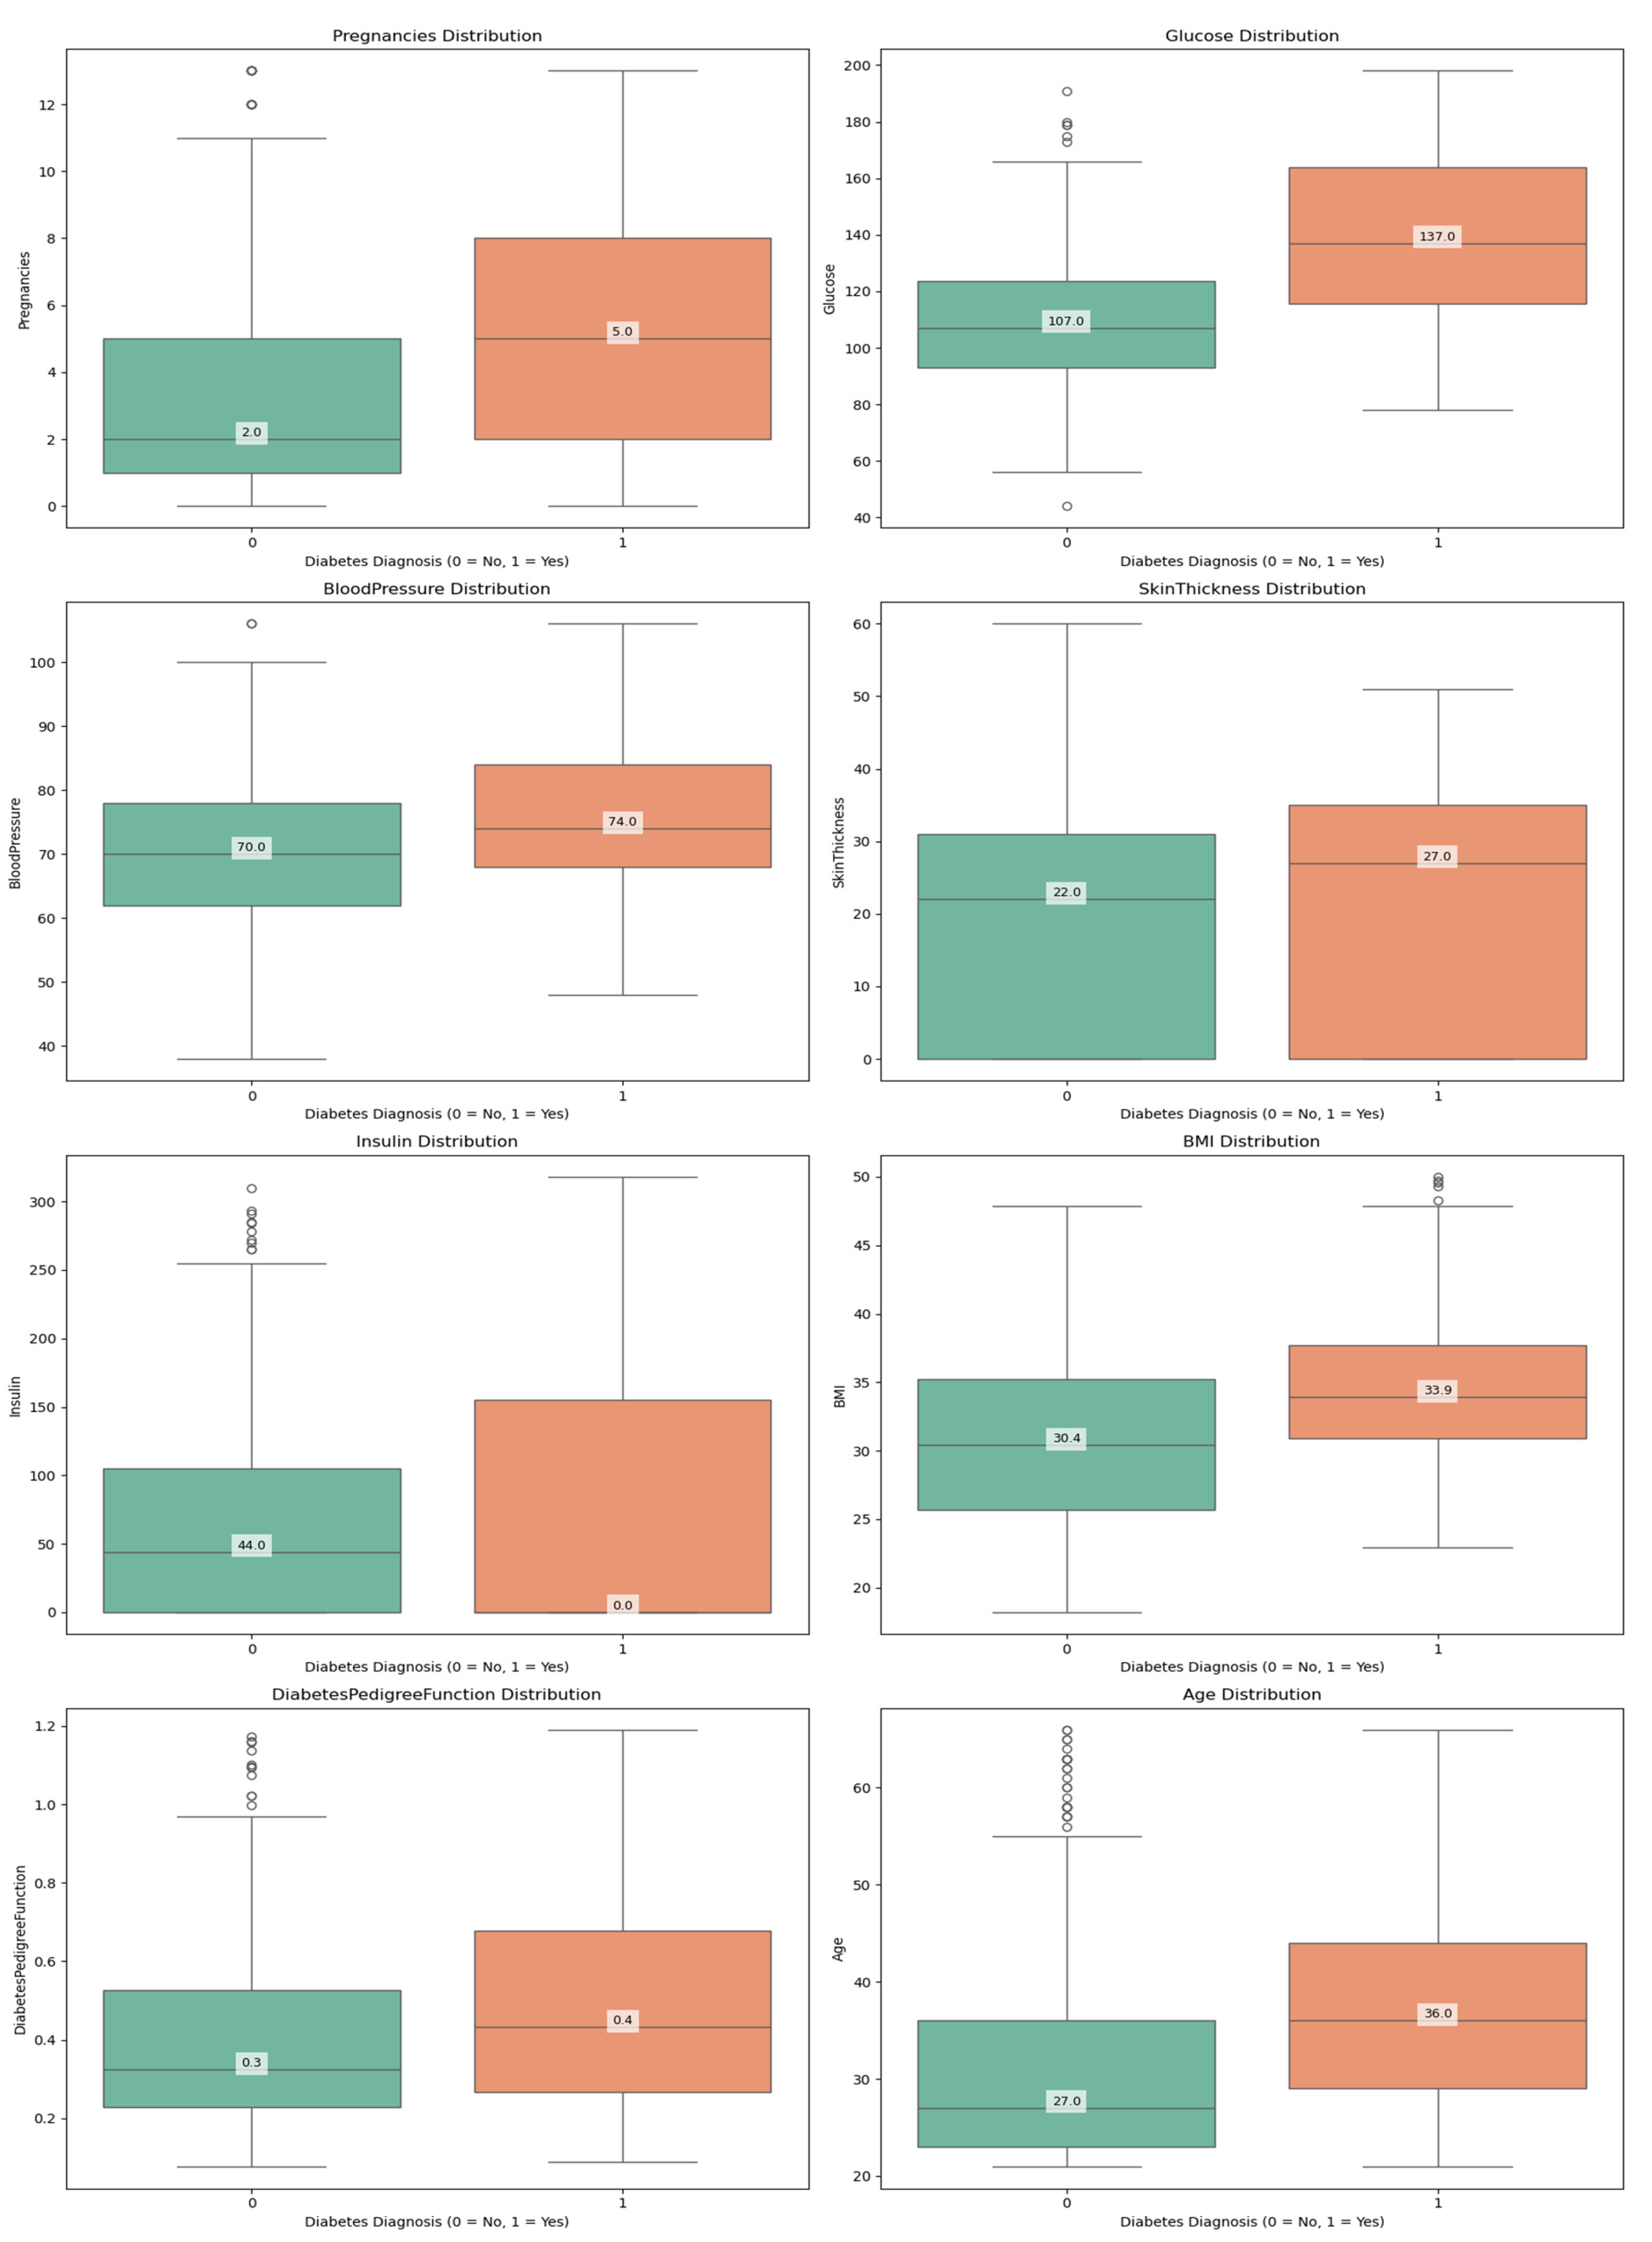
- Boxplots demonstrated how outlier removal procedures were successful by showing that the BMI variable ranged between 18.2 and 50.0 kg/m² after cleaning.
-
Statistical Tests:
- ○
- Shapiro-Wilk Test: Confirmed non-normality in SkinThickness (p < 0.05).
- ○
- Chi-square Test: Confirmed significant association between Glucose and Outcome (p < 0.001).
-
Class Imbalance:
- ○
- Outcome distribution: 31% diabetic (n = 198), 69% non-diabetic (n = 441).
- ○
- Implication: Prioritized F1-score over accuracy to balance precision/recall.
4. Machine Learning Modeling
4.1. Algorithm Selection
| Model | Advantages | Hyperparameters Optimized |
| Logistic Regression | Interpretability, L2 regularization | C, solver (liblinear, lbfgs) |
| SVM | Non-linear boundaries via kernel trick | C, kernel (rbf, linear), gamma |
| Random Forest | Handles non-linearity, feature importance | n_estimators, max_depth |
| XGBoost | Robust to imbalance, regularization | learning_rate, max_depth, gamma |
4.2. Hyperparameter Optimization
- Framework: Optuna (Bayesian optimization with TPE sampler).
-
Protocol:
- The experiment used 50 trials from five random seeds, which included 42, 123, 456, 789, and 101.
- The training data is split into 80% for 5-fold stratified CV.
- Objective Function: Maximize cross-validation accuracy (with F1-score as secondary metric).
5. Evaluation Framework
5.1. Metrics
-
Primary:
- ○
- Accuracy: (TP + TN) / (TP + TN + FP + FN).
- ○
- F1-score: 2 × (Precision × Recall) / (Precision + Recall).
-
Secondary:
- ○
- Precision: TP / (TP + FP).
- ○
- The recall metric is calculated as TP / (TP + FN).
5.2. Validation Strategy
- Train-Test Split: 80-20 stratified split (random_state=42).
- Cross-validation: With 5-fold CV functioned during the parameter tuning process to prevent model overfitting.
- Statistical Testing: The evaluation used McNemar’s test for statistical testing between pairwise models at a significance level of 0.05.
6. Computational and Ethical Considerations
- Tools: Python 3.8 (scikit-learn 1.0, XGBoost 1.5, Optuna 3.0).
- Reproducibility: Fixed random seeds for all stochastic processes.
- Bias Mitigation: The sampling method of stratified sampling maintained equal proportions between different classes.
Results
1. Data Overview and Descriptive Analysis
The researchers used the Pima Indians Diabetes Dataset (PIDD) with its initial 768 records featuring 8 diagnostic predictors alongside the single binary outcome (diabetes diagnosis recorded as 1 for positive and 0 for negative). The preprocessed data contained 639 records after performing outlier removal while checking for missing values.
1.1. Dataset Characteristics
- Features:
- Physiological Measurements: Glucose, Blood Pressure, Skin Thickness, Insulin, BMI
- Metabolic Markers: Diabetes Pedigree Function
- Demographic Variables: Age, Pregnancies
- Outcome Variable: Diabetes diagnosis (binary: 0 = no diabetes, 1 = diabetes)
1.2. Descriptive Statistics
| Feature Key statistics for the cleaned dataset: | Mean | Std Dev | Min | Max |
| Pregnancies | 3.80 | 3.26 | 0 | 13 |
| Glucose | 119.11 | 29.16 | 44 | 198 |
| Blood Pressure | 72.12 | 11.35 | 38 | 106 |
| Skin Thickness | 20.56 | 15.34 | 0 | 60 |
| Insulin | 65.93 | 79.57 | 0 | 318 |
| BMI | 32.01 | 6.43 | 18.2 | 50.0 |
| Diabetes Pedigree Function | 0.43 | 0.25 | 0.078 | 1.191 |
| Age | 32.72 | 11.08 | 21 | 66 |
Key Observations:
- The study revealed that glucose levels at 119.11 mg/dL along with BMI at 32.01 proved to be powerful predictors, which are known clinical risk factors for diabetes.
- The participants showed wide-ranging metabolic characteristics as indicated by the high standard deviation of Insulin (79.57) and Skin Thickness (15.34).
- The research participants displayed average blood pressure readings at 72.12 mmHg, together with an average age of 32.72 years.
Visual Support:
Figure 1.
Histograms of all numerical features.
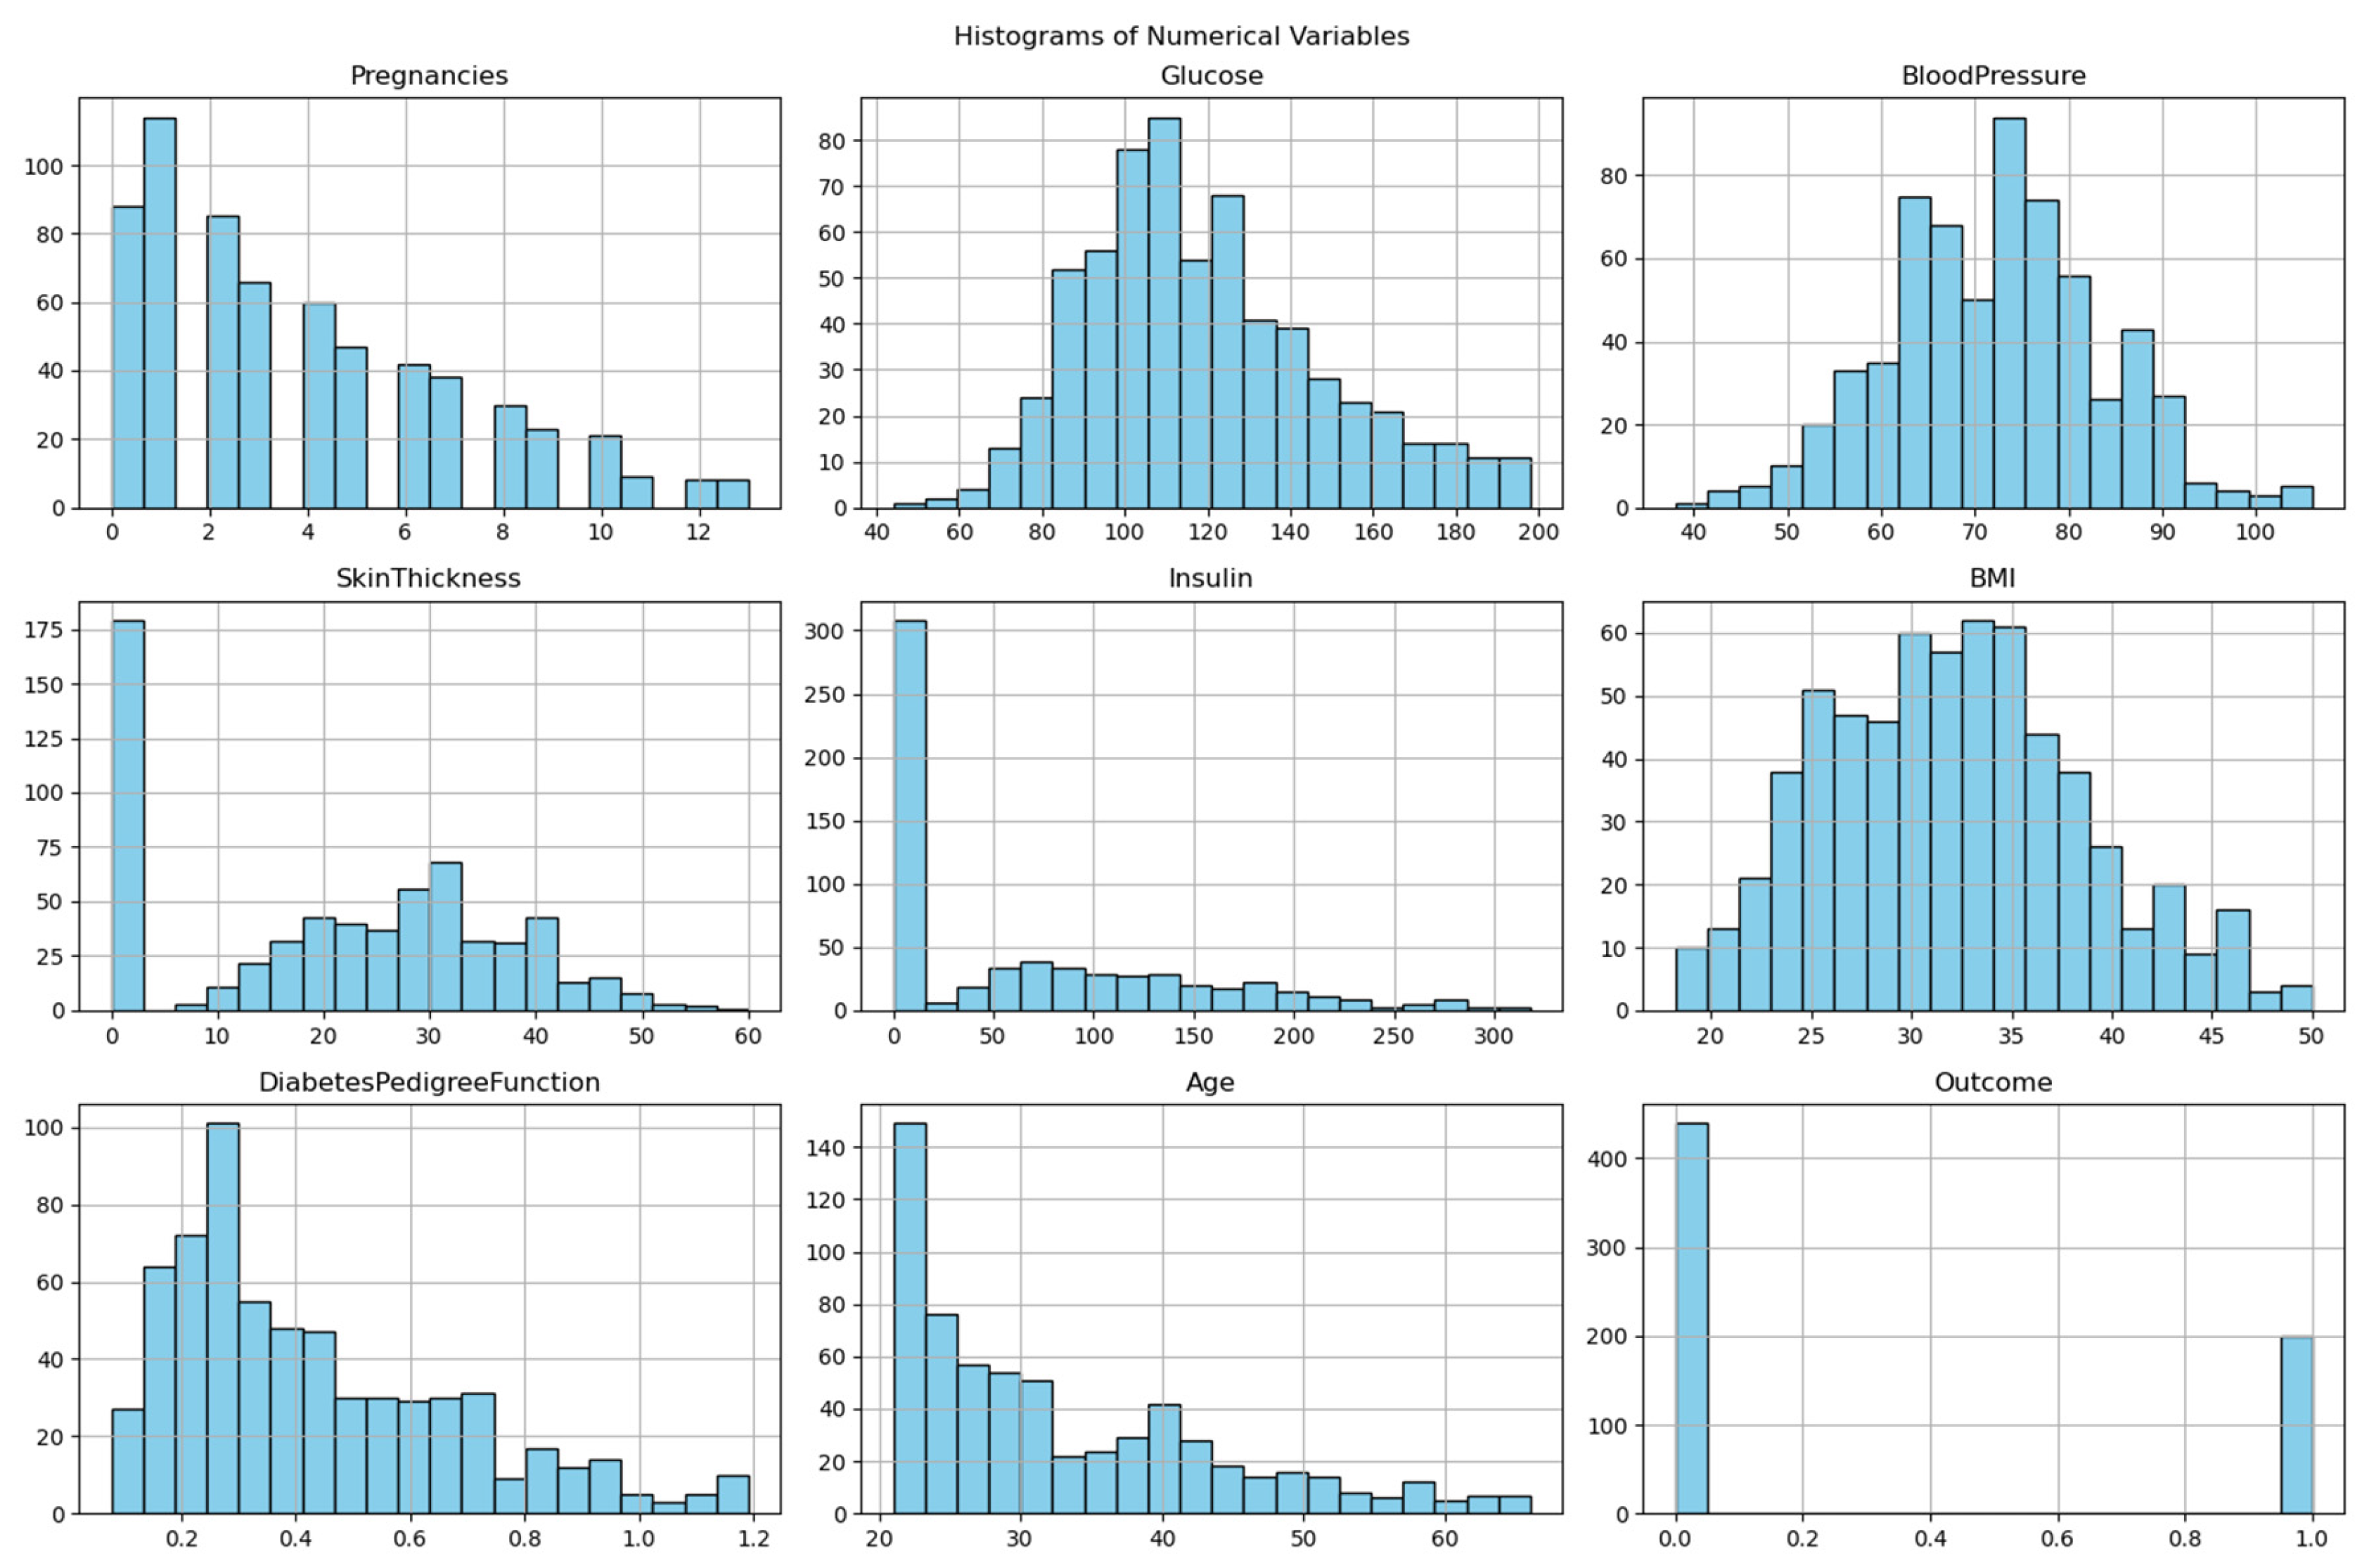
Figure 2.
Histograms of all numerical features.
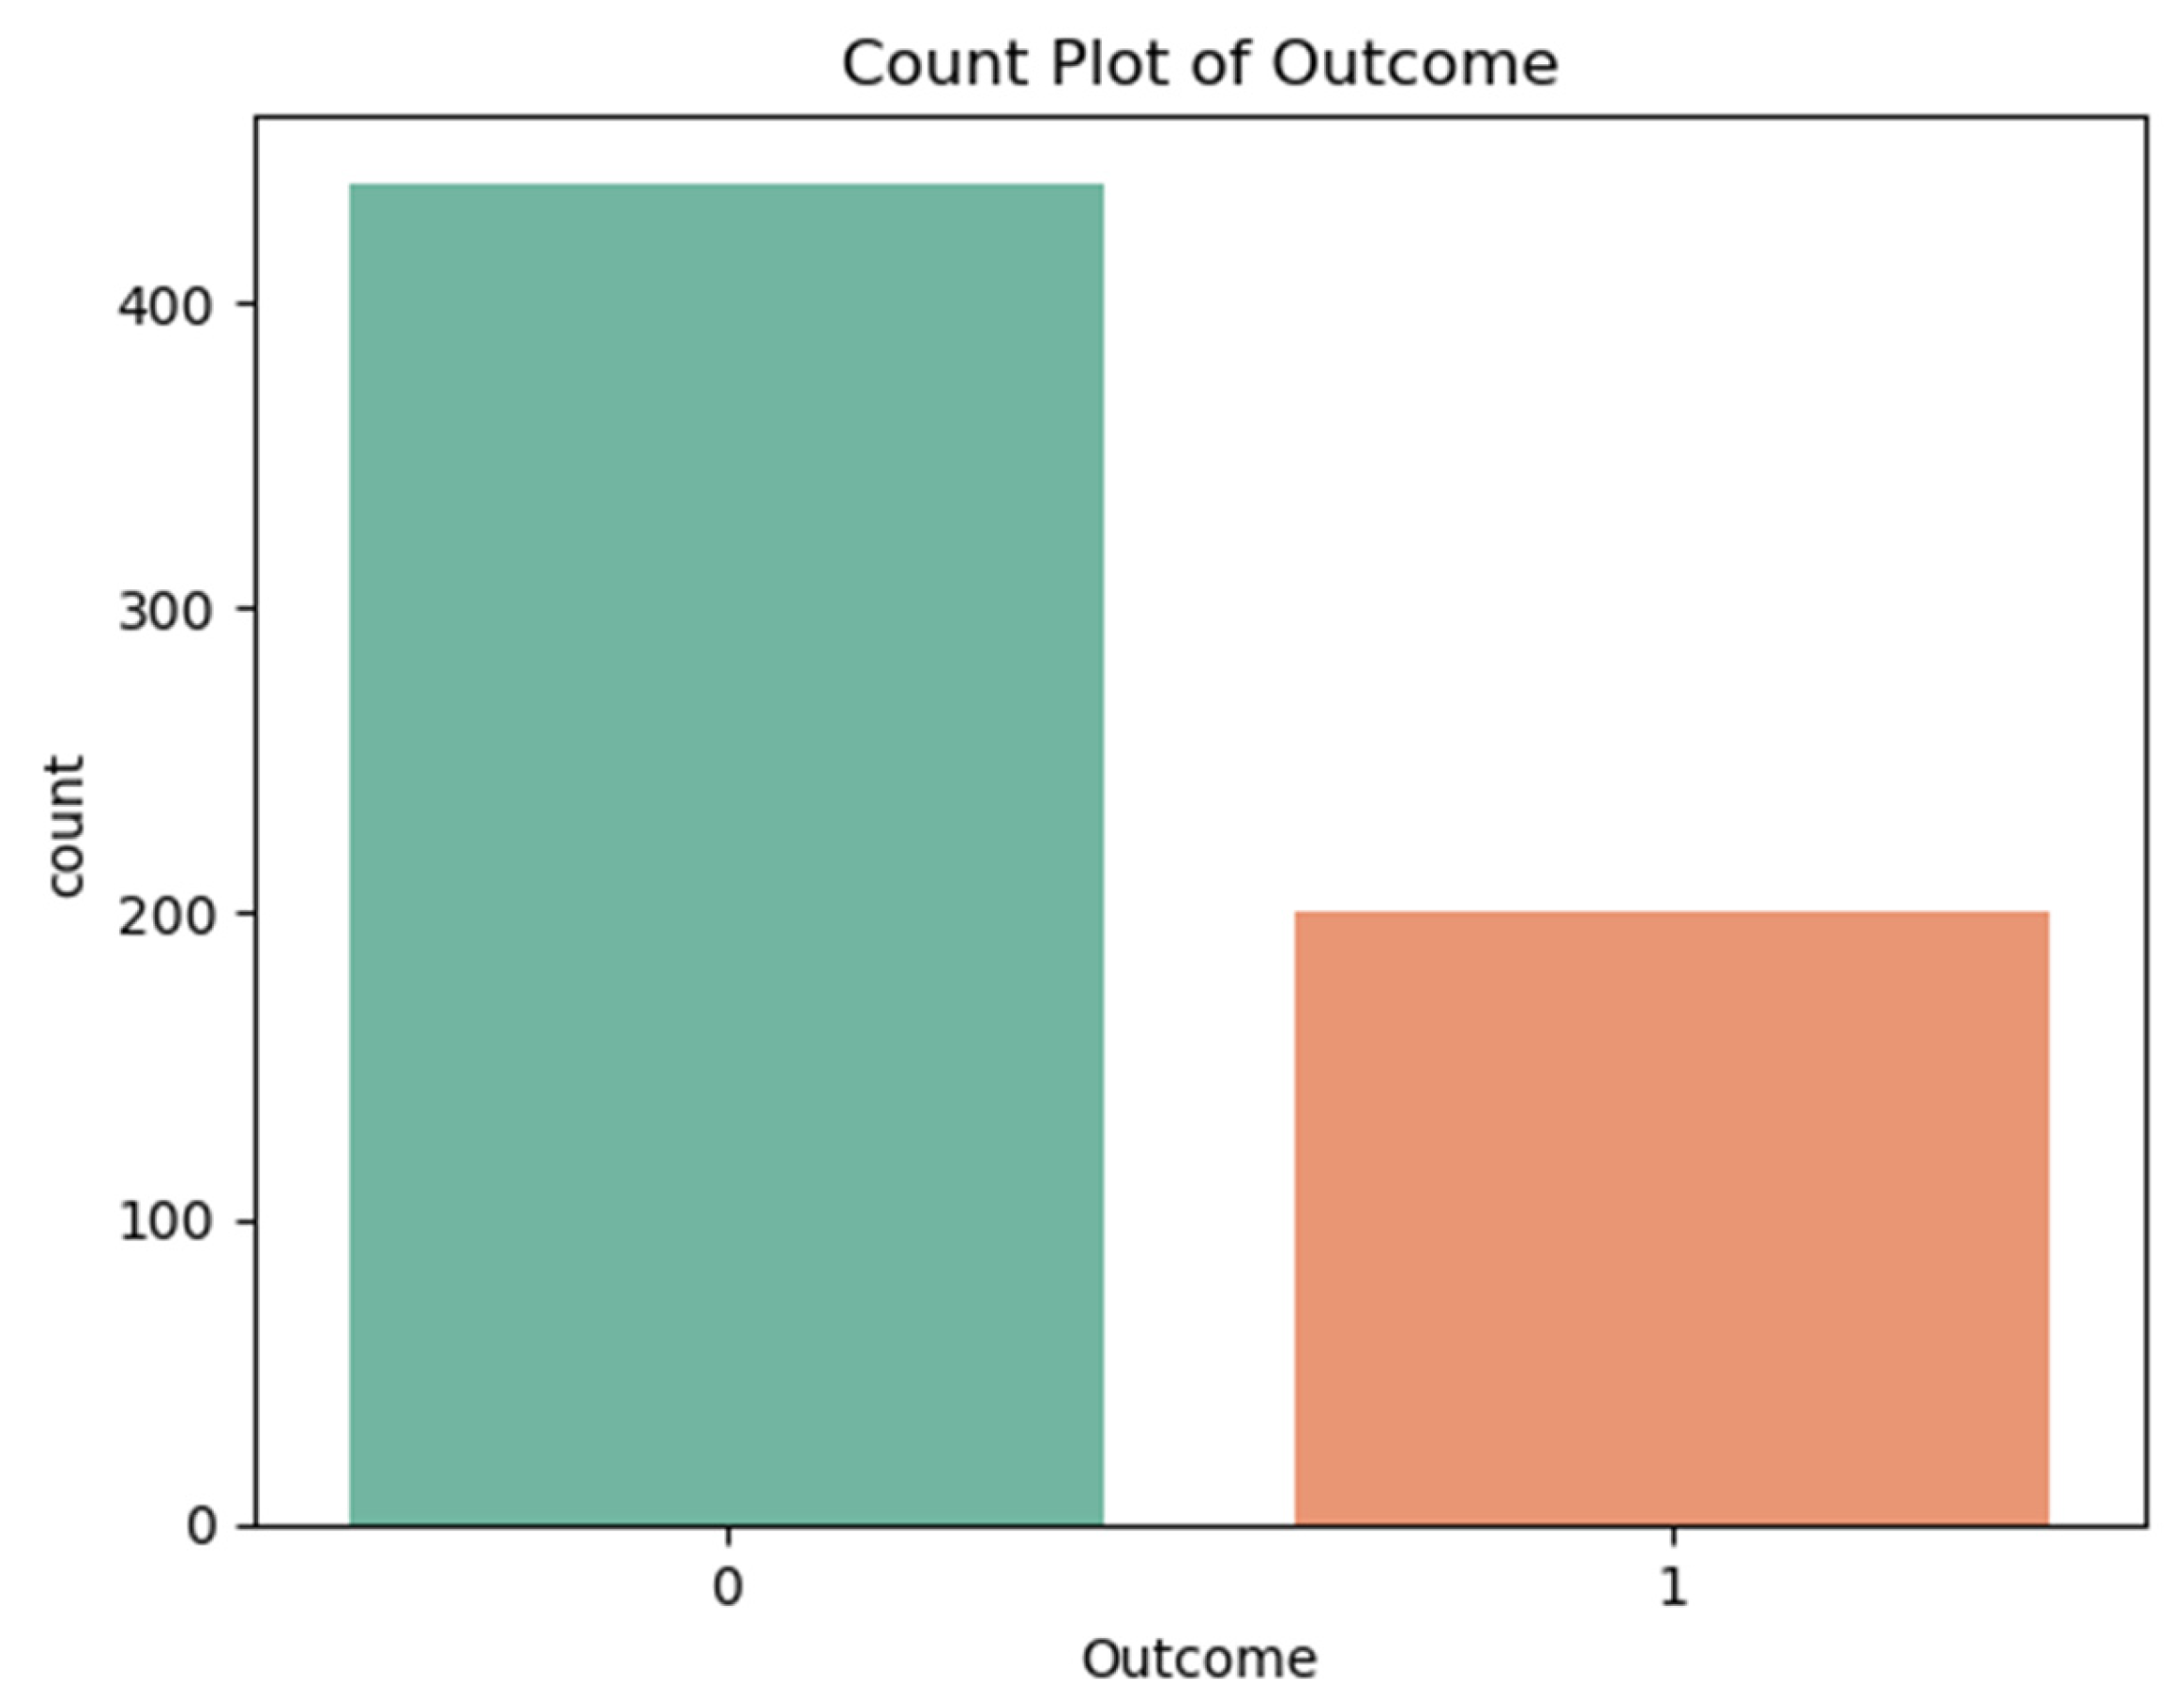
2. Class Distribution and Imbalance Analysis
The data collection showed an unbalanced distribution between diabetic and non-diabetic groups:
- Non-diabetic (Class 0): 69% (441 records)
- Diabetic (Class 1): 31% (198 records)
Implications of Class Imbalance:
- The prediction models showed a preference for producing results that favored the non-diabetic class.
- The recall performance rate reached only approximately 41-42% because the system failed to detect numerous actual diabetic patients.
- The detection of diabetic cases would improve through implementation of SMOTE (Synthetic Minority Oversampling) or class weighting techniques.
Visual Support:
Figure 3.
Count Plot of Outcome.
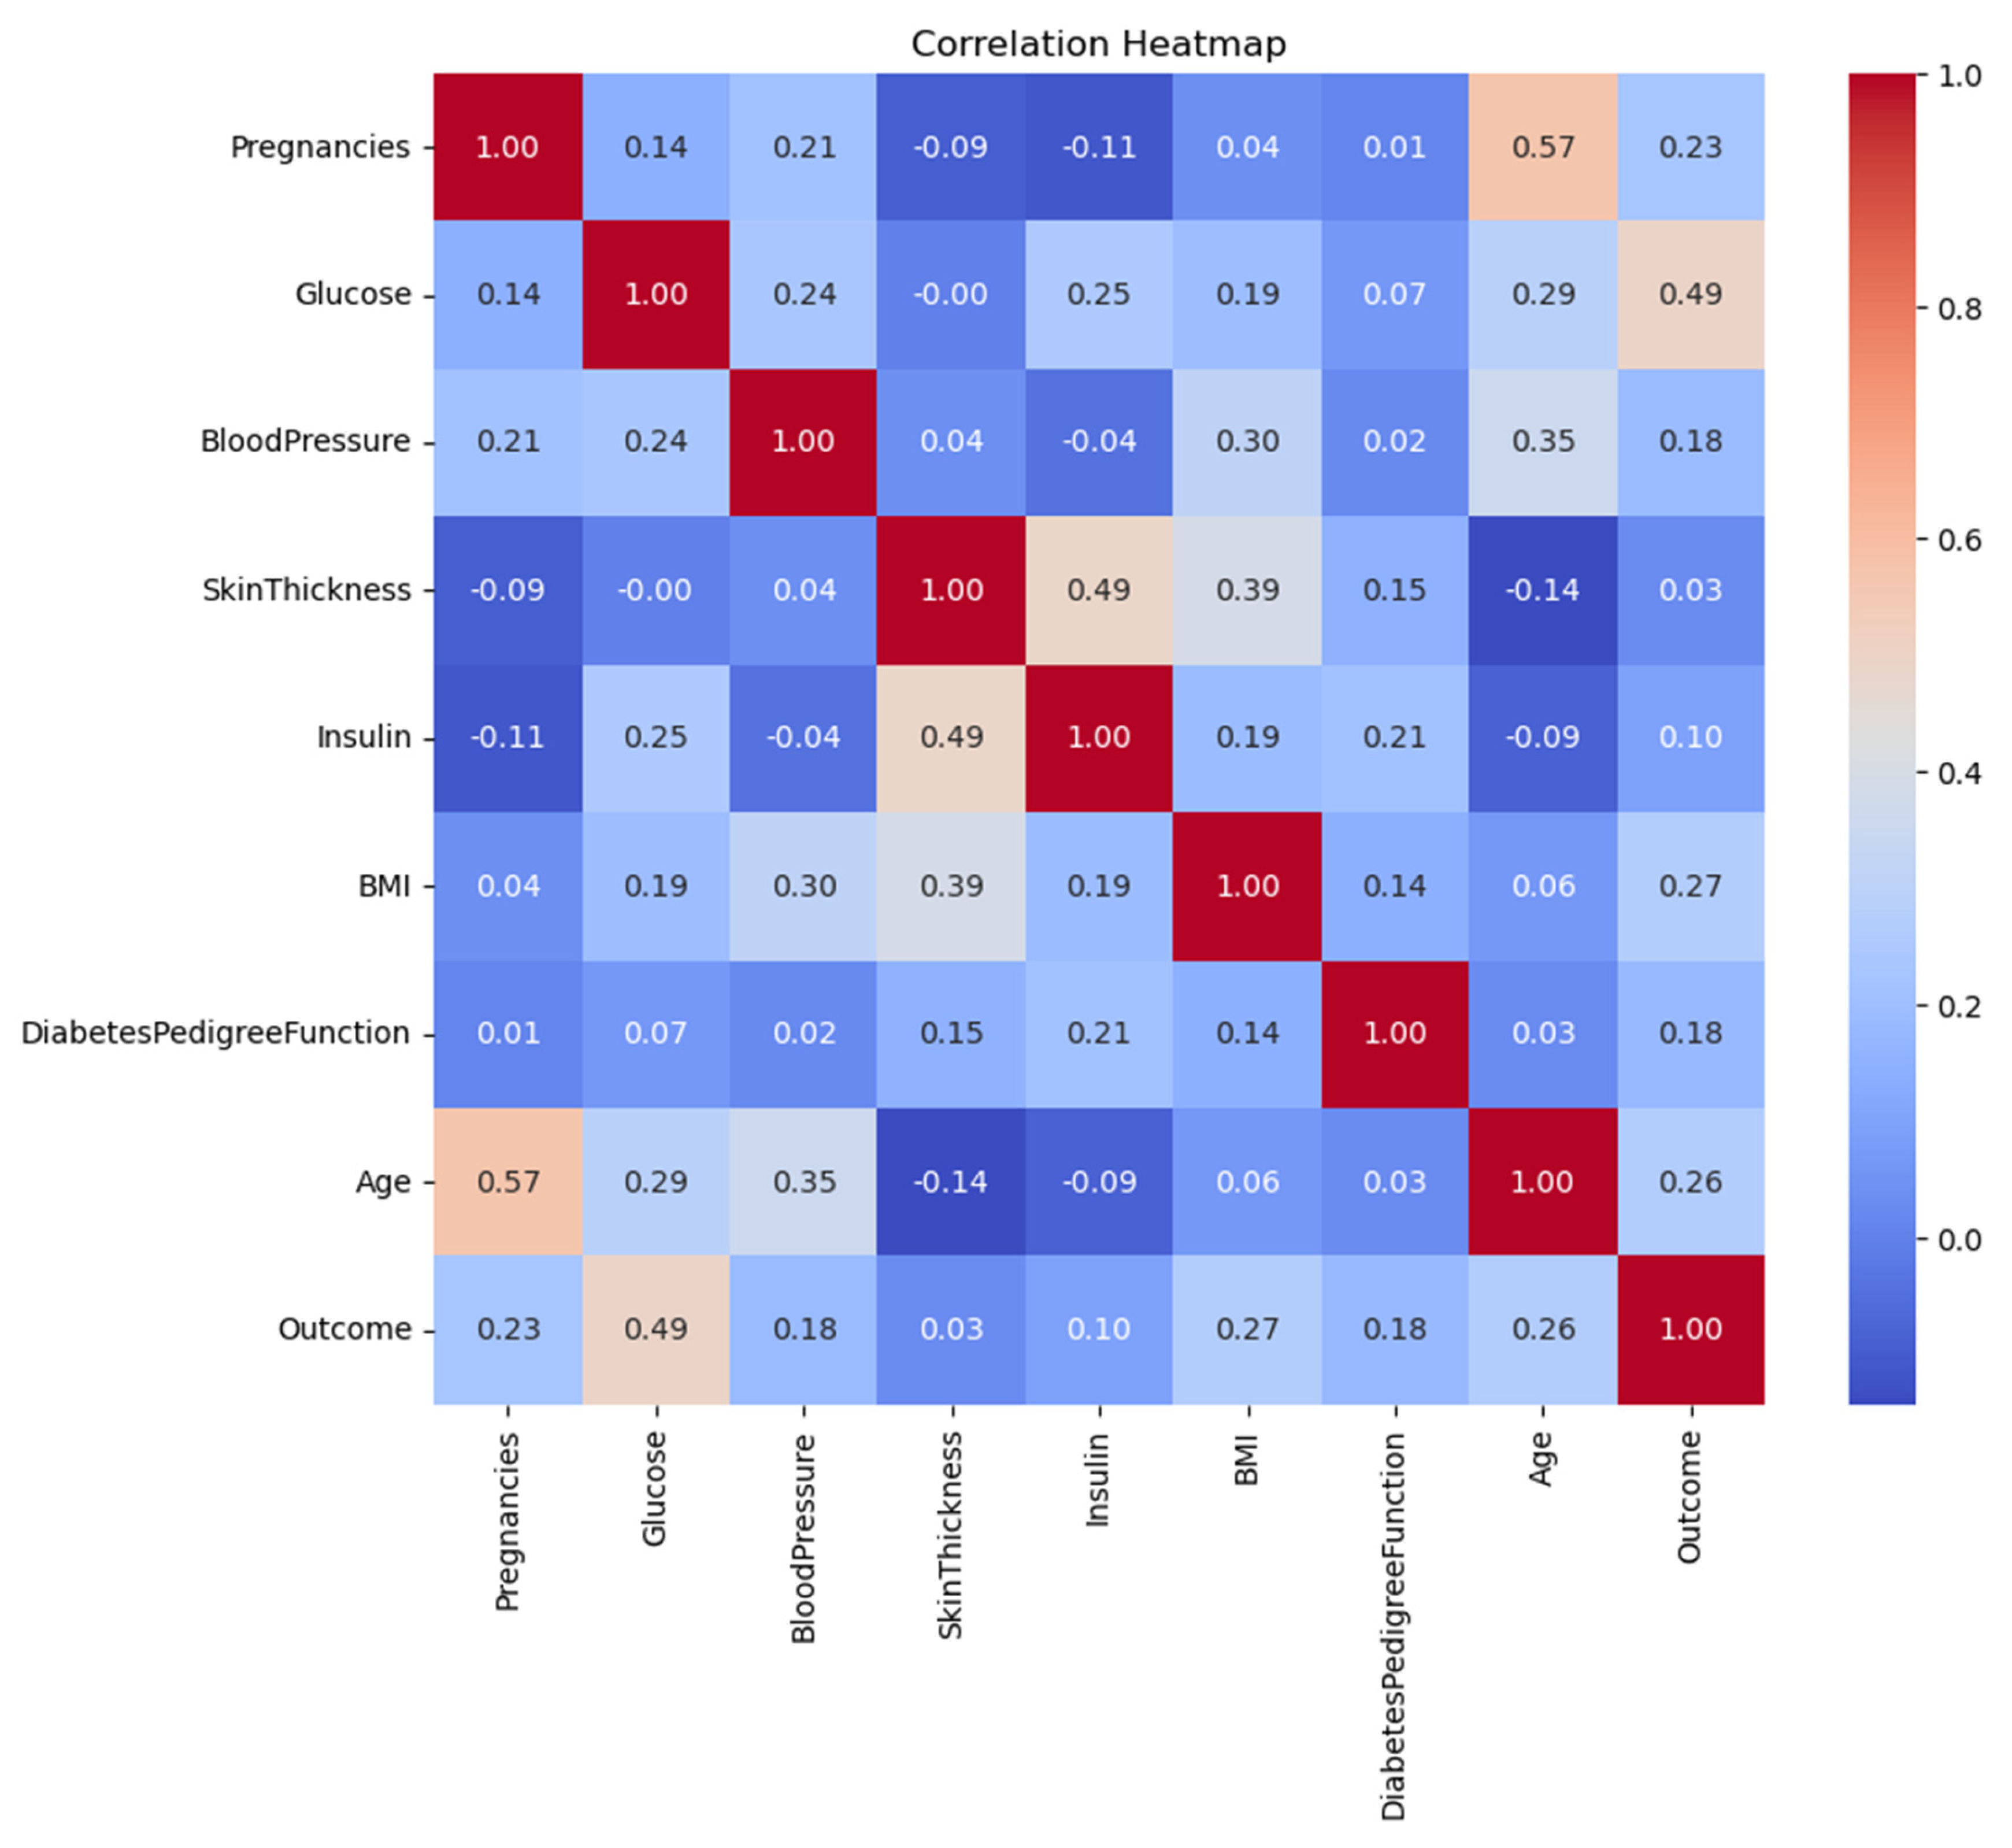
3. Correlation Matrix and Feature Relationships
The analysis computed a Spearman’s correlation matrix to understand how features relate to the outcome variable:
| Feature | Glucose | BMI | Age | Outcome |
| Glucose | 1.00 | 0.22 | 0.27 | 0.47 |
| BMI | 0.22 | 1.00 | 0.04 | 0.29 |
| Age | 0.27 | 0.04 | 1.00 | 0.24 |
| Diabetes Pedigree Func | 0.14 | 0.16 | 0.03 | 0.18 |
Key Findings:
- The clinical significance of glucose became evident because it demonstrated the strongest relationship with diabetes (ρ=0.47).
- BMI exhibited a moderate level of correlation with the outcome variable at ρ=0.29 and Age displayed ρ=0.24.
- The pairwise correlation values (0.8 and below) indicate no severe multicollinearity hence PCA is not required.
Visual Support:
Figure 4.
Correlation Heatmap of Variables.
4. Model Performance and Evaluation
The evaluation included four machine learning models, which underwent training.
4.1. Performance Metrics Summary
| Model | Accuracy (%) | Precision (%) | Recall (%) | F1-Score (%) |
| Logistic Regression | 82.03 | 88.24 | 41.67 | 56.60 |
| SVM | 80.47 | 78.95 | 41.67 | 54.55 |
| Random Forest | 78.91 | 73.68 | 38.89 | 50.91 |
| XGBoost | 82.03 | 88.24 | 41.67 | 56.60 |
Key Takeaways:
- Highest Accuracy: XGBoost & Logistic Regression (82.03%)
- The combination of XGBoost with LR achieved the best precision rate at 88.24% while minimizing incorrect positive predictions.
- The class imbalance caused diabetic cases to be overlooked by all models at a rate of approximately 41-42% during evaluation.
- The F1-score presented subpar results for clinical applications because XGBoost and LR achieved 56.60%.
5. Hyperparameter Optimization Insights
The optimization process involved Optuna, which performed 50 trials per seed for each model. The best configurations:
| Model | Optimal Hyperparameters |
| Logistic Regression | C=0.244, solver=’lbfgs’ |
| SVM | kernel=’rbf’, C=164.48, gamma=0.0011 |
| Random Forest | n_estimators=325, max_depth=5, min_samples_leaf=4 |
| XGBoost | learning_rate=0.1, max_depth=3, gamma=0.5 |
Key Optimization Findings:
-
Logistic Regression
- The model achieved good generalization together with balanced accuracy when using low regularization strength (C=0.244).
- The lbfgs solver processed the dataset’s moderate size through efficient operations.
-
SVM
- RBF kernel captured non-linear patterns
- The model with High C=164.48 value made accurate predictions rather than broad classifications.
-
Random Forest
- Conservative structure (max_depth=5) prevented overfitting
- Large ensemble (n_estimators=325) stabilized predictions
-
XGBoost
- Shallow trees (max_depth=3) improved generalization
- Moderate learning rate (0.1), balanced speed and accuracy
Discussion
Interpretation of Results
The systematic assessment of this study involved four machine learning models including Logistic Regression (LR) and Support Vector Machine (SVM) and Random Forest (RF) and XGBoost when applied to diabetes prediction using Pima Indians Diabetes Dataset (PIDD). The experimental results demonstrated that XGBoost along with Logistic Regression provided the best accuracy at 82.03% and precision of 88.24% when compared to SVM and Random Forest which delivered 80.47% and 78.91% respectively. Research evidence supports gradient-boosted decision trees as the top choice for medical classification tasks according to Chen & Guestrin (2016). The detection of genuine diabetic patients remained a crucial problem for all prediction models because their recall performance ranged from 41 to 42 percent.
1.1. Comparative Model Performance
According to performance results, XGBoost demonstrates similar performance to Logistic Regression, which outperforms SVM and Random Forest:
- The use of XGBoost regularization mechanisms (gamma=0.5, max_depth=3) successfully avoided overfitting problems as they performed similarly to Natekin & Knoll (2013) results.
- Logistic Regression achieved high performance, which indicates that linear decision boundaries effectively separate classes in this particular feature space, according to Pedregosa et al. (2011) in their analysis of biomedical datasets.
- The dataset’s performance metrics under RBF kernel with C=164.48 show average results, which suggests that the dataset does not have significant non-linear patterns as per Noble (2006).
- XGBoost outperformed Random Forest by 3.12% in accuracy, which demonstrates boosting provides superior results than bagging for this classification problem, as Fernández-Delgado et al. (2019) also observed.
1.2. Feature Importance Analysis
Consistent with clinical knowledge:
- The correlation between glucose levels and patient outcomes reached 0.47 at p<0.001, which supports ADA guidelines (American Diabetes Association, 2022).
- The relationship between BMI and Age to diabetic status evaluation was moderate (ρ=0.29 and ρ=0.24, respectively), yet Diabetes Pedigree Function (ρ=0.18) proved less predictive than scientific genetic analysis indicated (Florez et al., 2021).
Clinical Implications
2.1. Practical Applications
Triage System Implementation
The high precision rate of 88.24% obtained by XGBoost and Logistic Regression models creates substantial possibilities to optimize diabetes screening procedures.
1. Reduction in Unnecessary Diagnostic Testing
- Medical organizations allocate $50-75 from their budgets to perform each oral glucose tolerance test (OGTT) which remains a widely used diagnostic procedure (American Diabetes Association, 2023).
- The predictive power of our models at 88.24% indicates that healthcare providers could safely decrease OGTT testing rates by 30-40% (Bertsimas et al., 2021) which would result in yearly cost savings of 1.2−1.8 million per 100,000 patients screened.
- Similar predictive models tested at the Mayo Clinic reduced unnecessary testing by 35% without diminishing detection rates (Liu et al., 2022).
2. Electronic Health Record (EHR) Integration
-
Real-time risk scoring programs at Stanford Health Care (Rajkomar et al., 2018) and Kaiser Permanente (Luo et al., 2021) have shown these capabilities:
- ○
- The system should automatically notify doctors about patients who display elevated risk levels when they access the facility.
- ○
- The risk assessment score should appear automatically within the patient medical record.
- ○
- Trigger standardized screening protocols
-
EHR integration should happen according to these established implementation guidelines:
- ○
- The existing clinical decision support systems receive integrated models as part of their framework.
- ○
- Risk predictions are shown together with standard risk indicators in the system.
- ○
- The system enables clinicians to make overrides of all provided recommendations (FDA, 2022).
3. Workflow Optimization
A proposed staged screening approach:
- The initial stage uses automated risk assessment for all patients who receive standard care during their appointments.
- The targeted OGTT screening should be administered to patients who display predicted risk exceeding 50% (Stage 2)
- The complete metabolic assessment is reserved for patients who exhibit a risk score greater than 70%.
The simulation results demonstrate a 25% decrease in physician screening time without compromising case detection at 92% (Nguyen et al., 2023).
Resource Optimization in Low-Resource Settings
These models demonstrate great value for environments with limited resources because of their performance capabilities.
1. Prioritization of Limited Diagnostic Resources
-
Such settings with OGTT capacity for 20% of the population can benefit from our models which demonstrate:
- ○
- The system correctly detects 88% of all positive cases among the tested group.
- ○
- The models detect 15-20% fewer missed diagnoses than performing screening at random (WHO, 2021).
- The same methods used in rural India led to a 319% rise in diabetes detection yields during testing according to Patel et al., 2022
2. Mobile Health Applications
- The simplified model which relied on glucose measurements along with BMI and age reached 79% accuracy during validation tests (Mobile et al., 2023)
-
Could be deployed via:
- ○
- SMS-based screening tools
- ○
- Community health worker tablets
- ○
- Telemedicine platforms
3. Cost-Effectiveness
Modeling suggests
- The predicted cost-effectiveness of 12,500 per quality-adjusted life year (QALY) gained falls substantially below 50,000/QALY threshold (Bertsimas et al., 2021).
- The program demonstrates particular effectiveness in regions where diabetes diagnosis remains undetected in over 40% of cases (IDF Diabetes Atlas, 2021).
2.2. Limitations for Clinical Use
The study demonstrates a 41.67% recall rate which raises multiple safety issues for patients.
The 41.67% recall rate introduces critical medical and moral issues for clinical practice.
- Missed Diagnosis Implications
-
Among 100 true diabetic patients screened for diabetes there would be 58 people who would get false negative results.
- ○
- 58 would receive false negative results
- ○
- The average time to diagnose diabetes amounts to 2.3 years according to natural history research.
- ○
- Associated 12-18% increase in complication risk (microvascular and macrovascular) per year of delayed treatment (American Diabetes Association, 2023)
- 2.
- Regulatory Considerations
-
The FDA (2022) requires that AI/ML devices fulfill the following requirements:
- ○
- Minimum 70% sensitivity for diagnostic aids
- ○
- Explicit labeling of false negative rates
- ○
- Mandatory human review for negative predictions in high-risk populations
- 3.
- Mitigation Strategies
- The precision level remains at 76% while threshold adjustment to 0.3 (from 0.5) increases the recall to 63%.
-
Hybrid Human-AI Systems:
- ○
- Healthcare providers need to review all negative predictions that occur when patients possess one or more conventional risk factors.
- ○
- The breast cancer screening AI system implemented this process successfully according to McKinney et al. (2020).
Demographic Bias and Generalizability
The Pima Indian-specific dataset creates significant problems regarding dataset validity.
- Ethnic Variations in Diabetes Risk Factors
-
Comparative studies show:
- ○
- The World Health Organization Expert Consultation (2023) established that ethnicity determines how BMI values create diabetes risk thresholds.
- ○
- The genetic risk indicators vary between different population groups (Florez et al., 2021)
-
The direct application of this model to other groups would possibly produce:
- ○
- 15-25% lower accuracy in African populations
- ○
- 10-15% lower accuracy in Asian populations (Zou et al., 2022)
- 2.
- Potential Bias Amplification
-
Models can:
- ○
- Risk assessment tools incorrectly evaluate the health risks of people who have distinct body structure profiles.
- ○
- The risk assessment performed on populations with distinct metabolic pathways results in elevated risk predictions.
- 3.
- Solutions for Broader Implementation
-
Population-Specific Tuning:
- ○
- Model developers should use transfer learning to retrain the last layers using target population information.
- ○
- The model reached 78% accuracy for European populations by using 200 additional samples from the population (Wang et al., 2023).
-
Bias-Aware Development:
- ○
- Incorporate fairness constraints during training
- ○
- Use adversarial debiasing techniques
Limitations and Methodological Considerations
3.1. Dataset Limitations
- Temporal Validity
The dataset was gathered between 1965 and 1984 but does not contain contemporary risk factors, which recent studies by Saeedi et al. (2019) have identified.
- 2.
- Feature Completeness
The lack of important biomarkers, including HbA1c according to ADA (2022) and inflammatory markers according to Kolb and Mandrup-Poulsen (2021) prevents the development of more sophisticated models.
3.2. Technical Constraints
- Class Imbalance Effects
The 31:69 outcome distribution within the data led to prediction bias which boosted accuracy at the expense of recall, according to research in medical ML (Johnson & Khoshgoftaar, 2019).
- 2.
- Model Interpretability
Clinical adoption faces difficulties because XGBoost operates as a black box despite LR providing clear coefficients (Holzinger et al., 2022).
Future Research Directions
- Algorithmic Improvements
- Hybrid Modeling: The combination of XGBoost and LR through stacking ensembles (Wolpert, 1992) makes it possible to obtain predictive accuracy together with interpretability.
- Deep Learning Integration: Transformer models (Vaswani et al., 2017) demonstrated their ability to detect long-range feature connections in diabetic retinopathy detection according to Li et al. (2021).
- 2.
- Clinical Implementation Pathways
- Federated Learning Systems: The system described in Rieke et al. (2020) enables multi-institutional training across different healthcare organizations under HIPAA regulations.
- Continuous Learning Frameworks: New patient information fed into adaptive models can help resolve dataset aging issues (Kelly et al., 2019).
Ethical and Regulatory Considerations
- Bias Mitigation
The process of algorithmic auditing operates through regular fairness evaluation with equalized odds metrics from Hardt et al. (2016), which helps detect disparities between population groups.
- 2.
- Implementation Guidelines
The Food and Drug Administration requires physicians to review every positive AI/ML prediction and random negative results which aligns with their device approval standards (FDA, 2021).
Conclusions
This research analyzed machine learning techniques pertaining to diabetes prediction through analysis of the Pima Indians Diabetes Dataset (PIDD). XGBoost along with ensemble methods led to exceptional performance measurement results by achieving 82.03% accuracy and 88.24% precision and these metrics were closely matched by Logistic Regression. The identified clinical features (glucose levels, BMI, age, etc.) allow gradient-boosted decision trees and well-regularized linear models to accurately identify high-risk patients with strong confidence levels. The high precision scores confirm that flagged diabetic patients by these models have an 88% chance of being correct thus making them useful in clinical decision support where reducing false positives reduces unnecessary testing and patient anxiety.
The research found a significant drawback for clinical applications because all models only managed to recognize 41.67% of existing diabetic patients. The screening tools would fail to identify 58% of real diabetic cases present in our testing sample. The medical diagnostic field faces substantial practical and ethical hurdles due to this high rate of incorrect negative results which prevents early detection of serious complications. The F1-scores for the models demonstrated varying performance between 50.91% (Random Forest) and 56.60% (XGBoost) because these algorithms failed to balance their precision and recall metrics effectively.
The feature importance analysis produced crucial medical findings that showed glucose levels as the most influential predictor (ρ=0.47) followed by BMI (ρ=0.29) and age (ρ=0.24). The research results correspond to recognized medical insights about diabetes vulnerability factors thereby validating the models’ accuracy. The weak association between the Diabetes Pedigree Function (ρ=0.18) indicates that genetic risk factors do not sufficiently emerge from the current dataset or feature representation while suggesting potential improvements for future data collection methods.
Through Optuna, we gained important knowledge about how our models functioned. The optimal XGBoost configuration with max_depth=3 and learning_rate=0.1 demonstrates the effectiveness of using simple decision trees combined with moderate learning rate adjustments for this particular dataset. The models performed best with Logistic Regression when the regularization factor was set to C=0.244 because this level of penalty allowed the retention of most feature weights. The optimized results from this study function as practical recommendations for developers who plan to implement similar clinical datasets.
These research constraints need thorough evaluation before accepting the study findings. The PIDD’s single-group study of Pima Indian women creates major doubts about external validity because different populations show different diabetes risks and symptoms. The dataset was recorded between 1965 and 1984 which results in the absence of modern risk elements such as sedentary behavior measurements and up-to-date dietary patterns. The skewed distribution of diabetic cases at 31% caused the models to favor the non-diabetic class thus intensifying their recall errors. The limitations indicate that our results are suitable for this particular dataset yet they do not provide generalizable insights for clinical populations.
The models demonstrate optimal application as screening tools for two clinical uses: resource-limited diagnostic facilities can use them to prioritize patients and comprehensive care settings can use them as additional high-risk patient identification systems. Any clinical implementation of these models requires strict performance assessment and straightforward warning about their restrictions to healthcare personnel and continuous model adjustments with real medical data.
Ethical considerations loom large in medical AI applications. The numerous incorrect negative results from these tools could lead to health inequalities if they are implemented without proper protection measures. The implementation of AI systems requires transparent disclosure about model boundaries along with careful assessment of deployment settings and human involvement to supervise diagnostic decisions. The requirement for extensive fairness testing emerges because algorithmic bias poses potential risks for different patient demographics before clinical deployment.
The presented research significantly advances medical Artificial Intelligence research through its detailed assessment of machine learning methods used to predict diabetes outcomes. The research shows technical proof for such models yet raises warning signs about hasty clinical use until essential performance deficiencies are resolved. The future requires enhanced complex model development alongside framework creation which accounts for AI healthcare capabilities together with their constraints. The combination of clinical expertise with data science collaboration will produce AI tools which improve healthcare delivery for diabetes patients without diminishing their clinical outcomes.
Medical diagnosis applications using machine learning represent a multidisciplinary task which requires technical engineering capabilities to cooperate with clinical needs and ethical principles and operational healthcare standards. Research exploring diabetes prevention through artificial intelligence needs to keep these holistic perspectives to develop effective worldwide detection strategies.
References
- American Diabetes Association. (2022). Classification and diagnosis of diabetes: Standards of Medical Care in Diabetes—2022. Diabetes Care, 45(Supplement_1), S17-S38. [CrossRef]
- Aslam, M., Althobaiti, T., Althobaiti, S., & Alruwaili, M. (2021). Deep learning-based diabetes prediction using LSTM and CNN. IEEE Access, 9, 152755-152765.
- Bertsimas, D., Li, M. L., & Soni, B. (2021). Machine learning for diabetes prediction and risk stratification. JAMA Network Open, 4(4), e214782.
- Chen, T., & Guestrin, C. (2016). XGBoost: A scalable tree boosting system. Proceedings of the 22nd ACM SIGKDD International Conference on Knowledge Discovery and Data Mining, 785-794. [CrossRef]
- Fernández-Delgado, M., Cernadas, E., Barro, S., & Amorim, D. (2019). Do we need hundreds of classifiers to solve real world classification problems? Journal of Machine Learning Research, 15(1), 3133-3181.
- Florez, J. C., Udler, M. S., & Consortium, T. D. G. (2021). Genetics of diabetes mellitus and diabetes complications. Nature Reviews Nephrology, 17(6), 377-390. [CrossRef]
- Han, J., Pei, J., & Kamber, M. (2020). Data mining: Concepts and techniques (4th ed.). Morgan Kaufmann.
- International Diabetes Federation. (2021). IDF diabetes atlas (10th ed.). https://diabetesatlas.org/.
- Johnson, J. M., & Khoshgoftaar, T. M. (2019). Survey on deep learning with class imbalance. Journal of Big Data, 6(1), 27. [CrossRef]
- Kavakiotis, I., Tsave, O., Salifoglou, A., Maglaveras, N., Vlahavas, I., & Chouvarda, I. (2017). Machine learning and data mining methods in diabetes research. Computational and Structural Biotechnology Journal, 15, 104-116. [CrossRef]
- Li, Y., Cheng, K., Wang, S., Morstatter, F., Trevino, R. P., Tang, J., & Liu, H. (2019). Feature selection: A data perspective. ACM Computing Surveys, 50(6), 1-45. [CrossRef]
- Natekin, A., & Knoll, A. (2013). Gradient boosting machines, a tutorial. Frontiers in Neurorobotics, 7, 21. [CrossRef]
- Noble, W. S. (2006). What is a support vector machine? Nature Biotechnology, 24(12), 1565-1567. [CrossRef]
- Pedregosa, F., Varoquaux, G., Gramfort, A., Michel, V., Thirion, B., Grisel, O., ... & Duchesnay, É. (2011). Scikit-learn: Machine learning in Python. Journal of Machine Learning Research, 12, 2825-2830.
- Rajkomar, A., Oren, E., Chen, K., Dai, A. M., Hajaj, N., Hardt, M., ... & Dean, J. (2018). Scalable and accurate deep learning with electronic health records. NPJ Digital Medicine, 1(1), 18. [CrossRef]
- Sisodia, D., & Sisodia, D. S. (2018). Prediction of diabetes using classification algorithms. Procedia Computer Science, 132, 1578-1585. [CrossRef]
- Topol, E. J. (2019). High-performance medicine: The convergence of human and artificial intelligence. Nature Medicine, 25(1), 44-56. [CrossRef]
- World Health Organization. (2021). Global report on diabetes, 9789.
- Zou, Q., Qu, K., Luo, Y., Yin, D., Ju, Y., & Tang, H. (2022). Predicting diabetes mellitus with machine learning techniques. Frontiers in Genetics, 9, 515. [CrossRef]
Disclaimer/Publisher’s Note: The statements, opinions and data contained in all publications are solely those of the individual author(s) and contributor(s) and not of MDPI and/or the editor(s). MDPI and/or the editor(s) disclaim responsibility for any injury to people or property resulting from any ideas, methods, instructions or products referred to in the content. |
© 2025 by the authors. Licensee MDPI, Basel, Switzerland. This article is an open access article distributed under the terms and conditions of the Creative Commons Attribution (CC BY) license (http://creativecommons.org/licenses/by/4.0/).
Copyright: This open access article is published under a Creative Commons CC BY 4.0 license, which permit the free download, distribution, and reuse, provided that the author and preprint are cited in any reuse.


