Submitted:
18 April 2025
Posted:
21 April 2025
You are already at the latest version
Abstract
As China's electric vehicle (EV) market transitions from rapid growth to high-quality development, competition among brands is shifting from purely technological aspects to more holistic expressions involving spatial design and brand positioning. This study investigates the coupling mechanism between spatial aesthetics and brand positioning and its influence on consumer purchase intention. Drawing on Gibson’s theory of spatial aesthetics and the Technology Acceptance Model (TAM), we develop a theoretical framework integrating perceived usefulness and perceived ease of use of spatial aesthetics with brand cognition. Empirical analysis is conducted using coupling coordination degree modeling and multiple regression, based on 1,576 valid questionnaires collected from 4S dealerships of nine major EV brands in China. The results indicate that spatial aesthetic elements—such as environmental visual flow, invariance, and affordance—positively affect consumers’ perceptions of technology and brand recognition. Furthermore, the degree of coupling between spatial aesthetics and brand positioning perceptions significantly enhances purchase intention, particularly among consumers of safety-oriented and luxury EV models. These findings confirm the synergistic effect of spatial experience and brand strategy in shaping consumer behavior, enriching theoretical understanding of EV consumer psychology and offering practical guidance for strategic decision-making in product design and brand communication.
Keywords:
Electric vehicle
; Spatial aesthetics
; Brand positioning
; Purchase intention
; Technology acceptance model
; Coupling coordination degre
1. Introduction
China's electric vehicle market has experienced vigorous growth in recent years, becoming a leader in the global electric vehicle industry. According to data from the China Association of Automobile Manufacturers, in 2023, China's new energy vehicle production reached 9.587 million units, and sales reached 9.495 million units, representing year-on-year increases of 35.8% and 37.9%, respectively, and accounting for over 60% of global production and sales. Specifically, production and sales of pure electric vehicles were 6.704 million and 6.685 million, respectively, marking year-on-year increases of 22.6% and 24.6%. This growth is evident not only in the domestic market but also internationally. In 2023, China's new energy vehicle exports reached 1.203 million units, a year-on-year increase of 77.2%, reaching a record high. Regarding market penetration, in the first half of April 2024, the retail penetration rate of new energy passenger vehicles in China exceeded 50% for the first time, reaching 50.39%, indicating a further increase in the acceptance and popularity of new energy vehicles in the Chinese market.123 This trend demonstrates a continuously improving consumer recognition of new energy vehicles.
Technological innovation is also a key factor driving market growth. For example, BYD claims that its electric vehicles can be charged in five minutes, increasing the driving range by approximately 470 kilometers, a technological advancement that surpasses competitors such as Tesla and Mercedes-Benz. Furthermore, Xiaomi has also achieved breakthroughs in the electric vehicle sector, with its first model, the SU7, experiencing significant market popularity and a six-month order backlog.4
The aforementioned trends highlight the booming Chinese electric car market and indicate that the industry is transitioning from high-speed growth to a new phase of high-quality development. As the market continues to expand, competition among companies intensifies, with price wars, technological upgrades, and brand competition becoming crucial variables in the industry's evolution. Domestic brands, such as BYD and Xiaomi, are reshaping the global new energy vehicle market's competitive landscape through technological breakthroughs in power batteries, intelligent driving, and vehicle manufacturing. 5However, as the industry matures, the slowdown in market growth and the compression of profit margins are becoming increasingly significant concerns, leading more car dealerships to shift their competitive focus from electric vehicle technology to spatial design and brand positioning.
Compared to the era of traditional fuel vehicles, new energy vehicles are now seen as more than just transportation; they are mobile living spaces. Consequently, their spatial design aesthetics have evolved beyond purely functional layouts to encompass a comprehensive consideration of technology, comfort, and personalized experiences. This trend is closely linked to modern consumers' aesthetic demands for automobiles and evolving lifestyles. Particularly with the rise of intelligence and connectivity in new energy vehicles, the interior space has become a key competitive area for car companies to showcase brand value and shape the user experience.
Currently, most scholarly research remains primarily focused on the technical aspects of new energy vehicles, particularly power battery performance optimization, intelligent driving technology development, energy consumption management, and the integration of new energy vehicle-mounted systems. Academia generally believes that the core competitiveness of the new energy vehicle industry hinges on technological breakthroughs. Therefore, a significant amount of research revolves around improving power battery energy density, enhancing fast charging technology, and optimizing intelligent network connection systems to explore ways to further improve electric vehicle range, charging convenience, and intelligent driving experience. However, compared to this in-depth exploration of technical aspects, research on the coupling relationship between consumer behavior, brand positioning, and spatial aesthetics remains in its early stages, and a systematic theoretical framework has yet to be established.
In the field of consumer behavior research, existing literature primarily focuses on consumer acceptance of new energy vehicles, the impact of government subsidy policies on purchase intention, and the role of charging infrastructure deployment on market penetration. For example, some studies have explored issues such as consumer risk perception regarding new energy models, brand loyalty, and the rational versus emotional trade-offs in the car-buying decision process.6 However, compared to consumer psychology research in the traditional automotive industry, the consumer decision-making logic in the new energy vehicle market is more complex, involving multiple variables such as environmental awareness, technology acceptance, and the demand for intelligent experiences. Consequently, academia has not yet fully explored the role of spatial aesthetics in brand building and consumer decision-making.7
The impact of the coupling between brand positioning and spatial aesthetics in electric vehicles on consumer purchase behavior has also been largely overlooked. In the era of traditional fuel vehicles, brand positioning often revolved around technical specifications such as power performance, handling, and safety. However, in the electric vehicle market, shaping the brand image is increasingly focused on a sense of technology, futuristic aesthetics, and intelligent, interconnected user experiences. New energy vehicle brands such as BYD, NIO, and Xpeng have incorporated "technological aesthetics" into their brand strategies, building brand identification through spatial design aesthetics. 8Nevertheless, existing research lacks a systematic theoretical explanation and empirical data to support how spatial design influences consumer brand awareness, how in-car layout enhances brand premium, and how spatial aesthetics shapes the user experience.
Spatial aesthetics is playing an increasingly prominent role in consumer decisions regarding new energy vehicles. However, existing academic research on this issue remains relatively fragmented. Some studies address the impact of in-car colors, materials, and cockpit layout on user experience, but these often approach the topic from the perspective of industrial design or ergonomics, rather than offering an in-depth analysis from a marketing or consumer psychology standpoint. As the new energy vehicle market matures, consumer purchase decisions are no longer solely reliant on technical specifications, but increasingly prioritize the overall spatial atmosphere, brand tone, and personalized experience of the vehicle. Nevertheless, academia has yet to thoroughly explore how the spatial design of electric vehicles can be effectively coupled with brand positioning to influence consumer purchase intention.
2. Theoretical Research and Research Hypotheses
2.1. Theoretical Research
- (1) Gibson's Spatial Aesthetics
Gibson's ecological psychology theory emphasizes the dynamic relationship between perception and the environment. His aesthetic concept revolves around “affordance,” arguing that spatial design not only affects visual perception but also directly shapes individual behavior and interactive experiences.9
Figure 1 illustrates Gibson's Spatial Aesthetics Framework. Gibson's spatial aesthetics theory, based on the fundamental framework of perceptual ecology, emphasizes the direct interaction between the environment and the individual. From this theoretical perspective, space is not a passive background but profoundly influences individuals through its affordances, invariances, and visual flow, thereby shaping perception, cognition, and ultimately, behavioral experience.
Figure 1.
Gibson's Spatial Aesthetics Framework.
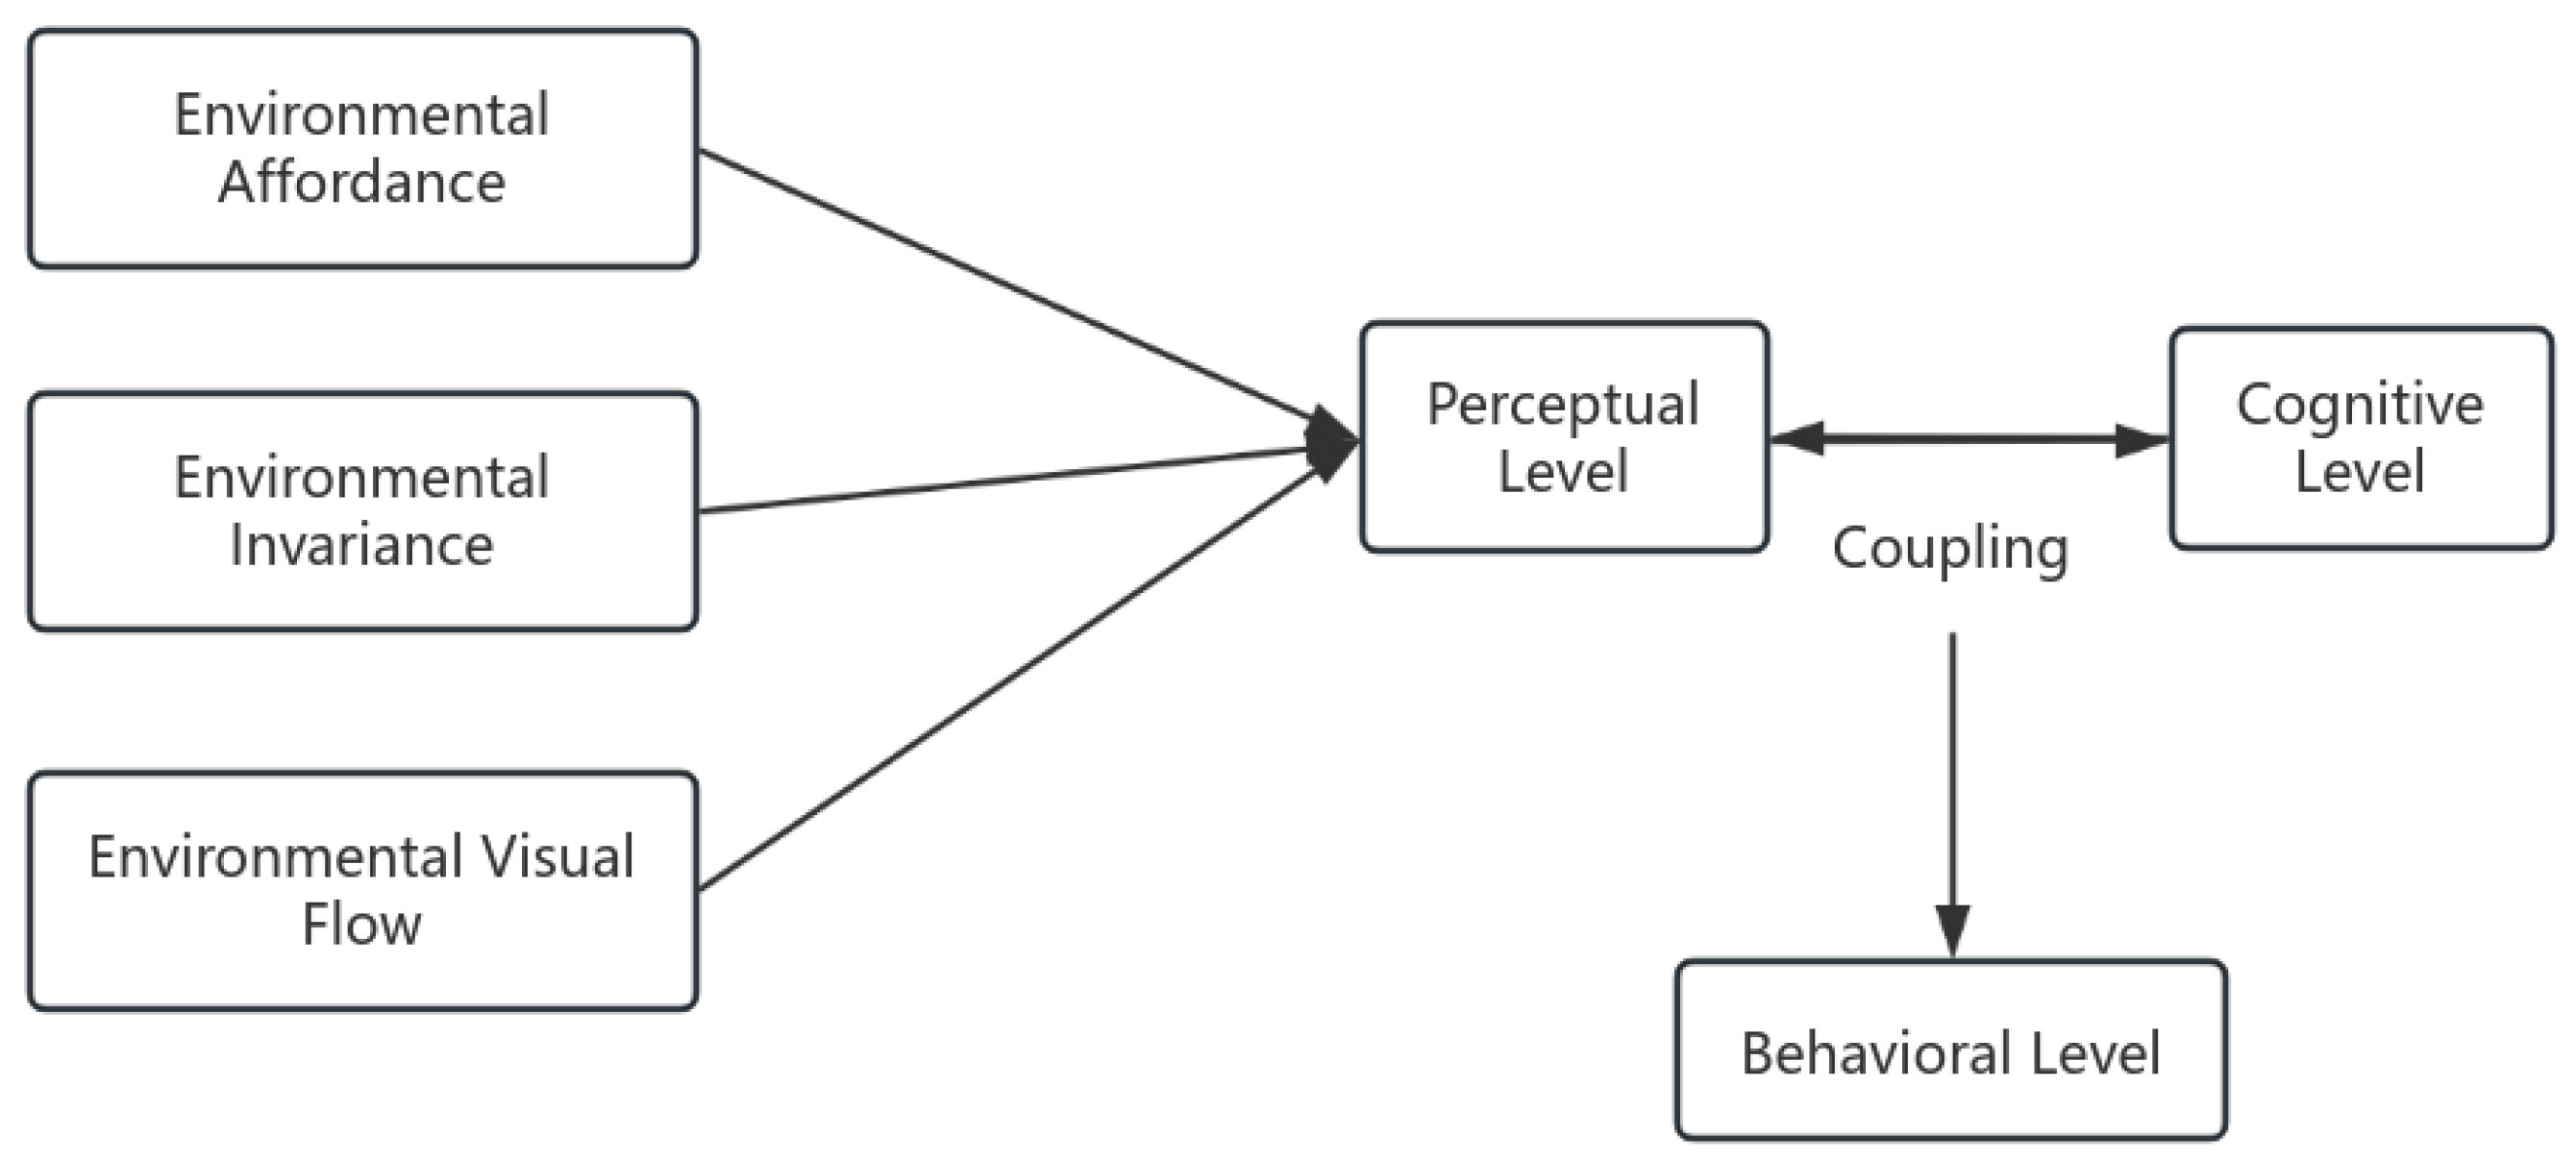
Within Gibson's theoretical framework, affordance is a core concept for understanding spatial aesthetic experiences.In the field of spatial aesthetics, subsequent scholars have extended Gibson’s theory of direct perception by emphasizing that the design of physical spaces should account not only for visual appeal but also for users’ potential behaviors. Elements such as form, material, scale, light, shadow, and spatial layout collectively shape affordance, thereby influencing how individuals interact with their environment. 10The notion of sensory architecture deepens the understanding of spatial experience by asserting that architecture is not merely a visual art form but a multisensory construct that engages touch, hearing, and kinesthesia. The aesthetic value of a space lies in how it guides bodily perception and behavioral responses.11 In museum exhibition design, for instance, the flow and arrangement of exhibits shape visitors’ touring paths and viewing rhythms, thereby influencing the overall aesthetic experience. This perspective reveals that spatial beauty emerges not solely from visual elements but from the dynamic interaction between perception and action. 12Spatial experience is generated less through cognitive reasoning than through immediate responses to environmental information. Thus, spatial design influences not only how people see but more significantly how they act, a view widely applied in architectural and urban design. Factors such as openness, accessibility, and seating arrangements in public urban spaces directly affect social interaction patterns, with aesthetic value reflected in how these spaces stimulate activity and provide comfort.In contemporary digital spaces and interaction design, Gibson’s aesthetic framework remains influential. 13Aesthetic experience in digital environments depends not only on graphic representation but also on how users interact with interfaces. The digital affordance of space determines ease of use and the degree of immersion. In applications such as virtual reality and augmented reality, designers must carefully consider user behavior in virtual space and enhance the aesthetic experience by optimizing spatial layout and interaction mechanisms. 14In game design, the aesthetic appeal of virtual environments is not solely a product of graphic quality but also of how the game world guides player actions and constructs immersive experiences through affordance.Gibson’s framework has also profoundly shaped environmental aesthetics by emphasizing that the human-nature relationship is constructed through affordance. While traditional aesthetic theories focus on the visual features of landscapes, Gibson’s approach posits that the perception of natural environments emerges through bodily movement and sensory engagement. 1516The aesthetic appreciation of elements such as mountains, rivers, and forests stems from how they guide physical movement and perceptual experiences. In landscape and garden design, factors such as path curvature, plant layering, and variations in light and shadow significantly affect visitors’ aesthetic engagement. Ecological aesthetics further asserts that effective landscape design should awaken intuitive perception of nature, enhance environmental awareness, and foster deeper concern for ecological change.17
Collectively, these explorations of affordance and spatial aesthetics highlight the multidimensional functions of spatial design in shaping bodily experience, guiding behavioral pathways, and stimulating ecological consciousness. They suggest a shift in the paradigm of aesthetic appreciation—from one grounded in visual observation to one deeply rooted in embodied perception and action.18
- (2) Technology Acceptance Model (TAM)
The Technology Acceptance Model (TAM) is a theoretical framework used to explain the psychological and behavioral processes individuals experience when adopting new technologies. Proposed by Fred D. Davis in the 1980s, TAM is based on the Theory of Reasoned Action by Fishbein and Ajzen. It posits that an individual's adoption of technology is a cognitive process influenced by perception, where perceived usefulness and perceived ease of use are key variables determining their attitude toward adoption and their ultimate usage behavior. 19TAM not only has theoretical value but is also widely used in practical applications to evaluate and optimize technology design. Businesses and technology developers can use the TAM framework to optimize the user experience in the early stages of product development, improve the perceived ease of use of the technology, and enhance users' perception of the benefits it offers, thereby promoting its adoption and wider use. Therefore, this theory has a significant impact in fields such as information technology, business management, and educational technology, and provides a systematic analytical tool for user behavior research.20
As shown in Figure 2, the core structure of the TAM comprises five key components: external factors, perceived ease of use of spatial aesthetics, perceived usefulness of spatial aesthetics, intention to use, and ultimate usage behavior. External factors are significant variables influencing user cognition, including the technology's design characteristics, social environment, organizational support, training resources, and the user's prior experience.21 These factors indirectly affect technology usage behavior by influencing the user's perceived ease of use and perceived usefulness of spatial aesthetics. Perceived ease of use of spatial aesthetics refers to a user's subjective perception of the difficulty in operating the technology.2223 If the technology is easy to understand and use, users are more likely to accept it, further enhancing their recognition of its effectiveness. Perceived usefulness of spatial aesthetics is the core variable for users evaluating whether the technology can improve work efficiency or optimize their experience, directly determining their intention to use. If users believe the technology offers practical benefits, they are more likely to develop a strong intention to use, which is a key predictor of ultimate usage behavior. Once users establish a strong intention to use, they are more likely to translate it into actual usage behavior in real-world scenarios.24
The Technology Acceptance Model (TAM) provides a crucial theoretical foundation in consumer behavior research, explaining how consumers perceive and adopt new technological products. 25When adopting new technologies, consumers' decisions are influenced not only by the product's functional characteristics but also by factors such as the perceived usefulness of spatial aesthetics, the perceived ease of use of spatial aesthetics, and the social environment. 26Within this framework, consumers' purchase intention and subsequent purchase behavior are often dually influenced by their perception of the product's value and its ease of use. 27If consumers believe that a new technology enhances the user experience, improves efficiency, or provides additional convenience, their purchase intention is significantly strengthened. Simultaneously, if the product is easy to understand and operate, consumers are more likely to accept the technology and be willing to try or use it long-term. Research also indicates that the consumer's technology acceptance process involves not only individual cognitive factors but also the influence of social factors, brand trust, marketing promotion strategies, and the external environment.28 For example, recommendations from opinion leaders, the attitudes of social groups, and after-sales support provided by companies all affect consumers' trust in new technological products, thereby further influencing their purchase intention and continued usage. 29Therefore, successful technology promotion in the consumer market often requires optimizing the user experience, reducing usage costs, and incorporating marketing and consumer education to cultivate a favorable environment for acceptance.
In studies of electric car consumer behavior, the Technology Acceptance Model (TAM) is widely used to explain consumer acceptance and purchase decisions regarding new energy vehicles. As innovative technological products, the market acceptance of electric cars is influenced by several cognitive factors. The perceived utility of spatial aesthetics in this context is mainly reflected in consumer expectations regarding energy conservation, environmental protection, low operating costs, and an optimized driving experience. 30The perceived ease of use of spatial aesthetics relates to the convenience of charging infrastructure, the simplicity of driving operations, and the affordability of maintenance costs. Research indicates a strong correlation between consumer acceptance of electric cars and the perceived utility of spatial aesthetics, especially given increasing environmental awareness. Consumers are often more inclined to choose transportation options perceived to positively impact sustainable development. However, due to incomplete charging infrastructure and persistent range anxiety, the perceived ease of use of spatial aesthetics remains a significant factor for consumers. The acceptance of electric cars by many potential consumers is constrained by charging convenience and technological maturity.31 Furthermore, external factors play a key role in electric car consumer behavior. Government policies, subsidy incentives, tax breaks, and companies' marketing promotion strategies all influence consumer purchasing decisions. For example, government subsidies for car purchases can reduce the economic burden on consumers and increase the acceptability of the technology, while improvements to public charging networks can effectively reduce barriers to use, thereby enhancing consumers' willingness to adopt electric cars. Moreover, social identity is an important variable influencing electric car consumer behavior; electric cars often have higher adoption rates within technologically advanced groups or in socio-cultural environments with strong environmental awareness. 3233Therefore, the development of the electric car market requires not only technological optimization and improved price competitiveness, but also efforts to reduce barriers to adoption and increase consumer trust and acceptance of the technology through government policy support, social identity shaping, and consumer education. 34Overall, technology acceptance theory provides a systematic analytical framework for understanding consumer behavior and the electric car market. It helps to elucidate the psychological mechanisms involved in technology adoption and provides effective marketing and management strategies for relevant companies and policymakers.
2.2. Research Hypotheses
In the electric car market, consumers' purchasing decisions are influenced by multiple factors. Spatial aesthetics plays a significant role in shaping user perception, enhancing brand awareness, and increasing purchase intention. From the perspective of Gibsonian spatial aesthetics, environmental affordance, environmental invariance, and environmental visual flow collectively influence consumers' cognitive processes, enabling them to directly perceive the technical performance, ease of use, and brand image of electric cars. Environmental affordance determines whether the cockpit design meets user needs, considering aspects such as the steering wheel's grip, the seat's comfort, and the central control interface's intuitiveness. This directly affects consumers' perception of the product's practical value. Environmental invariance ensures the stability of information during driving, including the dashboard's readability, the consistency of the interface layout, and the constancy of spatial perception derived from light and materials. This allows users to maintain a clear understanding of product functions under varying driving conditions. Environmental visual flow affects consumers' spatial perception during dynamic driving, encompassing the visual feedback from speed changes, the comfort of light and shadow flow within the cockpit, and the overall driving immersion, thereby further shaping consumers' experience of the electric car's technological advantages and brand image.
Within this framework, consumer perception of electric cars is primarily reflected in two dimensions: perceived usefulness of spatial aesthetics and perceived ease of use of spatial aesthetics. Perceived usefulness of spatial aesthetics reflects whether users believe the product enhances the driving experience, optimizes travel efficiency, or reduces long-term operating costs. If the spatial aesthetic design provides improved driving comfort, convenient information interaction, and enhanced safety perception, consumers are more likely to perceive high use value in the product. Perceived ease of use of spatial aesthetics emphasizes the learning cost and intuitiveness for users operating the product. If the electric car's interior layout, intelligent interaction system, and driving assistance features offer a seamless and user-friendly experience, consumers are more likely to adapt to and accept the technology. Furthermore, brand positioning perception serves as a crucial bridge connecting consumer perception and purchase behavior. Brand positioning not only influences users' overall impression of electric car products but also affects whether their evaluation of the perceived usefulness and perceived ease of use of spatial aesthetics aligns with their expectations. For example, if a brand's core positioning is "high-end intelligent mobility" and the consumer experience aligns with this positioning, brand awareness will strengthen their purchase intention. Conversely, if there is a discrepancy between the brand positioning and the user's actual experience, it may reduce their trust in the product.
Within this logical framework, the rationality of spatial aesthetics not only directly influences users' perception of the product but also enhances their purchase intention through its coupling with brand positioning perception. Therefore, this study proposes the following research hypotheses:
H1: Spatial aesthetics evaluation positively influences the perceived usefulness of spatial aesthetics.
H1a: Environmental affordance positively influences the perceived usefulness of spatial aesthetics.
H1b: Environmental invariance positively influences the perceived usefulness of spatial aesthetics.
H1c: Environmental visual flow positively influences the perceived usefulness of spatial aesthetics.
H2: Spatial aesthetics evaluation positively influences the perceived ease of use of spatial aesthetics.
H2a: Environmental affordance positively influences the perceived ease of use of spatial aesthetics.
H2b: Environmental invariance positively influences the perceived ease of use of spatial aesthetics.
H2c: Environmental visual flow positively influences the perceived ease of use of spatial aesthetics.
H3: The degree of coupling between the perceived usefulness of spatial aesthetics and brand positioning perception positively influences purchase intention.
H4: The degree of coupling between the perceived ease of use of spatial aesthetics and brand positioning perception positively influences purchase intention.
3. Research Design
3.1. Method of Measurement
Based on the theoretical framework and research hypotheses, the questionnaire design should focus on four core dimensions: Gibson's spatial aesthetics factors, perceived cognition, brand positioning perception, and purchase behavior. This is to verify the relationships between variables and test the validity of the research hypotheses. Specifically, the questionnaire should cover measurement dimensions such as environmental affordance, environmental invariance, environmental visual flow, perceived usefulness of spatial aesthetics, perceived ease of use of spatial aesthetics, brand positioning perception, and purchase behavior. Each dimension will be evaluated using a 5-point Likert scale to capture changes in consumers' perceptions of electric car cabin aesthetics and their purchase intention.
In the environmental factor measurement section, the questionnaire should include questions related to environmental affordance, environmental invariance, and environmental visual flow. This aims to assess how consumers perceive the spatial layout, structural stability, and visual information flow within the electric car cabin. This study employs a grounded theory approach, conducting in-depth interviews with designers from 14 electric vehicle brands. The interviews analyze their understanding of the spatial aesthetics of electric car cabins to extract core concepts and further refine the questionnaire design. The interview content focuses on the designers' understanding of spatial aesthetics, the key influencing factors of user experience, and how they balance functionality and aesthetic value in the actual design process, as shown in Table 1.
Through open coding, principal axis coding, and selective coding of interview data, combined with Gibson's theory of spatial aesthetics and expert interviews, the following questionnaire was developed, as shown in Table 2:
Table 3, the “Other Factors Questionnaire” is designed based on the Technology Acceptance Model (TAM) and brand equity theory, focusing on three core dimensions: “Perceived Usefulness of Spatial Aesthetics” “Perceived Ease of Use of Spatial Aesthetics” and “Brand Positioning Perception” It aims to systematically measure consumers' subjective perceptions and brand associations regarding electric car products. The questionnaire content references the theoretical work of scholars such as Davis (1989), Keller (1993), and Aaker (1996), and employs a five-point Likert scale to evaluate users' perceived effectiveness, perceived ease of operation, and brand image identification during electric car usage. The Perceived Usefulness of Spatial Aesthetics dimension reflects users' subjective evaluations of electric cars in terms of improving travel efficiency, reducing costs, and enhancing the overall experience. The Perceived Ease of Use of Spatial Aesthetics encompasses factors such as the intuitiveness of the operating interface and the learning cost. Brand Positioning Perception focuses on whether users have a clear impression of the brand and whether they consider it representative of a specific type of vehicle. The design of this table not only provides an empirical foundation for verifying research hypotheses but also helps to further elucidate the internal logical relationship between consumer perception and brand awareness in the electric car adoption process.
3.2. Model Construction
Using Gibson's theory of spatial aesthetics, this study analyzes how the coupling of perceptual and cognitive levels jointly promotes the behavioral level. Therefore, a synergistic relationship exists between the perception of spatial aesthetic factors and brand positioning perception. The 'Coupling Coordination Degree Model,' classically used in geographical and eco-economic system research, is introduced and simplified as follows:
where A is the normalized value of the spatial aesthetics score, and B is the normalized value of the brand positioning score. C∈[0,1]; values closer to 1 indicate a tighter coupling between the systems.
where α and β represent the system weights, typically set to 0.5 to indicate equal contribution.
A multiple regression model is constructed using the coupling coordination degree as the explanatory variable and incorporating control variables:
Wi = γ0 + γ1Di + γ2Xi + εi
In the model: represents the purchase intention score of the consumer; is its corresponding coupling coordination degree; represents a set of control variables, such as price sensitivity and other individual attributes that may affect consumer purchase intention; are regression coefficients, used to measure the marginal impact of each variable on the dependent variable; and is the error term, used to reflect the unexplained random disturbance components within the model.
3.3. Data Collection
In the questionnaire distribution process for this study, the research team, recognizing the rapid development and intensifying market competition within China's electric car industry, focused on consumers' perceptions of electric vehicle spatial aesthetics, technology perception, and brand identification. Aligning with the research objectives and sample representativeness requirements, a purposive sampling method within non-probability sampling was employed. Specifically, rather than randomly distributing questionnaires to the general consumer population, this study partnered with several electric vehicle companies, utilizing their affiliated, brand-authorized 4S stores as the primary distribution channel. This approach directly targeted genuine user groups with prior electric vehicle experience, purchase intentions, or established usage habits, thereby enhancing the relevance of the sample and the empirical explanatory power of the data.
The Questionnaire distribution was conducted with the assistance of 4S store staff. The research team partnered with the sales networks of BYD, Xpeng, NIO, Li Auto, Xiaomi, Tesla, AITO, Zeekr, and IM Motors, providing brief oral explanations to customers visiting the stores for test drives or consultations, and inviting them to complete the Questionnaire in exchange for a gift. The survey period spanned four months, from October 2024 to February 2025, covering the four major regions of East China, South China, North China, and Southwest China. High-frequency survey locations were specifically established in cities with active new energy vehicle consumption, such as Beijing, Shanghai, Guangzhou, Shenzhen, Hangzhou, and Chengdu.
The research team distributed a total of 1946 questionnaires, and after removing invalid responses, 1576 valid questionnaires were collected, yielding a sample compliance rate of 80.9%. The sample's demographic characteristics included age, gender, education level, income, car purchase frequency, brand preference, and car purchase budget. The data structure was robust, providing a solid empirical foundation for structural equation modeling and coupling coordination degree regression analysis. Unlike general user samples obtained through social media platforms or street intercepts, the data collected in this study originated from users within genuine brand contact pathways. This provides a more realistic behavioral basis and brand awareness context, making it particularly suitable for exploring how spatial design aesthetics influence consumers' cognitive evaluations, purchase decisions, and other deep psychological mechanisms.
3.4. Research Methods
Regarding the selection of data analysis methods, this study utilizes structured data obtained from questionnaire surveys and comprehensively employs descriptive statistical analysis, reliability and validity testing, structural equation modeling, and multiple regression analysis. This approach aims to verify the adaptability and statistical significance of the theoretical model and research hypotheses, systematically revealing the internal coupling relationships and pathways between spatial aesthetics, technology perception, brand awareness, and purchase intention.
To ensure the fundamental quality of the data and the rationality of the analysis, the study began by conducting a descriptive statistical analysis of the samples. This analysis encompassed the samples' basic demographic characteristics, the distribution of consumer behavior variables, and key variables' mean, standard deviation, skewness coefficient, and kurtosis coefficient. Descriptive statistics served two purposes: first, to reveal the overall characteristics and representativeness of the samples; and second, to test whether the data distribution approximated a normal distribution, thus providing a foundation for subsequent structural modeling and regression analysis. To further validate the measurement quality of the scale, reliability and validity analyses were performed. For reliability, Cronbach's Alpha coefficient was used to assess the internal consistency of each latent variable; dimensions with values exceeding 0.70 were considered to possess good internal consistency. For validity, the construct validity and convergent validity of the measurement model were tested through both exploratory and confirmatory factor analyses. Factor loading values were generally greater than 0.6, and both the average variance extracted (AVE) and composite reliability (CR) met the relevant threshold criteria, indicating that the scale demonstrated good statistical validity.
In the core path testing stage, this study employs structural equation modeling techniques to model and estimate the relationships between the latent variables. Structural equation modeling can simultaneously handle measurement and structural models, accounting for measurement errors and causal path analysis between latent variables. This approach is suitable for the complex structural framework of this study, which involves multiple mediating variables and moderating paths.
4. Empirical Analysis
4.1. Descriptive Analysis
To gain an in-depth understanding of the perception mechanisms of Chinese electric vehicle consumers regarding spatial aesthetics, brand positioning, and purchase intention, this study collected 1576 valid questionnaires and conducted a descriptive analysis of the sample's basic demographic characteristics, covering five dimensions: gender, age, educational background, car brand preference, and income level. Overall, the sample structure exhibits a reasonable distribution, providing a sound basis for representation and analysis, as shown in Table 4.
This study collected 1,576 valid questionnaires and statistically analyzed the samples across five dimensions: gender, age, education, brand preference, and income. Regarding gender, males accounted for 52.92% and females for 47.08%, indicating a relatively balanced distribution. The primary age groups were 26-35 years (43.15%) and 36-45 years (30.33%), suggesting that the consumer base is primarily composed of young and middle-aged individuals. The education level was relatively high, with over 90% holding a bachelor's degree or higher, reflecting strong information processing and technical comprehension skills among respondents. Concerning car brand positioning preferences, performance-oriented brands were the most popular (40.36%), followed by luxury and prestige models (22.46%) and energy-saving and environmentally friendly options (16.75%), demonstrating that consumers value both performance, brand tone, and environmental considerations. In terms of monthly income, the 5,001-15,000 yuan range represented the largest segment (39.59%), indicating a dominance of middle-to-high-income groups with significant purchasing power.
4.2. Reliability and Validity Testing
In this study, the measurement reliability and validity of each latent variable were systematically tested to ensure the statistical reliability and measurement validity of the scale during structural modeling. The data in Table 5 shows that the Cronbach's alpha coefficient for each dimension exceeds 0.75, indicating good internal consistency of the scale. Specifically, the alpha values for "Environmental invariance," "Environmental visual flow," and "Environmental affordance" are 0.898, 0.891, and 0.870, respectively, which are considered excellent. This suggests a high degree of consistency and stability in the respondents' answers to these items. The alpha values for "Perceived usefulness of spatial aesthetics," "Perceived ease of use of spatial aesthetics," and "Brand positioning perception" are also higher than 0.79, meeting the 0.70 standard generally accepted in Academia, indicating strong statistical reliability of the scale design. Regarding convergent validity, the average variance extracted (AVE) was used to measure the degree of common variance explained by the measurement items associated with each latent variable. Although the AVE values for "Environmental affordance" (0.354), "Brand positioning perception" (0.419), and "Perceived ease of use of spatial aesthetics" (0.447) did not reach the recommended threshold of 0.50, their composite reliability (CR) values reached 0.678, 0.786, and 0.796, respectively, approaching or exceeding the critical value of 0.70. This suggests that the potential constructs of these three dimensions possess a degree of convergent validity in theory. The AVE values for the remaining variables (such as "Environmental invariance," "Environmental visual flow," and "Perceived usefulness of spatial aesthetics") are 0.562, 0.590, and 0.542, respectively, all exceeding 0.50, and the CR values are also significantly higher than 0.85, demonstrating strong convergent explanatory power for this set of constructs.
In summary, while some variables are slightly below the threshold for the AVE index, a comprehensive examination of their internal consistency (Cronbach's alpha coefficient) and composite reliability suggests that the overall measurement structure still exhibits good reliability and validity. This provides a solid measurement foundation for subsequent path analysis and hypothesis testing using the structural equation model. It should be noted that future research could further improve the convergent validity of the "Environmental affordance" and "Brand positioning perception" constructs by optimizing indicator design within the current scale framework.
4.3. Correlation and VIF Test
The analysis of the correlation and multicollinearity test results in Table 6 reveals significant positive correlations between the main variables. All correlation coefficients passed the statistical significance test (p < 0.01), indicating theoretically explainable relationships among the selected variables, thus providing an empirical foundation for subsequent modeling.
Regarding the mean and standard deviation, the mean scores for each latent variable are concentrated between 3.07 and 4.13, while the standard deviations range from 0.69 to 1.18. This suggests that respondents' cognitive evaluations of each dimension are relatively concentrated, and the distribution of variable measurements is stable.
Based on the correlation coefficients between variables, the three sub-dimensions of spatial aesthetics show significant correlations with the perceived utility of spatial aesthetics. Notably, the correlation coefficient between environmental visual flow and the perceived utility of spatial aesthetics reaches 0.709, suggesting that enhanced dynamic visual guidance and immersive experiences lead users to form more positive judgments about the effectiveness of electric car usage. The correlation between environmental invariance and environmental visual flow also reaches 0.701, further confirming the synergistic effect of stability and visual dynamics in the cockpit's aesthetic experience. Furthermore, the correlation between the perceived utility of spatial aesthetics and brand positioning perception is 0.379, indicating that consumers who recognize the product's use value are also more likely to acknowledge the brand image. While the correlation coefficients between the perceived ease of use of spatial aesthetics and other variables are relatively low, they all exhibit statistically significant positive correlations with brand positioning perception and the perceived utility of spatial aesthetics, demonstrating that ease of operation remains an important dimension influencing overall user perception.
Regarding the multicollinearity test, the variance inflation factor (VIF) for all variables is below the commonly used threshold of 5. The highest VIF is 2.614 for "Environmental invariance," and the lowest is 1.085 for "Perceived ease of use of spatial aesthetics," indicating no significant collinearity issues among the variables. The explanatory variables in the multiple regression analysis exhibit relative independence, mitigating the risk of model instability or distorted parameter estimates due to multicollinearity. Therefore, the data structure is statistically robust, providing a solid foundation for constructing the structural equation model and the coupling coordination degree regression model. Furthermore, the correlation matrix provides preliminary validation of the logical rationality of the linkage mechanisms and transmission paths between the latent variables in this study's theoretical hypotheses.
4.4. Structural Analysis
The structural analysis results presented in Table 7 reveal the path relationships between the latent variables and the goodness-of-fit of the measurement model, providing strong statistical support for the verification of the theoretical hypotheses.
In terms of structural path coefficients, the three core dimensions of spatial aesthetics—environmental affordance, environmental invariance, and environmental visual flow—all significantly impact both the perceived usefulness of spatial aesthetics and brand positioning perception. All path coefficients passed the significance test (p < 0.01). Notably, the standardized regression coefficient of environmental visual flow on the perceived usefulness of spatial aesthetics is 0.567, with a z-value of 13.234, demonstrating its strongest positive impact on consumers' perceived use value. This result indicates that visual dynamic elements within the electric car cabin, such as dynamic lighting and shadows, speed-responsive interface rhythms, and immersive environmental experiences, significantly enhance consumers' positive evaluations of vehicle performance and functional benefits. Concurrently, the impact of environmental visual flow on brand positioning perception is also significant (standardized coefficient = 0.422, p < 0.001), suggesting that visual flow elements not only affect perceived utility but also play a crucial role in constructing brand value identity. The path coefficient between environmental invariance and brand awareness is 0.262, while its impact on the perceived usefulness of spatial aesthetics is 0.249, further emphasizing the importance of stable information presentation and environmental consistency in improving consumers' technical understanding and brand impression. The impact of environmental affordance on both variables is comparatively weaker; specifically, the coefficient for its impact on the perceived usefulness of spatial aesthetics is 0.074. However, it remains statistically significant, indicating that while the affordance dimension may not be the primary source of perception, it still holds positive significance in terms of intuitive operability and body adaptation.
Regarding the measurement model, the standardized factor loadings of each latent variable on its observed variables are generally high, reaching or exceeding 0.67, with most even surpassing 0.75. Furthermore, the z-values are all significantly positive, indicating that each measurement item within the scale possesses strong explanatory power for its latent construct.
In summary, based on the path analysis results from the structural equation model, it can be definitively concluded that some of the hypotheses proposed in this study have received empirical support. H1, 'Spatial aesthetics evaluation positively affects the perceived usefulness of spatial aesthetics,' has been validated overall. Within the structural path, environmental affordance, environmental invariance, and environmental visual flow all demonstrate significant positive effects on the perceived usefulness of spatial aesthetics, with standardized regression coefficients of 0.074, 0.249, and 0.567, respectively, and p-values all less than 0.01. This indicates that the three core dimensions of spatial aesthetics significantly enhance users' subjective perception of the use value of electric cars. Environmental visual flow, in particular, exhibits the largest path coefficient, demonstrating that visual guidance and immersive experience have the most significant promoting effect on users' utility perception. Consequently, H1a (Environmental affordance positively affects the perceived usefulness of spatial aesthetics), H1b (Environmental invariance positively affects the perceived usefulness of spatial aesthetics), and H1c (Environmental visual flow positively affects the perceived usefulness of spatial aesthetics) are all supported. Examining the structural model results, the three key dimensions of spatial aesthetics—environmental affordance, environmental invariance, and environmental visual flow—all exert a significant positive influence on the perceived ease of use of spatial aesthetics. Specifically, the standardized regression coefficient of environmental affordance on the perceived ease of use of spatial aesthetics is 0.117 (p = 0.000), environmental invariance is 0.262 (p = 0.000), and environmental visual flow reaches 0.422 (p = 0.000), all of which are highly statistically significant. This suggests that consumers, upon perceiving the rationality of the functional configuration, interface stability, and visual guidance within the electric car cabin, will significantly improve their subjective evaluation of ease of operation, learning cost, and interface intuitiveness. This result clearly supports hypothesis H2, which states that spatial aesthetics evaluation positively affects the perceived ease of use of spatial aesthetics, and also validates its subordinate hypotheses H2a, H2b, and H2c. This indicates that spatial design not only shapes product impressions at the aesthetic level but also enhances users' willingness to accept technology at the practical level, providing a crucial psychological foundation for the subsequent formation of purchase behavior.
Figure 1.
Structural Model of Gibson’s Spatial Aesthetics and Perceived Ease of Use.
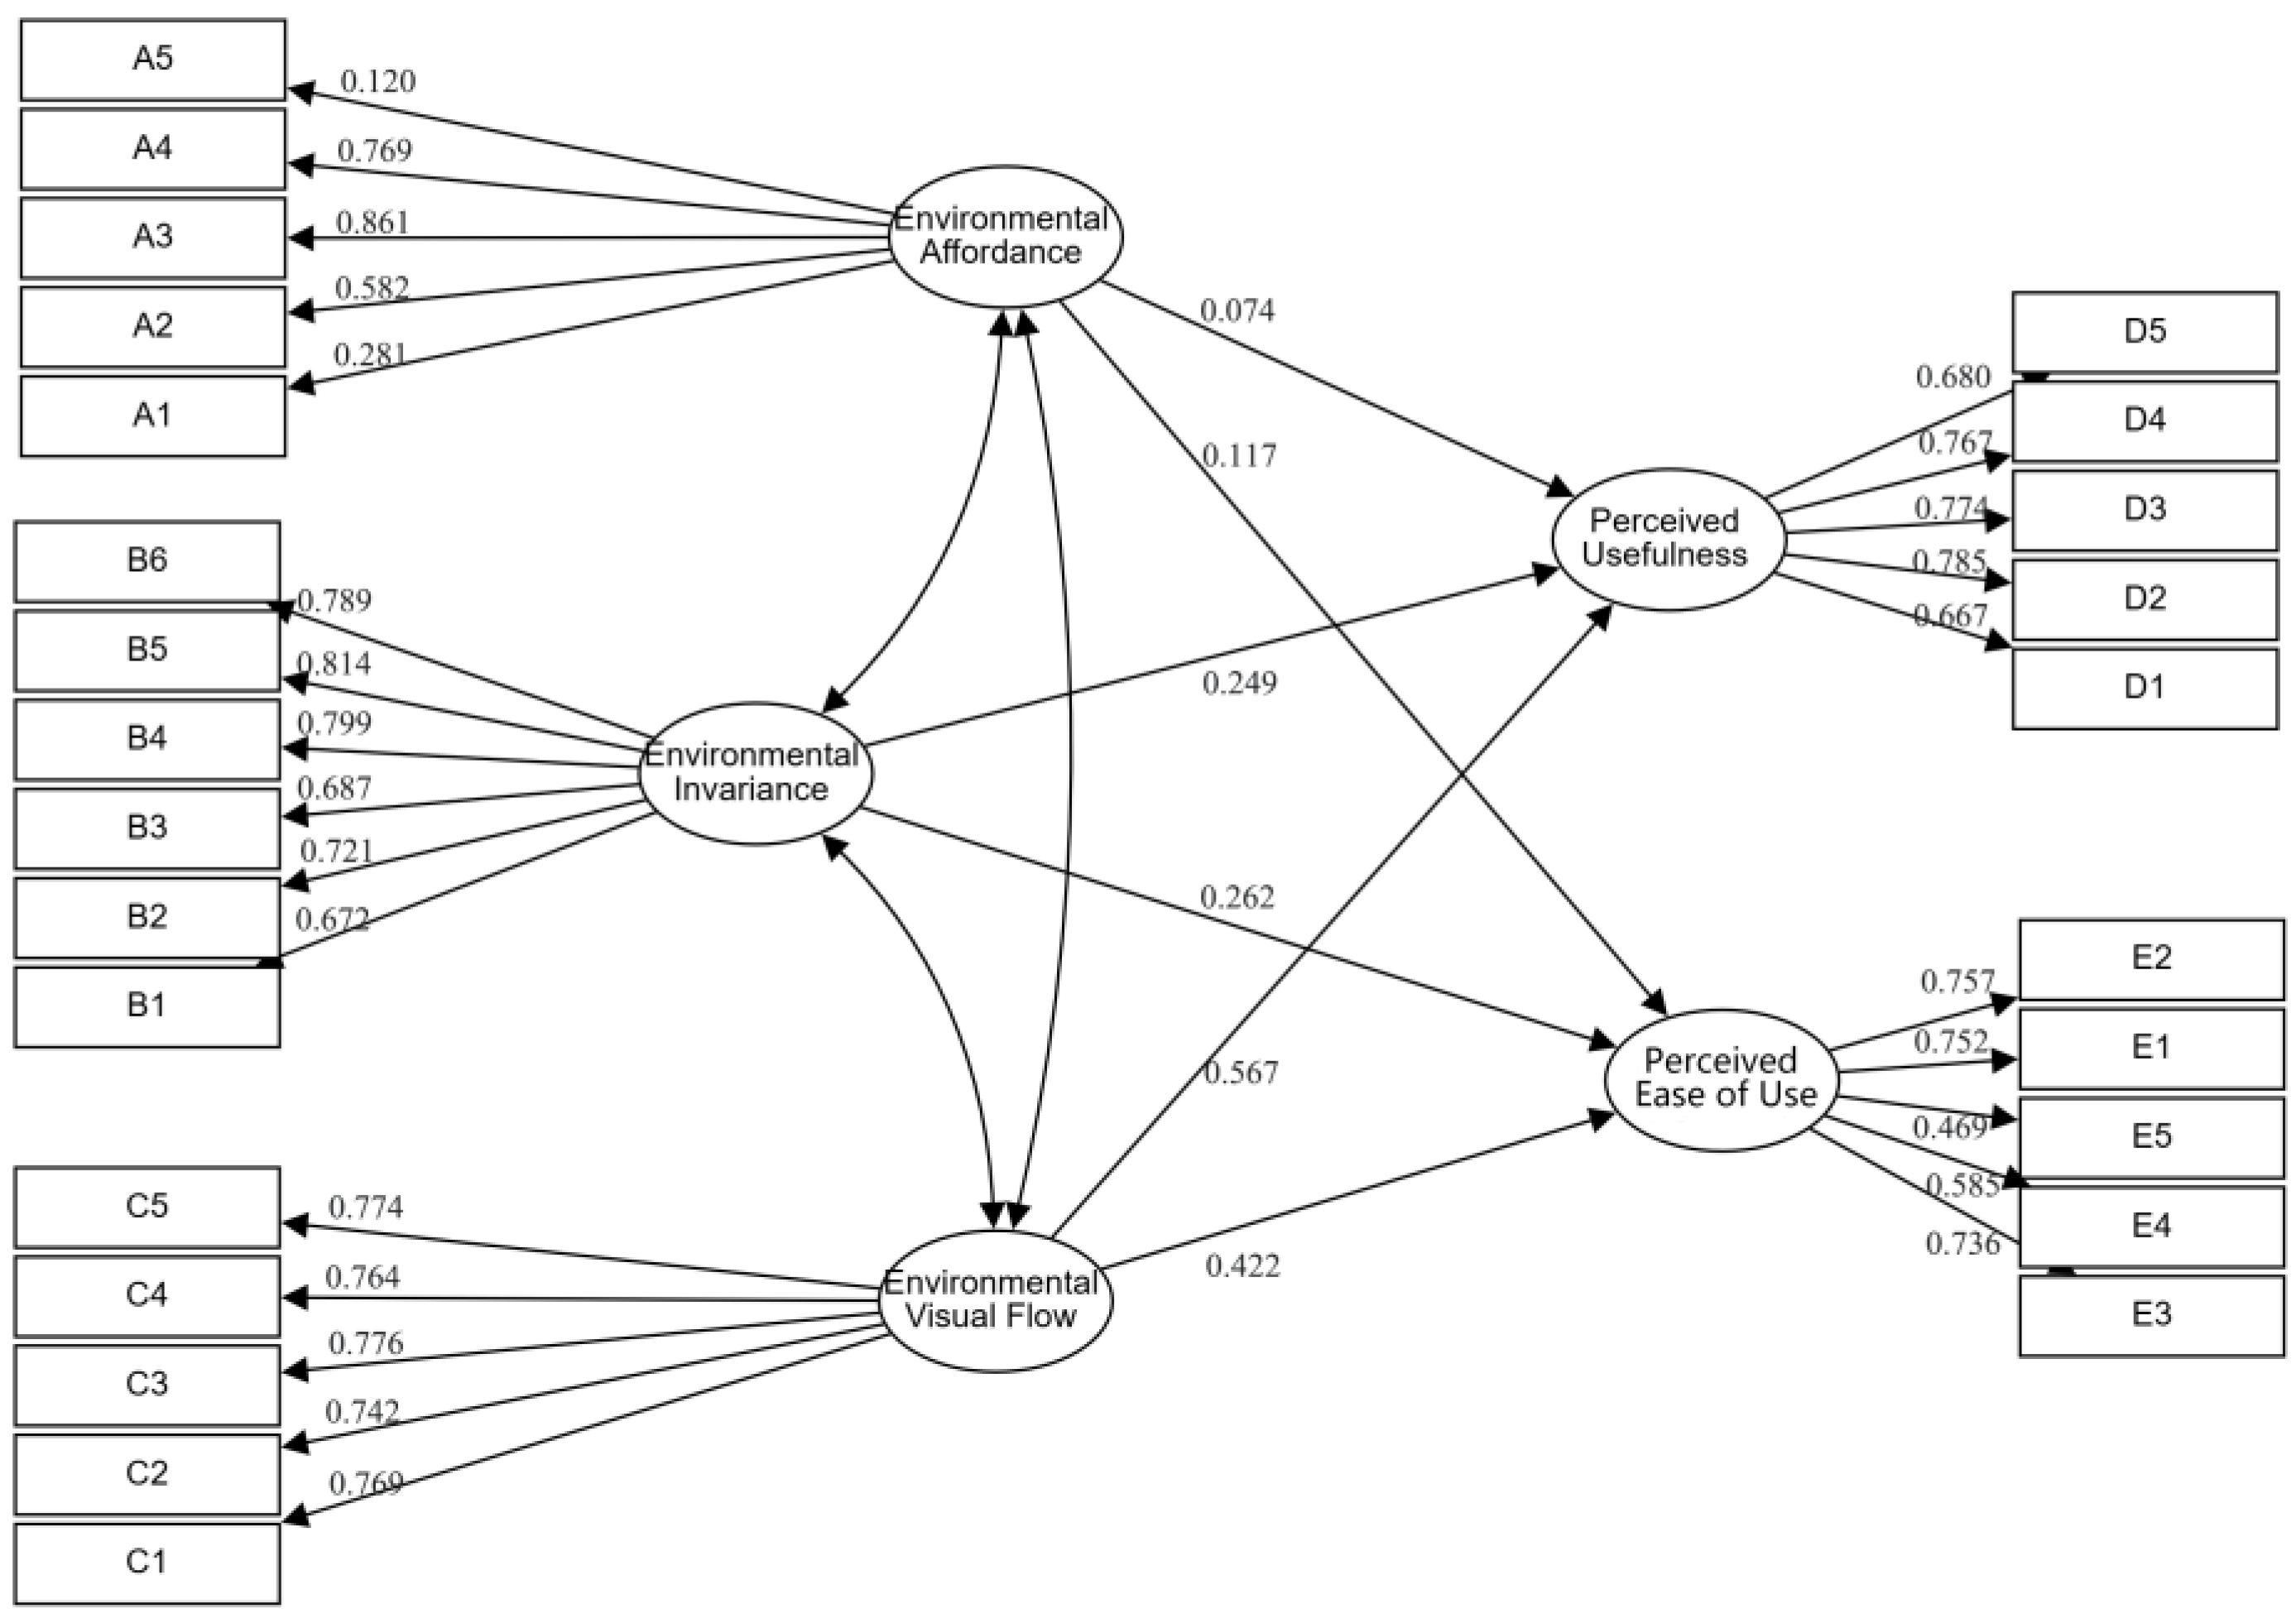
In summary, as illustrated in Figure 1, the influence pathways from electric vehicle spatial aesthetic elements—including environmental affordance, environmental invariance, and environmental visual flow—to consumers’ perceived usefulness and perceived ease of use demonstrate the adaptation and extension of spatial aesthetics within the framework of the Technology Acceptance Model (TAM). The model supports the conclusion that the spatial aesthetic features of electric vehicle usage environments significantly shape consumers’ cognitive experiences of the technology, with particularly strong effects on enhancing their perceived ease of use.Therefore, H1, H1a, H1b, H1c, and H2, along with their sub-hypotheses H2a, H2b, and H2c, have all been empirically verified, demonstrating that each dimension of spatial aesthetics significantly enhances consumers' perceived usefulness of the spatial aesthetics of electric cars.
3.5. Multiple Regression Analysis
According to the regression analysis results in Table 8, it can be clearly concluded that the degree of coupling between the perceived usefulness of spatial aesthetics and brand positioning perception has a significant positive impact on consumers' purchase intention, thus verifying hypothesis H3 proposed in this study.
In Model (1), considering only the Coupling term (Coupling variable) of Perceived usefulness of spatial aesthetics and Brand positioning perception, the Standardized regression coefficient is 0.086, the t-value is 3.701, and the p-value is less than 0.01, which is highly significant, initially verifying the positive impact of this Coupling effect on Purchase intention. In Model (2), after controlling for Gender and Age, the Regression coefficient of the Coupling variable remains at 0.044, the t-value is 2.261, and p < 0.05, indicating that even when considering the influence of basic demographic variables, the Coupling relationship still has significant explanatory power. Furthermore, after adding Control Variables such as Educational Background, car Brand preference, and Monthly Income in Model (3), the Coefficient of the Coupling variable slightly increases to 0.050, the t-value is 2.803, and p < 0.01, indicating that after controlling for various individual difference factors, the consistency of Perceived usefulness of spatial aesthetics and Brand awareness can still significantly increase Purchase intention. In addition, regarding the overall Model fit, the R-squared value gradually increases from 0.319 in Model (1) to 0.435 in Model (3), and the adjusted R-squared also reaches 0.433, indicating that the final Model can explain more than 43% of the Dependent variable variance and has good explanatory power. Both the F-value and ΔF-value are significant, indicating that the incremental explanatory effect of each Model after incorporating different variables is significant, and the structure is robust.
In conclusion, the empirical results strongly confirm that the coupling mechanism between the perceived usefulness of spatial aesthetics and brand positioning perception is statistically significant and remains robust even after controlling for multiple individual attribute variables. This indicates that consistent perception between the two has a significant positive impact on consumers' purchase intention of new energy vehicles. This finding reveals that when developing market strategies, electric car brands should not only enhance the perceived utility of their products but also strengthen the consistency of user perception through clear and aligned brand positioning strategies, thereby increasing the likelihood of behavioral conversion.
According to the regression analysis results in Table 9, the degree of coupling between the perceived ease of use of spatial aesthetics and brand positioning perception has a significant positive impact on purchase intention, thus verifying research hypothesis H4 from both statistical significance and model explanatory power perspectives.
In Model (4), only the coupling term of perceived ease of use of spatial aesthetics and brand positioning perception is introduced as an explanatory variable. The regression coefficient is 0.209, the t-value is 12.951, p < 0.01, and R² is 0.096, indicating that the coupling variable itself has strong explanatory power for purchase intention. After adding gender and age variables in Model (5), the influence of the coupling variable remains stable, with a regression coefficient of 0.212, a t-value of 13.135, and undiminished significance. The model fit is also slightly improved (R² = 0.102). Furthermore, after controlling for key demographic and behavioral variables such as educational background, brand positioning of car purchase, and monthly income in Model (6), the coefficient of the coupling variable remains at 0.184, with a t-value of 11.652, still reaching a highly significant level. This indicates that the influence of this variable on purchase intention remains robust under multiple controls.
In terms of model fit indices, the final model's R-squared value is 0.168, and the adjusted R-squared is 0.165, indicating that the model explains 16.5% of the variance in purchase intention. This is considered a moderate to high level of explanation in consumer behavior research. Furthermore, the F-test results demonstrate that all three models are significant (p < 0.001), particularly model (6) where ΔF = 41.511, further validating that including control variables effectively improves model fit. Therefore, considering the direction and significance of the path coefficients, model fit, and explanatory increment, we can definitively conclude that the degree of coupling between the perceived ease of use of spatial aesthetics and brand positioning perception significantly and positively influences consumers' purchase intention, providing empirical support for the research hypothesis. This result further confirms that when users evaluate electric cars, the synergistic effect of ease of operation and brand awareness consistency plays a crucial role in behavioral conversion, highlighting the strategic importance of integrating technological experience and brand strategy in new energy vehicle marketing.
3.6. Further Discussion
Based on the grouped regression analysis by brand positioning presented in Table 7, this section further explores the differences in how the coupling mechanism between spatial aesthetics perception and brand awareness impacts consumer purchase intention across different brand preference groups.
Among performance-oriented consumers, the coupling variable of perceived utility and brand positioning has a strong impact on purchase intention (coefficient = 0.118). Although the t-value of 1.500 approaches significance, the coupling term of perceived ease of use (coefficient = 0.128, t = 1.302) still exhibits some influence. This suggests that among user groups prioritizing power performance, if the vehicle's spatial design reinforces the recognition of a 'high-performance' brand image, it can indirectly increase purchase intention, even if space is not their primary concern.
Among the safety-oriented group, the influence of the coupling variable on purchase intention is particularly significant. The interaction coefficient between perceived utility and brand awareness is remarkably high at 0.478, and the coupling coefficient of perceived ease of use is 0.610. Although the t-value is slightly lower, the model exhibits a good fit with an R-squared value of 0.463, indicating that these consumers are particularly sensitive to the consistent perception of spatial design and brand. Safety-oriented consumers often prioritize the stability of the driving environment and the clear feedback of vehicle functions. Therefore, the degree of alignment between spatial aesthetics and the brand's value proposition directly reinforces their trust and purchase motivation. In contrast, among technology-oriented consumer groups, although the coefficients of the coupling terms remain positive (0.027 and 0.091, respectively), the t-values do not reach statistical significance. This suggests that, for user groups emphasizing "intelligence" and a "technological frontier," the coordination between spatial aesthetics and brand awareness is not sufficient to independently drive purchase intention. These users are more likely driven by core attributes such as technical specifications and intelligent interaction systems, exhibiting relatively lower sensitivity to spatial design. This implies that brands should integrate spatial design with intelligent interaction systems to enhance perceived integration. The analysis of energy-saving and environmentally conscious consumers reveals that the coupling term between the perceived ease of use of spatial aesthetics and brand positioning has a negative, albeit insignificant, impact (coefficient = -0.030, t = -0.763), while the perceived utility coupling term is positive but also insignificant (coefficient = 0.033). This indicates that, among consumers primarily driven by environmental awareness and cost-effectiveness, the subjective experience derived from spatial design has a limited influence. They tend to base their decisions on energy consumption, environmental protection technology, and long-term usage costs, placing less emphasis on consistency between space and brand.
Within the luxury and prestige model consumer group, the standardized coupling coefficient between Perceived Utility and Brand Awareness reached 0.773 (t=2.588), while the coupling coefficient for Perceived Ease of Use was 0.748 (t=2.683). Both were statistically significant, with an R-squared value of 0.395, demonstrating strong explanatory power. This suggests that, among consumers with a preference for high-end brands, a strong perceived consistency between Spatial Design and Brand Image is a key factor in building brand premium capability and driving Purchase Intention. Luxury consumers highly value the visual hierarchy, texture, and atmosphere of a space, making Spatial Aesthetics a core medium for understanding Brand Tone and reinforcing the perception of Brand Value. Therefore, when the spatial experience aligns with the Brand's premium positioning at a perceptual level, it significantly enhances consumers' psychological identification and the likelihood of Purchase Behavior conversion.
5. Suggestion
Research indicates that companies developing electric vehicle products should prioritize the guiding role of spatial aesthetics in shaping consumer perceptions. Studies show that environmental visual flow significantly impacts perceived usefulness and perceived ease of use. This suggests that dynamic visual elements, immersive in-cabin experiences, and consistent information interfaces can substantially enhance consumers' positive assessments of product technical performance and usability. Therefore, brands should emphasize dynamic visual layouts and optimized information flows in their spatial aesthetic designs. This can be achieved by creating immersive experiences through ambient lighting, interface animations, and dynamic feedback systems, thereby enhancing the overall sense of technology and futuristic aesthetic of the product. This, in turn, influences consumers' perceptions of brand professionalism and product innovation. Furthermore, "environmental invariance" within spatial aesthetics plays a crucial role in perceived utility and brand awareness. This study reveals that environmental invariance not only positively affects technology perception but also strengthens the stability and trustworthiness of the brand image. Consequently, when designing cockpit interfaces and spatial layouts, brands should prioritize stable, orderly, and predictable presentations. For example, ensuring continuity in console layout, interaction logic, and visual language can effectively reduce consumers' cognitive load and enhance their resonance with the brand's positioning as "professional, safe, and reliable." While environmental affordance has a relatively smaller impact on perceived utility and perceived ease of use, its statistical significance suggests that "operational intuition" and "body matching" in spatial design should not be overlooked. Companies should optimize button positions, operation paths, and spatial hierarchy from the perspectives of ergonomics and behavioral psychology to enhance the user experience of "intuitive usability upon entry." This achieves a low-barrier, highly satisfying user experience, adding approachable and caring attributes to the brand.
At the brand strategy level, this study further demonstrates that consumers' purchase intention is significantly enhanced when they perceive a high degree of consistency between spatial aesthetics and brand positioning. This coupling effect is particularly pronounced among luxury and prestige model and safety-oriented consumer groups. This implies that electric vehicle companies need to achieve a high degree of consistency between the "spatial aesthetic language" and the "brand spirit" in their brand communication and product configuration. For example, luxury consumers value the alignment of spatial texture and brand tone; therefore, companies should emphasize luxury and prestige in material selection, color schemes, and styling. Meanwhile, safety-oriented consumers pay more attention to orderliness and protective expression in spatial aesthetics. Companies can strengthen their perception of the brand's "protective" positioning through seat ergonomics and designs that promote visual stability. Furthermore, the impact of perceived coupling between spatial aesthetics and brand awareness on purchase intention is relatively weaker among technology-oriented and environmentally conscious consumers, suggesting that these two segments are more rational and focus on technical specifications, range, and energy efficiency. Therefore, in these market segments, companies should deeply integrate spatial design with intelligent technology and energy-saving features, such as voice control, autonomous driving interfaces, and energy consumption visualization, so that the space becomes a "functional container" rather than a "purely aesthetic expression," thereby enhancing the overall product's integrated system feel.
| 1 | Zhang, Y., Zhang, C., & Kang, W. (2024). An exploration of the development of China’s new energy vehicle industry from the perspective of logistics chains. New Economy Review, (5), 51–58. |
| 2 | Atabani, A.E.; Badruddin, I.A.; Mekhilef, S.; Silitonga, A.S. A review on global fuel economy standards, labels and technologies in the transportation sector. Renew. Sustain. Energy Rev. 2011, 15, 4586–4610. |
| 3 | Wang, N.; Tang, L.; Pan, H. Effectiveness of policy incentives on electric vehicle acceptance in China: A discrete choice analysis. Transp. Res. A Policy Pract. 2017, 105, 210–218. |
| 4 | He, X. (2024). User attention analysis on video-based social platforms during the initial launch of Xiaomi SU7: Based on popular video and comment data from Douyin. E-commerce Review, 13(4), 8. |
| 5 | Xia, Y. (2025). An analysis of BYD’s marketing strategies for new energy vehicles. Modernization of Shopping Malls. |
| 6 | Yuan X, Liu X, Zuo J. The development of new energy vehicles for a sustainable future: A review[J]. Renewable and Sustainable Energy Reviews, 2015, 42: 298-305. |
| 7 | Liu Y, Kokko A. Who does what in China’s new energy vehicle industry?[J]. Energy policy, 2013, 57: 21-29. |
| 8 | Ren, J. (2018). New energy vehicle in China for sustainable development: Analysis of success factors and strategic implications. Transportation Research Part D: Transport and Environment, 59, 268-288. |
| 9 | Goldstein E B. The ecology of JJ Gibson's perception[J]. Leonardo, 1981, 14(3): 191-195. |
| 10 | Flach J M, Holden J G. The reality of experience: Gibson's way[J]. Presence, 1998, 7(1): 90-95. |
| 11 | Zaitchik A K. Applying Gibson's Theory of Affordances to Interior Design[J]. The International Journal of Design in Society, 2015, 8(3-4): 1. |
| 12 | Gay F, Cazzaro I. Environmental Affordances: Some Meetings Between Artificial Aesthetics and Interior Design Theory[C]//International Conference Design! OPEN: Objects, Processes, Experiences and Narratives. Cham: Springer Nature Switzerland, 2022: 354-364. |
| 13 | Folkmann M N. Evaluating aesthetics in design: A phenomenological approach[J]. Design Issues, 2010, 26(1): 40-53. |
| 14 | Environmental aesthetics: Theory, research, and application[M]. Cambridge University Press, 1992. |
| 15 | Crippen M. Aesthetics and action: situations, emotional perception and the Kuleshov effect[J]. Synthese, 2021, 198(Suppl 9): 2345-2363. |
| 16 | Victor G J. Visual Depiction in James Gibson's Ecological Perception: Direct Perception, Imagination, and A-aesthetic Value[D]. Whitman College, 2022. |
| 17 | Riley H. The Domains of Aesthetics and Perception Theories: A Review Relevant to Practice-based Doctoral Theses in the Visual Arts[J]. Journal of Aesthetic Education, 2024, 58(2): 78-126. |
| 18 | Bornstein M H. The ecological approach to visual perception[J]. 1980. |
| 19 | |
| 20 | Momani A M, Jamous M. The evolution of technology acceptance theories[J]. International journal of contemporary computer research (IJCCR), 2017, 1(1): 51-58. |
| 21 | Taherdoost H. A review of technology acceptance and adoption models and theories[J]. Procedia manufacturing, 2018, 22: 960-967. |
| 22 | Alomary A, Woollard J. How is technology accepted by users? A review of technology acceptance models and theories[J]. 2015. |
| 23 | Sohn K, Kwon O. Technology acceptance theories and factors influencing artificial Intelligence-based intelligent products[J]. Telematics and Informatics, 2020, 47: 101324. |
| 24 | Venkatesh V. Technology acceptance model and the unified theory of acceptance and use of technology[J]. Wiley encyclopedia of management, 2015: 1-9. |
| 25 | Wang N, Tian H, Zhu S, et al. Analysis of public acceptance of electric vehicle charging scheduling based on the technology acceptance model[J]. Energy, 2022, 258: 124804. |
| 26 | Müller J M. Comparing technology acceptance for autonomous vehicles, battery electric vehicles, and car sharing—A study across Europe, China, and North America[J]. Sustainability, 2019, 11(16): 4333. |
| 27 | Thilina D K, Gunawardane N. The effect of perceived risk on the purchase intention of electric vehicles: an extension to the technology acceptance model[J]. International Journal of Electric and Hybrid Vehicles, 2019, 11(1): 73-84. |
| 28 | Shanmugavel N, Micheal M. Exploring the marketing related stimuli and personal innovativeness on the purchase intention of electric vehicles through Technology Acceptance Model[J]. Cleaner Logistics and Supply Chain, 2022, 3: 100029. |
| 29 | Yousif R O, Alsamydai M J. Perspective of Technological Acceptance Model toward Electric Vehicle[J]. International Journal of Mechanical and Production Engineering Research and Development, 2019, 9(5): 873-884. |
| 30 | Roemer E, Henseler J. The dynamics of electric vehicle acceptance in corporate fleets: Evidence from Germany[J]. Technology in Society, 2022, 68: 101938. |
| 31 | Kaur N, Sahdev S L, Bhutani R S. Analyzing adoption of electric vehicles in India for sustainable growth through application of technology acceptance model[C]//2021 International Conference on Innovative Practices in Technology and Management (ICIPTM). IEEE, 2021: 255-260. |
| 32 | Bektaş B C, Akyıldız Alçura G. Understanding Electric Vehicle Adoption in Türkiye: Analyzing User Motivations Through the Technology Acceptance Model[J]. Sustainability, 2024, 16(21): 9439. |
| 33 | Zhang B S, Ali K, Kanesan T. A model of extended technology acceptance for behavioral intention toward EVs with gender as a moderator[J]. Frontiers in Psychology, 2022, 13: 1080414. |
| 34 | Will C, Schuller A. Understanding user acceptance factors of electric vehicle smart charging[J]. Transportation Research Part C: Emerging Technologies, 2016, 71: 198-214. |
| 35 | Davis F D. Perceived usefulness, perceived ease of use, and user acceptance of information technology[J]. MIS quarterly, 1989: 319-340. |
| 36 | Davis F D. Perceived usefulness, perceived ease of use, and user acceptance of information technology[J]. MIS quarterly, 1989: 319-340. |
| 37 | Keller K L. Conceptualizing, measuring, and managing customer-based brand equity[J]. Journal of marketing, 1993, 57(1): 1-22. |
| 38 | Aaker D A. Measuring brand equity across products and markets[J]. California management review, 1996, 38(3). |
References
- Zhang, Y., Zhang, C., & Kang, W. (2024). An exploration of the development of China’s new energy vehicle industry from the perspective of logistics chains. New Economy Review, (5), 51–58.
- Atabani, A.E.; Badruddin, I.A.; Mekhilef, S.; Silitonga, A.S. A review on global fuel economy standards, labels and technologies in the transportation sector. Renew. Sustain. Energy Rev. 2011, 15, 4586–4610. [CrossRef]
- Wang, N.; Tang, L.; Pan, H. Effectiveness of policy incentives on electric vehicle acceptance in China: A discrete choice analysis. Transp. Res. A Policy Pract. 2017, 105, 210–218. [CrossRef]
- He, X. (2024). User attention analysis on video-based social platforms during the initial launch of Xiaomi SU7: Based on popular video and comment data from Douyin. E-commerce Review, 13(4), 8.
- Xia, Y. (2025). An analysis of BYD’s marketing strategies for new energy vehicles. Modernization of Shopping Malls.
- Yuan X, Liu X, Zuo J. The development of new energy vehicles for a sustainable future: A review[J]. Renewable and Sustainable Energy Reviews, 2015, 42: 298-305. [CrossRef]
- Liu Y, Kokko A. Who does what in China’s new energy vehicle industry?[J]. Energy policy, 2013, 57: 21-29.
- Ren, J. (2018). New energy vehicle in China for sustainable development: Analysis of success factors and strategic implications. Transportation Research Part D: Transport and Environment, 59, 268-288. [CrossRef]
- Goldstein E B. The ecology of JJ Gibson's perception[J]. Leonardo, 1981, 14(3): 191-195.
- Flach J M, Holden J G. The reality of experience: Gibson's way[J]. Presence, 1998, 7(1): 90-95.
- Zaitchik A K. Applying Gibson's Theory of Affordances to Interior Design[J]. The International Journal of Design in Society, 2015, 8(3-4): 1.
- Gay F, Cazzaro I. Environmental Affordances: Some Meetings Between Artificial Aesthetics and Interior Design Theory[C]//International Conference Design! OPEN: Objects, Processes, Experiences and Narratives. Cham: Springer Nature Switzerland, 2022: 354-364.
- Folkmann M N. Evaluating aesthetics in design: A phenomenological approach[J]. Design Issues, 2010, 26(1): 40-53. [CrossRef]
- Environmental aesthetics: Theory, research, and application[M]. Cambridge University Press, 1992.
- Crippen M. Aesthetics and action: situations, emotional perception and the Kuleshov effect[J]. Synthese, 2021, 198(Suppl 9): 2345-2363.
- Victor G J. Visual Depiction in James Gibson's Ecological Perception: Direct Perception, Imagination, and A-aesthetic Value[D]. Whitman College, 2022.
- Riley H. The Domains of Aesthetics and Perception Theories: A Review Relevant to Practice-based Doctoral Theses in the Visual Arts[J]. Journal of Aesthetic Education, 2024, 58(2): 78-126. [CrossRef]
- Bornstein M H. The ecological approach to visual perception[J]. 1980.
- Momani A M, Jamous M. The evolution of technology acceptance theories[J]. International journal of contemporary computer research (IJCCR), 2017, 1(1): 51-58.
- Taherdoost H. A review of technology acceptance and adoption models and theories[J]. Procedia manufacturing, 2018, 22: 960-967. [CrossRef]
- Alomary A, Woollard J. How is technology accepted by users? A review of technology acceptance models and theories[J]. 2015.
- Sohn K, Kwon O. Technology acceptance theories and factors influencing artificial Intelligence-based intelligent products[J]. Telematics and Informatics, 2020, 47: 101324. [CrossRef]
- Venkatesh V. Technology acceptance model and the unified theory of acceptance and use of technology[J]. Wiley encyclopedia of management, 2015: 1-9.
- Wang N, Tian H, Zhu S, et al. Analysis of public acceptance of electric vehicle charging scheduling based on the technology acceptance model[J]. Energy, 2022, 258: 124804. [CrossRef]
- Müller J M. Comparing technology acceptance for autonomous vehicles, battery electric vehicles, and car sharing—A study across Europe, China, and North America[J]. Sustainability, 2019, 11(16): 4333. [CrossRef]
- Thilina D K, Gunawardane N. The effect of perceived risk on the purchase intention of electric vehicles: an extension to the technology acceptance model[J]. International Journal of Electric and Hybrid Vehicles, 2019, 11(1): 73-84.
- Shanmugavel N, Micheal M. Exploring the marketing related stimuli and personal innovativeness on the purchase intention of electric vehicles through Technology Acceptance Model[J]. Cleaner Logistics and Supply Chain, 2022, 3: 100029. [CrossRef]
- Yousif R O, Alsamydai M J. Perspective of Technological Acceptance Model toward Electric Vehicle[J]. International Journal of Mechanical and Production Engineering Research and Development, 2019, 9(5): 873-884.
- Roemer E, Henseler J. The dynamics of electric vehicle acceptance in corporate fleets: Evidence from Germany[J]. Technology in Society, 2022, 68: 101938. [CrossRef]
- Kaur N, Sahdev S L, Bhutani R S. Analyzing adoption of electric vehicles in India for sustainable growth through application of technology acceptance model[C]//2021 International Conference on Innovative Practices in Technology and Management (ICIPTM). IEEE, 2021: 255-260.
- Bektaş B C, Akyıldız Alçura G. Understanding Electric Vehicle Adoption in Türkiye: Analyzing User Motivations Through the Technology Acceptance Model[J]. Sustainability, 2024, 16(21): 9439.
- Zhang B S, Ali K, Kanesan T. A model of extended technology acceptance for behavioral intention toward EVs with gender as a moderator[J]. Frontiers in Psychology, 2022, 13: 1080414. [CrossRef]
- Will C, Schuller A. Understanding user acceptance factors of electric vehicle smart charging[J]. Transportation Research Part C: Emerging Technologies, 2016, 71: 198-214. [CrossRef]
- Davis F D. Perceived usefulness, perceived ease of use, and user acceptance of information technology[J]. MIS quarterly, 1989: 319-340.
- Davis F D. Perceived usefulness, perceived ease of use, and user acceptance of information technology[J]. MIS quarterly, 1989: 319-340.
- Keller K L. Conceptualizing, measuring, and managing customer-based brand equity[J]. Journal of marketing, 1993, 57(1): 1-22.
- Aaker D A. Measuring brand equity across products and markets[J]. California management review, 1996, 38(3). [CrossRef]
Figure 2.
Technology Acceptance Model.
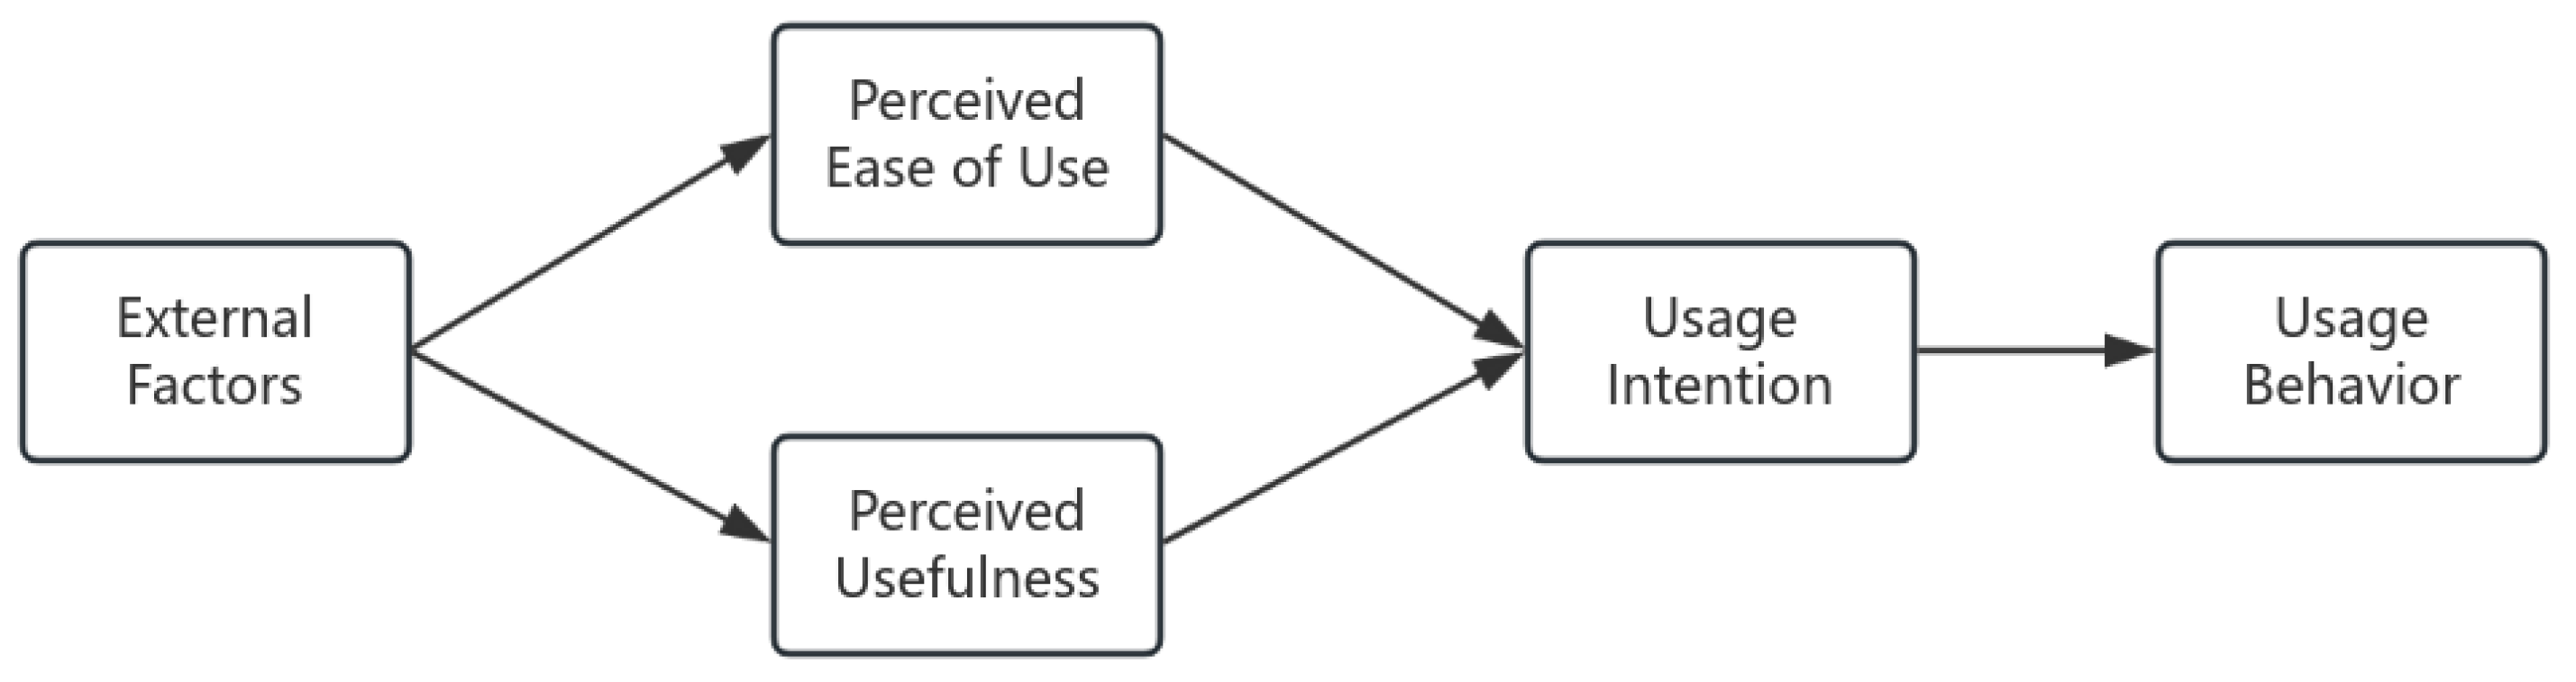
Figure 3.
Research hypothesis based on Gibson's spatial aesthetics and the Technology Acceptance Model.
Figure 3.
Research hypothesis based on Gibson's spatial aesthetics and the Technology Acceptance Model.
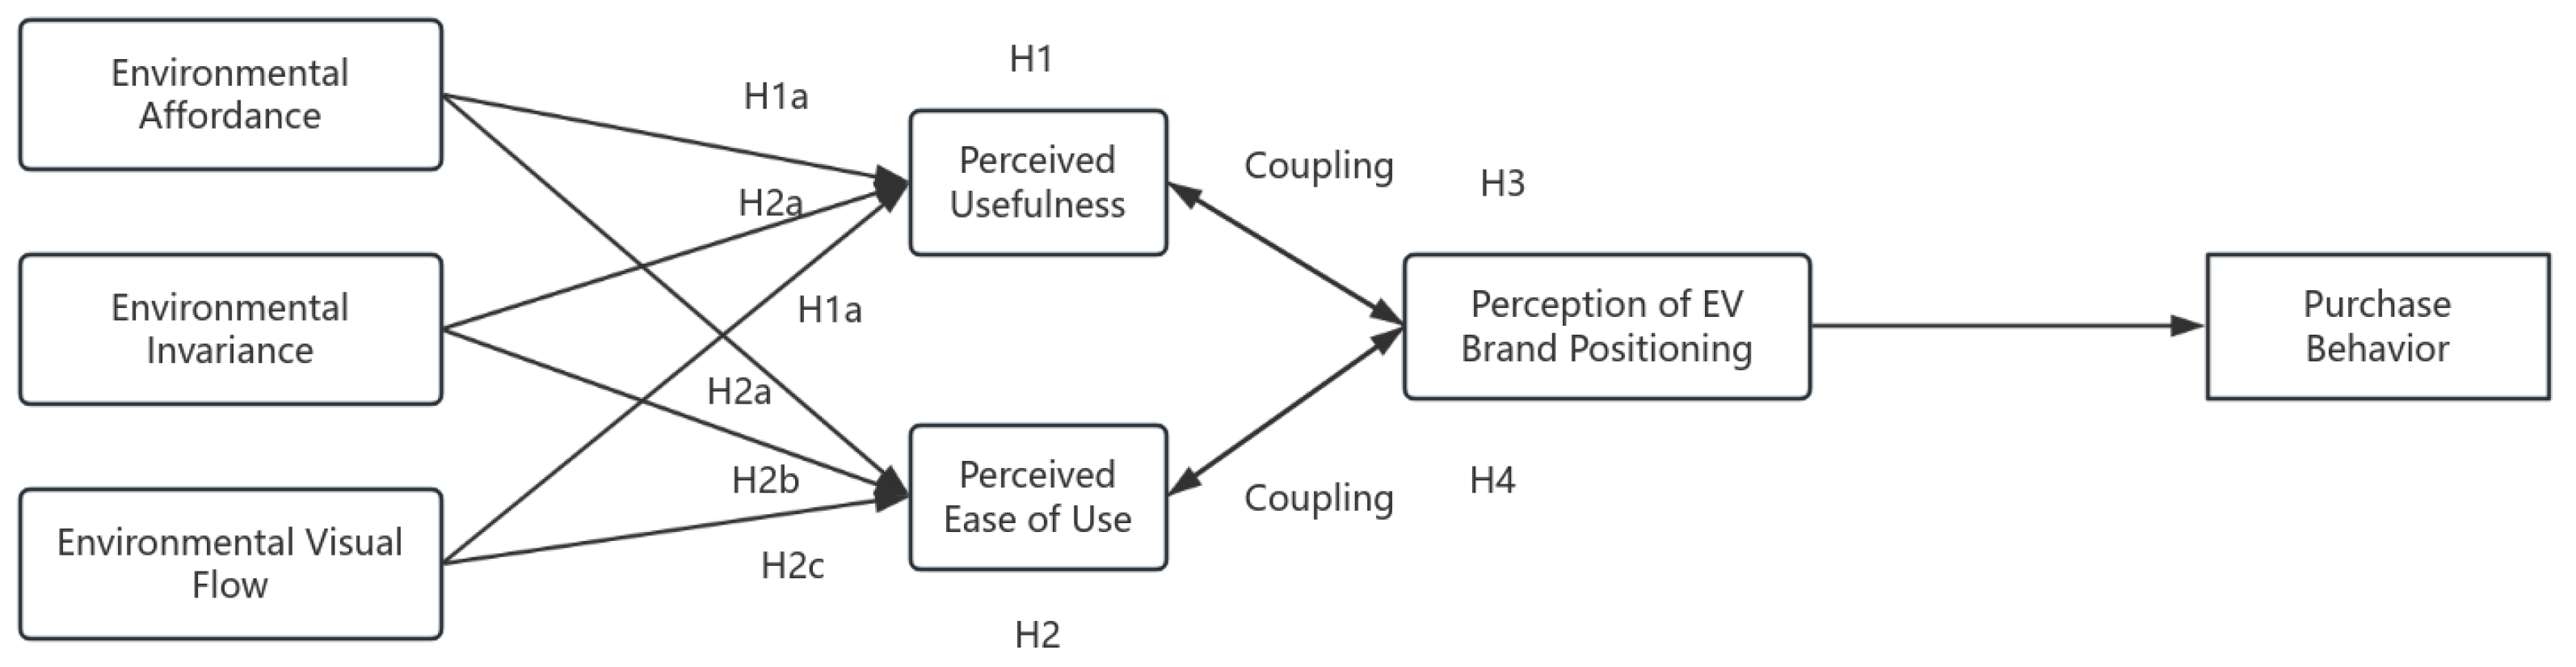

Table 1.
Analysis Results of Grounded Theory.
| Open Coding (Original Empirical Concepts) | Principal Axis Coding (Mid-Level Categories) | Selective Coding (Core Theoretical Categories) | Main Category |
|---|---|---|---|
| Natural Sitting Posture, Spatial Fit | Spatial Configuration Accessibility | Adaptability of Spatial Aesthetics to Behavioral Guidance | Environmental affordance |
| Steering Wheel Feel, Control Matching | Matching of Interface Structure and Physical Naturalness | Enhancement of Driving Behavior Naturalness Through Spatial Operation Design | |
| Operational Intuition, Blind Operation Friendliness, Button Layout Logic | Operational Accessibility and Information Acquisition | The Embodiment Mechanism of Intuitive Operability in Spatial Interaction | |
| Logical placement of interface information, reducing cognitive load | Intuitiveness of the human-computer interaction | Guidance of functional layout to enhance user perception efficiency | |
| Long-term riding support, ergonomic design, and physiological seat matching | Adaptation of the spatial physical structure | Aesthetic support from the cockpit structure for the user's physiological needs | |
| Information stability during scene transitions | Stable visual recognition across multiple contexts | Visual constancy of the spatial structure during dynamic use | Environmental invariance |
| Nighttime visibility, backlight adjustment, and adaptability to low-light environments | Brightness perception stability | Aesthetic support for stable information perception in low-light conditions | |
| Anti-glare screen, sunlight shielding strategy, and daytime visual impairment avoidance mechanism | Brightness adapts to ambient light intensity | Visual interference adjustment mechanism supporting spatial constancy | |
| Use of anti-reflective materials and driving vision continuity | Visual information integrity under interfering factors | Field-of-view stabilization mechanism in dynamic environments | |
| Brightness perception self-regulation system with light-sensitive feedback | Consistent system visual feedback | Support path of the environmental visual adjustment mechanism for information recognition | |
| Simple navigation interface and HUD synchronization function | Efficient key information acquisition | Consistent information availability across different environments | |
| Dynamic spatial design, visual triggering of speed sensation | The mechanism by which visual fluidity evokes driving rhythm | Spatial aesthetics' role in the perceptual guidance of driving behavior | Environmental visual flow |
| Interface animation fluency and visual rhythm representing speed feedback | Dynamic visual guidance mechanism | The guiding path of dynamic information display on the perception of driving rhythm | |
| Light source distribution and its spatial guidance function | The construction mechanism of a sense of security under the guidance of light and shadow | The guiding function of the lighting system in direction recognition | |
| Multi-material integration, construction of visual depth layers, and expression of spatial layering | Visual multi-dimensional structural sense | The mechanism for creating visual three-dimensionality | |
| Sense of information linkage, consistency between speed and visual feedback | Synchronization mechanism of information movement rhythm | Perceptual docking mechanism between visual dynamics and physical movement |
Table 2.
Questionnaire on Gibson's Spatial Aesthetics Factors.
| MEASUREMENT ITEM | QUESTION | NO. |
|---|---|---|
| ENVIRONMENTAL AFFORDANCE | Do you think the overall layout of the electric car cabin meets your driving needs? | A1 |
| Do the size and shape of the steering wheel fit your grip habits? | A2 | |
| Are the physical buttons inside the car positioned reasonably for intuitive operation? | A3 | |
| Is the layout of the touchscreen interface convenient for quickly finding the functions you need? | A4 | |
| Do you find that the comfort and positioning of the Seat meet your body's support needs? | A5 | |
| ENVIRONMENTAL INVARIANCE | In various driving scenarios (e.g., city, highway, mountainous areas), can you still clearly identify the in-car operation interface? | B1 |
| When driving at night, are the Dashboard, touchscreen, and center console information clearly readable? | B2 | |
| Does the in-car screen maintain good visibility under strong light (e.g., direct sunlight on a sunny day)? | B3 | |
| Does the window glass effectively reduce reflections or external light interference to maintain a clear view? | B4 | |
| Can the brightness of the in-car screen automatically adjust to adapt to different ambient lighting conditions? | B5 | |
| Does the in-car information (navigation, dashboard, HUD display, etc.) help you quickly obtain key information in different driving states? | B6 | |
| ENVIRONMENTAL VISUAL FLOW | Do you think the visual design of the electric car cockpit helps you better perceive changes in speed? | C1 |
| Are the in-car screen animations (such as dashboard RPM, navigation interface changes) smooth and do they enhance your sense of driving rhythm? | C2 | |
| When driving at night, do the interior and exterior lights (dashboard, ambient lighting, headlights, etc.) help enhance your sense of direction and security? | C3 | |
| Do the materials inside the car (such as the seats, dashboard, and door panels) visually enhance the spatial layering, making the cockpit more three-dimensional? | C4 | |
| Do you think the animation of the in-car information display is well-coordinated with the driving status (e.g., turning, acceleration, and braking)? | C5 |
Table 3.
Questionnaire for Other Factors.
| Measurement Dimension | Questionnaire Items | Literature Reference | |
|---|---|---|---|
| Perceived usefulness of spatial aesthetics | 1. I believe this electric car can effectively improve my daily commuting efficiency. | Davis (1989)35 | D1 |
| 2. Using this electric car helps to reduce travel costs. | D2 | ||
| 3. This electric car enhances my driving experience. | D3 | ||
| 4. This model provides the core functionalities I need for daily commuting. | D4 | ||
| 5. This product is significantly helpful in my life or work. | D5 | ||
| Perceived ease of use of spatial aesthetics | 1. Learning how to operate this electric car is easy for me. | Davis (1989)36 | E1 |
| 2. Using the functions of this electric car is not confusing. | E2 | ||
| 3. I can quickly find the functions or information I need when operating this car. | E3 | ||
| 4. This electric car has a clear and intuitive interface design. | E4 | ||
| 5. I believe that driving this car daily does not require excessive effort or instruction. | E5 | ||
| Brand positioning perception | 1. I believe this brand, to some extent, represents a certain type of electric car. | Keller (1993);37 Aaker (1996)38 | F1 |
| 2. The brand's market positioning has made a strong impression on me. | F2 | ||
| 3. Compared to other brands, this brand's positioning is clearer and more defined. | F3 | ||
| 4. The brand's models effectively reflect the brand image promoted in its advertising. | F4 | ||
| 5. When I think of electric cars, this brand is the first to come to mind. | F5 | ||
| 6. This brand's product characteristics align with my expectations regarding its positioning. | F6 |
Table 4.
Demographic Data Analysis of Respondents.
| Name | Option | Frequency 
|
Percentage (%) 
|
|---|---|---|---|
| Gender | Male | 834 | 52.92 |
| Female | 742 | 47.08 | |
| Age | 18-25 years | 75 | 4.76 |
| 26-35 years | 680 | 43.15 | |
| 36-45 years | 478 | 30.33 | |
| 46-55 years | 325 | 20.62 | |
| Over 55 years | 18 | 1.14 | |
| Educational Background | High school or below | 174 | 11.04 |
| High school | 131 | 8.31 | |
| Bachelor's Degree | 730 | 46.32 | |
| Master's degree | 411 | 26.08 | |
| Doctorate | 330 | 20.94 | |
| Car brand positioning preference | Performance-oriented | 636 | 40.36 |
| Safety-oriented | 108 | 6.85 | |
| Technology-oriented | 214 | 13.58 | |
| Energy-saving and environmentally friendly | 264 | 16.75 | |
| Luxury and prestige model | 354 | 22.46 | |
| Monthly Income | Below 5,000 yuan | 328 | 20.81 |
| 5,001-15,000 yuan | 624 | 39.59 | |
| 15,001-50,000 yuan | 445 | 28.24 | |
| Above 50,001 yuan | 179 | 11.36 |
Table 5.
Reliability and Validity Analysis.
| Name | Cronbach's α coefficient 
|
Average Variance Extracted (AVE) Value | Composite Reliability (CR) Value |
|---|---|---|---|
| Environmental affordance | 0.870 | 0.354 | 0.678 |
| Environmental invariance | 0.898 | 0.562 | 0.885 |
| Environmental visual flow | 0.891 | 0.590 | 0.878 |
| Perceived usefulness of spatial aesthetics | 0.868 | 0.542 | 0.855 |
| Perceived ease of use of spatial aesthetics | 0.796 | 0.447 | 0.796 |
| Brand positioning perception | 0.804 | 0.419 | 0.786 |
Table 6.
Correlation and VIF Test.
| Mean | Standard Deviation | (1) | (2) | (3) | (4) | (5) | (6) | VIF | |
|---|---|---|---|---|---|---|---|---|---|
| Environmental affordance | 3.070 | 0.690 | 1 | 1.538 | |||||
| Environmental invariance | 3.515 | 0.976 | 0.580** | 1 | 2.614 | ||||
| Environmental visual flow | 3.610 | 0.970 | 0.439** | 0.701** | 1 | 2.486 | |||
| Perceived usefulness of spatial aesthetics | 3.607 | 0.936 | 0.466** | 0.663** | 0.709** | 1 | 2.454 | ||
| Perceived ease of use of spatial aesthetics | 3.288 | 1.182 | 0.054* | 0.111** | 0.135** | 0.236** | 1 | 1.085 | |
| Brand positioning perception | 4.129 | 0.777 | 0.249** | 0.359** | 0.292** | 0.379** | 0.201** | 1 | 1.222 |
| * p<0.05 ** p<0.01 | |||||||||
Table 7.
Structural Analysis.
| X | → | Y | Standardized regression coefficient | SE | z (CR value) | p |
| Environmental Affordance | → | Perceived Usefulness | 0.074 | 0.067 | 2.900 | 0.004 |
| Environmental Affordance | → | Perceived Ease of Use | 0.117 | 0.093 | 3.853 | 0.000 |
| Environmental Invariance | → | Perceived Usefulness | 0.249 | 0.034 | 6.157 | 0.000 |
| Environmental Invariance | → | Perceived Ease of Use | 0.262 | 0.045 | 5.676 | 0.000 |
| Environmental Visual Flow | → | Perceived Usefulness | 0.567 | 0.036 | 13.234 | 0.000 |
| Environmental Visual Flow | → | Perceived Ease of Use | 0.422 | 0.043 | 9.351 | 0.000 |
| Environmental Affordance | → | A5 | 0.120 | 0.134 | 3.936 | 0.000 |
| Environmental Affordance | → | A4 | 0.769 | 0.302 | 9.948 | 0.000 |
| Environmental Affordance | → | A3 | 0.861 | 0.423 | 9.974 | 0.000 |
| Environmental Affordance | → | A2 | 0.582 | 0.309 | 9.512 | 0.000 |
| Environmental Affordance | → | A1 | 0.281 | - | - | - |
| Environmental Invariance | → | B6 | 0.789 | 0.038 | 26.859 | 0.000 |
| Environmental Invariance | → | B5 | 0.814 | 0.038 | 27.564 | 0.000 |
| Environmental Invariance | → | B4 | 0.799 | 0.038 | 27.148 | 0.000 |
| Environmental Invariance | → | B3 | 0.687 | 0.035 | 23.838 | 0.000 |
| Environmental Invariance | → | B2 | 0.721 | 0.039 | 24.869 | 0.000 |
| Environmental Invariance | → | B1 | 0.672 | - | - | - |
| Environmental Visual Flow | → | C5 | 0.774 | 0.032 | 30.698 | 0.000 |
| Environmental Visual Flow | → | C4 | 0.764 | 0.032 | 30.260 | 0.000 |
| Environmental Visual Flow | → | C3 | 0.776 | 0.033 | 30.786 | 0.000 |
| Environmental Visual Flow | → | C2 | 0.742 | 0.032 | 29.241 | 0.000 |
| Environmental Visual Flow | → | C1 | 0.769 | - | - | - |
| Perceived Usefulness | → | D5 | 0.680 | 0.046 | 23.012 | 0.000 |
| Perceived Usefulness | → | D4 | 0.767 | 0.046 | 25.447 | 0.000 |
| Perceived Usefulness | → | D3 | 0.774 | 0.047 | 25.645 | 0.000 |
| Perceived Usefulness | → | D2 | 0.785 | 0.047 | 25.914 | 0.000 |
| Perceived Usefulness | → | D1 | 0.667 | - | - | - |
| Perceived Ease of Use | → | E2 | 0.757 | 0.037 | 26.973 | 0.000 |
| Perceived Ease of Use | → | E1 | 0.752 | - | - | - |
| Perceived Ease of Use | → | E5 | 0.469 | 0.041 | 16.764 | 0.000 |
| Perceived Ease of Use | → | E4 | 0.585 | 0.043 | 20.955 | 0.000 |
| Perceived Ease of Use | → | E3 | 0.736 | 0.037 | 26.298 | 0.000 |
| Note: → indicates a regression influence or measurement relationship | ||||||
| The hyphen '-' indicates that the item serves as a reference | ||||||
Table 8.
Regression Analysis of the Degree of Coupling Between the Perceived Usefulness of Spatial Aesthetics and Brand Positioning Perception on Purchase Intention.
Table 8.
Regression Analysis of the Degree of Coupling Between the Perceived Usefulness of Spatial Aesthetics and Brand Positioning Perception on Purchase Intention.
| (1) | (2) | (3) | |
| Constant | 1.249**(6.149) | 0.546**(2.846) | -0.307(-1.570) |
| Perceived Usefulness of Spatial Aesthetics * Brand Positioning Perception Coupling | 0.086**(3.701) | 0.044*(2.261) | 0.050**(2.803) |
| Gender | -0.235**(-5.140) | -0.243**(-5.806) | |
| Age | 0.479**(22.118) | 0.310**(12.673) | |
| Educational Background | 0.387**(11.839) | ||
| Car brand positioning preference | 0.111**(8.209) | ||
| Monthly Income | -0.143**(-7.200) | ||
| Sample Size | 1576 | 1576 | 1576 |
| R 2 | 0.319 | 0.323 | 0.435 |
| F value | F (1,1574)=13.695,p=0.000 | F (3,1572)=250.467,p=0.000 | F (6,1569)=201.673,p=0.000 |
| Note: Dependent variable = Purchase Intention | |||
| * p<0.05 ** p<0.01 (t-values in parentheses) | |||
Table 9.
Regression Analysis of the Degree of Coupling Between Perceived Ease of Use of Spatial Aesthetics and Brand Positioning Perception and Purchase Intention.
Table 9.
Regression Analysis of the Degree of Coupling Between Perceived Ease of Use of Spatial Aesthetics and Brand Positioning Perception and Purchase Intention.
| (4) | (5) | (6) | |
| Constant | -0.762**(-5.398) | -0.468**(-2.580) | -0.223(-1.096) |
| Perceived Ease of Use of Spatial Aesthetics * Brand Positioning Perception Coupling | 0.209**(12.951) | 0.212**(13.135) | 0.184**(11.652) |
| Gender | -0.058(-1.100) | -0.095(-1.860) | |
| Age | -0.080**(-3.247) | 0.136**(4.426) | |
| Educational Background | 0.041(1.002) | ||
| Car brand positioning preference | -0.117**(-7.109) | ||
| Monthly Income | -0.197**(-6.587) | ||
| Sample Size | 1576 | 1576 | 1576 |
| R 2 | 0.096 | 0.102 | 0.168 |
| F value | F (1,1574)=167.739,p=0.000 | F (3,1572)=59.754,p=0.000 | F (6,1569)=52.942,p=0.000 |
| Note: Dependent variable = A1 | |||
| * p<0.05 ** p<0.01 (t-values in parentheses) | |||
Table 10.
Grouped Discussion Based on Brand Positioning.
| Overall | Performance-oriented | Safety-oriented | Technology-oriented | Energy-saving and environmentally friendly | Luxury and prestige model | |||
| Constant | 0.315(1.471) | 0.365(0.567) | 1.181(2.565) | 0.320(0.510) | 0.147(0.296) | 1.402(-2.031) | ||
| Perceived Usefulness of Spatial Aesthetics * Brand Positioning Perception Coupling | 0.043*(2.284) | 0.118*(1.500) | 0.478*(1.517) | 0.027*(0.365) | 0.033*(0.640) | 0.773*(2.588) | ||
| Perceived Ease of Use of Spatial Aesthetics * Brand Positioning Perception Coupling | 0.036**(2.590) | 0.128*(1.302) | 0.610*(0.170) | 0.091(1.106) | -0.030(-0.763) | 0.748**(2.683) | ||
| Gender | -0.237**(-5.571) | -0.261(-1.775) | -0.236**(-2.912) | -0.153(-1.401) | -0.361**(-4.378) | -0.152(-1.681) | ||
| Age | 0.303**(12.245) | 0.385**(3.923) | 0.351**(7.878) | 0.344**(5.474) | 0.268**(5.331) | 0.217**(4.027) | ||
| Education | 0.387**(11.697) | 0.404**(3.607) | 0.417**(6.062) | 0.291**(3.162) | 0.353**(6.239) | 0.493**(6.632) | ||
| Monthly Income | 0.127**(9.424) | 0.096(1.789) | 0.104**(4.255) | 0.146**(4.002) | 0.129**(4.676) | 0.143**(5.135) | ||
| Sample Size | 1576 | 636 | 108 | 214 | 264 | 354 | ||
| R 2 | 0.423 | 0.481 | 0.463 | 0.415 | 0.431 | 0.395 | ||
| Adjusted R 2 | 0.421 | 0.458 | 0.453 | 0.398 | 0.421 | 0.384 | ||
| F value | F (7,1568)=164.266,p=0.000 | F (7,162)=21.421,p=0.000 | F (7,381)=46.934,p=0.000 | F (7,245)=24.791,p=0.000 | F (7,369)=40.006,p=0.000 | F (7,379)=35.335,p=0.000 | ||
| * p<0.05 ** p<0.01 | ||||||||
Disclaimer/Publisher’s Note: The statements, opinions and data contained in all publications are solely those of the individual author(s) and contributor(s) and not of MDPI and/or the editor(s). MDPI and/or the editor(s) disclaim responsibility for any injury to people or property resulting from any ideas, methods, instructions or products referred to in the content. |
© 2025 by the authors. Licensee MDPI, Basel, Switzerland. This article is an open access article distributed under the terms and conditions of the Creative Commons Attribution (CC BY) license (https://creativecommons.org/licenses/by/4.0/).
Copyright: This open access article is published under a Creative Commons CC BY 4.0 license, which permit the free download, distribution, and reuse, provided that the author and preprint are cited in any reuse.


