Submitted:
19 April 2025
Posted:
21 April 2025
You are already at the latest version
Abstract
Urban park vitality serves as a critical metric for assessing park service performance, drawing substantial scholarly interest. However, existing studies often neglect the temporal variability in vitality patterns and thus failing to accurately reflect actual park performance. This study constructs a "temporal behavior-spatial attributes-park typology" framework using high-precision (50m) mobile signaling data to capture hourly vitality fluctuations in 59 parks of Hangzhou’s Gongshu District. By applying dynamic time warping-optimized K-means clustering, the research identifies vitality types and employs geographical detectors to analyze multivariate interaction effects influencing park vitality. We find there were three vitality types based on visitor temporal patterns: Morning Exercise-Dominated, All-Day Balanced and Evening Aggregation. Community parks show weekday morning dominance, while comprehensive parks demonstrate weekend all-day equilibrium. These vitality types show varying degrees of correlation with spatial attributes at different times: weekend morning vitality is synergistically driven by park area and surrounding POI density, whereas weekday evening vitality is primarily influenced by interactions between park service facility density and surrounding residential population density. The three vitality types highlight transportation accessibility and commercial amenities regulate temporal vitality, and time-specific management can enhance park recreational performance. Findings offer references for optimizing urban park vitality in other regions.
Keywords:
mobile signaling data
; park vitality
; geographical detector
; spatio-temporal clustering
; multi-source big data
1. Introduction
In an era of rapid urbanization, strategic planning for urban sustainability faces a critical paradox: while parks are acknowledged as vital for livability and climate resilience[1], their planning often remains fragmented—prioritizing short-term land development profits over long-term community needs. Rigid zoning, disconnected real estate-driven planning, and insufficient integration of temporal usage dynamics[2] have led to underutilized parks, particularly in peripheral areas, where evening vitality plummets due to poor accessibility and inadequate facilities. This misalignment between strategic spatial allocation and sustainable user demands begs the question: Can a strategic, time-sensitive planning approach transform parks into resilient, inclusive anchors of urban sustainability?
In the context of China's new urbanization, urban park development faces structural contradictions arising from spatial mismatch between supply and demand[3]. This is manifested in issues such as low utilization efficiency and insufficient spatial vitality in parks due to improper planning, creating significant tensions with the "people-centered" urban development philosophy under the high-quality development agenda. In response to the urgent need for high-quality development, urban green space system planning in China is undergoing a strategic transformation from quantitative expansion to qualitative improvement. To align with population needs, there is an imperative to establish spatial optimization mechanisms based on population behavioral characteristics.
Current planning paradigms typically rely on static metrics (e.g., park area per capita) but overlook temporal vitality patterns[4]—a critical dimension of sustainability that reflects resource efficiency and equity. For instance, community parks dominated by morning exercisers on weekdays indicate underutilization of infrastructure during other hours, while comprehensive parks’ weekend balance suggests untapped potential for multi-functional, sustainable land use. By bridging strategic planning theory [5] with temporal-spatial vitality analysis, this study proposes a new framework to align park design with urban sustainability goals, ensuring parks are not just green spaces, but dynamic engines for equitable, resilient cities.
The vitality patterns of park green spaces, defined as the spatial activity volume per unit area per unit time [6], directly reflect human park usage. This metric not only serves as an intuitive indicator of spatial utilization efficiency but also constitutes a key quantitative basis for evaluating urban public space service levels. Using big data, this research explores temporal rhythms and spatial accessibility patterns of urban park usage. The analysis of relationships between green infrastructure attributes and human activities contributes to more responsive urban design frameworks.
Investigating the relationship between green space characteristics and utilization efficiency is a prerequisite for enhancing recreational performance in urban parks. Existing studies have focused on spatial design features such as green view ratio [7], vegetation composition [8], and infrastructure provision [9], analyzing their differential impacts on recreational activities to improve usage efficiency. Other research has examined distributional characteristics at the planning scale, including accessibility [10], green area [11], location [12], and morphology[13], exploring their relationships with usage behaviors to establish green space allocation rules at regional and urban levels. However, a common limitation in planning-level studies is their treatment of recreational activities as static or homogenized ideal states, overlooking the temporal and social dimensions that influence spatial vitality. This leads to significant practical constraints due to regional and temporal variations, complicating efforts to uncover the underlying mechanisms linking green space attributes to utilization efficiency.
Recreational behavior observation constitutes the foundational method for landscape designers and professionals to evaluate green space usage. Since Whyte's [14] seminal study on public space users, observation techniques have evolved significantly, including video recording [15], UAV monitoring [16], and GPS tracking [17]. These methods enable detailed documentation of visitor dynamics, broad-scale green space surveillance, and comprehensive individual activity records respectively. However, practical implementations of existing studies are constrained by instrumental limitations, preventing long-term and large-scale observations of recreational behaviors. This restricts the assessment of regional green space utilization efficiency over extended time periods.
With the proliferation of mobile signaling data and internet-sourced big data in recent years, studies leveraging location-based service (LBS) datasets have identified correlations between recreational activities and resident behavioral characteristics. These findings have been applied to spatial planning processes such as urban functional zoning [18,19]. This technological advancement enables the exploration of temporal and spatial patterns of green space recreation at urban and regional scales, facilitating systematic and precise evaluations of green space service capacity to inform more accurate and rational green infrastructure planning. Many scholars have utilized aggregated mobile signaling data to investigate the spatiotemporal characteristics of park visits by residents in Chinese megacities [20,21,22], as well as to assess park service areas and utilization efficiency [23,24].
Temporal studies have confirmed that park visitor volume follows periodic patterns at specific time points [20]. For instance, Liu et al.[25] analyzed recreational behaviors in summer street green spaces in Tianjin Binhai New Area and found peak usage between 10:00–16:00. Yang [26] observed recreational activities at Hefei Swan Lake Park, examining hourly visitor behaviors from 8:30–17:30 and the impact of landscape spaces. Yang et al. [27] used mobile signaling data and surrounding POI/facility datasets for spatial statistical analysis, revealing diurnal differences in park vitality and their structural determinants, indicating a shift toward round-the-clock recreational patterns. Additionally, previous studies have confirmed significant differences in park usage between weekdays and weekends [28,29]. Existing time-dimension research has three key limitations: (1) Small sample sizes, typically relying on 1–2 days of representative data [30], with daytime-only analysis and limited focus on instantaneous/average efficiency rather than longitudinal trends; (2) Coarse data resolution, as most mobile signaling studies use 250m/100m positioning [29]. This study pioneers individual-level analysis using 50m resolution data, enabling precise tracking of visitor trajectories and improving analytical accuracy compared to previous coarser datasets; (3) Traditional regression models (e.g., OLS [27,31,32] and GWR [33,34,35]) insufficiently account for spatial heterogeneity.
Classifying parks based on temporal patterns provides a new perspective for studying relationships between green space attributes and recreational efficiency, particularly diurnal rhythms [32]. Hourly recreational flows directly reflect the visitation intensity of green spaces, revealing both the temporal variations in daily usage frequency and the concentrated time periods/durations of peak activity. This provides a critical perspective for in-depth analysis of daily recreational patterns among urban park users.
This research integrates multi-source big data to construct a "temporal behavior-spatial attribute-vitality typology" framework, analyzing periodic patterns and spatial differentiation mechanisms across park vitality types. By innovatively combining typological clustering and geographical detectors, it addresses the traditional disconnect between temporal and spatial dimensions, providing scientific recommendations for optimizing park services. This data-driven approach overcomes subjective planning limitations, offering evidence-based solutions for green space layout optimization, facility upgrades, and service radius adjustments to achieve spatial alignment between public space supply and resident needs, advancing high-quality urban green infrastructure development.
2. Materials and Methods
2.1. Study Area
This study selects Gongshu District, one of Hangzhou's core urban areas (Figure 1), as the research site. Gongshu District, a core component of Hangzhou's urban fabric, is situated at the confluence of ecological and cultural landscapes: the Banshan National Forest Park to the north, the Grand Canal waterway system, and the iconic West Lake to the south. Spanning 119 km² with 18 subdistricts, the district supports a population of 1.188 million and a green infrastructure network totaling 2,186.89 hectares. Current metrics include a 27.31% green coverage rate and 18 m² per capita park space. As outlined in Hangzhou Green Space System Special Plan (2021-2035), Gongshu will play a critical role in achieving city-wide targets of 17 m² per capita park space, 43% green coverage, and 95% park service radius coverage.
Gongshu District was selected as the research area for urban park green spaces due to its abundant and diverse park resources, including urban parks, wetland parks, and forest parks. With high green coverage rates, Gongshu exhibits complex ecosystems and vegetation types while maintaining a unique blend of historical and modern landscapes, facilitating comparative analysis of green space designs across different periods. Additionally, the district's advanced urbanization and proactive government initiatives in ecological civilization, including innovative practices like smart landscape technologies, provide an ideal research environment. Given its strategic location, diverse green infrastructure, and strong policy support, Gongshu District serves as an optimal case study for park green space research. This investigation contributes to deeper understanding of urban park dynamics and offers transferable insights for green space planning in other cities.
Given the 50-meter spatial resolution of mobile signaling data and the assumption of uniform user distribution within Voronoi polygons, accurately matching the boundaries of small parks (less than 3 hectares) with signaling data becomes challenging, particularly in high-density urban environments. This may lead to significant computational errors and hinder precise identification of actual visitor counts. Considering both data precision and research requirements, this study selected urban parks larger than 3 hectares as research targets, totaling 59 sites. These include 6 comprehensive parks (154.96 ha), 10 special-category parks (635.16 ha), 9 community parks (83.28 ha), and 34 garden parks (204.57 ha). Their spatial distribution is illustrated in Figure 2.
2.2. Signaling Data and Processing
To ensure data validity and representativeness, this study collected hourly mobile signaling data from 6:00–22:00 across 59 urban parks in the research area over 14 consecutive days from March 27 to April 9, 2023. The time span covered two full weeks with no extreme weather conditions affecting travel. Demographic data for permanent residents utilized the full-year 2022 dataset. According to market penetration surveys by China Mobile Zhejiang Company, their network currently covers over 68% of Zhejiang's telecommunications market, meeting the requirements for mobile big data analysis. Thus, the selected dataset demonstrates strong representativeness for reflecting real-time park visitation patterns.
The signaling data employed six algorithmic models: Permanent Resident Identification, Floating Population Recognition, Fixed-Position Recognition, Travel OD (Origin-Destination) Analysis, Commuting Pattern Identification, and Population Distribution Modeling. Temporal analysis was structured into:
- Leisure time categorization: Weekdays vs weekends;
- Arrival time intervals: 6:00–8:00, 8:00–12:00, 12:00–16:00, 16:00–18:00, 18:00–20:00, 20:00–22:00 (six intervals);
Spatial analysis utilized 50-meter grids. Statistical metrics including average stay duration and park occupancy were derived through aggregation.
2.3. Integrated Analytical Framework of "Temporal Behavior-Spatial Attribute-Vitality Typology"
This study constructs a spatiotemporal integration framework for analyzing urban park vitality—"Temporal Behavior-Spatial Attributes-Vitality Typologies"—based on time geography theory [36]. Park vitality is measured by population density, with visitor groups demonstrating temporal consistency in arrival patterns. Addressing the diurnal heterogeneity of park visits and integrating spatiotemporal constraints of urban daily rhythms, the daily cycle is divided into six characteristic periods: Early Morning (6:00–8:00), Morning (8:00–12:00), Afternoon (12:00–16:00), Evening (16:00–18:00), Night (18:00–20:00), and Late Night (20:00–22:00).
At the temporal feature analysis level, this study transcends traditional frequency-based statistical paradigms by constructing a five-dimensional temporal feature index system: morning peak ratio, day-night difference coefficient, evening activity level, fluctuation entropy, and peak-valley difference coefficient. After normalizing the feature space using Z-score standardization, an improved silhouette coefficient optimization algorithm was employed to determine the optimal cluster number. Dynamic Time Warping (DTW) distance-optimized K-means clustering (DTW-KMeans) was then implemented to classify the 59 urban parks into distinct temporal behavior spectrum types.
The spatial attribute analysis constructs a three-tier spatial attribute index system based on park characteristics, accessibility features, and surrounding environmental attributes:.
- Park-specific attributes: Including park area, park type, landscape morphology index, water area ratio, and facility density;
- Accessibility attributes: Comprising distance to city center, bus stop density, walking accessibility, and driving accessibility;
- Surrounding environment attributes: Encompassing residential population density, employment density, and density of park-related services/facilities.
Geographical detector models were applied to separately analyze each temporal feature index, quantifying the influence intensity and interaction effects of spatial attributes on temporal patterns. The methodological flowchart is as Figure 3:
2.3.1. Constructing the Temporal Feature Matrix of Recreational Behavior
Daily Visitor Flow Fluctuation Curve Construction: Hourly average visitation volumes were calculated for each time segment according to daily temporal distributions, yielding a 16-hour visitor flow fluctuation curve for each park.
Temporal Feature Index Extraction: Based on waveform characteristics, five temporal feature indices were extracted:
- Morning Peak Ratio (Mmor) : Quantifies vitality intensity during the morning commute (6:00–8:00). Calculated as the ratio of hourly average visitation volume during 6:00–8:00 to the full-day average;
- Day-Night Difference Coefficient (MDN) : Reflects the imbalance between daytime (8:00–16:00) and evening (16:00–22:00) vitality distributions, measured by the ratio of visitation volumes between these periods;
where is hourly average visitation volume during 8:00–16:00; is hourly average visitation volume during 16:00–22:00.
- Evening Activity Level (Meve): Represents the contribution of 18:00–22:00 vitality as the proportion of total visits during this period relative to the full day;
where is total visitation volume during 18:00–22:00; is full-day (6:00–22:00) total visitation volume
- Fluctuation Entropy (H) : Uses Shannon entropy to measure the disorderliness of visitor flow fluctuations, where higher entropy indicates more random vitality distributions. Measuring the irregularity of hourly visitation volume distributions. Calculated as Shannon entropy of hourly visit distributions;
where is probability of visitation volume state i; is number of hours in state i; is total analyzed hours (16 hours, 6:00–22:00).
- Peak-Valley Difference Coefficient (PVR) : Core index to measure the fluctuation intensity of park population flow. Quantifies the amplitude of daily vitality extremes as the ratio of maximum to minimum hourly average visitation volumes.
where is maximum hourly average visitation volume; is non - zero minimum visitation volume. Notably, to avoid infinite values caused by zero visitation during trough periods, this study substitutes , the non-zero minimum value observed across all parks during trough periods—for actual zero values in PVR calculations.
This study encompasses 59 urban parks as research objects. Through the synthesis of the five characteristic indicators, a 5×59 temporal feature matrix T is established, formulated as follows:
where (n=1, 2, …, 59) represents the morning peak ratio of each park, and (n=1, 2, …, 59) denotes the peak-valley difference coefficient. The sequence of parks in the study does not influence the computational outcomes.
2.3.2. DTW-based K-Means Clustering
To capture dynamic similarities in urban park visitor flow temporal patterns, this study employs Dynamic Time Warping (DTW) distance-optimized K-means clustering (DTW-KMeans). The DTW-KMeans clustering algorithm serves as a strategic planning tool, identifying several vitality types that inform adaptive land use strategies. Unlike conventional static classifications, this dynamic approach captures hourly demand fluctuations, enabling planners to allocate resources strategically—e.g., prioritizing evening facility upgrades in residential-heavy zones to maximize sustainable service efficiency. Replacing Euclidean distance with DTW enables better detection of waveform similarities. The Silhouette Score was used to determine the optimal number of clusters. The implementation steps are as follows:
- Temporal Data Preprocessing: Daily visitation volume data for 59 parks were standardized using Z-score normalization to eliminate dimensional differences, constructing a standardized temporal matrix X ∈ R59×6.
- DTW distance replaced traditional Euclidean distance to elastically align temporal waveforms and resolve interference from phase shifts in similarity measurements. The DTW distance is calculated as:
- 3.
- Cluster Number Determination: Cluster quality was evaluated using the Silhouette Score, with grid search identifying the optimal cluster number K=3. The Silhouette Score is calculated as:
where is the average intra-cluster distance of sample i, and is the average distance to the nearest neighboring cluster.
- 4.
- Model Training and Optimization: DTW-KMeans was implemented using Python’s tslearn library with parameters: maximum iterations T=100, convergence threshold , and three random initializations to avoid local optima. The algorithm iteratively optimizes cluster centroids and sample assignments to minimize the objective function:
- 5.
- Result Validation: Intra-cluster compactness was validated through intra-cluster average DTW distance (< 60 visitors/hour) and inter-cluster separation (> 220 visitors/hour). Cluster structure significance was confirmed using permutation tests (p < 0.01).
2.3.3. Geographical Detector Model – Indicator Determination and Feature Extraction
This study employs the Geographical Detector model [37] to explore relevant factors influencing the spatiotemporal vitality indices of urban park green spaces. The Geographical Detector can detect spatial heterogeneity in geographical phenomena and identify the significance and correlation of different influencing factors on these phenomena [20]. Its core concept evaluates the degree of influence of specific factors on spatial heterogeneity by comparing sub - regions under different factors with the entire region.
For numerical independent variables, this research uses the natural breaks method to stratify variables into 7 layers (scoring range: 1–7) before conducting statistical analysis with the Geographical Detector. To maintain consistency with this scoring system, park types were assigned values: comprehensive parks (=7), special - category parks (=5), community parks (=3), and garden parks (=1).
A unique advantage of the Geographical Detector is its ability to detect interaction effects between two factors on dependent variables. By calculating and comparing single-factor q-values and combined q-values of factor pairs, the model can determine the presence, strength, directionality, and linear or non-linear nature of interactions.
This study employs two components of the Geographical Detector model: Differentiation & Factor Detection and Interaction Detection. The Factor Detector quantifies the influence of an independent variable Xn on park utilization Y using the q-statistic [30]:
where q is explanatory power of factor Xn on Y; h ={1,2,3,…L} is categories or strata of the variable; N, Nh are total units in the entire region and stratum h, respectively; , σ2 are variance of Y in stratum h and the entire region; SSW is sum of squared within-group deviation; SST is total sum of squared deviations. Interpretation: , with higher values indicating stronger influence of Xn on Y.
The Interaction Detector examines how interactions between factors X1, X2, ..., Xk affect urban park utilization. It compares combined q-values of factor pairs to their individual q-values to identify: Synergistic/antagonistic effects, Linear/non-linear relationships and Dominant/recessive factor hierarchies.
In this study, the Geographical Detector model uses cluster-specific typological indices of 59 parks as dependent variables, modeling weekday and weekend typological indices separately to analyze the influence intensity of factors on different vitality types. As defined in Section 2.3.1, the dependent variables include: Morning Peak Ratio, Evening Activity Level and Peak-Valley Difference Coefficient. Building on prior research [30,38,39,40], independent variables were selected from three dimensions influencing park visitation behavior (Table 1): Park-specific Attributes, Accessibility Features and Surrounding Environmental Attributes.
- Park-specific Attributes;
Park-specific Attributes include park area, park type, Landscape Shape Index (LSI), water area ratio, and facility density. Park area, as a fundamental attribute, enables larger parks to provide more recreational amenities and services [41]. According to the Urban Green Space Classification Standard (CJJ/T 85-2017), urban park green spaces are classified into four categories: comprehensive parks, community parks, special - category parks, and garden parks. The Landscape Shape Index (LSI) is a key metric in landscape ecology for quantifying the complexity of patch shapes. It evaluates shape complexity by measuring the relationship between patch perimeter and area, calculated as [41]:
The water area ratio is the ratio of water area to park area, serving as an important indicator for evaluating green space composition and ecological value. This ratio is calculated by dividing the total water area within the park boundary by the park's total area. It highlights the proportion of water bodies such as lakes, ponds, and streams, which can significantly influence the park's aesthetic appeal, biodiversity, and recreational opportunities.
Facility density is the ratio of the number of service facilities within the park to the park's area. Service facilities include playgrounds, themed plazas, leisure corridors, restaurants, shops, restrooms, parking lots, etc.
- 2.
- Accessibility Features;
Accessibility Features are measured through four dimensions: distance to city center, bus stop density, walking accessibility, and driving accessibility. Combining POI data and nighttime light data, this study calculates the distance from each park to the urban center (Wulin Square in Hangzhou). Bus stop density (BSD) is defined as the ratio of bus stop count to buffer area within the park’s service radius. Following the Urban Green Space Planning Standard (GBT 51346 - 2019), buffer zones were established as follows: 1200 meters for comprehensive/special-category parks, 500 meters for community parks and 300 meters for small parks. A total of 649 bus stops within park buffers were collected from AMAP POI data. Bus stop density was calculated by dividing bus stop counts by buffer area. Walking accessibility represents the area reachable within 15 or 30 minutes on foot during non-peak weekdays. Grid files describing time-distance to parks were generated using real-time route planning tools. Driving accessibility was calculated similarly.
- 3.
- Surrounding Environmental Attributes;
Surrounding Environmental Attributes encompass Residential Population Density (RPD), Working Population Density (WPD), and park-related services/facilities within park buffer zones. RPD and WPD represent the density of residents and workers, respectively, within the park’s service radius buffers, identified using mobile signaling data. Park-related service/facility characteristics are reflected by the density of Surrounding Points of Interest (SPOI).
POI data were collected from AMAP (https://map.gaode.com/) in 2023, with Hangzhou Gongshu District POI information obtained via the AMAP API (https://lbs.amap.com/api/android-sdk/guide/map-data/poi/). This API enables web crawler programs to gather data, yielding attributes such as IDs, names, categories, descriptions, coordinates, addresses, longitudes, and latitudes. Data preprocessing included coordinate correction, filtering, duplicate removal, and deletion of incomplete records, resulting in 57,946 valid POI entries for Gongshu District.
Eight primary categories were identified as positively influencing park usage: Food & Beverage, Shopping & Consumption, Hotels & Accommodation, Science & Education & Culture, Lifestyle Services, Healthcare, Leisure & Entertainment, and Sports & Fitness. Similar to BSD, RPD, and WPD calculations, ArcGIS 10.2’s Network Analyst and Spatial Join tools were used to filter POIs within 1200m, 500m, or 300m network distances from park boundaries. POI density was calculated by buffer zone.
3. Results
3.1. Urban Park Vitality Typologies
Using a dynamic time warping distance-optimized K-means clustering algorithm, and combining the waveform characteristics of cluster centers with field surveys, the 59 urban parks were classified into three vitality types: "Morning Exercise-Dominant", "All-Day Balanced", and "Evening Aggregation". Typological indices are presented in Figure 4, with spatial distributions mapped in Figure 5. The number of clusters was set to 3, with a maximum iteration count of T=100, a convergence threshold of ϵ=1×10⁻⁴, and three random initializations to avoid local optima. The algorithm minimized the objective function by iteratively optimizing cluster centers Cₖ and sample assignments. Clustering compactness was validated via average within-class DTW distance (<60 people/hour) and between-class separation (>220 people/hour), while a permutation test (p<0.01) confirmed the significance of cluster structures. Key findings include: (1) Typological Characteristics: Morning Exercise-Dominant parks exhibit distinct daytime peak clusters, characterized by high morning peak ratios; All-Day Balanced parks (predominantly comprehensive parks) display stable visitation profiles with lower fluctuation entropy values; Evening Aggregation parks (largely special-category parks) experience sharp post-18:00 peaks, with high evening activity levels. (2) Temporal Variation: Morning Exercise-Dominant parks outnumber others on weekdays, while All-Day Balanced parks increase significantly on weekends; Community parks and riverside walking trails exhibit strong temporal dependence, with weekday visitation often dominated by morning exercise (indicating early recreational time allocation) and weekend usage shifting to evening aggregation patterns that reflect leisure-focused visits; Comprehensive/special-category parks like Xiaohezhi Street Historical Block and Banshan National Forest Park maintain consistent vitality patterns across days, attributed to their high popularity and tourism-driven visitation.
3.2. Results of Geographical Detector Model
3.2.1. Main Influencing Factors on Weekends
Using the Geographical Detector model, this study identified significant determinants of weekend urban park vitality typologies through analysis of 14 influencing factors across three dimensions (Table 2). Results indicate that weekend morning peak ratios are most strongly influenced by park type (e.g., comprehensive parks), park area, 30-minute driving accessibility (D-30), and surrounding POI density (SPOI), reflecting family preferences for large, functionally diverse parks with commercial amenities and long-distance accessibility. Evening activity levels correlate significantly with park facility density, 15-minute walking accessibility (W-15), and SPOI, as well-equipped parks and high walkability combined with surrounding retail/leisure services extend weekend evening stays. Peak-valley differences are shaped by distance to city center, residential population density (RPD), D-30, and SPOI, where dense residential areas exhibit stable visitation while long-distance driving accessibility creates concentrated peak flows. Interaction detection (Figure 6) revealed synergistic effects among factors: SPOI interactions with park type (q=0.7485), area (q=0.7567), and D-30 (q=0.8221) exerted the strongest influence on morning peaks, driven by consumption-leisure linkages in parks like Banshan National Forest Park. For evening activity, SPOI interactions with facility density (q=0.763) and W-15 (q=0.8056) dominated, reflecting night market/retail synergies. D-30 interactions with park area (q=0.806) and SPOI (q=0.8156) intensified pulse visits in large parks, exacerbating flow fluctuations. These findings highlight the critical role of comprehensive parks and surrounding amenities in mediating weekend visitation patterns, with implications for park planning and resource allocation.
3.2.2. Main Influencing Factors on Weekdays
Similar to weekends, weekday park visitation determinants were analyzed using 14 factors across three dimensions (Table 3), with interaction detection applied to factor pairs (Figure 7).
The results show that morning peak ratios on weekdays were significantly influenced by bus stop density, working population density (WPD), 15-minute walking accessibility (W-15), and surrounding POI density (SPOI), reflecting commuter activity near transit hubs and office areas where WPD ∩ bus stop density (q=0.8358) and SPOI∩WPD (q=0.8356) interactions amplified morning peaks through combined transit, commercial, and office influences. W-15∩park type interactions (q=0.8133) further highlighted the multiplicative effect of pedestrian accessibility on commuter attraction.
Evening activity levels correlated with facility density, residential population density (RPD), 15-minute driving accessibility (D-15), and SPOI, with residents favoring well-equipped parks after work despite parking challenges associated with high D-15; RPD ∩ facility density (q=0.8241) and RPD ∩ SPOI (q=0.8103) interactions underscored synergistic enhancement of evening vitality through residential density and park/retail amenities.
Peak-valley differences were shaped by park type, distance to city center, and SPOI, with exclusive functional orientations of park typologies leading to purpose-driven visitation patterns and peripheral parks exhibiting greater flow volatility. SPOI ∩ distance (q=0.8505) and SPOI ∩ D-30 (q=0.8264) interactions indicated parks in peripheral yet commercially dense areas faced concentrated daytime visits dominated by single-function usage, exacerbating diurnal variations. These findings emphasize the need for integrated transit-oriented and amenity-rich strategies to balance weekday park vitality across temporal and spatial dimensions.
3.3. Influencing Factors of Vitality Types in Different Time Periods
Analysis of influencing factors for characteristic indices of urban park vitality typologies across weekend and weekday periods (Figure 8) reveals four key findings: First, surrounding POI density (SPOI) significantly impacts parks of all vitality types across temporal dimensions, making commercial service provisions near parks a primary consideration for future maintenance and management. Second, weekend vitality enhancement strategies should integrate park type, area, and 30-minute driving accessibility (D-30) for morning peak optimization, alongside facility density and 15-minute walking accessibility (W-15) for evening activity improvement. Additionally, distance to city center, D-30, and residential population density (RPD) must be addressed to mitigate peak-valley fluctuations. Third, weekday strategies should prioritize transit accessibility (bus stop density, W-15), working population density (WPD), and park typology to align with commuter patterns, while facility density and RPD require attention for evening vitality. Fourth, interaction factors with the highest impacts on characteristic indices across both periods include SPOI ∩ D-30, SPOI ∩ W-15, SPOI ∩ WPD, and SPOI ∩ RPD, which must be incorporated into planning frameworks. These findings provide a data-driven foundation for targeted park management interventions and spatial planning decisions.
4. Discussion
This study identifies three vitality types through DTW-KMeans clustering, revealing the fundamental differences in the temporal-spatial distribution of park vitality. The research finds that park vitality is not determined by single resources (such as area or facilities), but depends on "temporal-spatial adaptability"—the precise alignment of service provisions with time-specific demands. This challenges the traditional planning standard of "park allocation based on population size", calling for an added dimension of "time-period demand forecasting" to enable precise service delivery and avoid resource waste from one-size-fits-all planning. Compared with traditional universal strategies, typological analysis can precisely address the core needs of different parks, achieving deep coordination among maintenance management, planning layout, and collaborative optimization of surrounding elements. The differentiated strategic planning and sustainability enhancement based on vitality types demonstrate that the key to improving park vitality lies in "temporal-spatial adaptability"[42]: Morning Exercise-Dominated parks need to transcend the traditional "daytime-only park" location, All-Day Balanced parks require stronger integration with TOD (transit-oriented development) strategies, Evening Aggregation-Dominated parks must align closely with residential activity rhythms.
- "Morning Exercise-Dominated" parks: Addressing temporal fragmentation to unlock the temporal value of suburban parks.
Parks of this type are mainly suburban natural parks (e.g., Banshan National Forest Park), characterized by high morning vitality on weekdays/weekends and significant declines during daytime and nighttime. Their core contradiction lies in the neglect of the "time dimension" in planning—a disconnect between "time-period service demands and flexible land supply". Current maintenance management only meets basic morning needs (e.g., sanitation), failing to tap into the potential value of other periods.
- Innovative Maintenance Management:
Establish a "time-divided maintenance-dynamic opening" mechanism: Prioritize anti-slip facilities on fitness trails and direct drinking water supply in the morning; gradually open indoor/outdoor spaces such as forest science museums and stargazing platforms from afternoon to evening, regulating visitor flow through smart reservation systems (reducing nighttime management costs).
- Planning Strategies:
Define "time-period flexible indicators" in land use planning, requiring newly built suburban parks to reserve 20% of land as "nighttime vitality expansion zones" with simultaneous construction of sustainable facilities like solar streetlights and eco-toilets. Collaborate with public transportation systems to launch "morning fitness shuttle routes" connecting metro stations and park entrances. This "time-space-transportation" collaborative planning directly responds to the concept of "flexible planning"[43], breaking the vicious cycle of "low accessibility-low utilization" in suburban parks.
- Synergy with Surrounding Elements:
Introduce a "light-asset park night economy" model, hosting stargazing camping and nature education lectures on weekend evenings. Partner merchants must commit to operating during 6:00–8:00 AM (e.g., breakfast carts, sports supply stations) in exchange for rental discounts.
- 2.
- "All-Day Balanced" parks (e.g., Xiaohezhi Street Greenway, Ying’ergang Greenway, green spaces around West Lake Cultural Square): Reconfiguring urban functional networks to create sustainable vitality hubs.
As urban core parks, their "all-day high vitality on weekends and secondary peaks at noon/evening on weekdays" reflect strong functional coupling with surrounding commercial, office, and transportation facilities. However, this also exposes the drawback of "functional isolation" in traditional planning—parks lack collaborative management with adjacent businesses when hosting diverse activities.
- Upgraded Maintenance Management:
Deploy modular stages and smart lockers, adopting an "activity reservation-facility sharing" system: Reserve lawns for parent-child markets in the morning, convert them to open-air concert venues in the afternoon, and transform them into light art exhibition spaces at night. High-efficiency space utilization is achieved through dynamic facilities (e.g., movable seats, temporary stages), reducing repetitive construction costs[44]. Collaborate with surrounding enterprises on a "noon vitality program", providing shared office pods and unmanned convenience stores to meet the short-term rest needs of white-collar workers.
- Planning Strategies:
Implement a "Park+TOD" mixed-use development model, prioritizing the layout of such parks within 500 meters of metro stations. Require surrounding commercial complexes to allocate at least 10% of their area for park-supporting facilities (e.g., coffee kiosks, sports equipment rental points), forming integrated spaces for "recreation-consumption-commuting". Geographical detector analysis shows significant correlations between the temporal characteristic indicators of these parks and surrounding POI density, confirming that functional mixing promotes all-day vitality.
- Synergy with Surrounding Elements:
Construct "Rail+Park" integrated corridors along the Grand Canal, connecting commercial complexes and community service centers via permeable asphalt pathways for seamless linkage. Establish a "park-commercial district-community tripartite governance mechanism", channeling 5% of commercial advertising revenue into park maintenance funds. Use park footfall data to guide staggered parking fees in surrounding lots (e.g., free parking for 1 hour on weekend mornings), integrating parking, retail, and park entrances. This increases weekend park-and-ride rates, alleviates traffic pressure in central areas, and creates a virtuous cycle of "popularity accumulation-commercial feedback-sustainable operation".
- 3.
- "Evening Aggregation-Dominated" parks (e.g., Mishixiang Cultural Square): Precisely responding to residential needs to build inclusive vitality units.
The "high weekday evening vitality and low weekend daytime vitality" of these parks reveals that residents’ post-work social and fitness needs are not fully addressed by traditional planning standards (the current Urban Residential Area Planning and Design Standard only specifies per capita park area without distinguishing time-period demands).
- Innovative Maintenance Management:
Implement an "evening vitality special program": Extend operating hours to 22:00 and add security facilities; prioritize the installation of high-demand evening facilities such as soundproof enclosures for square dancing and glow-in-the-dark children’s play areas based on resident voting results, collecting real-time usage feedback via WeChat mini-programs to dynamically adjust layouts. Establish a "park steward" system, with community volunteers responsible for nighttime order maintenance.
- Planning Strategies:
Introduce an "evening vitality correction coefficient" in regulatory planning, requiring supporting parks in residential areas with a population density > 15,000 people/km² to increase service facility density by 30% above standard values and reserve indoor activity spaces. Studies show that facility density has a significant impact on evening vitality (p<0.01), confirming the importance of targeted facility allocation.
- Synergy with Surrounding Elements:
Collaborate with community committees to develop "park night economy" projects[45], introducing low-energy activities like intangible cultural heritage handicraft markets and outdoor movies. Allocate a portion of stall revenues to subsidize park lighting costs, creating a sustainable cycle of "resident use-community management-commercial empowerment" while enhancing community identity through nighttime activities. Embed convenience service stations, (e.g., automatic water vending machines, shared umbrellas) in the facades of surrounding buildings and develop underground spaces into community gyms, improving land use efficiency.
5. Conclusions
The "time-series behavior-spatial attribute" coupling framework constructed in this study provides a new approach to addressing the contradiction between "planning rigidity and flexible demands." By embedding park vitality types into land use planning, transportation accessibility design, and community development strategies, it can promote the transformation of cities from "incremental expansion" to "stock activation," thereby facilitating the realization of the planning objective of sustainable symbiosis among "humans, cities, and parks."
This study innovatively employs long-term, large-sample, high-precision mobile signaling data alongside multi-source big data (POI, OpenStreetMap [OSM]), supplemented by field surveys, to classify urban park vitality typologies based on diurnal activity patterns. By analyzing 14 influencing factors across three dimensions using Geographical Detector, the research identifies primary and secondary determinants shaping vitality patterns, including significant temporal interactions (e.g., SPOI ∩ D-30=0.8221 for morning peaks). The findings provide data-driven maintenance strategies for high-density urban parks and quantitative support for future park site selection, with applications extendable to Hangzhou’s "park city" initiative and similar urban renewal contexts globally.
This study advances strategic planning for urban sustainability by demonstrating that park vitality is not a static outcome, but a dynamic product of temporal-spatial strategic alignment. By integrating hourly usage data into land use decisions, planners can create parks that adapt to evolving community needs while minimizing resource waste. In an era where cities grapple with climate crisis and equity challenges, this time-sensitive, multi-factor planning approach offers a replicable model for transforming parks into resilient, sustainable urban assets—proving that strategic foresight in design can turn underused green spaces into vibrant hubs of inclusive, long-term sustainability.
This study acknowledges four primary limitations: First, excluding park visits with dwell time <30 minutes may underestimate visitor scale. Second, population composition analysis focuses solely on residential/working demographics, lacking subdivide visitor characteristics (gender, age, income) which will be explored in future research. Third, factor selection relies on literature review and qualitative methods, potentially missing unknown determinants due to knowledge gaps. Fourth, data collection included a midweek light rain Qingming Festival day treated as a weekday, limiting insights into holiday visitation patterns; future studies will incorporate May Day/National Day holiday data to investigate seasonal variations.
Author Contributions
G.L. (Ge Lou): conceptualization, data curation, formal analysis, methodology, software, validation, writing—original draft, writing—review and editing. Q.C. (Qiuxiao Chen): resources, writing—review and editing, funding acquisition. All authors have read and agreed to the published version of the manuscript.
Funding
This research was funded by Key R&D Program of Zhejiang (No.2024C03234).
Data Availability Statement
Data will be made available on request.
Acknowledgments
Thanks to all the reviewers and editors.
Conflicts of Interest
The authors declare that they have no known competing financial interests or personal relationships that could have appeared to influence the work reported in this paper
References
- UN-Habitat - a Better Urban Future | UN-Habitat. Available online: https://unhabitat.org/ (accessed on 14 April 2025).
- Healey, P. Urban Complexity and Spatial Strategies: Towards a Relational Planning for Our Times; Routledge: London, 2006; ISBN 978-0-203-09941-4. [Google Scholar]
- Chen, J.; Liu, B.; Li, S.; Jiang, B.; Wang, X.; Lu, W.; Hu, Y.; Wen, T.; Feng, Y. Actual Supply-Demand of the Urban Green Space in a Populous and Highly Developed City: Evidence Based on Mobile Signal Data in Guangzhou. Ecol. Indic. 2024, 169, 112839. [Google Scholar] [CrossRef]
- Haselsteiner, E.; Smetschka, B.; Remesch, A.; Gaube, V. Time-Use Patterns and Sustainable Urban Form: A Case Study to Explore Potential Links. Sustainability 2015, 7, 8022–8050. [Google Scholar] [CrossRef]
- Making Strategic Spatial Plans; Healey, P., Ed.; Routledge: London, 2006; ISBN 978-0-203-45150-2. [Google Scholar]
- Zhang, J.; Yu, Z.; Cheng, Y.; Chen, C.; Wan, Y.; Zhao, B.; Vejre, H. Evaluating the Disparities in Urban Green Space Provision in Communities with Diverse Built Environments: The Case of a Rapidly Urbanizing Chinese City. Build. Environ. 2020, 183, 107170. [Google Scholar] [CrossRef]
- Shao, Y; Lu, H. Research on recreation rules and spatial correlation of community parks based on multi-source data: A case study of Shanghai. Landsc. Archit. 2024, 31, 32–40.
- de Jalon, S.G.; Chiabai, A.; Quiroga, S.; Suarez, C.; Scasny, M.; Maca, V.; Zverinova, I.; Marques, S.; Craveiro, D.; Taylor, T. The Influence of Urban Greenspaces on People’s Physical Activity: A Population-Based Study in Spain. Landsc. URBAN Plan. 2021, 215, 104229. [Google Scholar] [CrossRef]
- Zhang, L; Yang, S. A preliminary study on the behavior characteristics of residents' activities and the correlation of spatial layout in community public space: A case study of Suzhou Park Neighborhood Center. Huazhong Archit. 2018, 82–86. [CrossRef]
- Ekkel, E.D.; de Vries, S. Nearby Green Space and Human Health: Evaluating Accessibility Metrics. Landsc. URBAN Plan. 2017, 157, 214–220. [Google Scholar] [CrossRef]
- Chen, Y. Factors influencing the activity volume of urban community public space. J. Shenzhen Univ. Sci. Eng. 2016, 33, 180–187. [Google Scholar]
- Tong, Z. The Study of Quantification Method on Urban Greenspace Configuration. Doctoral dissertation, Nanjing University, Nanjing, 2011.
- Kimpton, A. A Spatial Analytic Approach for Classifying Greenspace and Comparing Greenspace Social Equity. Appl. Geogr. 2017, 82, 129–142. [Google Scholar] [CrossRef]
- Whyte, W.H. The Social Life of Small Urban Spaces. STPH, 2016; ISBN 978-7-5327-7051-9.
- Park, K.; Ewing, R. The Usability of Unmanned Aerial Vehicles (UAVs) for Measuring Park-Based Physical Activity. Landsc. Urban Plan. 2017, 167, 157–164. [Google Scholar] [CrossRef]
- Zhao, X; Xu J; Liu, X; Zhu, X. Study on physical activity and spatial distribution of urban parks in winter based on UAV observation: A case study of four parks in Harbin. CLA 2019, 35, 40–45. [CrossRef]
- Matisziw, T.C.; Nilon, C.H.; Wilhelm Stanis, S.A.; LeMaster, J.W.; McElroy, J.A.; Sayers, S.P. The Right Space at the Right Time: The Relationship between Children’s Physical Activity and Land Use/Land Cover. Landsc. Urban Plan. 2016, 151, 21–32. [Google Scholar] [CrossRef]
- Reades, J.; Calabrese, F.; Sevtsuk, A.; Ratti, C. Cellular Census: Explorations in Urban Data Collection. IEEE Pervasive Comput. 2007, 6, 30–38. [Google Scholar] [CrossRef]
- Wang, B; Zhen, F; Zhang, H. Study on dynamic change and regionalization of urban activity time based on check-in data. Scient. Geogr. Sin. 2015, 35, 151–160. [CrossRef]
- He, X; Yuan, Q; Lu, J; Li, G. A study on the spatio-temporal patterns and influencing mechanisms of foreign tourists' visits to urban parks: A case study of Guangzhou. S. Archit. 2024, 32–43.
- Niu, X; Kang, N. Spatial and temporal characteristics and influencing factors of tourist activities in Shanghai Country Parks: a study based on mobile phone signaling data. CLA 2021, 37, 39–43. [CrossRef]
- Dong, W. Spatial and temporal vitality characteristics and influencing factors of urban parks based on multi-source data: A case study of Yanqing District, Beijing. C. Constr. Metal Struct. 2023, 141–143, 149. [CrossRef]
- Long, F; Shi, L; Peng, Z; Yang, J; Zhang, S. Urban park service evaluation based on mobile signaling data. Urban Probl. 2018, 88–92. [CrossRef]
- Fang, J; Liu, S; Wang, D; Zhang, Y. Analysis of supply and demand service of Shanghai urban park based on mobile signaling data. Landsc. Archit. 2017, 35–40. [CrossRef]
- Liu, H; Hu, Y; Liang, F. Study on recreational behavior of street side green space users in summer in Binhai New Area, Tianjin. J Beijing Univ Agric. 2013, 28, 74–77.
- Yang, G. Research on recreation behavior in lake-type park based on behavioral observation. Archit. & Cult. 2018, 171–172.
- Yang, B; Yin, M; Zheng, S; Gao, R. Study on day and night recreation activity of high-density urban park green space based on mobile phone signaling and POI big data: A case study of typical park green space in Shanghai. Landsc. Archit. 2023, 40, 35–42.
- Rizwan, M.; Wan, W.; Cervantes, O.; Gwiazdzinski, L. Using Location-Based Social Media Data to Observe Check-In Behavior and Gender Difference: Bringing Weibo Data into Play. ISPRS Int. J. Geo-Inf. 2018, 7, 196. [Google Scholar] [CrossRef]
- Song, Y.; Huang, B.; Cai, J.; Chen, B. Dynamic Assessments of Population Exposure to Urban Greenspace Using Multi-Source Big Data. Sci. Total Environ. 2018, 634, 1315–1325. [Google Scholar] [CrossRef]
- Zeng, L.; Liu, C. Exploring Factors Affecting Urban Park Use from a Geospatial Perspective: A Big Data Study in Fuzhou, China. Int. J. Environ. Res. Public. Health 2023, 20, 4237. [Google Scholar] [CrossRef] [PubMed]
- Xu, J; Zhao, Y; Zhong, K; Ruan, H; Sun, C. Correlation analysis of temperature and NDVI concentration density based on geographical weighting and least square linear regression model. Trop. Geogr. 2017, 37, 269–276. [CrossRef]
- Hu, X; Li, T. Spatial and temporal distribution characteristics of urban park population based on vitality perspective: A case study of Suzhou Central City. Landsc. Archit. 2022, 39, 90–97.
- Tao, Z; Ding, J; Wang, L; Chen, D. A spatial-temporal heterogeneity study on the influence of urban park characteristics on recreation vitality. Chin. Landsc. Archit. 2023, 39, 108–113. [CrossRef]
- Ye, Y.; Qiu, H. Exploring Affecting Factors of Park Use Based on Multisource Big Data: Case Study in Wuhan, China. J. URBAN Plan. Dev. 2021, 147, 05020037. [Google Scholar] [CrossRef]
- He, X; Yuan, Q; Lu, J; Li, G. Spatial and temporal activity patterns and planning strategies of urban park population in Guangzhou based on multi-source big data. Mod. Urban Res. 2025, 7–14.
- Hägerstraand, T. WHAT ABOUT PEOPLE IN REGIONAL SCIENCE? Pap. Reg. Sci. 1970, 24, 7–21. [Google Scholar] [CrossRef]
- Wang, J; Xu, C. Geodetectors: Principles and prospects. Acta Geogr. Sin. 2017, 72, 116–134.
- Li, F.; Yao, N.; Liu, D.; Liu, W.; Sun, Y.; Cheng, W.; Li, X.; Wang, X.; Zhao, Y. Explore the Recreational Service of Large Urban Parks and Its Influential Factors in City Clusters – Experiments from 11 Cities in the Beijing-Tianjin-Hebei Region. J. Clean. Prod. 2021, 314, 128261. [Google Scholar] [CrossRef]
- Chen, Y.; Liu, X.; Gao, W.; Wang, R.Y.; Li, Y.; Tu, W. Emerging Social Media Data on Measuring Urban Park Use. Urban For. Urban Green. 2018, 31, 130–141. [Google Scholar] [CrossRef]
- Lyu, F.; Zhang, L. Using Multi-Source Big Data to Understand the Factors Affecting Urban Park Use in Wuhan. Urban For. Urban Green. 2019, 43, 126367. [Google Scholar] [CrossRef]
- Dade, M.C.; Mitchell, M.G.E.; Brown, G.; Rhodes, J.R. The Effects of Urban Greenspace Characteristics and Socio-Demographics Vary among Cultural Ecosystem Services. Urban For. Urban Green. 2020, 49, 126641. [Google Scholar] [CrossRef]
- Gomez-Baggethun, E.; Barton, D.N. Classifying and Valuing Ecosystem Services for Urban Planning. Ecol. Econ. 2013, 86, 235–245. [Google Scholar] [CrossRef]
- Yin, Q.; Wu, C.; Luo, G. Research on flexible land use planning. TCSAE. 2006, 65–68. [Google Scholar]
- Bolund, P.; Hunhammar, S. Ecosystem Services in Urban Areas. Ecol. Econ. 1999, 29, 293–301. [Google Scholar] [CrossRef]
- Work Summary and Work Plan for 2022 and 2023 of the Municipal Bureau of Planning and Natural Resources -- Public Disclosure of Implementation Status. Available online: https://www.sz.gov.cn/szzt2010/wgkzl/jggk/lsqkgk/content/post_10568888.html (accessed on 14 April 2025).
Figure 1.
Location of Gongshu District.
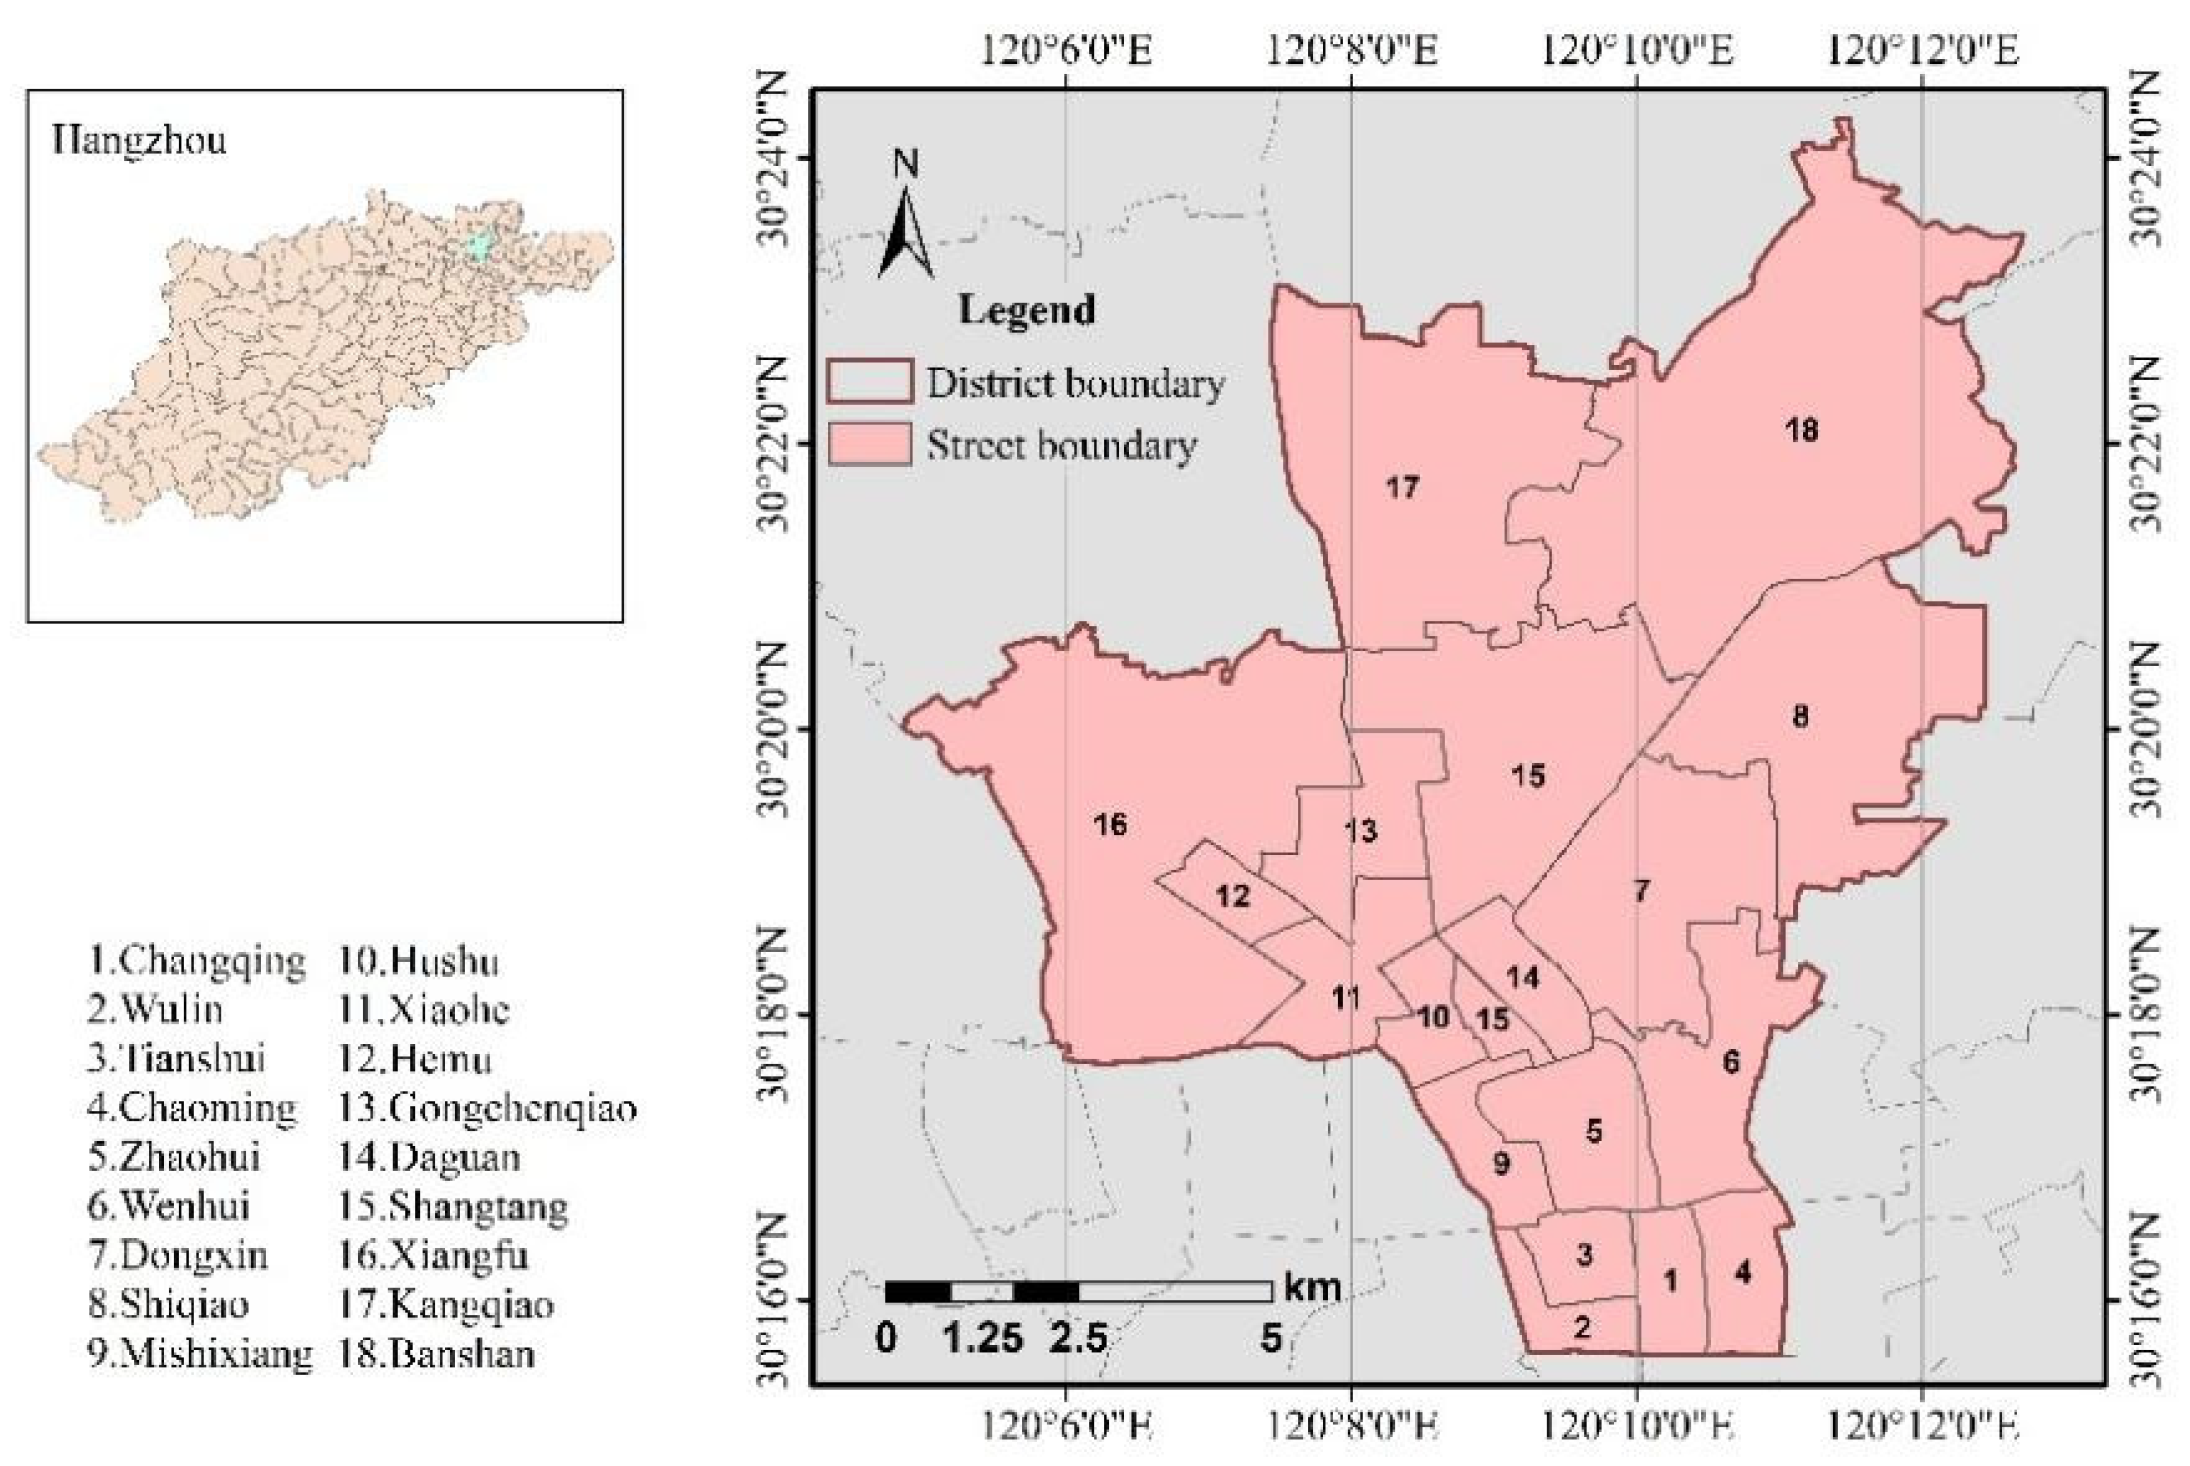
Figure 2.
Spatial distribution of urban parks with different areas.
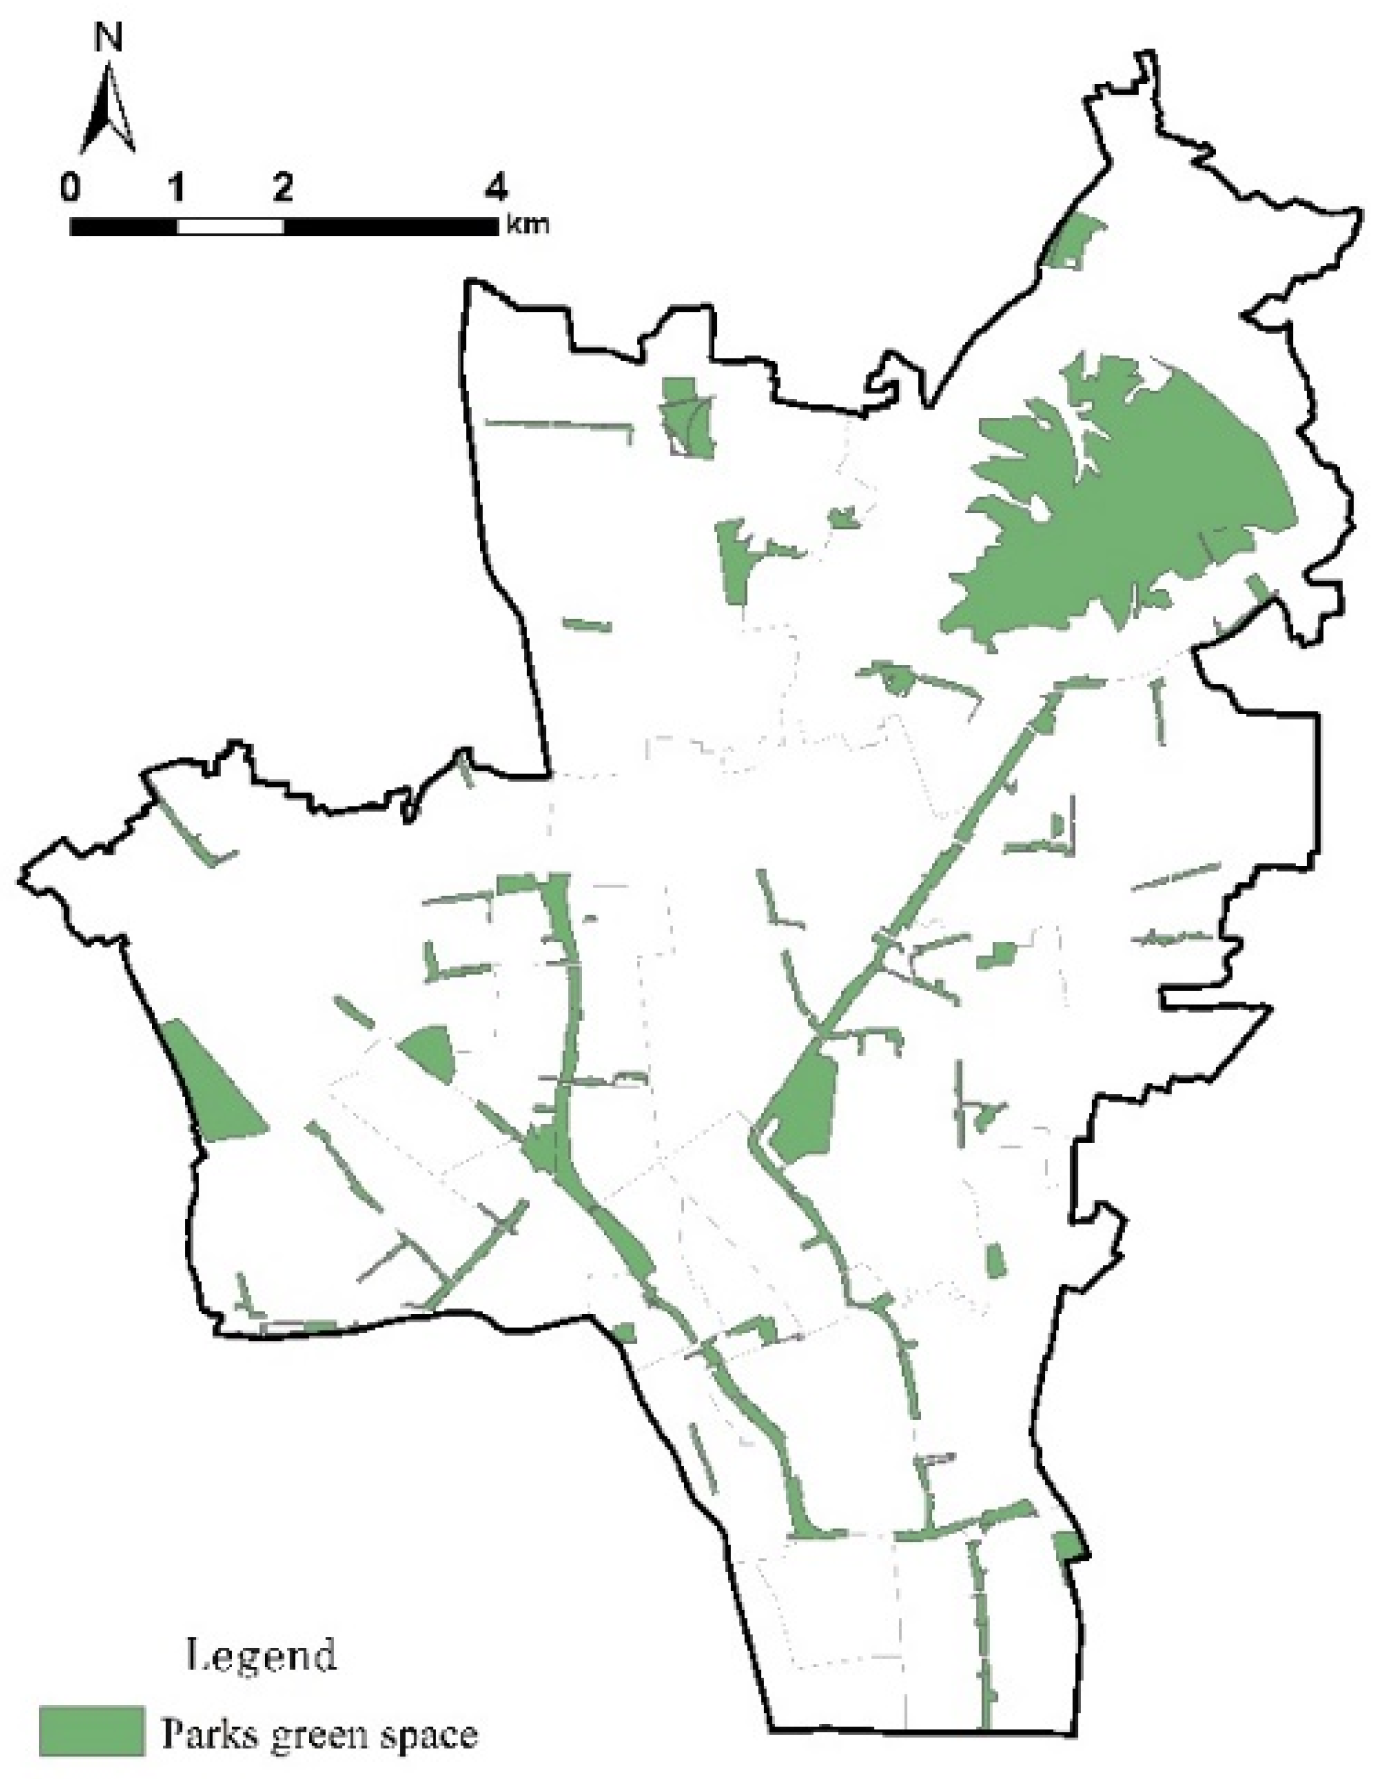
Figure 3.
Coupling analysis framework of "temporal behavior-spatial attribute-vitality typology".
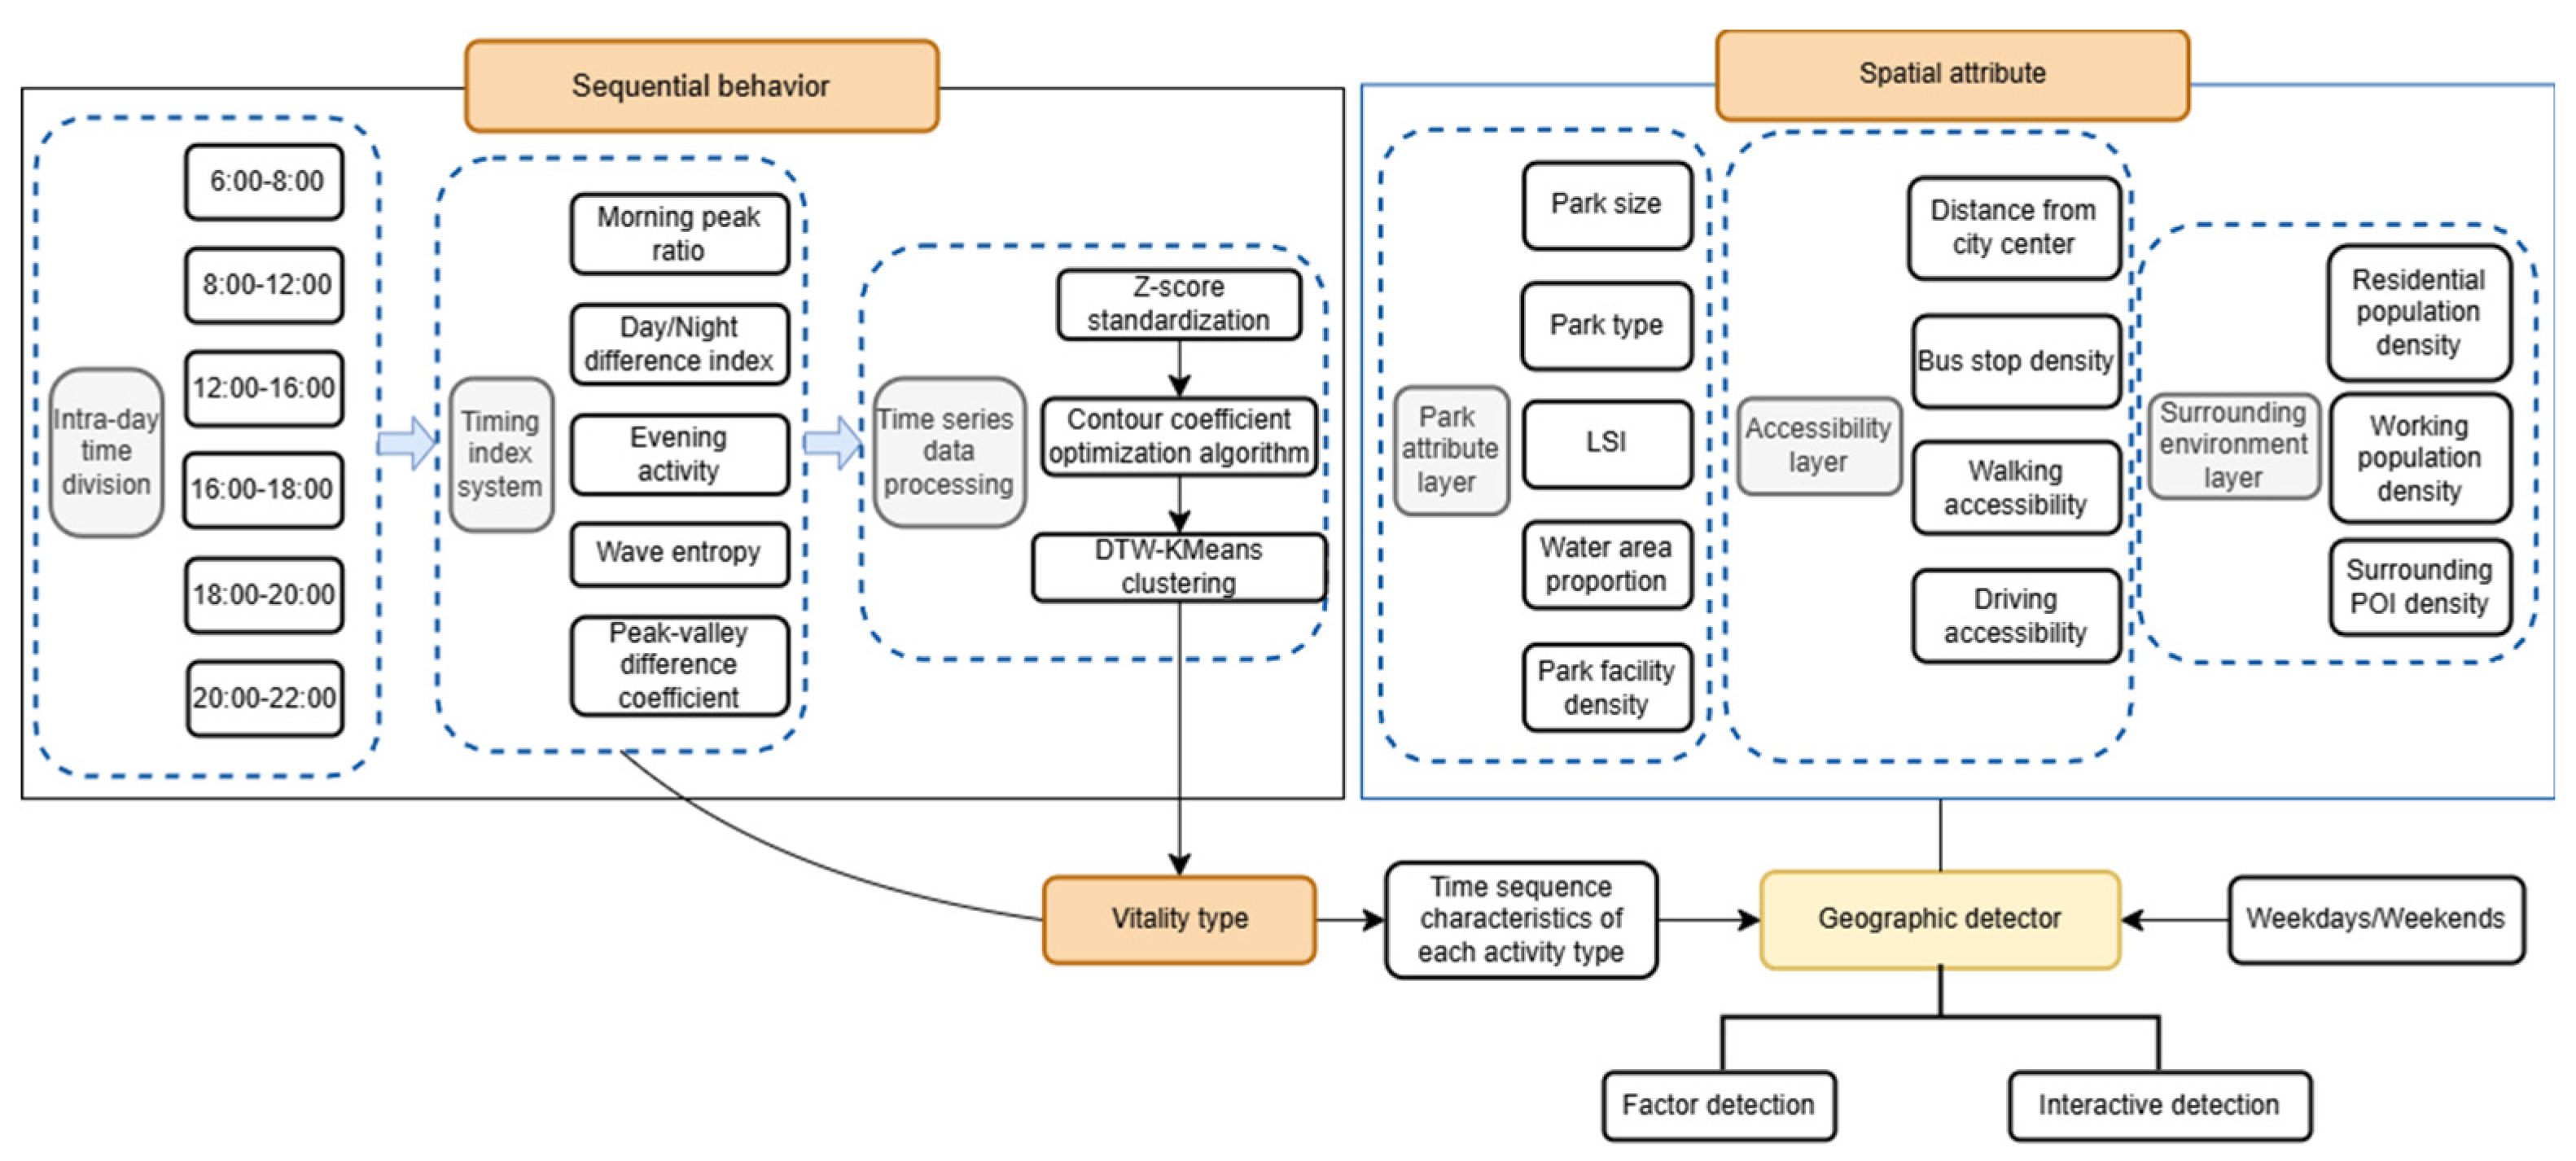
Figure 4.
Parallel coordinate map of the characteristic index of each activity type park in different.
Figure 4.
Parallel coordinate map of the characteristic index of each activity type park in different.

Figure 5.
Spatial distribution map of parks with active types in different time periods: (a) Weekday; (b) Weekend.
Figure 5.
Spatial distribution map of parks with active types in different time periods: (a) Weekday; (b) Weekend.
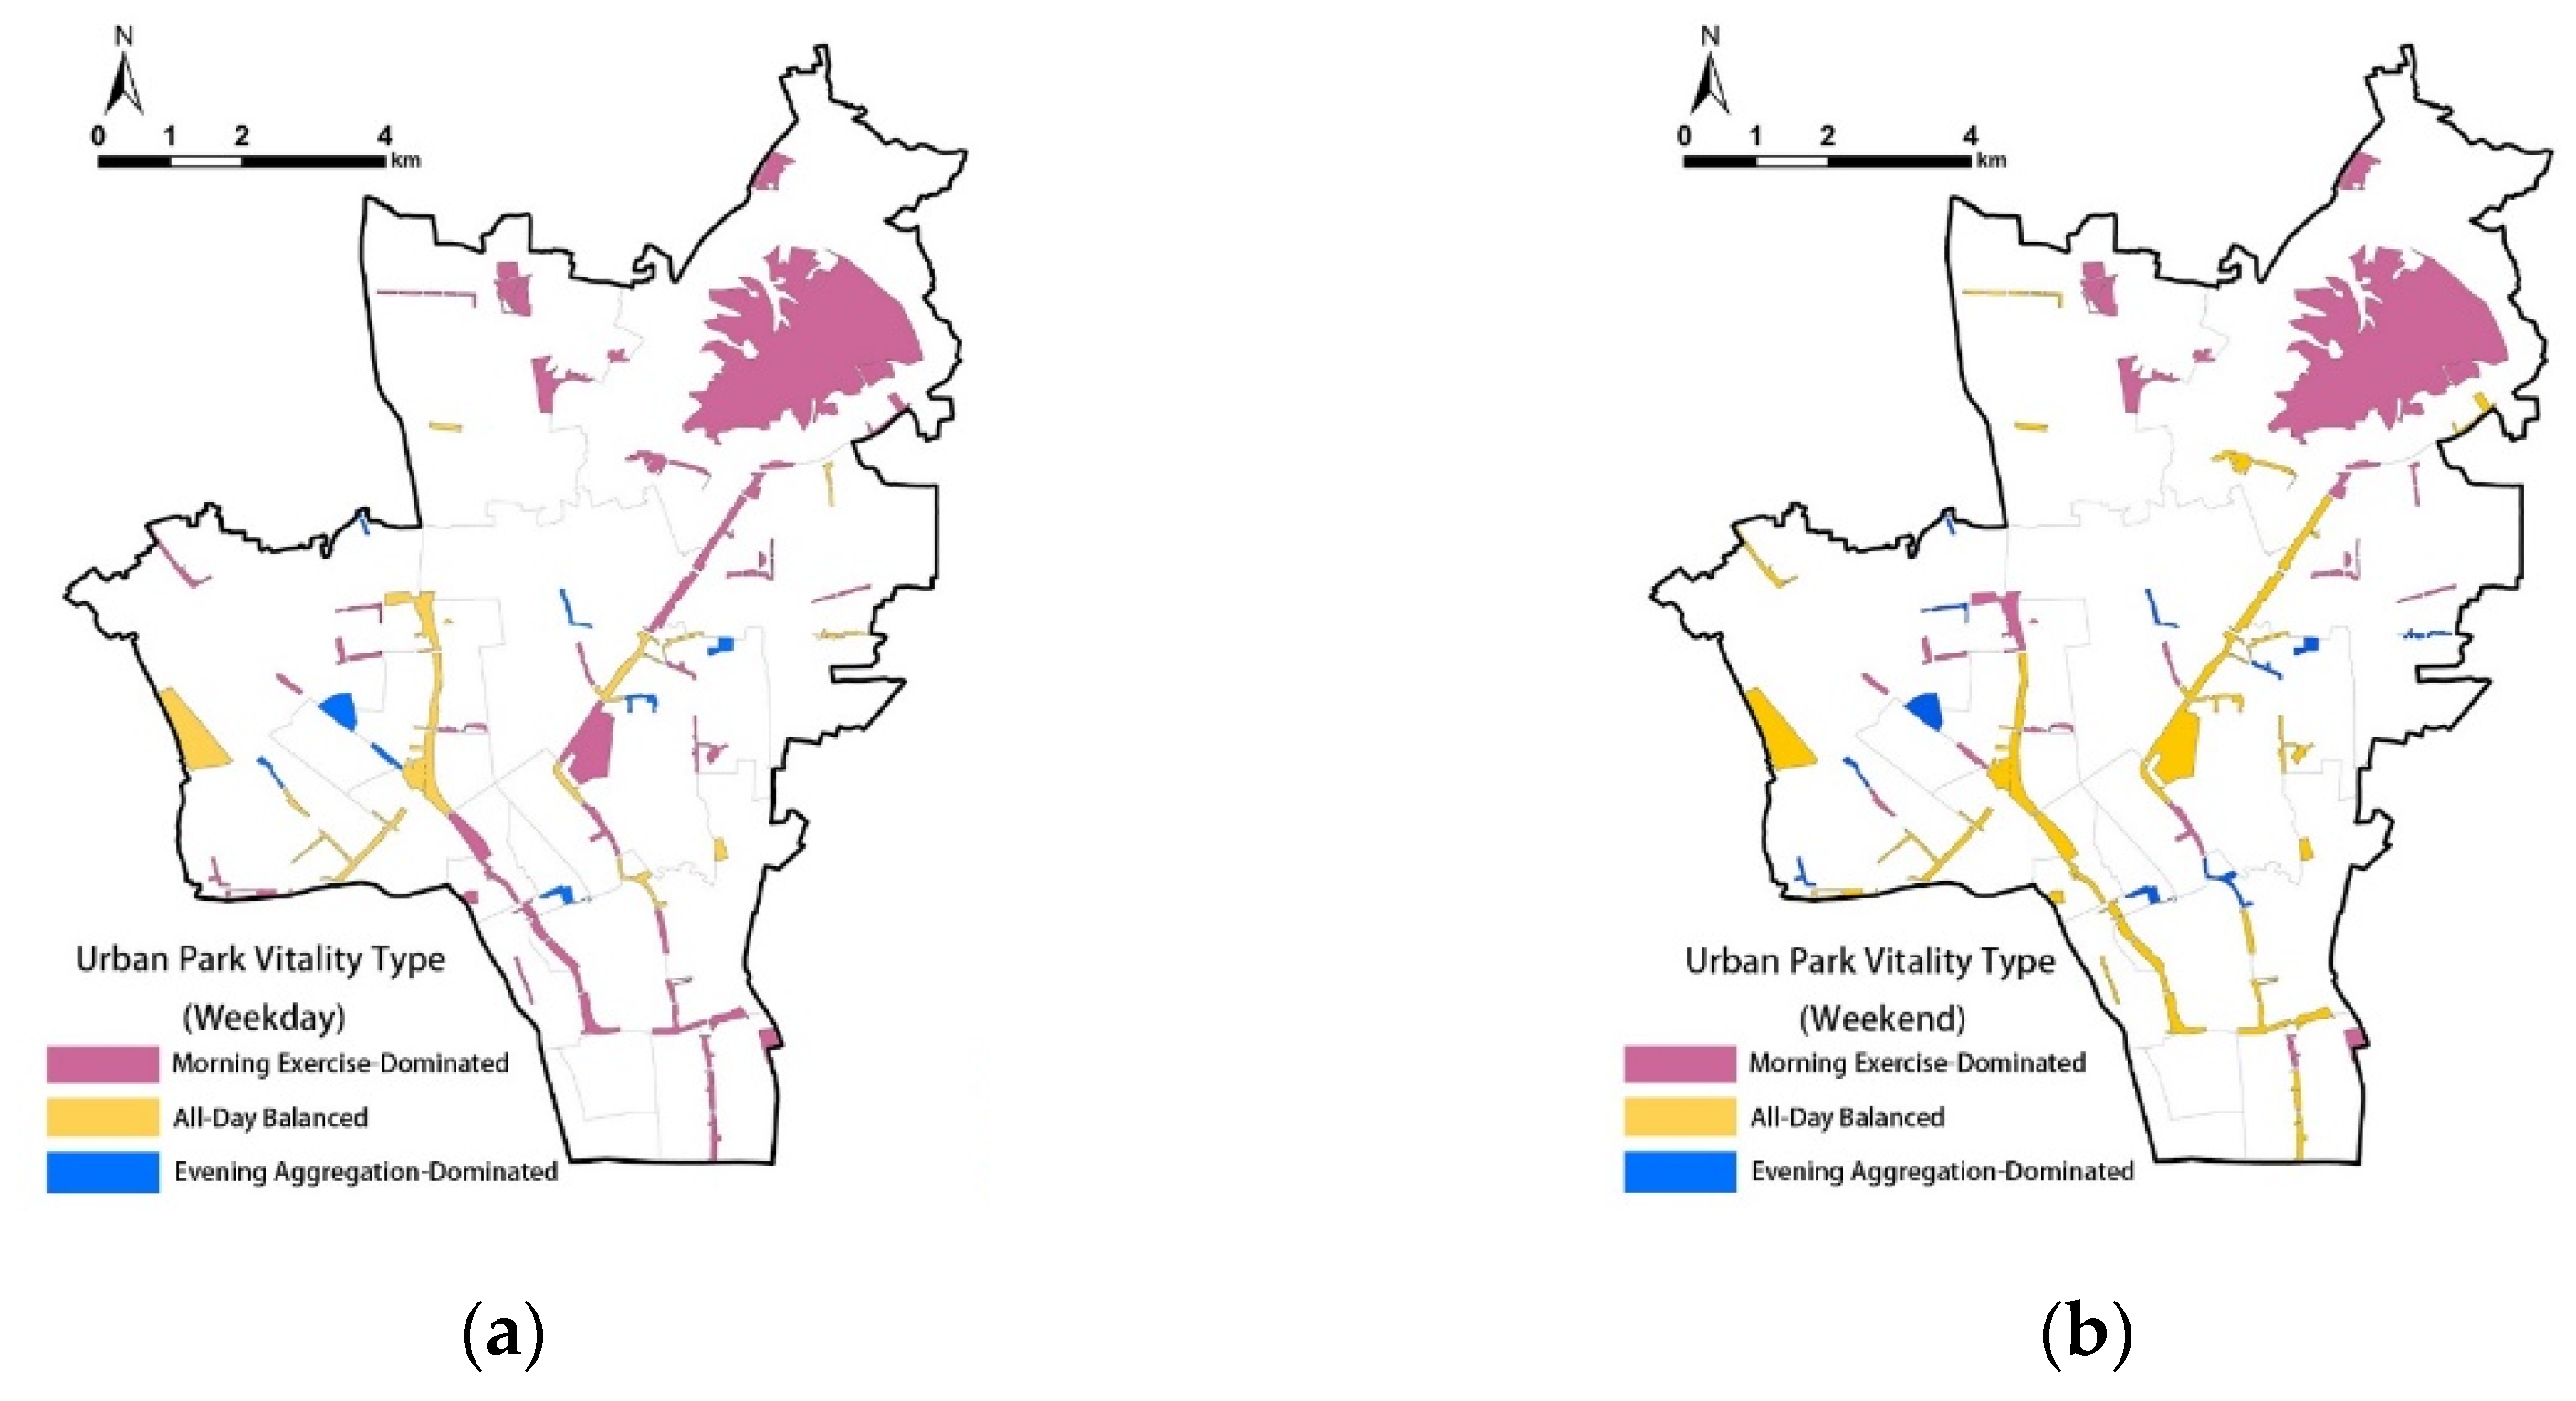
Figure 6.
Thermal map of each characteristic index influence factor detection on the weekends: (a) Morning peak ratio; (b) Evening activity; (c) Day/Night difference index.
Figure 6.
Thermal map of each characteristic index influence factor detection on the weekends: (a) Morning peak ratio; (b) Evening activity; (c) Day/Night difference index.
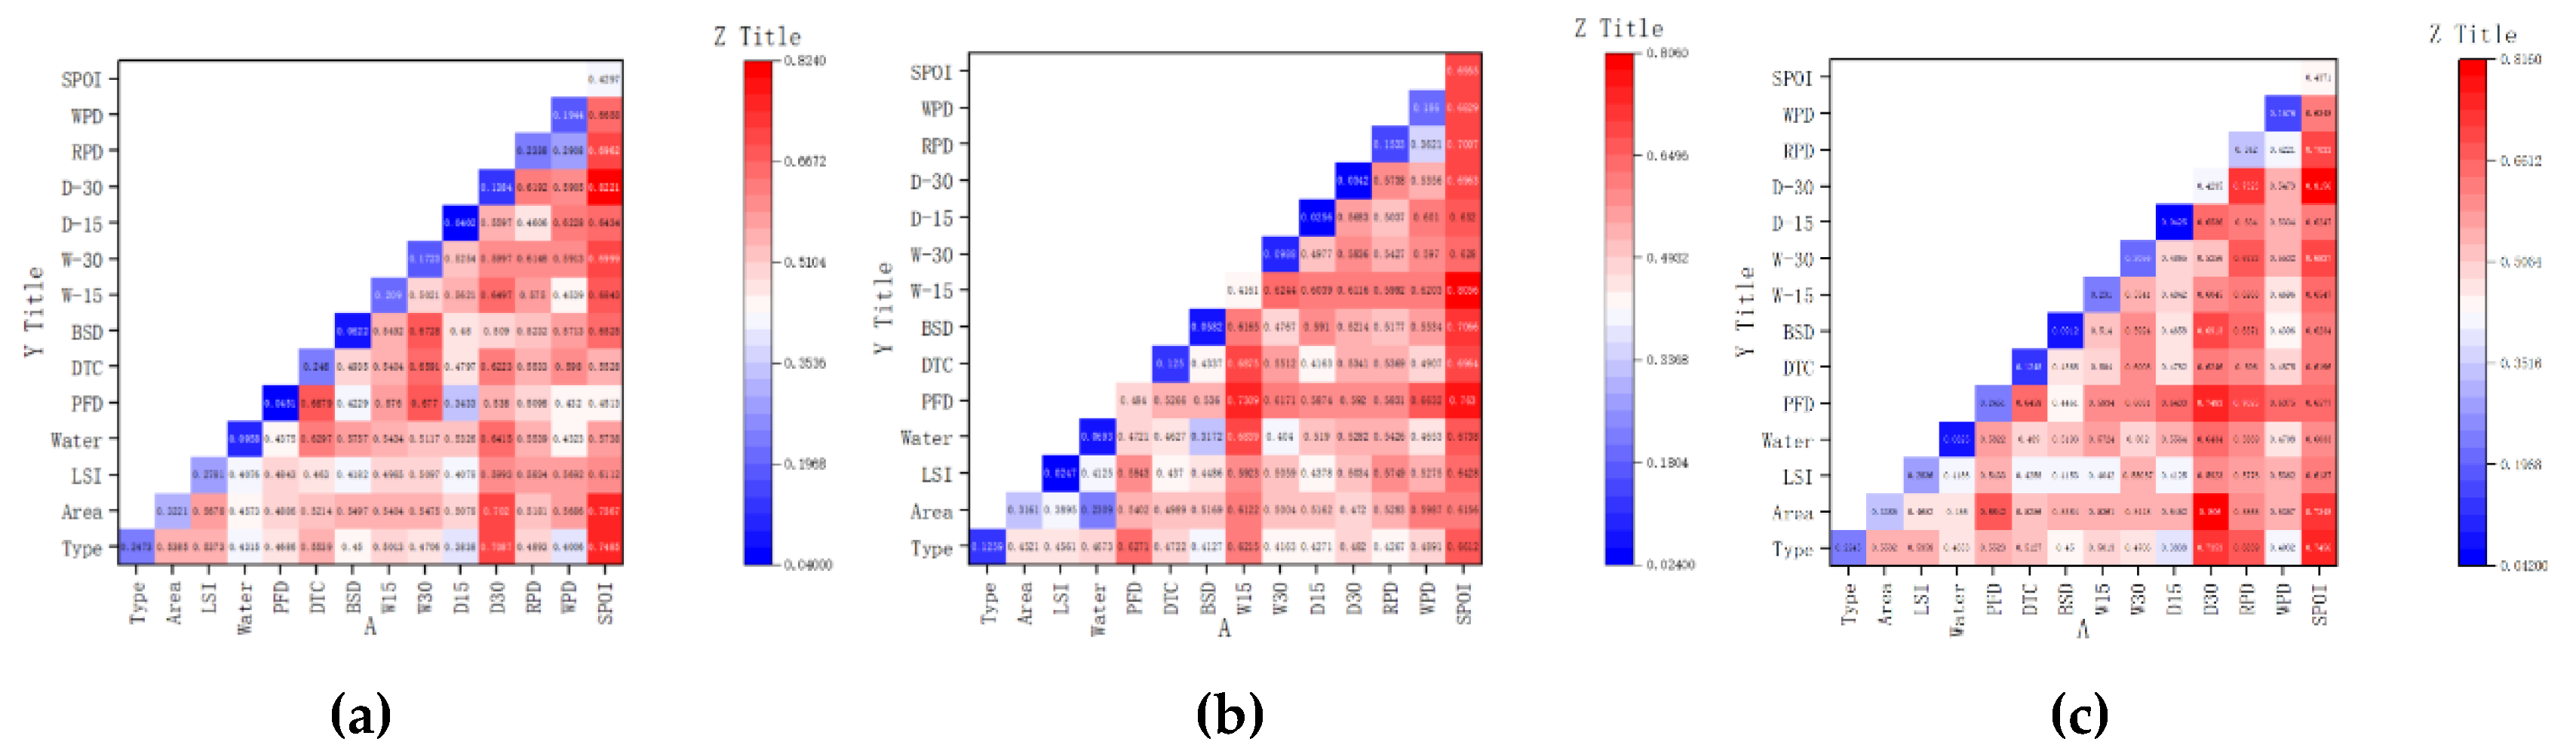
Figure 7.
Thermal map of each characteristic index influence factor detection on the weekdays: (a) Morning peak ratio; (b) Evening activity; (c) Day/Night difference index.
Figure 7.
Thermal map of each characteristic index influence factor detection on the weekdays: (a) Morning peak ratio; (b) Evening activity; (c) Day/Night difference index.
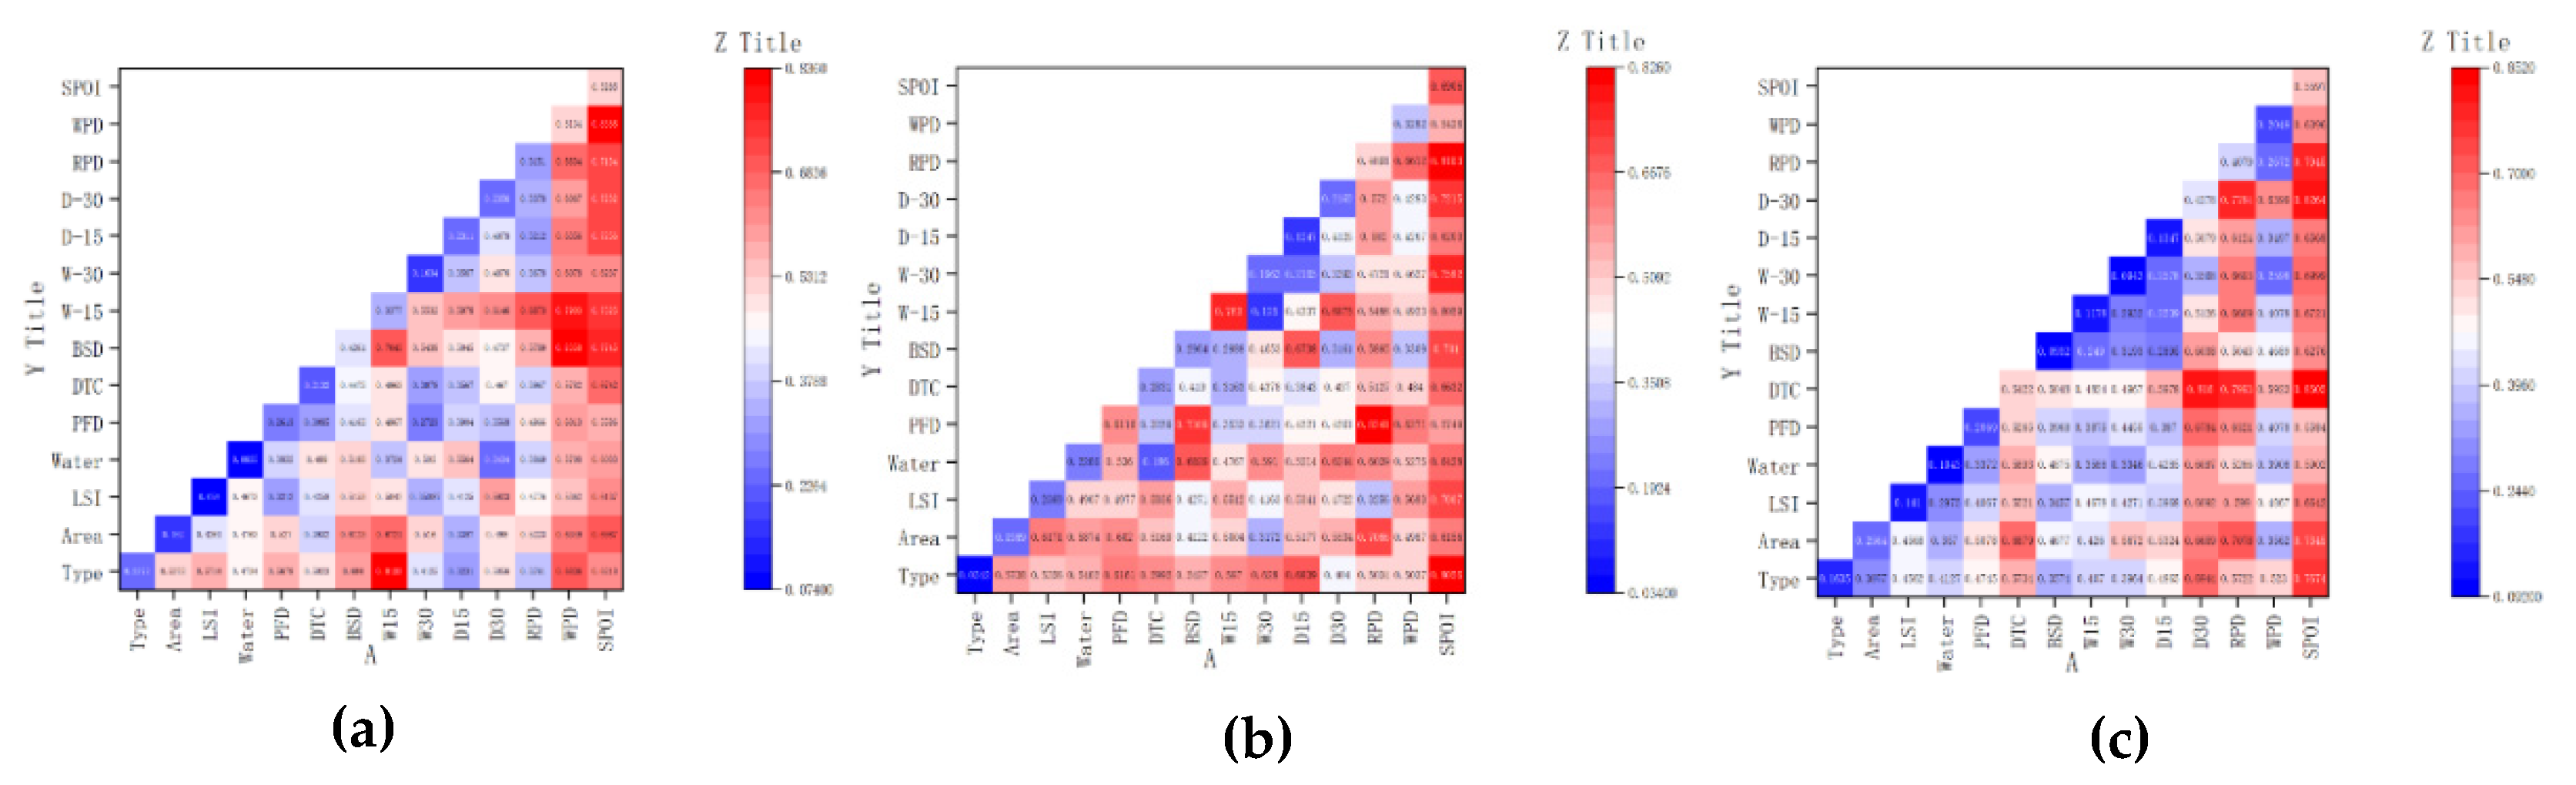
Figure 8.
Distribution of influence factors of each characteristic index of urban park in different time periods (q value): (a) Morning peak ratio; (b) Evening activity; (c) Day/Night different index.
Figure 8.
Distribution of influence factors of each characteristic index of urban park in different time periods (q value): (a) Morning peak ratio; (b) Evening activity; (c) Day/Night different index.
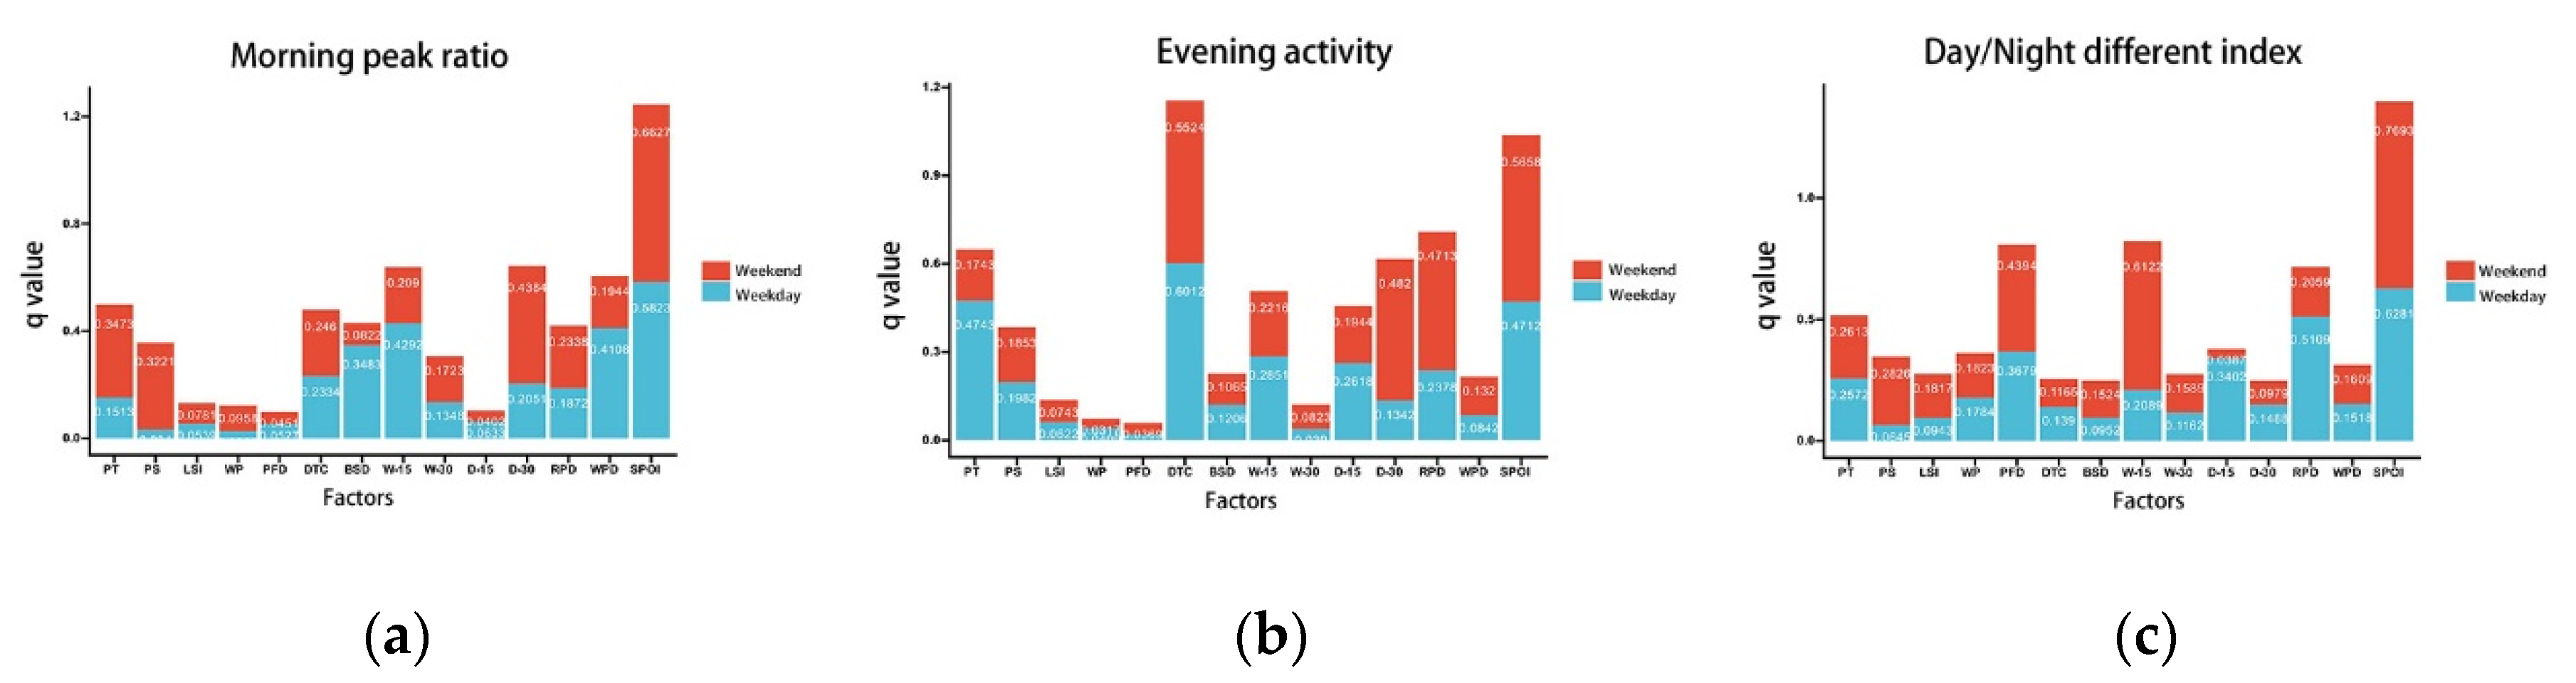

Table 1.
Variables: description and data sources.
| Variables | Description | Unit | Source | |
|---|---|---|---|---|
| Park-specific Attributes | PS | Park size | Ha | |
| PT | Park type | - | Comprehensive park(=7) Specialized park(=5) Community park(=3) Mini park(=1) |
|
| (LSI) Landscape shape index |
The landscape shape index | - | LSI=2 Si represents the area of the urban park I in hectares and Ci signifies the circumference of the park I in meters. |
|
| WP | Water proportion to the urban park area | water area / park area | ||
| (PFD) Park facilities density |
The density of park service, such as playgrounds, themed plazas, lounge corridors, restaurants, shops, toilets, and parking lots | n/ha | POI screening + map comparison | |
| Accessibility Features | (DTC) Distance to the city center |
The distance from the park to the city center | m | Euclidean distance from the city center (Wulin Square) to an urban park centroid |
| (BSD) Bus station density |
The density of the bus stations within buffer areas of each park. | n/ha | Buffer analysis was conducted based on data from AMAP POI(accessed on Apirl,2023) | |
| (W-15) Walking in an isochronous circle (15min) |
Area accessibility from walking for 15 min in non-peak hours on weekdays from the park | m2 | Used real-time path planning tool to obtain a grid file describing the time distance to the park. | |
| (W-30) Walking in an isochronous circle (30min) |
Area accessibility from walking for 30 min in non-peak hours on weekdays from the park | m2 | Used real-time path planning tool to obtain a grid file describing the time distance to the park. | |
| (D-15) Driving in an isochronous circle (15min) |
Area accessibility from driving for 15 min in non-peak hours on weekdays from the park | m2 | Used real-time path planning tool to obtain a grid file describing the time distance to the park. | |
| (D-30) Driving in an isochronous circle (30min) |
Area accessibility from driving for 30 min in non-peak hours on weekdays from the park | m2 | Used real-time path planning tool to obtain a grid file describing the time distance to the park. | |
| Surroundings Environmental Attributes | (RPD) Residential population density |
The density of the residential population within the buffer areas of each park | Population/ha | Buffer analysis was conducted based on mobile phone signaling data |
| (WPD) Working population density |
The density of the working population within the buffer areas of each park | Population/ha | Buffer analysis was conducted based on mobile phone signaling data | |
| SPOI | The density of surrounding services and POI in the buffer areas of each park | n/ha | Buffer analysis was conducted based on data from AMAP in 2023 |
Note: Factors were calculated in ArcGIS 10.2.
Table 2.
Correlation and significance of influencing factors of each characteristic index of urban parks on weekends: (A) Morning peak ratio; (B) Evening activity; (C) Day/Night difference index.
Table 2.
Correlation and significance of influencing factors of each characteristic index of urban parks on weekends: (A) Morning peak ratio; (B) Evening activity; (C) Day/Night difference index.
| (A) Morning peak ratio | ||||||||||||||
| Factor | PT | PS | LSI | WP | PFD | DTC | BSD | W-15 | W-30 | D-15 | D-30 | RPD | WPD | SPOI |
| q statistic | 0.3473 | 0.3221 | 0.0781 | 0.0958 | 0.0451 | 0.2460 | 0.0822 | 0.2090 | 0.1723 | 0.0402 | 0.4384 | 0.2338 | 0.1944 | 0.6627 |
| p value | 0.00 | 0.00 | 0.26 | 0.57 | 0.69 | 0.40 | 0.06 | 0.08 | 0.08 | 0.09 | 0.02 | 0.08 | 0.10 | 0.00 |
| (B) Evening activity | ||||||||||||||
| Factor | Type | Area | LSI | WP | PFD | DTC | BSD | W-15 | W-30 | D-15 | D-30 | RPD | WPD | SPOI |
| q statistic | 0.2613 | 0.2826 | 0.1817 | 0.1823 | 0.4394 | 0.1165 | 0.1524 | 0.6122 | 0.1589 | 0.0387 | 0.0979 | 0.2059 | 0.1609 | 0.7693 |
| p value | 0.10 | 0.07 | 0.18 | 0.82 | 0.04 | 0.34 | 0.66 | 0.00 | 0.22 | 0.13 | 0.08 | 0.08 | 0.17 | 0.01 |
| (C) Day/Night difference index | ||||||||||||||
| Factor | Type | Area | LSI | WP | PFD | DTC | BSD | W-15 | W-30 | D-15 | D-30 | RPD | WPD | SPOI |
| q statistic | 0.1743 | 0.1853 | 0.0743 | 0.0317 | 0.0369 | 0.5524 | 0.1065 | 0.2216 | 0.0823 | 0.1944 | 0.4820 | 0.4713 | 0.1320 | 0.5658 |
| p value | 0.88 | 0.06 | 0.14 | 0.87 | 0.95 | 0.02 | 0.64 | 0.08 | 0.28 | 0.23 | 0.03 | 0.01 | 0.12 | 0.03 |
Table 3.
Correlation and significance of influencing factors of each characteristic index of urban parks on weekdays: (A) Morning peak ratio; (B) Evening activity; (C) Day/Night difference index.
Table 3.
Correlation and significance of influencing factors of each characteristic index of urban parks on weekdays: (A) Morning peak ratio; (B) Evening activity; (C) Day/Night difference index.
| (A) Morning peak ratio | ||||||||||||||
| Factor | PT | PS | LSI | WP | PFD | DTC | BSD | W-15 | W-30 | D-15 | D-30 | RPD | WPD | SPOI |
| q statistic | 0.1513 | 0.034 | 0.0539 | 0.0263 | 0.0527 | 0.2334 | 0.3483 | 0.4292 | 0.1348 | 0.0633 | 0.2051 | 0.1872 | 0.4108 | 0.5823 |
| p value | 0.30 | 0.16 | 0.06 | 0.56 | 0.66 | 0.38 | 0.00 | 0.01 | 0.07 | 0.24 | 0.13 | 0.06 | 0.00 | 0.01 |
| (B) Evening activity | ||||||||||||||
| Factor | Type | Area | LSI | WP | PFD | DTC | BSD | W-15 | W-30 | D-15 | D-30 | RPD | WPD | SPOI |
| q statistic | 0.2572 | 0.0645 | 0.0943 | 0.1784 | 0.3679 | 0.1390 | 0.0952 | 0.2089 | 0.1162 | 0.3402 | 0.1488 | 0.5109 | 0.1518 | 0.6281 |
| p value | 0.11 | 0.79 | 0.08 | 0.82 | 0.03 | 0.25 | 0.57 | 0.10 | 0.20 | 0.03 | 0.58 | 0.00 | 0.09 | 0.00 |
| (C) Day/Night difference index | ||||||||||||||
| Factor | Type | Area | LSI | WP | PFD | DTC | BSD | W-15 | W-30 | D-15 | D-30 | RPD | WPD | SPOI |
| q statistic | 0.4743 | 0.1982 | 0.0622 | 0.0409 | 0.0216 | 0.6012 | 0.1206 | 0.2851 | 0.0390 | 0.2618 | 0.1342 | 0.2378 | 0.0842 | 0.4712 |
| p value | 0.01 | 0.23 | 0.12 | 0.79 | 0.90 | 0.01 | 0.53 | 0.06 | 0.31 | 0.24 | 0.18 | 0.06 | 0.28 | 0.01 |
Disclaimer/Publisher’s Note: The statements, opinions and data contained in all publications are solely those of the individual author(s) and contributor(s) and not of MDPI and/or the editor(s). MDPI and/or the editor(s) disclaim responsibility for any injury to people or property resulting from any ideas, methods, instructions or products referred to in the content. |
© 2025 by the authors. Licensee MDPI, Basel, Switzerland. This article is an open access article distributed under the terms and conditions of the Creative Commons Attribution (CC BY) license (http://creativecommons.org/licenses/by/4.0/).
Copyright: This open access article is published under a Creative Commons CC BY 4.0 license, which permit the free download, distribution, and reuse, provided that the author and preprint are cited in any reuse.


