
Submitted:
18 April 2025
Posted:
21 April 2025
You are already at the latest version
Abstract
Variations in facial complexion serve as a telltale sign of the underlying health conditions. Precisely categorizing facial complexions poses a significant challenge due to the subtle distinctions in facial features. Three multi-feature facial complexion classification algorithms leveraging convolutional neural networks (CNN) are proposed. They fuses, splices, or independently trains the features extracted from distinctly facial regions of interest (ROI),respectively. Innovative frameworks of the three algorithms can more effectively exploit facial features, improving the utilization rate of feature information and classification performance. The comprehensive evaluation reveals that multi-feature fusion and splicing classification algorithm achieve accuracies of 95.98% and 93.76%, respectively. The optimal approach combining multi-feature CNN with machine learning algorithms attains remarkable accuracy of 98.89%. Additionally, these experiments proved that multidomain combination was curial, and arrangement of ROI features including nose, forehead, philtrum, right and left cheek was the preferential choice for classification. Furthermore, we employed the EfficientNet model for training on the face image as a whole, which achieve a classification accuracy of 89.37%. The difference in accuracy underscores the superiority and efficacy of multi-feature classification algorithms. The employment of multi-feature fusion algorithms in facial complexion classification holds substantial advantages, ushering in fresh research directions in the field of facial complexion classification and deep learning.
Keywords:
facial complexion classification
; CNN
; machine learning
; multi-feature
1. Introduction
Inspection in Traditional Chinese Medicine (TCM), as a non-invasive diagnostic modality, offers a convenient way to assess health status through a patient's complexion, tongue coating, and overall vitality. The facial region maps to whole body with carrying holographic information to reflect the diseases and lesions of different viscera [1]. Facial complexion, serving as a crucial symptom, can offer practitioners an array of invaluable insights. Typically, practitioners relying on visual inspection to assess facial complexion are limited by professional accomplishments, and simultaneously affected by volatile external environments [2,3]. Therefore, the quantitative analysis of facial complexion classification by computer vision technology provides an objective and standardized criteria for TCM inspection [4]. The pathological complexion is generally divided into five kinds: cyan, red, sallow, pallid, and dark [6,7]. Each complexion is related to the corresponding organ and the degree of lesion [8]. The subtle inter-individual variations in facial characteristics make complexion classification a clinically challenging task, particularly in TCM diagnostic applications. Therefore, a crucial aspect lies in accurately categorizing the complexion.
Conventional facial complexion classification methods involve the application of machine learning algorithms to train and classify features extracted from different color spaces [9]. Lin et al. employed KNN, SVM and ELM for facial complexion recognition through utilizing primary features extracted by PCA (principal component analysis) in different color spaces [10–13]. Zheng et al. conducted lip color recognition by combining SVM and histograms [14]. Wang et al. utilized SVM algorithm for zygomatic color recognition by determining the percentage of red pixels on the face [15]. Sun et al. divided face complexion classification into overall classification and local classification by using Dlib library for segmentation of different facial regions, and exploited K-Means or SVM algorithms for face complexion classification respectively [16]. Overall, conventional methods rely on feature design, excellent features can accurately lead to beneficial information, while relatively poor features cannot bring about useful training information.
Deep learning has been a hot research direction in the field of machine learning in recent years. Convolutional neural networks based on deep learning can avoid artificial feature extraction and automatically extract useful features that are difficult for human eyes. Hou et al. improved the CNN-based CaffeNet model to classify tongue colors, thereby demonstrating the superiority of deep learning methods over conventional approaches in terms of practicality and accuracy [17]. Alami et al. proposed the utilization of pure quaternions to represent the RGB color components of images for face recognition by constructing a deep learning model [18]. Lin et al. employed convolutional neural network models such as AlexNet, VGGnet, and ResNet for facial complexion classification, and subsequently compared their performance with various machine learning methods [19]. All of their methods use the entire facial image as input, resulting in underutilization of feature information and interference from other factors.
In this paper, we introduce three multi-feature algorithms for facial complexion classification: a multi-feature fusion classification algorithm, a multi-feature splicing algorithm, and a multi-feature machine learning algorithm. We leverage the Dlib library to extract facial keypoints and partition them into six distinct regions of interest (ROI), which is analogous to how traditional Chinese medicine conducts diagnosis by evaluating multiple local facial features. This concept is also reflected in the holographic mapping phenomenon observed in biological systems [20]. Deep learning algorithms are trained by integrating various visual cues, much like how biological neural networks process multimodal sensory inputs [21]. Therefore, we apply convolutional neural networks to extract features for each ROI. The multi-feature fusion algorithm integrates diverse features into channels and incorporates grayscale information that reflect the multimodal information integration properties of the biological visual system. The multi-feature splicing algorithm splices the different ROI sections together for training, while the multi-feature machine learning classification algorithm employs a hybrid approach of deep learning and machine learning for classification. We tested and compared the three algorithms in the same environment. The multi-feature fusion algorithm attained a classification accuracy of 95.98%, the multi-feature splicing algorithm achieved a maximum accuracy of 93.76%, and the machine learning algorithm excelled with an accuracy of 98.89%. Finally, we delved into the correlation and importance of different ROI features. The bio-inspired approach bridges AI-driven diagnostics with traditional medical expertise and improves classification performance.
This paper is organized as follows. In section Ⅱ we will present our dataset and the specific steps of the proposed method. In section Ⅲ, we will present the experiment results of our methods. Finally, we will make a conclusion in Section Ⅳ.
2. Method Overview
In this section, we will describe the datasets and proposed methods in detail. The dataset is first segmented into separate face images for full facial complexion analysis and specific ROI segmentation. Secondly, three multi-feature classification algorithms are presented, namely multi-feature fusion classification algorithm, multi-feature splicing classification algorithm, and multi-feature classification algorithms with machine learning.
2.1. Dataset
The dataset comprises an extensive collection of facial images, curated to guarantee the utmost quality and consistency of the captured imagery. We collaborated with Shanxi University of Traditional Chinese Medicine to procure and compile these facial datasets. To ensure the objectivity and effectiveness of classification, facial data were collected using specialized equipment under controlled lighting conditions.
During the collection process, we maintained the shooting environment's standards and stability, ensuring the pristine quality of facial images. We gathered facial images from 600 patients, spanning ages from 18 to 70 years, with an image resolution of 3840×2160 pixels. The categorization of facial complexions was collaboratively labeled by several TCM practitioners. Given the challenges in collecting data on cyan facial complexion, we segmented it into five distinct categories: dark, red, pallid, sallow, and normal. Subsequently, as depicted in Figure 1, the gathered facial data underwent preprocessing using the Deeplab3+ model [22], effectively eliminating background information and yielding a segmented facial dataset tailored for experimental purposes. We further augmented the processed data through horizontal flipping, ultimately culminating in a final dataset comprising 721 images. The ratio of the five categories stands at 131:134:168: 160:128.
2.2. Method
We will describe the three proposed methods in detail for facial complexion classification, namely the multi-feature fusion algorithm, the multi-feature splicing algorithm, and the multi-feature classification algorithms combined with machine learning, respectively. They combine six features (nose, forehead, philtrum, chin, right cheek, left cheek) for classification. According to the theory of TCM, facial complexion is systematically classified into five canonical categories: dark, red, pallid, sallow, normal.
2.2.1. Multi-Feature Fusion Classification Algorithm
a) Utilizing the Dlib library, we calibrated 68 crucial facial landmarks. Based on the coordinates of these key points, the face is segmented into six representative ROIs as shown in Figure 2: nose, forehead, philtrum, chin, right cheek, and left cheek. While everyone possesses the same facial landmarks, variations in facial dimensions lead to disparities in the sizes of the six ROIs. Consequently, we determine the coordinates of each ROI by selectively referencing the keypoints within the captured images, ensuring consistency in ROIs shapes. For example, the chin area is calculated using the coordinates of keypoints 9th, 56th, 58th and 60th.
b) In this phase, we integrated diverse ROI features, leveraging a convolutional neural network for feature extraction. Beyond merging the RGB color data of the ROI segments, we incorporated grayscale information to enrich the extracted features. The input image was set at a size of 224x224 pixels, with an initial channel count of 4. The convolutional neural network's primary function at this juncture is to individually extract features from the ROI locations and subsequently fuse them.
We employ the pre-trained EfficientNet [23] model for extracting features from ROIs. EfficientNet consists of a series of repetitive MBConv modules, where each MBConv uniquely integrates the SE module. Its final layer combines global pooling and a fully connected layer. Initially, we utilize a sequence of MBConv modules to extract features from ROIs. Subsequently, following global pooling, each face image yields a 1280*N feature vector, where N represents the number of ROI features. Furthermore, we experimented with replacing the SE module with alternative attention mechanisms, but the enhancement was relatively modest.
We utilize the PyTorch framework to pre-train and subsequently fine-tune the face features. We configure the batch_size as 16, ensuring that the final extracted feature vector attains a shape of (16, 1280, N), where N denotes the number of ROI features. For training our network, we employ the SGD optimization algorithm, initiating the learning rate at 0.01, setting the momentum to 0.9, and applying a weight decay of 0.0001. The entire training process spans overall 50 epochs.
c) The extracted feature vector ultimately assumes a shape of (16, 1280, N), where N can be either 6 or 5. Our analysis encompassed overall 6 ROI parts, two of which—the philtrum and chin—share similar color characteristics. We conducted ablation experiments to determine the optimal combination for classification. Following the flatten operation, the feature vector's shape transforms to (16, 1280*N), enabling its input into the fully connected layer for classification.
Notably, we employed a convolutional neural network to extract features from each ROI site. Consequently, during prediction, the initial input to the network remains a complete face image. After ROI segmentation, the convolutional neural network proceeds to extract and evaluate the respective features.
2.2.2. Multi-Feature Splicing Classification Algorithm
The multi-feature splicing classification algorithm adopts the identical set of ROI features as its predecessor but with a distinct twist. In this iteration, we interlace images of distinct ROI segments and reshape them to create a novel data image.
Initially, we acquired segmented visuals of 6 ROI locations. To enhance the model's training, we adjusted all the images with the same height-to-idth ratio but different sizes to the same size. We opt for the median size as the standardized dataset measure, ensuring that color details remain intact despite the dimensional alteration. Six ROI images with different sizes were obtained after data processing. As shown in Figure 3, these images were firstly spread in the channel dimension to get the data with the shape of (h*w, 3). Then the six ROI parts data of each face were merged in the first dimension. Finally, we get N sets of data with shape (6*h*w, 3), where N is the number of faces. Of course, here the h and w of the six groups of ROI data are not the same.
To standardize the data, we transformed its dimensions to achieve a shape of (h, w, 3), where h and w are determined by the images of the six sets of ROI sites. This final data was then saved in image format, creating a novel dataset as illustrated in Figure 3. Additionally, we conducted ablation tests to identify which combinations of ROI features yielded the most accurate predictions.
2.2.3. Multi-Feature Classification Algorithms with Machine Learning
As shown in Figure 4, the algorithm relies primarily on images of the ROI features. We leverage EfficientNet to train each of the six ROI datasets, ultimately deriving prediction weights for the respective sites. The trained model is then employed to predict ROI images, yielding six sets of predicted data. The predicted categories are compared against the actual categories, resulting in a numerical dataset.
Subsequently, we normalize and standardize the five categories, numbering them (dark, red, pallid, sallow, normal) from 1 to 5, and segregating them into training and testing sets. Various machine learning techniques, including KNN, Decision Tree, Random Forest, Linear Regression, SVM, and XGBoost, are utilized to train and predict the new dataset. Additionally, ablation experiments are conducted to assess the optimal combinations of features and algorithms.
2.3. Evaluation Indicators
The model's performance is evaluated using Precision (P), Recall (R), and F1-score. F1-score is the harmonic mean of precision and recall. The formula for P, R, and F1-score is as follows:
Here, TP (true positives) denotes correctly classified positive samples, FP (false positives) indicates misclassified positive samples, and FN (false negatives) refers to misclassified negative samples. Precision quantifies the probability that a model's predicted positive classes are truly positive, whereas recall evaluates the model's capability to identify all positive instances.
3. Experimental Results
We train and predict the three algorithms and perform ablation experiments with different combinations of features. In addition, we also conducted correlation analysis and importance analysis for five ROI regions.
3.1. Results of Multi-Feature Fusion Classification Algorithm
We initially assessed the efficacy of the multi-feature fusion classification algorithm, and the results for the five categories are presented in Table 1. Notably, the precision for the sallow complexion category achieved a peak of 97.62%, while the recall for the red complexion category stood at 97.02%. Moreover, the F1-score for the pallid complexion category excelled, reaching 96.88%. These findings demonstrate the remarkable classification performance of our proposed facial complexion classification algorithm.
3.2. Comparison of Different Algorithms and Ablation Experiments
To further scrutinize the classification performance of our algorithm, we conducted comparative experiments with two facial complexion classification algorithms under identical conditions. Experiments 2-1, 2-2, and 2-3 represented ablation experiments of the second algorithm, employing three distinct feature combinations for training, similar to the first algorithm. A selection of these comparative experiments is outlined in Table 2. Experiment 1-1 involved eliminating grayscale features and solely relying on the three RGB color channels for feature fusion. Experiment 1-2 entailed directly concatenating the extracted features from the four channels, aligning with the pixel distribution. Experiment 1-3 and 1-4 served as ablation studies of our proposed algorithm, utilizing features from five distinct facial regions (nose, forehead, chin, right cheek, and left cheek) and all six regions for fusion, respectively.
As depicted in Table 3, all three experimental results of multi-feature splicing classification algorithm achieved more than 90% accuracy. While the algorithm exhibited commendable classification results in experiments 2-1, 2-2, and 2-3, it still paled compared with the first algorithm. Feature fusion using three color channels alone yields slightly inferior classification results compared to incorporating grayscale channels. Specifically, in Experiment 1-2, directly concatenating features based on pixel distribution resulted in the lowest accuracy of just 40.50%. The accuracies of 92.79% and 94.01% for Experiments 1-3 and 1-4 show that the combination of nose, forehead, philtrum, right cheek, and left cheek features leads to the best classification results. Additionally, these experiments revealed the optimal combination of ROI features for classification.
Furthermore, we present the results of experiment 2-1 and 2-5 in the form of distinct bar charts to provide a more intuitive illustration of the classification effect. As depicted in Figure 5, the comparison reveals that the three-channel multi-feature fusion algorithm boasts a superior recognition accuracy for the dark category, whereas the four-channel approach excels in recognizing the red and normal categories. Notably, there is no significant disparity in the overall recognition accuracy between the two algorithms.
A separate experiment was performed for the third algorithm, starting with the use of the ROI dataset's trained weights for prediction. Subsequently, the five categories (dark, red, pallid, sallow, normal) were assigned numerical values ranging from 1 to 5. The predictive metrics pertaining to the six ROI features are presented in Table 4, indicating that the forehead achieved the highest combined accuracy of 95.15%, while the left cheek recorded the lowest accuracy of 81%.
We acquired a categorized set of prediction data ranging from 1 to 5, subsequently normalizing and standardizing the data. We employed various machine learning methods for training purposes. The outcomes of the ablation experiments are detailed in Table 5, with the 'chin' column indicating the inclusion of chin in the five-feature set, and the 'philtrum' column following suit. Notably, the XGBoost algorithm emerged as the most accurate, achieving a 98.89% accuracy, where its composition of ROI features encompassed the philtrum. This remarkable result surpasses the performance of the first algorithm. Other machine learning algorithms yielded accuracies of 93.92%, 95.58%, 94.47%, 92.81%, 94.41%, and 92.26%, respectively.
After conducting an exhaustive comparison among the three classification algorithms, it was determined that the multi-feature combined with machine learning delivered the highest classification accuracy. Specifically, when integrated with the XGBoost algorithm, an impressive accuracy of 98.89% was attained. In contrast, the peak accuracy rates for the other two algorithms stood at 95.98% and 93.76%, respectively. This outcome can be attributed to the preliminary classification of facial features using the EfficientNet model, which preceded the application of machine learning techniques. Furthermore, XGBoost stands out as a potent and adaptable machine learning algorithm, renowned for its efficiency and exceptional performance. Additionally, we attempted training the entire face image directly using the EfficientNet model, yielding a classification accuracy of 89.37%. However, this result pales in comparison to the efficacy of our proposed algorithm.
3.3. Correlation and Importance Analysis
Moreover, we performed a comprehensive correlation and importance analysis encompassing six ROI regions. Initially, we employed the Pearson correlation coefficient to quantify the degree of association between two distinct ROI regions. This coefficient ranges from 0 to 1, where a value closer to 1 signifies a stronger correlation. Figure 6(a) presents the correlation heatmap, wherein the intensity of color depicts the strength of the correlation; darker shades indicate a higher correlation, while lighter shades represent a weaker correlation. For example, from this visualization, it is evident that the chin exhibits a significant correlation with the forehead and a weaker correlation with the right cheek.
To assess the importance of each ROI region, we leveraged the XGBoost algorithm to quantify their contribution to the overall forecasting accuracy. As depicted in Figure 6(b), the forehead emerged as a highly significant region, whereas the philtrum and right cheek contributed relatively less. Additionally, we observed a distance in the importance score attributed to the left and right cheeks, which necessitated a more thorough investigation of the initially collected dataset. Our examination unveiled that certain patient had a preference for being photographed with their faces slightly turned, leading to an asymmetry in the left and right facial structures within the gathered data. Notably, this asymmetry did not exert influence on the face complexion classification outcomes.
4. Conclusions
The human face, akin to a mirror, serves as a window to reflect the body's underlying diseases and lesions. To address the challenge of accurately categorizing facial complexion, we introduce three innovative multi-feature classification algorithms based on convolutional neural networks. These algorithms are trained and make predictions by learning from different facial ROI features. Among the proposed methods, the multi-feature fusion algorithm excelled, achieving a commendable classification accuracy of 95.98%. The multi-feature splicing algorithm attained a maximum accuracy of 93.76%. Notably, the algorithm with machine learning, specifically the XGBoost algorithm, surpassed all others, boasting an impressive accuracy of 98.89%. Furthermore, we conducted correlation and importance analysis to gain deeper insights into the impact of various ROI features on the classification outcomes. In summary, the multi-feature classification algorithms verify effectiveness of multidomain combination and improve the accuracy of facial complexion classification. The bio-inspired lays an important foundation for the development of non-invasive diagnostic and health monitoring technology.
CRediT author contribution statement
Xiyuan Cao: Supervision, Validation, Writing-review and editing. Delong Zhang: Methodology, visualization, Writing-original draft, Chunyang Jin: Data curation, Formal analysis, Software. Zhidong Zhang: Funding acquisition, Supervision, Validation. Chenyang Xue: Funding acquisition, Supervision.
Data availability
Data will be made available on request.
Acknowledgments
This work was supported by the Key Research and Development Program of Shanxi Province [No. 202102130501011], the National Natural Science Foundation of China [No. 62204231], and the Key Research and Development Program of Hainan Province [No. ZDYF2022SHFZ304].
Declaration of competing interest
The authors declare that they have no known competing financial interests or personal relationships that could have appeared to influence the work reported in this paper.
References
- Jin B, Cruz L, Gonçalves N. Deep facial diagnosis: deep transfer learning from face recognition to facial diagnosis[J]. IEEE Access, 2020, 8: 123649-123661.
- Tian D, Chen W, Xu D, et al. A review of traditional chinese medicine diagnosis using machine learning: Inspection, auscultation-olfaction, inquiry, and palpation[J]. Computers in Biology and Medicine, 2024: 108074.
- Xu M, Guo C, Hu Y, et al. Automatic Facial Complexion Classification Based on Mixture Model[C]//Advances in Multimedia Information Processing–PCM 2017: 18th Pacific-Rim Conference on Multimedia, Harbin, China, September 28-29, 2017, Revised Selected Papers, Part II 18. Springer International Publishing, 2018: 327-336.
- Zhang B, Wang X, Karray F, et al. Computerized facial diagnosis using both color and texture features[J]. Information Sciences, 2013, 221: 49-59.
- Yang Yuncong, Zhang Jing, Zhuo Li, et al. Face region segmention applying in face diagnosis of traditional Chinese medicine[J]. Measurement & control technology, 2012, 31(5): 25-28.
- Zhuo L, Yang Y, Zhang J, et al. Human facial complexion recognition of traditional Chinese medicine based on uniform color space[J]. International Journal of Pattern Recognition and Artificial Intelligence, 2014, 28(04): 1450008.
- Zhao C, Li G, Li F, et al. Qualitative and quantitative analysis for facial complexion in traditional Chinese medicine[J]. BioMed Research International, 2014, 2014.
- Jmal M, Mseddi W S, Attia R, et al. Classification of human skin color and its application to face recognition[C]//MMEDIA 2014: the Sixth International Conference on Advances in Multimedia, IARIA. 2014.
- Lin Y, Wang B. Facial Complexion Recognition of Traditional Chinese Medicine Based on Computer Vision[C]//2020 5th International Conference on Computational Intelligence and Applications (ICCIA). IEEE, 2020: 113-117.
- Eyupoglu, C. Implementation of color face recognition using PCA and k-NN classifier[C]//2016 IEEE NW Russia Young Researchers in Electrical and Electronic Engineering Conference (EIConRusNW). IEEE, 2016: 199-202.
- Zhang J, Wang C, Zhuo L, et al. Uniform color space based facial complexion recognition for traditional Chinese medicine[C]//2014 13th International Conference on Control Automation Robotics & Vision (ICARCV). IEEE, 2014: 631-636.
- Chen M, Cen Y, Xu J, et al. Study on observation diagnosis automatic complexion recognition based on image processing[J]. Chinese Journal of Information on TCM, 2018, 25(12): 97-101.
- Zheng, Lili;Li, Xiaoqiang;Yan, Xiping;Li, Fufeng;Zheng, Xiaoyan;Li, Wei.Lip color classification based on support vector machine and histogram[J].Proceedings - 2010 3rd International Congress on Image and Signal Processing, CISP 2010,2010,Vol.4: 1883-1886.
- Wang J, Li X, Yan X, et al. Classification of zygomatic color based on support vector machine in traditional Chinese medicine inspection[J]. Beijing Biomedical Engineering, 2012, 31(1): 1-6.
- Sun K, Sun Q, Li S, et al. Research on TCM color extraction and recognition based on the convolutional neural network[J]. China Journal of Traditional Chinese medicine and Pharmacy, 2021, 36(7): 4286-4290.
- Hou J, Su H Y, Yan B, et al. Classification of tongue color based on CNN[C]//2017 IEEE 2nd international conference on big data analysis (ICBDA). IEEE, 2017: 725-729.
- El Alami A, Lakhili Z, Mesbah A, et al. Color face recognition by using quaternion and deep neural networks[C]//2019 International Conference on Wireless Technologies, Embedded and Intelligent Systems (WITS). IEEE, 2019: 1-5.
- Lin, Y. Complexion classification based on convolutional neural network[J]. Journal of Artificial Intelligence Practice, 2020, 3(1): 22-30.
- Gellis, M. The Unique Aspects of Diagnosing and Treating the Face in Chinese Medicine[J]. Journal of Chinese Medicine (JCM), 2021 (125).
- Tan H, Zhou Y, Tao Q, et al. Bioinspired multisensory neural network with crossmodal integration and recognition[J]. Nature communications, 2021, 12(1): 1120.
- Chen L C, Zhu Y, Papandreou G, et al. Encoder-decoder with atrous separable convolution for semantic image segmentation[C]//Proceedings of the European conference on computer vision (ECCV). 2018: 801-818.
- Tan M, Le Q. Efficientnet: Rethinking model scaling for convolutional neural networks[C]//International conference on machine learning. PMLR, 2019: 6105-6114.
Figure 1.
Examples of face before and after cutting. Although we had obtained consent from the patients at the time of photo collection, we still applied mosaic processing to their portraits.
Figure 1.
Examples of face before and after cutting. Although we had obtained consent from the patients at the time of photo collection, we still applied mosaic processing to their portraits.
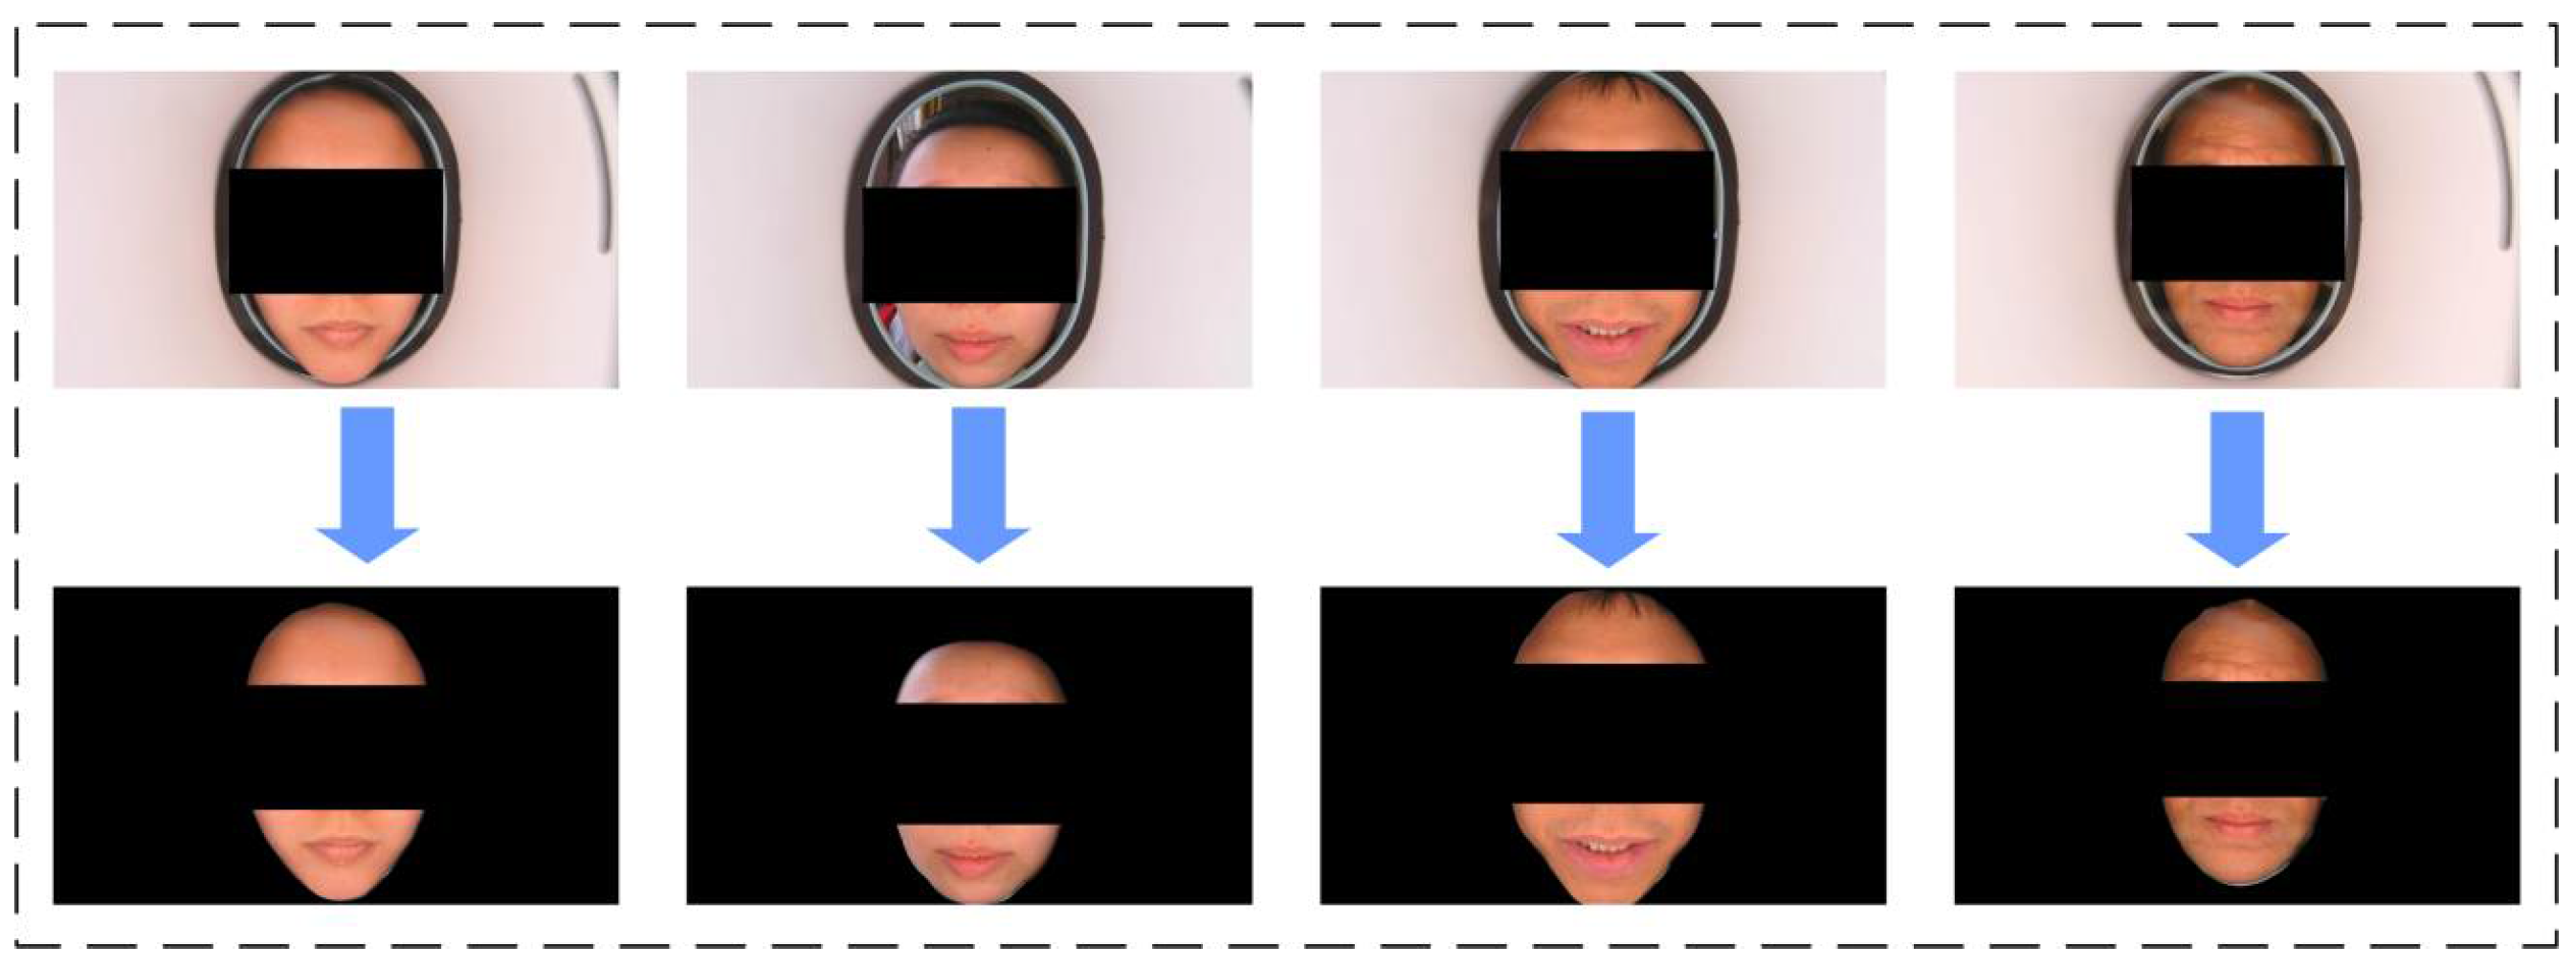
Figure 2.
Framework of the multi-feature fusion classification algorithm, where the network used is EfficientNet.
Figure 2.
Framework of the multi-feature fusion classification algorithm, where the network used is EfficientNet.
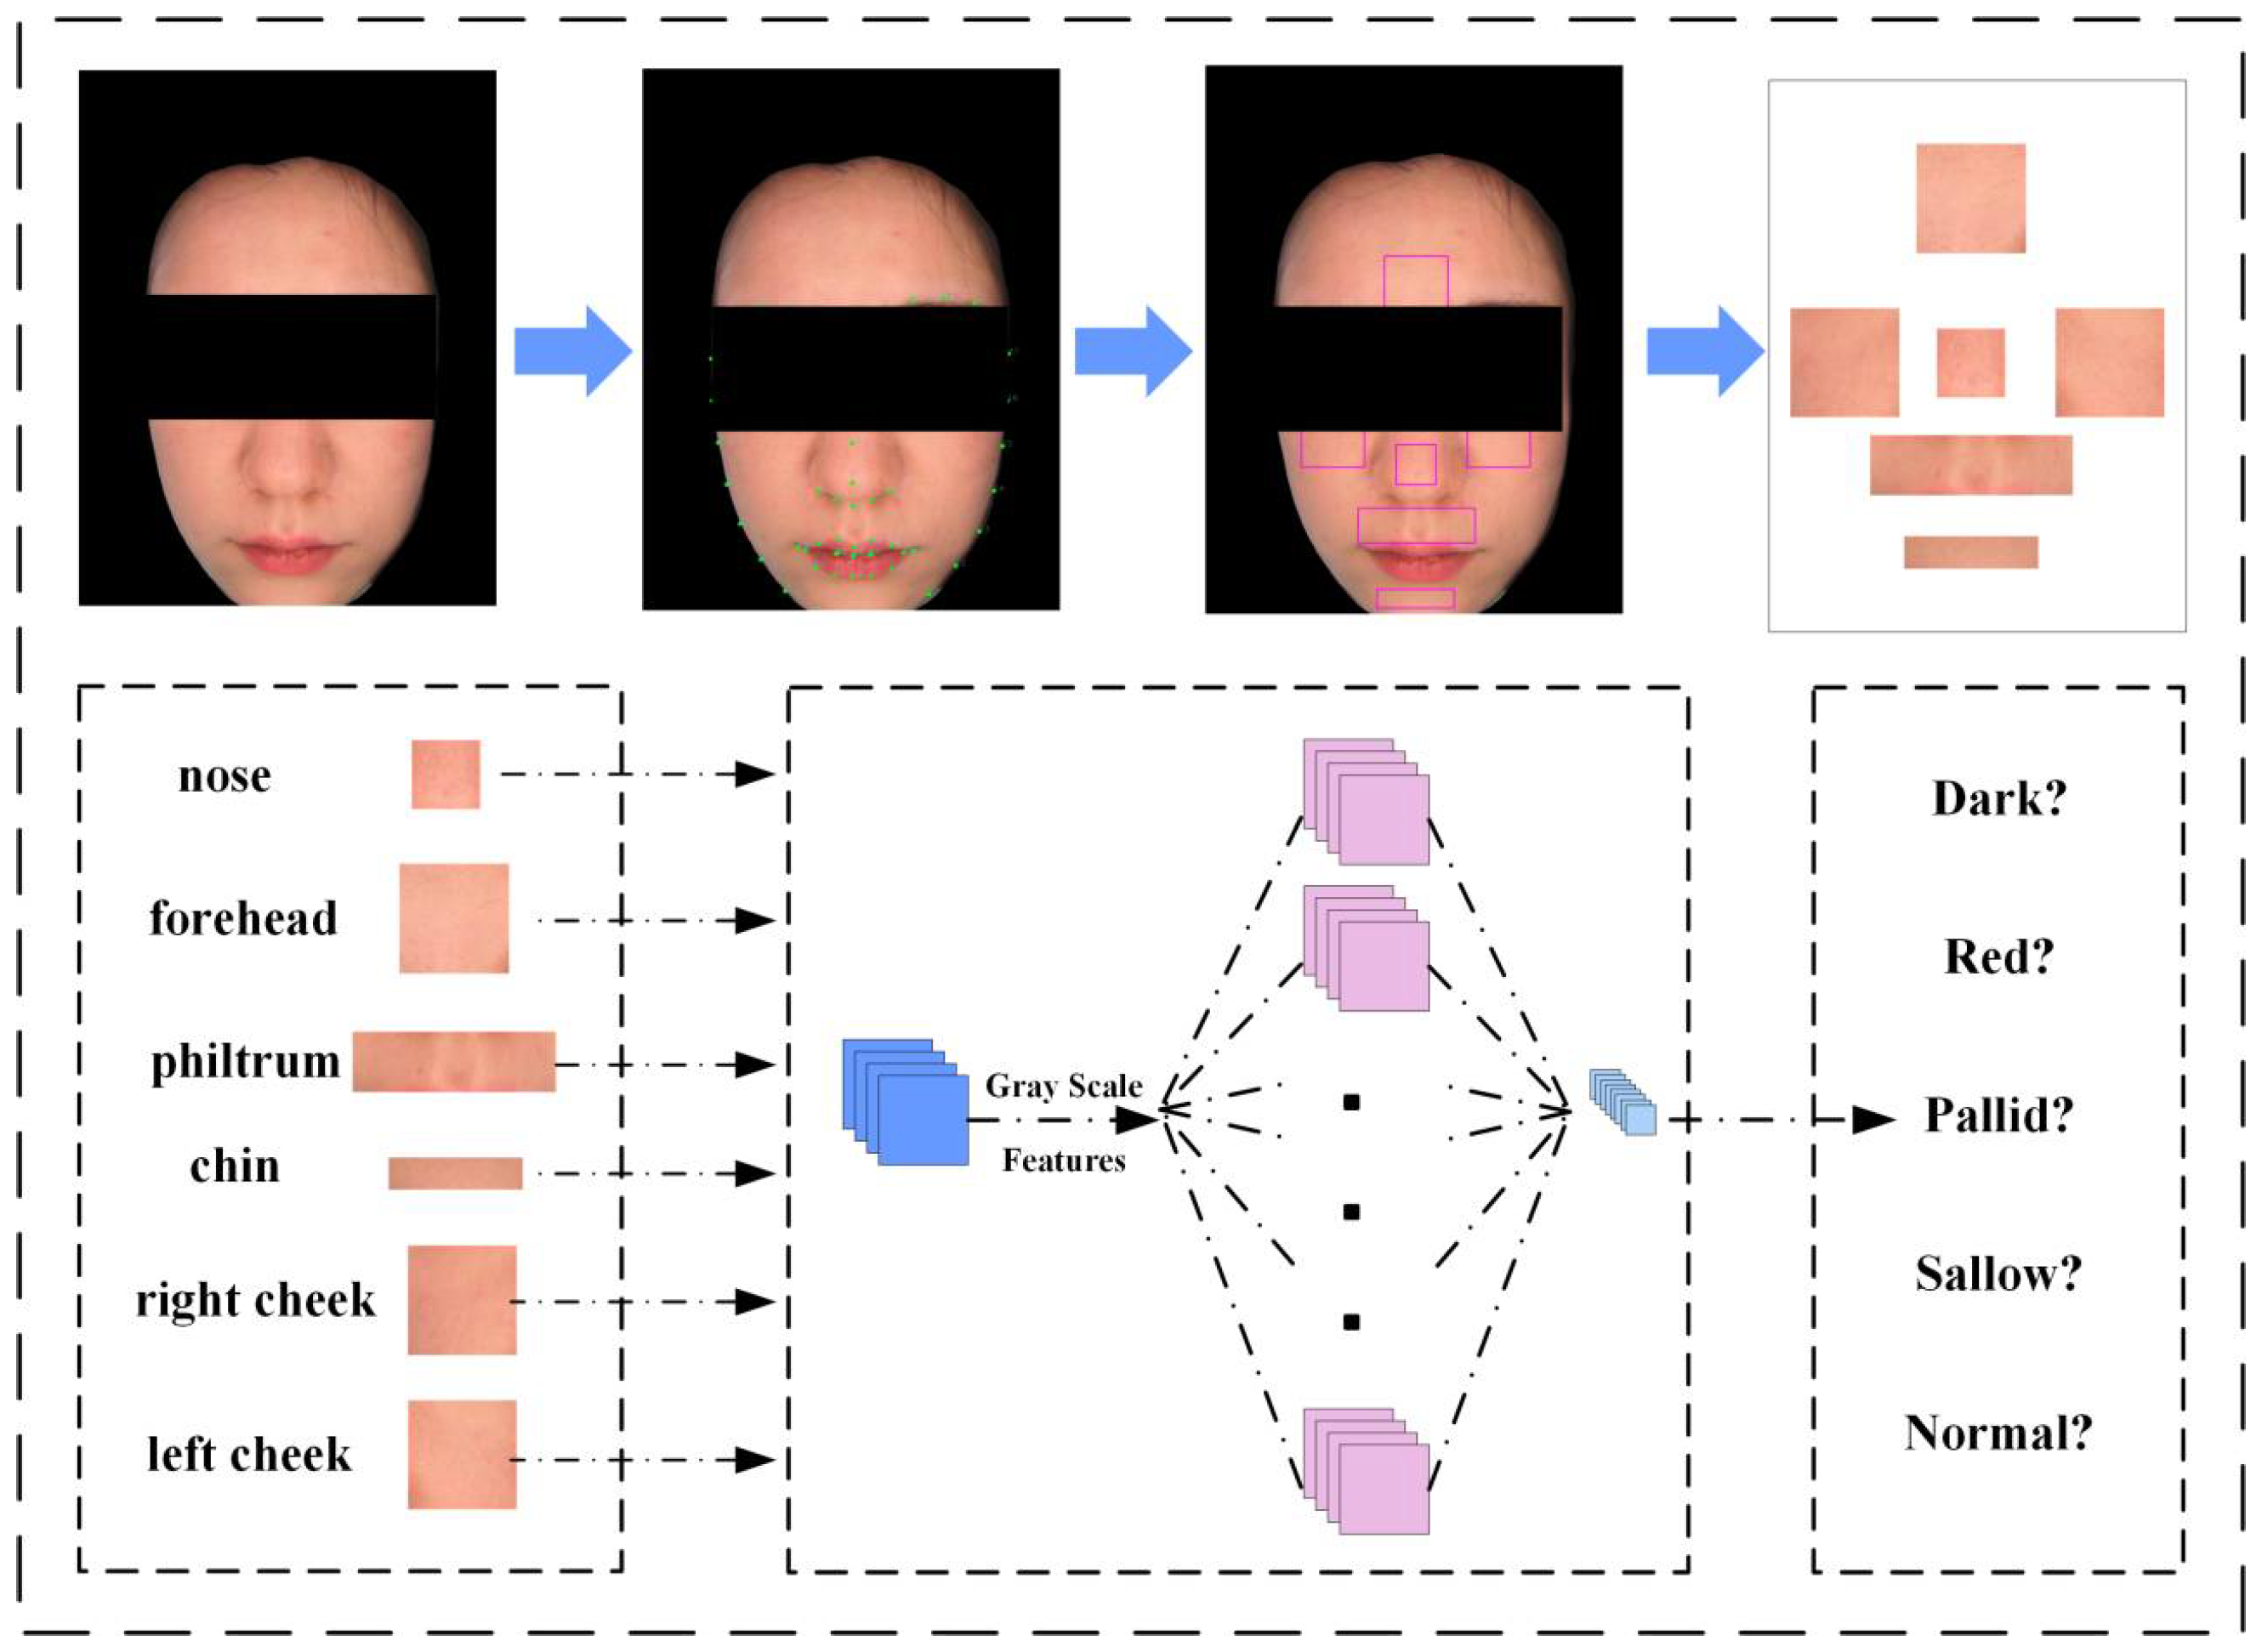
Figure 3.
Stitching ROI features into 3-channel image data.
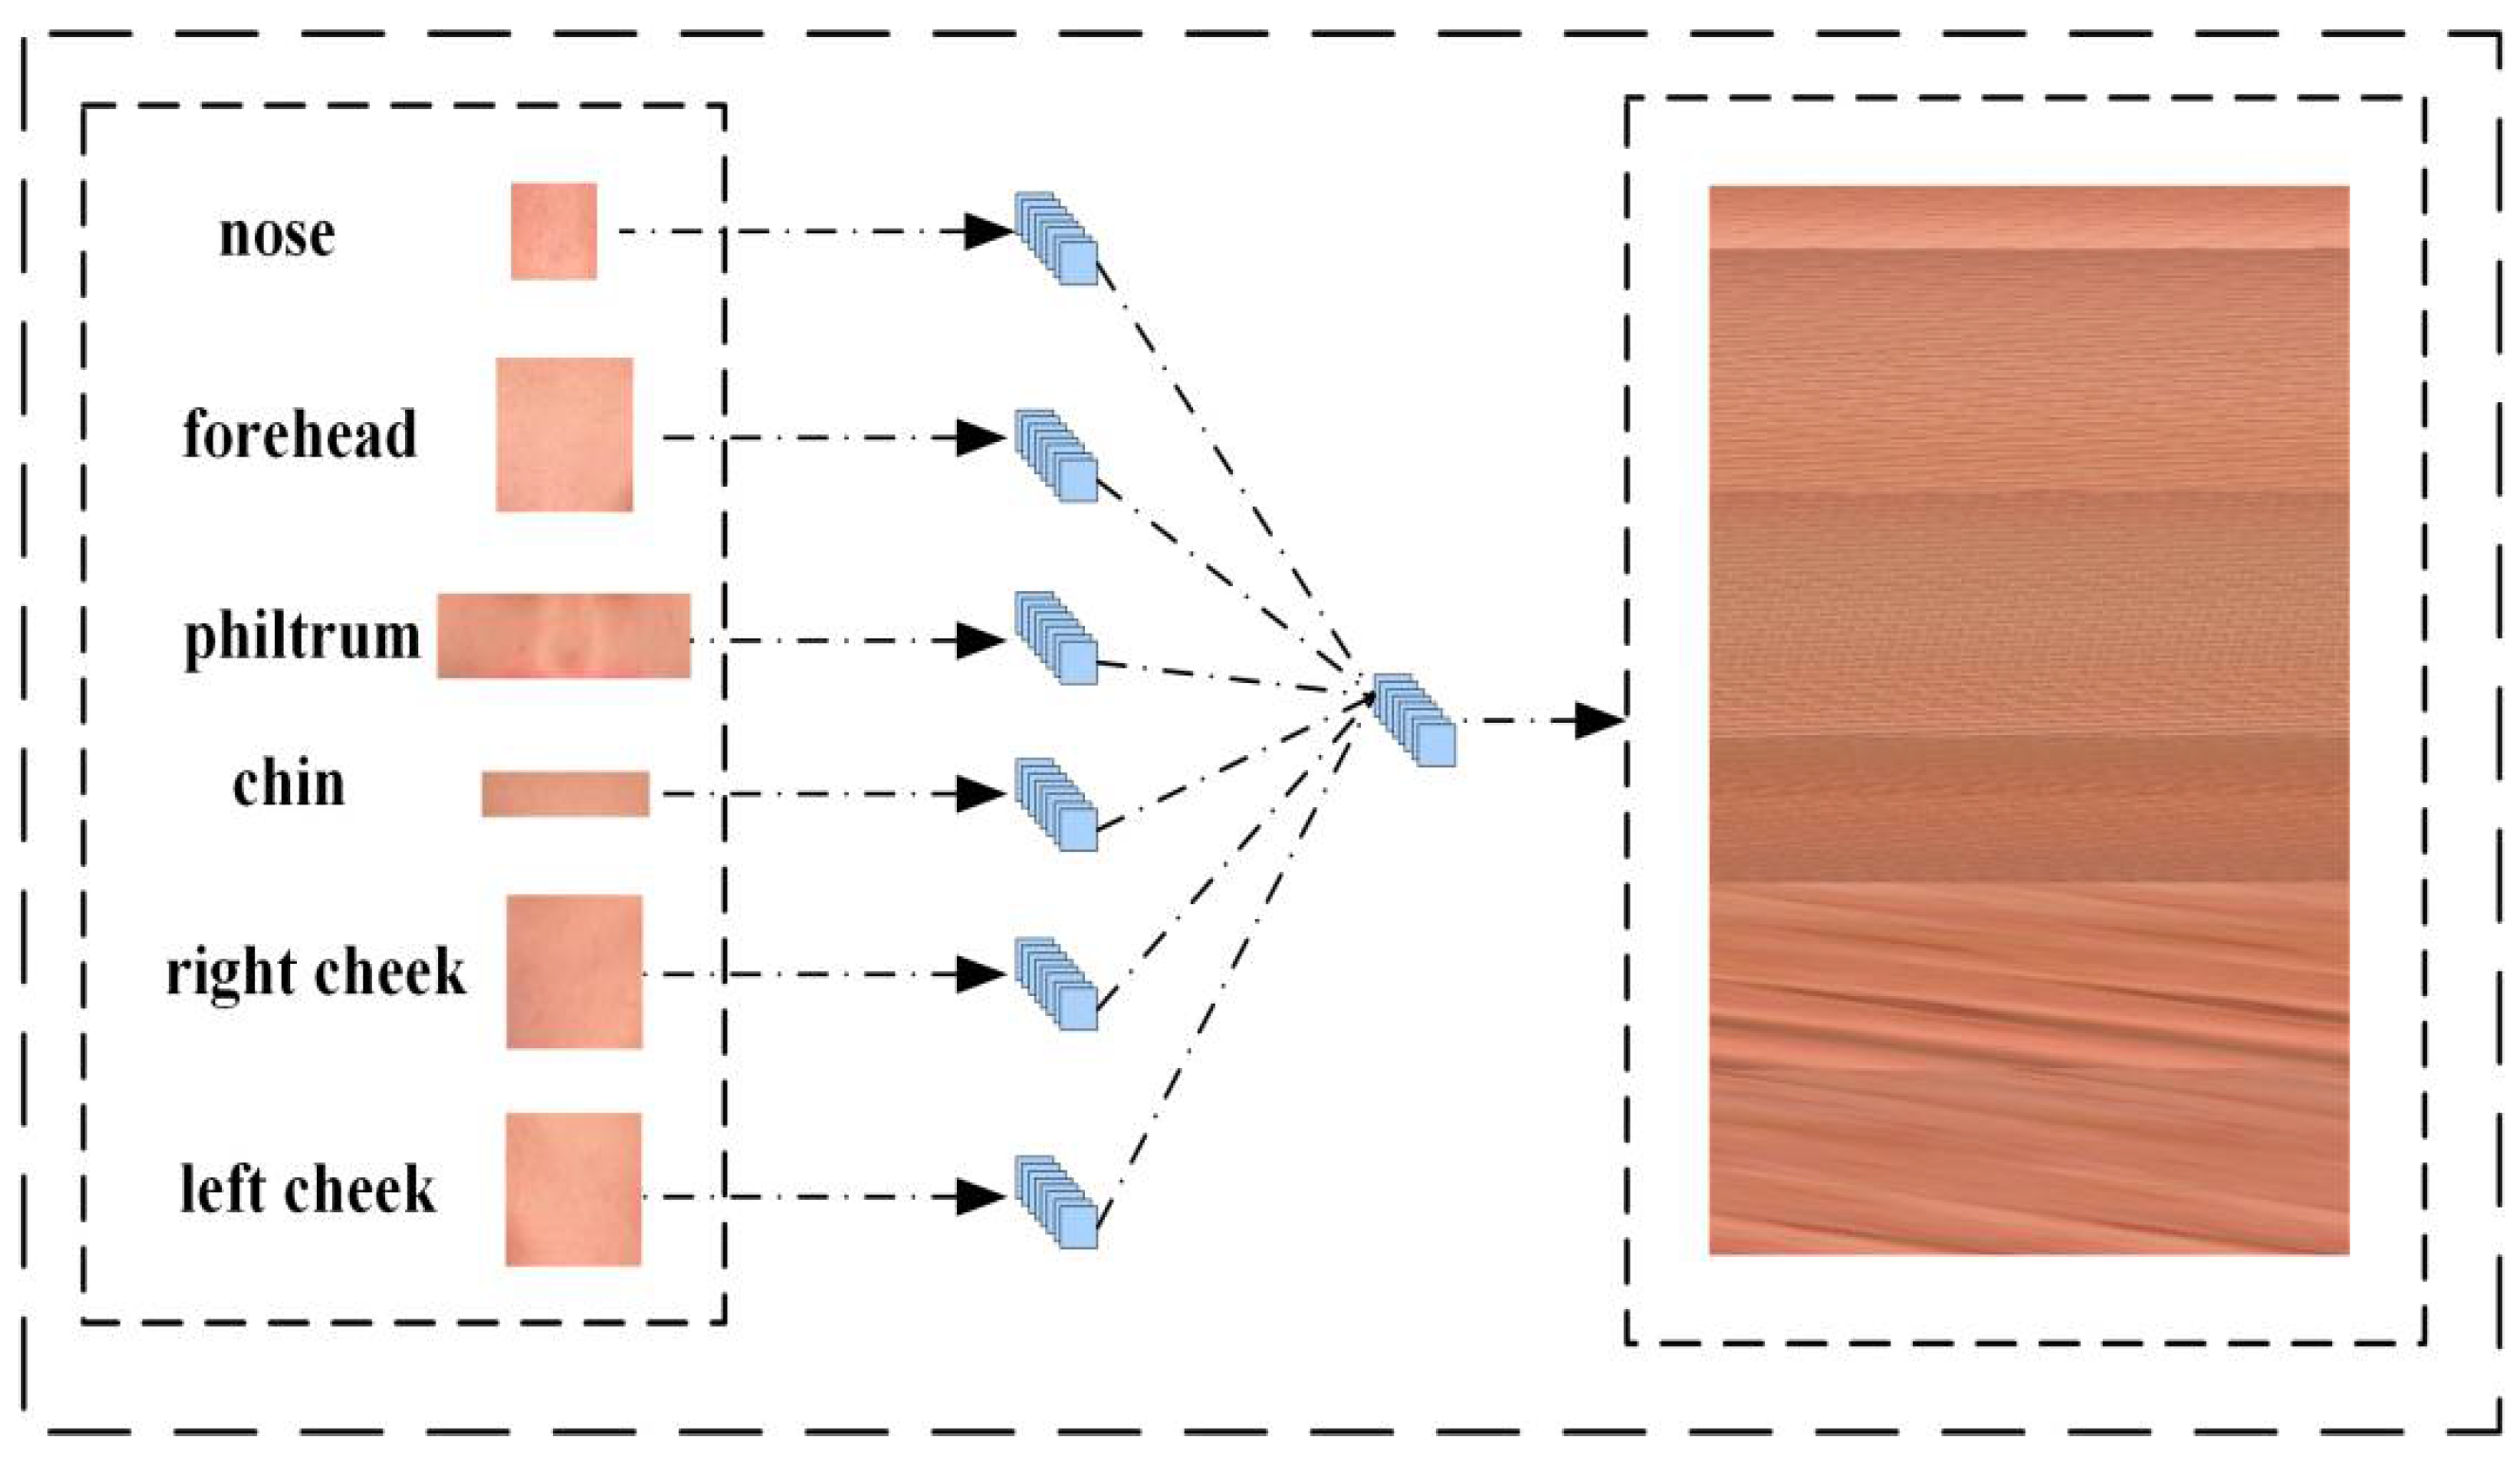
Figure 4.
Framework of the multi-feature classification algorithms with machine learning.
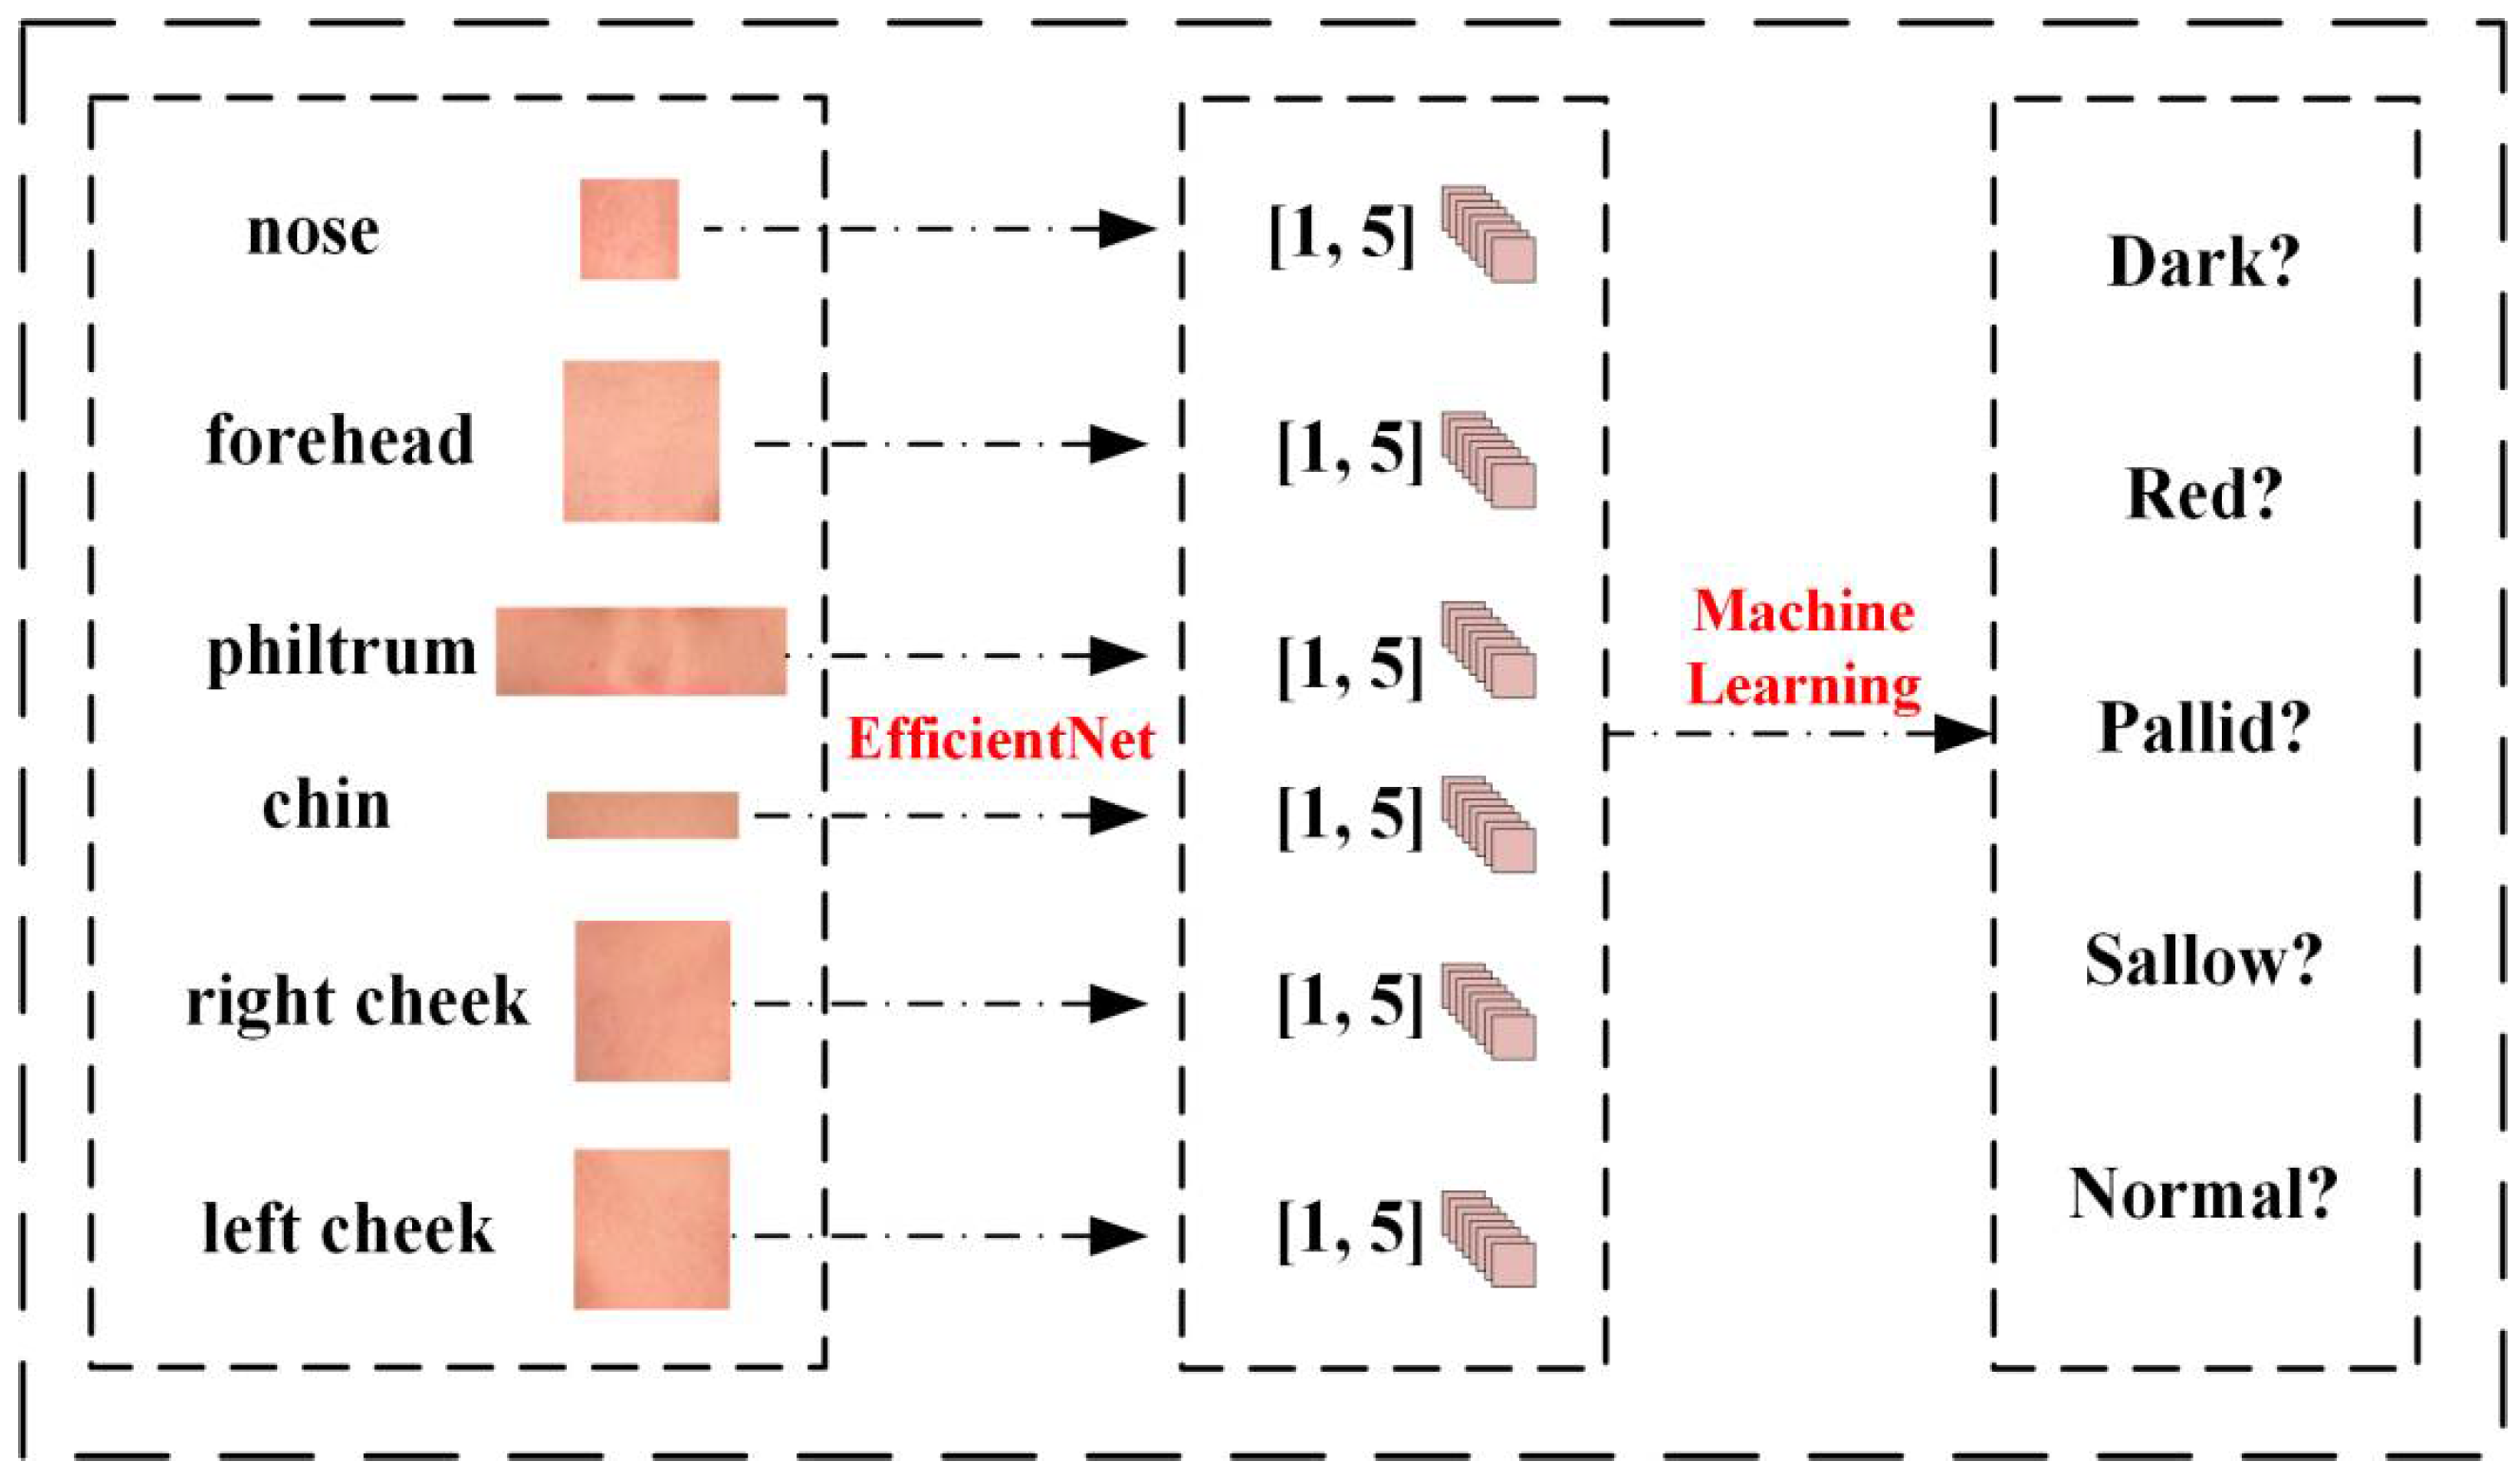
Figure 5.
Visual presentation of results from 3 and 4 channel multi-feature fusion classification algorithms.
Figure 5.
Visual presentation of results from 3 and 4 channel multi-feature fusion classification algorithms.
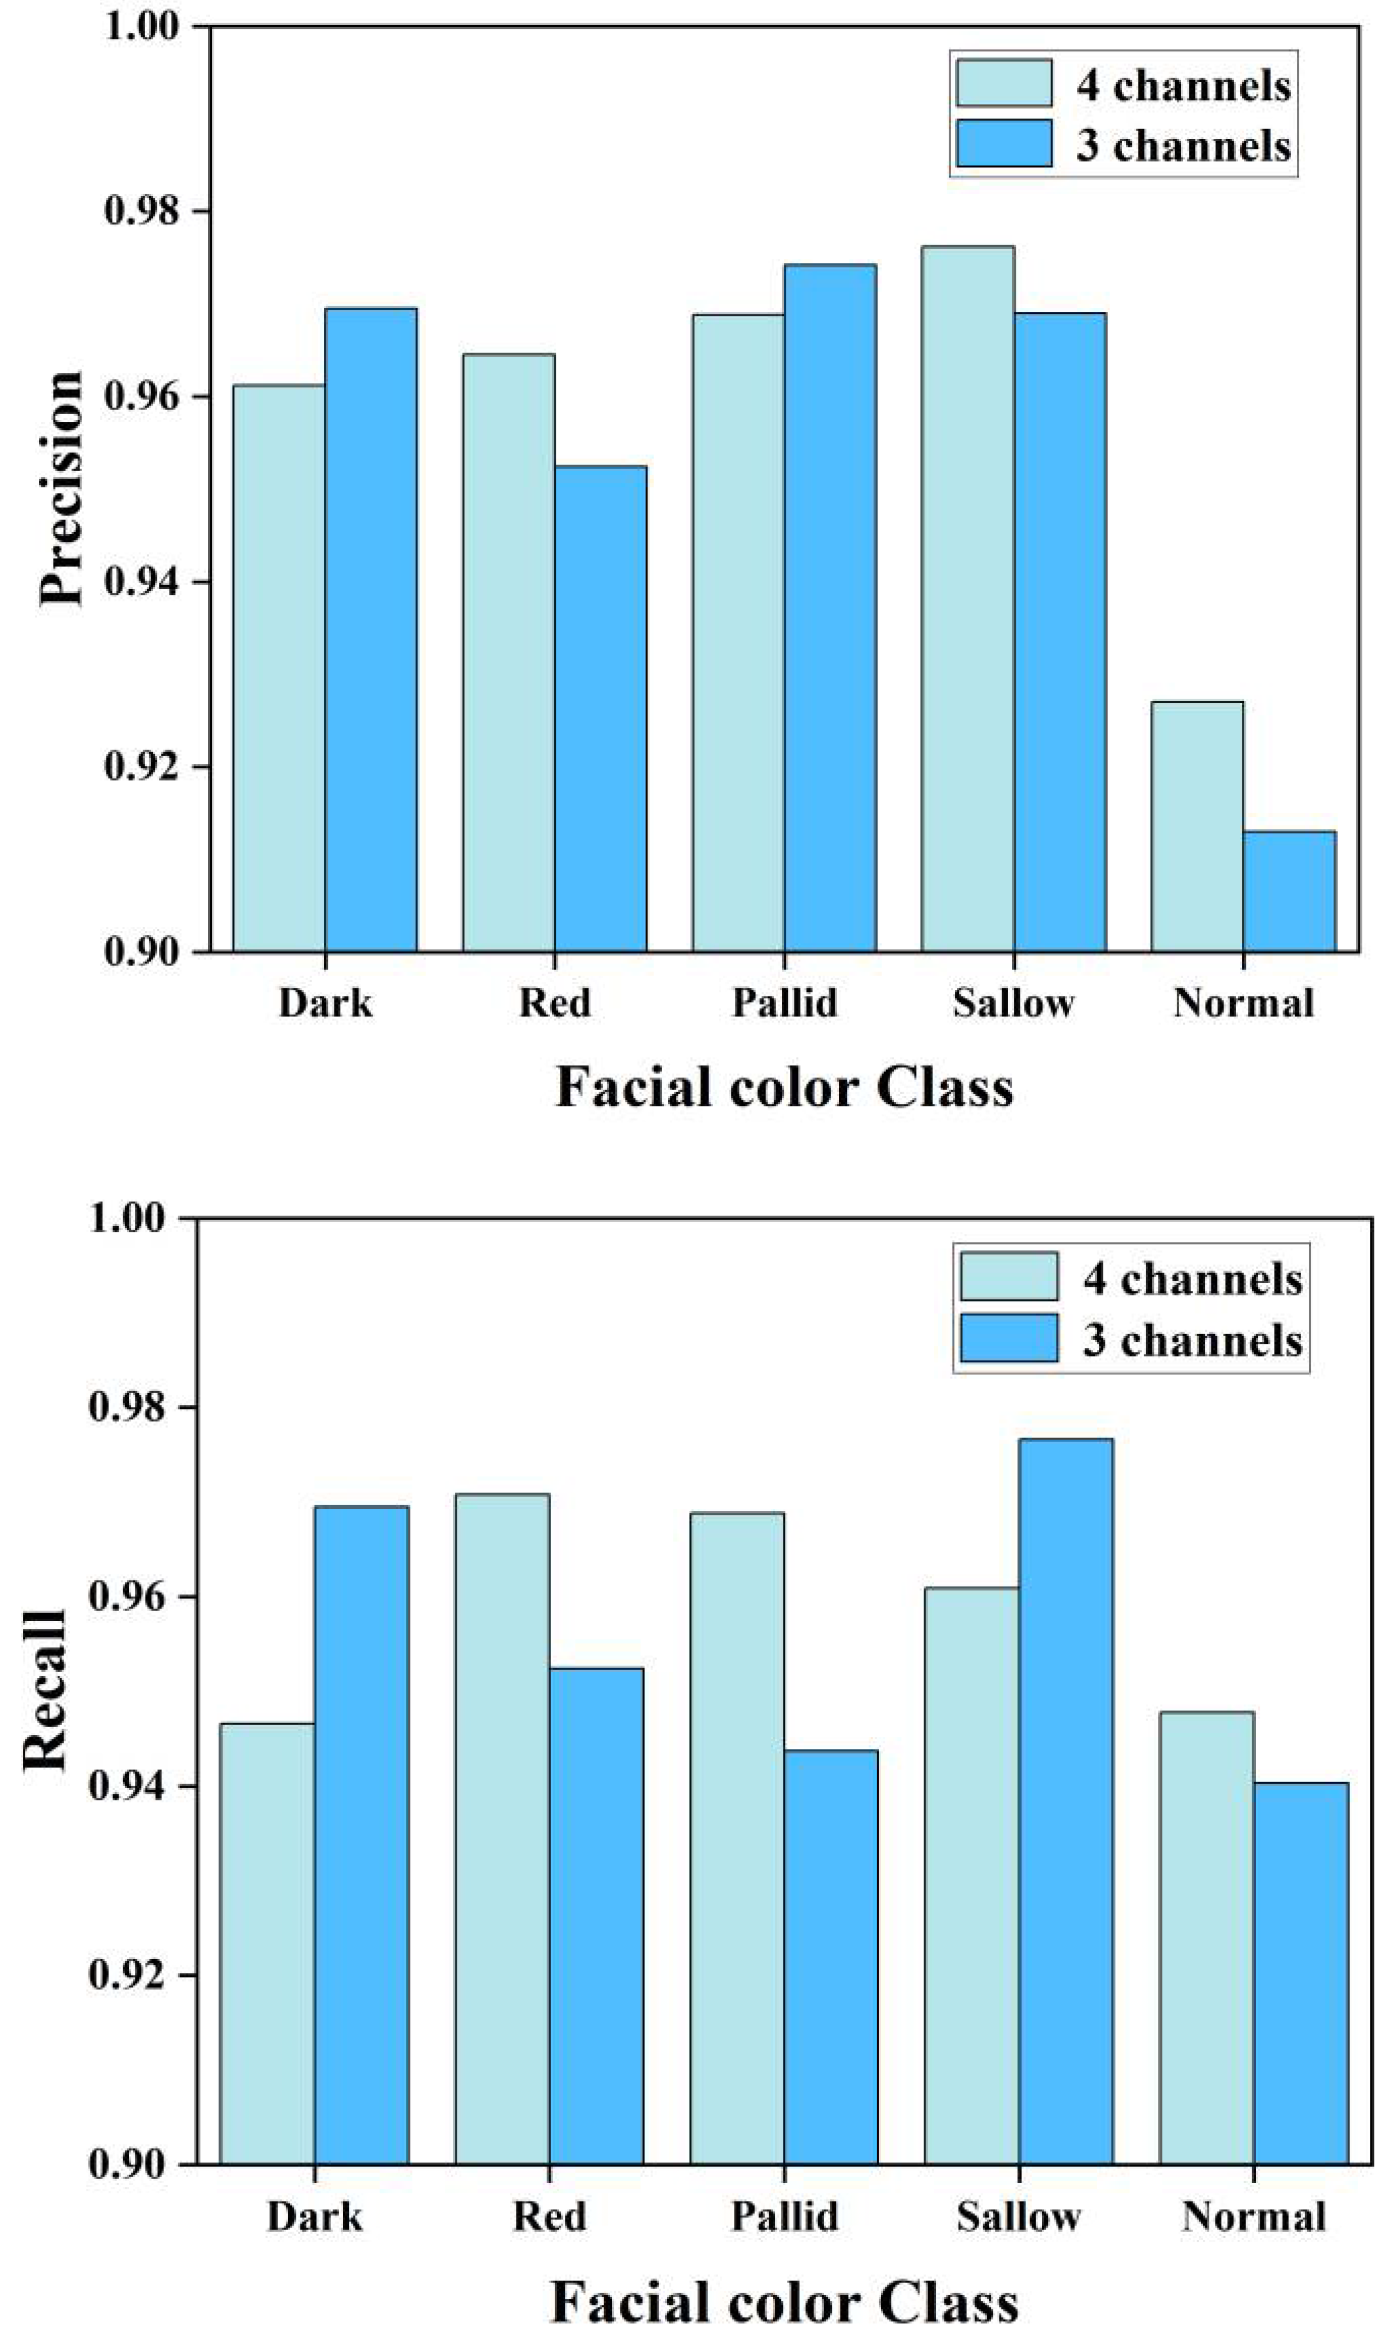
Figure 6.
(a) Correlation analysis of 5 ROI features. (b) Importance analysis of 5 ROI features.
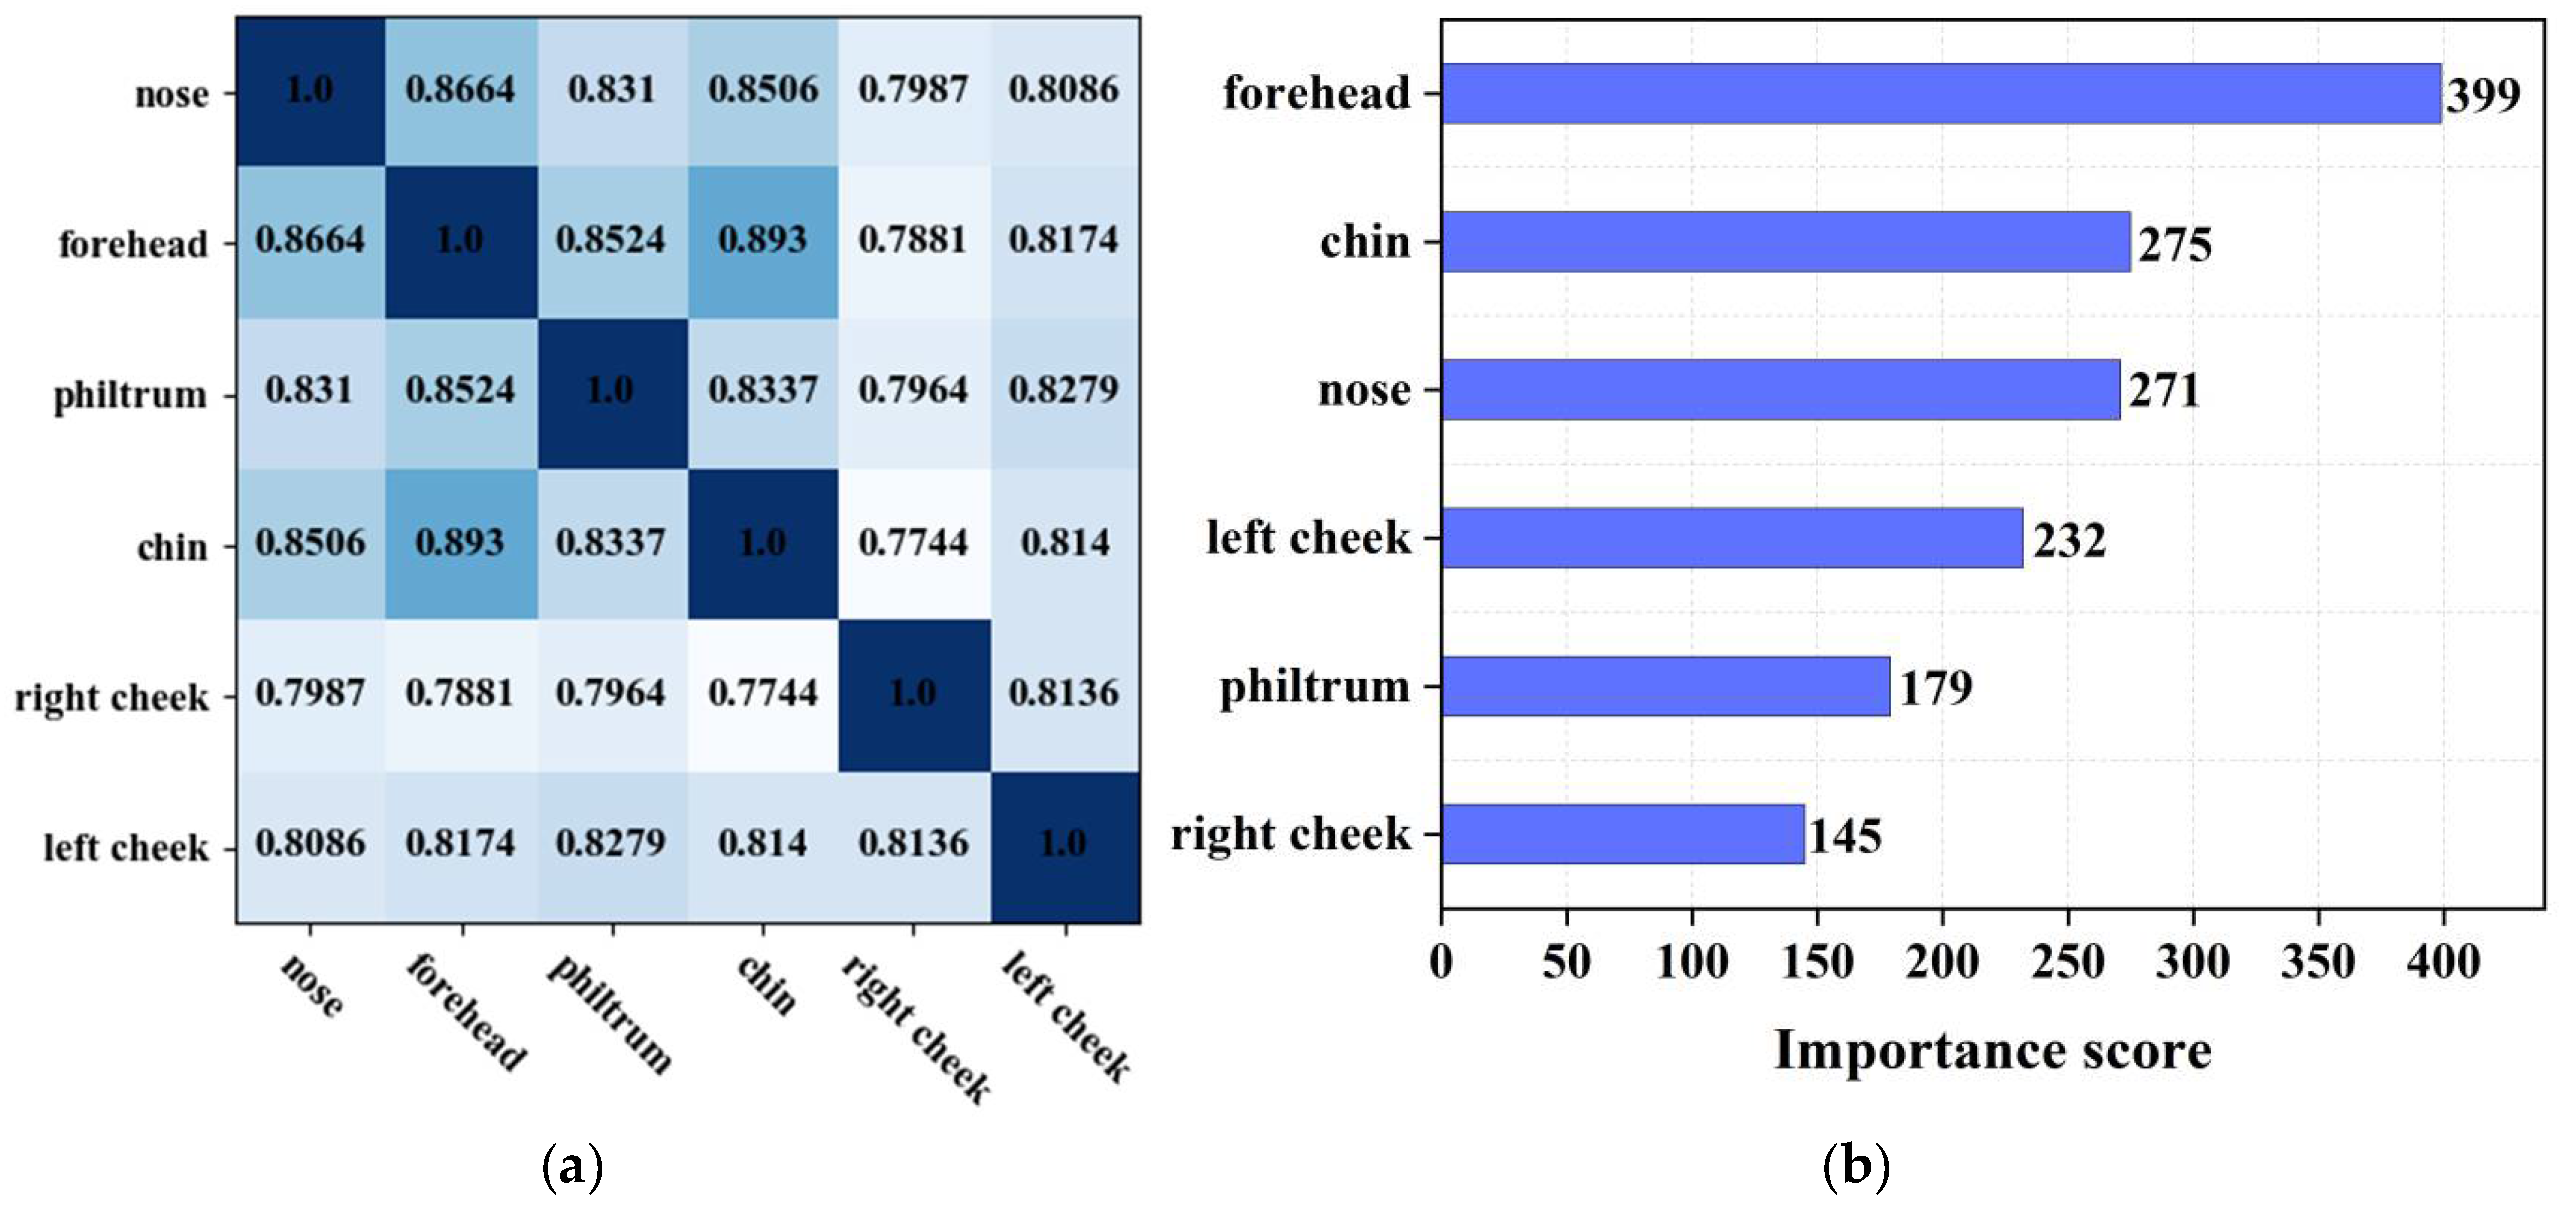

Table 1.
Evaluation results of multi-feature fusion classification algorithm.
| Indicators | Dark | Red | Pallid | Sallow | Normal |
|---|---|---|---|---|---|
| Precision | 96.12% | 96.45% | 96.88% | 97.62% | 92.70% |
| Recall | 94.66% | 97.02% | 96.88% | 96.09% | 94.78% |
| F1-score | 95.38% | 96.73% | 96.88% | 96.85% | 93.73% |
Table 2.
Comparison Experiments numbered from 1-1 to 2-3.
| Algorithm | Comparison | Experiment |
|---|---|---|
| Multi-feature fusion classification algorithm | 1-1 | 3 channels (RGB) |
| 1-2 | pixel splicing | |
| 1-3 | with chin parts | |
| 1-4 | all 6 parts | |
| 1-5 | 4 channels (RGB+Gray) | |
| Multi-feature splicing classification algorithm | 2-1 | with philtrum parts |
| 2-2 | with chin parts | |
| 2-3 | all 6 parts |
Table 3.
Evaluation results of comparison experiments.
| Comparison | Accuracy | Precision (average) |
Recall (average) |
F1-score (average) |
|---|---|---|---|---|
| 1-1 | 95.56% | 95.52% | 95.65% | 95.59% |
| 1-2 | 40.5% | 42.01% | 39.54% | 36.15% |
| 1-3 | 92.79% | 92.79% | 92.91% | 92.80% |
| 1-4 | 94.04% | 94.43% | 93.84% | 94.07% |
| 1-5 | 95.98% | 95.95% | 95.88% | 95.91% |
| 2-1 | 93.76% | 93.67% | 93.96% | 93.73% |
| 2-2 | 90.01% | 90.62% | 89.91% | 89.90% |
| 2-3 | 90.29% | 90.64% | 90.18% | 90.28% |
Table 4.
Prediction results for six ROI features.
| ROI | Accuracy | Precision (average) |
Recall (average) |
F1-score (average) |
|---|---|---|---|---|
| nose | 92.23% | 92.29% | 92.15% | 92.18% |
| forehead | 95.15% | 95.43% | 95.03% | 95.19% |
| philtrum | 91.12% | 90.99% | 91.05% | 90.96% |
| chin | 90.98% | 90.73% | 90.88% | 90.79% |
| right cheek | 90.29% | 90.23% | 90.13% | 90.13% |
| left cheek | 81.00% | 81.51% | 81.23% | 80.82% |
Table 5.
Comprehensive accuracy of different machine learning algorithms.
| Model | All | Chin | Philtrum |
|---|---|---|---|
| KNN | 93.92% | 94.47% | 91.16% |
| Decision tree | 95.58% | 95.58% | 96.13% |
| Random forest | 94.47% | 96.68% | 95.02% |
| Linear1 | 92.81% | 92.96% | 92.79% |
| Linear2 | 94.41% | 92.92% | 92.24% |
| SVM | 92.26% | 93.92% | 91.71% |
| XGBoost | 97.23% | 97.79% | 98.89% |
Disclaimer/Publisher’s Note: The statements, opinions and data contained in all publications are solely those of the individual author(s) and contributor(s) and not of MDPI and/or the editor(s). MDPI and/or the editor(s) disclaim responsibility for any injury to people or property resulting from any ideas, methods, instructions or products referred to in the content. |
© 2025 by the authors. Licensee MDPI, Basel, Switzerland. This article is an open access article distributed under the terms and conditions of the Creative Commons Attribution (CC BY) license (http://creativecommons.org/licenses/by/4.0/).
Copyright: This open access article is published under a Creative Commons CC BY 4.0 license, which permit the free download, distribution, and reuse, provided that the author and preprint are cited in any reuse.


