
Submitted:
18 April 2025
Posted:
21 April 2025
You are already at the latest version
Abstract
Bridges are crucial structures for transportation networks, and their structural integrity is paramount. Deterioration and damage to bridges can lead to significant economic losses, traffic disruptions, and, in severe cases, loss of life. Traditional methods of bridge damage detection, often relying on visual inspections, can be challenging or impossible in critical areas such as roofing, corners, and heights. Therefore, there is a pressing need for automated and accurate techniques for bridge damage detection. In this paper, we propose a novel method for bridge damage detection that leverages a hybrid supervised and unsupervised learning strategy. Our approach combines pixel-based feature method LBP with the mid-level feature BoVW for feature extraction, followed by Apriori algorithm for dimensionality reduction and optimal feature selection. The selected features are then trained using the MobileNet model. The proposed model demonstrates exceptional performance, achieving accuracy rates ranging from 98.27% to 100% with error rates between 1.73% and 0% across multiple bridge damage datasets. This study contributes a reliable hybrid learning framework for minimizing error rates in bridge damage detection, showcasing the potential of combining LBP-BoVW features with MobileNet for image-based classification tasks.
Keywords:
Association Rule Mining
; BoVW
; Bridge Damage
; Deep Learning
; Local Binary Pattern
1. Introduction
Bridge infrastructure is critical to our transportation networks, and ensuring their structural integrity is primary. Deterioration and damage to bridges can lead to significant economic losses, traffic disruptions, and, in severe cases, loss of life because they are susceptible to various forms of damage, such as cracks, corrosion, and erosion, which can compromise their safety and functionality. Early detection of these damages is crucial for timely maintenance and repairs, preventing catastrophic failures, and minimizing economic losses[1,2].
In the past decade, several industries have employed Artificial Intelligence (AI) algorithms to acquire information and insights, thus enhancing their performance. The concept of AI is to provide machines with the ability to think and act like human beings. It contains supervised and unsupervised learning strategies. Artificial intelligence methodologies, including diagnosis, prediction, clustering, and classification, are used to develop models that distinguish between various data classes [3]. These models are employed to predict categorical class labels, such as "Background" or "Defects," and "Crack" or "Non-crack" in the classification of bridge damage. These techniques are employed to transform data into knowledge, enabling specialists to improve their work. This knowledge is represented as models. A model exhibiting high-performance metrics indicates that the artificial intelligence methodology effectively extracted knowledge and distinguished between various data patterns. However, the extracted knowledge may not always provide the correct predictions [4].
In the context of feature extraction based on handcrafted method, Cao et al. [5] trained CNN descriptors using Bag of Visul Words (BoVW), while Hassan et al. [6] utilized color moments as a global feature and Local Binary Patterns (LBP) as a local feature to construct BoVW. Additionally, various studies [7,8,9,10] utilize BoVW for image classification and recognition. Many methods have been used to modify BoVW; for instance, an improved BoVW (iBoVW) has been proposed to generate the features from each convolutional layer of the pre-trained CNN model [11]. Also, a BoVW model presented by Olaode and Naghdy [12], whereby deep feature learning via a stacked autoencoder was used to extract image features, and for video-based recognition, spatiotemporal scale-coded BoW (SC-BoW) was utilized. It entails splitting spatiotemporal characteristics into sub-groups according to the geographic scale from which they were taken and then encoding the acquired multi-scale information into BoW representations [13]. The SO-BoVW model proposed by Sultani and Dhannoon [14] combined the Scale Invariant Feature Transform (SIFT) and Oriented Fast and Rotated BRIEF (ORB) based on the BoVW model for image classification, where k-nearest neighbor (kNN) was utilized for image classification.
Based on our analysis of concrete damage detection models mentioned in previous literature, we have seen that some studies utilize deep learning models while others employ machine learning approaches. Some studies combine image processing techniques with either deep learning or machine learning. Bhalaji Kharthik et al. [15] employed twelve transfer learning DCNN models to categorize fractures in three publicly available datasets: CCIC, SDNET for structural cracks, and BCD for bridge fissures. The researchers applied two image enhancement techniques, LBP and contrast enhancement, to the SDNET images owing to the constrained efficacy of the transfer learning DCNN models. Furthermore, the support vector machine (SVM) was trained utilizing deep features derived from the final fully connected layer of the DCNNs. The integration of deep features with SVM resulted in an enhancement of detection accuracy across all combinations of DCNN and datasets. Yang et al. [16] proposed the utilization of the DCNN framework to classify fissures across three publicly accessible datasets: CCIC, BCD, and SDNET. The proposed methodology facilitates the transfer of three distinct forms of knowledge derived from prior scholarly achievements: sample knowledge, parameter knowledge, and model knowledge. The VGG network was augmented with additional fully connected layers, thereby establishing a novel learning framework. The researchers substantiated the credibility and efficacy of the proposed methodology. Zoubir et al. [17] employed a histogram of oriented gradients (HOG) in conjunction with uniform local binary patterns (ULBP) to derive features from a dataset comprising over 3000 images, both uncracked and cracked, which encompassed various crack patterns and representations of concrete surfaces. Nonlinear dimensionality reduction techniques were executed through kernel principal component analysis (KPCA), and three machine learning classifiers were utilized to facilitate the classification process. The findings of the experiments indicate that the classification approach predicated on the SVM model and the feature-level fusion of HOG and ULBP features subsequent to the application of KPCA yielded optimal results, as the proposed classification framework accomplished an accuracy rate of 99.26%. Zoubir with other team [18] introduced a publicly accessible benchmark annotated image dataset comprising over 6900 images depicting cracked and non-cracked concrete bridges and culverts. The dataset presented encompasses a variety of challenging surface conditions and comprises concrete cracks exhibiting diverse sizes and patterns. The authors analyzed the proposed dataset employing three cutting-edge DCNNs, namely VGG16, VGG19, and InceptionV3, utilizing a transfer learning approach. The models above were employed to differentiate between cracked and non-cracked images, achieving a maximum testing accuracy of 95.89%. The outcomes of the experiments illustrate the promising applicability of this dataset for training deep learning networks aimed at the recognition of concrete cracks in bridge structures. Xu et al. [19] created a convolutional neural network (CNN)-based model for crack detection that works completely, from the beginning to the end. It does this by using atrous convolution, the Atrous Spatial Pyramid Pooling (ASPP) module, and depthwise separable convolution. An implementation of atrous convolution makes it easier to get a wider receptive field while keeping the input data's resolution. When the ASPP module is used, the network can gather contextual data at different levels, and the depthwise separable convolution makes the computations easier. The model proposed by the authors achieved an impressive detection accuracy of 96.37% for BCD dataset without the necessity for pre-training.
In this study, we aim to build a classification model which minimize the prediction errors. At first, we built a model based on LBP-BoVW, Apriori, and MobileNet algorithms. We have achieved excellent accuracy with this model, ranging from 98.27% to 100%, and very few misclassified instances with an error rate between 1.73% and 0% for all datasets. The contributions of our work are summarized as follows:
- Reliable hybrid supervised and unsupervised learning based on LBP-BoVW features for minimizing error rate.
- Built a new algorithm for reliable learning on image datasets.
- Employ the Apriori algorithm for selecting the robust features and dimensionality reduction.
We organize the rest of the paper as follows: we provide a brief explanation of the relevant works in the subsequent section. Section 2 describes the methodology of the proposed model. Section 3 presents the experiments and results. Section 4 describes the discussion. Finally, section 4 presents the paper's conclusion.
2. Materials and Methods
The proposed model contains multiple steps: preprocessing, feature extraction based on LBP-BoVW, feature selection and dimensionality reduction based on apriori algorithm, and classification using MobileNetV3_Large algorithms. Figure 1 explains the general structure of the proposed model.
2.1. Preprocessing
Depending on the purpose, nature, quality, and use of the data, one can employ various strategies, as data preparation is a crucial step in preparing the data for model training. Preprocessing the model might also boost model inference and reduce training time. Reducing the size of the input images can significantly reduce the model's training time while still preserving its performance, especially if the images are very large. This paper employs the following preprocessing techniques:
- Image resizing works the model correctly; images must be resized to a consistent size. The large image is difficult to process effectively. Therefore, we resized the different sizes of the used datasets to 100 x 100.
- Grayscale image: a grayscale instead of color is used in this work to simplify the image's data and lower the processing requirements of algorithms.
- Data augmentation techniques are used to produce new images from existing ones to increase the size of a dataset. It enhances the model's generalization and decreases overfitting.
- The data normalization technique sets pixel intensity values to a predefined range, usually between 0 and 1.
2.2. Local Binary Pattern
The LBP is a textural descriptor described by Ojala et al. [20] and utilized for classification. To calculate a binary pattern, LBP compares the intensity of a center pixel (threshold) with the intensity of the 8 neighbor pixels around it. Figure 2 shows the LBP work. LBP may be formalized as follows for a center pixel Ic and an adjacent pixel Ii (i = 1, 2, …, p) [21]:
2.3. LBP-BoVW
The LBP-BoVW features are extracted by training the image patches using the k-means clustering technique. Where the size of the dictionary (k) is determined, which represents the number of clusters, and the cluster centroids were used as visual words. The steps of LBP-BoVW are explained as follows:
- Determine the number of patches needed to divide each image into patches. Here we used 250 image patches.
- Computed the LBP for each patch.
- To determine the size of the dictionary (k), we used 50, 100, 200, and 300, which represent the number of K-means clusters.
- Identify each cluster's center. These centers are the visual words. The size of the visual word vector is equal to K.
- Computed the histograms for each image to create the local feature vectors.
Figure 1 explains the steps above.
2.4. Feature Selection and Dimensionality Reduction
The hidden patterns and knowledge are extracted from massive amounts of data in the form of association rules, with the assistance of association rule mining. One of these association rule mining algorithms, the Apriori algorithm [22], uses frequent item set mining to generate association rules from a transactional dataset. Additionally, machine learning uses it for classification, feature selection, and dimensionality reduction. Selecting characteristic features from raw data is a fundamental stage in data mining. There are two main objectives for feature extraction. The first is to improve the classifier's efficiency by representing each data object with a limited number of useful features, and the second is to remove features that are not representative of the data object, which will increase classification accuracy [23,24]. The main objectives of dimensionality reduction and feature selection are [25]:
- We can reduce overfitting by eliminating redundant or unnecessary features from the model, especially when working with high-dimensional data.
- Dimensionality and feature reduction can produce a simpler, more interpretable model that is easier to comprehend and explain.
- Reducing execution time by shrinking the model's size, data pruning assists in speeding up the training and inference processes.
- By eliminating noisy or unnecessary features, the ability of a model to generalize to previously unobserved data can be enhanced.
- By data pruning, the best trade-off between model size and performance is achieved, resulting in a balance between accuracy and complexity.
- Feature reduction helps to enhance model performance and lower the chance of overfitting.
We used min-support = 0.9 and min-confidence = 0.9 as a threshold for feature selection. After applying the Apriori algorithm to the features derived from LBP-BoVW, the number of features that are selected in one image differs from the number of features that are selected in another image. So, the resulting features need to be processed to obtain an equal number of features for each image. To treat these missing values, we used the imputation mean method. When data is imputed, missing values are substituted with values that make sense given the information at hand. Data can be imputed in a way that maintains the set's size and structure, prevents the removal of information that can be valuable, and lowers the predictability and bias of the estimations. Table 1 explains the number of features after Apriori feature selection and the size of LBP-BoVW features for used datasets.
2.5. MobileNet
MobileNet is a computer vision model that has been made available as open source by Google. It is specifically developed for training classifiers. The network is a CNN that uses depthwise convolutions to greatly decrease the parameter count in comparison to other networks, thereby creating a lightweight deep neural network. MobileNets are compact models designed to accommodate limited resources, such as low latency and low power consumption. They are specifically parameterized to cater to a range of use cases, making them well-suited for mobile applications and other situations with constrained resources. The efficiency of MobileNet is attained by using depthwise separable convolutions, which decrease the number of multiply-accumulates and the total size of the model. Although MobileNets exhibit superior speed and compactness compared to other prominent networks, they may sacrifice some accuracy in comparison to bigger, resource-intensive models. Nevertheless, its performance remains commendable, with just a little decline in accuracy [26]. In our work, we trained the datasets using MobileNetV3-Large [27].
3. Experimental Results
3.1. Experimental Environment
In this section, we demonstrate that the proposed model is generalizable and capable of minimizing error rate by evaluating their performance on several datasets using 10-fold cross-validation.
Our model implemented in the TensorFlow and Keras environments. We developed it in Python 3.9 using the Anaconda Navigator IDE and utilized it with Windows 10 64-bit. An i7-8550U CPU runs at 1.99 GHz and 32 GB of RAM, and the experiment's settings are as follows: the batch size is 128; the epoch is 20; and the optimization method for loss is Adam optimization.
3.2. Datasets
To test our model, we used four bridge damage datasets and compare our work with other studies that used these datasets. The experiment datasets will be described in this section.
- DIMEC-Crack Database: Lopez Droguett et al. [28] developed a new dataset for crack semantic segmentation. The dataset contains images extracted from video captured by the Unmanned Aerial Vehicle (UAV) equipped with high-resolution cameras for several concrete bridges. Each image has a resolution of 1920 x 1080; in their study, they extracted non-overlapping patches of 96 x 96 pixels from each raw image, but we will use the original raw images. The dataset contains 10,092 high-resolution images separated into two classes: 7872 crack and 2220 non-crack images.
- CODEBRIM Dataset: Mundt et al. [29] introduced a novel concrete defect bridge image (CODEBRIM) dataset. CODEBRIM includes images of 30 distinct bridges, excluding bridges without defects. The bridges were selected based on their levels of general degradation, severity, number of defects, and surface appearance, such as roughness and color. Images were captured in different weather conditions to encompass damp or soiled surfaces using numerous cameras at various magnifications. Due to the small size of the defects, high-resolution images were required. An UAV obtained a portion of the dataset due to the inaccessibility of certain bridge areas. Four distinct cameras with high resolution and huge focal lengths collected the dataset, capturing images from various distances and perspectives. Furthermore, to uniformly brighten the darkest sections of the bridge, they employed diffused flash. The additional material contains precise information about the specific camera models and their accompanying technical specifications. The collection comprises 7455 high-resolution photos of 30 distinct bridges obtained at various sizes and resolutions. We divided it into two classes: defects and background. The defects have 4388 images, while the background contains 3067 images.
- Bridge Concrete Damage (BCD): Xu et al. [19] introduced dataset, which includes 2068 images of bridge cracks and non-cracks. They captured the images using the Phantom 4 Pro's CMOS surface array camera, boasting a resolution of 1024x1024. The images underwent two reductions, first to dimensions of 512×512 and then to a size of 224×224 to produce the dataset. This dataset consists of 4057 photos with cracks and 2013 images without cracks.
- Bridge Datasets: The dataset created by Zoubir et al. [17] yielded a total of 1304 cracked and 1806 non-cracked RGB bridge images at a resolution of 200 × 200. These images depict various concrete surfaces and cracks from the actual bridge examination. In order to minimize crack-like noise, the images were pre-processed using a 3 x 3 median filter after being converted to grayscale
3.3. Evolution Metrics
Because our models are binary classification, we utilize performance metrics that experiment with the binary classification models, such as accuracy, precision, recall (also called sensitivity), f1-score, ROC-AUC score, and error rate. All these metrics are taken from the confusion matrix, which shows the classifier's performance. Four elements comprise the confusion matrix: false positive (FP), false negative (FN), true positive (TP), and true negative (TN). The formula for evaluation metrics is as follows [30,31,32]:
Where SP is the true negative rate (TNR), also called Specificity, and SE is the true positive rate (TPR) also called sensitivity or recall [33]. The (TP) is a true positive, (TN) is a true negative, (FP) is a false negative, and (FN) is a false negative.
3.4. Cross-Validation
For the experiment, we use 10-fold cross-validation, with 9-folds accounted for the training dataset, 1-fold for testing, and ten process repetitions. Cross-validation is essential for addressing the issue of overfitting. The selection of cross-validation folds is essential. We aggregate the outcomes of all folds by means of averaging.
4. Results and Discussion
In this section, we display a detailed analysis of the results of the proposed models on the utilized datasets. Many factors affect model performance, such as preprocessing operations and their vital role in classification performance, feature selection, dimensionality reduction, and selecting an appropriate classifier. Also, the number of features, image quality, and lighting conditions all impact classification performance. We evaluate the performance of proposed algorithm using MobileNet model. Table 2 explain the performance of the proposed model using difference evaluation metrics using four sizes of features for each dataset.
As shown in Table 2, the BCD dataset with feature sizes 100 performed the best, with an accuracy of 99.99% and a high recall of 99.99% with precision and F1 score of 100%, the ROC-AUC is 99.99% and a 0.01 error rate. The best performance was attained by the Bridge dataset with a feature size of 300, with 99.97% for all performance metrics with an error rate of 0.03. With an accuracy of 100% and a high precision of 100% in the CODEBRIM dataset, the feature size of 200 outperformed the other feature sizes. Its recall of 99.99% demonstrated its ability to identify actual damaged images with a 0.01 false negative. This resulted in an F1 score of 100%, which balances precision and recall. We also achieved a ROC-AUC of 100% and a 0-error rate. The DIMEC-Crack dataset with feature sizes 100 performed the best, with a high precision reach to 100% which means there is no false positive and 99.99% for all performance metrics with error rate reach to 0.01%. Figure 3 shows the plot of average of the best accuracy and loss. Figure 4 shows the confusion matrix of the best results for each dataset.
Table 3 presents the accuracy scores for each dataset and compares them with related studies that classify the same datasets. The difference in methodologies prevents a direct comparison with these studies, so we will only compare accuracy.
Bhalaji Kharthik et al. [15] employed 12 transfer learning (TL) methods: VGG16 achieved an accuracy of 99.83% with more than 99% for each precision, recall, and F1-score; VGG19 achieved an accuracy of 99.67% with a precision, recall, and F1-score of > 99%; Xception achieved 99.67% and more than 99% for each precision, recall, and F1-score; ResNet 50 achieved an accuracy of 99.67% with precision, recall, and F1-score reaching > 99%; the ResNet 101 achieved an accuracy of 99.5%, a precision of 100%, a recall of 99%, and an F1-score of 99.5%; the ResNet 152 gained an accuracy of 99.83% and > 99% for each precision, recall, and F1-score. InceptionV3 achieved an accuracy of 99.83%, a precision of 99%, a recall of 99%, and an f1-score of 99%. InceptionResNet V2 achieved an accuracy of 99.5% with a precision of 100%, a recall of 99%, and an F1 score reaching 99.5%. MobileNet achieved an accuracy of 99.83% with more than 99% for each precision, recall, and F1-score. MobileNetV2 achieved an accuracy of 99.83% with a precision, recall, and F1 score of > 99%. DenseNet 121 achieved an accuracy of 99.67% with a precision, recall, and F1-score of 100%, while the EfficientNetB0 model yielded an accuracy of 99.6% and a precision of 99.83%, with a precision, recall, and F1-score of > 99%.
Yang et al. [16] also used transfer learning, utilizing 13 layers of VGG16 and 2 FC layers. They trained their proposal with BCD and CCIC datasets. For the BCD dataset, they achieved an accuracy of 99.72%, a precision of 96.46%, and an AUC of 99.99%. In their study, Zoubir et al. [17] used ULBP, HOG, KPCA, and SVM to classify concrete cracks in the self-made bridge dataset. They achieved an accuracy of 99.26%, a precision of 95%, a recall of 99.23%, and an F1 score of 99.12%. Zoubir with another team [18] utilized the Bridge dataset, supplemented it with culvert images, and applied transfer learning to the CNN models. They achieved an accuracy of 94.89% in VGG16, 95.39% in VGG19, and 95.89% in InceptionV3.The InceptionV3 model produced the most favourable outcomes. The model proposed by Xu et al. [19] based on the Atrous Spatial Pyramid Pooling (ASPP) module and depthwise separable convolution. They trained the BCD dataset on 300 epochs, achieving an accuracy of 96.37% with a precision of 78.11%, 100% recall, and an F1-score of 87.71%. When we compared our proposal to previous studies and with the MobileNetV3_Large model, we found that it outperformed in all feature sizes.
5. Conclusions
This paper presents a method for enhancing bridge damage prediction based on LBP-BoVW for feature extraction, an Apriori algorithm for selecting the strongest features, and MobileNetV3_Large as a classifier. The proposed method achieved promising results for four bridge damage and crack image datasets, with an accuracy rate between 98.27% and 100% and an error rate between 1.73% and 0%. Although we trained the data using 10-fold cross-validation, which tested all dataset samples with 20 epochs, our proposed system achieved promising results compared to previous studies that used the same datasets with more training epochs and did not use cross-validation or with lower k-fold.
Author Contributions
Conceptualization, A.A.M. and S.P.; methodology, A.A.M. and S.P.; software, A.A.M.; validation, A.A.M., S.P. and P.S.; formal analysis, A.A.M.; investigation, A.A.M.; resources, A.A.M.; writing—original draft preparation, A.A.M. and S.P.; writing—review and editing, A.A.M.; visualization, A.A.M.; supervision, S.P. and P.S.; project administration, S.P.
Funding
This work was not funded by any party.
Data Availability Statement
Not applicable.
Conflicts of Interest
The authors declare that there are no conflicts of interest.
References
- Nasr, A.; Kjellström, E.; Björnsson, I.; Honfi, D.; Ivanov, O. L., &Johansson, J. Bridges in a changing climate: a study of the potential impacts of climate change on bridges and their possible adaptations. Struct. Infrastruct. Eng. 2020, 16, pp. 738-749. [CrossRef]
- Ni, Y.; Mao, J.; Fu, Y.; Wang, H.; Zong, H., &Luo, K. Damage Detection and Localization of Bridge Deck Pavement Based on Deep Learning. sensors 2023, 23, p. 5138. [CrossRef]
- Bi, Q.; Goodman, K. E.; Kaminsky, J., &Lessler, J. What is Machine Learning? A Primer for the Epidemiologist. Am. J. Epidemiol. 2019, 188, pp. 2222-2239. [CrossRef]
- Krahe, C.; Kalaidov, M.; Doellken, M.; Gwosch, T.; Kuhnle, A.; Lanza, G., &Matthiesen, S. AI-Based knowledge extraction for automatic design proposals using design-related patterns. Procedia CIRP 2021, 100, pp. 397-402.
- Cao, J.; Huang, Z., &Shen, H. T. Local deep descriptors in bag-of-words for image retrieval. . ACM Multimedia 2017, pp. 52-58. [CrossRef]
- Hassan, R. Q.; Sultani, Z. N., &Dhannoon, B. N. Content-Based Image Retrieval System using Color Moment and Bag of Visual Words with Local Binary Pattern. KIJOMS 2023, 9. [CrossRef]
- Ngoc, V. T. N.; Agwu, A. C.; Son, L. H.; Tuan, T. M.; Nguyen Giap, C.; Thanh, M. T. G.; Duy, H. B., &Ngan, T. T. The combination of adaptive convolutional neural network and bag of visual words in automatic diagnosis of third molar complications on dental x-ray images. Diagnostics 2020, 10, p. 209. [CrossRef]
- Afonso, L. C.; Pereira, C. R.; Weber, S. A.; Hook, C.; Falcão, A. X., && Papa, J. P. Hierarchical learning using deep optimum-path forest. J. Vis. Commun. Image Represent. 2020, 71. [CrossRef]
- Tripathi, S.; Singh, S. K., &Kuan, L. H. Bag of Visual Words (BoVW) with Deep Features--Patch Classification Model for Limited Dataset of Breast Tumours. arXiv preprint arXiv:.10701 2022. [CrossRef]
- Kumar, M. D.; Babaie, M.; Zhu, S.; Kalra, S., &Tizhoosh, H. R. A comparative study of CNN, BoVW and LBP for classification of histopathological images. SSCI 2017. [CrossRef]
- Huang, H., & Xu, K. Combing Triple-Part Features of Convolutional Neural Networks for Scene Classification in Remote Sensing. Remote Sens. 2019, 11. [CrossRef]
- Olaode, A., & Naghdy, G. Local Image Feature Extraction using Stacked-Autoencoder in the Bag-of-Visual Word modelling of Images. ICCC 2019, December, pp. 1744-1749. [CrossRef]
- Govender, D., & Tapamo, J.-R. Spatio-temporal scale coded bag-of-words. Sensors 2020, 20, p. 6380. [CrossRef]
- Sultani, Z. N., & Dhannoon, B. Modified Bag of Visual Words Model for Image Classification. ANJS 2021, 24, pp. 78-86. [CrossRef]
- Bhalaji Kharthik, K. S.; Onyema, E. M.; Mallik, S.; Siva Prasad, B. V. V.; Qin, H.; Selvi, C., &Sikha, O. K. Transfer learned deep feature based crack detection using support vector machine: a comparative study. Sci. Rep. 2024, 14, p. 14517. [CrossRef]
- Yang, Q.; Shi, W.; Chen, J., &Lin, W. Deep convolution neural network-based transfer learning method for civil infrastructure crack detection. Autom Constr 2020, 116, p. 103199. [CrossRef]
- Zoubir, H.; Rguig, M.; El Aroussi, M.; Chehri, A., &Saadane, R. Concrete Bridge Crack Image Classification Using Histograms of Oriented Gradients, Uniform Local Binary Patterns, and Kernel Principal Component Analysis. Electronics (Basel) 2022, 11, p. 3357. [CrossRef]
- Zoubir, H.; Rguig, M., &Elaroussi, M. Crack recognition automation in concrete bridges using Deep Convolutional Neural Networks. MATEC Web of Conferences 2021, 349, p. 03014.
- Xu, H.; Su, X.; Wang, Y.; Cai, H.; Cui, K., &Chen, X. Automatic Bridge Crack Detection Using a Convolutional Neural Network. Appl. Sci. 2019, 9, p. 2867. [CrossRef]
- Ojala, T.; Pietikainen, M., &Maenpaa, T. Multiresolution gray-scale and rotation invariant texture classification with local binary patterns. IEEE Trans. Pattern Anal. Mach. Intell. 2002, 24, pp. 971-987. [CrossRef]
- Yu, Z.; Cai, R.; Cui, Y.; Liu, X.; Hu, Y., &Kot, A. C. Rethinking vision transformer and masked autoencoder in multimodal face anti-spoofing. Int J Comput Vis 2024, 132, pp. 1-22. [CrossRef]
- Agrawal, R.; Imielinski, T., &Swami, A. Database mining: A performance perspective. TKDE 1993, 5, pp. 914-925. [CrossRef]
- Zakur, Y., & Flaih, L. Apriori Algorithm and Hybrid Apriori Algorithm in the Data Mining: A Comprehensive Review. E3S Web of Conferences 2023, 448, p. 02021. [CrossRef]
- Kharsa, R., & Aghbari, Z. A. Association rules based feature extraction for deep learning classification. icSoftComp2022 2022, December, pp. 72-83. [CrossRef]
- Mamdouh Farghaly, H., & Abd El-Hafeez, T. A high-quality feature selection method based on frequent and correlated items for text classification. Soft Comput. 2023, 27, pp. 11259-11274. [CrossRef]
- Howard, A. G.; Zhu, M.; Chen, B.; Kalenichenko, D.; Wang, W.; Weyand, T.; Andreetto, M., &Adam, H. Mobilenets: Efficient convolutional neural networks for mobile vision applications. arXiv preprint arXiv:.04861 2017. [CrossRef]
- Howard, A.; Sandler, M.; Chu, G.; Chen, L. C.; Chen, B.; Tan, M., &Adam, H. Searching for mobilenetv3. IEEE/CVF 2019. [CrossRef]
- Lopez Droguett, E.; Tapia, J.; Yanez, C., &Boroschek, R. Semantic segmentation model for crack images from concrete bridges for mobile devices. Proc. Inst. Mech. Eng. O 2022, 236, pp. 570-583. [CrossRef]
- Mundt, M.; Majumder, S.; Murali, S.; Panetsos, P., &Ramesh, V. Meta-learning convolutional neural architectures for multi-target concrete defect classification with the concrete defect bridge image dataset. CVPR 2019. [CrossRef]
- Brzezinski, D., & Stefanowski, J. Prequential AUC: properties of the area under the ROC curve for data streams with concept drift. Knowl Inf Syst 2017, 52, pp. 531-562. [CrossRef]
- Hu, B.-G., & Dong, W.-M. A study on cost behaviors of binary classification measures in class-imbalanced problems. arXiv preprint arXiv:.04861 2014,. [CrossRef]
- Tran, T. X., "The high confidence data classification method with near zero classification error," The University of Alabama in Huntsville, 2021.
- DeLong, E. R.; DeLong, D. M., &Clarke-Pearson, D. L. Comparing the Areas under Two or More Correlated Receiver Operating Characteristic Curves: A Nonparametric Approach. Biometrics 1988, 44, pp. 837-845. [CrossRef]
Figure 1.
The general structure of the proposed model.
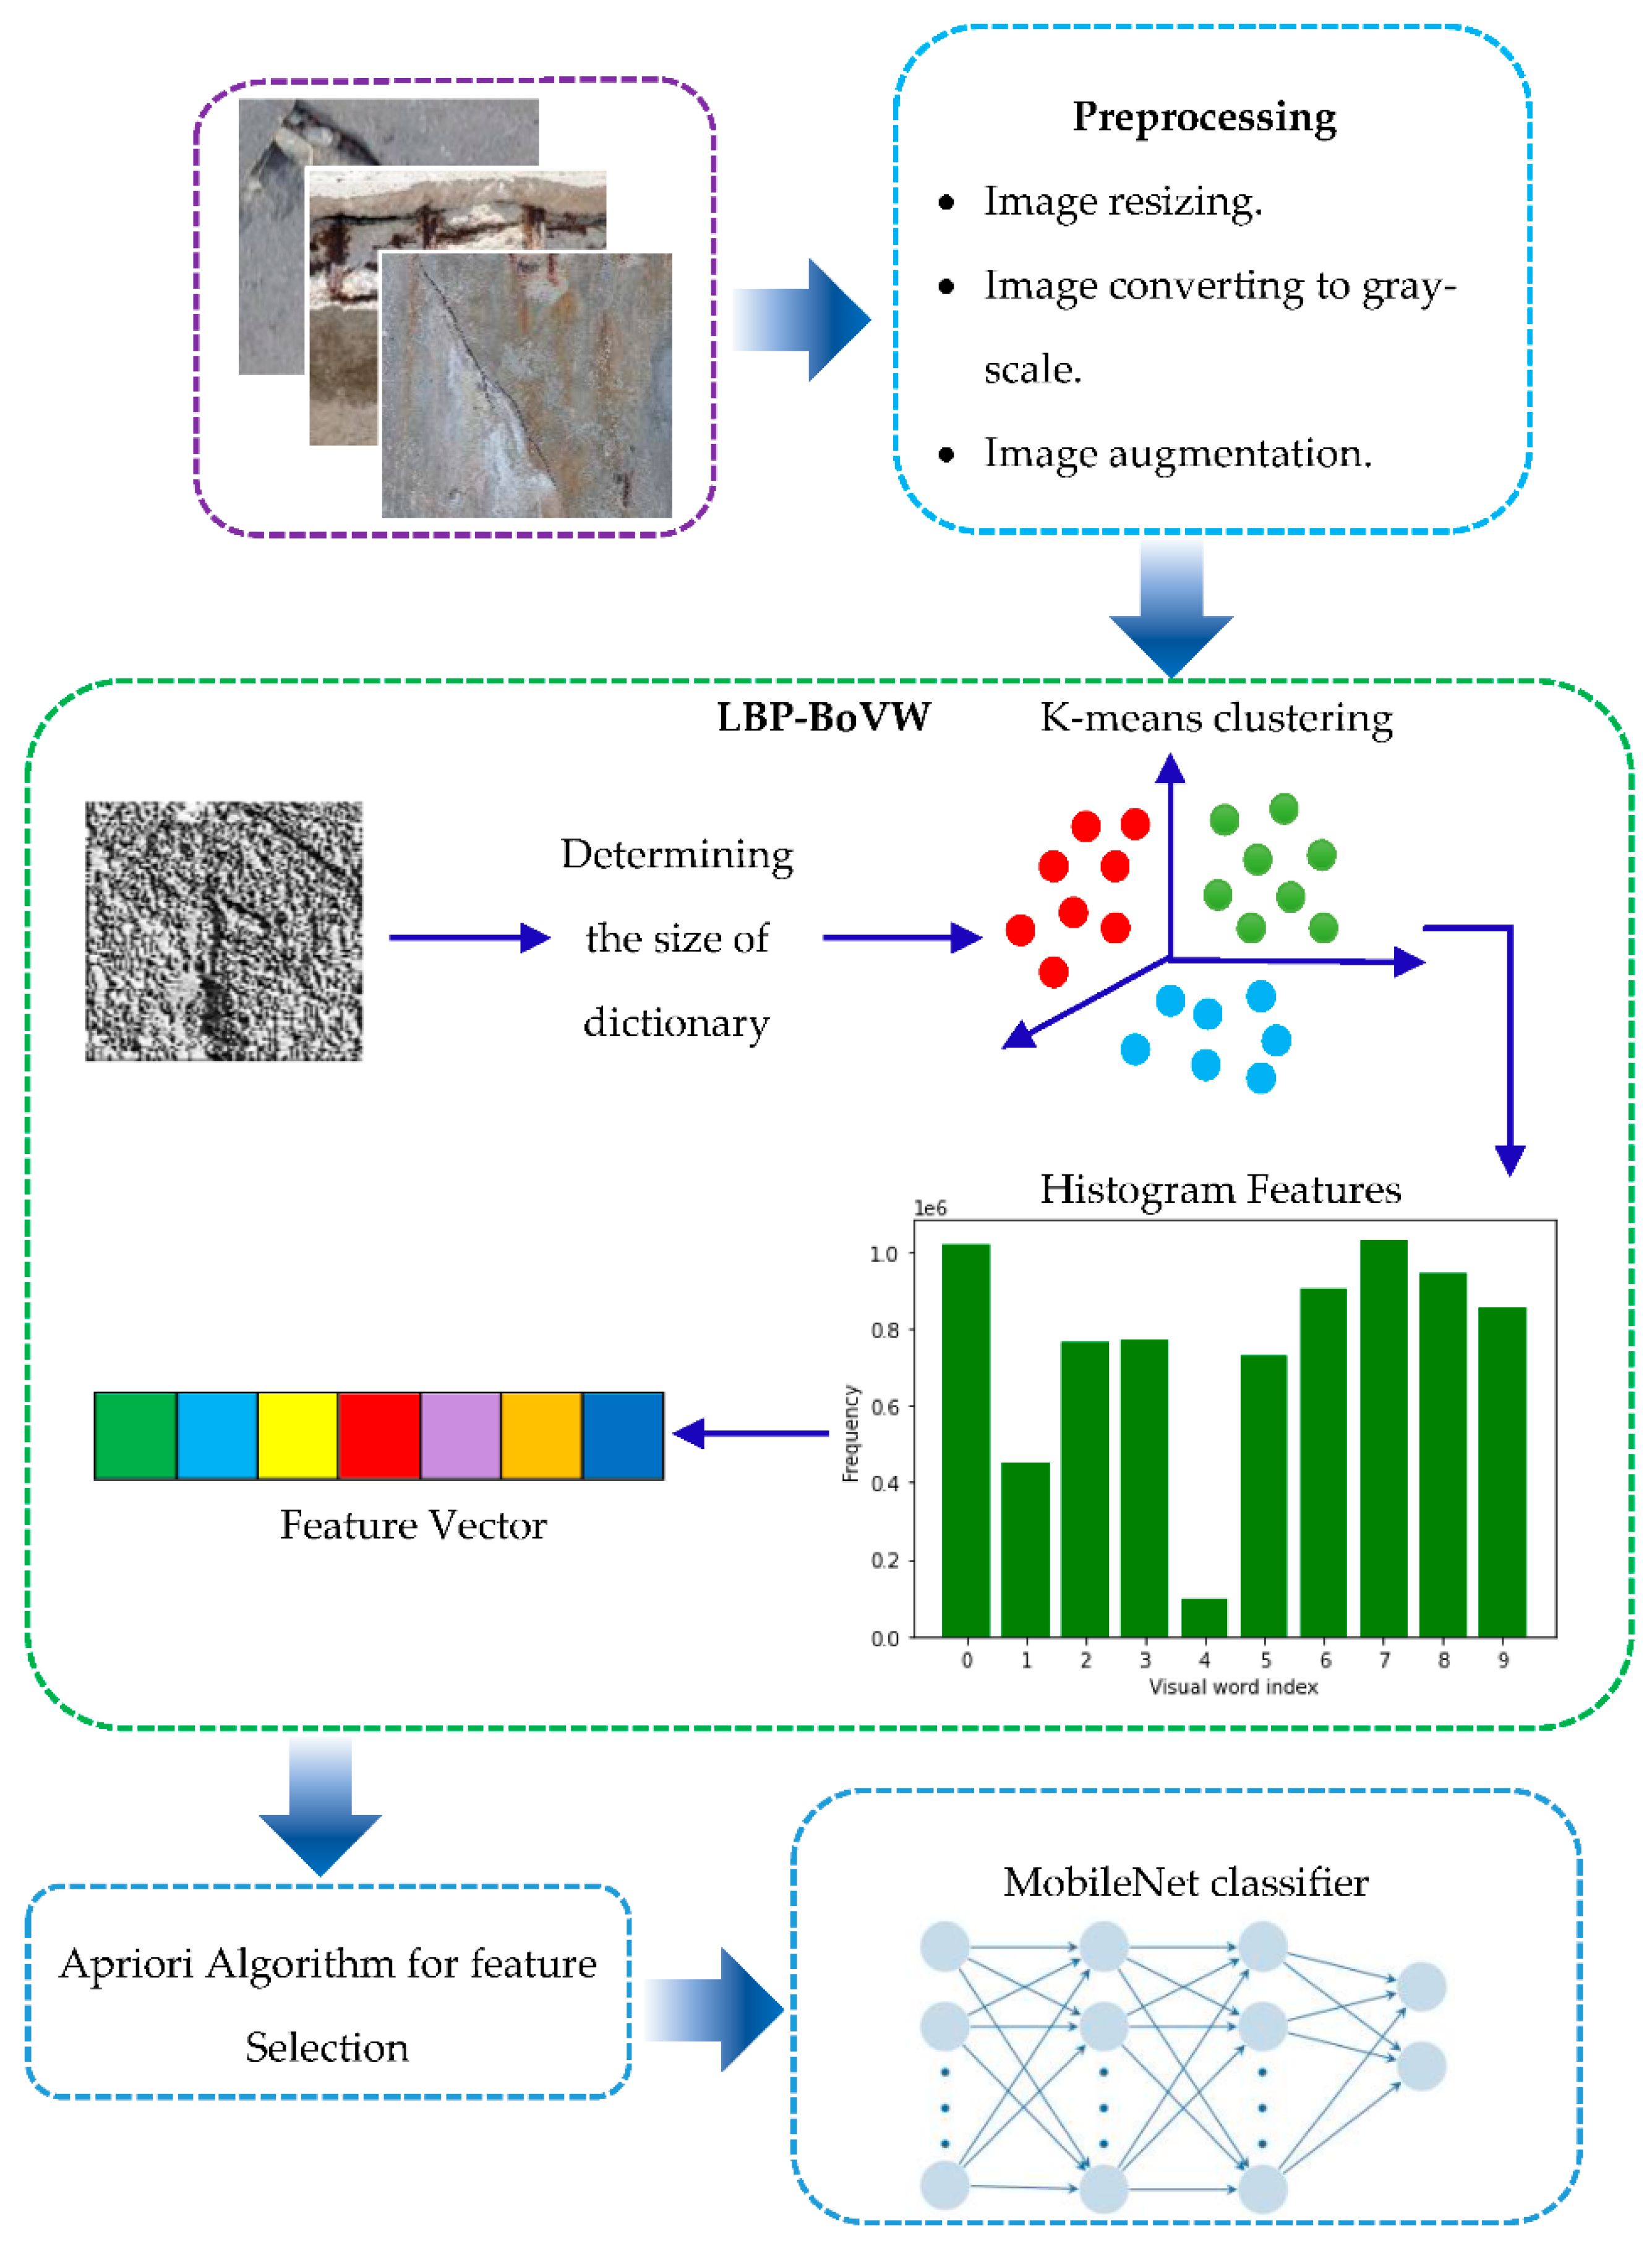
Figure 2.
Local Binary Pattern calculating.
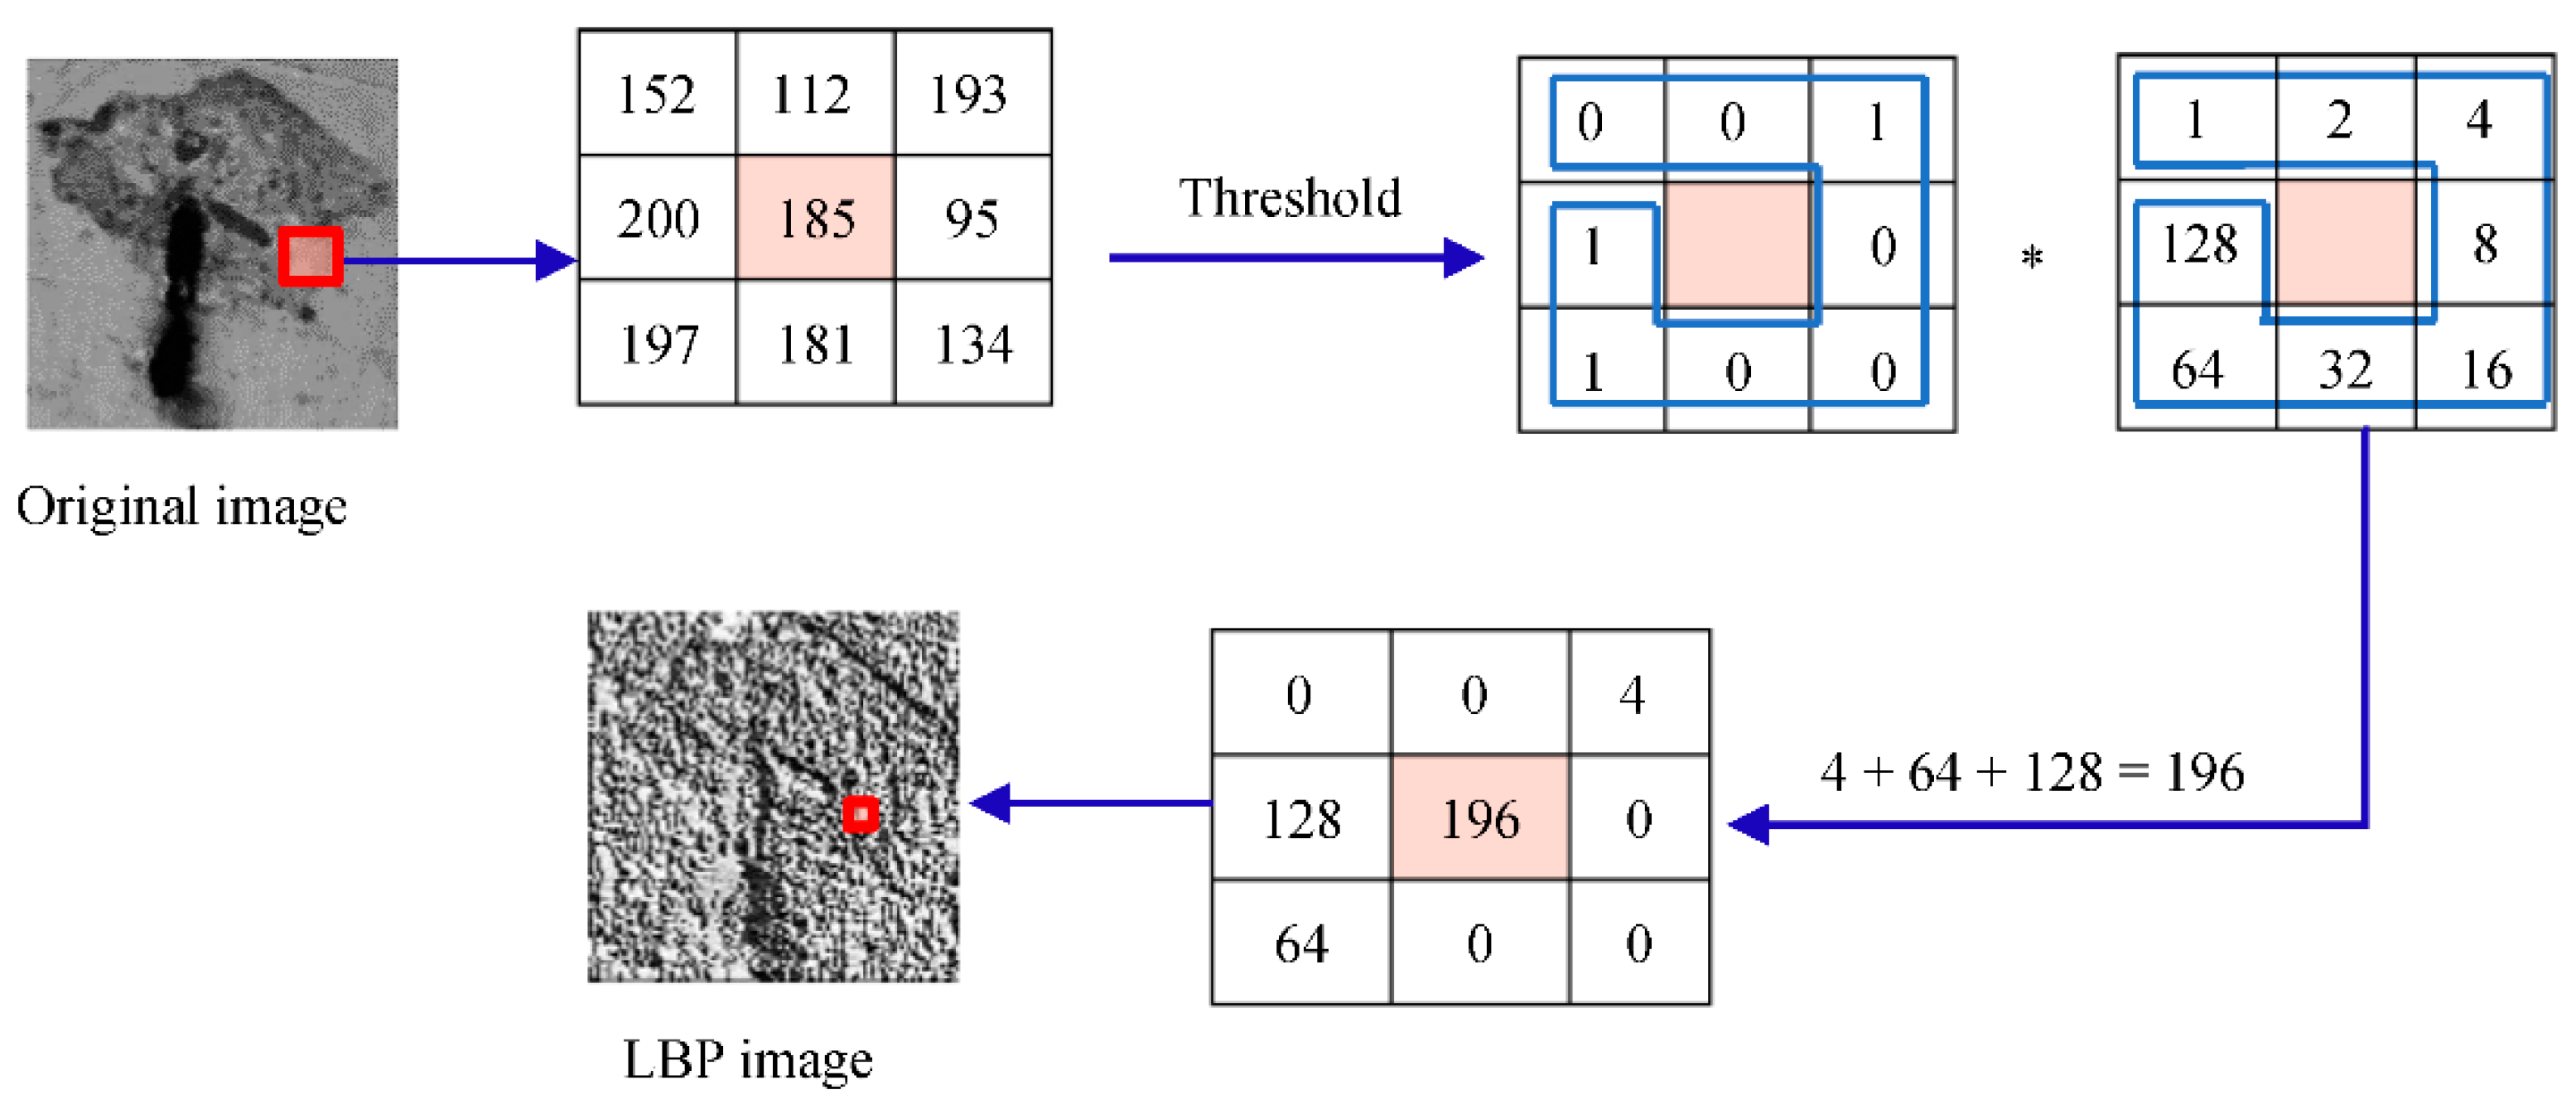
Figure 3.
The accuracy and loss plot of the best results for: (a) BCD dataset with feature size 100; (b) Bridge dataset with feature size 300; (c) CODEBRIM dataset with feature size 200; and (d) DIMEC-Crack dataset with feature size 100.
Figure 3.
The accuracy and loss plot of the best results for: (a) BCD dataset with feature size 100; (b) Bridge dataset with feature size 300; (c) CODEBRIM dataset with feature size 200; and (d) DIMEC-Crack dataset with feature size 100.
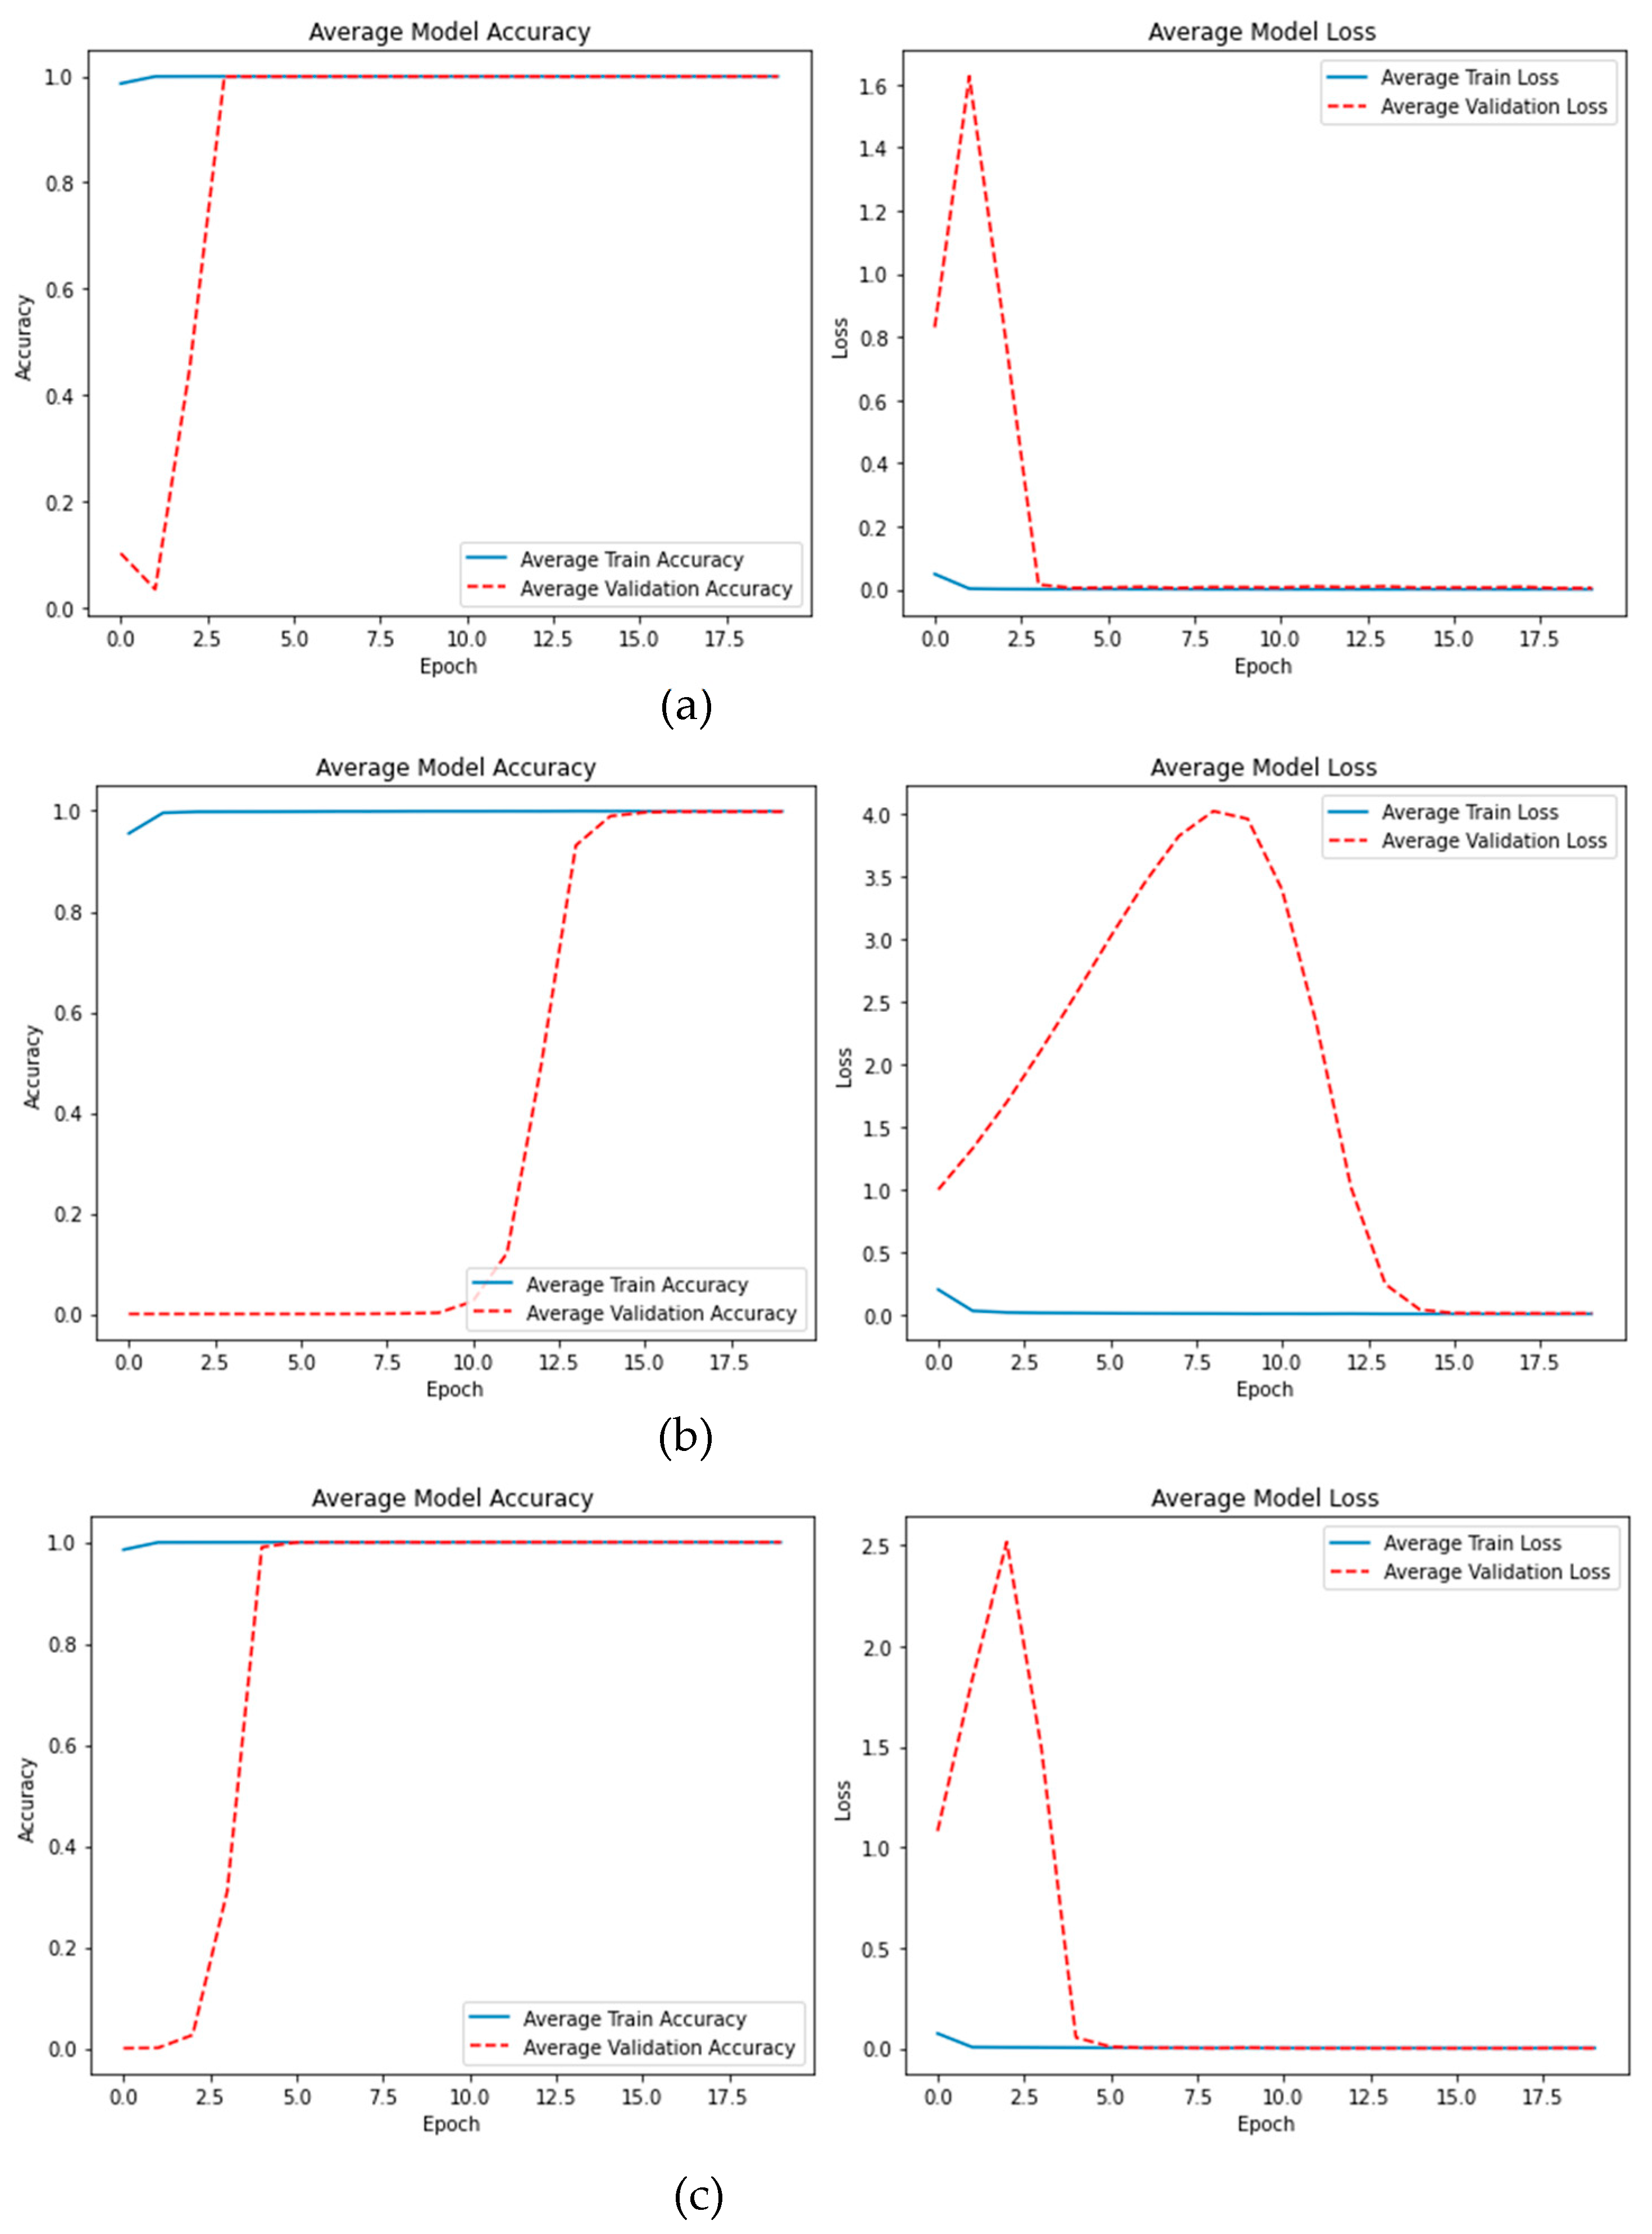
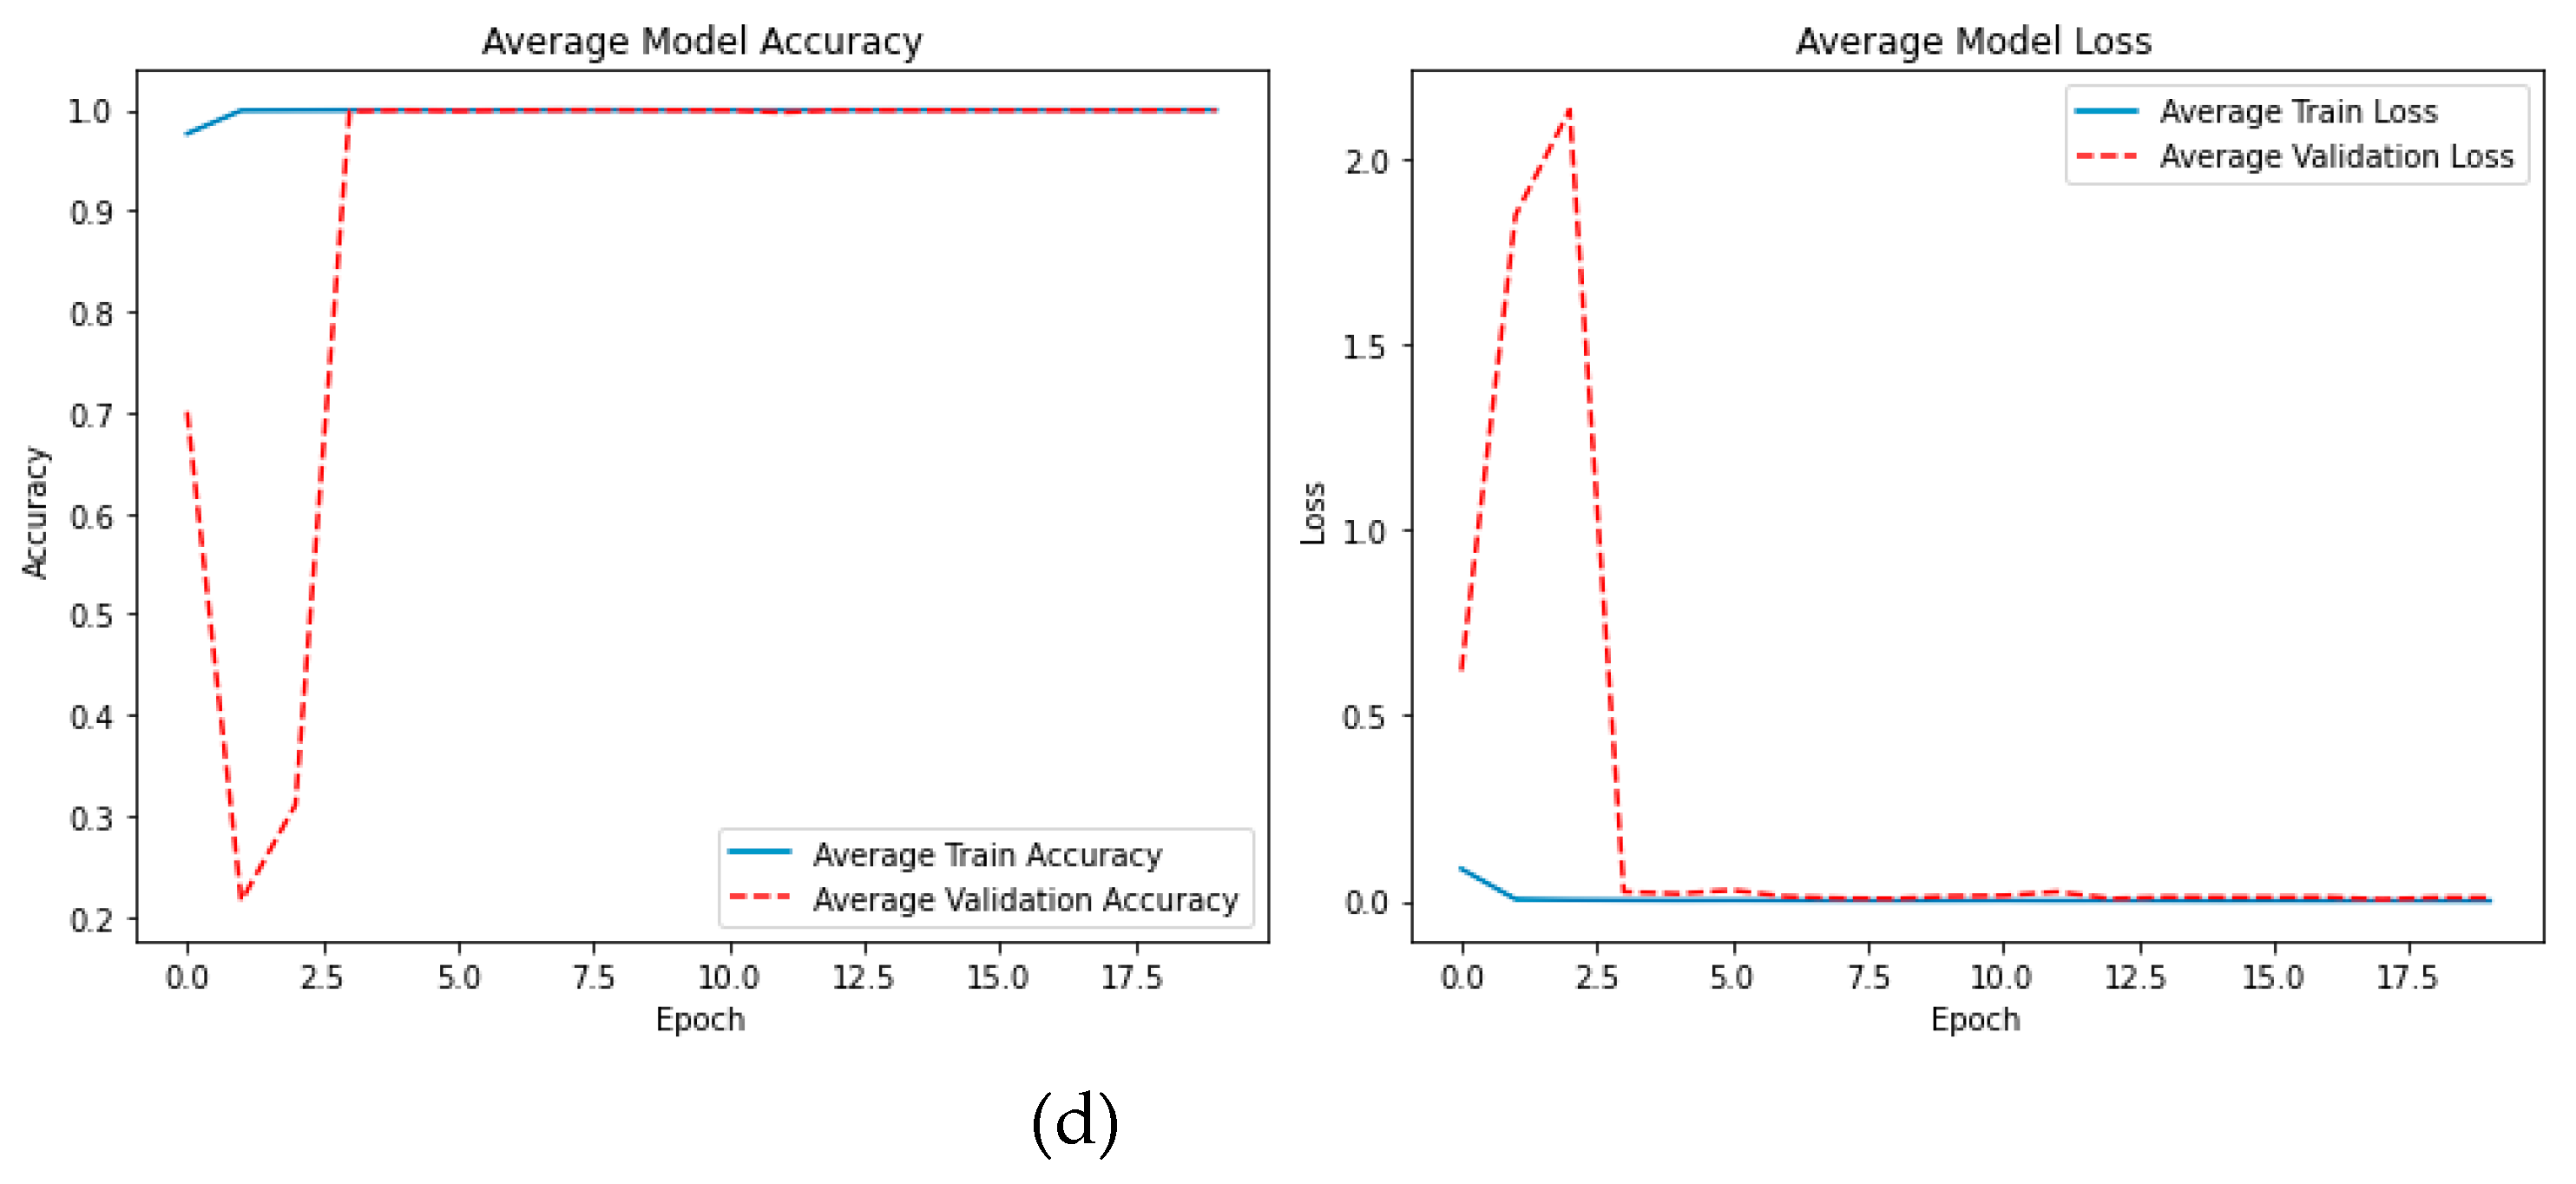
Figure 4.
The confusion matric of the best results for: (a) BCD dataset with feature size 100; (b) Bridge dataset with feature size 300; (c) CODEBRIM dataset with feature size 200; and (d) DIMEC-Crack dataset with feature size 100.
Figure 4.
The confusion matric of the best results for: (a) BCD dataset with feature size 100; (b) Bridge dataset with feature size 300; (c) CODEBRIM dataset with feature size 200; and (d) DIMEC-Crack dataset with feature size 100.
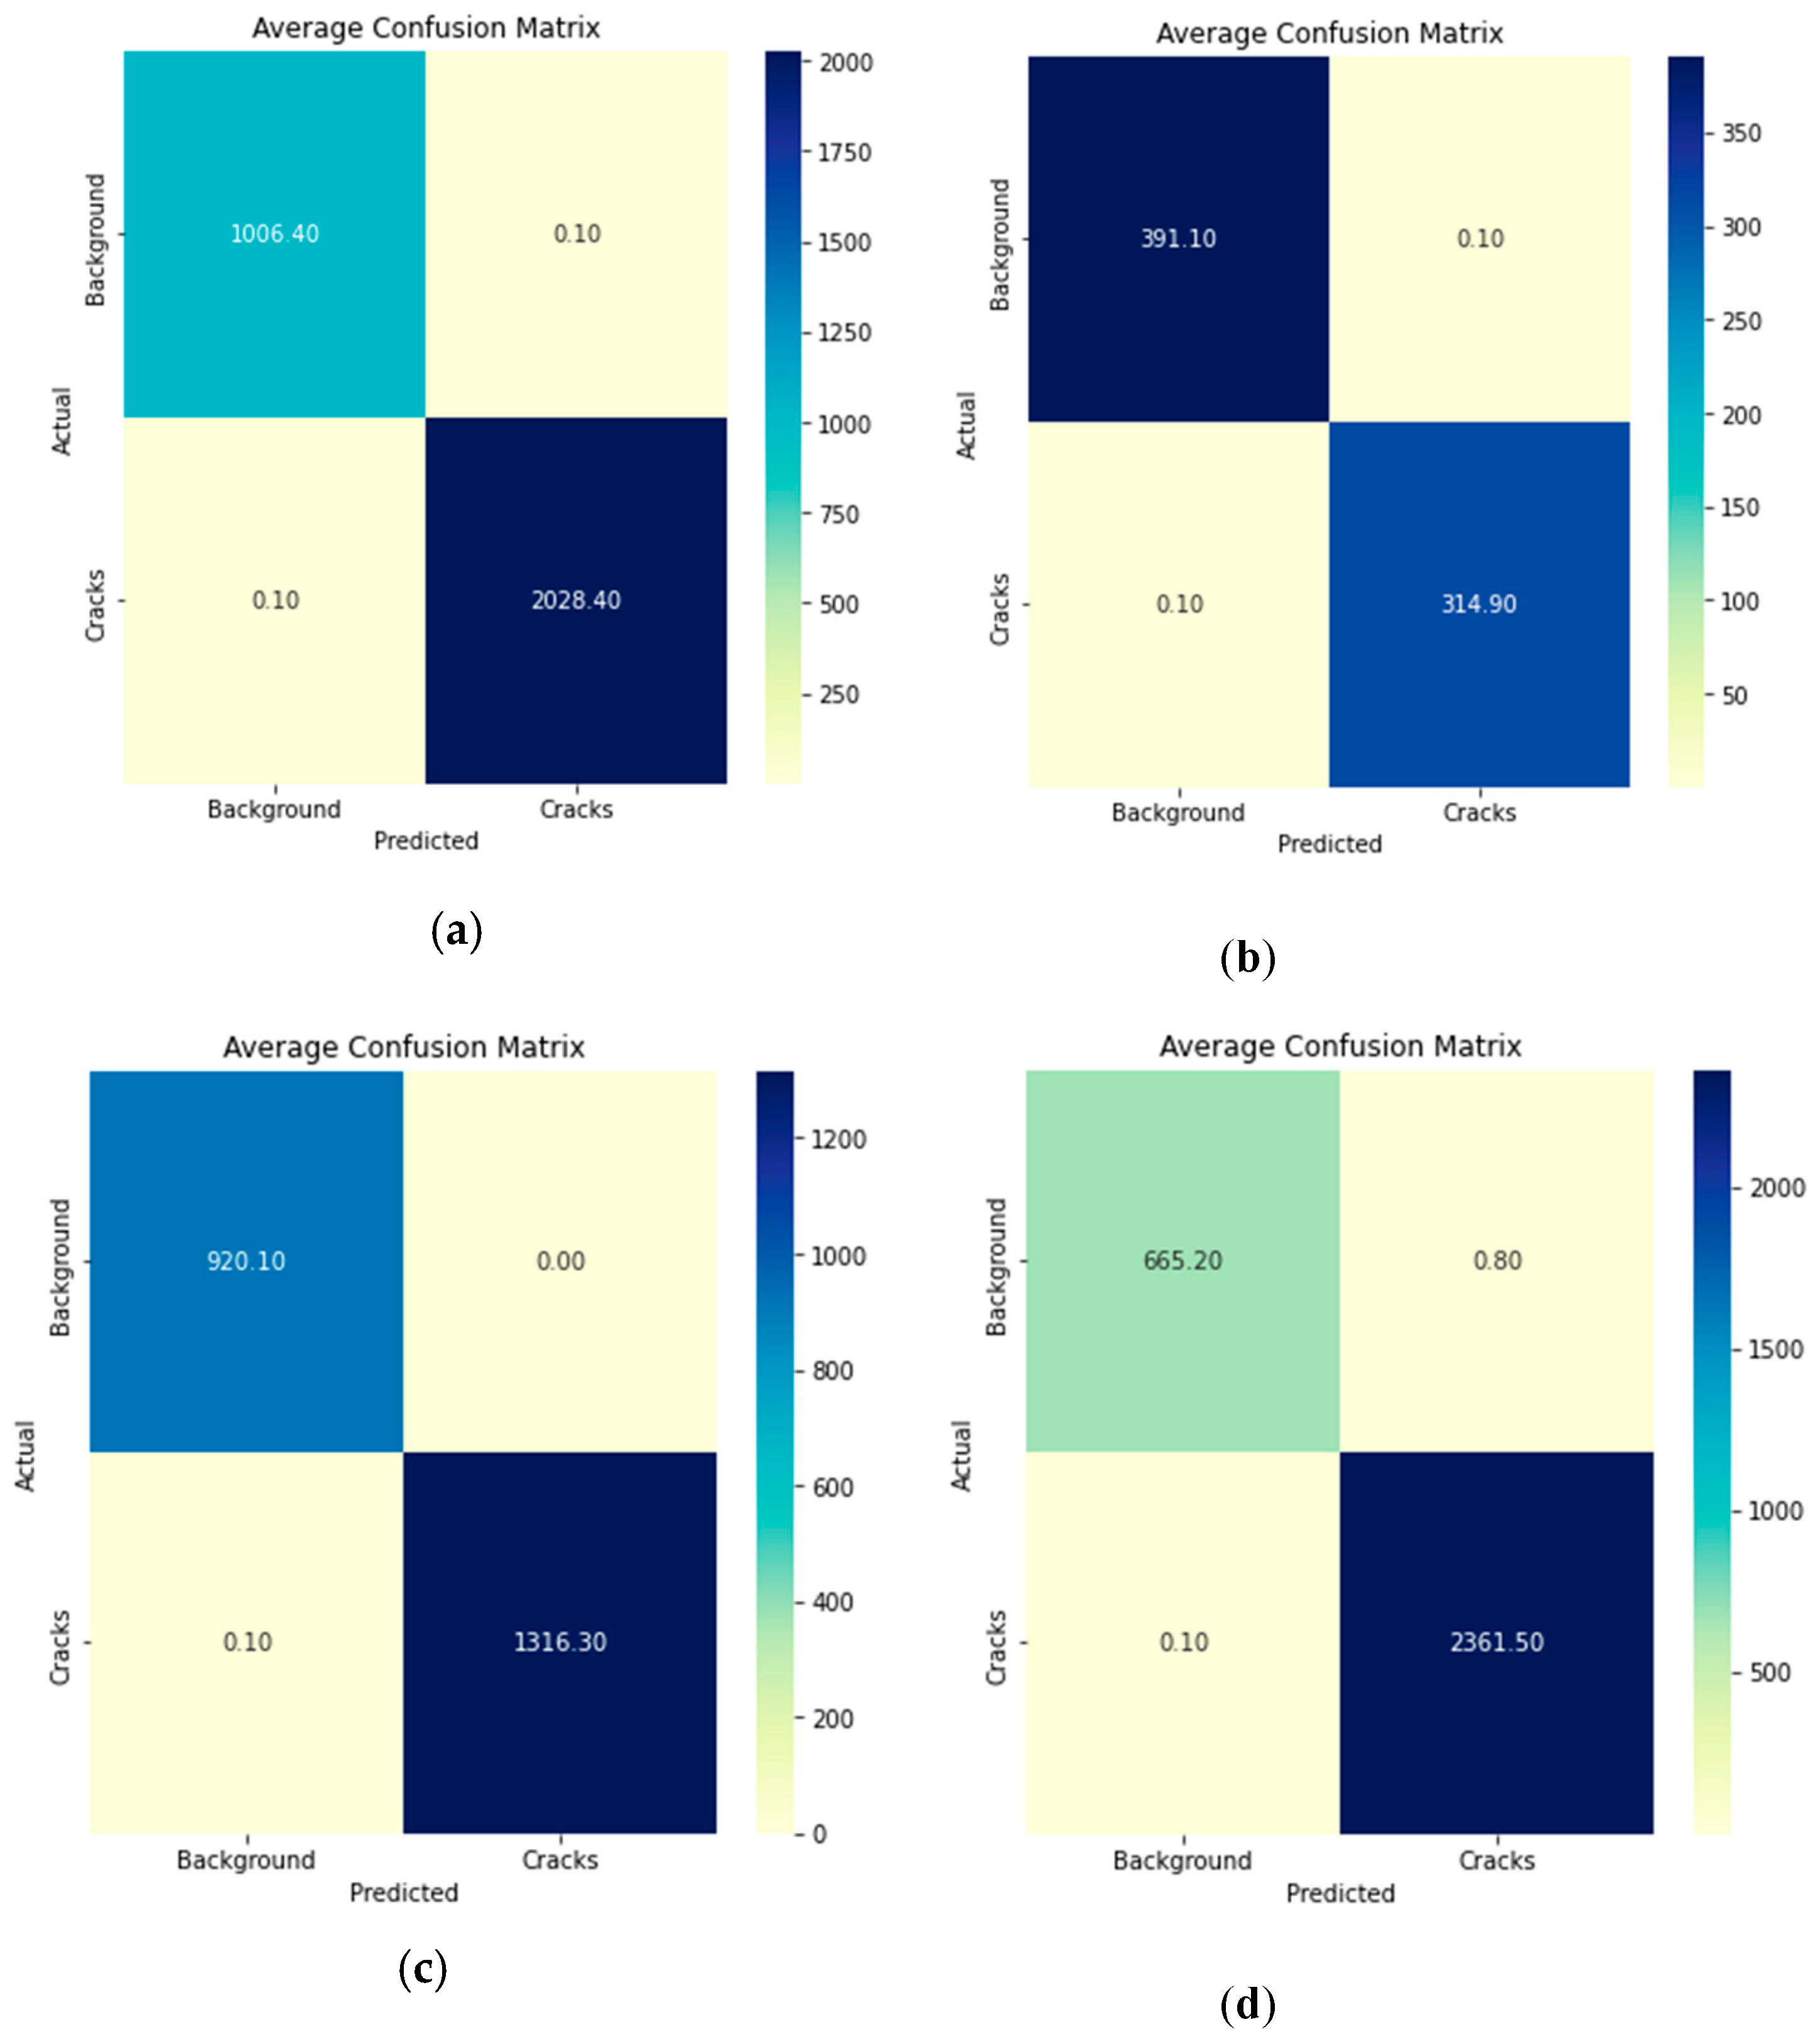

Table 1.
Number of features after and before Apriori feature selection.
| Datasets | No. LBP-BoVW feature | ||||
| 50 | 100 | 200 | 300 | ||
| No. features after Apriori feature selection | DIMEC-Crack Database | 21 | 19 | 18 | 17 |
| CODEBRIM | 21 | 20 | 22 | 20 | |
| BCD | 21 | 17 | 14 | 14 | |
| Bridge | 20 | 19 | 18 | 18 | |
Table 2.
The results of the proposed Model.
| Datasets | Performance Metrics | Number of visual words | |||
| 50 | 100 | 200 | 300 | ||
| BCD | Accuracy | 99.98 | 99.99 | 99.98 | 99.97 |
| Precision | 99.97 | 100 | 100 | 100 | |
| Recall | 100 | 99.99 | 99.97 | 99.97 | |
| F1-score | 99.99 | 100 | 99.98 | 99.98 | |
| ROC-AUC | 99.97 | 99.99 | 99.98 | 99.98 | |
| Error rate | 0.02 | 0.01 | 0.02 | 0.03 | |
| Bridge Dataset | Accuracy | 99.82 | 99.84 | 99.96 | 99.97 |
| Precision | 99.78 | 99.90 | 99.97 | 99.97 | |
| Recall | 99.81 | 99.75 | 99.94 | 99.97 | |
| F1-score | 99.79 | 99.83 | 99.95 | 99.97 | |
| ROC-AUC | 99.82 | 99.83 | 99.96 | 99.97 | |
| Error rate | 0.18 | 0.16 | 0.04 | 0.03 | |
| CODEBRIM | Accuracy | 99.93 | 99.94 | 100 | 98.27 |
| Precision | 99.96 | 99.92 | 100 | 99.97 | |
| Recall | 99.92 | 99.98 | 99.99 | 97.09 | |
| F1-score | 99.94 | 99.95 | 100 | 98.28 | |
| ROC-AUC | 99.93 | 99.93 | 100 | 98.52 | |
| Error rate | 0.07 | 0.06 | 0 | 1.73 | |
| DIMEC-Crack | Accuracy | 99.98 | 99.99 | 99.98 | 99.97 |
| Precision | 100 | 100 | 100 | 99.99 | |
| Recall | 99.97 | 99.99 | 99.98 | 99.97 | |
| F1-score | 99.99 | 99.99 | 99.99 | 99.98 | |
| ROC-AUC | 99.99 | 99.99 | 99.99 | 99.97 | |
| Error rate | 0.02 | 0.01 | 0.02 | 0.03 | |
Table 3.
The classification accuracy scores comparison.
| Refrences | Method | K-fold CV | No. of Epochs | Datasets | |||
| BCD | Bridge | CODEBRIM | DIMEC-Crack | ||||
| Bhalaji Kharthik et al. [15] | VGG16 | - | - | 99.83 | - | - | - |
| VGG19 | 99.67 | - | - | - | |||
| Xception | 99.67 | - | - | - | |||
| ResNet 50 | 99.67 | - | - | - | |||
| ResNet 101 | 99.5 | - | - | - | |||
| ResNet 152 | 99.83 | - | - | - | |||
| InceptionV3 | 99.83 | - | - | - | |||
| InceptionResNet V2 | 99.5 | - | - | - | |||
| MobileNet | 99.83 | - | - | - | |||
| MobileNetV2 | 99.83 | - | - | - | |||
| DenseNet121 | 99.67 | - | - | - | |||
| EfficientNetB0 | 99.83 | - | - | - | |||
| Yang et al. [16] | TL model | - | 20 | 99.72 | - | - | - |
| Zoubir et al. [18] | TL model | 5-fold | 10 | - | 95.89 | - | - |
| Zoubir et al. [17] | HOG + ULBP + KPCA+ SVM | 5-fold | - | - | 99.29 | - | - |
| Xu et al. [19] | atrous convolution, ASPP, and depthwise separable convolution | - | 300 | 96.37 | - | - | - |
| MobileNetV3_Large | 10-fold | 20 | 82.14 | 72.59 | 77.53 | 91.51 | |
| Proposed Method | LBP-BoVW+ Appriori+ MobileNetV3_Large | 10-fold | 20 | 99.99 | 99.97 | 100 | 100 |
Disclaimer/Publisher’s Note: The statements, opinions and data contained in all publications are solely those of the individual author(s) and contributor(s) and not of MDPI and/or the editor(s). MDPI and/or the editor(s) disclaim responsibility for any injury to people or property resulting from any ideas, methods, instructions or products referred to in the content. |
© 2025 by the authors. Licensee MDPI, Basel, Switzerland. This article is an open access article distributed under the terms and conditions of the Creative Commons Attribution (CC BY) license (http://creativecommons.org/licenses/by/4.0/).
Copyright: This open access article is published under a Creative Commons CC BY 4.0 license, which permit the free download, distribution, and reuse, provided that the author and preprint are cited in any reuse.


