
Submitted:
21 April 2025
Posted:
21 April 2025
You are already at the latest version
Abstract
This study explores the development of an Electronic Nose (E-nose) sensor for fish freshness based on a composite of polyvinyl alcohol (PVA), polyethylene glycol (PEG), and reduced graphene oxide (rGO). The sensor leverages the unique properties of the PVA-PEG polymer matrix, such as its flexibility and moisture responsiveness, in combination with the electrical conductivity of rGO. The PVA-PEG/rGO composite was synthesized through a low-temperature embedding process to ensure the preservation of sensitive biomolecules and prevent thermal degradation. This sensor demonstrates high sensitivity to volatile amines released during fish spoilage, providing real-time food monitoring to maintain freshness. Electrical resistance changes in the rGO network, influenced by the polymer's interaction with spoilage gases, were correlated with fish freshness levels. The low-cost, easy fabrication and environmentally friendly nature of the PVA-PEG/rGO E-nose sensor make it a promising candidate for use in packaging or direct contact with fish products in the food industry. This study highlights the potential for extending shelf life and reducing food waste through rapid spoilage detection.
Keywords:
Low-Temperature
; Polyvinyl Alcohol-Polyethylene Glycol
; Reduced Graphene Oxide
; Gas Sensor
; Electronic Nose
; Fish Freshness Indicator
1. Introduction
Consuming rotten food leads to numerous fatalities worldwide. Foodborne illnesses result from the introduction of diverse microbial pathogens into the human gastrointestinal tract through numerous means [1]. Often, these infections lead to the hospitalization of patients due to the seriousness of the infection. Out of all protein-rich foods that are prone to spoiling, fish and fishery products are particularly perishable [2]. Particular species of fish and fisheries products are cultivated in specific geographic regions and thereafter distributed globally. This is a prime possibility for fish to spoil due to cross-contamination, inadequate storage, and fluctuations in temperature [3]. Most consumers find it challenging to detect rotten fish by observing its color, texture, or odor. Conventional methods such as gas/liquid chromatography, chemical methods, enzyme testing, and optical spectroscopy provide precise measurements of spoilage. However, these approaches involve substantial usage expenses, demand lengthy analysis periods, and require the expertise of experienced personnel [4]. An inexpensive, dependable, fast, and non-destructive technique for identifying fish spoilage is highly sought after, however, remains a difficult task.
Several studies over the last few years have established a relation between fish spoilage and the release of total basic volatile nitrogen (TVB-N) in gaseous form [4,5,6,7]. TVB-N is produced through the breakdown of amino acids by enzymes from both the fish itself and microorganisms present in decaying fish and fishery products. TVB-N mostly comprises ammonia, dimethylamine (DMA), and trimethylamine (TMA) generated from deceased fish. Authorities worldwide have authorized a maximum amount of 20 mg of TVB-N per 100 g of fish product, equivalent to 200 ppm of TVB-N [5]. The safe TVB-N levels range from 150 ppm to 300 ppm, depending on the situation. Several recent studies have found a connection between the decay of fish and the release of total basic volatile nitrogen (TVB-N) in its gaseous state. Detecting levels of TVB-N in its gaseous state is significantly less complex than detecting multiple biogenic amines using chemical methods. In previous investigations, chemo resistive gas sensors have been successfully utilized to detect the presence of ammonia, DMA, and TMA. Chemoresistive gas sensors are electrical sensors that exhibit a change in resistance when exposed to a particular gas. These sensors are inexpensive, fast, and capable of wirelessly transmitting data for distant sensing [5].
Graphene is a two-dimensional sheet of Carbon having sp2 hybridization. It is called a miracle material as it can be stacked to form 3D graphite, rolled to form 1D nanotubes, and wrapped to form 0D fullerenes [8]. Its extended range π-conjugation has resulted in remarkable thermal, mechanical, and electrical properties. These characteristics make it a compelling option for sensor applications [9]. The electronic structure of graphene allows it to participate in chemical reactions as an electron donor (reducing agent) and also as an electron acceptor (oxidizer) [8]. rGO is the graphene-like material obtained via less complicated synthesis methods. Research has shown electrical properties of rGO are similar to graphene and can be modified to a great extent by using the polymer embedding method [10,11,12]. Polymers like polypyrrole, PEDOT: PSS, polythiophene, polyvinyl alcohol (PVA), and polyethylene glycol (PEG) represent the class of gas-sensing materials that can operate at room temperature. The good mechanical properties of these polymers allow easy fabrication of sensors [13]. PVA is a polymer material with good absorption ability towards organic gases because of its fibrous and porous structure. Large specific area of PVA provides an absorption site for gases to interact with the material [14].
Rafaela Andre's review emphasized the significance of investigating chemoresistive gas sensors for the identification of volatile amines generated during the decomposition of fish and fishery products [3]. The review conducted by Leonardo Franceschelli et. al. focuses on sensing technologies used to detect fish rotting, providing an overview of the existing approaches employed in this field [1]. Their emphasis lies on the cost-effective and efficient detection achieved by an electronic nose composed of chemoresistive gas sensors, in contrast to more advanced methods such as NMR, fluorescence, IR, and Raman spectroscopies. Giulia Zambotti and their team worked on the realistic analysis of fish degradation detected using a single chemoresistive metal oxide gas sensor [2]. They backed their results by analyzing microbial degradation of the real fish sample under similar atmospheric conditions. This study highlights the practical applications of chemo-resistive gas sensors as a fish freshness indicator. Liang-Yu Chang and team worked on the rapid amine gas sensor using a poly(3-hexylthiophene) sensing element for amine detection. They detected a sensitivity of 50% for ammonia, 35% for DMA, and 15% for TMA at 1 ppm. Zhong Ma et. al. developed a printable and wireless chemo-resistive polymer gas sensor for the detection of food spoilage. They reported a sensitivity of ~225% for 5 ppm of ammonia at room temperature. Ammonia sensing using rGO has been explored by Tan Nhiem Ly et. al. [15], Ghasem Habibi Jetani et. al. [16] Ravindra Jha et. al. [17], etc. The material has shown good sensitivity and selectivity for ammonia sensing at room temperature. The application of rGO-polymer for TVB-N sensing is based on the groundwork laid by previous studies.
In our previously published study, we have explored the possibility of using PEG-embedded rGO materials for sensing various types of gases [18]. We have obtained promising results after using optimized polymer-rGO composite materials for sensing volatile organic compounds (VOCs). The current investigation involved the creation of electronic nose (E-nose) sensors utilizing reduced graphene oxide (rGO), polyethylene glycol (PEG), and polyvinyl alcohol (PVA). Characterization of fabricated E-nose involves the assessment of their structural, chemical, and morphological properties. Subsequently, these sensors were evaluated for their gas sensing capabilities towards TVB-N, ammonia, DMA, and TMA at ambient temperature. An analysis was conducted on many sensor characteristics, including sensitivity, selectivity, long-term stability, and temperature stability, of improving the sensors. The calibration curve was established to better understand the relationship between the concentration of the analyte gas and the sensitivity of the sensor.
2. Materials and Methods
2.1. Materials
For the synthesis of PVA-PEG embedded rGO powders, polyethylene glycol (mol wt. 8000), polyvinyl alcohol (mol wt. 85000), graphite (particle size ~ 40 μm), concentrated sulfuric acid (H2SO4, 98%), potassium permanganate (KMnO4), sodium nitrate (NaNO3), sodium borohydride (NaBH4), and hydrogen peroxide (H2O2, 30 wt.%) were used. All these were obtained from S.D. Fine Chemical Limited, India. All the chemicals were AR-grade and were used without any further purification. Deionized (DI) water was purified using the Elga Lab. water system was used to ensure the high purity of synthesized powders.
2.2. Synthesis of Polymer-rGO Nanocomposite
Modified Hummer’s method was used to synthesize rGO powder [19,20]. To prepare primary PVA-PEG-rGO samples, rGO was dispersed in DI water, and 1 wt.%, of PVA (50%) and PEG (50%) was added to the solution. This mixture was ultrasonicated at room temperature for 30 min. A filtered mixture of PVA, PEG, and rGO was printed on a glass substrate using the ultrasonic spray deposition method. Films were air-dried under an IR lamp for 1 hr [21,22]. This sample was named 1% PP-rGO. A similar method was used to prepare other samples with 2%, 3%, 4%, and 5% PVA-PEG wt.% concentration in rGO. These samples were named 2% PP-rGO, 3% PP-rGO, 4% PP-rGO and 5% PP-rGO respectively. Table S1 provides complete information about the composition of all samples synthesized for testing gas sensing responses.
2.3. Material Characterization
Morphological analysis of rGO and various polymer-rGO composite samples was carried out using a JEOL (JSM-IT 300 LV) scanning electron microscope (SEM) to study the effect of polymer embedding on the morphology of the rGO samples. Samples were studied at various magnifications between 1000X and 100,000X of the surface. Structural analysis was carried out using an XPERT-PROMPD X-ray diffractometer (CuKα radiation, λ = 1.5405 Å). The analysis of functional groups present in rGO and polymer-rGO composites was studied using Perkin Elmer UATR spectrum 2. Transmittance was recorded for the range of 400 cm-1 to 4000 cm-1.
2.4. Gas sensing Studies
A four-probe-based gas sensing system apparatus was used for gas sensing studies. Keithley-2400 source meter was employed for resistivity measurements. Figure S1 shows the gas sensing set-up used for this study. In the present study, five PEG-rGO samples, 1% PP-rGO, 2% PP-rGO, 3% PP-rGO, 4% PP-rGO, and 5% PP-rGO were studied for their gas sensing responses for TVB-N, ammonia, DMA and TMA gases. We then selected the optimized sample based on the gas sensing results. PVA-PEG-rGO composite sample’s gas sensing response for TVB-N, ammonia, DMA, and TMA were recorded using the same method. The composition of each of these samples is given in the Table S1. TVB-N was produced by mixing equal amounts of ammonia, DMA, and TMA in a gas mixer connected to gas sensing system. The gas mixer is the simple container having multiple inlets and one outlet. The calculations of individual concentrations were done primary before mixing these gases together. Sensing studies were done by measuring the resistivity of each PP-rGO sample in air and in the presence of gas. Gas sensing studies were carried out at ambient temperature to enhance sensor applications in any environment [9]. Regarding sensor studies, sensitivity, selectivity, response time, recovery time, and repeatability were studied for each sample [23]. Sensitivity is defined as the relative variation of the resistance of the sensor film in the presence of applied gas concentration. The selectivity of a sensor is the ability to differentiate between different gases during the sensing process. Mathematically, they can be calculated as,
where Sg1 and Sg2 are sensitivities for gas 1 and gas 2. Ra and Rg are the resistances of the film in the presence of air and gas ‘g’ respectively. Response time is calculated as the time taken by the sensor to reach 90 % of its saturation resistance after the gas is inserted in the chamber.
Similarly, recovery time is when the sensor reaches 90 % of its original resistance after the gas is removed from the chamber towards the end of the cycle. The sensor's repeatability is its ability to reproduce similar results over several sensing cycles. Repeatability is studied by recording the number of cycles with the same sensor for the same concentration of analyte gas. Figure 1 represents the research scheme from deposition to obtaining gas sensing results using PP-rGO samples.
3. Results and Discussion
3.1. Scanning Electron Microscopy Studies of rGO and PP-rGO Samples
Morphological images of PP-rGO samples are shown in Figure 2. In Figure 2a, rGO powder shows the signature flake-like structure. Layers of rGO are stacked on each other and combined to form granules of rGO. Figure 2b–f show the images of 1% to 5 % rGO samples.
The significant morphological feature of these samples is the threads of PVA-PEG connecting different granules of rGO. They have been highlighted with yellow rectangles in the images. These thread-like structures passing through rGO granules can have significant effect on the conduction mechanism of the composite sample. Polymeric structures are known to expand after absorbing the analyte gas during gas-sensing activity. This expansion comes in the form of polymer swelling. This affects the overall conductivity of the sample sensor. As we go from 1% PP-rGO to 5% PP-rGO, the number of connecting polymer lines increases as the amount of polymer content in the PP-rGO composite increases. As discussed in Section 3.5.1, these increased polymer bridges result in increased selectivity for TVB-N and amines. The effect of the specific morphology of PP-rGO samples on gas-sensing activity has been discussed in Section 3.6.
3.2. FTIR Analysis of rGO and PP-rGO Samples
A study of the functional groups and chemical bonds was carried out using FTIR. Figure 3a shows the FTIR spectra of pure rGO and all composite PP-rGO samples. There is a clear distinction between rGO spectra and the PP-rGO spectrum. The FTIR spectra of PP-rGO samples are dominated by the peaks belonging to chemical bonds in PVA and PEG. As the chemical composition indicates, C-OH, C-H, C=O, and C-O are a few of the characteristic bonds expected in the PP-rGO spectra. Stretching vibrations in the hydroxyl group are represented by the broad peak present around 3300 cm-1. This belongs to the OH impurities present on rGO flake boundaries and in PVA-PEG. C-H stretching vibrations can be identified by a peak at 2876 cm-1. 1086 cm-1 peak belongs to the C-O asymmetric stretching vibrations present in the PP-rGO. A peak at 1472 cm-1 indicates C=O stretching vibrations. A sharp peak at 827 cm-1 is indicative of bonding between PVA, PEG, and rGO. In the FTIR spectra, the formation of rGO nanosheets is assumed by observing a peak at 1354 cm-1. This peak belongs to the skeleton vibrations of unoxidized graphite during the synthesis of rGO. Carbon bonding around oxygen as C-O-C is observed via peak present at 957 cm-1. These several peaks observed in the FTIR spectra indicate the successful formation of the PVA-PEG-rGO composite.
3.3. XRD Analysis of rGO and PP-rGO Samples
The method of X-ray diffraction was used to study the crystal structure and composition of the synthesized samples. Figure 3b shows the XRD pattern of rGO and all PP-rGO samples. The broad peak around 25.0 in the rGO diffraction pattern belongs to the sample's completely reduced graphene oxide functional groups. This peak also indicates the interlayer distance of 0.339 nm. The synthesized material has a different lattice structure than graphite and graphene oxide. It possibly contains only a few layers of rGO. The XRD pattern of PP-rGO samples shows the same peak present in all the plots. This peak is slightly shifted to 27.0 in the XRD pattern of composite samples. The pattern also shows two distinct peaks at 19.5 and 23.7 These peaks belong to PVA and PEG, respectively. The incorporation of all the peaks in the XRD pattern of the PP-rGO composite sample shows the successful formation of the PVA-PEG-rGO composite. In the XRD pattern of PP-rGO, as we go from 1% PP-rGO to 5% PP-rGO, the intensity of the peaks at 19.5 and 23.7 is somewhat similar to each other.
3.4. Gas Sensing Properties of PP-rGO Samples
3.4.1. Sensitivity and Selectivity of PP-rGO Sensors
Chemoresistive gas sensors exhibit a change in resistance upon exposure to a particular gas. The magnitude of this alteration in gas concentration determines the sensitivity of the gas sensor to a given gas [24]. The gas-sensing responses of the rGO and PP-rGO composite films were recorded at room temperature for TVB-N, ammonia, DMA, and TMA. rGO films show a sensitivity of 96, 119, 97, and 68 for TVB-N, ammonia, DMA, and TMA, respectively (Figure 4a). The sensitivity of the rGO film decreases with the increasing molecular weight of the analyte gas. This indicates the gas adsorption and molecule trapping activity of rGO is dependent on the molecular weight of the analyte gas molecules. Figure 4a shows the gas sensing results of PP-rGO samples 1% PP-rGO, 2% PP-rGO, 3% PP-rGO, 4% PP-rGO, and 5% PP-rGO for 100 ppm of each TVB-N, ammonia, DMA, and TMA at room temperature. As seen in the plot, 1% PEG-rGO shows the highest sensitivity for all the VOCs under study. The sensitivity value of 1% PEG-rGO is somewhat similar for TVB-N, ammonia, DMA, and TMA. This particular phenomenon translates into trustworthy detection of TVB-N compared to sensors that show different sensitivity values for ammonia, DMA, and TMA. As we increase the polymer amount in the PP-rGO sensor from 1% to 5%, the sensitivity is seen to be gradually decreasing with an increasing PVA-PEG amount. The possible reasons for this phenomenon are discussed in Section 3.6. Table 1 shows the sensitivity values of all the samples for TVB-N, ammonia, DMA, and TMA
Selectivity is the measure of how effectively a particular gas sensor can differentiate between two analyte gases in terms of detected sensitivity. Selectivity is calculated as the ratio of sensitivities in the presence of two gases [25]. Figure 4b shows the selectivity for TVB-N sensing against ammonia, DMA, and TMA for all the PP-rGO samples. For 1% PP-rGO, the selectivity of TVB-N sensing is ~1 against ammonia, DMA, and TMA. This indicates the 1% PP-rGO sensor does not differentiate between the TVB-N, ammonia, DMA, and TMA. This is an important property for this sensor to be used as a fish freshness indicator using TVB-N sensing. If the sensor shows high selectivity for one of these amines over others, it cannot provide a real picture of the amine levels in the chamber. ~1 selectivity indicates almost equal sensitivity, and the sensor treats ammonia, DMA, and TMA similarly. With this sensor, the sensitivity levels of TVB-N would reflect the true average of the amines in the chamber. As we go from 1% PP-rGO to 5% PP-rGO the selectivity values move away from 1. For 5% PP-rGO, the TVB-N sensing shows a sensitivity of 0.7 for ammonia, 1.0 for DMA, and 2.0 for TMA. This indicates the 5% PP-rGO sensor can very well differentiate between ammonia, DMA, and TMA. This particular sensor could be used in applications where it is important to detect individual amines instead of average TVB-N levels.
3.4.2. Discrimination Test and Calibration Curve for 1% PP-rGO Sensor
To conduct the discrimination test, the analyte gas was prepared by mixing 100 ppm of TVB-N with 100 ppm of other VOCs individually. This mixture was used as an analyte gas for the 1% PP-rGO sensor, and the resultant sensitivity was compared with the 100 ppm of TVB-N sensing using the same 1%PP-rGO sensor. We combined TVB-N with benzene, toluene, xylene, acetone, methanol, ethanol, and dichloromethane (DCM) individually and separately for this discrimination test. Figure 4c plots the test results. The sensitivity of 1% PP-rGO for 100 ppm of TVB-N is ~321. As we add 100 ppm of other analyte gas with TVB-N, the sensitivity of 1%PP-rGO always increases. For the TVB-N + acetone mixture, the maximum recorded sensitivity was 353. Though the sensitivity value increases after adding other VOC along with TVB-N, the maximum change in sensitivity is ~9% while the average change is ~8%. This is a relatively small change in the sensitivity value. We can say the 1% PP-rGO sensor shows stable sensitivity for TVB-N even in the presence of other VOCs.
For any gas sensor, the calibration curve is used to correlate the sensitivity of the gas sensor to the concentration of the particular gas and vice versa [26]. For the effective use of 1% PP-rGO sensor as a fish spoilage detector, we studied the sensitivity change in 1%PP-rGO for TVB-N, ammonia, DMA, and TMA from 20 ppm to 1000 ppm. The obtained results are plotted in Figure 4d. The acceptable TVB-N levels for fresh fish are < 250 ppm. TVB-N levels above this would indicate a spoiled fish product. For 20 ppm of TVB-N, the 1%PP-rGO sensor shows a sensitivity of ~65. As we increase the TVB-N concentration, the sensitivity value increases. For 200 ppm of TVB-N, the sensor shows a sensitivity of ~640, and for 1000 ppm, this sensitivity reaches ~3195. Figure 4d also shows the calibration curves for ammonia, DMA, and TMA detection using a 1% PP-rGO sensor. The sensor follows a pattern of linear increments in sensitivity with analyte gas concentration. Hence, linear regression was applied to the sensitivity values obtained at various concentrations of analyte gases. The coefficient of determination (R-squared) was found to be 0.99 for TVB-N, 0.99 for ammonia, 0.99 for DMA, and 0.99 for TMA. This implies a good linear fit of the calibration curve with the observed sensitivity values for each analyte gas.
3.4.3. Response-Recovery Time, Temperature Stability, Long-Term Stability of the Sensor and Effect of Humidity on Sensor
The response time of any gas sensor is defined as the time taken by the sensor to reach 90% of its maximum sensitivity at a specific analyte gas concentration after the gas is introduced into the chamber. Similarly, recovery time is the time taken by the sensor to reach 90% of its original resistance after the air is reintroduced into the chamber [26]. The response and recovery time of the sensor greatly determines the viability of the sensor for a specific sensing application. For the 1% PP-rGO gas sensor, the response and recovery time were recorded for various gas concentrations from 20 ppm to 1000 ppm. The obtained results are plotted in Figure 5a. For 20 ppm of TVB-N, sensor 1%PP-rGO shows a response time of 440 s and a recovery time of 70 s. As we increase the TVB-N concentration in the chamber, the response time of the 1%PP-rGO sensor decreases while the recovery time increases. For the maximum TVB-N concentration of 1000 ppm, the sensor records a response time of 310 s and a recovery time of 30 s. The response and recovery time of the 1%PP-rGO sensor follows the expected trend for a typical chemo resistive gas sensor. PP-rGO gas sensors operate effectively at room temperature. Fish products are generally stored at a lower temperature. To use the 1%PP-rGO sensor as a fish freshness indicator, it is necessary to study its stability at lower temperatures. We systematically lowered the temperature of the 1%PP-rGO sensor from 30°C to -5°C and studied its sensing response for TVB-N, ammonia, DMA, and TMA. The obtained results are plotted in Figure 5b. As we reduce the sensor temperature from 30 °C, some fluctuations in the sensitivity values are observed. These fluctuations are small and random. The sensitivity value is neither increasing nor decreasing with the changing temperature. This indicates the gas sensing response of 1% PP-rGO for TVB-N, ammonia, DMA, and TMA is independent of the surrounding temperature. Hence, the 1% PP-rGO sensor can operate very well even at lower temperatures.
To use the TVB-N gas sensor for freshness indication in distant applications, the sensor must maintain a consistent and reliable sensing ability for an extended duration. The long-term stability of the 1% PP-rGO for TVB-N, ammonia, DMA, and TMA sensing was studied for 120 days from fabrication. The obtained results are plotted in Figure 5c. Results show the sensing ability of the 1% PP-rGO does not degrade considerably over 120 days. On day 0, the sensitivity for TVB-N was 321. After 30 days, the sensitivity for TVB-N was reduced to 309. This is a 3.7% reduction in sensitivity over 30 days. After 60 days, sensitivity for TVB-N was reduced to 299 (6.8% reduction). Finally, after 120 days, the 1% PP-rGO gas sensor showed a sensitivity of 285 for TVB-N sensing. This is an 11.2% reduction in sensitivity for TVB-N over 3 months. Similarly, 1% PP-rGO sensor showed reductions of 10.4%, 8.6%, and 9.8% for ammonia, DMA, and TMA, respectively. The sensor experiences a gradual decline in its sensing capability of approximately 3-4% per month when exposed to ambient air. The decrease in sensitivity may be attributed to the interaction of other ambient gases with the 1%PP-rGO gas sensor film, leading to persistent and irreversible alterations in the film's chemistry.
To use the TVB-N gas sensor for freshness indication in distant applications, the sensor must maintain a consistent and reliable sensing ability for an extended duration. The long-term stability of the 1% PP-rGO for TVB-N, ammonia, DMA, and TMA sensing was
To use the TVB-N gas sensor for freshness indication in distant applications, the sensor must maintain a consistent and reliable sensing ability for an extended duration. The long-term stability of the 1% PP-rGO for TVB-N, ammonia, DMA, and TMA sensing was studied for 120 days from fabrication. The obtained results are plotted in Figure 5c. Results show the sensing ability of the 1% PP-rGO does not degrade considerably over 120 days. On day 0, the sensitivity for TVB-N was 321. After 30 days, the sensitivity for TVB-N was reduced to 309. This is a 3.7% reduction in sensitivity over 30 days. After 60 days, sensitivity for TVB-N was reduced to 299 (6.8% reduction). Finally, after 120 days, the 1% PP-rGO gas sensor showed a sensitivity of 285 for TVB-N sensing. This is an 11.2% reduction in sensitivity for TVB-N over 3 months. Similarly, 1% PP-rGO sensor showed reductions of 10.4%, 8.6%, and 9.8% for ammonia, DMA, and TMA, respectively. The sensor experiences a gradual decline in its sensing capability of approximately 3-4% per month when exposed to ambient air. The decrease in sensitivity may be attributed to the interaction of other ambient gases with the 1%PP-rGO gas sensor film, leading to persistent and irreversible alterations in the film's chemistry.
For a room temperature gas sensor, the effect of humidity could be important on the proper functioning of the sensor. Extended exposure to high humidity could permanently affect the sensing ability of the gas sensor. We have developed this PP-rGO sensor for seafood freshness monitoring in the cold storage container. These containers generally have temperature and humidity control. Yet, we have studied the effect of humidity on PP-rGO sensor to understand its operations in ambient conditions. 1% PP-rGO sensor was used for this humidity study. Figure 5d shows the changes in sensitivity with increasing relative humidity levels. The sensor shows minor changes in the sensitivity up to 50% relative humidity levels. Above 50% relative humidity levels, the sensitivity of the sensor starts decreasing. At 70% of relative humidity level, the sensitivity of the sensor is reduced by average ~7%. At 90% relative humidity the sensitivity shows almost ~11% reduction in the sensitivity. This is significant drop in sensitivity. It would be better to maintain the relative humidity levels below 50% for appropriate functioning of the sensor. This loss of sensitivity due to increased relative humidity is not permanent for small durations of exposure to high humidity. The sensor regains its original sensitivity at lower relative humidity levels after some time.
3.4.4. Amine Sensing Mechanism for PP-rGO Sensor
Various gas sensing mechanisms are proposed for polymer-rGO composite materials. In the case of a PP-rGO composite amine sensor, the electronegativity of the rGO is an important factor. The amorphous nature of both rGO and PVA-PEG makes them effective at sensing amines. The boundaries of these amorphous materials maximize the surface area available for the gaseous adsorption of amines [3,26]. High electronegativity of oxygen atoms in rGO is extremely effective in interacting with amine functional groups (Figure 6a). This physisorption of gas leads to polymer swelling and changes the resistance of the film in the presence of analyte gas (Figure 6b) [27,28]. The role of the PVA-PEG in these samples is helping increase the selectivity of the rGO. PVA - PEG increases the adsorption of the analyte gas compared to rGO. At the same time, adsorption using PVA-PEG is highly dependent on the molecular weight and relative polarity of the analyte gas molecules. As we go on increasing PVA-PEG concentration in the composite sample from 1% to 5%, we increase the contribution of PVA-PEG to the total number of adsorbed gas molecules. For PVA-PEG, the amount of adsorbed gas molecules decreases with increasing molecular weights. Hence as we move from 1% to 5% of PVA-PEG in composite, the difference in the sensitivity of ammonia, DMA, and TMA increases.
Various gas sensing mechanisms are proposed for polymer-rGO composite materials. In the case of a PP-rGO composite amine sensor, the electronegativity of the rGO is an important factor. The amorphous nature of both rGO and PVA-PEG makes them effective at sensing amines. The boundaries of these amorphous materials maximize the surface area available for the gaseous adsorption of amines [3,26]. High electronegativity of oxygen atoms in rGO is extremely effective in interacting with amine functional groups (Figure 6a). This physisorption of gas leads to polymer swelling and changes the resistance of the film in the presence of analyte gas (Figure 6b) [27,28]. The role of the PVA-PEG in these samples is helping increase the selectivity of the rGO. PVA - PEG increases the adsorption of the analyte gas compared to rGO. At the same time, adsorption using PVA-PEG is highly dependent on the molecular weight and relative polarity of the analyte gas molecules. As we go on increasing PVA-PEG concentration in the composite sample from 1% to 5%, we increase the contribution of PVA-PEG to the total number of adsorbed gas molecules. For PVA-PEG, the amount of adsorbed gas molecules decreases with increasing molecular weights. Hence as we move from 1% to 5% of PVA-PEG in composite, the difference in the sensitivity of ammonia, DMA, and TMA increases.
4. Conclusions
The ultrasonic spray deposition process was effectively used to construct a PVA-PEG-rGO composite gas sensor. Hummer's method was modified to synthesize rGO. XRD, FTIR, and SEM were used to analyze the synthesized materials to understand their structural, chemical, and morphological properties. The characterization revealed the successful formation of the PVA-PEG-rGO composite gas sensor. The morphological analysis showed properties suitable for gas sensor applications. The PP-rGO composite also exhibited enhanced sensitivity compared to sensors made with only rGO. The studied gases of ammonia, DMA, TMA, and TVB-N show similar sensitivity using a 1% PP-rGO sensor. With increasing PVA-PEG concentrations in the PP-rGO composite, the sensitivity of the gas sensor decreases. On the other hand, the selectivity of the sensor increases with increasing PVA-PEG concentrations in the PP-rGO composite. The 1% PP-rGO sensor is the best suited for applications as a fish freshness indicator. This sensor also shows good temperature stability for a temperature range of -10 to 35 and long-term stability up to 120 days from first use. This sensor is perfect to be used as a fish freshness indicator based on its good sensitivity, selectivity, and high stability.
Supplementary Materials
The following supporting information can be downloaded at the website of this paper posted on Preprints.org.
Author Contributions
Conceptualization, Baliram Nadekar, Ahmad Umar and Abu ul Hassan S. Rana; Data curation, Sadaf Jamal Gilani; Formal analysis, Baliram Nadekar, Yogesh B. Khollam, Ahmad Umar, Pravin S. More, Abu ul Hassan S. Rana and Marimuthu Palaniswami; Funding acquisition, Sadaf Jamal Gilani and Pravin S. More; Investigation, Yogesh B. Khollam, Pravin S. More and Abu ul Hassan S. Rana; Methodology, Baliram Nadekar and Sadaf Jamal Gilani; Project administration, Sadaf Jamal Gilani, and Pravin S. More; Resources, Yogesh B. Khollam, Pravin S. More, Abu ul Hassan S. Rana and Marimuthu Palaniswami; Software, Ahmad Umar; Supervision, Pravin S. More, Abu ul Hassan S. Rana and Marimuthu Palaniswami; Validation, Ahmad Umar, Pravin S. More and Marimuthu Palaniswami; Visualization, Sadaf Jamal Gilani; Writing – original draft, Baliram Nadekar; Writing – review & editing, Pravin S. More, Sadaf Jamal Gilani, Yogesh B. Khollam, Ahmad Umar, Marimuthu Palaniswami and Abu ul Hassan S. Rana
Acknowledgments
The authors would like to thank Rajiv Gandhi Science and Technology Commission, Mumbai (RGSTC/File2016/DPP-146/CR-36). Maharashtra for providing financial assistance and Director, The Institute of Science, Dr. Homi Bhabha State University, Mumbai, for providing laboratory access for carrying out experiments. The authors would also like to thank DST for providing instruments to the Institute of Science under their FIST scheme. This research project was supported by Princess Nourah bint Abdulrahman University Researchers Supporting Project number (PNURSP2025R108), Princess Nourah bint Abdulrahman University, Riyadh, Saudi Arabia. A.H.S. Rana was supported by Melbourne Research Fellowship, The University of Melbourne. This work was performed in part at the Melbourne Centre for Nanofabrication (MCN) in the Victorian Node of the Australian National Fabrication Facility (ANFF).
Conflicts of Interest
The authors declare that they have no known competing financial interests or personal relationships that could have appeared to influence the work reported in this paper.
References
- L. Franceschelli, A. Berardinelli, S. Dabbou, L. Ragni, M. Tartagni, Sensing technology for fish freshness and safety: A Review, Sensors, 21 (2021) 1373. [CrossRef]
- G. Zambotti, R. Capuano, V. Pasqualetti, M. Soprani, E. Gobbi, C. Di Natale, A. Ponzoni, Monitoring fish freshness in real time under realistic conditions through a single metal oxide gas sensor, Sensors, 22 (2022) 5888. [CrossRef]
- R.S. Andre, L.A. Mercante, M.H.M. Facure, R.C. Sanfelice, L. Fugikawa-Santos, T.M. Swager, D.S. Correa, Recent progress in amine gas sensors for food quality monitoring: novel architectures for sensing materials and systems, ACS Sensors, 7 (2022) 2104-2131. [CrossRef]
- A.E.-D.A. Bekhit, B.W.B. Holman, S.G. Giteru, D.L. Hopkins, Total volatile basic nitrogen (TVB-N) and its role in meat spoilage: A review, Trends Food Sci. Technol., 109 (2021) 280-302. [CrossRef]
- P. Castro, J.C.P. Padrón, M.J.C. Cansino, E.S. Velázquez, R.M. De Larriva, Total volatile base nitrogen and its use to assess freshness in European sea bass stored in ice, Food Control 17 (2006) 245–248. [CrossRef]
- M. Moosavi-Nasab, S. Khoshnoudi-Nia, Z. Azimifar, S. Kamyab, Evaluation of the total volatile basic nitrogen (TVB-N) content in fish fillets using hyperspectral imaging coupled with deep learning neural network and meta-analysis, Sci. Rep. 11 (2021) 5094. [CrossRef]
- L.-Y. Chang, M.-Y. Chuang, H.-W. Zan, H.-F. Meng, C.-J. Lu, P.-H. Yeh, J.-N. Chen, One-minute fish freshness evaluation by testing the volatile amine gas with an ultrasensitive porous-electrode-capped organic gas sensor system, ACS Sensors, 2 (2017) 531-539. [CrossRef]
- M.J. Allen, V.C. Tung, R.B. Kaner, Honeycomb Carbon: A review of graphene, Chem. Rev., 110 (2010) 132-145. [CrossRef]
- Pravin. S. More. Dattatray. J. Late, Shivani A. Singh, Investigation of PEG embedded WO3-graphene thin film sensor, Adv. Mater. Proc., 2 (2021) 506-509. [CrossRef]
- S. Zhang, J. Pang, Y. Li, B. Ibarlucea, Y. Liu, T. Wang, X. Liu, S. Peng, T. Gemming, Q. Cheng, H. Liu, J. Yang, G. Cuniberti, W. Zhou, M.H. Rümmeli, An effective formaldehyde gas sensor based on oxygen-rich three-dimensional graphene, Nanotechnology 33 (2022) 185702. [CrossRef]
- W. Tian, X. Liu, W. Yu, Research progress of gas sensor based on graphene and its derivatives: A review, Appl. Sci., 8 (2018) 1118. [CrossRef]
- T. Wang, D. Huang, Z. Yang, S. Xu, G. He, X. Li, N. Hu, G. Yin, D. He, L. Zhang, A Review on graphene-based gas/vapour sensors with unique properties and potential applications, Nanomicro. Lett., 8 (2016) 95-119. [CrossRef]
- H. Bai, G. Shi, Gas sensors based on conducting polymers, Sensors, 7 (2007) 267-307. [CrossRef]
- Z. Liu, T. Yang, Y. Dong, X. Wang, A room temperature VOCs gas sensor based on a layer by layer multi-walled carbon nanotubes/poly-ethylene glycol composite, Sensors, 18 (2018) 3113. [CrossRef]
- T.N. Ly, S. Park, highly sensitive ammonia sensor for diagnostic purpose using reduced graphene oxide and conductive polymer, Sci. Rep., 8 (2018) 18030. [CrossRef]
- G. Habibi Jetani, M.B. Rahmani, Near-room-temperature operating ammonia sensors fabricated using hydrothermally in situ synthesized WS2/rGO nanocomposites, The European Physical J. Plus, 137 (2022) 901. [CrossRef]
- R. Jha, A. Nanda, N. Bhat, Ammonia sensing performance of RGO-based chemiresistive gas sensor decorated with exfoliated MoSe2 Nanosheets, IEEE Sensors, J21 (2021) 10211-10218. [CrossRef]
- A. Umar, R. Kumar, P.S. More, A.A. Ibrahim, H. Algadi, M.A. Alhamami, S. Baskoutas, S. Akbar, Polyethylene glycol embedded reduced graphene oxide supramolecular assemblies for enhanced room-temperature gas sensors, Environ. Res., 236 (2023) 116793. [CrossRef]
- L.Cuéllar-Herrera, E.Miriam Arce-Estrada, D.Esperanza Pacheco-Catalán, L.Vivasc, José Ortiz-Landeros, C. Jiménez-Lugos, A. Romero-Serrano, International Journal of Electrochemical Science, 19 (2024) 100737. [CrossRef]
- G. M. Rajguru, R. K. Mishra, P. B. Kharat P. P. Khirade, Optical Materials, 154 (2024) 115720. [CrossRef]
- A.K. Geim, K.S. Novoselov, The rise of graphene, Nat. Mater., 6 (2007) 183-191. [CrossRef]
- B. Y. Gul, E. Pekgenc, V. Vatanpour, I. Koyuncu, Carbohydrate Polymers, 321 (2023) 121296. [CrossRef]
- R. Zhang, B. Wang, X. Wang, K. Zeng, C. Guo, Colloids and Surfaces A: Physicochemical and Engineering Aspects, 702 (2024) 135037. [CrossRef]
- A. H. Anwer, M. Saadaoui, A. T. Mohamed, N. Ahmad, A. Benamor, Chemical Engineering Journal, 502 (2024) 157899. [CrossRef]
- J. Li , H. Zhao , Y. Wang, Y Zhou, Sens. Diagn, 3 (2024) 336-353. [CrossRef]
- A. Turlybekuly, Y. Shynybekov, B. Soltabayev, G. Yergaliuly, A. Mentbayeva, ACS Sensors, 9 (2024) 6358–6371. [CrossRef]
- G. Jasinski, Influence of operation temperature instability on gas sensor performance, in: 2017 21st European Microelectronics and Packaging Conference (EMPC) & Exhibition, IEEE, 2017: pp. 1–4. [CrossRef]
- A.C. Romain, J. Nicolas, Long term stability of metal oxide-based gas sensors for e-nose environmental applications: An overview, Sensors & Actuators B Chem., 146 (2010) 502-506. [CrossRef]
Figure 1.
Scheme of developing PP-rGO gas sensor from deposition to results.
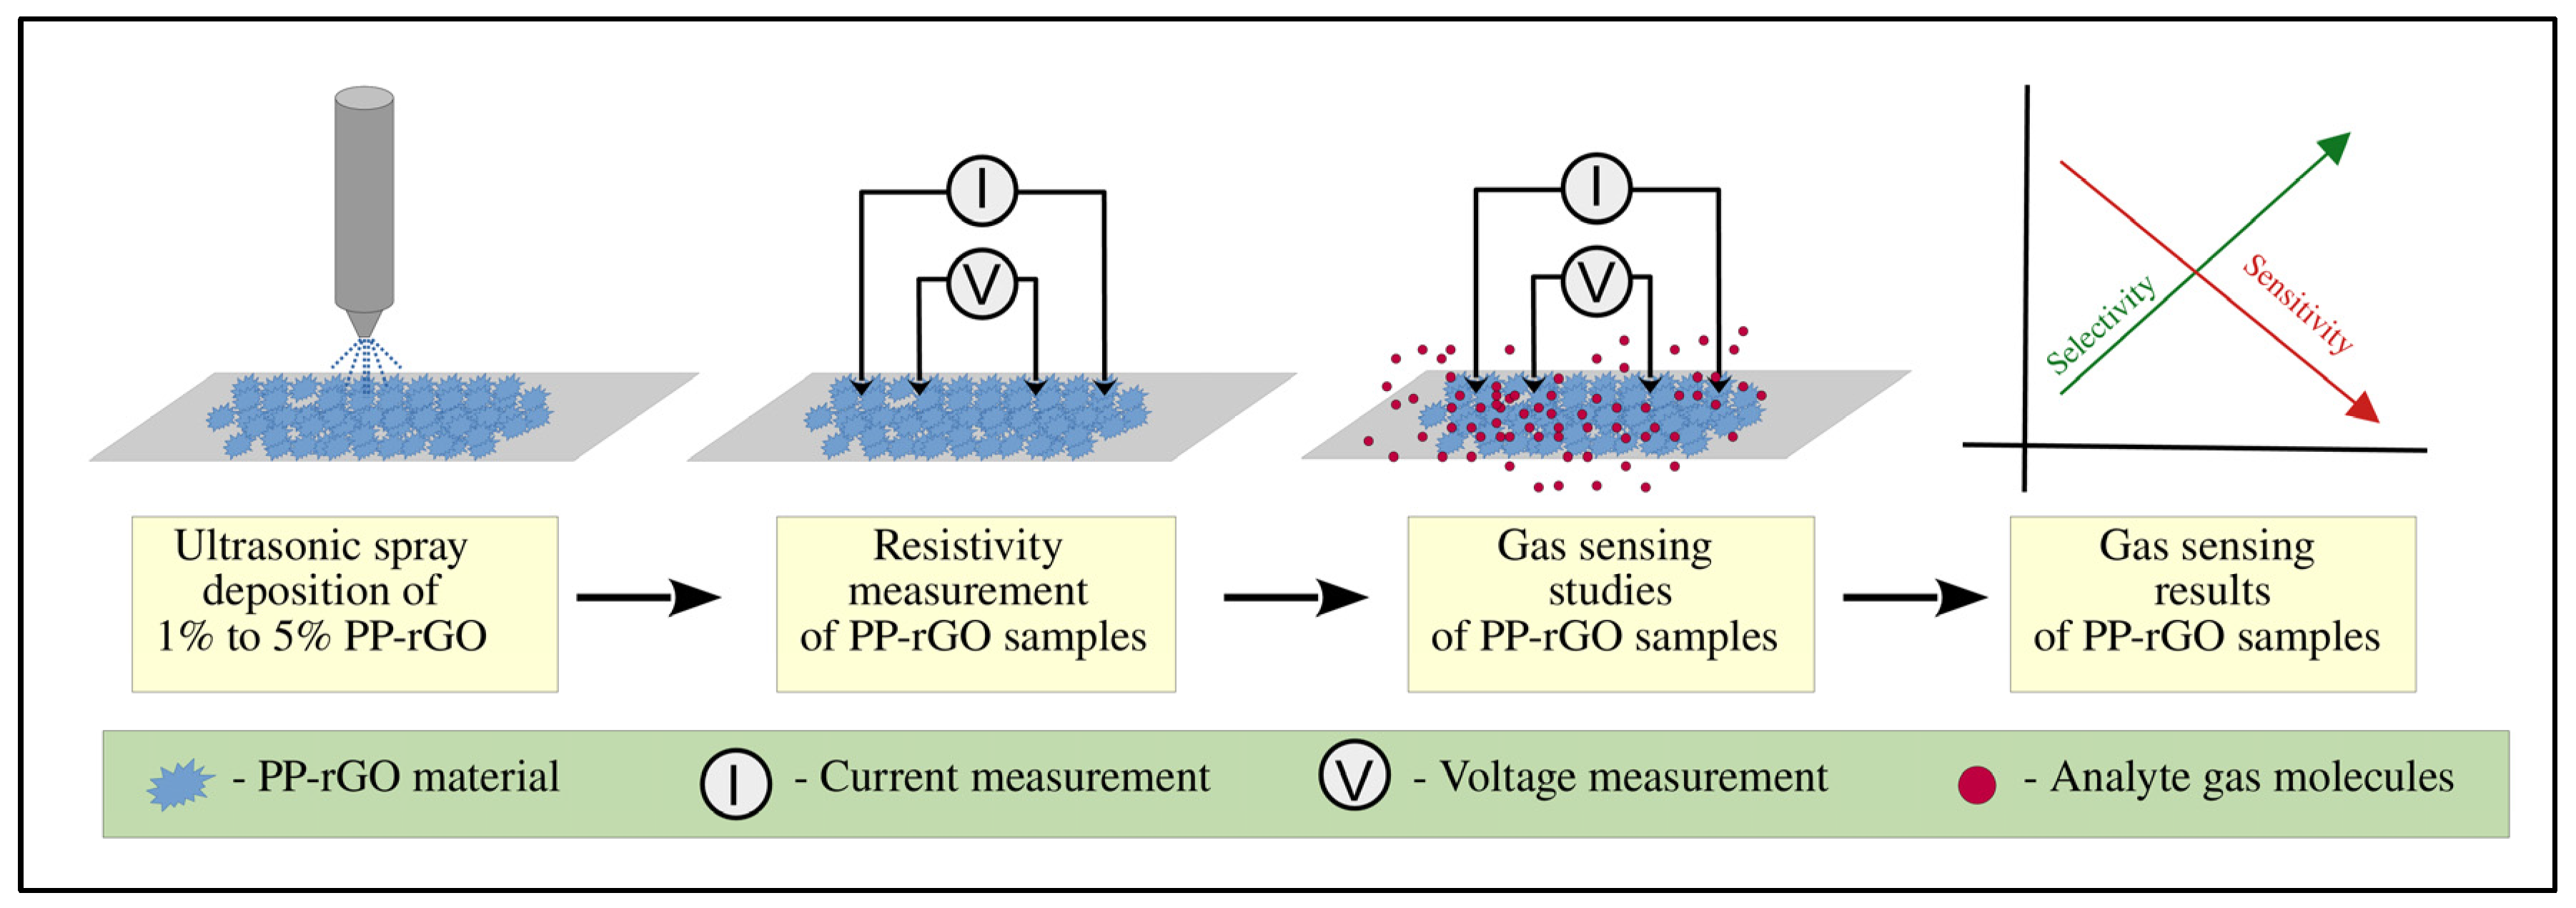
Figure 2.
Scanning electron microscopy images of (a) rGO, (b) 1% PP-rGO, (c) 2% PP-rGO, (d) 3% PP-rGO, (e) 4% PP-rGO and (f) 5% PP-rGO.
Figure 2.
Scanning electron microscopy images of (a) rGO, (b) 1% PP-rGO, (c) 2% PP-rGO, (d) 3% PP-rGO, (e) 4% PP-rGO and (f) 5% PP-rGO.
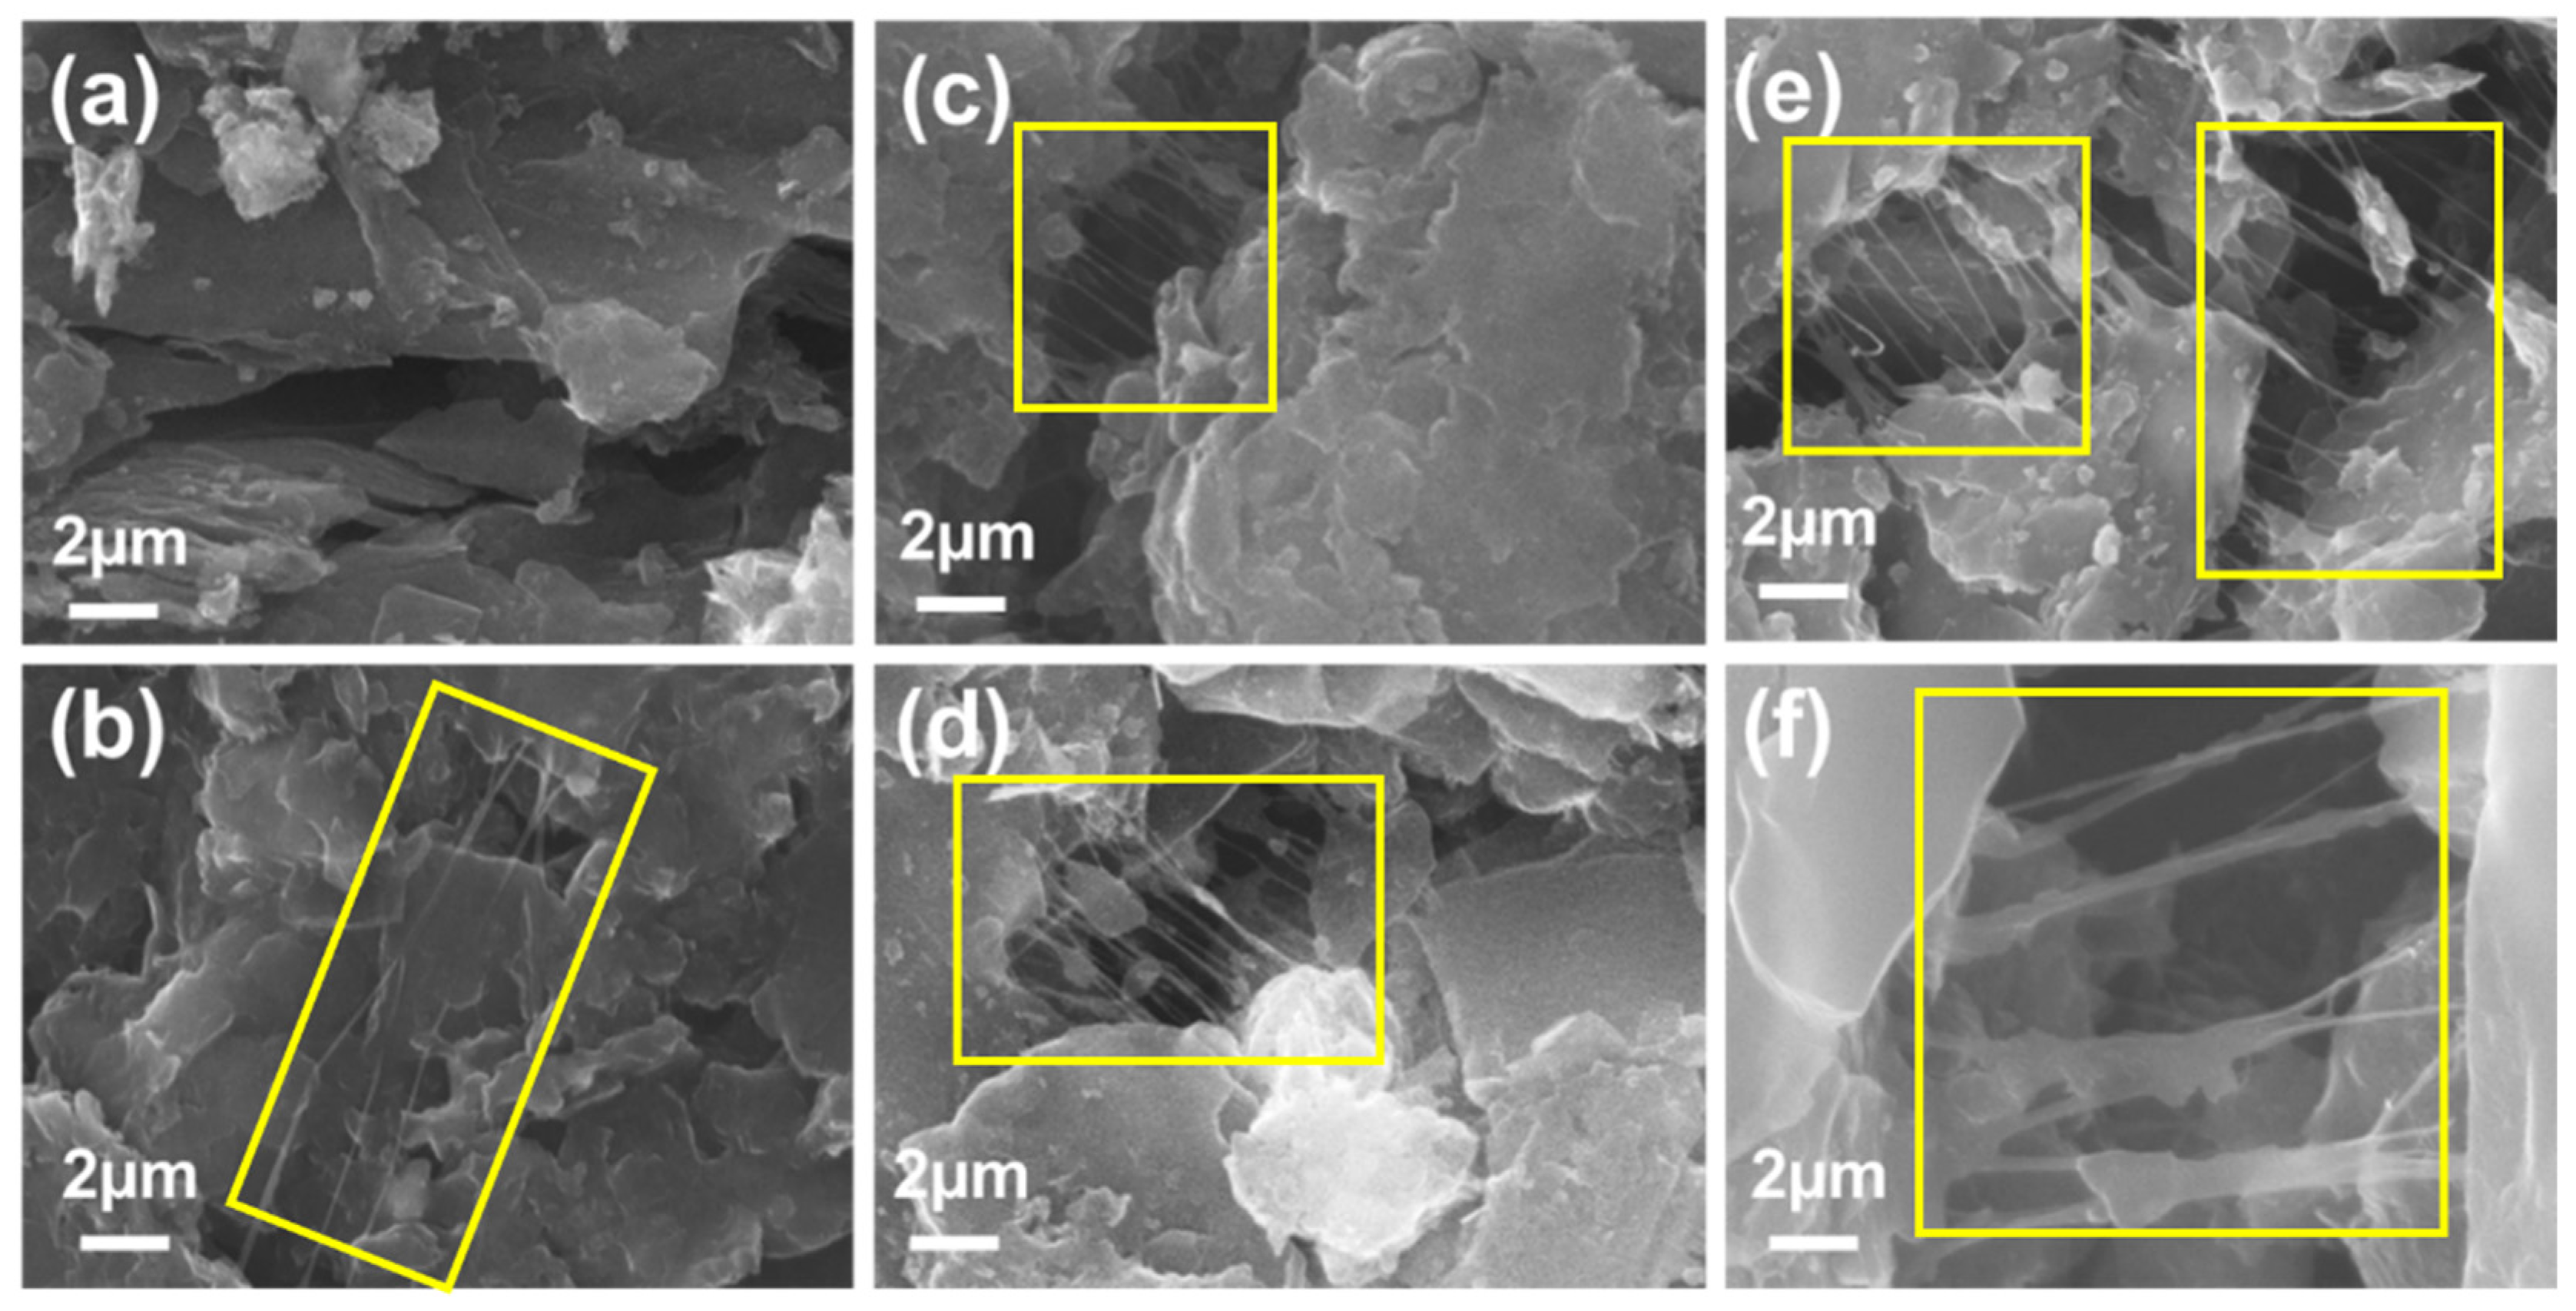
Figure 3.
(a) FTIR spectra of rGO and all PP-rGO samples (b) XRD patterns of rGO all PP-rGO samples.
Figure 3.
(a) FTIR spectra of rGO and all PP-rGO samples (b) XRD patterns of rGO all PP-rGO samples.
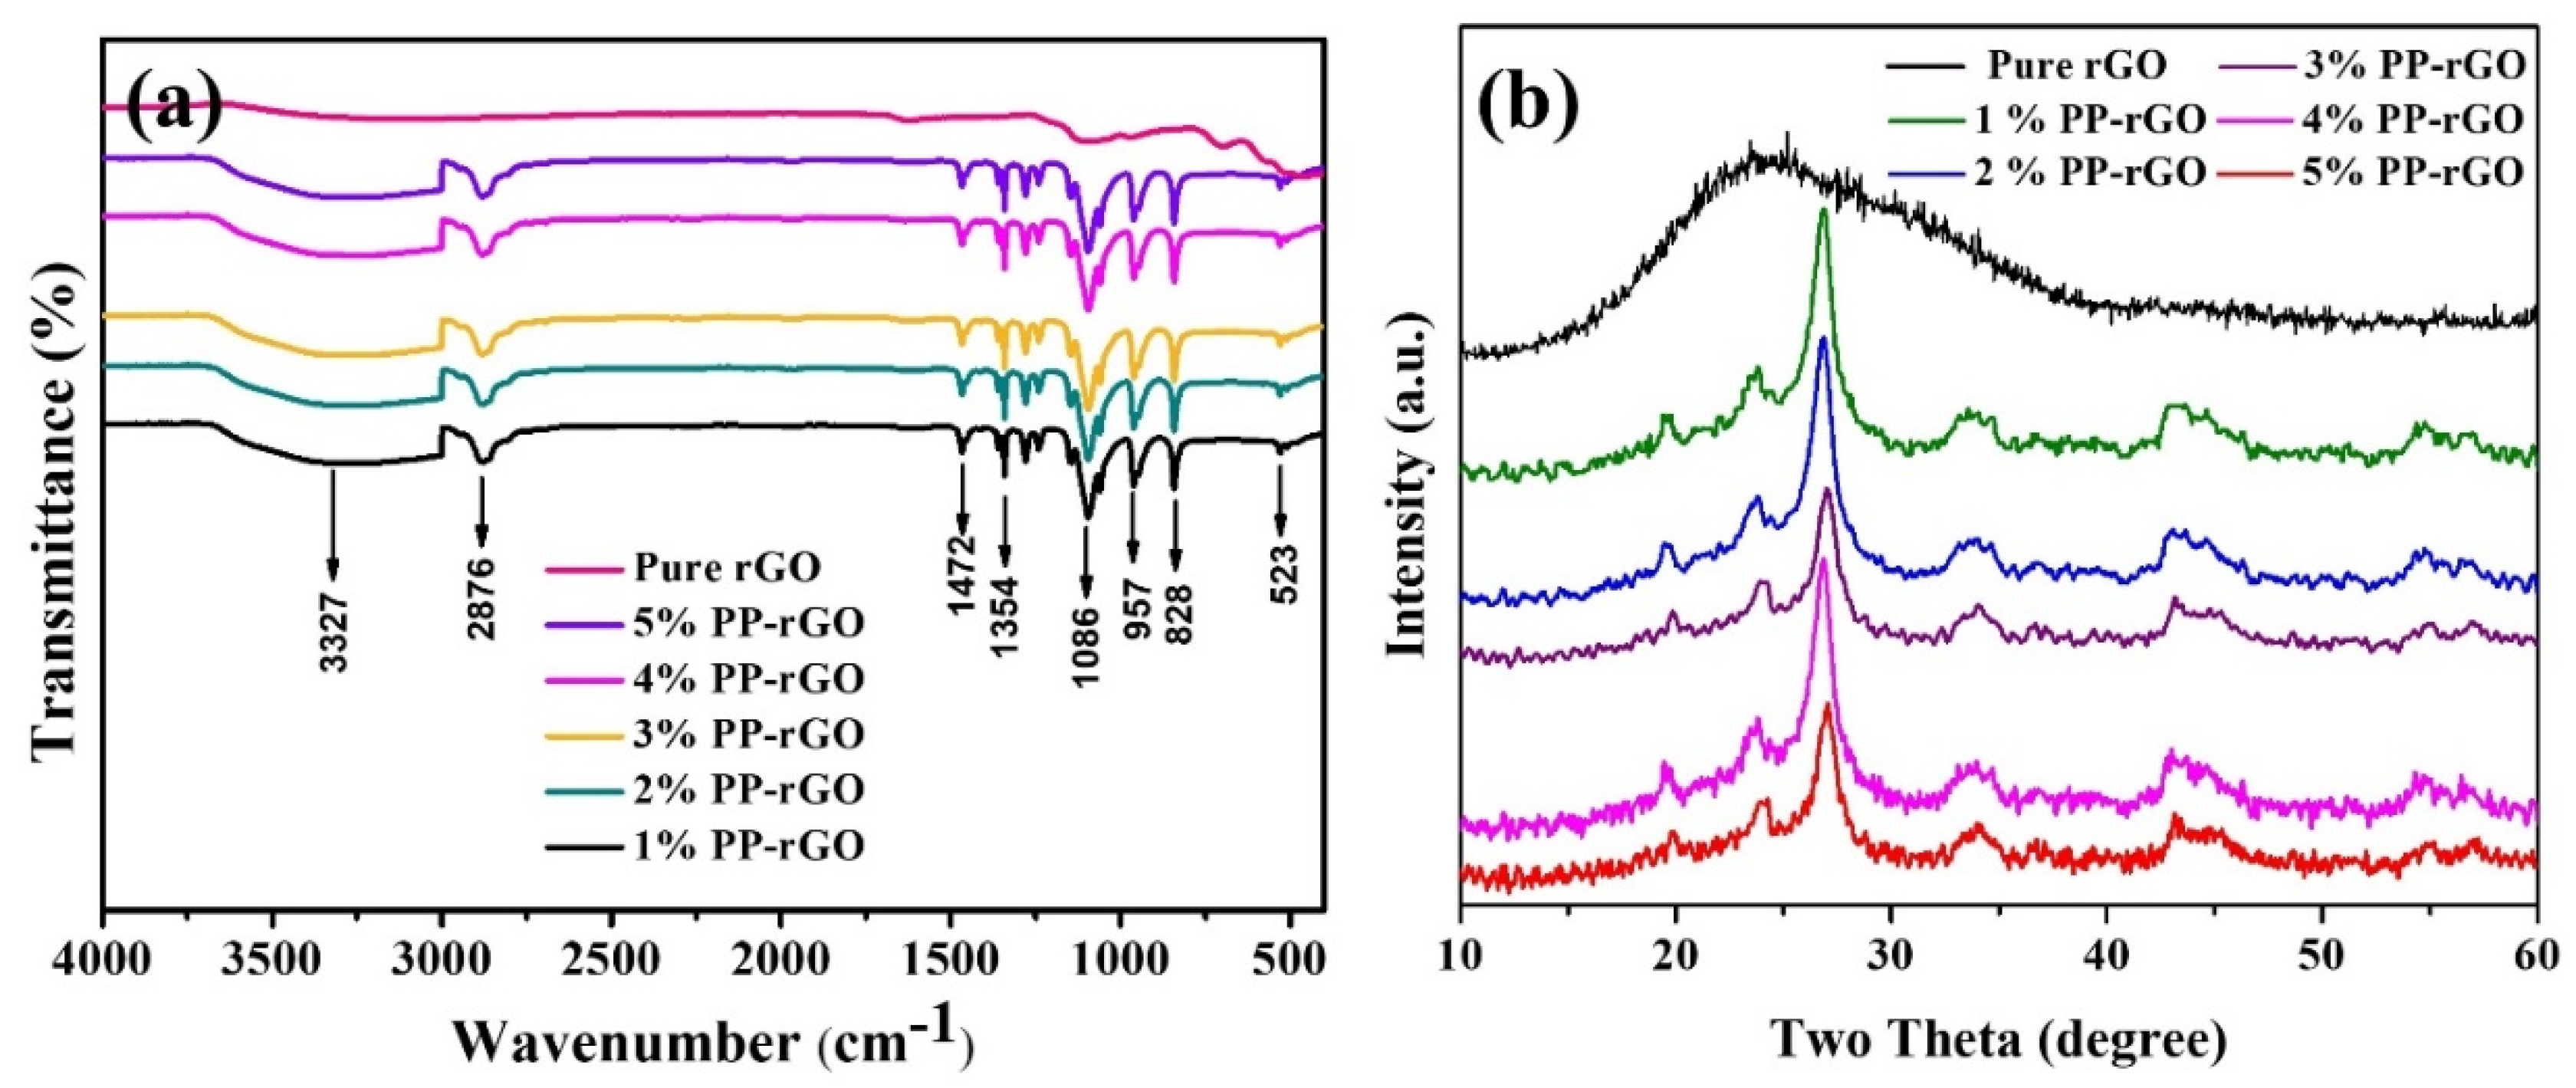
Figure 4.
(a) sensitivity of rGO and various PP-rGO sensors for TVB-N, ammonia, DMA and TMA, (b) selectivity of 1%PP-rGO for TVB-N against amines, (c) discrimination test of 1% PP-rGO for TVB-N with common VOCs and (d) calibration curve of 1% PP-rGO sensor for TVB-N, ammonia, DMA and TMA sensing.
Figure 4.
(a) sensitivity of rGO and various PP-rGO sensors for TVB-N, ammonia, DMA and TMA, (b) selectivity of 1%PP-rGO for TVB-N against amines, (c) discrimination test of 1% PP-rGO for TVB-N with common VOCs and (d) calibration curve of 1% PP-rGO sensor for TVB-N, ammonia, DMA and TMA sensing.
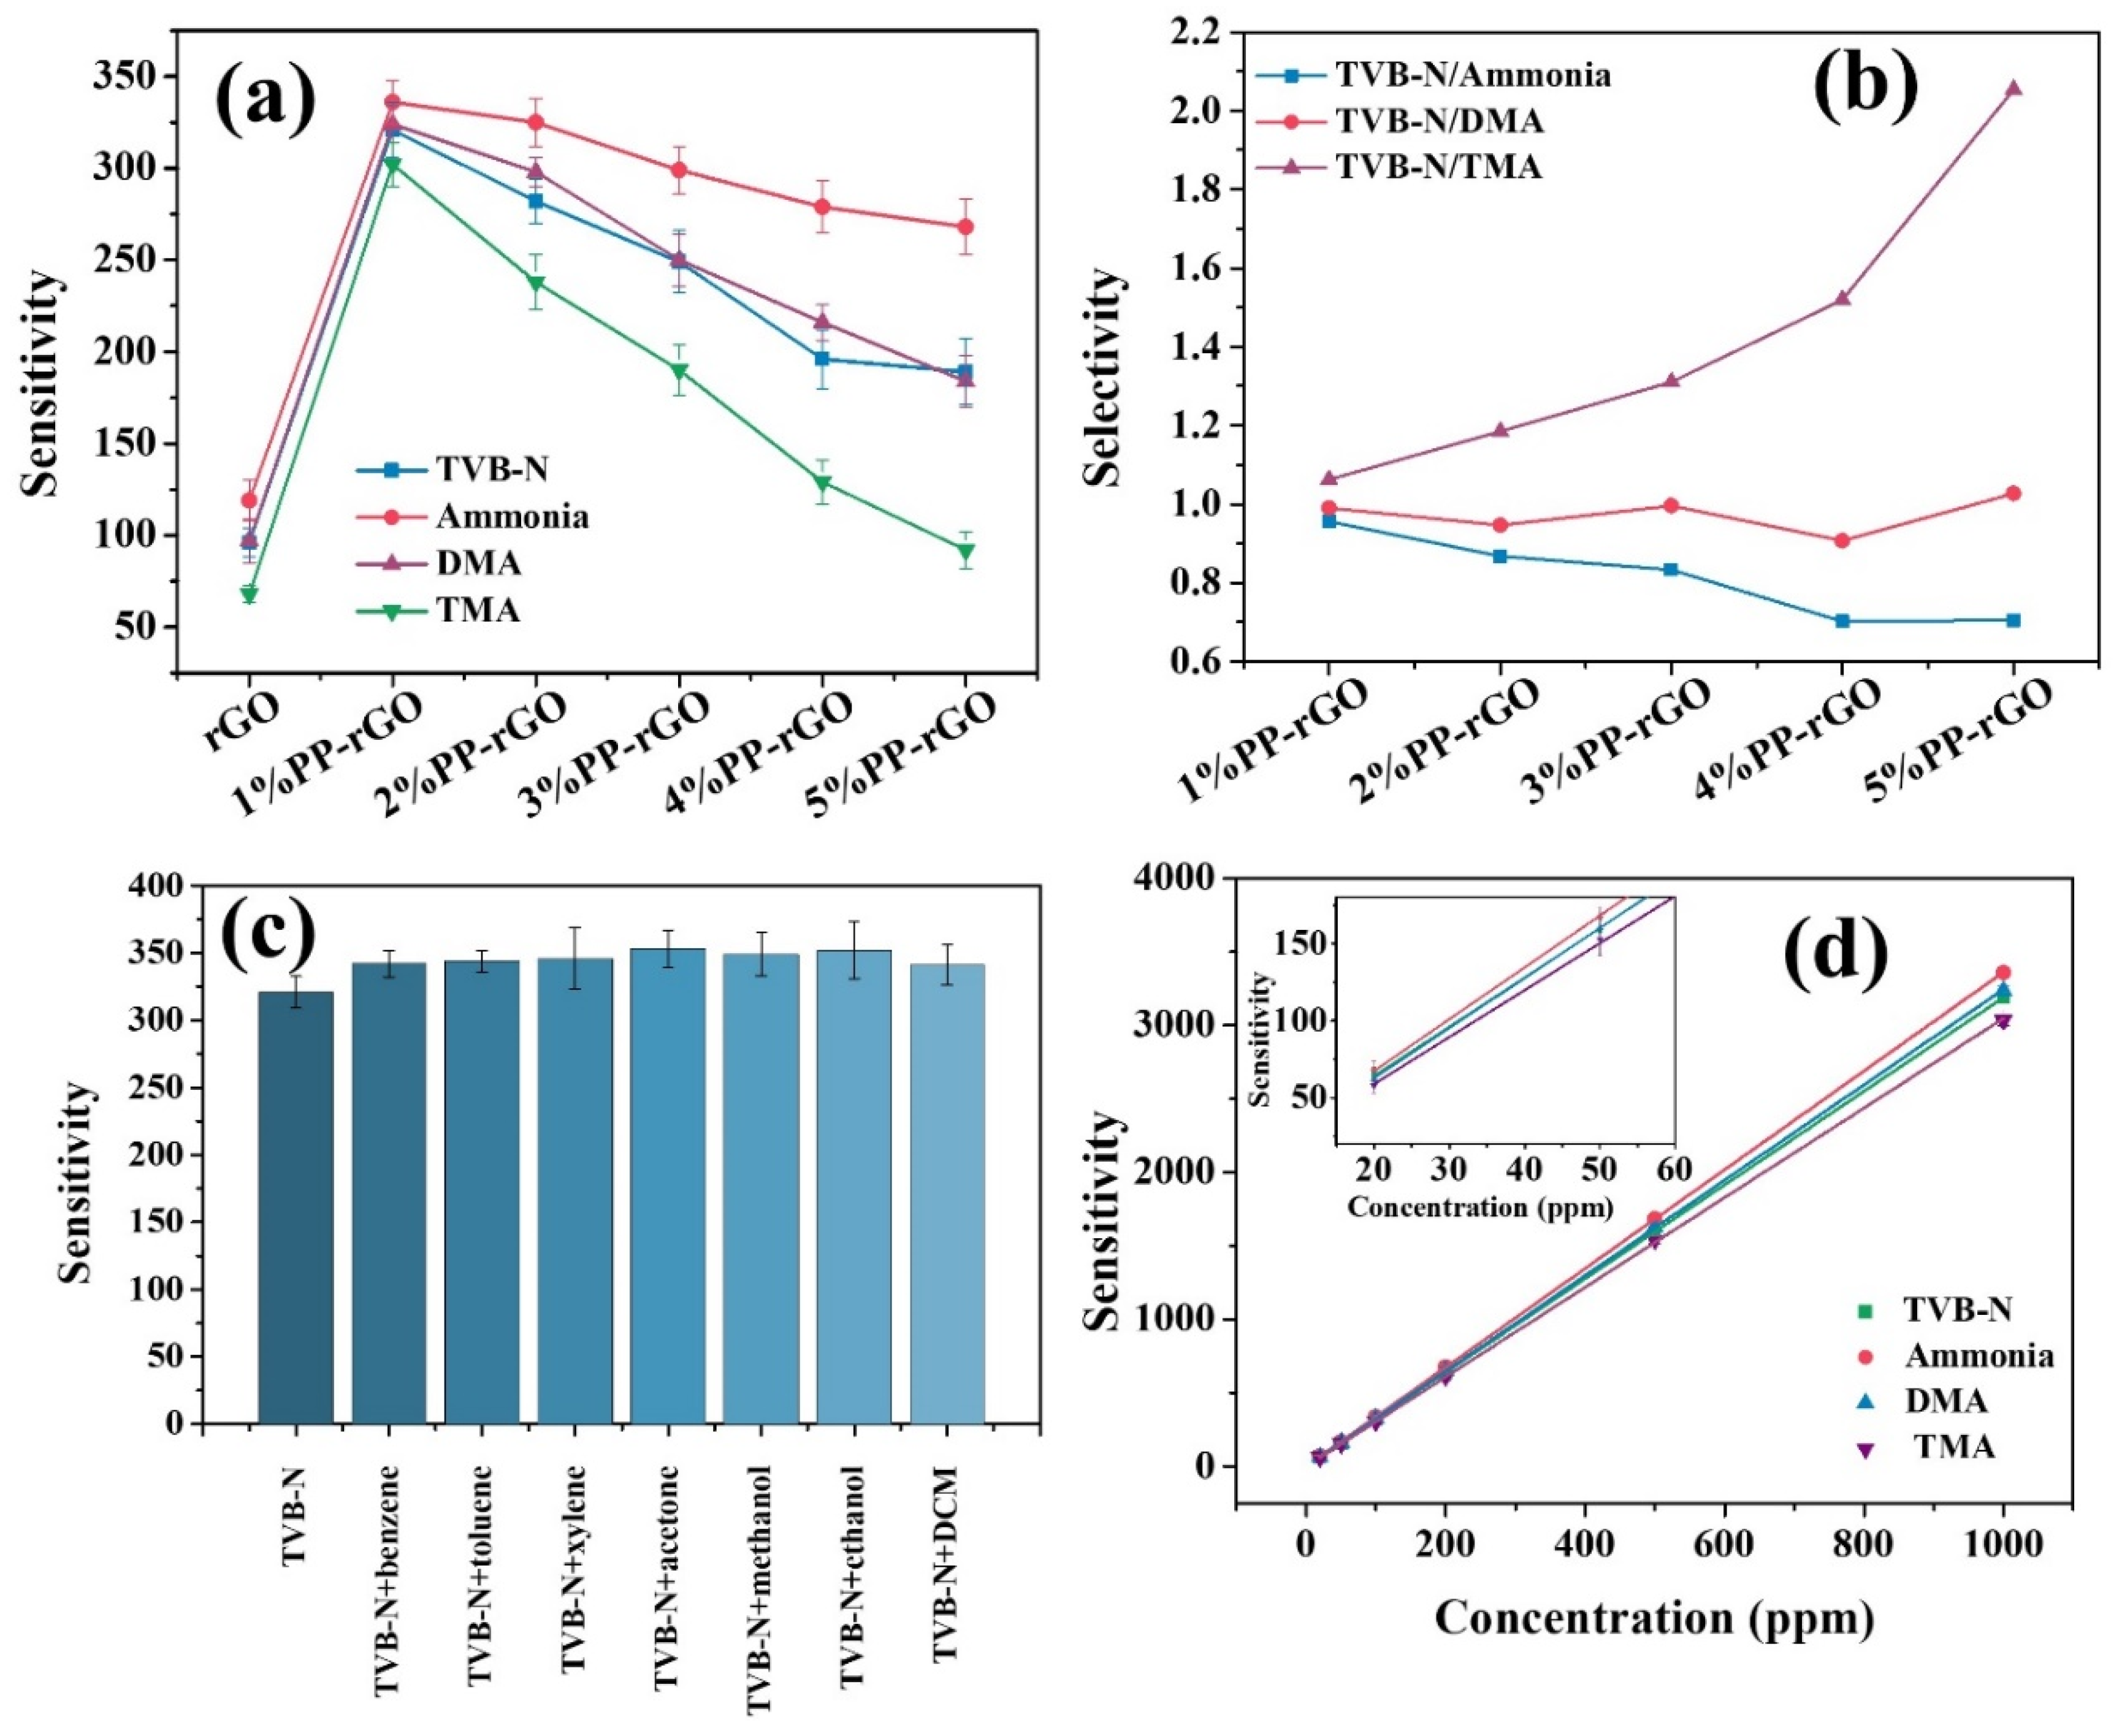
Figure 5.
(a) Response-recovery time of 1% PP-rGO sensor for TVB-N sensing at various concentrations (b) Temperature stability of 1% PP-rGO sensor at lower temperatures and (c) long term stability of 1% PP-rGO gas sensor. (d) Effect of Humidity on 1% PP-rGO gas sensor for different gases.
Figure 5.
(a) Response-recovery time of 1% PP-rGO sensor for TVB-N sensing at various concentrations (b) Temperature stability of 1% PP-rGO sensor at lower temperatures and (c) long term stability of 1% PP-rGO gas sensor. (d) Effect of Humidity on 1% PP-rGO gas sensor for different gases.
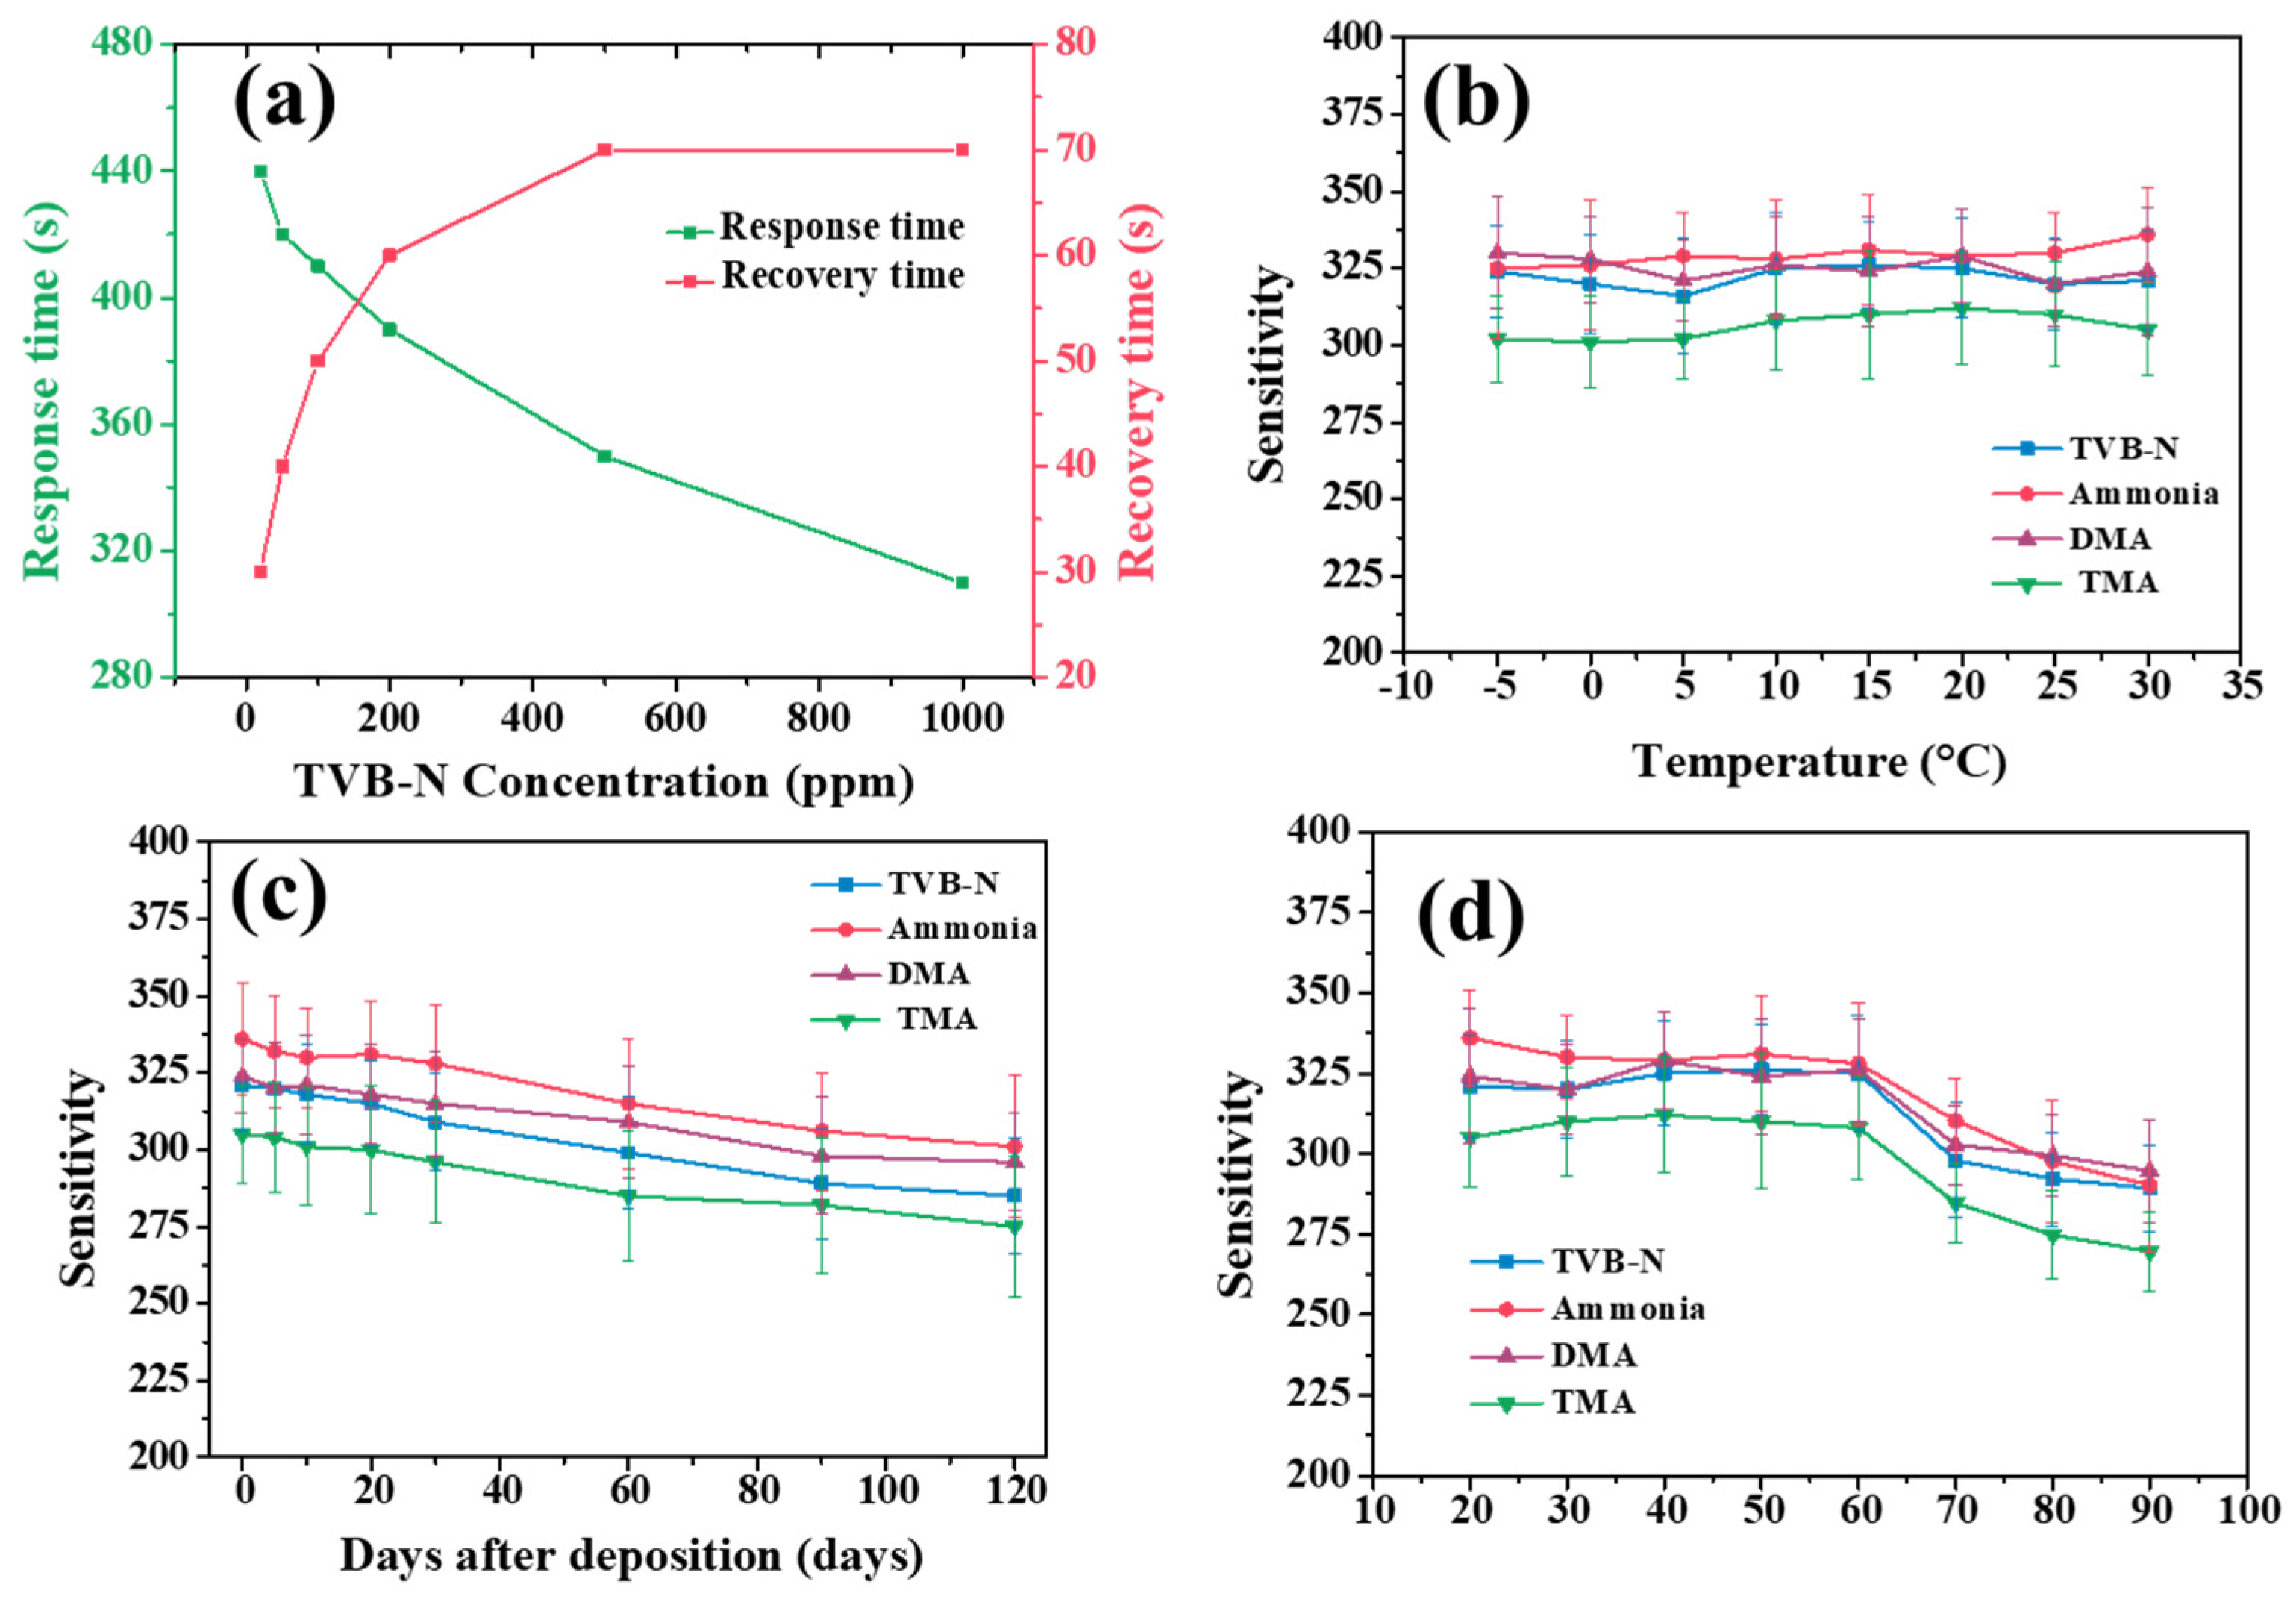
Figure 6.
(a) gas sensing mechanism of rGO for ammonia/amines (b) polymer swelling of PVA-PEG after adsorption of analyte gas molecules.
Figure 6.
(a) gas sensing mechanism of rGO for ammonia/amines (b) polymer swelling of PVA-PEG after adsorption of analyte gas molecules.
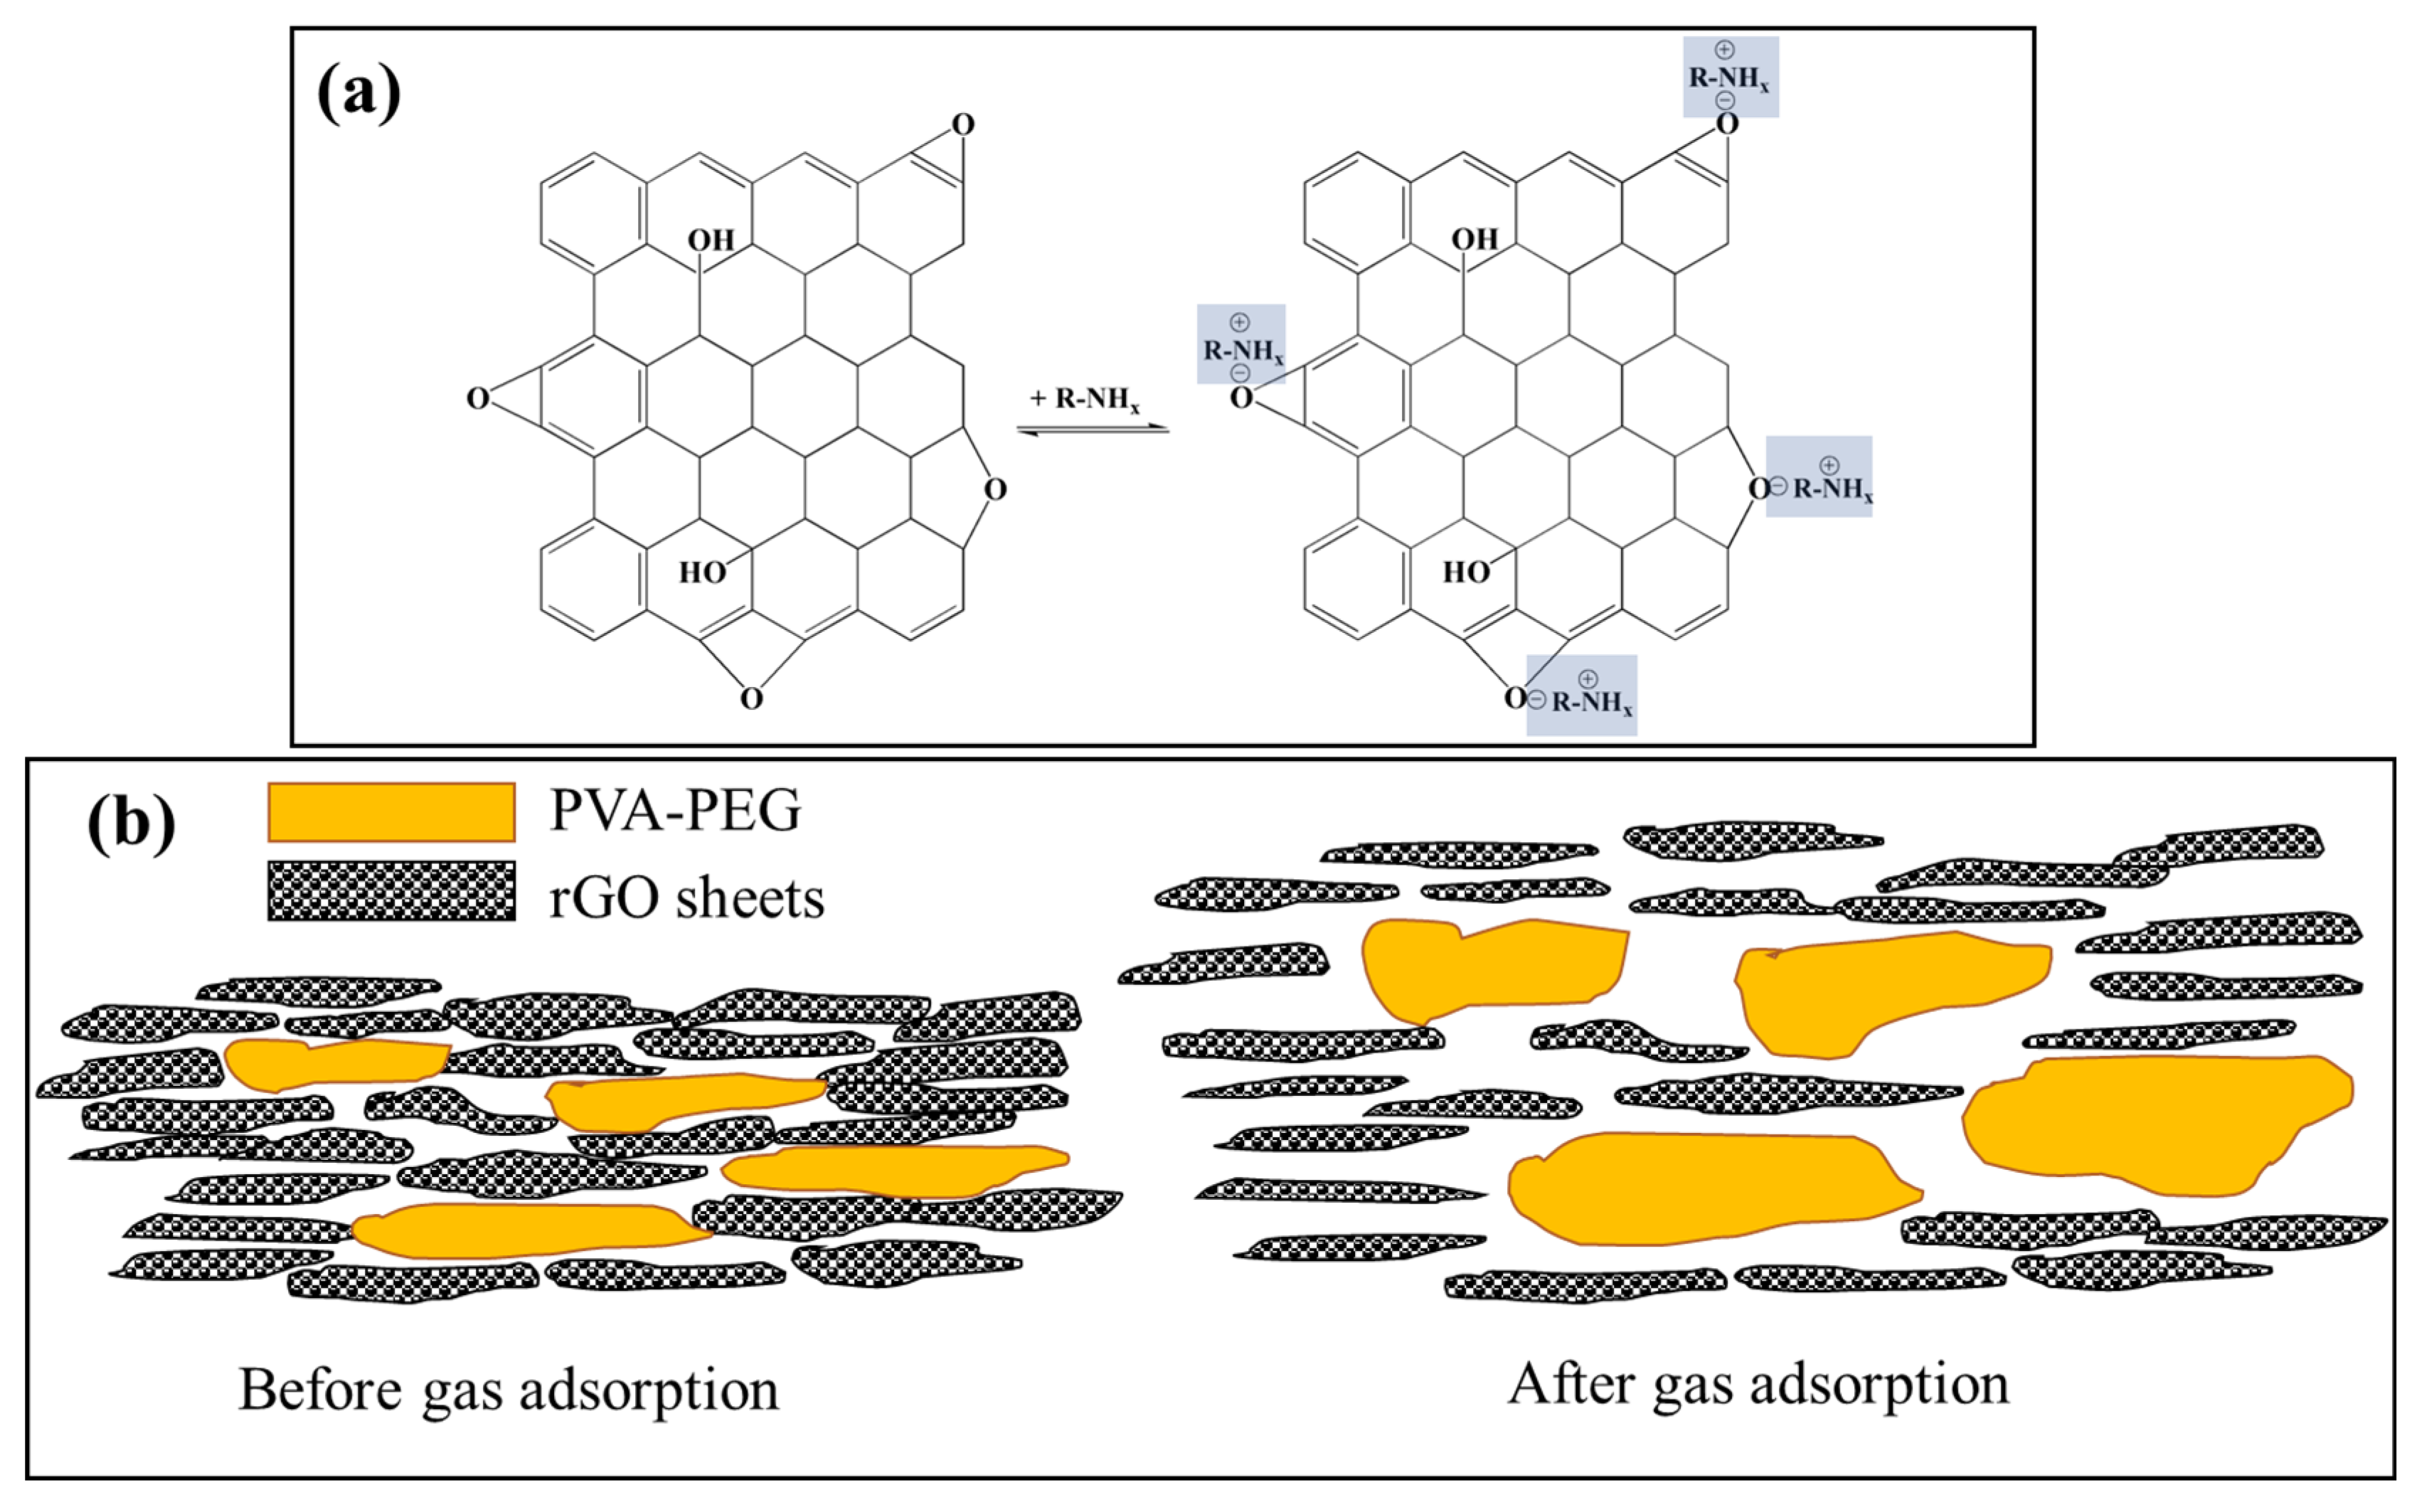

Table 1.
Sensitivity values of rGO and all polymer-embedded rGO sensors for TVB-N, ammonia, DMA, and TMA.
Table 1.
Sensitivity values of rGO and all polymer-embedded rGO sensors for TVB-N, ammonia, DMA, and TMA.
| Sample | TVB-N | Ammonia | DMA | TMA |
| rGO | 96 ± 8 | 119 ± 11 | 97 ± 12 | 68 ± 5 |
| 1% PP-rGO | 321 ± 15 | 336 ± 12 | 324 ± 10 | 302 ± 12 |
| 2% PP-rGO | 282 ± 12 | 325 ± 13 | 298 ± 8 | 238 ± 15 |
| 3% PP-rGO | 249 ± 17 | 299 ± 13 | 250 ± 14 | 190 ± 14 |
| 4% PP-rGO | 196 ± 16 | 279 ± 14 | 216 ± 10 | 129 ± 12 |
| 5% PP-rGO | 189 ± 18 | 268 ± 15 | 184 ± 14 | 92 ± 10 |
Disclaimer/Publisher’s Note: The statements, opinions and data contained in all publications are solely those of the individual author(s) and contributor(s) and not of MDPI and/or the editor(s). MDPI and/or the editor(s) disclaim responsibility for any injury to people or property resulting from any ideas, methods, instructions or products referred to in the content. |
© 2025 by the authors. Licensee MDPI, Basel, Switzerland. This article is an open access article distributed under the terms and conditions of the Creative Commons Attribution (CC BY) license (http://creativecommons.org/licenses/by/4.0/).
Copyright: This open access article is published under a Creative Commons CC BY 4.0 license, which permit the free download, distribution, and reuse, provided that the author and preprint are cited in any reuse.


