
Submitted:
21 April 2025
Posted:
22 April 2025
You are already at the latest version
Abstract
Elucidating the compositions, sources and mixing processes of dissolved organic matter (DOM) is crucial for a deeper understanding of the coastal carbon cycle and global carbon budget. The Hangzhou Bay (HZB), a vital estuary in China, receives freshwater inputs in the upper bay, borders the Changjiang River Estuary (CRE) to the north and is adjacent to Zhoushan Islands region (ZIR) to the east. In HZB, the DOM sources and their compositions in estuaries are still unclear due to the complexity of this dynamic environment. In this study, we aimed to expound the chemical composition and sources of the DOM in the HZB and its adjacent coastal waters based on chromophoric DOM, fluorescent DOM indexes, and other hydrochemical parameters in winter. The results showed that the DOM compositions in HZB have significant differences in the upper bay, middle bay and lower bay. The highest concentration of DOC was found in CRE, close to the northern lower HZB, with high humification index (HIX), low biological index (BIX) and high proportion of humic-like fluorescent component (C1), indicating a terrestrial inputs. In contrast, the DOM in the upper bay showed the characteristics of high BIX and low HIX, dominated by protein-like fluorescent components (C2 and C3), indicating autochthonous source. The DOM in middle bay showed a mixing composition characteristics indicated by CDOM and FDOM indexes. Moreover, the terrestrial DOM transported by CDW intrusion accounts for a large proportion of DOM in the northern HZB, Our study shows that even in coastal estuaries with very strong hydrodynamics, the DOM composition can still retain its unique source signal, which in turn affects its migration and transformation processes. This work provides a reference for studying the nearshore carbon cycle and tracking the sources and transformation processes of DOM in coastal bays and estuaries.
Keywords:
dissolved organic carbon
; CDOM
; FDOM
; parallel factor analysis
; Changjiang Diluted Water
; Hangzhou Bay
1. Introduction
The oceans are the most important carbon reservoir on Earth, absorbing more than 25% of carbon dioxide (CO2) emitted by human activities [1]. Although the offshore area only accounts for 7% to 8% of the global ocean area, the primary production accounts for 10% to 30%, and the organic carbon burial is as high as 80%, making it one of the most important carbon sinks in the global ocean [2,3]. However, it is challenging to accurately assess the carbon flux, source-sink pattern, and evolution trend in the coastal region, including the estuaries and bays [4].
Dissolved organic carbon (DOC) is the largest carbon reservoir in the ocean, which impacts the global carbon cycle and climate change. Dissolved organic matter (DOM) is a heterogeneous mixture formed by the secretion and excretion of living organisms [5]. The structure and composition of dissolved organic matter significantly affect the balance of aquatic ecosystems. DOM in ocean is generally divided into two categories: terrigenous (humus-like, high aromaticity, and high molecular weight) and autochthonous (protein-like, low aromaticity, and low molecular weight) DOM [6]. In addition, as a carrier of water pollutants, the source, composition, and characteristics of DOC also regulate the migration and transformation of pollutants [7].
DOM chemical composition depends on its parent organic matter and subsequent biogeochemical processes, including photo- and bio-degradation [8]. Though there are many studies interpreting DOM on the molecular level, such as sugars amino acids and lignin phenols [9,10], the source and composition of most DOM are still largely uncertain [11]. Spectroscopic techniques, including absorbance spectra and fluorescence excitation emission matrices (EEMs) are informative to trace DOM sources and assess DOM reactivity by testing chromophoric DOM (CDOM), fluorescent DOM (FDOM), and multiple established optical indices [12]. Combined with parallel factor analysis (PARAFAC) models, the relative contributions of allochthonous and autochthonous FDOM could be semi-quantitatively confirmed [13,14], and the method was also used in the study of coastal bays under eutrophication conditions and large estuaries [15,16,17,18,19]. Recent research has correlated the EEM data with the maximum fluorescence (Fmax) modeled by PARAFAC to examine the accuracy of the fluorescence intensities at the peaks of PARAFAC [20], and the machine learning method combined with PARAFAC model have also been used to identify sources of fluvial DOM in rivers [21].
Estuaries and bays link the land and the sea. The Hangzhou Bay (HZB), adjacent to the Changjiang River Estuary (CRE) at the northern lower bay, is a vital estuary in China. The Qiantang River carries terrestrial materials directly imported into HZB at the upper bay. Changjiang diluted water can also enter the bay directly from the northern lower HZB, or be carried into the bay under the action of ebb and flow. Changjiang, the largest river in China, brings large amounts of terrestrial materials, such as nutrients, particles and pollutants into the CRE, thereby affecting material transport processes in adjacent coastal regions [22]. The Changjiang Diluted Water (CDW), characterized by low salinity and high nutrients, spreads southwestward in winter affected by the northeast monsoon (December–February) [23]. It is generally recognized that the northwest monsoon leads to more significant CDW intrusion into Hangzhou Bay in winter than in summer and then strongly influences the hydrography of Hangzhou Bay [24].
Recent research in HZB waters has focused on nutrients, particles, and hydrodynamics [25,26]. However, the study of DOM and DOC has been limited owing to complex fluid dynamics and sampling challenges. The objective of this study is to expound the chemical composition and sources of the DOM in HZB and the contribution of CDW inputs based on CDOM absorption, FDOM, and other hydrochemical parameters collected under a comprehensive investigation survey in HZB and its adjacent sea in the winter season.
2. Results
2.1. Hydrological and Hydrochemical Parameters in HZB and Adjacent Seas
The HZB showed strong vertical mixing characteristics in late January 2024. The temperature and salinity ranged from 5.8 to 13.6 ℃ and 15.65 to 33.29, with the average value of 8.8 ± 2.1 ℃ and 27.57 ± 4.56, respectively. The spatial distributions of salinity and temperature are consistent between the surface and bottom layers with low salinity and temperature in the upper HZB and the north HZB, and then both the salinity and the temperature increased gradually southeastward to the Zhoushan Island region (ZIR) (Figure 1a,b).
HZB is known for its strong tidal currents, with a large tidal range accompanied by high turbidity. An obvious turbidity front in the study area was found along the longitude of ca 122.5 °E. The turbidity is pretty high, ranging from 400 to 500 FTU, at the west side of the front including the whole HZB. Then it decreased eastward to the ZIR. On the east side of the front, the turbidity ranged from 5 to 100 FTU (Figure 1c). The turbidity of the northern Changjiang Estuary stations (B3, B4, and B4-0) is slightly lower than that of Hangzhou Bay.
The total suspended matter (TSM) in the HZB and adjacent seas showed a similar distribution with turbidity (Figure 2a,b). It ranged from 113.6 mg·L-1 to 4616 mg·L-1 and 5.6 mg·L-1 to 616 mg·L-1 in the HZB (west of 122.5 °E) and the ZIR (east of 122.5 °E), respectively. The high values of TSM were found at the Qiantang River Estuary (QRE, station E1 to E4) and northern lower bay near CRE (Figure 1d), consistent with previous studies [27,28].
2.2. Distributions of DOC in HZB and Adjacent Seas
Concentrations of DOC in the study area ranged from 69.2 to 179.2 μmol·L-1, with an average value of 105.8 ± 25.0 μmol·L-1. The high DOC concentrations were observed near the Changjiang Estuary as a high-value core (149.2 ± 8.3 μmol·L-1 at stations B3, B4, B4-0, and B4-1) and at station C2-1 (168.3 μmol·L-1) (Figure 3), and then gradually decreases southwestward to the HZB and southeastward to the Zhoushan Islands Region (ZIR).
2.3. CDOM and FDOM Properties in HZB and Adjacent Seas
2.3.1. CDOM Coefficients
The absorption coefficients of CDOM at different wavelengths are always positively correlated in the coastal estuaries where the DOM is dominated by terrestrial input [29]. The absorption coefficient of CDOM in HZB and adjacent seas was higher at 254 nm (a254) than other longer wavelengths (Figure S1). This was mainly due to the low concentrations of CDOM in the HZB and shelf region, resulting in inaccurate absorption coefficient measured at 350-500nm. Previous studies have also reported that the shorter wavelength absorption fit better than the longer wavelength absorption, especially in the open sea [30].
The UV absorption coefficients at 254nm and 355nm, a254 and a355 in the HZB and adjacent seas ranged from 1.31 to 8.74 m-1 and 0.05 to 3.86 m-1 with an average of 4.77 ± 1.62 m-1 and 1.28 ± 0.69 m-1, respectively. The highest value of a254 is concentrated in the upper HZB and CRE (surface-water stations E1, E2, CE3, and B3) (Figure 4a, b). The SR ranged from 0.68 to 3.65, with an average of 1.71 ± 0.52. The aromaticity index SUVA254 ranged from 1.15 to 9.62 with an average of 3.90 ± 1.62 in units of L·mg-1·m-1 (Figure 4c).
The absorption of CDOM at certain wavelengths reveals the relative abundance of CDOM in the study area. There are two high-absorb areas at both 254 nm and 355 nm (UV absorptions) in the surface layer. One is near the CRE (station B3), and the other is near the (HZB, stations E1, E2, and CE3). At the bottom layer, the distribution of CDOM at 254 nm is similar to that at the surface layer. The highest SUVA254 values in the surface and bottom layers were found in the upper HZB, indicating that the DOM was highly aromatic under the influence of Qiantang River Estuary (QRE) input.
2.3.2. FDOM Indexes
The HIX values ranged from 0.41 to 2.93, with lower values near the upper HZB (Qiantang River Estuary) and southern HZB (station E1 to E6 to ZJD12031), while higher values near the CRE (station B3 to B8) (Figure 5a). The HIX values decreased gradually from the CRE to the southern HZB and from the northern lower bay to the upper bay.
The BIX values ranged from 0.95 to 1.26, with lowest values in bottom-waters near the CRE (station B3, B4-0 and B4-1) and higher values in the southern HZB (station E1 to E6) (Figure 5b). The BIX values increased spatially from the Changjiang Estuary southwestward to the southern HZB and southeastward to the ZIR. Indexes ranged with salinity are supported in Figure S3.
2.3.3. PARAFAC Analysis Results
Three fluorophore components were identified using the excitation and emission matrices by the parallel factor analysis (Figure 6). The excitation and emission wavelengths of component 1 (C1) are 248 nm and 460 nm, respectively. C1 represents spectral characteristics similar to a UVC humic-like component (peak A) [13,31]. Compared with UVA humic-like matter (signature-peak C), UVC humic-like DOM has a lighter molecular weight, lower aromaticity, and stronger resistance to photodegradation [32].
The Ex/Em of Components 2 (C2) and 3 (C3) are 275/318 nm and 287/355 nm, respectively. Additionally, a single Ex peak of C3 was observed at a wavelength less than 240 nm. Both C2 and C3 were identified as protein-like components. C2 shows typical features of tyrosine-like fluorescence (peak B). Meanwhile C3 shows typical features of tryptophan-like fluorescence (peak T) [13,33].
The possible sources of the three DOM components were terrestrial sources or photodegraded products for C1, autochthonous origin (algal and microbial sources) or human pollution inputs for C2 and C3 [32]. Totally, the three components C1, C2 and C3 accounted for 34.7%, 41.5% and 23.8% in HZB and 56.6%, 23.5% and 19.9% in ZIR, respectively (Figure 7).
The Ftotal (summary of C1+C2+C3) in HZB and adjacent areas ranged from 0.0270 to 0.0510 R.U. Highest Ftotal values concentrated in the QRE and upper HZB (Figure 8a). The Fmax of C1, C2 and C3 were 0.0110–0.0187, 0.0050–0.0269 and 0.0043–0.0131 R.U, with average values of 0.0165 ± 0.0016, 0.0096 ± 0.0050 and 0.0070 ± 0.0020 R.U, respectively.
C1 components were higher in the CDW-influenced areas like the CRE, the shelf sea area and lower HZB. C2 and C3 components had the highest values near the QRE in upper HZB. The distributions of C1, C2, and C3 in HZB and adjacent sea were shown in the following Figure 8b-d. There is a strong positive correlation between the two protein-like components C2 and C3 (r2 = 0.93, p < 0.0001), while there is a strong negative correlation between the humic-like components C1 and protein-like component C2 when salinity is lower than 27.5 (r2 = 0.96, p < 0.0001), which is supported in Figure S2.
3. Discussion
3.1. Composition and Characteristics of DOM in HZB and Adjacent Seas
CDOM is a naturally occurring dissolved organic matter that absorbs UV light in water. The intensity of the UV absorption varies with the composition of CDOM, and it is often used in combination with FDOM to indicate the composition and characteristics of DOM [12]. Besides, FDOM, the DOM with fluorescence characteristics, also has Uv-vis absorption properties, and the absorption intensity could be represented by Ftotal (summary of C1+C2+C3, in unit R.U).
The results of CDOM and FDOM showed that there are distinct differences in the composition and characteristics of DOM in HZB and its adjacent areas (Figure 9,10). In the QRE, the main components of DOM are C2 and C3. and then these DOM decreased from the upper HZB to the lower HZB (from the QRE to CRE and ZIR) as shown in Figure 9. Both C2 and C3 were identified as protein-like components [13]. C2 shows the typical features of tyrosine-like fluorescence., while C3 shows typical features of tryptophan-like fluorescence [34]. In this study, we analyzed the correlation between RFE corrected at 254 nm [35] and Chl-a. The result showed a significant positive correlation between the two parameters, indicating that the C2 component was closely related to the primary production source.
In contrast, the highest value of humic-like C1 was found in CRE as a high-value core, and then it decreased from the CRE westward to the upper HZB and eastward to the ZIR, as shown in Figure 9. The three fluorescent components (C1 - C3) were compared with the OpenFluor database [36]. C1 associated with signatures similar to a photo-oxidized crude oil product [37]. It is associated to the terrestrial humic-like substance in Green Bay [38], major component of porewater and bottom water in rivers [39], and leaf extracts in stream water [40], indicating that C1 is a terrestrial humic-like dissolved organic matter with photo-oxidized.
A high correlation (p < 0.0001) was revealed between HIX and component C1 (Figure S4), showing that the source of C1 mainly contributed to the degree of humification of DOM. This suggests that the DOC in CRE is dominated by the terrestrial input DOC with a high degree of humification. Considering the Changjiang River carrying large amounts of terrestrial materials into the CRE, the DOM in CRE was mainly carried by Changjiang inputs with a high degree of humification.
Furthermore, the composition and characteristics of DOC indicated by other CDOM parameters and FDOM indexes support the above results. A relatively low DOC concentrations, but with high a254 and SUVA254 values, were found in the upper HZB (Qiantang River Estuary, QRE in Figure 10a, e), indicating that DOM in QRE had the characteristics of higher UV absorption per C. Besides, the highest value of Ftotal was found at the QRE (Figure 10c). The distributions of SUVA254 and Ftotal jointly reflect the DOM molecular characteristics of QTR source with high aromaticity, which result in high UV absorption and high fluorescence excitation emission peaks.
However, the highest DOC concentration with low SUVA254 was found at CRE (Figure 10f). Compared to the DOM of QR inputs, DOM of CDW showed the characteristic of higher carbon amounts but lower aromaticity.
Moreover, SR is used to indicate the molecular weight (M.W) of DOM. Higher SR ratios indicate small M.W in average. The molecular weight turns smaller with the DOM decomposition process. Therefore, SR can not only indicate the characteristics and source of different kinds of DOM, but also indicate the degradation degree of the same species of DOM [41]. In our study SR (Figure 10d) was higher in ZIR (mean value 2.01) than CRE and HZB area (mean value 1.28-1.55), which indicated that in SSW with low turbidity, photodegradation happened obviously in humic-like DOM component.
In addition, the highest FI mean value was also found at QRE (Figure 10g), and the FI decreased from upper HZB (QRE) eastward to CRE and ZIR. FI is often used as the proxy of the microbial modification of the DOM [42], and the result indicated that the microbial modification in QRE and southern HZB was more significant than in CRE and ZIR.
HIX is often used to indicate the humification degree of DOM [43]. HIX mean values exhibited a sharp increase from QRE to CRE, with the values increased from 0.47 to 2.19 (Figure 10h). Since HIX is an indicator of humic substance content or extent of humification, the highest HIX in CRE indicated that an evident terrigenous humic-like DOM was carried by CR, and then it was spread from CRE to the surrounding sea areas, including the lower HZB and ZIR. The higher peak area of HIX and lower peak area of BIX in CER and northern HZB showed a significant intrusion from CDW into HZB.
BIX is an indicator of autotrophic productivity, and the higher values (> 1) always correspond to recently produced DOM of autochthonous origin [44]. BIX mean values decreased from upper HZB (QRE) eastward to CRE, decreasing from 1.10 to 0.99 (Figure 10i). The BIX values in HZB indicated that the DOM from the contribution of autotrophic productivity in QRE and southern bay was greater than northern bay and CRE. Although the average value of BIX in ZIR is almost equal to the value of QRE, the significant difference in FI values indicated that there is a significant difference in DOM composition between these two regions, and the DOM in QRE has experienced strong microbial modification.
PCA analysis of different characteristics and indexes in HZB and adjacent seas turned out two principal components (Figure 11). PC1 counting for 50.2% represents positive correlations with CDOM UV-absorption, protein-like FDOM (C2 and C3) and turbidity, but negative correlations with salinity, HIX and humic-like FDOM C1.
PC1 was a principal component of short-wave absorption, small-molecules, photodegradation and non-terrestrial source. PC2 counting for 18.6% represents positive correlations with turbidity and DOC, but negative correlations with BIX and FI. PC2 was a principal component about freshness, biological modification. PC1 distinguished CRE and ZIR sources of DOM from HZB sources. And PC2 distinguished SSW from low-salinity, high-turbidity CDW and Qiantang Estuary water (QTW) water masses. PCA analysis clearly showed the obvious differences in DOM composition and characteristics in HZB and its adjacent areas.
3.2. Sources of DOM in HZB
Generally, DOM can be divided into autochthonous and allochthonous DOM according to the initial source. The autochthonous source includes phytoplankton synthesis in surface water and transport of benthic organisms by upwellings. Besides, autochthonous DOM can also come from the POM transportation and microbial lysis. The autochthonous DOM have lower molecular weight, aromaticity and higher UV-cis absorption in general. While the allochthonous source includes the soil precipitation and plant metabolite leaching as terrestrial source, and pollution source produced by human activity. The allochthonous DOM have higher molecular weight, aromaticity and are easily photodegraded, relatively [45,46].
The humic-like components were mainly terrestrial inputs in bays, estuaries and coastal waters, taking studies in Xiangshan Bay, Changjiang River Estuary and Shelf East China Sea as examples [16-18]. The protein-like component DOM is marine autochthonous humic-like DOM which is derived from phytoplankton production, as well as human pollution inputs. In general, from the bay to the sea, with the elevation of salinity, the DOM would be gradually dominated by the in-situ produced composition [47].
The compositions of DOM in HZB showed the contribution of different DOM sources. The highest values of C1 in CER and C2 and C3 in QER supported that different FDOM composition features could be used to distinguish the sources of DOM of waters in different regions of HZB.
The physical and chemical properties of seawater are primarily affected by the properties of water masses. Three different water sources were identified based on temperature, salinity, and turbidity, showing distinct hydrological and hydro-chemical properties (Table 1). QTW represents for Qiantang Estuary Water; CDW represents for Changjiang Diluted Water; SSW represents for Shelf Sea Water (salinity > 27.5) in Zhoushan Islands Region.
Table 1 shows the different water masses with different hydro-chemical properties in winter in the study area: The QTW (blue circle in Figure. 12a), had the medium temperature, lowest salinity, and high turbidity (> 400) with the highest DO and Chl-a values. The Changjiang diluted water (CDW, orange circle in Figure 12a) had the lowest temperature, medium salinity, and high turbidity (> 400) with medium DO and Chl-a values. The shelf seawater (SSW, red quadrangle in Figure 13a) had the highest temperature, salinity, and low turbidity (< 300) with the lowest DO and Chl-a values.
Water masses of varying densities and sources are highlighted and circled in different colors in Figure 13a. Turbidity is significantly resistant to the photodegradation and photobleaching of DOM in the bay and estuary [48]. There were 79 water samples with turbidity greater than 300 FTU in the study area, representing mixed waters highly influenced by both CDW and QTW, and 69 water samples with turbidity less than 300 FTU represent shelf sea waters (Figure 12b).
The distinct differences of FDOM components in HZB and its adjacent areas were discussed in section 4.1 of this study. The result, combined with the water mass characteristics, could be used to indicate the DOM sources in HZB.
The DOM in HZB composed of different sources was controlled by the three different water masses of QTW, CDW, and SSW. Among them, QTW has the lowest humic-like C1 component due to the modification of high Chl-a linked DOM, and thus displays the highest protein-like C2 component of DOM in the upper HZB. The Qiantang River carried a mixture of terrestrial humic-rich and anthropogenic protein-rich CDOM and contributed primarily to the CDOM in the upper bay [15]. And the values of protein-like components in FDOM were notably higher (from 23% up to 90%) than those of the other components in typical bays in China [17]. The main components are either derived from synthesis of algal production or human sewage discharge [50]. In the upper bay near QRE (station E1, E2, CE3, E3, E4), the main component of DOM is C2 and C3, the protein-like DOM.
CDW showed the highest humic-like C1 component due to strong effects of Changjiang terrestrial DOM inputs. SSW shows the high salinity and medium value of C1. The DOM composition in the northern Bay is a mixture of QTW and CDW, with CDW in higher proportion. The DOM composition in the central and southern Bay was controlled by the mixing of these three water masses. In the southern HZB (blue dashed section in Figure 12), the C1 abundance and salinity (S) showed a significant positive relationship conforming to the formula C1 = 4.18*10-4 × S + 4.44*10-3 (R2 = 0.9862, blue dashed line in Figure 13), but the line was not on the mixing line of QTW and SSW. This further confirms the contribution of the mixing of the three water masses.
The C1 abundance and salinity in the ZIR (salinity > 27.5, red SSW area in Figure 12) conform to formula C1 = -3.49*10-5 × S2 + 1.77*10-3 × S – 4.23*10-3 (R2 = 0.5803, red curve in Figure 13). The DOM composition in the ZIR was controlled by the nonlinear mixing of CDW and SSW. It is reasonable, since the CDW is the mixing water mass of Changjiang fresh water and the ECS shelf water.
4. Materials and Methods
4.1. Study Area and Sampling Sites
A comprehensive investigation survey was conducted in HZB and its adjacent seas (Figure 14a) in winter (January 27th-31st, 2024). 50 stations were investigated during the cruise. Water samples (Figure 14b) were collected using a SBE CTD (CTD-conductivity, temperature, and depth; SBE 9) with 6 Niskin sampling bottles. At each station, hydrologic parameters (temperature, salinity, turbidity, PAR, Chl-a, DO and pH) were constantly monitored on board. Further processing of raw data was performed using Golden Software Surfer 15 and SBE Data Processing.
4.2. Sample Collection
A total of 152 water samples were collected from 3 depth layers (surface, middle, and bottom) at each sampling station. Water samples were filtered (0.2 μm polycarbonate membrane, Millipore, IsoporeTM) into borosilicate EPA bottles (amber glass, hydrochloride acid precleaned, calcined at 460 ℃ for 4 hours). Samples for DOC concentration were stored dark at -20 ℃, and samples for CDOM and FDOM were stored dark at 4 ℃ until laboratory analysis.
4.3. DOC Concentration Analysis
The DOC concentrations were analyzed using a high-temperature catalytic oxidation method with a total organic carbon analyzer (TOC-L, Shimadzu). Samples were acidified with 6 N HCl to pH ∼2 to remove the inorganic carbon before injection. Sample concentrations were quantified by the external standard curve. The Milli-Q water samples (blank) were subtracted as a baseline, and 83.33μmol/L standards were injected every 10 samples to check the accuracy of the measurements [51]. Analytical error based on the replicated measurements (three measurements per sample) is 0.5 within 5% of the DOC values.
4.4. CDOM and FDOM Optical Analyses
The CDOM absorbance was measured by using the Absorbance Spectrophotometer (Hardware of Aqualog®, HORIBA Scientific) with a 1 × 1 cm quartz cuvette. Meanwhile, FDOM excitation emission matrices (EEMs) were recorded using the Fluorescence Spectrofluorometer (Hardware of Aqualog®, HORIBA Scientific) with a 1 × 1 cm quartz cuvette.
4.4.1. CDOM Analysis: Ultraviolet-Visible (UV-Vis) Absorbance
The CDOM absorbance was measured throughout the UV and visible spectral domains (240 – 500 nm) with a resolution of 3.0 nm. The absorbance (A) was converted into the Napierian absorption coefficient (a) in the unit of m-1 using Eq. (1) [52]:
where Aλ is the absorbance, l is the length of the quartz cuvette, and λ is the wavelength. The aλ at certain wavelengths can represent the abundance of CDOM in waters [53].
The spectral slope coefficient (S) was calculated from Eq. (2) [54]:
where aλ1 and aλ2 are absorption coefficients at wavelengths λ1 and λ2. For example, the spectral range (275 – 295 nm) was reported as S275−295 in units of μm−1. The spectral slope ratio at a specific wavelength (SR) was calculated from Eq. (3) to indicate the molecular weight of the DOM [41]:
4.4.2. FDOM Analysis: Fluorescence Excitation Emission Matrices (EEMs)
The FDOM excitation range was set from 240 to 500 nm, while the emission range was set from 245 to 825 nm. The excitation and emission scans were set at 3 nm and 4.66 nm (8 pixel) steps, respectively. Instrument correction, blank subtraction, correction of inner-filter effects, Rayleigh-masking of first and second orders, and normalization (Raman scattering units) were performed as below:
Instrument correction: sensitivity of Water-Raman SNR > 20,000: 1 and peak of water absorb ranged at 397 ± 1 nm. Blank subtraction: the EEMs were subtracted by the EEM of Milli-Q water measured in the same conditions. The inner-filter effects in EEMs were corrected by the Eq. (5) [57]:
where Fideal is the ideal fluorescence-signal spectrum, and Fobs is the observed fluorescence signal. AbsEx and AbsEm are the measured absorbance values at the respective excitation and emission wavelength-coordinates. The Rayleigh and Raman scatter peaks were removed by using the three-dimensional interpolation (R1 ±10 nm, R2 ±20 nm) [58]. EEMs were normalized to the water Raman signal [59], and the fluorescence intensities were reported as equivalent water Raman Units (R.U).
The fluorescence index (FI), humification index (HIX), and biological index (BIX) were calculated as indices for the microbial modification, the humification degree, and the contribution of biological and autochthonous DOM, respectively. FI is the relative contribution of microbial and terrestrial sources of the DOM. Higher values indicate an increasing degree of microbial modification. FI was calculated by the ratio of Em intensity at 470 nm divided by 520 nm at Ex 370 nm [42,60]. HIX is calculated by the area under the Em spectra 435 – 480 nm divided by the peak area 300 - 345 nm, at Ex 254 nm [43]. Higher HIX values indicate an increasing degree of humification. BIX is an indicator of autotrophic productivity. Higher values (> 1) correspond to recently produced DOM of autochthonous origin. BIX was calculated by the ratio of Em intensity at 380 nm divided by 430 nm at Ex 310 nm [44].
2.4.3 The 3D Fluorescence - PARAFAC Analysis
The EEMs data were further analyzed using the parallel factor analysis (PARAFAC) with the Solo® Software (9.5R, with PLS_Toolbox, Eigenvector Research). The n-component model (n = 2, 3, 4......) was validated by split-half, random initialization analysis and analysis of residuals.
Four-component PARAFAC analysis has 97.226% data explained but the Core Consistency is only 17, with only 2.2% similarity measure of splits and overall model, which means the 4-comp - PARAFAC model is not available. Meanwhile, three- component PARAFAC analysis has 96.746% data explained and the Core Consistency is 87, with 87.2% similarity measure of splits and overall model (Figure S6), which means the three-component PARAFAC model is reliable. Taking all factors into account, three-component PARAFAC model was used for DOM composition analysis and further discussion in this study.
4.5. Statistical Analyses
The location of sampling sites, surface distributions, and scatter diagrams were mapped with Ocean Data View 5.3.0 software (Schlitzer, Reiner, Ocean Data View, https://odv.awi.de, 2020). Correlation analysis (Pearson’s r) and principal component analysis (PCA) in this study were performed using the inbuilt statistics toolbox in OriginPro 2024b software. Results of linear and nonlinear fittings with p < 0.001 were recorded as significant.
5. Conclusions
The DOC concentrations ranged from 69.2 to 179.2 μmol/L in HZB and its adjacent seas, with the highest values in the Changjiang Estuary in winter, 2024. The high HIX, low BIX, and low SUVA254 in CDW indicated the terrestrial C1 characterized by high humification, high molecular weight, and low aromaticity by photodegraded. The high HIX was found in northern HZB (lower Bay), while the high BIX was found in southern HZB. DOM coming directly from the Changjiang River made a relatively high contribution to the Hangzhou Bay DOM in winter. A three-component model was carried out by PARAFAC analysis in the study area, including a humic-like C1 and two protein-like C2 and C3. The highest C1 component was detected in CRE, indicating high terrestrial DOM carried by the Changjiang River into the CRE, while high values of protein-like C2 and C3 components were found in QRE at upper HZB. The compositions, sources, and mixing behavior of DOM in HZB were determined by three different water masses (CDW, QTW, and SSW). The terrestrial DOM transported by CDW intrusion accounts for a large proportion of DOM in northern HZB, while the DOC in the central and southern HZB shows the mixing characteristics of three water masses. The composition of DOC in ZIR indicates the mixing source of CDW and SSW. Our results reveal that DOC compositions can be effectively discriminated by their spectral characteristics, providing valid insights for investigating offshore carbon cycling and tracing the carbon transformation processes.
Supplementary Materials
The following supporting information can be downloaded at the website of this paper posted on Preprints.org. Figure S1: Surface distributions of CDOM absorption coefficients in different wavelengths ranged from 254nm to 460 nm; Figure S2: Pearson correlations analysis of DOC concentrations, CDOM absorptions at different wavelengths, and abundance of three FDOM components; Figure S3: FDOM indexes ranged with salinity in HZB and adjacent seas in winter 2024; Figure S4: FDOM indexes versus with component divided by PARAFAC; Figure S5: FDOM components of protein-like C2 along the salinity gradient in HZB and adjacent seas in winter 2024; Figure S6: Comparison of the Results of PARAFAC between 4-component model and 3-component model on Parameters, residuals, auxiliary and split-half test.
Author Contributions
Conceptualization, Haiyan Jin and Zhongqiang Ji.; methodology, Chenshuai Wei, Peisong Yu and Bin Wang; validation, Ying Luo, Xiao Ning. and Yanhong Xu; investigation, Qian Li, Chenshuai Wei, Ying Luo; data curation, Chenshuai Wei, Dewang Li.; writing—original draft preparation, Chenshuai Wei and Haiyan Jin.; writing—review and editing, Haiyan Jin, Yanhong Xu, Lihong Chen, Dewang Li; supervision, Haiyan Jin; project administration, Haiyan Jin and Bin Wang; funding acquisition, Haiyan Jin and Yanhong Xu. All authors have read and agreed to the published version of the manuscript.
Funding
This research was funded by The Zhejiang Provincial Natural Science Foundation of China, grant number LD24D060001, the Science Foundation of Donghai Laboratory, grant number DH-2022ZY0006, Scientific Research Fund of the Second Institute of Oceanography, MNR, grant number JB2405, the Key R&D Program of Zhejiang, grant number 2023C03120, the Ocean Negative Carbon Emissions (ONCE) Program and Long Term Observation and Research Plan in the CE and the Adjacent ECS Project, grant number QNYJ2203.
Institutional Review Board Statement
Not applicable.
Informed Consent Statement
Not applicable.
Data Availability Statement
The raw data supporting the conclusions of this article will be made available by the authors on request.
Acknowledgments
We thank all the crew members for their help in collecting samples during the survey. We also thank colleagues from Second Institute of Oceanography, MNR for providing the following support: Jiang Zhihao for CTD data, Jiang Peiwen and Bi Shuqing for TSM handling And Hu Ji for providing the Fluorescence Spectrofluorometer.
Conflicts of Interest
The authors declare no conflicts of interest. The funders had no role in the design of the study; in the collection, analyses, or interpretation of data; in the writing of the manuscript; or in the decision to publish the results.
Abbreviations
The following abbreviations are used in this manuscript:
| DOM | Dissolved Organic Matter |
| CDOM | Chromophoric dissolved organic matter |
| FDOM | Fluorescent dissolved organic matter |
| DOC | Dissolved organic carbon |
| TSM | The total suspended matter |
| HZB | Hangzhou Bay |
| QRE | Qiantang River Estuary |
| CRE | Changjiang River Estuary |
| ZIR | Zhoushan Islands region |
| ECS | East China Sea |
| QTW | Qiantang Estuary water |
| CDW | Changjiang Diluted Water |
| SSW | Shelf seawater |
| FI | The fluorescence index |
| HIX | The humification index |
| BIX | The biological index |
| EEMs | Excitation emission matrices |
| PARAFAC | Parallel factor analysis |
| PCA | Principal component analysis |
References
- Hajima, T.; Kawamiya, M.; Ito, A.; Tachiiri, K.; Jones, C. D.; Arora, V.; Brovkin, V.; Séférian, R.; Liddicoat, S.; Friedlingstein, P.; Shevliakova, E. Consistency of global carbon budget between concentration- and emission-driven historical experiments simulated by CMIP6 Earth system models and suggestions for improved simulation of CO2 concentration. Biogeosciences 2025, 22, 1447–1473. [Google Scholar] [CrossRef]
- Bauer, J. E.; Cai, W.; Raymond, P. A.; Bianchi, T. S.; Hopkinson, C. S.; Regnier, P. A. G. The changing carbon cycle of the coastal ocean. Nature 2013, 504, 61–70. [Google Scholar] [CrossRef] [PubMed]
- Cai, W. Estuarine and Coastal Ocean Carbon Paradox: CO2 Sinks or Sites of Terrestrial Carbon Incineration. In Annual Review of Marine Science, Carlson, C. A.; Giovannoni, S. J., Eds. 2011; Vol. 3, p 123.
- Dai, M.; Su, J.; Zhao, Y.; Hofmann, E. E.; Cao, Z.; Cai, W.; Gan, J.; Lacroix, F.; Laruelle, G. G.; Meng, F.; Mueller, J. D.; Regnier, P. A. G.; Wang, G.; Wang, Z. Carbon fluxes in the coastal ocean: synthesis, boundary processes, and future trends. Annual Review of Earth and Planetary Sciences 2022, 50, 593–626. [Google Scholar] [CrossRef]
- Wetzel, R. G. Death, detritus, and energy-flow in aquatic ecosystems. Freshwater Biology 1995, 33, 83–89. [Google Scholar] [CrossRef]
- Zigah, P. K.; McNichol, A. P.; Xu, L.; Johnson, C.; Santinelli, C.; Karl, D. M.; Repeta, D. J. Allochthonous sources and dynamic cycling of ocean dissolved organic carbon revealed by carbon isotopes. Geophysical Research Letters 2017, 44, 2407–2415. [Google Scholar] [CrossRef]
- Du, Y.; Zhang, Q.; Liu, Z.; He, H.; Lurling, M.; Chen, M.; Zhang, Y. Composition of dissolved organic matter controls interactions with La and Al ions: Implications for phosphorus immobilization in eutrophic lakes. Environmental Pollution 2019, 248, 36–47. [Google Scholar] [CrossRef]
- Stubbins, A.; Spencer, R. G. M.; Chen, H.; Hatcher, P. G.; Mopper, K.; Hernes, P. J.; Mwamba, V. L.; Mangangu, A. M.; Wabakanghanzi, J. N.; Six, J. Illuminated darkness: Molecular signatures of Congo River dissolved organic matter and its photochemical alteration as revealed by ultrahigh precision mass spectrometry. Limnology and Oceanography 2010, 55, 1467–1477. [Google Scholar] [CrossRef]
- Hernes, P. J.; Benner, R. Photochemical and microbial degradation of dissolved lignin phenols: Implications for the fate of terrigenous dissolved organic matter in marine environments. Journal of Geophysical Research-Oceans 2003, 108, (C9).
- Repeta, D. J. Chemical Characterization and Cycling of Dissolved Organic Matter. 2015; p 21-63.
- Hansell, D. A.; Carlson, C. A. Biogeochemistry of Marine Dissolved Organic Matter, 2nd Edition. 2015.
- Hansen, A. M.; Kraus, T. E. C.; Pellerin, B. A.; Fleck, J. A.; Downing, B. D.; Bergamaschi, B. A. Optical properties of dissolved organic matter (DOM): Effects of biological and photolytic degradation. Limnology and Oceanography 2016, 61, 1015–1032. [Google Scholar] [CrossRef]
- Coble, P. G. Characterization of marine and terrestrial DOM in seawater using excitation-emission matrix spectroscopy. Marine Chemistry 1996, 51, 325–346. [Google Scholar] [CrossRef]
- Stedmon, C. A.; Bro, R. Characterizing dissolved organic matter fluorescence with parallel factor analysis: a tutorial. Limnology and Oceanography-Methods 2008, 6, 572–579. [Google Scholar] [CrossRef]
- Zhou, Y.; Li, Y.; Yao, X.; Ding, W.; Zhang, Y.; Jeppesen, E.; Zhang, Y.; Podgorski, D. C.; Chen, C.; Ding, Y.; Wu, H.; Spencer, R. G. M. Response of chromophoric dissolved organic matter dynamics to tidal oscillations and anthropogenic disturbances in a large subtropical estuary. Science of The Total Environment 2019, 662, 769–778. [Google Scholar] [CrossRef] [PubMed]
- Guo, J.; Liang, S.; Wang, X.; Pan, X. Distribution and dynamics of dissolved organic matter in the Changjiang Estuary and adjacent sea. Journal of Geophysical Research: Biogeosciences 2021, 126, e2020JG006161.
- Zhao, C.; Zhou, Y.; Pang, Y.; Zhang, Y.; Huang, W.; Wang, Y.; He, D. The optical and molecular signatures of DOM under the eutrophication status in a shallow, semi-enclosed coastal bay in southeast China. Science China Earth Sciences 2021, 64, 1090–1104. [Google Scholar] [CrossRef]
- Zhou, Y.; He, D.; He, C.; Li, P.; Fan, D.; Wang, A.; Zhang, K.; Chen, B.; Zhao, C.; Wang, Y.; Shi, Q.; Sun, Y. Spatial changes in molecular composition of dissolved organic matter in the Yangtze River Estuary: Implications for the seaward transport of estuarine DOM. Science of The Total Environment 2021, 759, 143531. [Google Scholar] [CrossRef]
- Liang, W.; Chen, X.; Chen, Z. L.; Zhu, P.; Huang, Z.; Li, J.; Wang, Y.; Li, L.; He, D. Unraveling the impact of Spartina alterniflora invasion on greenhouse gas production and emissions in coastal saltmarshes: New insights from dissolved organic matter characteristics and surface-porewater interactions. Water Research 2024, 262, 122120. [Google Scholar] [CrossRef]
- Yu, H.; Liang, H.; Qu, F.; Han, Z.-s.; Shao, S.; Chang, H.; Li, G. Impact of dataset diversity on accuracy and sensitivity of parallel factor analysis model of dissolved organic matter fluorescence excitation-emission matrix. Scientific Reports 2015, 5, 10207. [Google Scholar] [CrossRef]
- Liu, D.; Nie, L.; Xi, B.; Gao, H.; Yang, F.; Yu, H. A novel-approach for identifying sources of fluvial DOM using fluorescence spectroscopy and machine learning model. npj Clean Water 2024, 7, 79. [Google Scholar] [CrossRef]
- Li, D.; Chen, J.; Wang, B.; Jin, H.; Shou, L.; Lin, H.; Miao, Y.; Sun, Q.; Jiang, Z.; Meng, Q.; Zeng, J.; Zhou, F.; Cai, W. Hypoxia Triggered by Expanding River Plume on the East China Sea Inner Shelf During Flood Years. Journal of Geophysical Research: Oceans 2024, 129, e2024JC021299.
- Chen, C. T. A. Rare northward flow in the Taiwan Strait in winter: a note. Continental Shelf Research 2003, 23, (3-4), 387-391.
- Che, Y.; He, Q.; Lin, W. Q. The distributions of particulate heavy metals and its indication to the transfer of sediments in the Changjiang Estuary and Hangzhou Bay, China. Marine Pollution Bulletin 2003, 46, 123–131. [Google Scholar] [CrossRef]
- Li, M.; Wang, B.; Li, Y.; Li, D.; Zhang, Y.; Yang, Z.; Chen, Q.; Huang, W.; Zhu, Y.; Zeng, J.; Zhou, F.; Jin, H.; Xu, J.; Chen, J. Influence of suspended particulate matters on P dynamics and eutrophication in the highly turbid estuary: A case study in Hangzhou Bay, China. Marine Pollution Bulletin 2024, 207, 116793. [Google Scholar] [CrossRef]
- Yang, Z.; Chen, J.; Jin, H.; Li, H.; Ji, Z.; Li, Y.; Wang, B.; Cao, Z.; Chen, Q. Tracing nitrate sources in one of the world’s largest eutrophicated bays (Hangzhou Bay): insights from nitrogen and oxygen isotopes. Acta Oceanologica Sinica 2024, 43, 86–95. [Google Scholar] [CrossRef]
- Li, Y.; Li, J.; Su, J.; Ren, F. Study on fluctuations of plume front and turbidity maximum in the Hangzhou Bay by remote sensing data. Acta Oceanologica Sinica 1993, (1), 51. [Google Scholar]
- Xu, F.; Ji, Z.; Wang, K.; Jin, H.; Loh, P. S. The Distribution of Sedimentary Organic Matter and Implication of Its Transfer from Changjiang Estuary to Hangzhou Bay, China. Open Journal of Marine Science 2016, 6, 103–114. [Google Scholar] [CrossRef]
- Guo, W.; Wang, C.; Xu, J.; Jiao, T.; Lin, Z. A review on the spectral analysis of marine organic matter. Marine Science Bulletin 2018, 37, 601–614. [Google Scholar]
- Martínez-Pérez, A. M.; Nieto-Cid, M.; Osterholz, H.; Catalá, T. S.; Reche, I.; Dittmar, T.; Álvarez-Salgado, X. A. Linking optical and molecular signatures of dissolved organic matter in the Mediterranean Sea. Scientific Reports 2017, 7, 3436. [Google Scholar] [CrossRef]
- Stedmon, C. A.; Markager, S. Tracing the production and degradation of autochthonous fractions of dissolved organic matter by fluorescence analysis. Limnology and Oceanography 2005, 50, 1415–1426. [Google Scholar] [CrossRef]
- Liu, L.; Fang, Y.; Sun, X. Research progress of organic matter based on three-dimensional fluorescence spectroscopy-parallel factor analysis (EEM-PARAFAC). Water Purification Technology (in Chinese) 2022, 41, 7–16. [Google Scholar]
- Cory, R. M.; McKnight, D. M. Fluorescence Spectroscopy Reveals Ubiquitous Presence of Oxidized and Reduced Quinones in Dissolved Organic Matter. Environmental Science & Technology 2005, 39, 8142–8149. [Google Scholar]
- Hudson, N.; Baker, A.; Reynolds, D. Fluorescence analysis of dissolved organic matter in natural, waste and polluted waters—a review. River Research and Applications 2007, 23, 631–649. [Google Scholar] [CrossRef]
- Downing, B. D.; Boss, E.; Bergamaschi, B. A.; Fleck, J. A.; Lionberger, M. A.; Ganju, N. K.; Schoellhamer, D. H.; Fujii, R. Quantifying fluxes and characterizing compositional changes of dissolved organic matter in aquatic systems in situ using combined acoustic and optical measurements. Limnology and Oceanography: Methods 2009, 7, 119–131. [Google Scholar] [CrossRef]
- Murphy, K. R.; Stedmon, C. A.; Wenig, P.; Bro, R. OpenFluor- An online spectral library of auto-fluorescence by organic compounds in the environment. Analytical Methods 2014, 6, 658–661. [Google Scholar] [CrossRef]
- Whisenhant, E. A.; Zito, P.; Podgorski, D. C.; McKenna, A. M.; Redman, Z. C.; Tomco, P. L. Unique Molecular Features of Water-Soluble Photo-Oxidation Products among Refined Fuels, Crude Oil, and Herded Burnt Residue under High Latitude Conditions. ACS ES&T Water 2022, 2, 994–1002. [Google Scholar]
- Lin, H.; Guo, L. Variations in Colloidal DOM Composition with Molecular Weight within Individual Water Samples as Characterized by Flow Field-Flow Fractionation and EEM-PARAFAC Analysis. Environmental Science & Technology 2020, 54, 1657–1667. [Google Scholar]
- Chen, M.; Kim, S.-H.; Jung, H.-J.; Hyun, J.-H.; Choi, J. H.; Lee, H.-J.; Huh, I.-A.; Hur, J. Dynamics of dissolved organic matter in riverine sediments affected by weir impoundments: Production, benthic flux, and environmental implications. Water Research 2017, 121, 150–161. [Google Scholar] [CrossRef] [PubMed]
- D’Andrilli, J.; Junker, J. R.; Smith, H. J.; Scholl, E. A.; Foreman, C. M. DOM composition alters ecosystem function during microbial processing of isolated sources. Biogeochemistry 2019, 142, 281–298. [Google Scholar] [CrossRef]
- Helms, J. R.; Stubbins, A.; Ritchie, J. D.; Minor, E. C.; Kieber, D. J.; Mopper, K. Absorption spectral slopes and slope ratios as indicators of molecular weight, source, and photobleaching of chromophoric dissolved organic matter. Limnology and Oceanography 2008, 53, 955–969. [Google Scholar] [CrossRef]
- McKnight, D. M.; Boyer, E. W.; Westerhoff, P. K.; Doran, P. T.; Kulbe, T.; Andersen, D. T. Spectrofluorometric characterization of dissolved organic matter for indication of precursor organic material and aromaticity. Limnology and Oceanography 2001, 46, 38–48. [Google Scholar] [CrossRef]
- Ohno, T. Fluorescence inner-filtering correction for determining the humification index of dissolved organic matter. Environmental Science & Technology 2002, 36, 742–746. [Google Scholar]
- Huguet, A.; Vacher, L.; Relexans, S.; Saubusse, S.; Froidefond, J. M.; Parlanti, E. Properties of fluorescent dissolved organic matter in the Gironde Estuary. Organic Geochemistry 2009, 40, 706–719. [Google Scholar] [CrossRef]
- Jiao, N.; Herndl, G. J.; Hansell, D. A.; Benner, R.; Kattner, G.; Wilhelm, S. W.; Kirchman, D. L.; Weinbauer, M. G.; Luo, T.; Chen, F.; Azam, F. Microbial production of recalcitrant dissolved organic matter: long-term carbon storage in the global ocean. Nature Reviews Microbiology 2010, 8, 593–599. [Google Scholar] [CrossRef]
- Lonborg, C.; Carreira, C.; Jickells, T.; Anton Alvarez-Salgado, X. Impacts of Global Change on Ocean Dissolved Organic Carbon (DOC) Cycling. Frontiers in Marine Science 2020, 7. [Google Scholar] [CrossRef]
- Medeiros, P. M.; Seidel, M.; Ward, N. D.; Carpenter, E. J.; Gomes, H. R.; Niggemann, J.; Krusche, A. V.; Richey, J. E.; Yager, P. L.; Dittmar, T. Fate of the Amazon River dissolved organic matter in the tropical Atlantic Ocean. Global Biogeochemical Cycles 2015, 29, 677–690. [Google Scholar] [CrossRef]
- Sun, X.; Song, G.; Xie, H. The apparent quantum yields of dissolved organic matter photobleaching and photomineralization in the Changjiang River Estuary. Haiyang Xuebao (in Chinese) 2016, 38, 120–129. [Google Scholar]
- Wu, H.; Shen, J.; Zhu, J.; Zhang, J.; Li, L. Characteristics of the Changjiang plume and its extension along the Jiangsu Coast. Continental Shelf Research 2014, 76, 108–123. [Google Scholar] [CrossRef]
- Stedmon, C. A.; Seredynska-Sobecka, B.; Boe-Hansen, R.; Le Tallec, N.; Waul, C. K.; Arvin, E. A potential approach for monitoring drinking water quality from groundwater systems using organic matter fluorescence as an early warning for contamination events. Water Research 2011, 45, 6030–6038. [Google Scholar] [CrossRef] [PubMed]
- Benner, R.; Strom, M. A critical evaluation of the analytical blank associated with DOC measurements by high-temperature catalytic oxidation. Marine Chemistry 1993, 41, 153–160. [Google Scholar] [CrossRef]
- Pegau, W. S.; Gray, D.; Zaneveld, J.; V. , R. Absorption and attenuation of visible and near-infrared light in water: dependence on temperature and salinity. Appl. Opt. 1997, 36, 6035–6046. [Google Scholar] [CrossRef]
- Li, P.; Chen, L.; Zhang, W.; Huang, Q. Spatiotemporal distribution, sources, and photobleaching imprint of dissolved organic matter in the Yangtze Estuary and its adjacent sea using fluorescence and parallel factor analysis. PLOS ONE 2015, 10, e0130852. [Google Scholar] [CrossRef]
- Twardowski, M. S.; Boss, E.; Sullivan, J. M.; Donaghay, P. L. Modeling the spectral shape of absorption by chromophoric dissolved organic matter. Marine Chemistry 2004, 89, 69–88. [Google Scholar] [CrossRef]
- Traina, S. J.; Novak, J.; Smeck, N. E. An ultraviolet absorbance method of estimating the percent aromatic carbon content of humic acids. Journal of Environmental Quality 1990, 19, 151–153. [Google Scholar] [CrossRef]
- Weishaar, J. L.; Aiken, G. R.; Bergamaschi, B. A.; Fram, M. S.; Fujii, R.; Mopper, K. Evaluation of specific ultraviolet absorbance as an indicator of the chemical composition and reactivity of dissolved organic carbon. Environmental Science & Technology 2003, 37, 4702–4708. [Google Scholar]
- Larsson, T.; Wedborg, M.; Turner, D. Correction of inner-filter effect in fluorescence excitation-emission matrix spectrometry using Raman scatter. Analytica Chimica Acta 2007, 583, 357–363. [Google Scholar] [CrossRef]
- Zepp, R. G.; Sheldon, W. M.; Moran, M. A. Dissolved organic fluorophores in southeastern US coastal waters: correction method for eliminating Rayleigh and Raman scattering peaks in excitation-emission matrices. Marine Chemistry 2004, 89, (1-4), 15-36.
- Lawaetz, A. J.; Stedmon, C. A. Fluorescence intensity calibration using the Raman scatter peak of water. Applied Spectroscopy 2009, 63, 936–940. [Google Scholar] [CrossRef]
- Cory, R. M.; McNeill, K.; Cotner, J. P.; Amado, A.; Purcell, J. M.; Marshall, A. G. Singlet Oxygen in the Coupled Photochemical and Biochemical Oxidation of Dissolved Organic Matter. Environmental Science & Technology 2010, 44, 3683–3689. [Google Scholar]
Figure 1.
Distributions of the hydro-parameters in surface water (left panels) and bottom water (right panels) in the HZB and its adjacent seas in late January 2024: (a) Temperature; (b) Salinity; (c) Turbidity, and (d) TSM.
Figure 1.
Distributions of the hydro-parameters in surface water (left panels) and bottom water (right panels) in the HZB and its adjacent seas in late January 2024: (a) Temperature; (b) Salinity; (c) Turbidity, and (d) TSM.
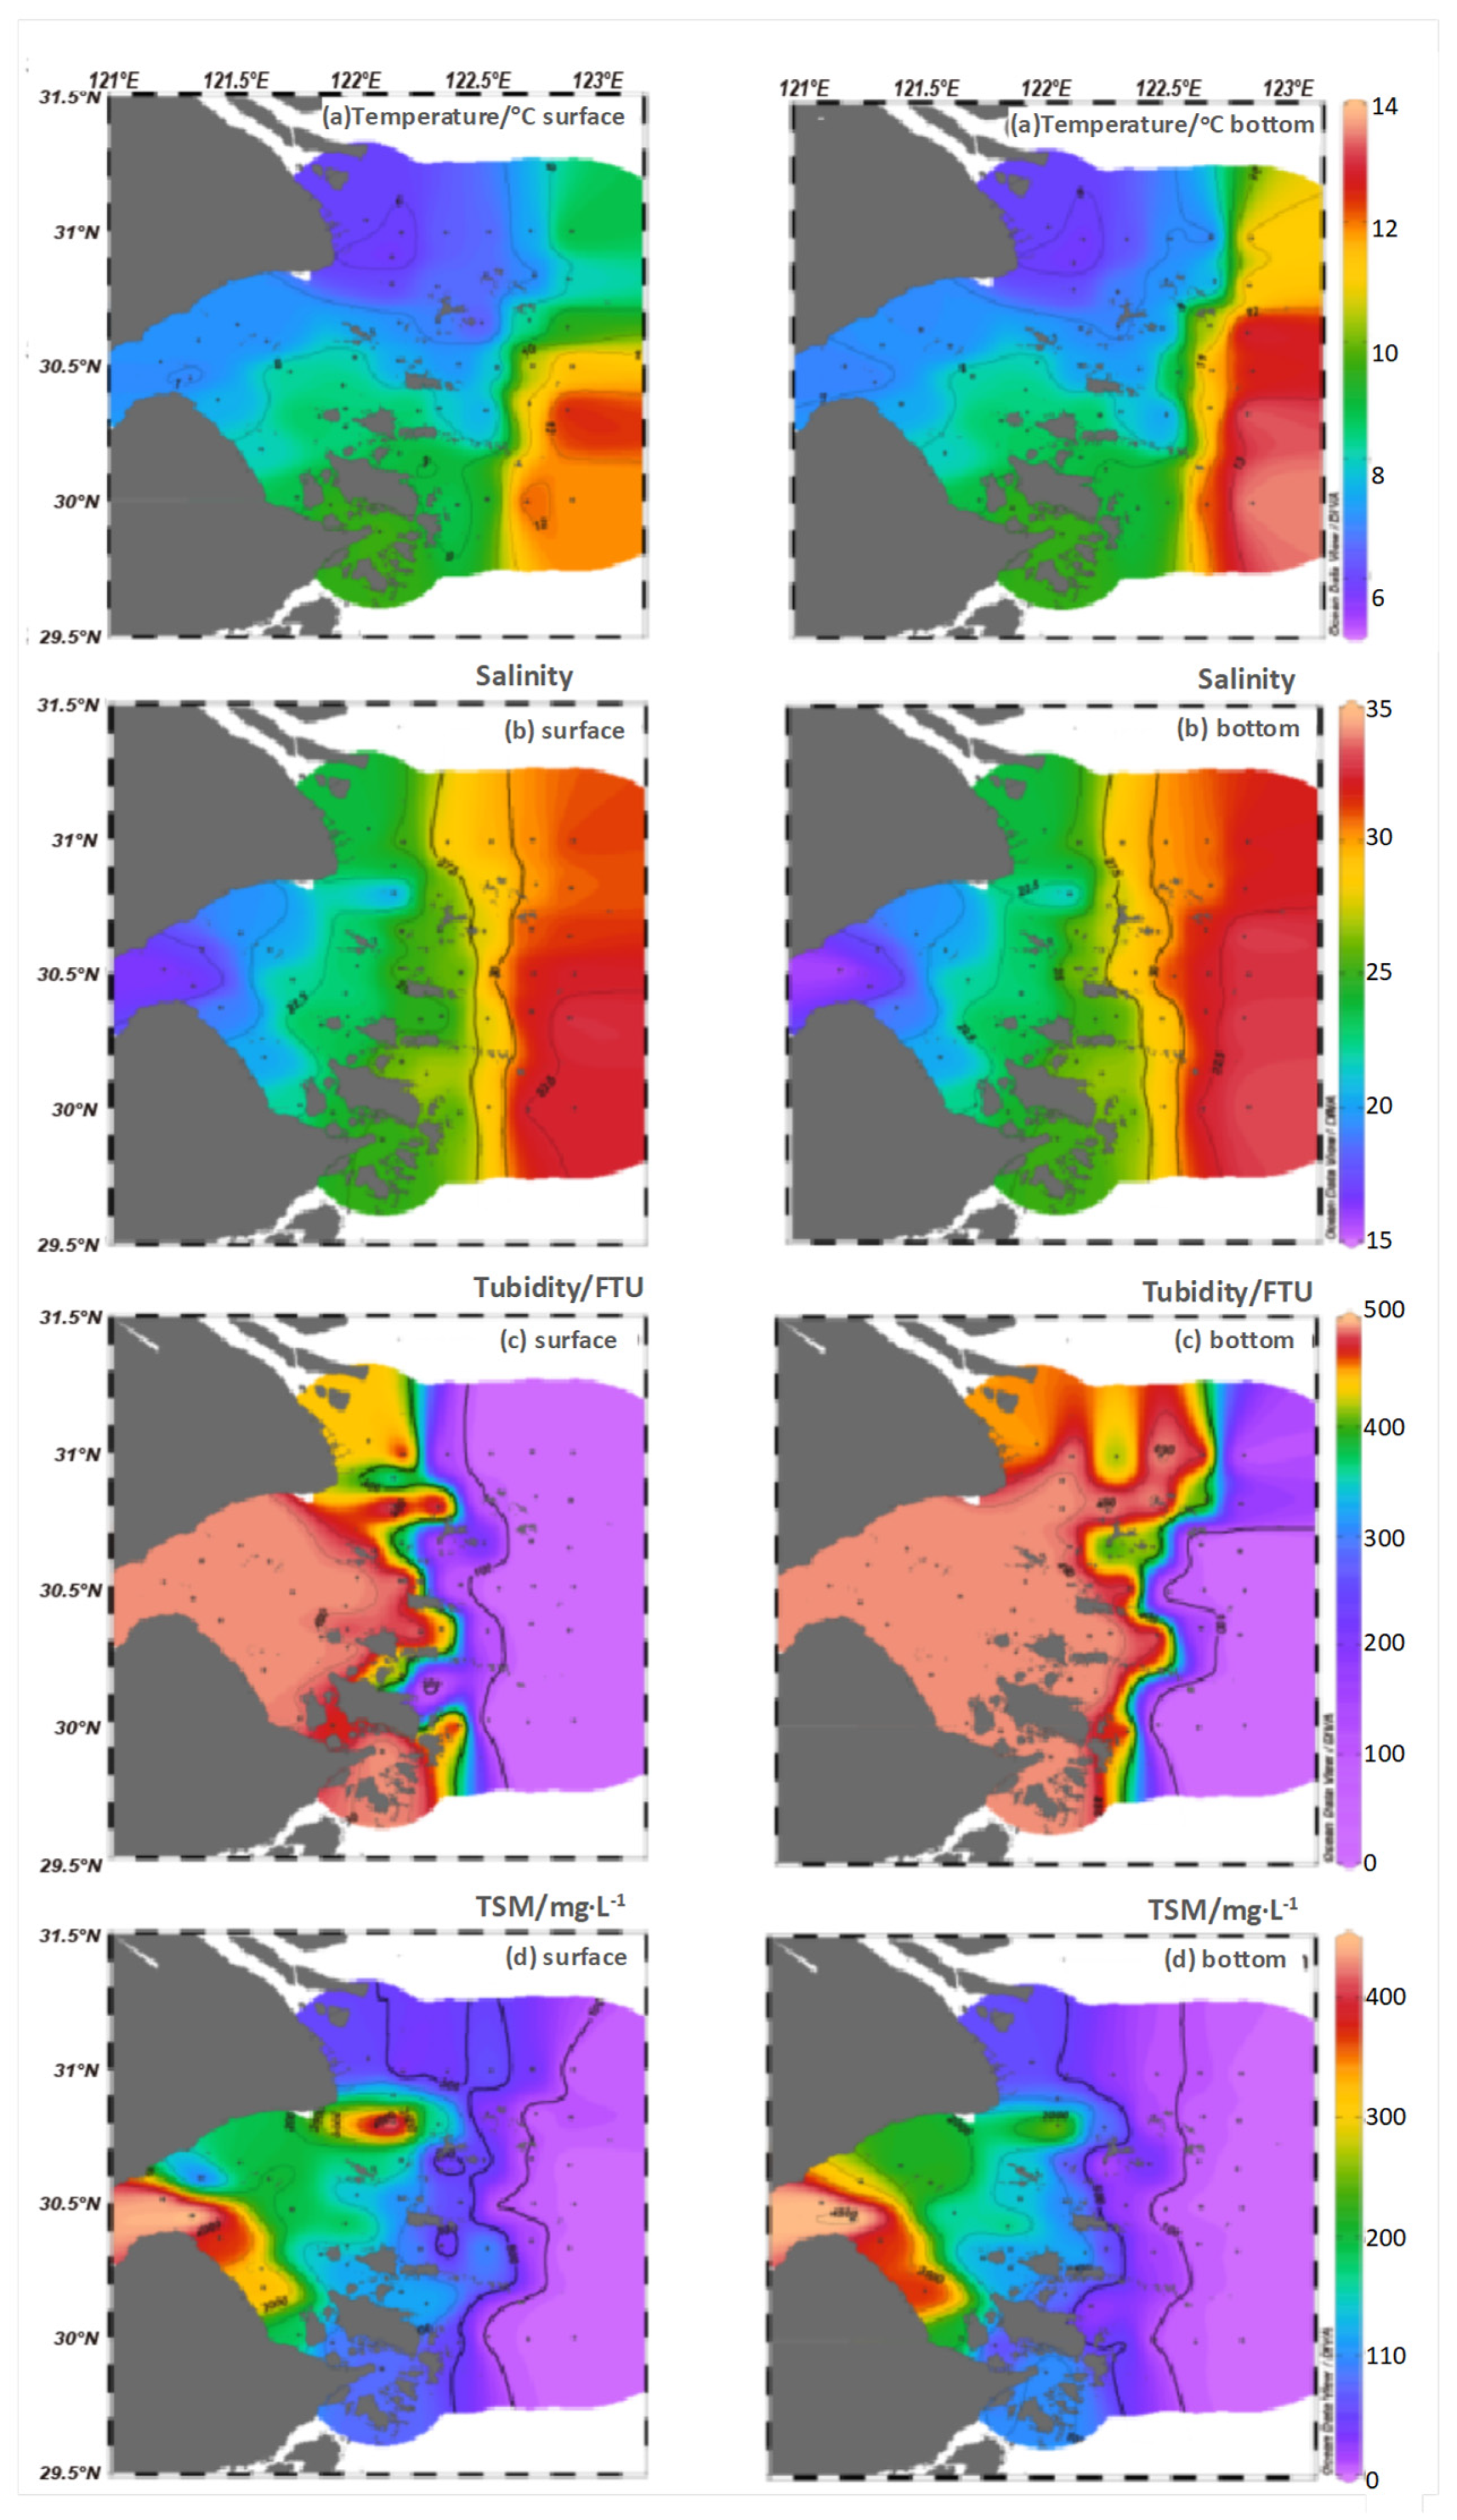
Figure 2.
The (a) turbidity and (b) TSM variability along with longitude and depth in the study areas.
Figure 2.
The (a) turbidity and (b) TSM variability along with longitude and depth in the study areas.
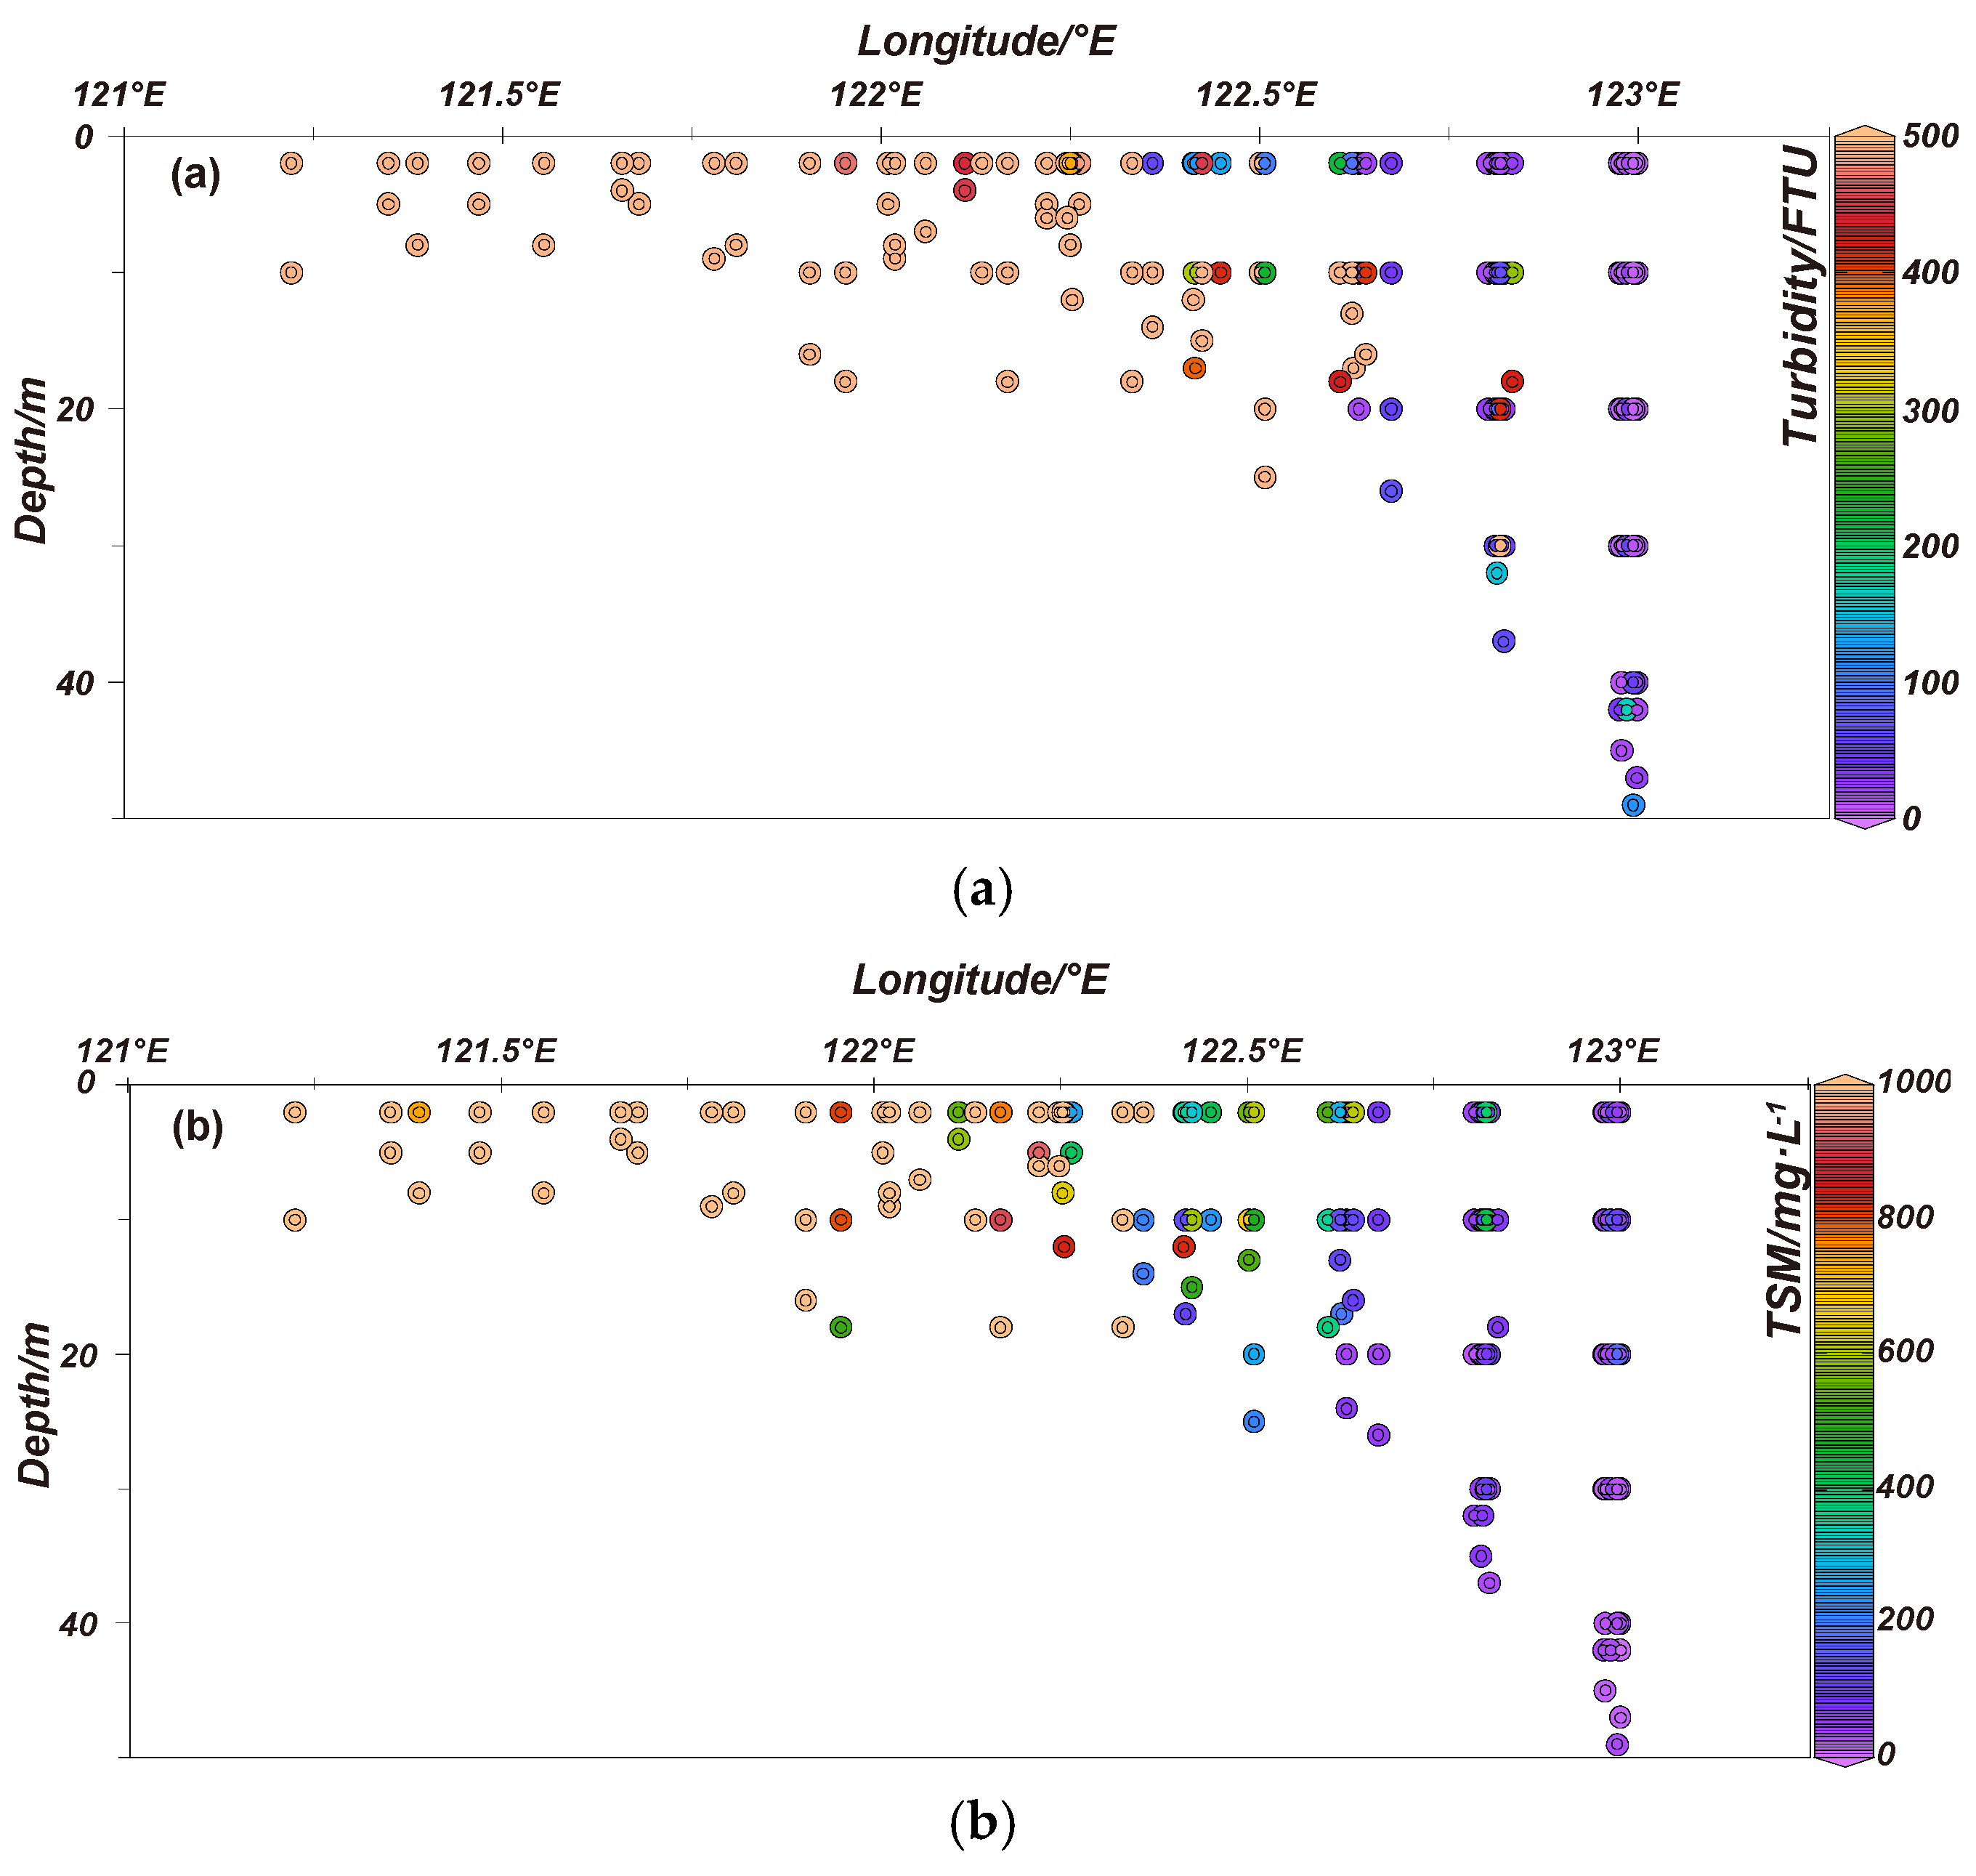
Figure 3.
Distributions of DOC in the HZB and adjacent seas. (a) DOC in surface water; (b) DOC in water.
Figure 3.
Distributions of DOC in the HZB and adjacent seas. (a) DOC in surface water; (b) DOC in water.
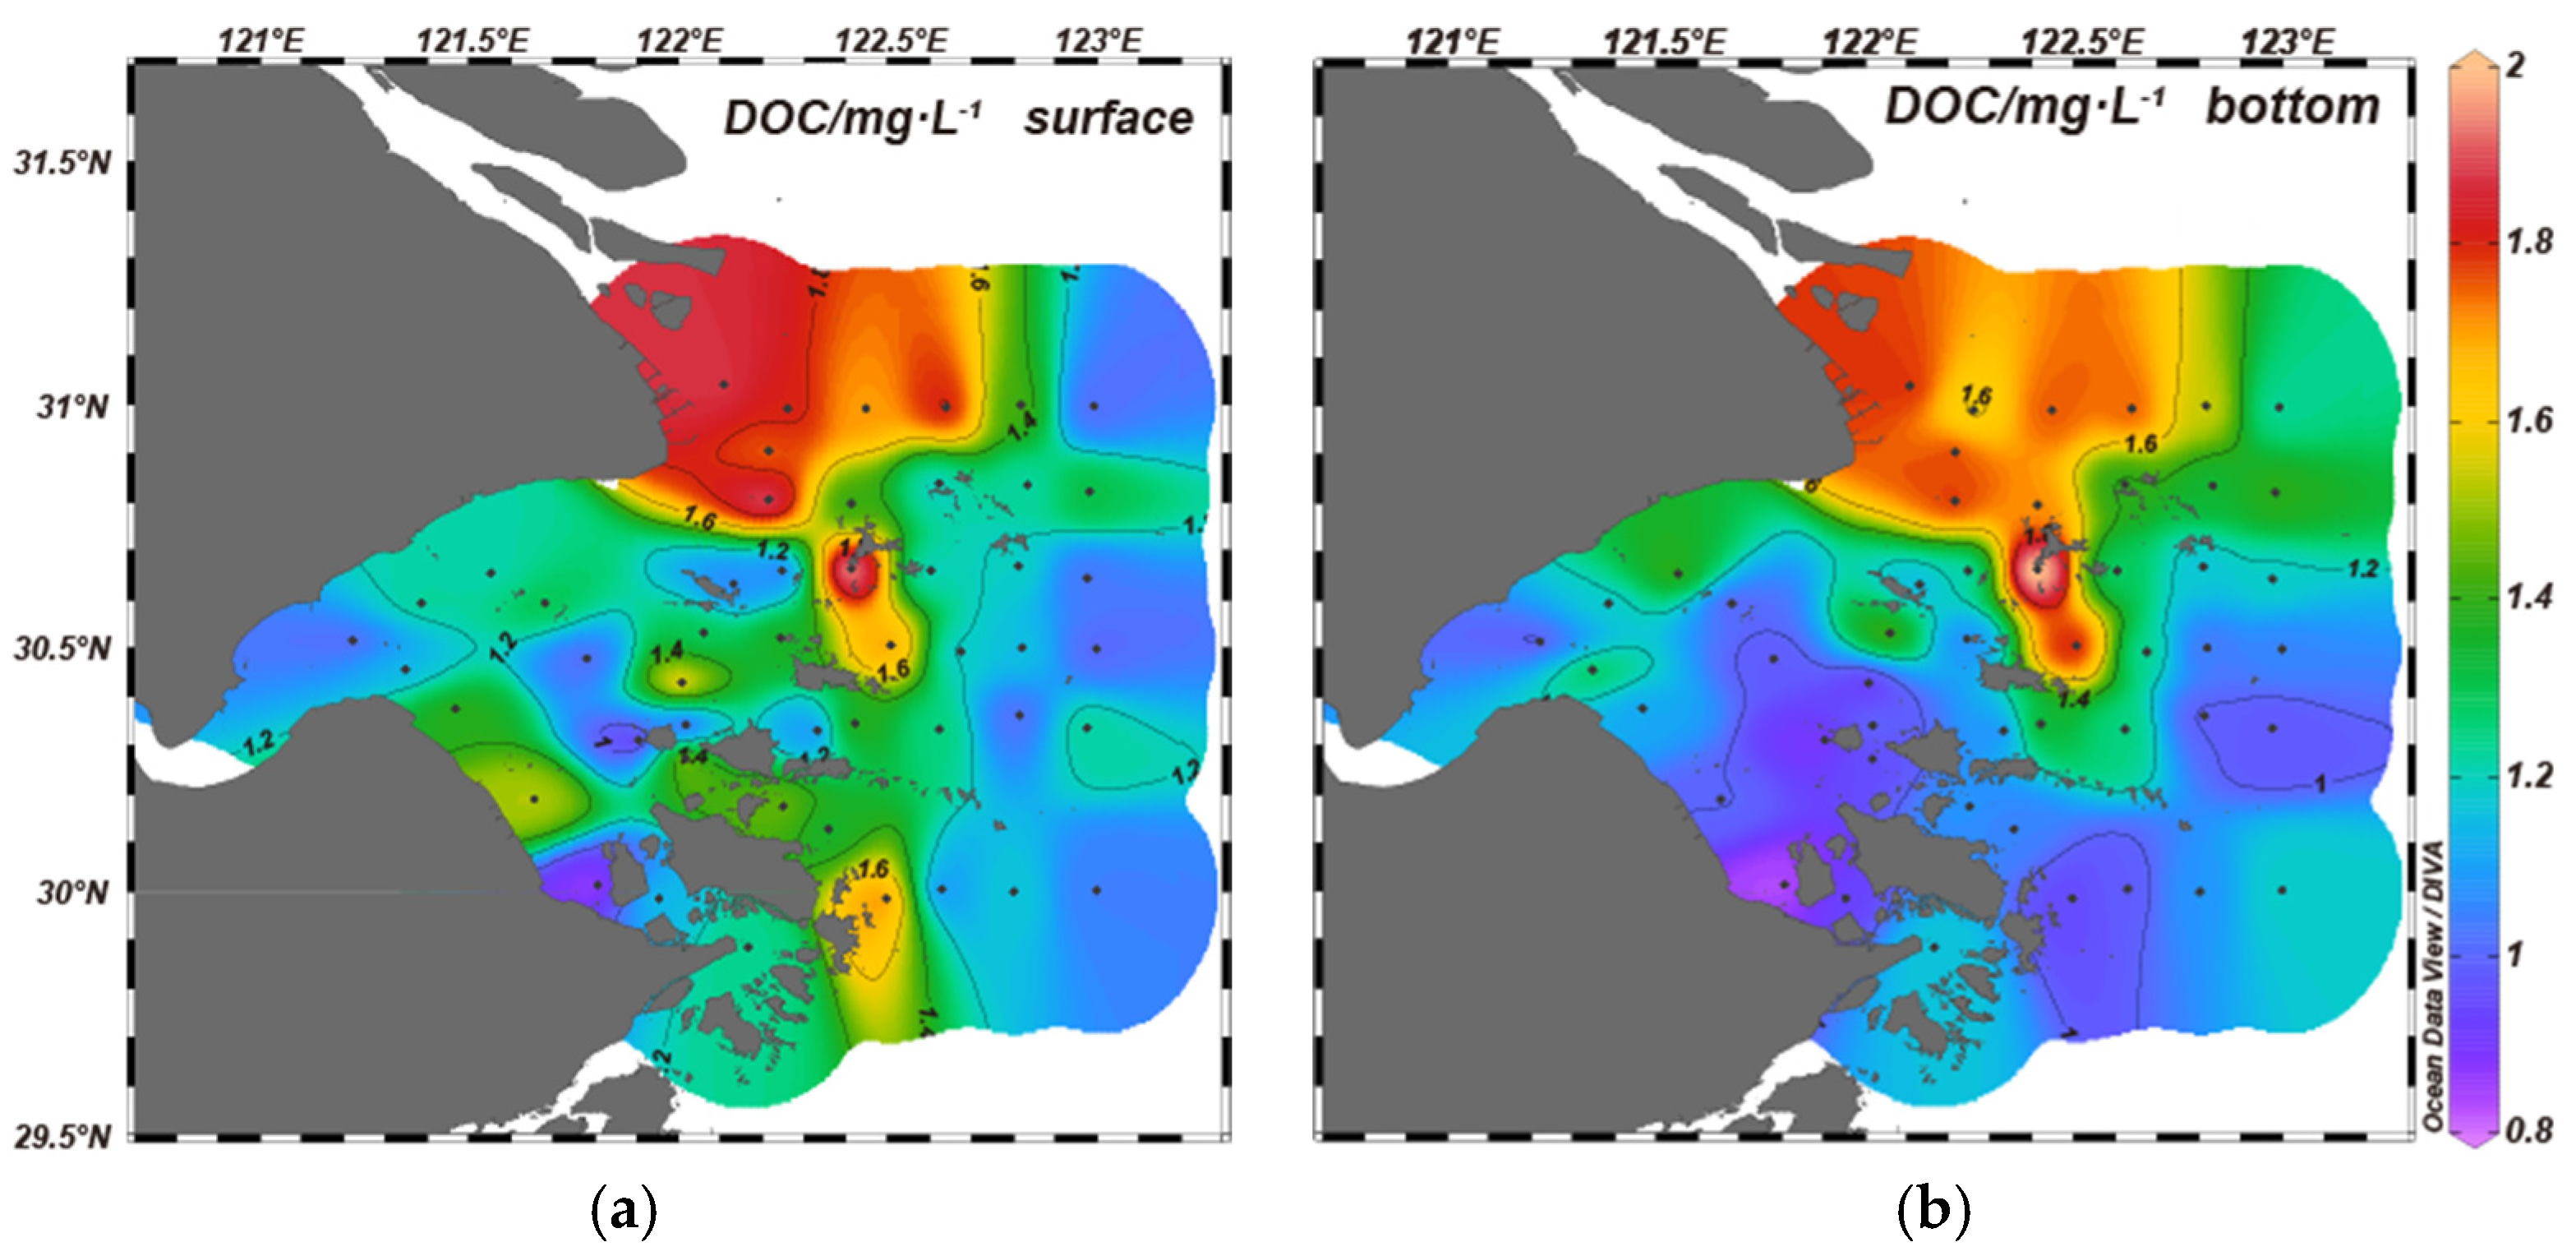
Figure 4.
Distributions of CDOM absorption coefficients in surface-water (left) and bottom-water (right). (a) a254; (b) a355; and (c) SUVA254.
Figure 4.
Distributions of CDOM absorption coefficients in surface-water (left) and bottom-water (right). (a) a254; (b) a355; and (c) SUVA254.
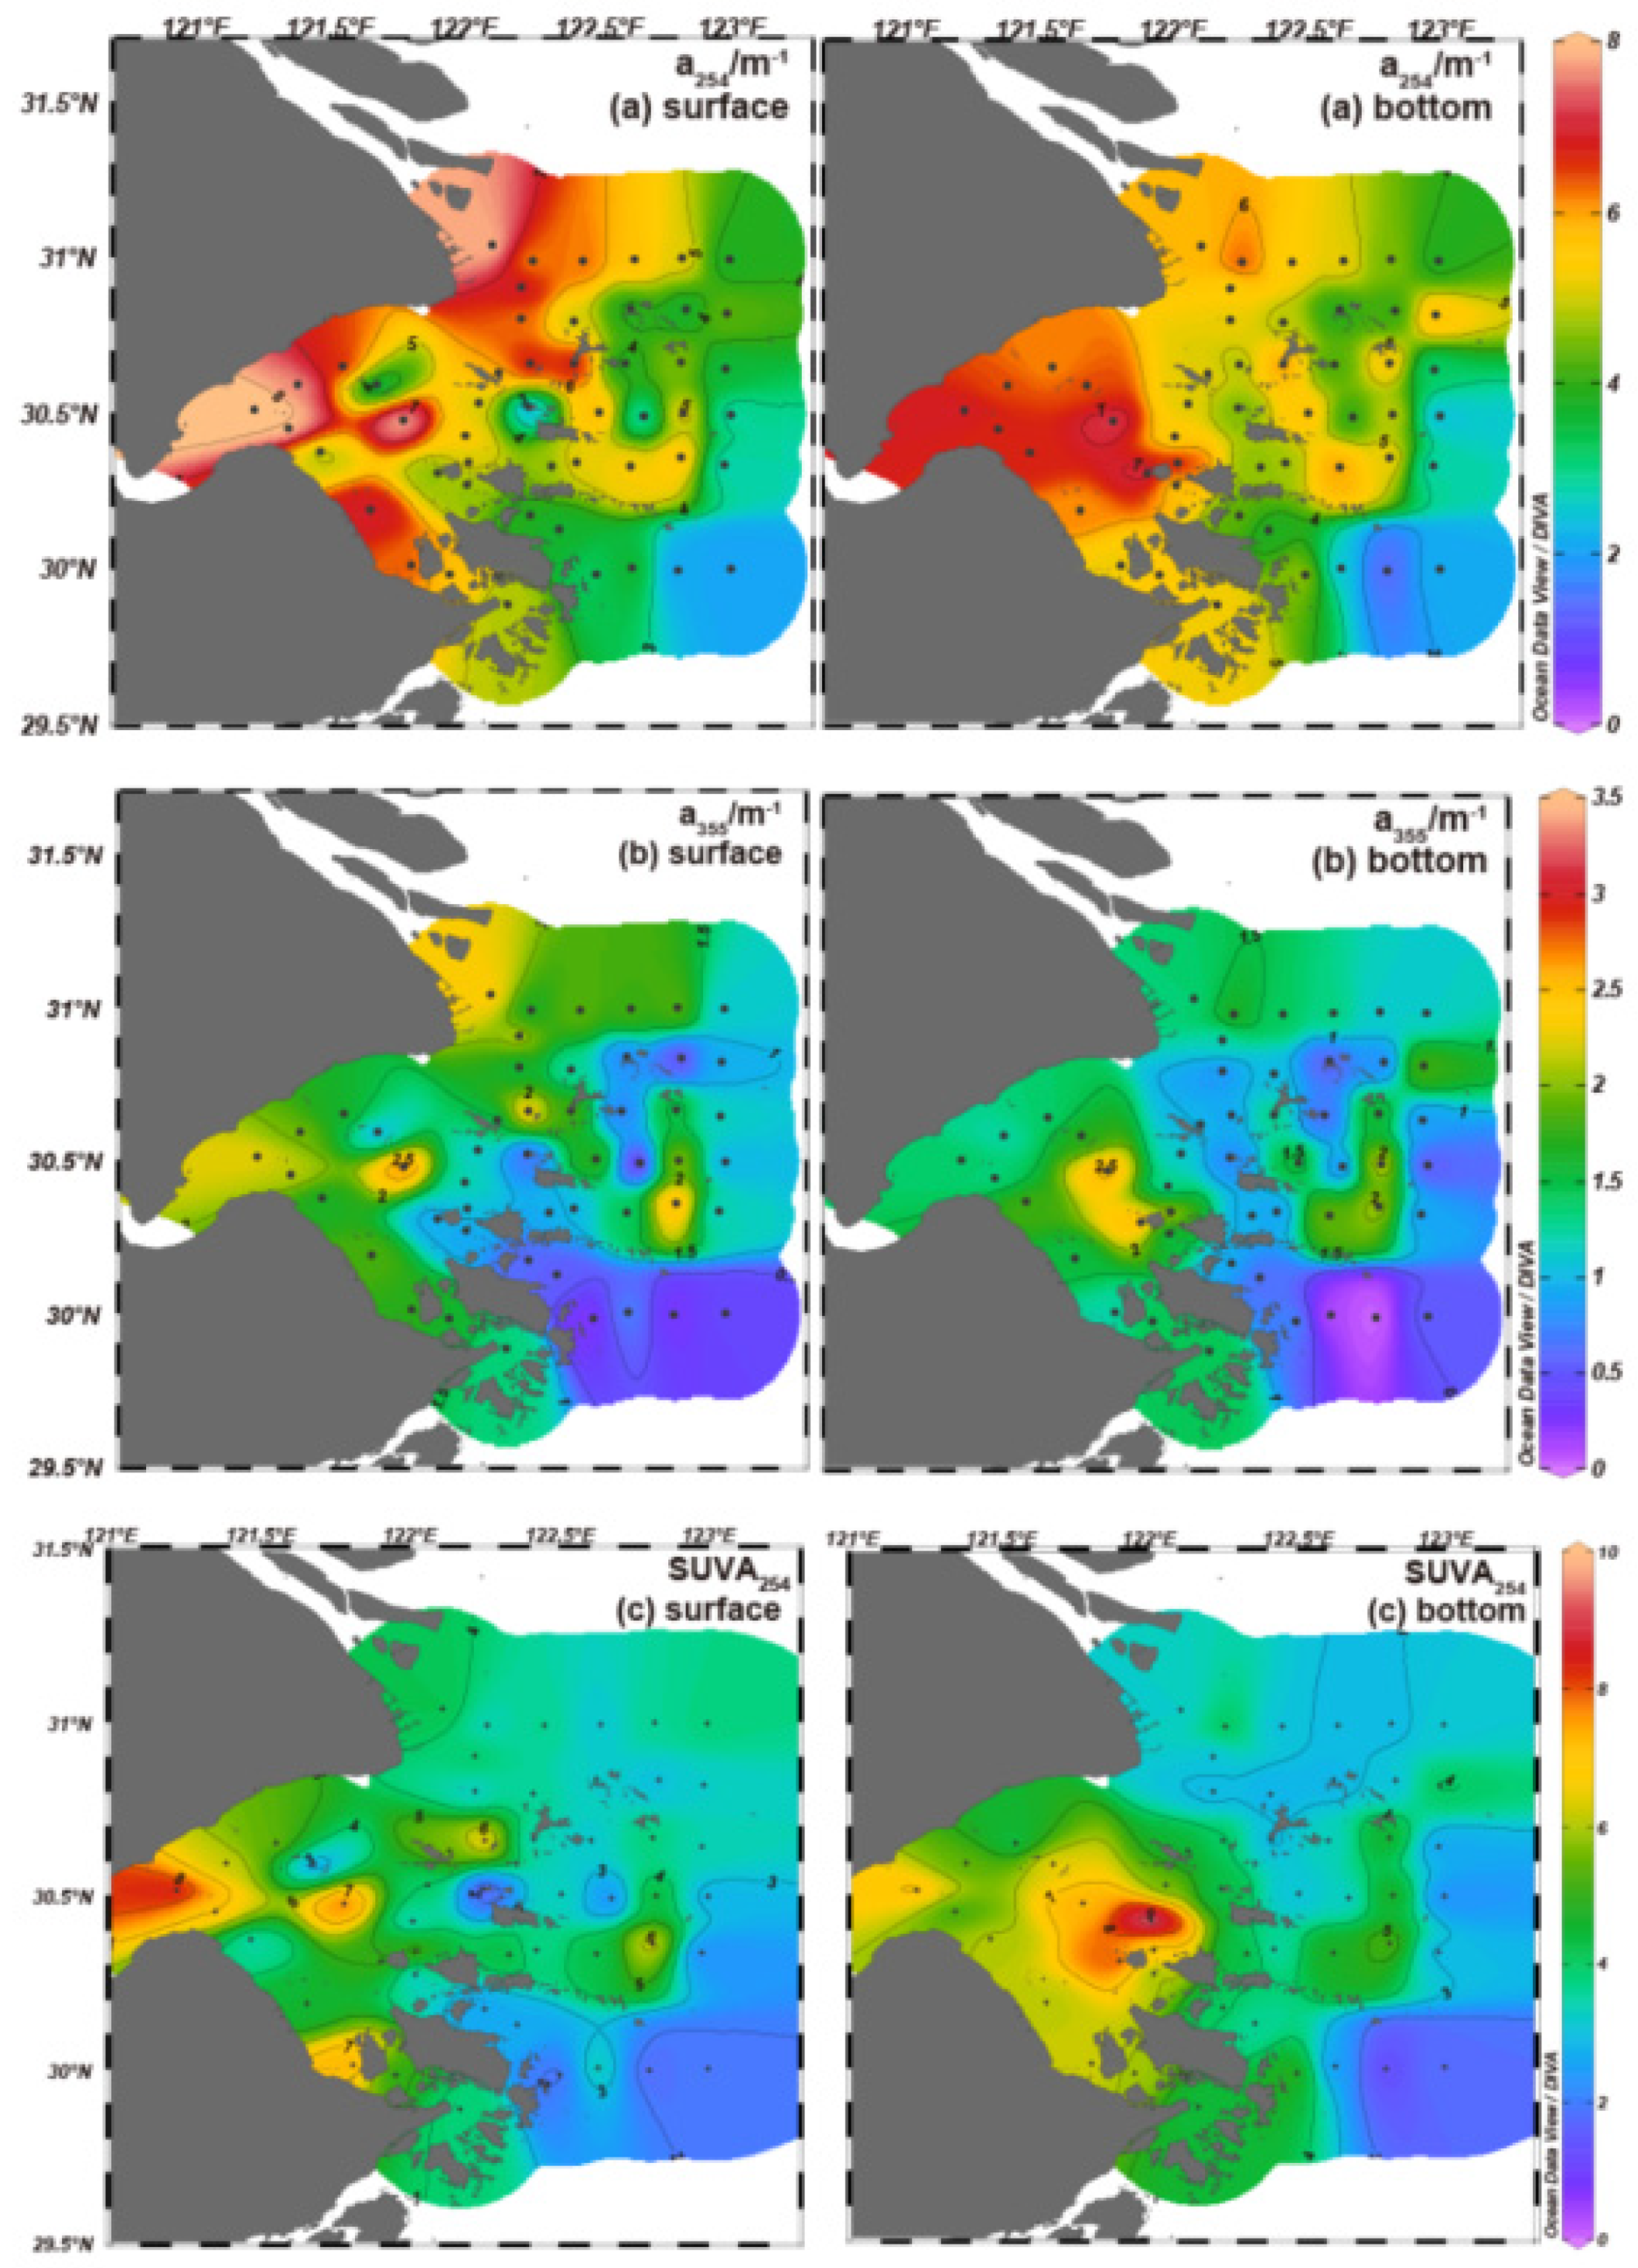
Figure 5.
The FDOM indexes distribution in the HZB and adjacent seas. (a) humification index (HIX); (b) biological index (BIX).
Figure 5.
The FDOM indexes distribution in the HZB and adjacent seas. (a) humification index (HIX); (b) biological index (BIX).
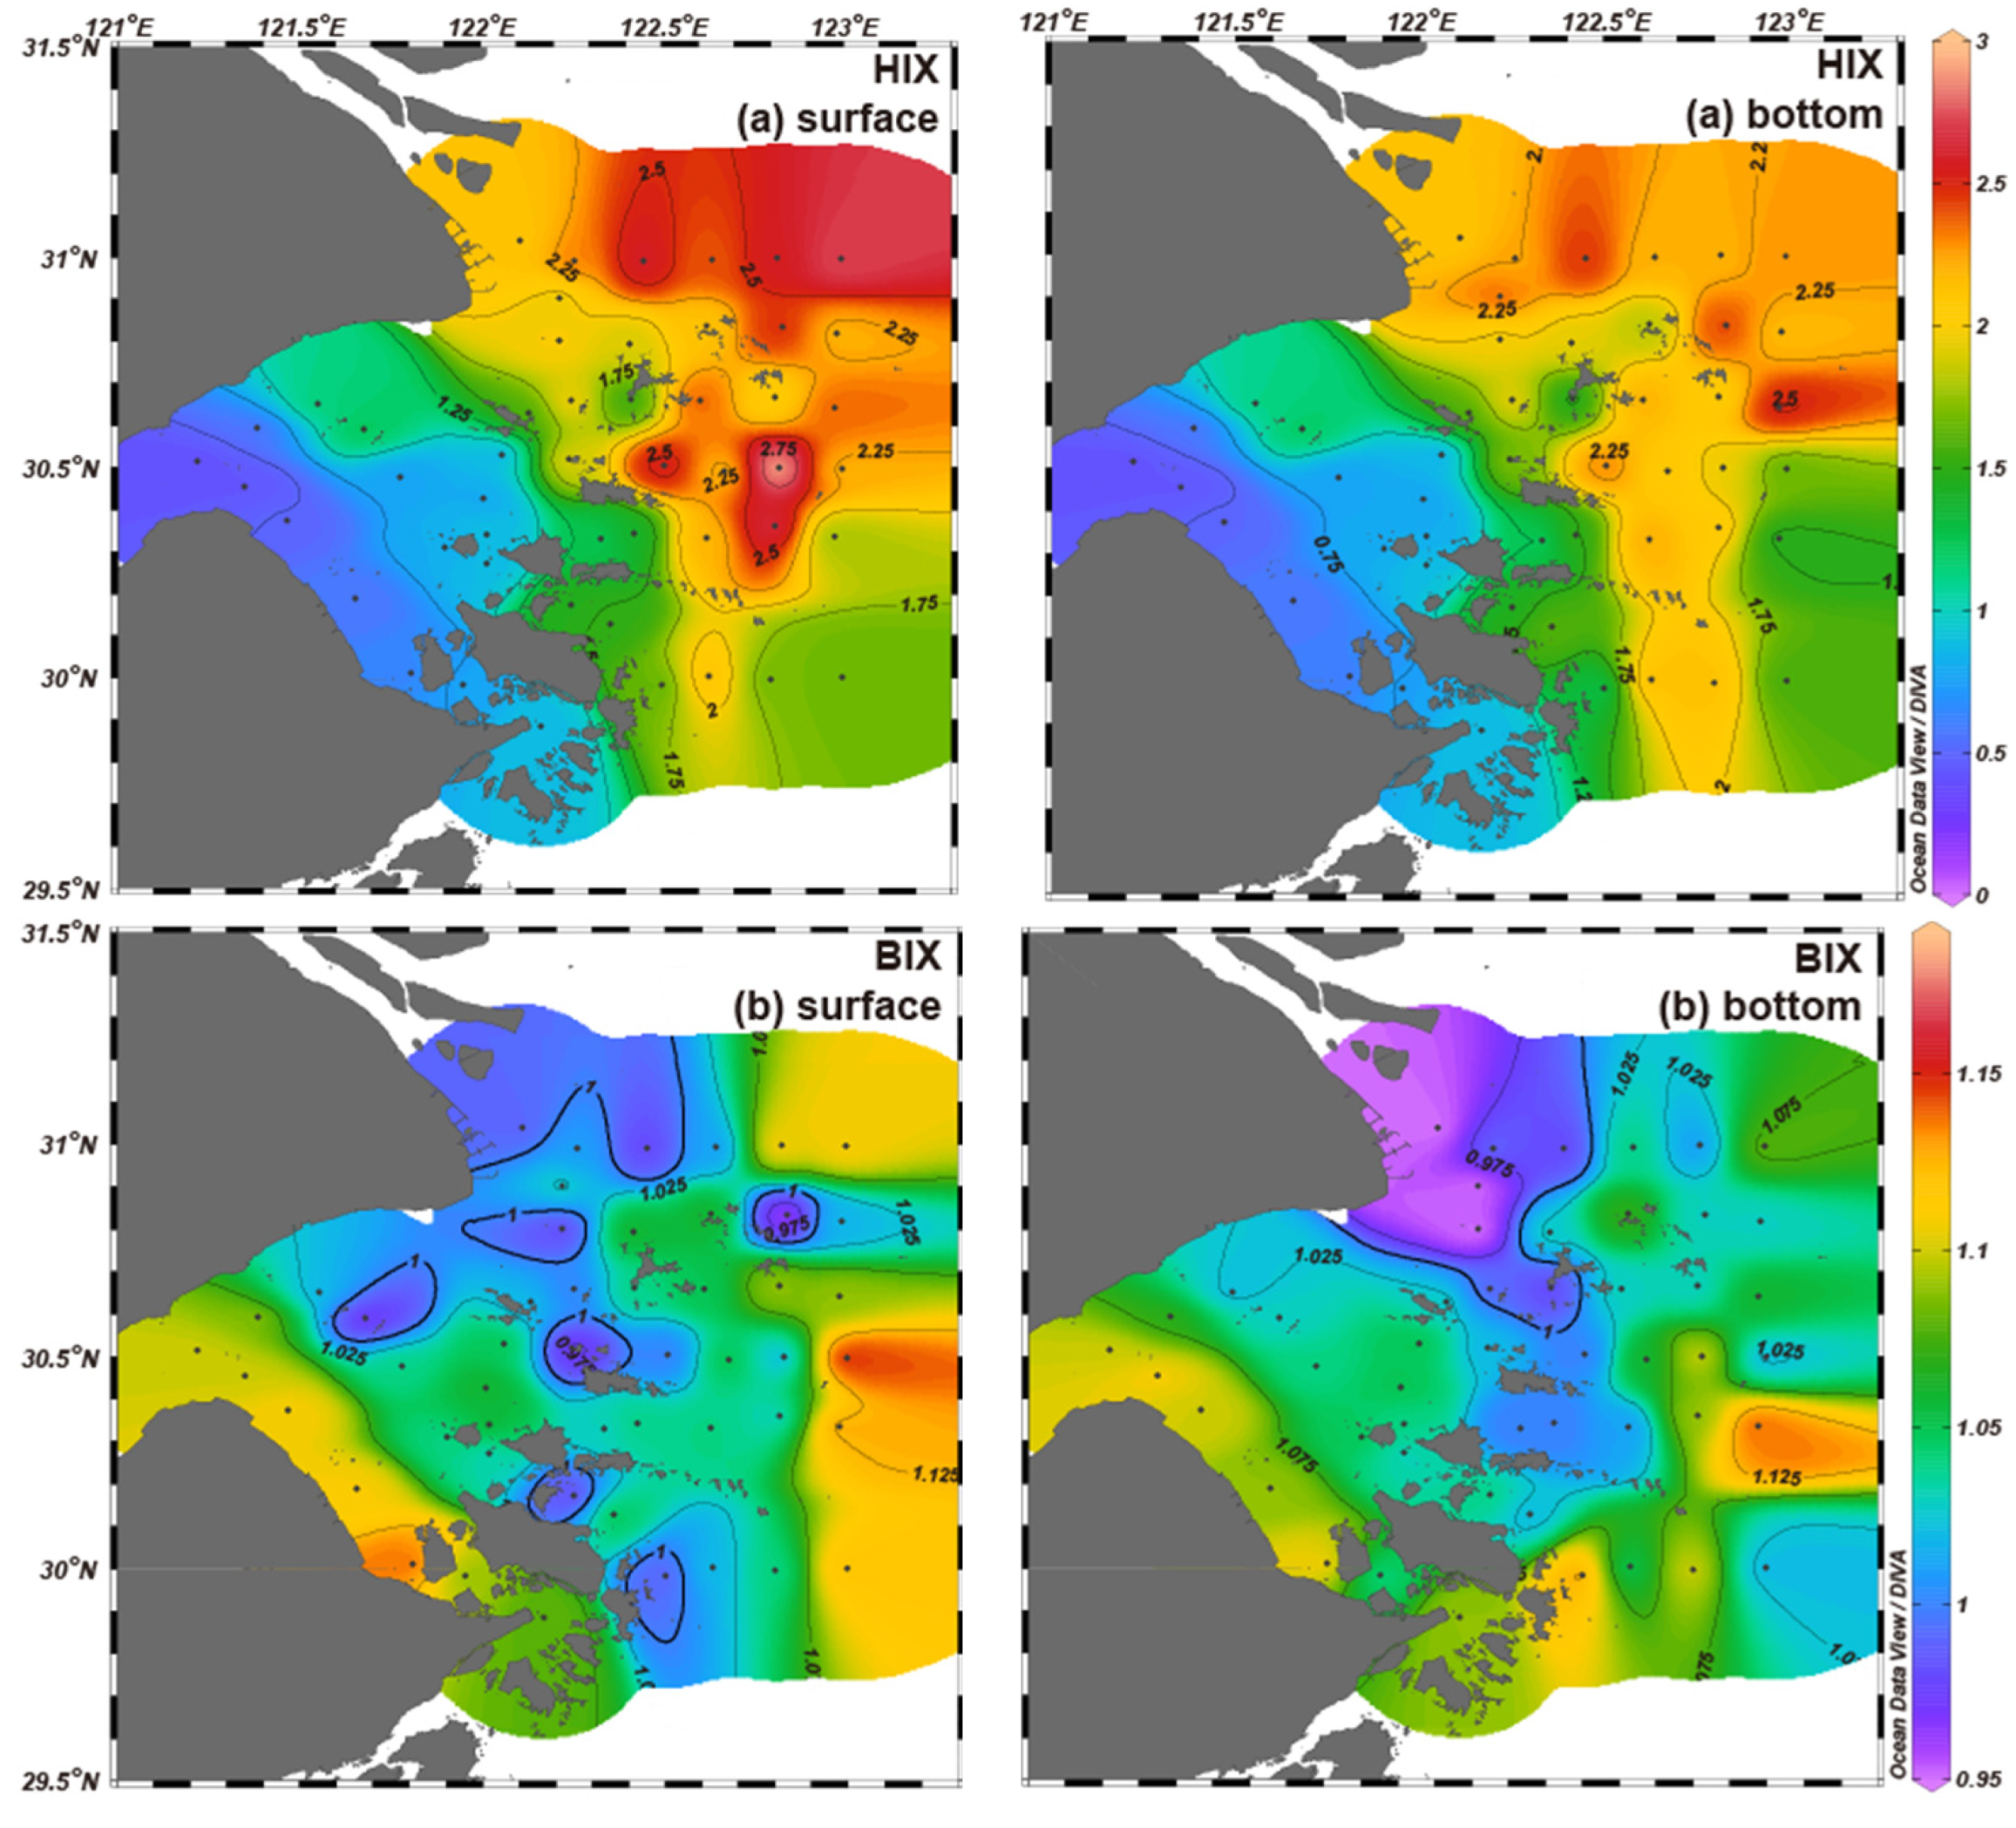
Figure 6.
The 3D-fluorescence spectroscopy, signature peak, Ex/Em, and molecular characteristics [34] of the three FDOM components. (a) C1; (b) C2; (c) C3.
Figure 6.
The 3D-fluorescence spectroscopy, signature peak, Ex/Em, and molecular characteristics [34] of the three FDOM components. (a) C1; (b) C2; (c) C3.
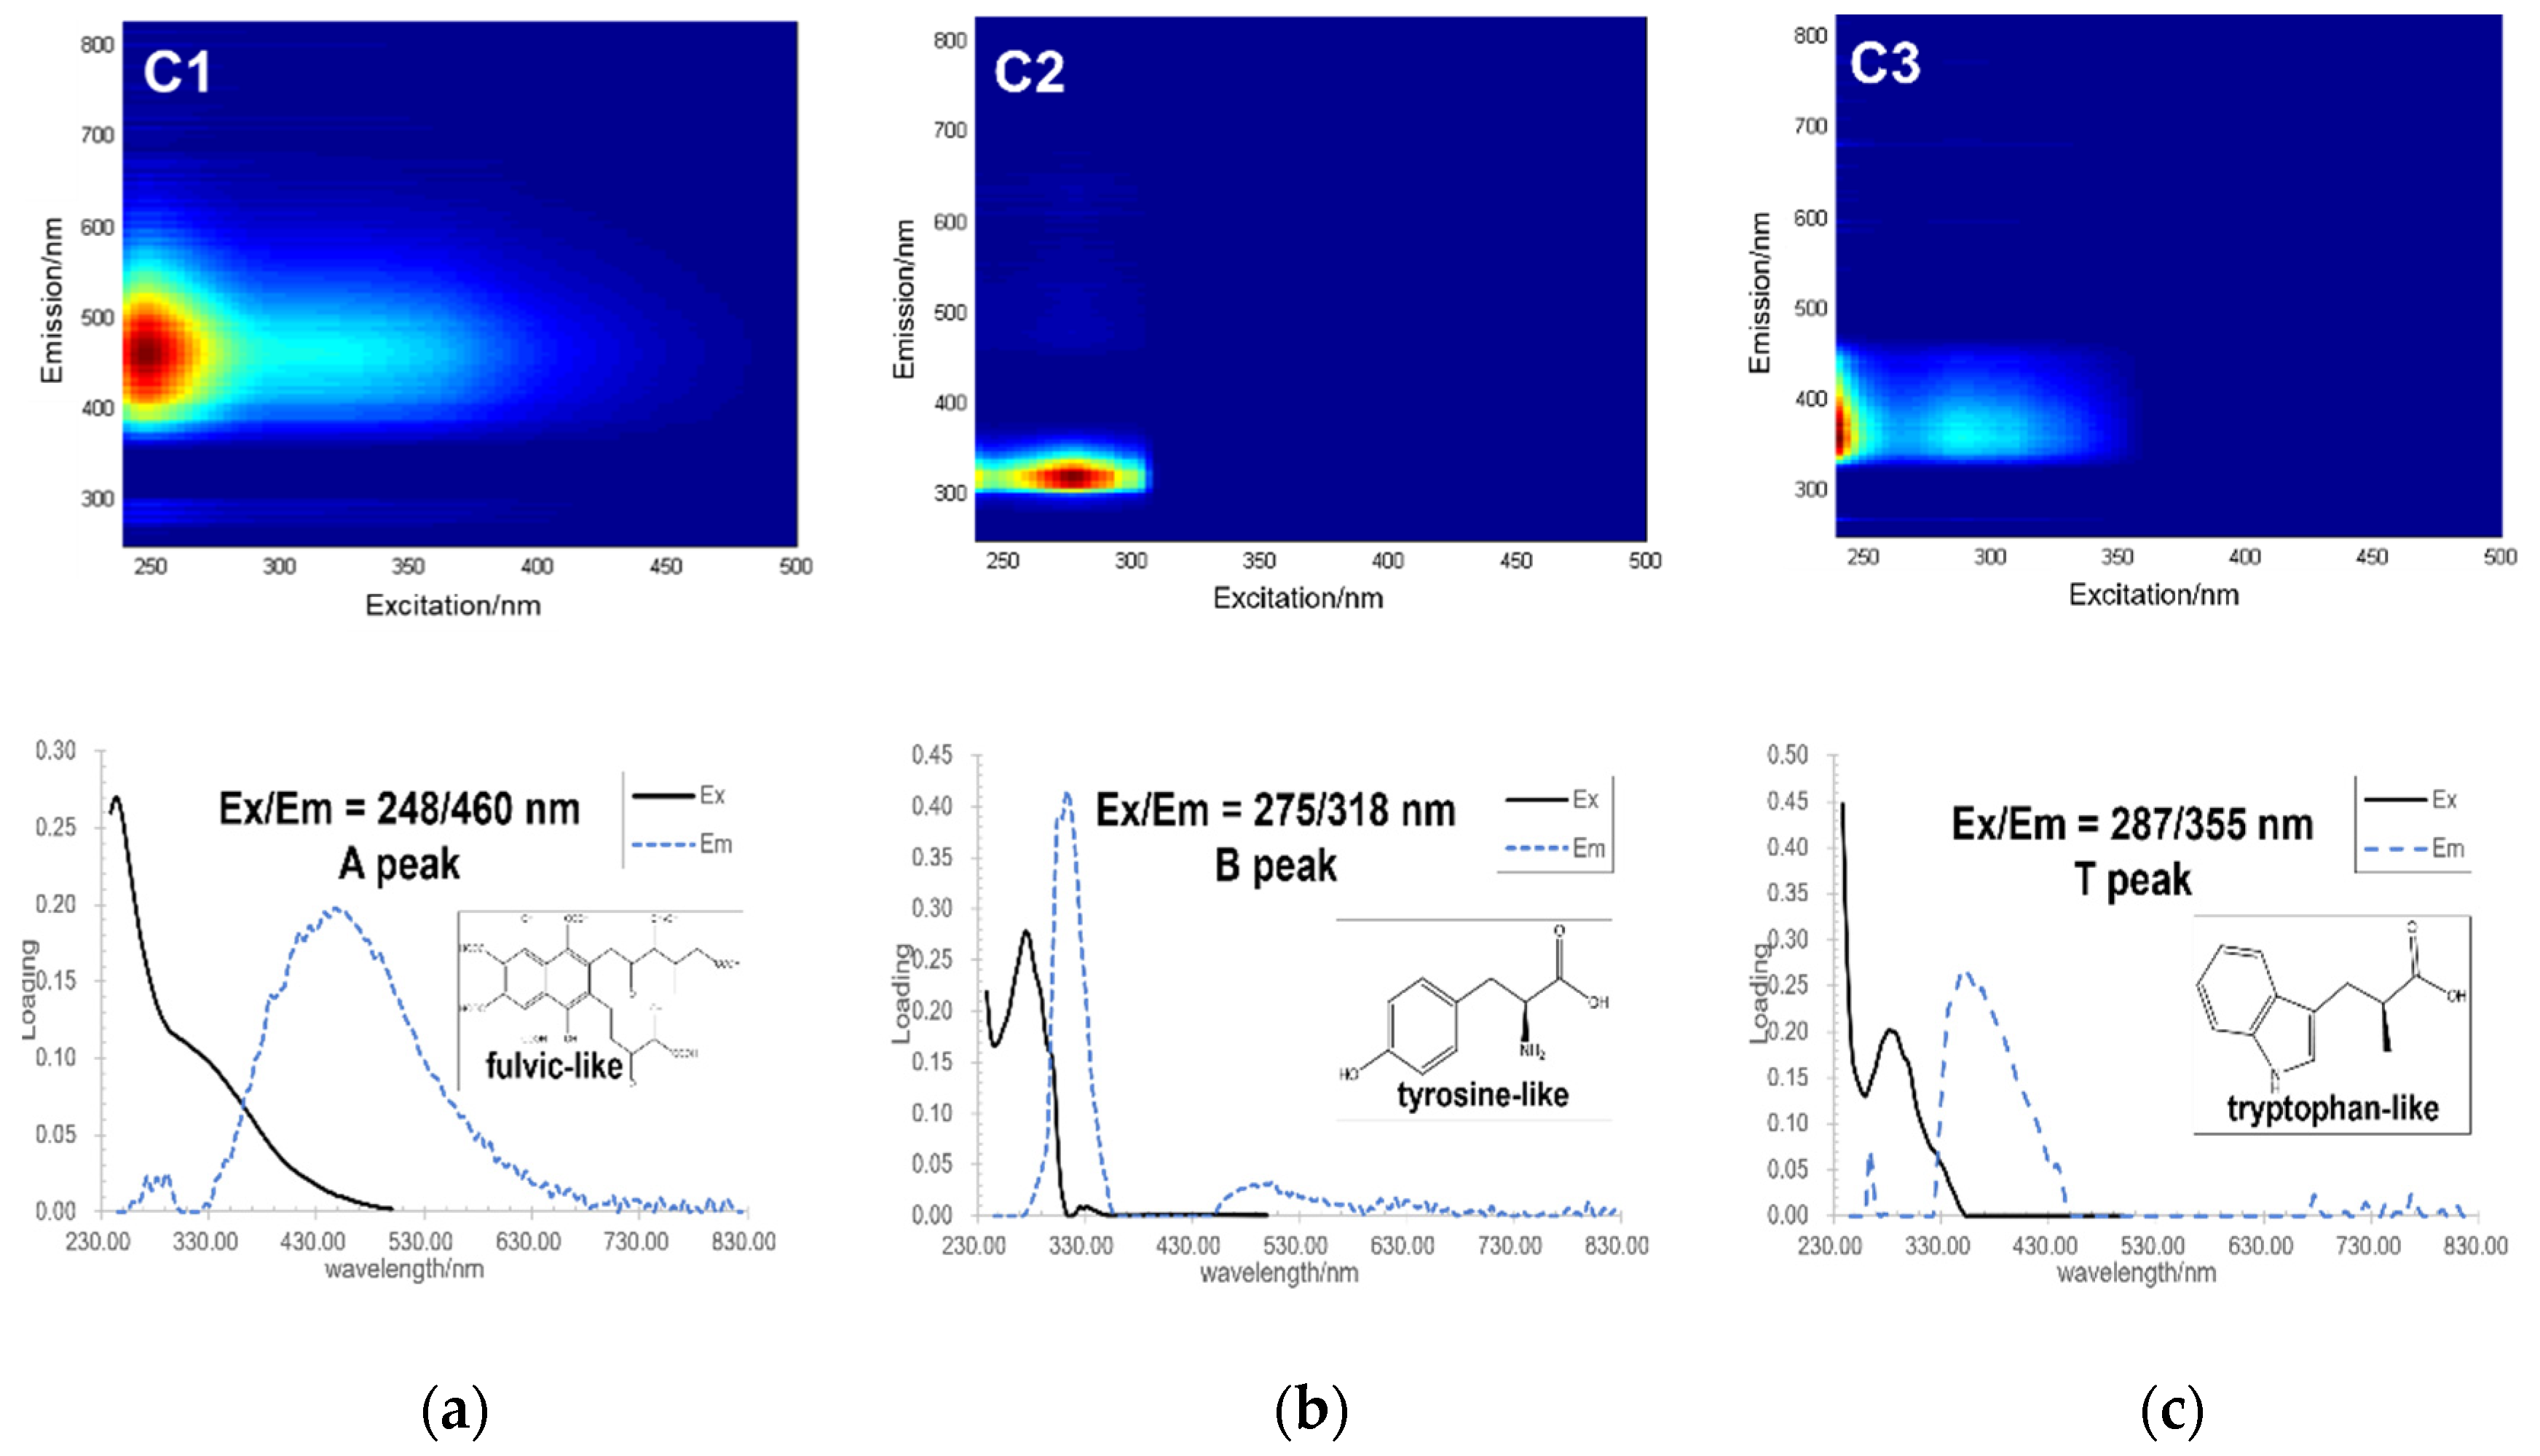
Figure 7.
The relative abundance of C1, C2, and C3 varies with salinity.
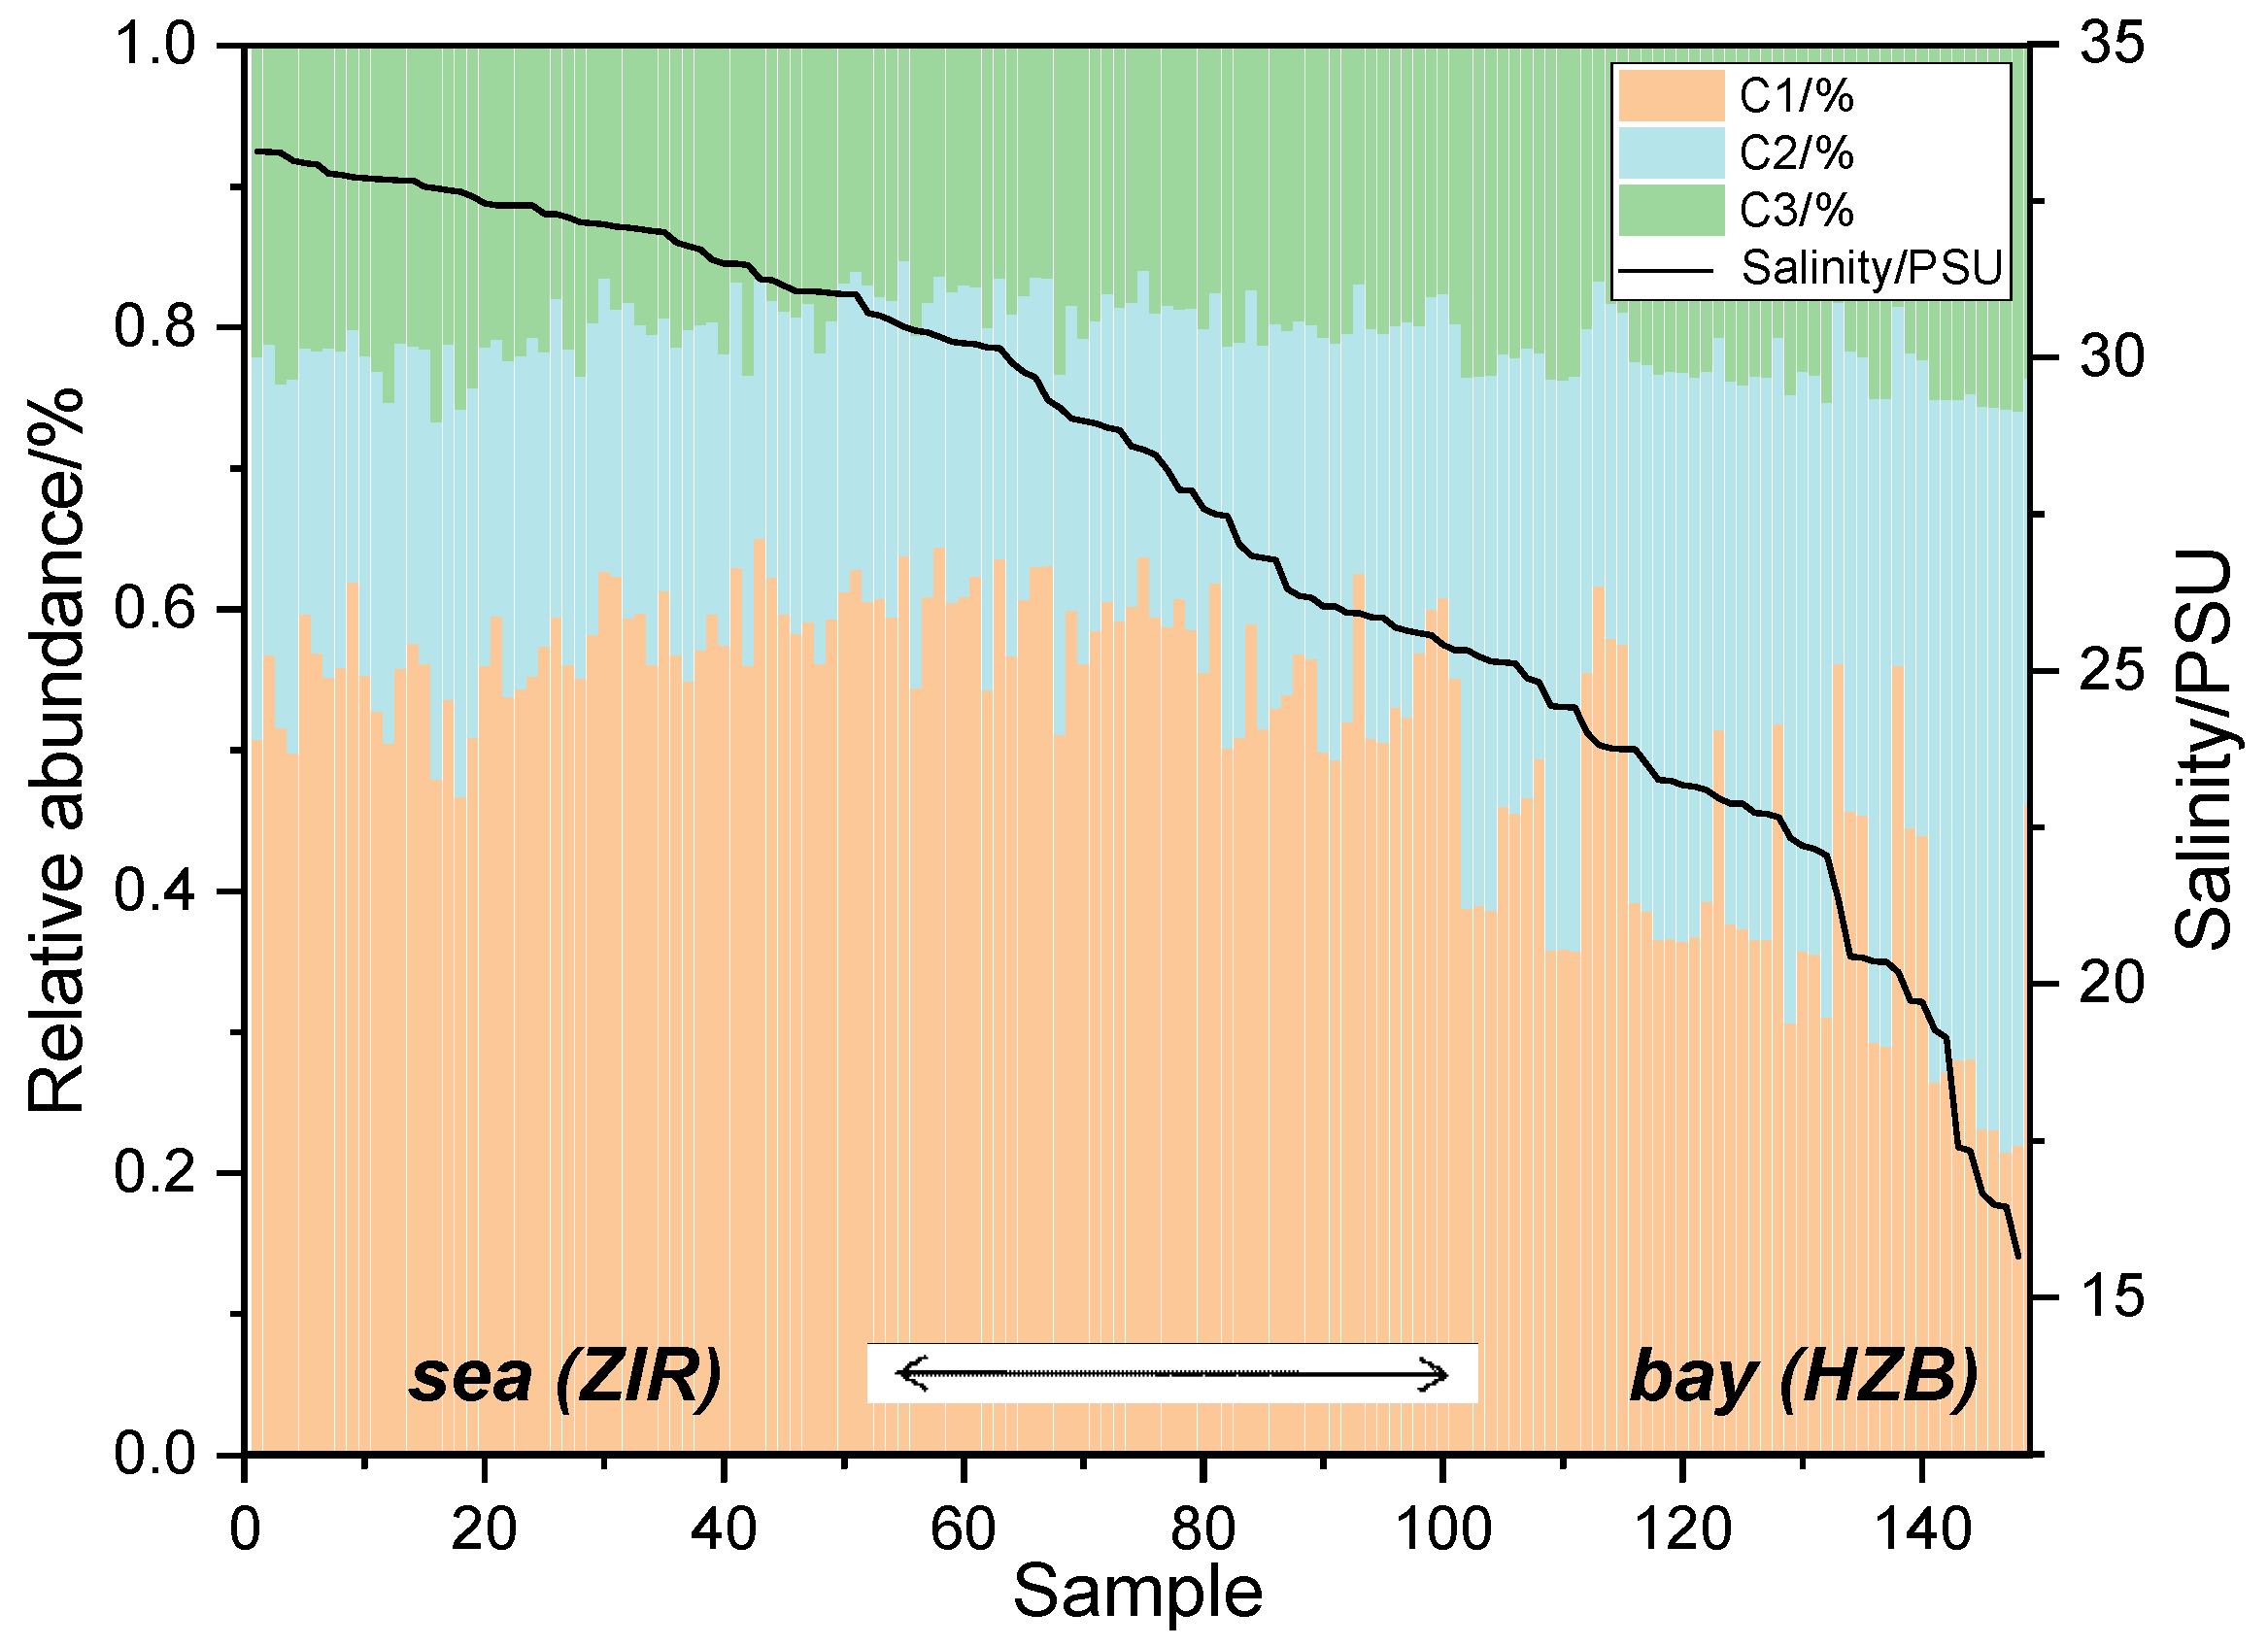
Figure 8.
(a - b) Summary of C1+C2+C3 as the total fluorescence; (c - h) Distributions of surface and bottom C1, C2 and C3 components abundance in the HZB and adjacent seas (with the same color bar).
Figure 8.
(a - b) Summary of C1+C2+C3 as the total fluorescence; (c - h) Distributions of surface and bottom C1, C2 and C3 components abundance in the HZB and adjacent seas (with the same color bar).
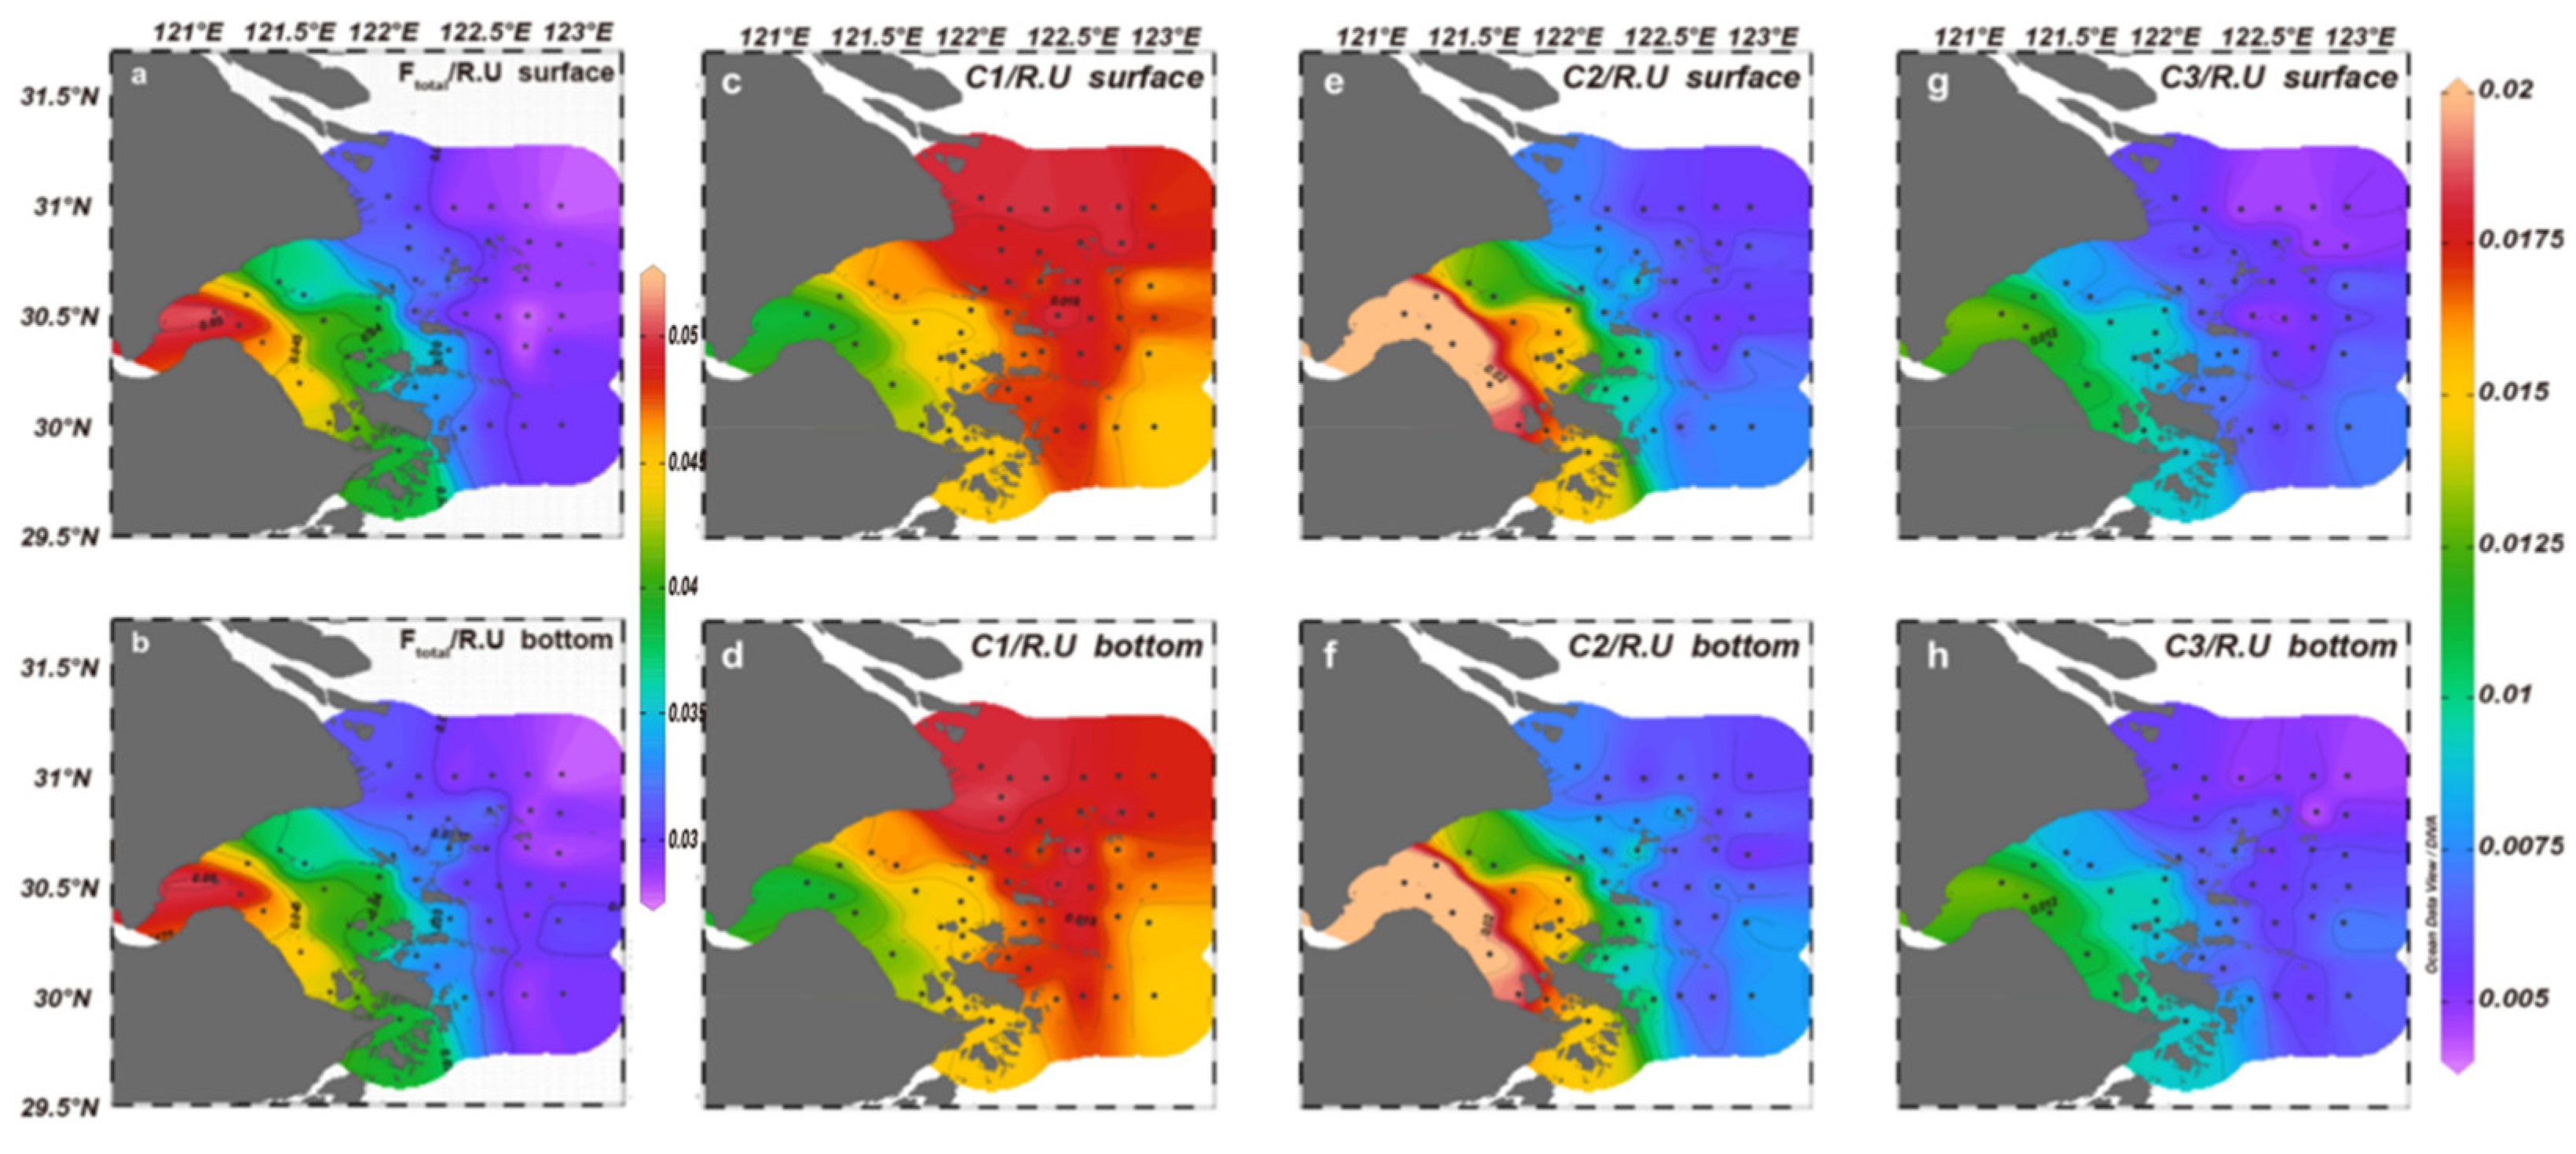
Figure 9.
Absolute abundance of FDOM components C1, C2, and C3 in HZB and its adjacent areas.
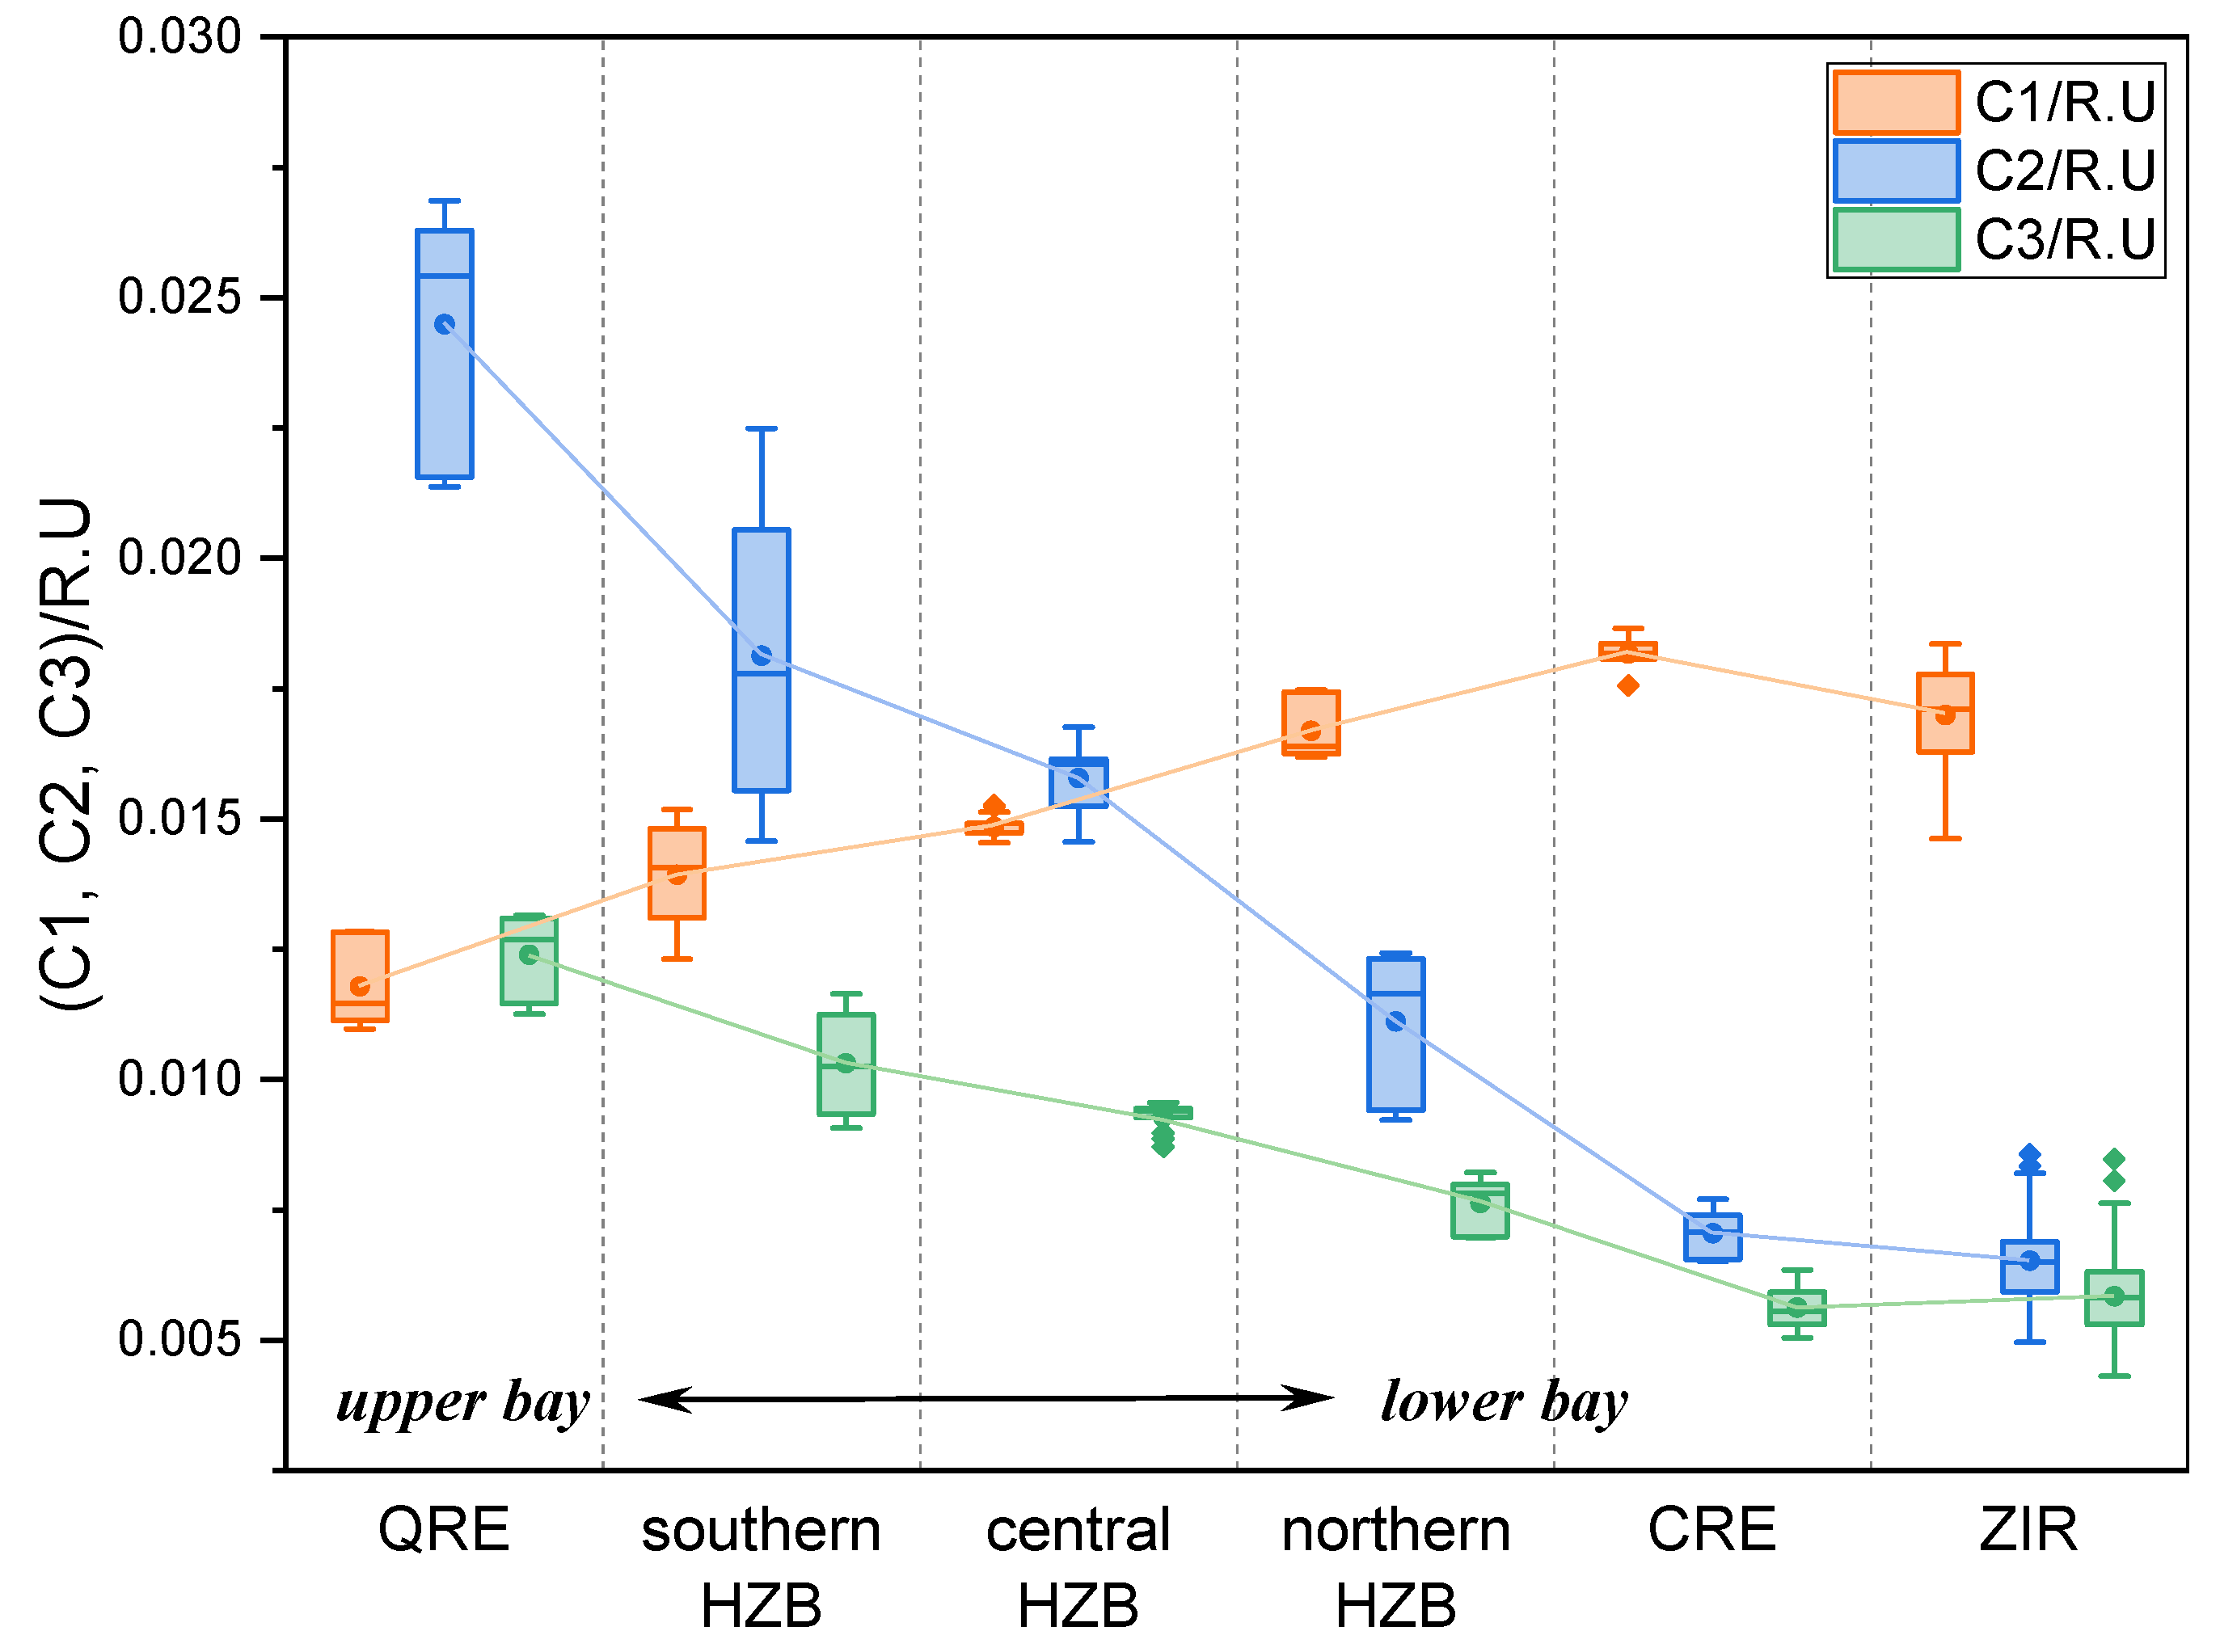
Figure 10.
DOC, CDOM and FDOM parameters in study area. (a) DOC concentration; (b) CDOM at 355nm; (c) Total FDOM; (d) CDOM SR; (e) a 254; (f) SUVA 254; (g) FI; (h) HIX; (i) BIX in the study area. QRE included stations E1, E2, and CE3; southern HZB was the nearshore section from E1 to E6 to ZJD12031; northern and central HZB was the mixed bay area influenced by CDW; CRE included stations B3, B4, and B4-0; ZIR included seawater samples in Zhoushan Islands Region (salinity > 27.5).
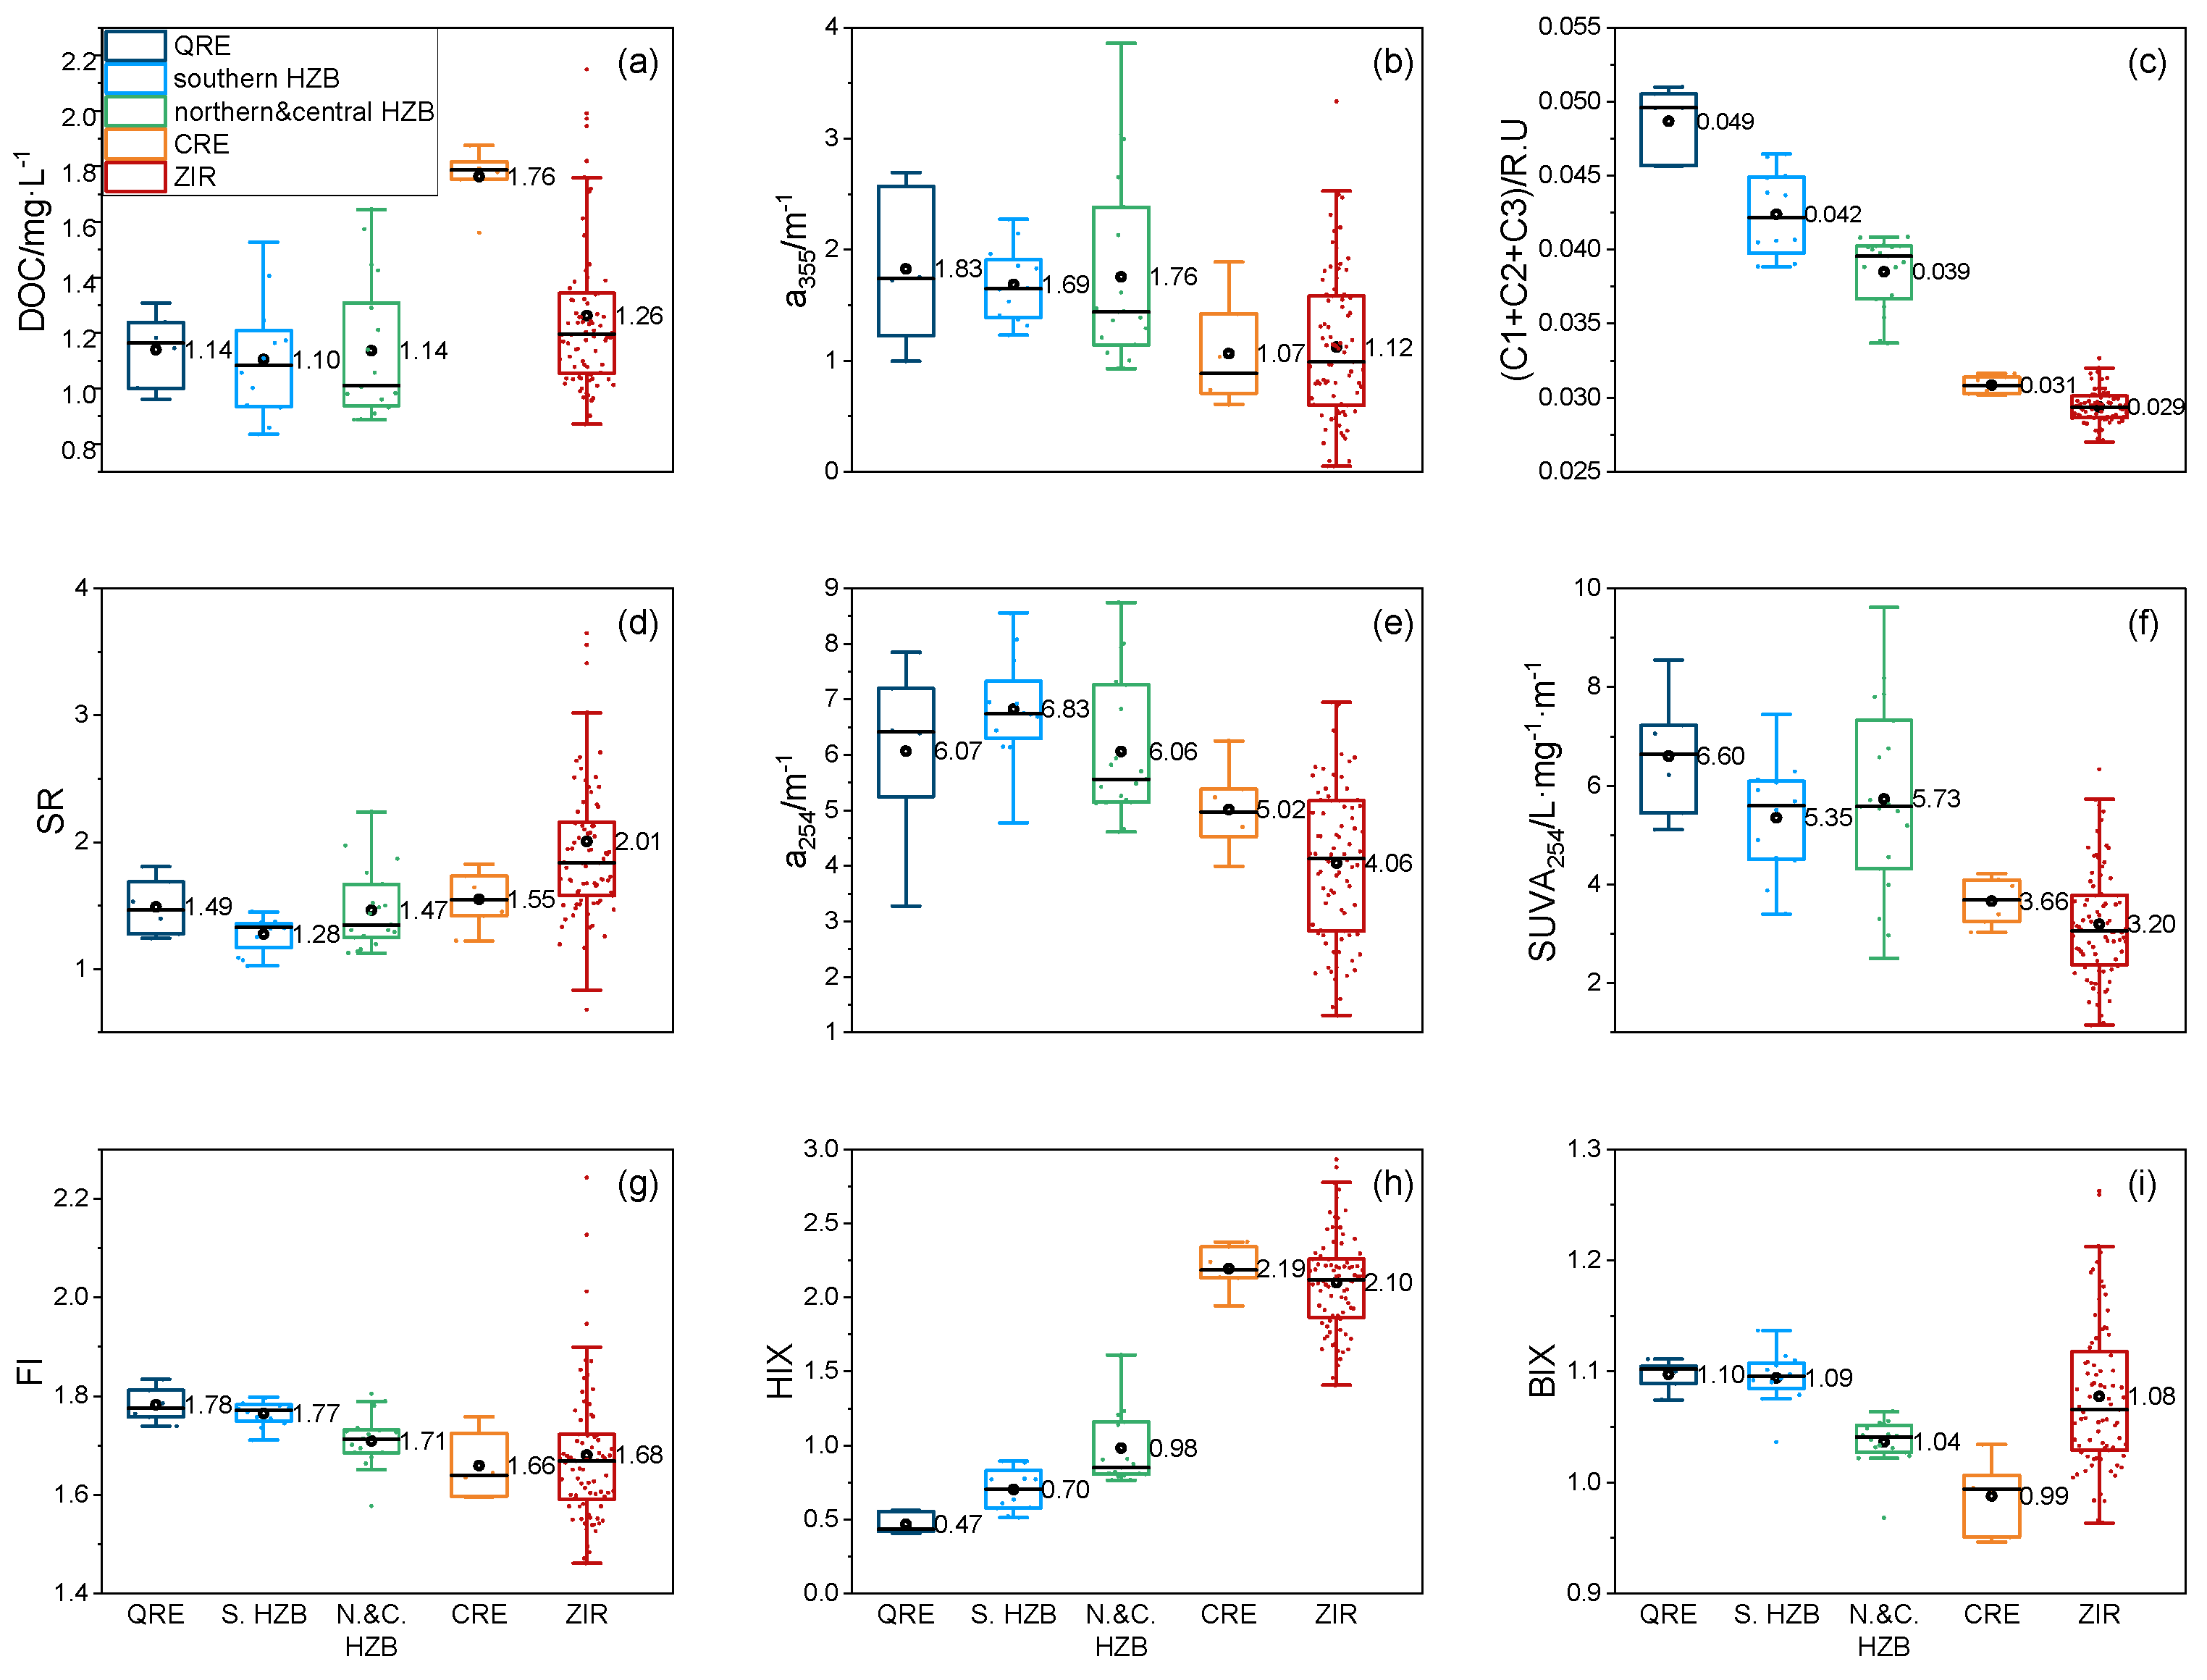
Figure 11.
The distinct difference of DOM composition and characteristics in study areas indicated by PCA analysis (ZIR samples did not put all in).
Figure 11.
The distinct difference of DOM composition and characteristics in study areas indicated by PCA analysis (ZIR samples did not put all in).
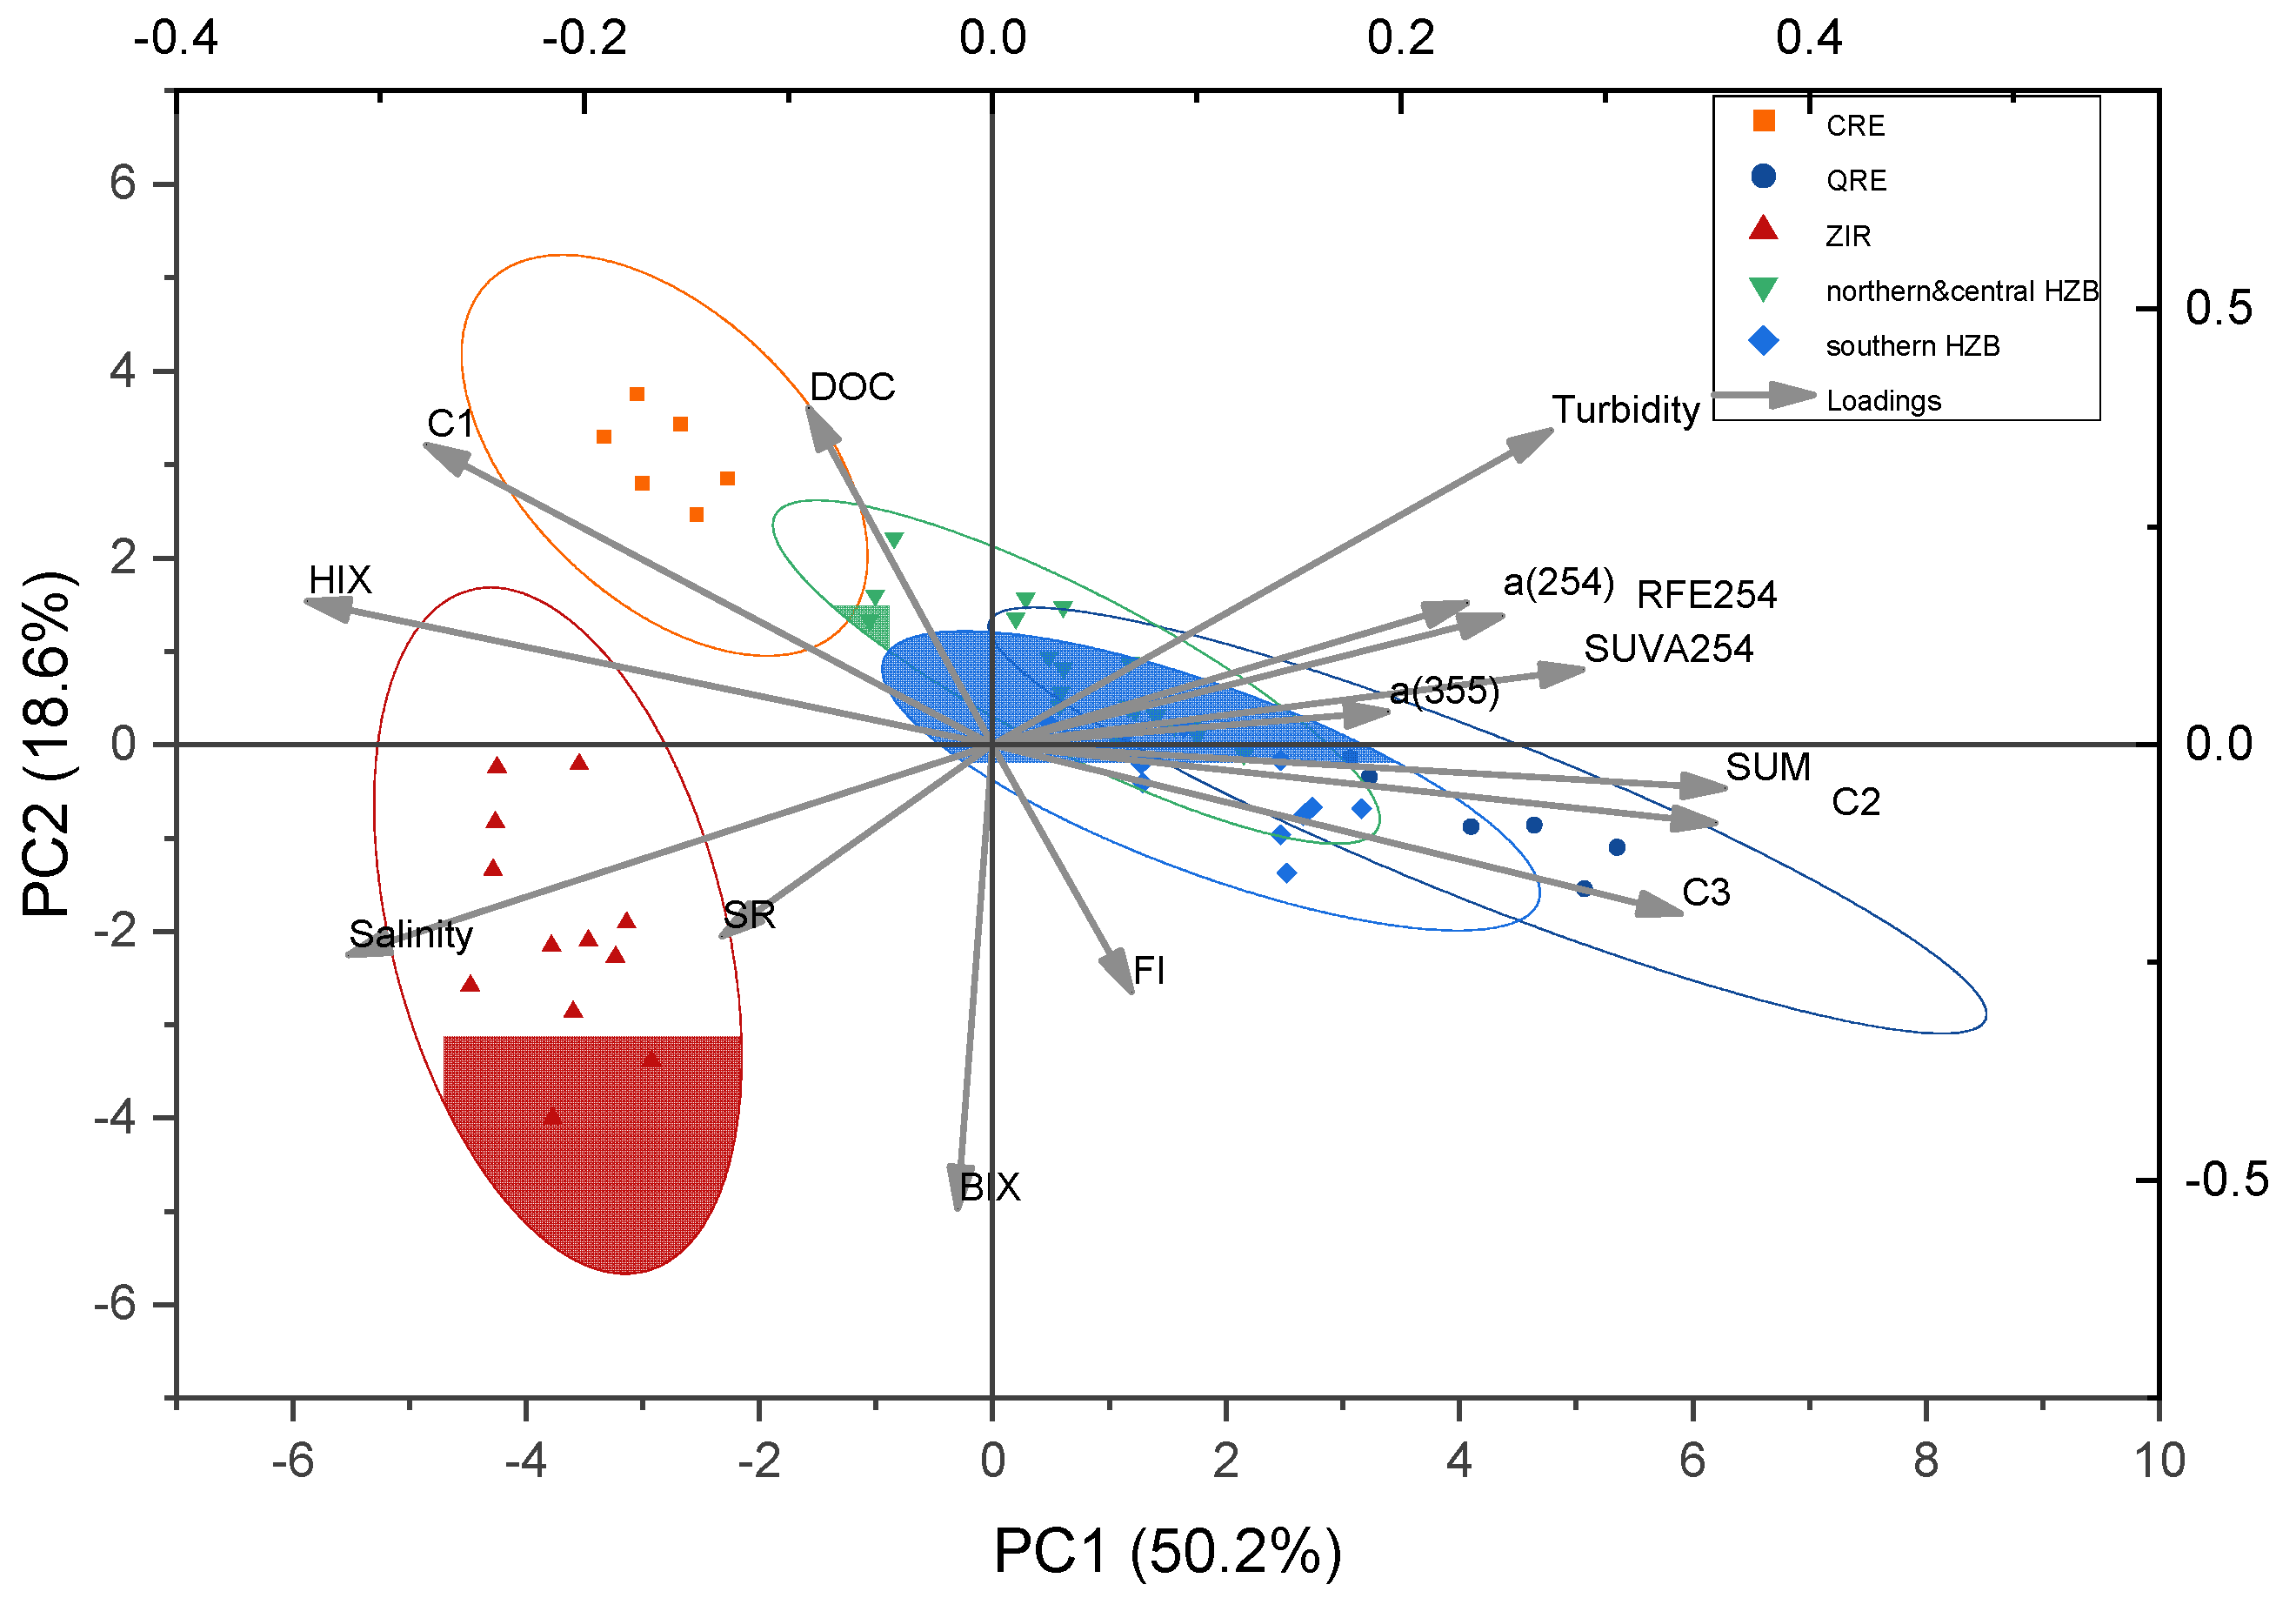
Figure 12.
T - S scheme in HZB and adjacent seas. (a) T-S scheme with density. The blue circle is the water mass of low density and high turbidity in stations E1, E2, and CE3 dominated by QTW; the orange circle is the water mass CDW with medium density and high turbidity in stations B3, B4 and B4-0; the red quadrangle is the water of high salinity (> 27.5), high density and low turbidity in ZIR [49]; (b) turbidity in study areas. HZB and CRE with turbidity > 400 FTU, ZIR with turbidity < 300 FTU.
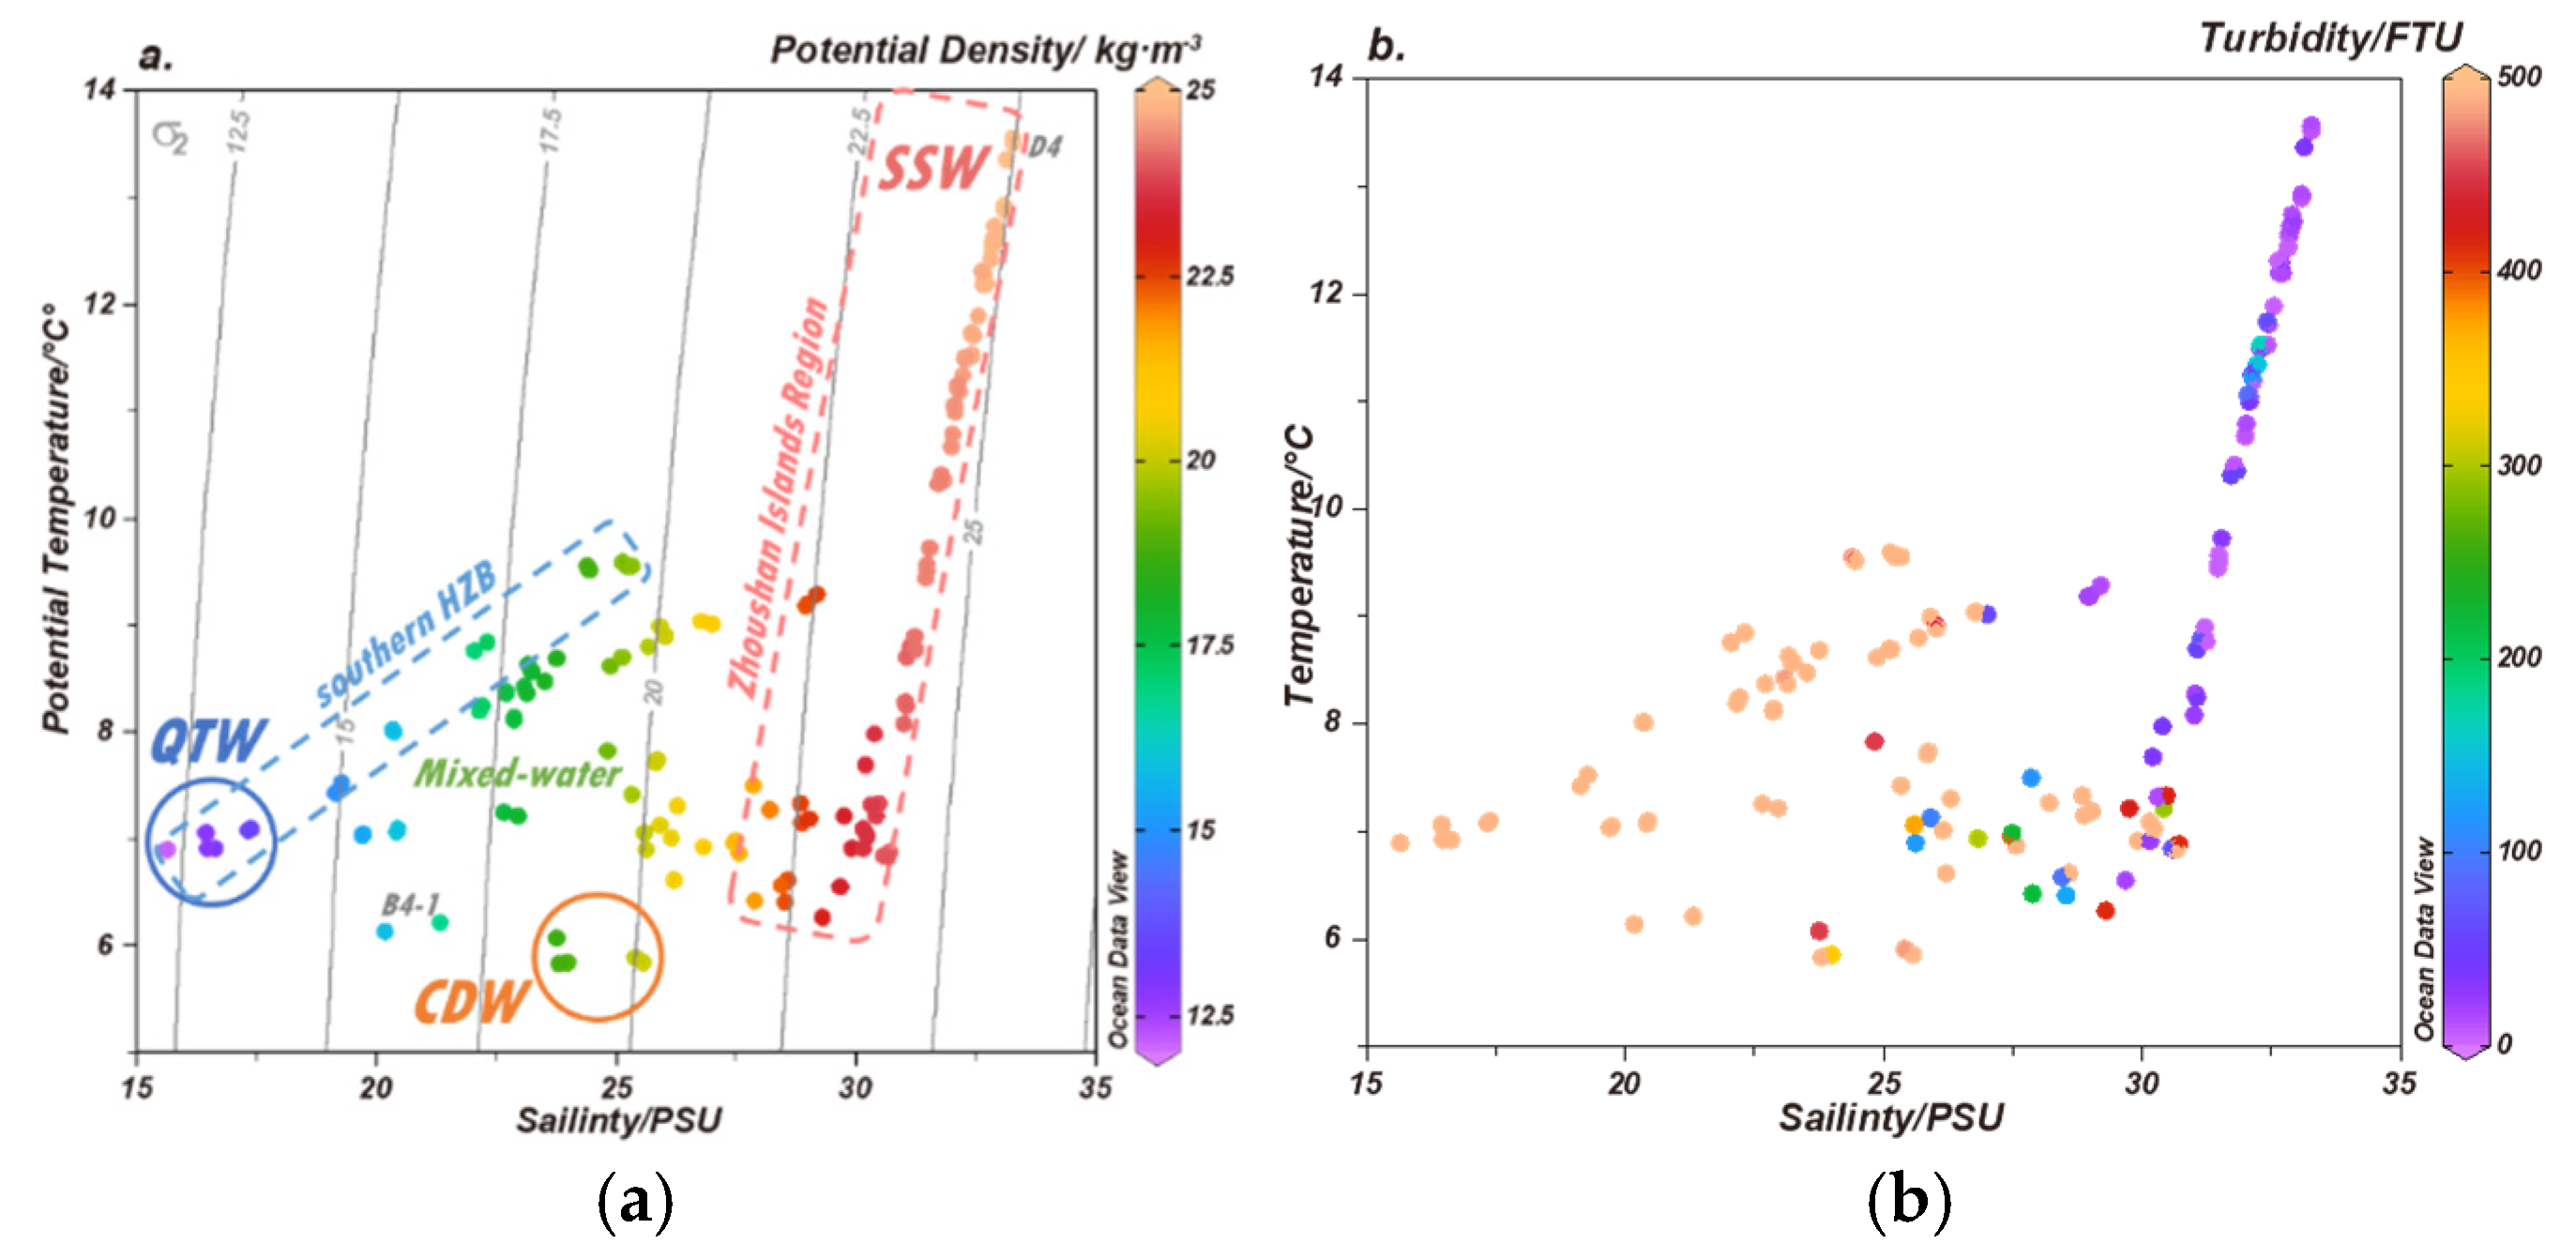
Figure 13.
The humic-like DOM component C1 varied with salinity in different study areas in winter. The pattern of protein-like DOM component C2 is supported in Figure S5.
Figure 13.
The humic-like DOM component C1 varied with salinity in different study areas in winter. The pattern of protein-like DOM component C2 is supported in Figure S5.
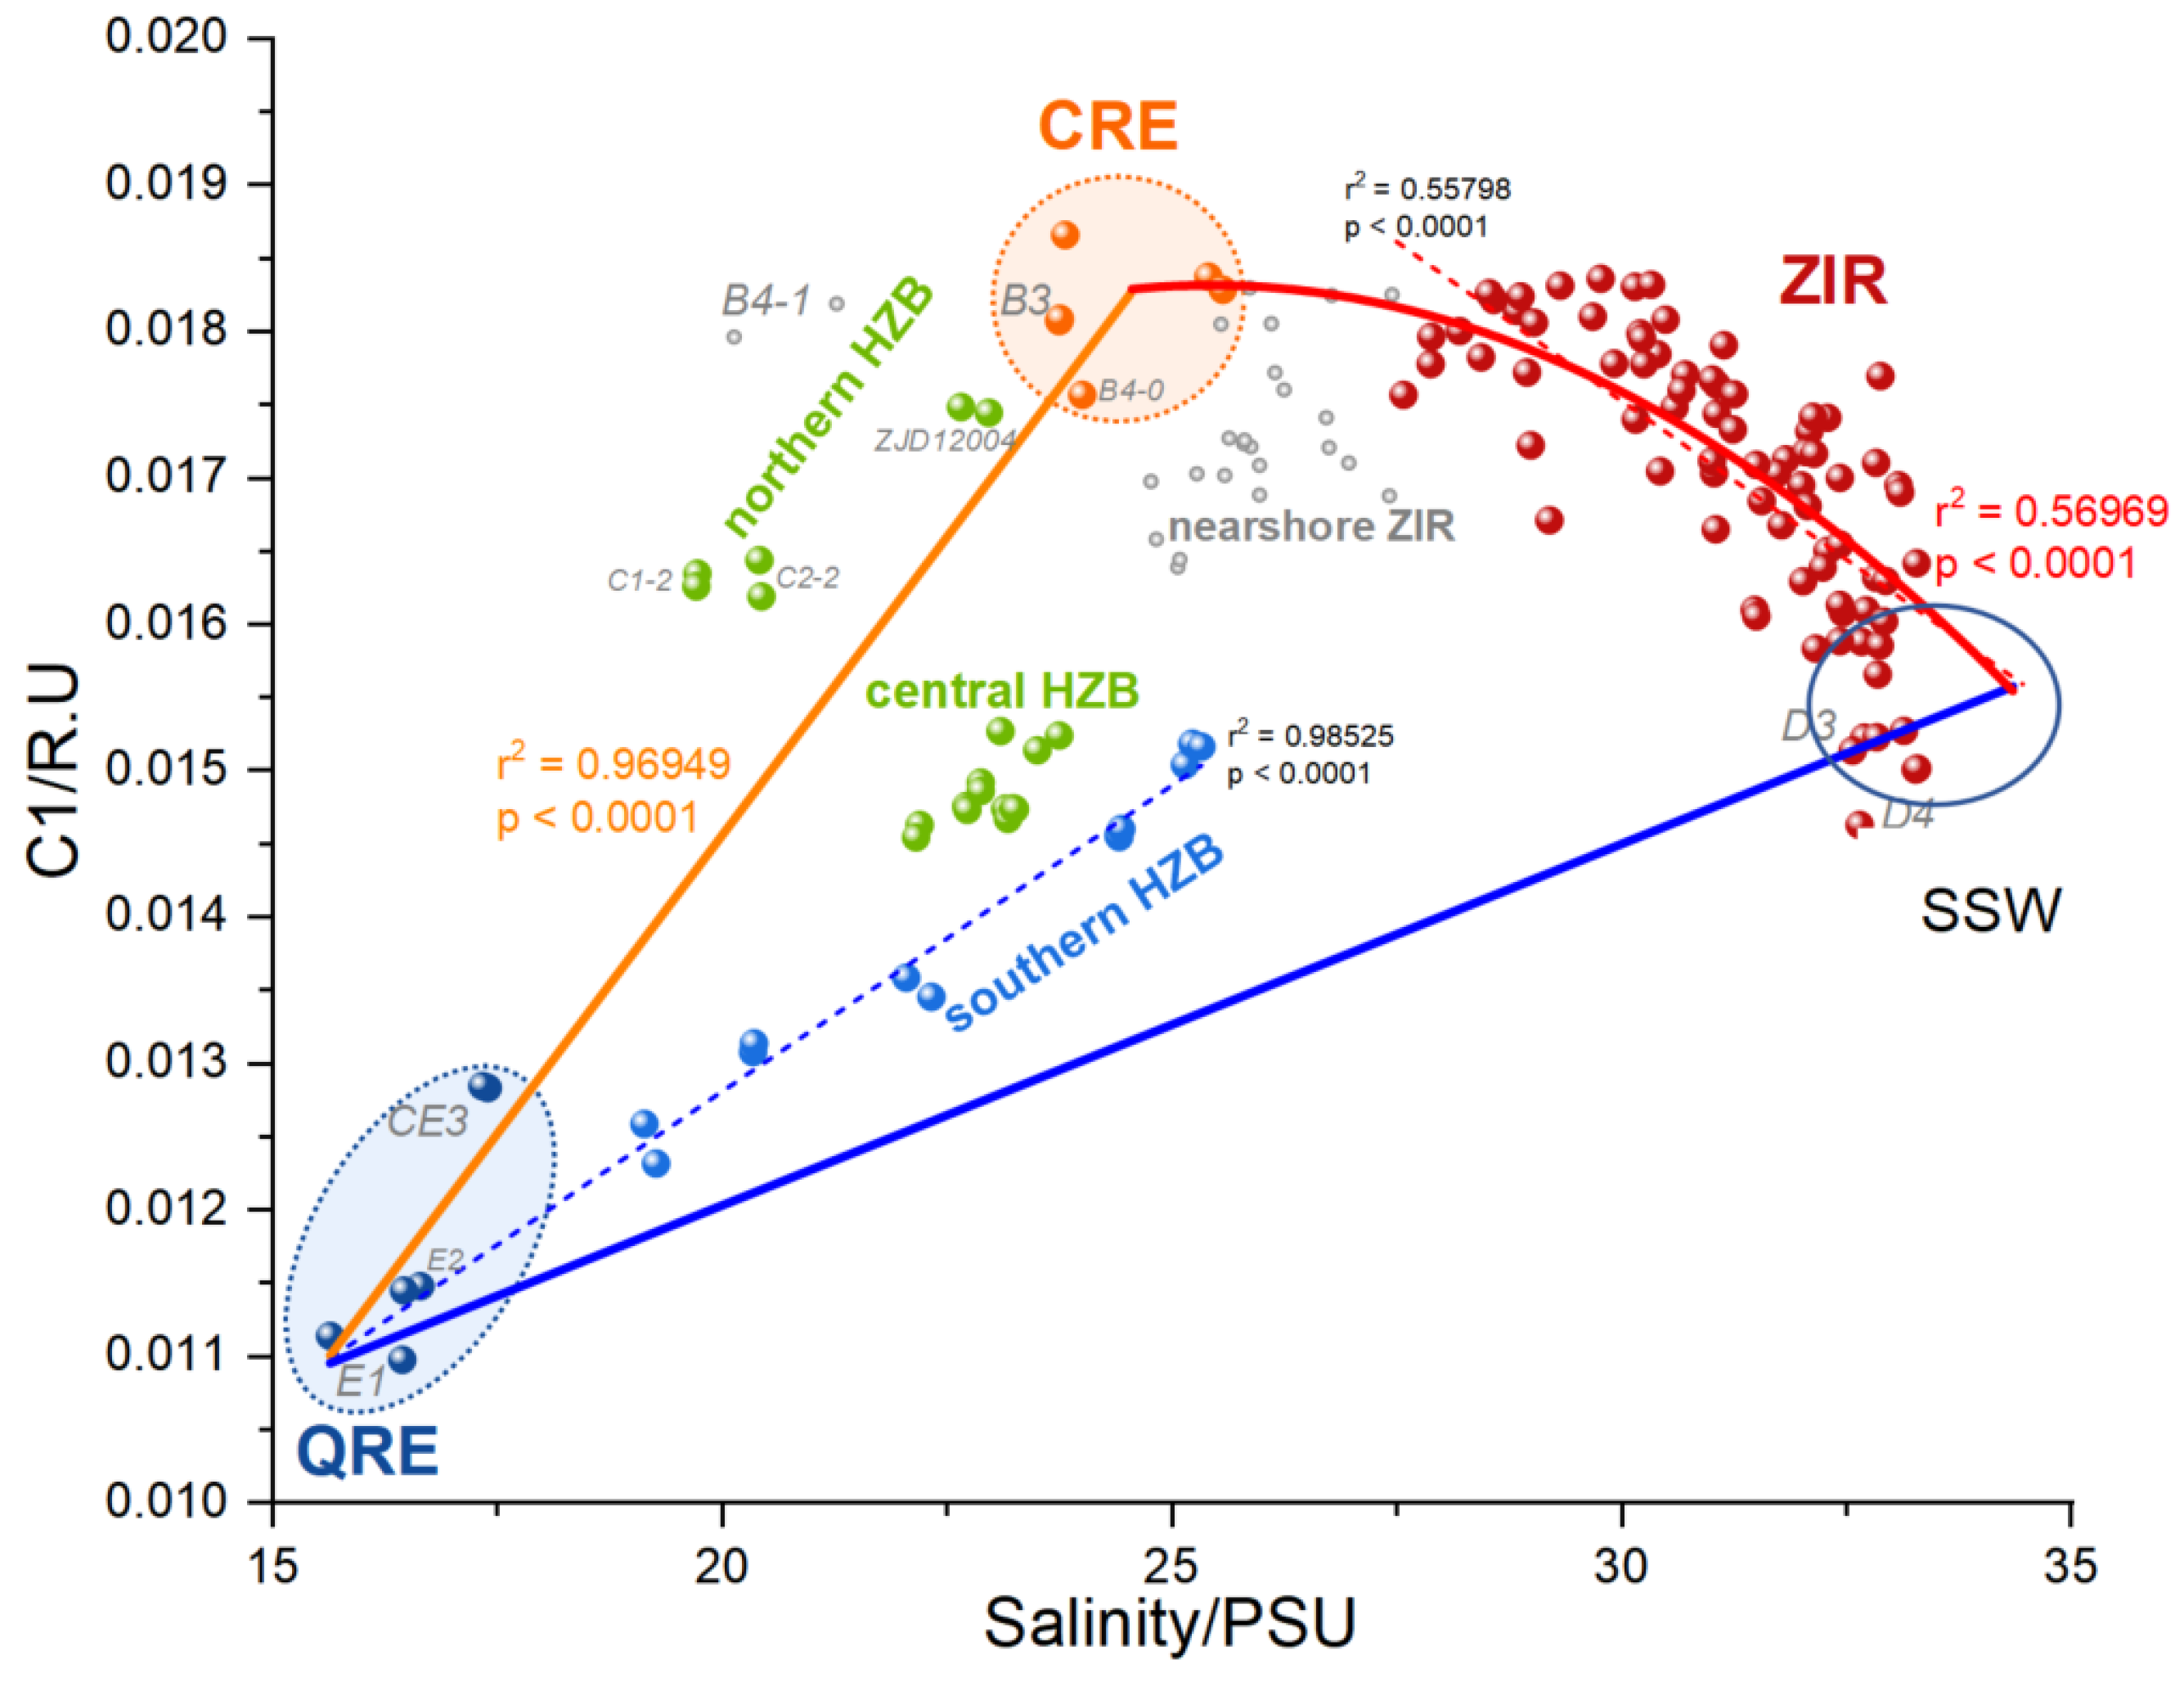
Figure 14.
Map of the study area: Hangzhou Bay (HZB) - Changjiang Estuary (CRE) and adjacent seas. (a) HZB – CRE and adjacent seas and the currents; (b) Sampling sites in January 2024. The green shaded area represents the water and DOM mixed zone.
Figure 14.
Map of the study area: Hangzhou Bay (HZB) - Changjiang Estuary (CRE) and adjacent seas. (a) HZB – CRE and adjacent seas and the currents; (b) Sampling sites in January 2024. The green shaded area represents the water and DOM mixed zone.
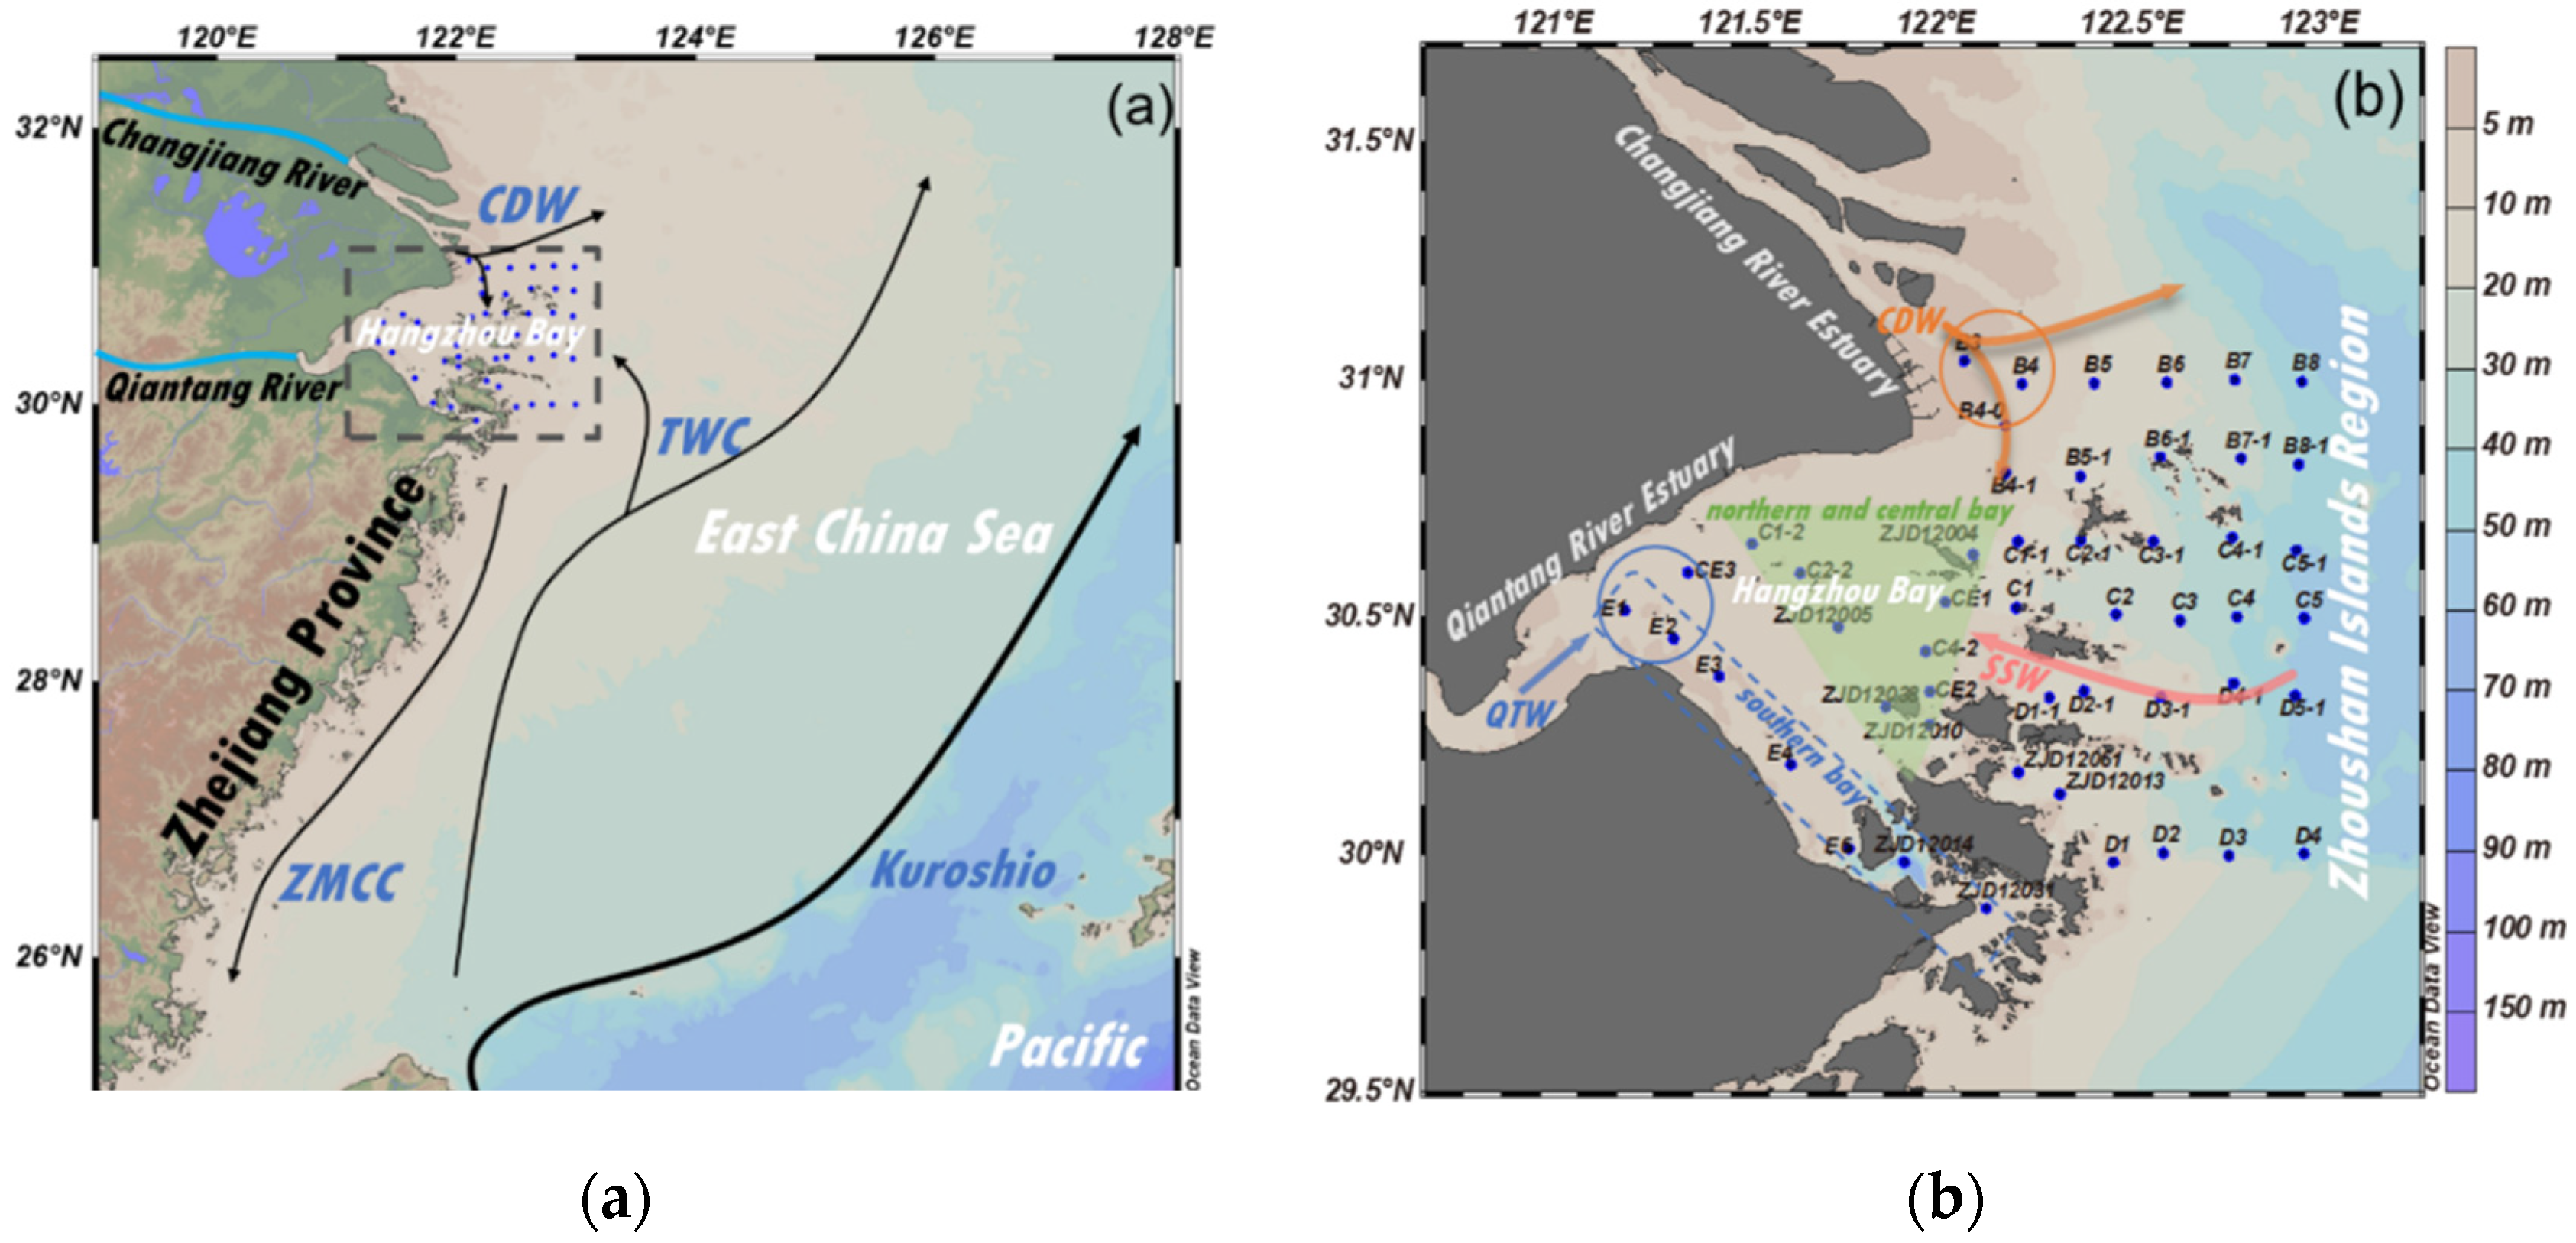

Table 1.
Hydrological and hydrochemical parameters in different end-member sources in the HZB and adjacent seas in late January 2024 (range values in parentheses).
Table 1.
Hydrological and hydrochemical parameters in different end-member sources in the HZB and adjacent seas in late January 2024 (range values in parentheses).
| Water Masses | Temperature /℃ |
Salinity /PSU |
Turbidity /FTU |
TSM /mg·L-1 |
Chl-a /μg·L-1 |
DO /mg·L-1 |
pH |
|---|---|---|---|---|---|---|---|
| QTW | 7.0 ± 0.1 | 16.66 ± 0.59 | 492.42 ± 0.01 | (746 – 4616) | 4.40 ± 0.15 | 10.83 ± 0.08 | 6.87 ± 0.00 |
| CDW | 5.9 ± 0.1 | 24.39 ± 0.79 | 451.33 ± 50.25 | (256 – 1475) | 2.12 ± 0.50 | 10.76 ± 0.05 | 6.86 ± 0.01 |
| SSW | 10.2 ± 2.2 | 31.31 ± 1.80 | 5.44 - 293 | (6 – 1184) | 0.58 ± 0.18 (0.36 – 1.37) |
9.20 ± 0.61 (8.29 - 10.38) |
6.89 ± 0.03 (6.83 - 6.97) |
Disclaimer/Publisher’s Note: The statements, opinions and data contained in all publications are solely those of the individual author(s) and contributor(s) and not of MDPI and/or the editor(s). MDPI and/or the editor(s) disclaim responsibility for any injury to people or property resulting from any ideas, methods, instructions or products referred to in the content. |
© 2025 by the authors. Licensee MDPI, Basel, Switzerland. This article is an open access article distributed under the terms and conditions of the Creative Commons Attribution (CC BY) license (http://creativecommons.org/licenses/by/4.0/).
Copyright: This open access article is published under a Creative Commons CC BY 4.0 license, which permit the free download, distribution, and reuse, provided that the author and preprint are cited in any reuse.


