
Submitted:
23 April 2025
Posted:
24 April 2025
You are already at the latest version
Abstract
ALK+ Anaplastic Large Cell Lymphoma (ALCL) is an aggressive T-cell lymphoma that is characterized by expression of the Anaplastic Lymphoma Kinase (ALK), which is induced by the t(2;5) chromosomal rearrangement leading to the expression of the NPM-ALK fusion-oncogene. Most previous preclinical models of ALK+ ALCL were based on overexpression of the NPM-ALK cDNA from heterologous promoters. Due to the enforced expression, this approach is prone to artifacts arising from synthetic overexpression, promoter competition and insertional variation. To improve the existing ALCL models and more closely recapitulate the oncogenic events in ALK+ ALCL, we employed CRISPR/Cas-based chromosomal engineering to selectively introduce translocations between the Npm1 and Alk gene loci in murine cells. By inducing precise DNA cleavage at the syntenic loci on chromosome 11 and 17 in a murine IL-3-dependent Ba/F3 reporter cell line, we generated de novo Npm-Alk translocations in-vivo, leading to IL-3-independent cell growth. To verify efficient recombination, we analyzed the expression of the Npm-Alk fusion protein in the recombined cells and could also show the t(11;17) in the IL-3 independent Ba/F3 cells. Subsequent functional testing of these cells using an Alk-inhibitor showed exquisite responsiveness towards Crizotinib, demonstrating strong dependence on the newly generated Alk fusion oncoprotein. Furthermore, a comparison of the gene expression pattern between Ba/F3 cells overexpressing the Npm-Alk cDNA with Ba/F3 cells transformed by CRISPR-mediated Npm-Alk translocation indicated that, while broadly overlapping, a set of pathways including the unfolded protein response pathway was increased in the Npm-Alk overexpression model, suggesting increased reactive changes induced by exogenous overexpression of Npm-Alk. Furthermore, we observed clustered expression changes in genes located in chromosomal regions close to the breakpoint in the new CRISPR-based model, indicating positional effects on gene expression mediated by the translocation event, which are not part of the older models. Thus, CRISPR-mediated recombination provides a novel and more faithful approach to model oncogenic translocations, which may lead to an improved understanding of the molecular pathogenesis of ALCL and enable more accurate therapeutic models of malignancies driven by oncogenic fusion proteins.
Keywords:
ALCL
; Npm-Alk
; CRISPR/Cas
; oncogenic fusion protein
; chromosomal translocation
; chromosomal engineering
1. Introduction
Anaplastic large cell lymphoma (ALCL) is a rare disease accounting for 10-15% of the pediatric and 2% of adult non-Hodgkin lymphomas (NHL), typically harboring the translocation t(2;5)(p23;q35) joining the tyrosine kinase anaplastic lymphoma kinase domain (ALK) to the nucleophosmin domain (NPM) located on chromosome 5q35 [1]. The latest classification in the revised fifth edition of the WHO in 2022 includes entities of ALCL depending on the presence of ALK translocations, the so called ALK-positive (ALK+) and ALK-negative (ALK-) ALCL and the breast implant-associated ALCL (BIA-ALCL) [2]. Most children and young adults show an ALK+ status, while old patients tend to be ALK- [3]. ALK- ALCL patients lean towards a worse outcome regarding 5 years median overall survival with 48% compared to 80% in patients with ALK+ disease [4,5]. The t(2;5) chromosomal translocation represents the defining initial event in ALK+ ALCL lymphomagenesis. The formation of interchromosomal translocations requires a double-strand break (DSB) on each of the chromosomes simultaneously and the subsequent inaccurate joining of the DNA ends [6], in which a type of non-homologous end joining (NHEJ) is typically involved. Thereby, a fusion gene is generated by juxtapositioning two normally separate genes. The new position either leads to overexpression of genes with oncogenic properties through transfer to a strong promoter, or expression of a novel fusion protein that exhibits oncogenic potential. Like other tyrosine kinases, ALK activates through homo-dimerization upon ligand binding and deactivates through dephosphorylation in the absence of the ligand [7]. The ALK protein is involved in activating several signaling pathways such as the phospholipase C-γ (PLC-γ), signal transducer and activator of transcription 3 (STAT3) and phosphatidylinositol-3-kinase (PI3K) pathways [8,9]. The NPM gene encodes for three transcript variants which share significant sequence and structural homology [10]. The nucleolar multifunctional phosphoprotein (Nucleophosmin) isoforms (35-40 kDa) are expressed in all tissues and have abundant functions including metabolic pathways for mRNA processing, chromatin remodeling and embryogenesis as well as pathways in DNA repair and regulating apoptosis [11]. The role of NPM within the t(2;5) translocation is twofold: First, the strong Npm1 promoter leads to the aberrant overexpression of the ALK tyrosine kinase in lymphoid cells. Furthermore the N-terminal NPM fragment leads to the multimerization of ALK, inducing autophosphorylation and dysregulated activation [12], thus promoting excessive initiation of signaling cascades responsible for cell growth, transformation and anti-apoptotic processes [13]. In this work we aimed to create a CRISPR/Cas9-based model leading to the expression of Npm-Alk, the major driving oncogene in ALK+ ALCL. For this purpose, we established a delivery system for Cas9 and two distinct sgRNAs targeting the Npm1 and Alk gene locus in murine cells, respectively. Thereby, we were able to generate an improved model of ALCL recapitulating the genetic events occurring during human oncogenesis. In contrast to previous approaches, such as the use of retroviral vectors combined with Cre-Lox technology to conditionally express NPM-ALK [14], this method directly replicates the t(2;5) chromosomal translocation. Furthermore, our workflow can potentially be expanded to model other relevant chromosomal translocations in-vitro and in-vivo.
2. Materials and Methods
2.1. Retroviral Expression Constructs and Cloning of the GBAC Vector System
The MSCV-MCS-PGK-Puro-IRES-GFP plasmid was a gift from Christopher Vakoc (Addgene plasmid # 75,124 ; http://n2t.net/addgene:75124 ; RRID:Addgene_75124) [15].The MSCV_Cas9_Puro plasmid was a gift from Christopher Vakoc (Addgene plasmid # 65,655 ; http://n2t.net/addgene:65655 ; RRID:Addgene_65655) [16].The eSpCas9 (1.1) (enhanced Streptococcus pyogenes Cas9) plasmid was a gift from Feng Zhang (Addgene plasmid # 71,814 ; http://n2t.net/addgene:71814 ; RRID:Addgene_71814) [17].
The pX330-U6-Chimeric_BB-CBh-hSpCas9 plasmid was a gift from Feng Zhang (Addgene plasmid # 42,230 ; http://n2t.net/addgene:42230 ; RRID:Addgene_42230) [18].
2.2. Golden Gate Cloning
To facilitate cloning of individual gRNAs as well as larger gRNA libraries, we developed a recipient vector platform enabling Golden Gate cloning of gRNAs (citation). The recipient vector included a CcdB cassette flanked by type IIs restriction enzyme sites to reduce empty background clones. In this study, Golden Gate cloning was performed alternatively to the restriction digest and DNA ligation to clone single guide RNAs (sgRNAs) into the GBAC vector in a one-step approach. First, the gRNA was synthesized as single strand DNA (Merck, Darmstadt), which was then amplified by PCR using primers containing compatible type IIs restriction sites to generate double stranded templates for Golden Gate cloning. Subsequently, the template and recipient vector were mixed in a ratio of 3:1, and 1 µl of the Type IIS restriction enzyme BspQI and 1 µl of T4 DNA ligase was added. By using 10 cycles of heating up to 37°C for 2 minutes and cooling down to 16°C for 5 minutes the optimum temperature range for the activity of BspQI and DNA ligase was utilized, respectively. After completion of the Golden Gate procedure, the ligation reactions were used for transformation of competent E. coli bacteria.
2.3. Surveyor Nuclease Assay
This assay was used to detect DNA mutations like small insertions or deletion, as well as single base mismatches. The surveyor endonuclease cleaves all heteroduplexes generated by hybridizing DNA fragments. Afterwards, analysis is performed by agarose gel electrophoresis. At first PCR amplification at the region of interest was performed using specifically designed primers. Efficiency of the PCR was monitored using 5 µl of each product in agarose gel electrophoresis. The remaining 45 µl were treated as instructed by the mutation detection kit (Surveyor®, IDT®, Germany, Dessau-Roßlau).
2.4. Cut-Point-Analysis by Deep Sequencing
To prepare the genomic DNA for deep sequencing, the target sequences were amplified via PCR using specifically designed primers containing the required p7 and p5 overhangs for Illumina sequencing. A 6-base barcode is embedded into the p7 primer to allow custom multiplexing of PCR products, the p5 primer contains the binding site for the sequencing primer.
To balance the amounts of reads between each sample for a deep sequencing run, we performed a gel electrophoresis of the PCR products and determined the required DNA amount to load individually. The determined DNA amounts are mixed together, column-purified and measured using the Qubit® dsDNA HS Assay kit (Invitrogen). The displayed DNA concentration is then diluted to 80 ng/µl. MiSeq or NextSeq 500 tabletop sequencing machines (Illumina) were used for deep sequencing of the cut-point PCR products using SR cartridges according to manufacturer’s protocol. After demultiplexing, the reads are aligned to the target sequence and the cut rate is determined by calculating the ratio between mutated/modified to wildtype sequences.
2.5. Multiplex Fluorescence In Situ Hybridization (M-FISH)
This technique allows studying of interchromosomal rearrangements by tagging homologous chromosome pairs with a finite number of fluorophores. The genome is then visualized by microscope and the data is acquired digitally. This method was performed using the Metasystems’ Multi-color Probe Kit according to manufacturer’s protocol, stained cells were analyzed using the Cytovision software (Leica Biosystems, Wetzlar, Germany).
2.6. Western Blotting and Immunodetection
Protein lysates were analyzed using standard Western blot protocols. Briefly, protein lysates were separated by SDS page gel electrophoresis and immobilized on a PVDF membrane (Immobilon®, Merck Millipore, USA, Massachusetts, Burlington) by western blotting. The membrane was incubated in blocking buffer (Odyssey®, Licor, USA, Nebraska, Lincoln) previous to incubation with primary antibody diluted in blocking buffer over night at 4°C on a shaker. After several washing steps and incubation with secondary antibodies diluted in blocking buffer, the blot was visualized using an IR Imaging System (Odyssey®, Licor, USA, Nebraska, Lincoln).
2.7. Data Analysis and Presentation
For the statistical analysis GraphPad Prism software was used (GraphPad Software, Inc). As we compared a minimum of 4 groups over several timepoints, the two-factorial analysis of variance (two-way ANOVA) with the Bonferroni post-hoc test was applied. Significance was stated, whenever the probability value (p-value) was p<0,05 (*), p<0,01 (**) or p<0,001 (***).
2.8. Culturing of Cell Lines
Cells were cultured under humidified conditions at 37°C and 5% CO2 atmosphere using standard cell culture techniques. Ba/F3 cells (Cat# ACC 300, DSMZ, Braunschweig, Germany) were grown in RPMI supplemented with 10%FCS, 1%Pen-Strep and 1 % Glutamine, as well as recombinant IL-3 (2ng/ml, PeproTech, Hamburg, Germany). In selected cases, Ba/F3 cells were grown without IL-3 to select for Npm-Alk mediated transformation.
Plat-E cells were grown in DMEM with 10%FCS, 1%Pen-Strep and 1 % Glutamine according to standard protocols [22].
2.9. Retrovirus Production and Infection
To produce recombinant retroviral particles, Plat-E cells (Cell Biolabs, San Diego, CA, USA) were transfected with retroviral expression plasmids using transfection reagents according to manufacturer’s protocol (TurboFect®, Thermo Fisher Scientific, USA, Massachusetts, Waltham). Supernatant of transfected Plat-E cells was collected, filtered and added to the target cells with the addition of 4 µg/ml polybrene before spin infection by centrifuging for 15 min at 1500 rpm. This step was repeated 12 and 24 h later after removing the supernatant. Infection rates were monitored via flow cytometry of GFP expression 24-48 h after the last infection step.
2.10. Flow Cytometry
A cell analyzer (BD LSRFortessa™, BD Biosciences, San Jose, CA, USA) was used to monitor viability (FSC, SSC) and expression of fluorescent proteins. A minimum of 5000 cells was analyzed in each measurement. Flow cytometric data was analyzed using the FlowJo software (BD Biosciences, Ashland, OR, USA).
2.11. Cell Sorting
Retrovirally infected cells were sorted by fluorescence-activated cell sorting (FACS) according to the expression of fluorescent proteins. This method was performed to select cells without using antibiotics by filtering them according to their expression of green fluorescent protein (GFP). Cell sorting was performed by Core Facility, Department of Medicine I, University Medical Center Freiburg.
2.12. IL-3-Deprivation of Ba/F3 Cells
Cells with Npm-Alk translocation events gained the expression of an oncogene. This oncogene substituted the IL-3 signaling in Ba/F3 cells. Selection of these cells was performed by depriving the cell culture medium of IL-3. 3d after third infection, Ba/F3 cells were centrifuged at 1500 rpm for 5 min and washed with PBS once to remove all IL-3 containing growth media. Afterwards the cells were resuspended in RPMI (10% FCS, 1% P/S). Viability of cells was monitored every 2 d via flow cytometry. Once IL-3 independent cells grew to 500.000/ml, they were split ¼ every 2 days.
3. Results
3.1. Establishment of a CRISPR/Cas9-Based Vector System
For the generation of a CRISPR/Cas9-based system inducing Npm-Alk translocations, we developed a retroviral gRNA expression system (GBAC – gRNA-pgk-blasticidin-2A-mCherry) based on a self-inactivating (SIN) vector backbone (pQCXIX, Clontech), enabling the expression of gRNAs from a U6 promoter cassette (17) together with expression of a blasticidin resistance gene for eukaryotic selection and the mCherry fluorescent protein to facilitate detection of infected cells by FACS. For double-infection experiments using two different gRNAs, we exchanged the mCherry fluorescent protein with the cyan fluorescent protein gene generating the GBACy vector (Figure 1b). In order to enable easy shuttling of gRNAs into the GBAC vector by Golden-Gate cloning [23], we included a ccdB cassette flanked by BspQI Type IIs restriction enzyme sites downstream of the U6 promoter. For simultaneous expression of two gRNAs from the same vector, we devised a strategy to clone 2 U6 promoter-gRNA cassettes in tandem, enabling dual targeting of two distinct sites with one vector (Figure 1b, see also Materials and Methods section).
For Cas9 expression, we initially cloned a tetracycline-inducible vector also based on the self-inactivating pQCXIX retroviral backbone (Figure 1a), but although we used a TREtight tet-inducible promoter [24], we still observed significant baseline Cas9 expression, negating the advantage of an inducible system (data not shown). We therefore used a vector constitutively expressing the Cas9 gene together with the puromycin resistance gene and a green fluorescent protein (GFP) expressed from an IRES element resulting in the Cas9_PIG (Puro-R_IRES_GFP) plasmid.
3.2. Functional Validation of Cas9 Expression Vectors After Retroviral Infection of Target Cells
To test the efficiency of the novel retroviral expression vectors, Ba/F3 cells were infected with Cas9 expression vectors and tested for the functionality of Cas9. After infection with MSCV-Cas9_Puro (C_P) or eCas9_PIG (eC_PIG) and selection using puromycin, the Western blot analysis showed that infected Ba/F3 cells expressed Cas9, which was not the case in the non-infected Ba/F3 cells (Ø). However, the band of Ba/F3_C_P was fainter compared to Ba/F3_eC_PIG (Figure 1d). For further functional testing of our CRISPR/Cas9 system, we targeted Rpa3, a known essential gene in most dividing eukaryotic cells [25] (using three different gRNAs from a previous publication [16]). Thereby, Cas9-induced Rpa3 inactivation should lead to depletion of cells expressing those sgRNAs compared to control cells. As a negative control we used a sgRNA that showed no exon target in BLAST [26]. For initial testing purposes, we used Ba/F3 cells and a murine Mantle Cell Lymphoma (MCL) line expressing either Cas9 or eCas9 after bulk infection and selection, and retrovirally infected these cells with the different Rpa3 or scrambled gRNAs. Using flow cytometry to measure the GFP+/mCherry+ cell fraction over time, selective enrichment or depletion of gRNA expressing cells under normal growth conditions was analyzed. The relative abundance of infected cells carrying a gRNA targeting Rpa3 rapidly depleted over time (Figure 1e), suggesting efficient Cas9-mediated inactivation of Rpa3 in this model.
While we did not observe significant differences in depletion between Cas9- and eCas9-expressing Ba/F3 cells, we noticed significant depletion of the Cas9 construct in the murine MCL line already before gRNA coexpression, suggesting increased toxicity of the original Cas9 construct in these cells (data not shown). We therefore preferentially used the eCas9 construct in the following experiments.
3.3. CRISPR/Cas9 Induced Npm1-Alk Translocation
IL-3 dependent Ba/F3 cells were used as a functional reporter cell line, since the Npm-Alk translocation is an oncogenic growth stimulant that can substitute for the dependency on IL-3. By successfully inducing a Npm-Alk translocation, Ba/F3 cells were able survive in IL-3 deprived cell culture medium (Figure 2a).
We designed three separate sgRNAs targeting predetermined breakpoint regions in Npm1 (gN1, gN2, gN3) and Alk (gA1, gA2, gA3) (suppl. Table 1) and cloned them into the fluorescently tagged GBAC and GBACy delivery vectors, allowing us to monitor sgRNA expression in flow cytometry. All experiments were performed in duplicates.
MSCV_Cas9_Puro Ba/F3 cells were separately infected with each sgRNA combination on day 0. After confirming successful infection via flow cytometry, the cells were deprived from IL-3 and monitored over the course of 14 days (Figure S1).
After an initial rapid drop in viability, we observed that the successfully infected cells expressing sgN1 and sgA1 outgrew the uninfected cells and other gRNA combinations IL-3 independently starting on day 6. Similar results could be observed by swapping the Cas9 expressing MSCV_Cas9_Puro vector with C_PIC or eC_PIC vector (not shown) or by exchanging the sgRNA delivery vector to the 2GBAC vector, expressing sgN1 and sgA1 simultaneously requiring only a single plasmid.
After 14 days in culture, the cells were harvested and lysed for western blotting and gDNA extraction. Non-infected Ba/F3 (ø) and Ba/F3 infected only with the Cas9-expressing vector (C_PIC) were used as negative controls. Western blot analysis showed a strong expression of a 75kDA hybrid Npm-Alk fusion protein (Figure 2b) and their respective β-tubulin control.
By using a forward primer 250bp upstream of the Alk cutting site and a reverse primer 250bp downstream of the Npm1 cutting site we were able to amplify a 554bp long product using PCR (Figure 2c). By Sanger sequencing, all sequences showed on target cleavage approximately 3bp upstream of the PAM-sequence resulting in non-identical double strand breaks around the targeted breakpoints.
Next, we used multiplex fluorescence in situ hybridization (M-FISH) to check for an interchromosomal translocation. MSCV-Cas9_Puro cells infected with 2GBAC_Npm1-Alk or double infected with GBAC_Npm1_1 and GBACy_Alk_1 presented with a t(11;17) chromosomal translocation (Figure 2d, marked in red). Uninfected Ba/F3 cells and Ba/F3 infected with an Npm1-Alk overexpressing (MSCV_NPM-ALK_IRES_eGFP) plasmid were used as control cell lines. Here, we did not observe the t(11;17) translocation, but the control cell line overexpressing Npm-Alk showed several different DNA alterations including derivative translocations der(3)t(3;6) and der(8)t(2;8) as well as several numerical chromosomal aberrations, indicating an ongoing genetic drift in these cells (Table S3).
In spite of testing three different combinations of gRNAs for translocation induction, only one specific gRNA combination was able to induce Npm-Alk chromosomal translocations. To improve our understanding of the underlying factors influencing the efficacy of fusion gene generation, we investigated gRNA cleavage efficiency via deep sequencing. We isolated gDNA from Ba/F3-Cas9 cells retrovirally infected with a single gRNA (gA1, gA2, gA3, gN1, gN2, gN3) and amplified the cutpoint region using locus-specific primers, which also incorporated a barcode sequence for multiplexing (see Materials&Methods). By high-throughput sequencing of more than 105 reads per locus, we were able to quantify the number of Cas9-modified sequences compared to wildtype for each gRNA. The deep sequencing analysis showed that gN1 and gA1 led to an on-target mutation rate of 70% and 90%, respectively, while the remaining gRNAs showed a cleavage efficiency of below 45% (Figure 2e). Our approach, while probably still underestimating the total number of effectively modified cells due to missing large deletions encompassing the primer binding site, indicates that highly efficient gRNAs are required to induce functionally active translocations in this setting.
3.4. CRISPR-Cas9-Induced Npm-Alk Fusions Respond to Alk-Inhibition and Show a Distinct mRNA Expression Pattern
The results of the M-FISH corroborated the Western blot analysis data demonstrating that the established CRISPR/Cas9 system induced Npm1-Alk translocations in Ba/F3 cells. The efficacy of Npm1-Alk as an oncogene driving the outgrowth of Ba/F3 cells was further tested using the specific Alk inhibitor NVP-TAE684 [27] (Figure 3a–c). The inhibitor was added to the cell culture medium for two days and the cell viability was monitored via flow cytometry.
Two Ba/F3 cell lines growing IL-3 independent after translocation induction (Ba/F3 infected with MSCV_Cas9_Puro and GBAC_Npm1 + GBACy_Alk_1), and Ba/F3 transduced with MSCV_Cas9_Puro_2GBAC_Npm1-Alk1) were treated with different concentrations (5 nM, 10 nM, 50 nM and 100 nM) of NVP-TAE648. Additionally, Ba/F3_MSCV_Cas9_Puro growing in IL-3 supplemented media were used as control cells. NVP-TAE684 had no significant effect at any utilized concentration on the control cells growing without the t(11;17) translocation. The viability of the cells carrying the Npm-Alk translocation, however, decreased already 24 hours after treatment with NVP-TAE684 (Figure 3a). The decrease in cell viability correlated with increased inhibitor concentrations, cells treated with the lowest concentration of NVP-TAE684 at 5 nM showed a slight decrease of cell viability of around 5-7 % compared to untreated cells on day 1, whereas viability in Npm-Alk translocated cells treated with 50 nM and 100 nM decreased to <2% after two days for all samples analyzed.
3.5. Cells Carrying an Endogenous Npm-Alk Translocation Demonstrate a Different mRNA Expression Pattern than Ba/F3 Cells Transformed by the Overexpressed Fusion Protein
Although both cells exogenously overexpressing the Npm-Alk fusion protein from a heterologous promoter and cells expressing the fusion protein from the endogenous Npm1 promoter grow IL-3 independent with similar growth kinetics, there are several differences between the two approaches. The endogenous Npm1 promoter responds to different cues than the retroviral MSCV promoter used for overexpression of the fusion oncoprotein. Furthermore, the translocation event may also impact other genes positioned in proximity to the breakpoint locus, which may further influence the biological behavior of the tumor cell. To address this question and identify more subtle differences between Ba/F3 cells transformed by either retroviral Npm-Alk overexpression or by endogenous CRISPR-mediated translocation, we performed mRNA expression analysis using Affymetrix GeneChip® Gene 1.0 ST Array System (Affymetrix, Santa Clara, CA, USA), comparing mRNA expression in steady-state growing Ba/F3 cells transformed by either MSCV-NPM-ALK or CRISPR-mediated recombination, with untransformed Ba/F3 cells growing in the presence of IL-3 as control. A principle component analysis (PCA) showed that the two Npm-Alk transformed Ba/F3 cell lines, while more related than the untransformed control cells, clustered in distinct groups (not shown) indicating that the different methods of Npm-Alk expression also induced diverging gene expression. To further dissect the pathways underlying the differential response, we performed gene set enrichment analysis (GSEA) on the differentially expressed genes between the three cohorts. The GSEA analysis highlighted the Unfolded Protein Response (UPR) pathway as one of the most significantly diverging pathways between the two Npm-Alk transformation approaches in several canonical GSEA pathways including the Reactome and WikiPathway subset (not shown). We also performed GSEA to evaluate topological effects of the chromosomal structural changes in the CRISPR model on gene expression e.g., due to loss (or gain) of long range repressors or enhancers as has been described previously in other cases [28]. A major difference between the two Npm-Alk models could derive from the impact on chromosome structure induced by the chromosomal translocation between chromosome 11 and 17 in our murine model, corresponding to the syntenic human chromosomes 2 and 5 in the human t(2;5) translocation in ALCL [1]. Notably, a GSEA analysis focusing on genes located in different gene areas around the translocation locus indicated a mostly reduced expression of genes in proximity to the translocation site . While the topological changes associated with the translocation event may differently affect gene expression on more distant isochromosomal regions or on different chromosomes [28], our results suggest that expression of the more proximal located genes in our model is mostly repressed after induced translocation.
4. Discussion
Chromosomal translocations are among the most frequent genetic events in cancer. Chromosomal translocations frequently lead to gene fusions, with deregulated expression of activated kinases strongly promoting the growth and survival of cancer cells. To study the effects of fusion neo-genes on cell growth and survival, cDNA overexpression of hallmark lesions like the Bcr-Abl fusion oncogene in CML models have been used to decipher the intracellular signaling driving cellular transformation. While the exogenous overexpression of the cDNA of fusion oncogenes recapitulates important aspects of the oncogenic transformation process including the relevant signaling pathways, it does not consider the chromosomal changes underlying the translocation event. Therefore, the advent of CRISPR technology to engineer chromosomal breaks, inducing chromosomal translocations to recapitulate specific oncogenic events in cancer promises to further improve genetic cancer models. Since translocations involving the ALK kinase are recurrent driver events in a range of human cancers, we initially focused on the development of models based on the NPM-ALK t(2:5) translocation. To enable fast and efficient recombination, we established a toolbox for the retroviral infection of murine cells with Cas9 and sgRNAs targeting the genes Npm1 and Alk, in which infection efficacy could be monitored through flow cytometric analysis of linked fluorescent markers. To test for successful on-target operation of our Cas9/gRNA approach, we showed expression of the Npm-Alk fusion protein in Western blot analysis, validated recombination by breakpoint sequencing, and performed direct visualization of the chromosomal rearrangements using M-FISH. Furthermore, Alk dependent growth after successful chromosomal rearrangement in IL-3-independent Ba/F3 cells was shown by demonstrating impaired cell viability upon Alk inhibitor treatment.
To establish the CRISPR-based translocation model, we adapted a retroviral self-inactivating (SIN) vector to enable stable gRNA expression and at the same time identification of infected cells by fluorescence, as well as positive selection using blasticidin. To achieve better control over CRISPR activity, we choose to express the Cas9 gene from a separate retroviral vector. Initial attempts to generate a tetracycline-inducible (teti) Cas9 expression system were abandoned due to persistent leakiness of the different teti constructs (data not shown). Therefore, we pursued the separate infection with two different retroviral vectors to deliver Cas9 and the sgRNAs targeting the Npm- and Alk-locus in two steps, which enabled permanent expression of the gRNA and the Cas9 gene to increase the chances of induction of the Npm-Alk translocation.
Targeting Rpa3, an essential gene for DNA replication in eukaryotic cells [29], led to rapid depletion of infected Ba/F3 cells, demonstrating the functionality of our system. For the induction of the interchromosomal translocation, we designed several sgRNAs targeting the Npm1 and Alk locus located on murine chromosome 11 and 17, respectively. After infection of Ba/F3 cells already expressing Cas9 with different combinations of sgRNAs, we tested the cells for factor-independent growth. As expected, IL-3 deprivation led to cell death in all Ba/F3 cells with control vectors lacking Cas9 or sgRNA expression. Interestingly, only one sgRNA combination led to a consistent outgrowth. To further maximize infection rates, we cloned a retroviral vector enabling simultaneous expression of two sgRNAs (2GBAC). While this numerically almost doubled the initial number of cells containing both sgRNAs (data not shown), there was no significant latency in outgrowth between using the dual sgRNA vector and the double infection approach, likely due to the rapid doubling time of the transformed cells. Of note, the 2GBAC infected cells displayed identical translocations regarding location and size as the single infected cells.
While the expression as single or double sgRNA did not significantly affect the efficiency of the system, the sgRNA design seemed to have a more profound impact. Initially, three different gRNAs for each locus were selected from predictions based on the CCTop algorithm [30]. The analysis of individual gRNA cutting efficacy by deep sequencing showed remarkable differences in cleavage efficiency between the different gRNAs, with the productive combination (gRNA Npm1_1 and ALK_1) leading to mutations in about 70% and more than 90% at the respective target site. Compared to the next best gRNAs targeting the same gene, there was an observed difference of about 40% in cleavage efficiency. Our results substantiate the need of gRNA efficacy testing and indicate that only highly efficient sgRNAs with high cut rates will enable efficient recombination. These results could either suggest that there is a non-linear effect on translocation efficiency, with a threshold of gRNA cleavage efficacy which is needed to effectively enable chromosomal recombination. Alternatively, there may be a required minimal number of cells with effectively cleaved sites on both chromosomes to enable productive translocation. With a calculated cutting rate (based on the measured cleavage efficiency of 70% for sgRNA NPM1_1 and 90% for ALK_1) of 0,62 for the most efficient (and only productive) gRNA combination versus a cutting rate of 0,12 (30% and 40%) for the second-best combination, an almost 6-fold difference may at least in part also account for the striking difference in the efficacy to generate productive translocations between the different gRNAs. Finally, while in our case the chosen gRNA cutting positions within the intron sequence on murine chromosome 11 and 17 varied by little more than 100bp, the flanking nucleotide sequence as well as the epigenetic state of the individual sites may also play a role in the rate of productive translocations induced by a particular gRNA. Hopefully, ongoing research into the determinants of effective translocation induction will lead to further improvements of the efficiency of the model.
In order to rule out that other secondary genetic alterations may have contributed to transformation thus rendering the cells independent from Alk kinase activity, we treated the CRISPR-generated cells with the ALK inhibitor NVP-TAE684 (26). Inhibition of Alk significantly decreased cell viability, confirming that the Npm-Alk fusion oncogene created by the t(11;17) translocation acts as the driver in the transformed cells.
Finally, while the CRISPR-induced transformation model showed many similarities to the Ba/F3 model based on Npm-Alk overexpression, we observed subtle differences in growth rates and response to Alk inhibition (data not shown). To further examine the differences, we analyzed mRNA expression in the different cell lines using microarray expression analysis. The results revealed significant differences in gene expression between the cell lines, including an significant upregulation of unfolded protein response (UPR) genes in the Npm-Alk cDNA overexpressing cells, suggesting that exogenous overexpression of Npm-Alk may lead to increased artificial cellular stress levels. Furthermore, our results indicated a dampening effect of the translocation on the expression of genes adjacent to the translocation breakpoint. A significant effect of chromosomal rearrangements on gene regulation has previously been described in other translocation events [31]. Our data corroborate these findings and indicate that a more concise replication of the genomic environment may be crucial for the accurate modeling of tumors driven by translocation events.
5. Conclusions
In conclusion, we established an efficient and versatile system for the induction of genomic translocations based on a SIN gamma retrovirus backbone for Cas9 and sgRNA delivery. By targeting the syntenic murine Npm and Alk loci, we were able to generate a genetically faithful model recapturing the chromosomal alterations underlying the oncogenic events underlying the t(2;5) translocation in ALCL. Furthermore, our results indicate that models based on overexpression of the Npm-Alk cDNA by exogenous promoters differ from models driven by accurate replication of the chromosomal translocation, in part due to the impact of the structural changes on genes located in the proximity of the translocation breakpoint. We are currently testing if these results can be extended to other cell lines and in-vivo models. So far, the rate of transformation in primary cells has been substantially lower using the same gRNAs (data not shown). We observed rapid depletion of Cas9 expressing cells in murine hematopoietic stem cells as well as in primary murine lymphoma cells, indicating an increased susceptibility to Cas9-mediated cytotoxicity in primary cells (data not shown). We also so far failed to transform murine stem cells with the 2GBAC construct (data not shown), indicating that an increased sensitivity to DNA damage may affect the translocation efficiency in primary cells. Thus, blunting the DNA damage response e.g., by targeted deletion of the p53 gene could increase the efficacy of translocation induction and facilitate the generation of CRISPR-induced translocation cancer models [32]. Nevertheless, the described model may help to further elucidate the contributing genetic factors underlying the development of ALCL and pave the way for the development of other genetically faithful models of translocation-driven cancers.
Supplementary Materials
The following supporting information can be downloaded at: Preprints.org, Table S1: Sequences of sgRNAs used for this project, Table S2: List of chromosomal structural alterations observed in Ba/F3 cells by M-FISH, Figure S1: Flow cytometric monitoring of Ba/F3 cells after targeting of the essential Rpa3 gene using the CRISPR/Cas9 system. Figure S2: Schematic outline of the syntenic chromosomal murine regions on chromosomes 11 and 17 corresponding to the human NPM and ALK gene loci on chromosomes 2 and 5. Figure S3: Schematic workflow of CRISPR/Cas9 induced Npm1-Alk translocation in Ba/F3 cells. Figure S4: Schematic workflow of CRISPR/Cas9 induced Npm1-Alk translocation in Ba/F3 cells with a dual sgRNA delivery system.
Author Contributions
All authors have read and agreed to the published version of the manuscript.
Funding
C.M. received research funding by the German Cancer Consortium (DKTK). This study was supported by the DFG: SFB-1479, project ID 441891347 (ALI, and JD), ALI received EU funding (MSCA-DN 101071735 FANTOM) and Mildred Scheel-professorship finding of the German Cancer Aid (DKH-70114112).
Data Availability Statement
The data presented in this study are available on request from the corresponding author
Conflicts of Interest
The authors declare no conflicts of interest
Abbreviations
The following abbreviations are used in this manuscript:
| AAVs | adeno-associated viruses |
| ALCL | anaplastic large cell lymphoma |
| ALK | anaplastic lymphoma kinase domain |
| BIA-ALCL | breast implant-associated ALCL |
| CRISPR | clustered regularly interspaced short palindromic repeats |
| CPPs | cell penetrating peptides |
| DBS | double-strand breaks |
| FACS | fluorescence-activated cell sorting |
| GFP | green fluorescent protein |
| GOI | gene of interest |
| GSEA | gene set enrichment analysis |
| MCL | mantle cell lymphoma |
| M-FISH | multiplex fluorescence in situ hybridization |
| mHSC | murine hematopoietic stem cells |
| NHL | Non-Hodgkin lymphoma |
| NHEJ | non-homologous end joining |
| NPM | nucleophosmin domain |
| Npm-Alk | Nucleophosmin-Anaplastic lymphoma kinase |
| PI3K | phosphatidylinositol-3-kinase |
| PLC-γ | phospholipase C-γ |
| SIN | self-inactivating |
| STAT3 | signal transducer and activator of transcription 3 |
| sgRNAs | single guide RNAs |
| UPR | Unfolded Protein Response |
References
- Morris, S.W.; Kirstein, M.N.; Valentine, M.B.; Dittmer, K.G.; Shapiro, D.N.; Saltman, D.L.; Look, A.T. Fusion of a Kinase Gene, ALK, to a Nucleolar Protein Gene, NPM, in Non-Hodgkin’s Lymphoma. Science 1994, 263, 1281–1284. [Google Scholar] [CrossRef]
- Alaggio, R.; Amador, C.; Anagnostopoulos, I.; Attygalle, A.D.; Araujo, I.B. de O.; Berti, E.; Bhagat, G.; Borges, A.M.; Boyer, D.; Calaminici, M.; et al. The 5th Edition of the World Health Organization Classification of Haematolymphoid Tumours: Lymphoid Neoplasms. Leukemia 2022, 36, 1720–1748. [Google Scholar] [CrossRef]
- Boi, M.; Zucca, E.; Inghirami, G.; Bertoni, F. Advances in Understanding the Pathogenesis of Systemic Anaplastic Large Cell Lymphomas. British Journal of Haematology 2015, 168, 771–783. [Google Scholar] [CrossRef] [PubMed]
- Falini, B.; Pileri, S.; Zinzani, P.L.; Carbone, A.; Zagonel, V.; Wolf-Peeters, C.; Verhoef, G.; Menestrina, F.; Todeschini, G.; Paulli, M.; et al. ALK+ Lymphoma: Clinico-Pathological Findings and Outcome. Blood 1999, 93, 2697–2706. [Google Scholar] [CrossRef] [PubMed]
- Gascoyne, R.D.; Aoun, P.; Wu, D.; Chhanabhai, M.; Skinnider, B.F.; Greiner, T.C.; Morris, S.W.; Connors, J.M.; Vose, J.M.; Viswanatha, D.S.; et al. Prognostic Significance of Anaplastic Lymphoma Kinase (ALK) Protein Expression in Adults With Anaplastic Large Cell Lymphoma. Blood 1999, 93, 3913–3921. [Google Scholar] [CrossRef] [PubMed]
- Richardson, C.; Jasin, M. Frequent Chromosomal Translocations Induced by DNA Double-Strand Breaks. Nature 2000, 405, 697–700. [Google Scholar] [CrossRef]
- Bossi, R.T.; Saccardo, M.B.; Ardini, E.; Menichincheri, M.; Rusconi, L.; Magnaghi, P.; Orsini, P.; Avanzi, N.; Borgia, A.L.; Nesi, M.; et al. Crystal Structures of Anaplastic Lymphoma Kinase in Complex with ATP Competitive Inhibitors. Biochemistry 2010, 49, 6813–6825. [Google Scholar] [CrossRef]
- Zamo, A.; Chiarle, R.; Piva, R.; Howes, J.; Fan, Y.; Chilosi, M.; Levy, D.E.; Inghirami, G. Anaplastic Lymphoma Kinase (ALK) Activates Stat3 and Protects Hematopoietic Cells from Cell Death. Oncogene 2002, 21, 1038–1047. [Google Scholar] [CrossRef]
- Slupianek, A.; Nieborowska-Skorska, M.; Hoser, G.; Morrione, A.; Majewski, M.; Xue, L.; Morris, S.W.; Wasik, M.A.; Skorski, T. Role of Phosphatidylinositol 3-Kinase-Akt Pathway in Nucleophosmin/Anaplastic Lymphoma Kinase-Mediated Lymphomagenesis1. Cancer Research 2001, 61, 2194–2199. [Google Scholar]
- Brunetti, L.; Gundry, M.C.; Goodell, M.A. New Insights into the Biology of Acute Myeloid Leukemia with Mutated NPM1. Int J Hematol 2019, 110, 150–160. [Google Scholar] [CrossRef]
- Box, J.K.; Paquet, N.; Adams, M.N.; Boucher, D.; Bolderson, E.; O’Byrne, K.J.; Richard, D.J. Nucleophosmin: From Structure and Function to Disease Development. BMC Molecular Biol 2016, 17, 19. [Google Scholar] [CrossRef] [PubMed]
- Bischof, D.; Pulford, K.; Mason, D.Y.; Morris, S.W. Role of the Nucleophosmin (NPM) Portion of the Non-Hodgkin’s Lymphoma-Associated NPM-Anaplastic Lymphoma Kinase Fusion Protein in Oncogenesis. Molecular and Cellular Biology 1997, 17, 2312–2325. [Google Scholar] [CrossRef]
- Della Corte, C.M.; Viscardi, G.; Di Liello, R.; Fasano, M.; Martinelli, E.; Troiani, T.; Ciardiello, F.; Morgillo, F. Role and Targeting of Anaplastic Lymphoma Kinase in Cancer. Molecular Cancer 2018, 17, 30. [Google Scholar] [CrossRef] [PubMed]
- Shoumariyeh, K.; Schneider, N.; Poggio, T.; Veratti, P.; Ehrenfeld, S.; Redhaber, D.M.; Khan, R.; Pfeifer, D.; Klingeberg, C.; Kreutmair, S.; et al. A Novel Conditional NPM-ALK-Driven Model of CD30+ T-Cell Lymphoma Mediated by a Translational Stop Cassette. Oncogene 2020, 39, 1904–1913. [Google Scholar] [CrossRef]
- Hohmann, A.F.; Martin, L.J.; Minder, J.L.; Roe, J.-S.; Shi, J.; Steurer, S.; Bader, G.; McConnell, D.; Pearson, M.; Gerstberger, T.; et al. Sensitivity and Engineered Resistance of Myeloid Leukemia Cells to BRD9 Inhibition. Nat Chem Biol 2016, 12, 672–679. [Google Scholar] [CrossRef]
- Shi, J.; Wang, E.; Milazzo, J.P.; Wang, Z.; Kinney, J.B.; Vakoc, C.R. Discovery of Cancer Drug Targets by CRISPR-Cas9 Screening of Protein Domains. Nature Biotechnology 2015, 33, 661–667. [Google Scholar] [CrossRef] [PubMed]
- Slaymaker, I.M.; Gao, L.; Zetsche, B.; Scott, D.A.; Yan, W.X.; Zhang, F. Rationally Engineered Cas9 Nucleases with Improved Specificity. Science 2016, 351, 84–88. [Google Scholar] [CrossRef]
- Cong, L.; Ran, F.A.; Cox, D.; Lin, S.; Barretto, R.; Habib, N.; Hsu, P.D.; Wu, X.; Jiang, W.; Marraffini, L.A.; et al. Multiplex Genome Engineering Using CRISPR/Cas Systems. Science 2013, 339, 819–823. [Google Scholar] [CrossRef] [PubMed]
- Mootha, V.K.; Lindgren, C.M.; Eriksson, K.-F.; Subramanian, A.; Sihag, S.; Lehar, J.; Puigserver, P.; Carlsson, E.; Ridderstråle, M.; Laurila, E.; et al. PGC-1α-Responsive Genes Involved in Oxidative Phosphorylation Are Coordinately Downregulated in Human Diabetes. Nat Genet 2003, 34, 267–273. [Google Scholar] [CrossRef]
- Subramanian, A.; Tamayo, P.; Mootha, V.K.; Mukherjee, S.; Ebert, B.L.; Gillette, M.A.; Paulovich, A.; Pomeroy, S.L.; Golub, T.R.; Lander, E.S.; et al. Gene Set Enrichment Analysis: A Knowledge-Based Approach for Interpreting Genome-Wide Expression Profiles. Proc Natl Acad Sci U S A 2005, 102, 15545–15550. [Google Scholar] [CrossRef]
- Liberzon, A.; Birger, C.; Thorvaldsdóttir, H.; Ghandi, M.; Mesirov, J.P.; Tamayo, P. The Molecular Signatures Database (MSigDB) Hallmark Gene Set Collection. Cell Syst 2015, 1, 417–425. [Google Scholar] [CrossRef] [PubMed]
- Morita, S.; Kojima, T.; Kitamura, T. Plat-E: An Efficient and Stable System for Transient Packaging of Retroviruses. Gene Ther 2000, 7, 1063–1066. [Google Scholar] [CrossRef] [PubMed]
- Engler, C.; Marillonnet, S. Golden Gate Cloning. Methods Mol Biol 2014, 1116, 119–131. [Google Scholar] [CrossRef] [PubMed]
- Gossen, M.; Bujard, H. Tight Control of Gene Expression in Mammalian Cells by Tetracycline-Responsive Promoters. Proc Natl Acad Sci U S A 1992, 89, 5547–5551. [Google Scholar] [CrossRef]
- Iftode, C.; Daniely, Y.; Borowiec, J.A. Replication Protein A (RPA): The Eukaryotic SSB. Critical Reviews in Biochemistry and Molecular Biology 1999, 34, 141–180. [Google Scholar] [CrossRef]
- Ye, J.; Coulouris, G.; Zaretskaya, I.; Cutcutache, I.; Rozen, S.; Madden, T.L. Primer-BLAST: A Tool to Design Target-Specific Primers for Polymerase Chain Reaction. BMC Bioinformatics 2012, 13, 134. [Google Scholar] [CrossRef]
- Galkin, A.V.; Melnick, J.S.; Kim, S.; Hood, T.L.; Li, N.; Li, L.; Xia, G.; Steensma, R.; Chopiuk, G.; Jiang, J.; et al. Identification of NVP-TAE684, a Potent, Selective, and Efficacious Inhibitor of NPM-ALK. Proc Natl Acad Sci U S A 2007, 104, 270–275. [Google Scholar] [CrossRef]
- Harewood, L.; Fraser, P. The Impact of Chromosomal Rearrangements on Regulation of Gene Expression. Human Molecular Genetics 2014, 23, R76–R82. [Google Scholar] [CrossRef]
- Wold, M.S. Replication Protein A: A Heterotrimeric, Single-Stranded DNA-Binding Protein Required for Eukaryotic DNA Metabolism. Annu Rev Biochem 1997, 66, 61–92. [Google Scholar] [CrossRef]
- Stemmer, M.; Thumberger, T.; Keyer, M. del S.; Wittbrodt, J.; Mateo, J.L. CCTop: An Intuitive, Flexible and Reliable CRISPR/Cas9 Target Prediction Tool. PLOS ONE 2015, 10, e0124633. [Google Scholar] [CrossRef]
- Harewood, L.; Schütz, F.; Boyle, S.; Perry, P.; Delorenzi, M.; Bickmore, W.A.; Reymond, A. The Effect of Translocation-Induced Nuclear Reorganization on Gene Expression. Genome Research 2010, 20, 554. [Google Scholar] [CrossRef] [PubMed]
- Haapaniemi, E.; Botla, S.; Persson, J.; Schmierer, B.; Taipale, J. CRISPR–Cas9 Genome Editing Induces a P53-Mediated DNA Damage Response. Nature Medicine 2018, 24, 927. [Google Scholar] [CrossRef] [PubMed]
Figure 1.
a) Cas9 plasmid structure: 1. T3GCasVIN: tetracycline inducible Cas9 expression: ~12,4 kb. 2. MIG_Cas9/MIG_eCas9: Two constitutive variants, one with Cas9 and one with eCas9, coupled to GFP expression. Size: ~10,7 kb. 3. Cas9_PIG/eCas9_PIG: Two constitutive variants, one with Cas9 and one with eCas9, constitutive expression puromycin, Size: ~12 kb.(Cas9: CRISRP-associated protein9; eCas9: “enhanced” Cas9; GFP: green fluorescent protein; IRES: internal ribosome entry site; MSCV: murine stem cell virus promoter; Neo-R: neomycin resistance gene; PGK: phosphoglycerate kinase; Puro-R: Puromycin resistance gene; TR3G: tetracycline response element 3rd generation; Venus: yellow fluorescent protein).b) sgRNA Plasmid structure: 1. GBAC_Rec: Constitutive sgRNA expression with 20 bp long sgRNA replacing the ccdB cassette: ~7,2 kb. 2. GBACy_Rec: Constitutive sgRNA expression with 20 bp long sgRNA replacing the ccdB cassette: ~7,2 kb. 3, 2GBAC_Npm1-Alk: dual sgRNA plasmid with a sgRNA targeting Npm1 and one targeting Alk: ~7,6 kb. (BSD-R: blasticidine resistance gene; BspQI: BspQI recognition site; eCFP: enhanced cyan fluorescent protein; gA1: sgRNA targeting Alk (Alk_1); gN1: sgRNA targeting Npm1 (Npm1_1); mCherry: red fluorescent protein; P2A: peptide 2A sequence; PGK: phosphoglycerate kinase; U6: Human U6 promoter).c) Schematic representation of Npm-Alk translocation: The sgRNAs (red arrows) target specific introns of Npm1 and Alk. By inducing double-stranded breaks the murine chromosomes 11 and 17 get the chance to translocate. The fusion of Npm1-Alk is located in between the 4th exon of Npm1 and the 20th exon of Alk. A PCR covering the proximity of the breaking point was conducted leading to a 550 bp product. The Npm1-specific forward primer and the Alk-specific reverse primer are indicated as black arrows. A1, A2, A3: sgRNAs no.1, 2 and 3 targeting Alk; N1, N2, N3: sgRNAs no.1, 2 and 3 targeting Npm1. d) Cas9 expression levels: Western Blot (WB) analysis of Ba/F3, HL-60, K562 cells infected with RIEP and T3GCasVIN after 2d of doxycycline treatment and Cas9 expression in Ba/F3 with constitutive Cas9 expression with C_P and eC_PIG vectors. e) Flow cytometric monitoring of cells after Cas9-induced targeting of the essential genes RPA using 3 different sgRNAs. All groups demonstrated a p-value of p<0,01 when using GBAC Rpa3e1.1 and GBAC Rpa3e1.3 only on day 4. All other timepoints for every group demonstrated a p-value of p<0,001 including GBAC Rpa3e1.2 on day 4.
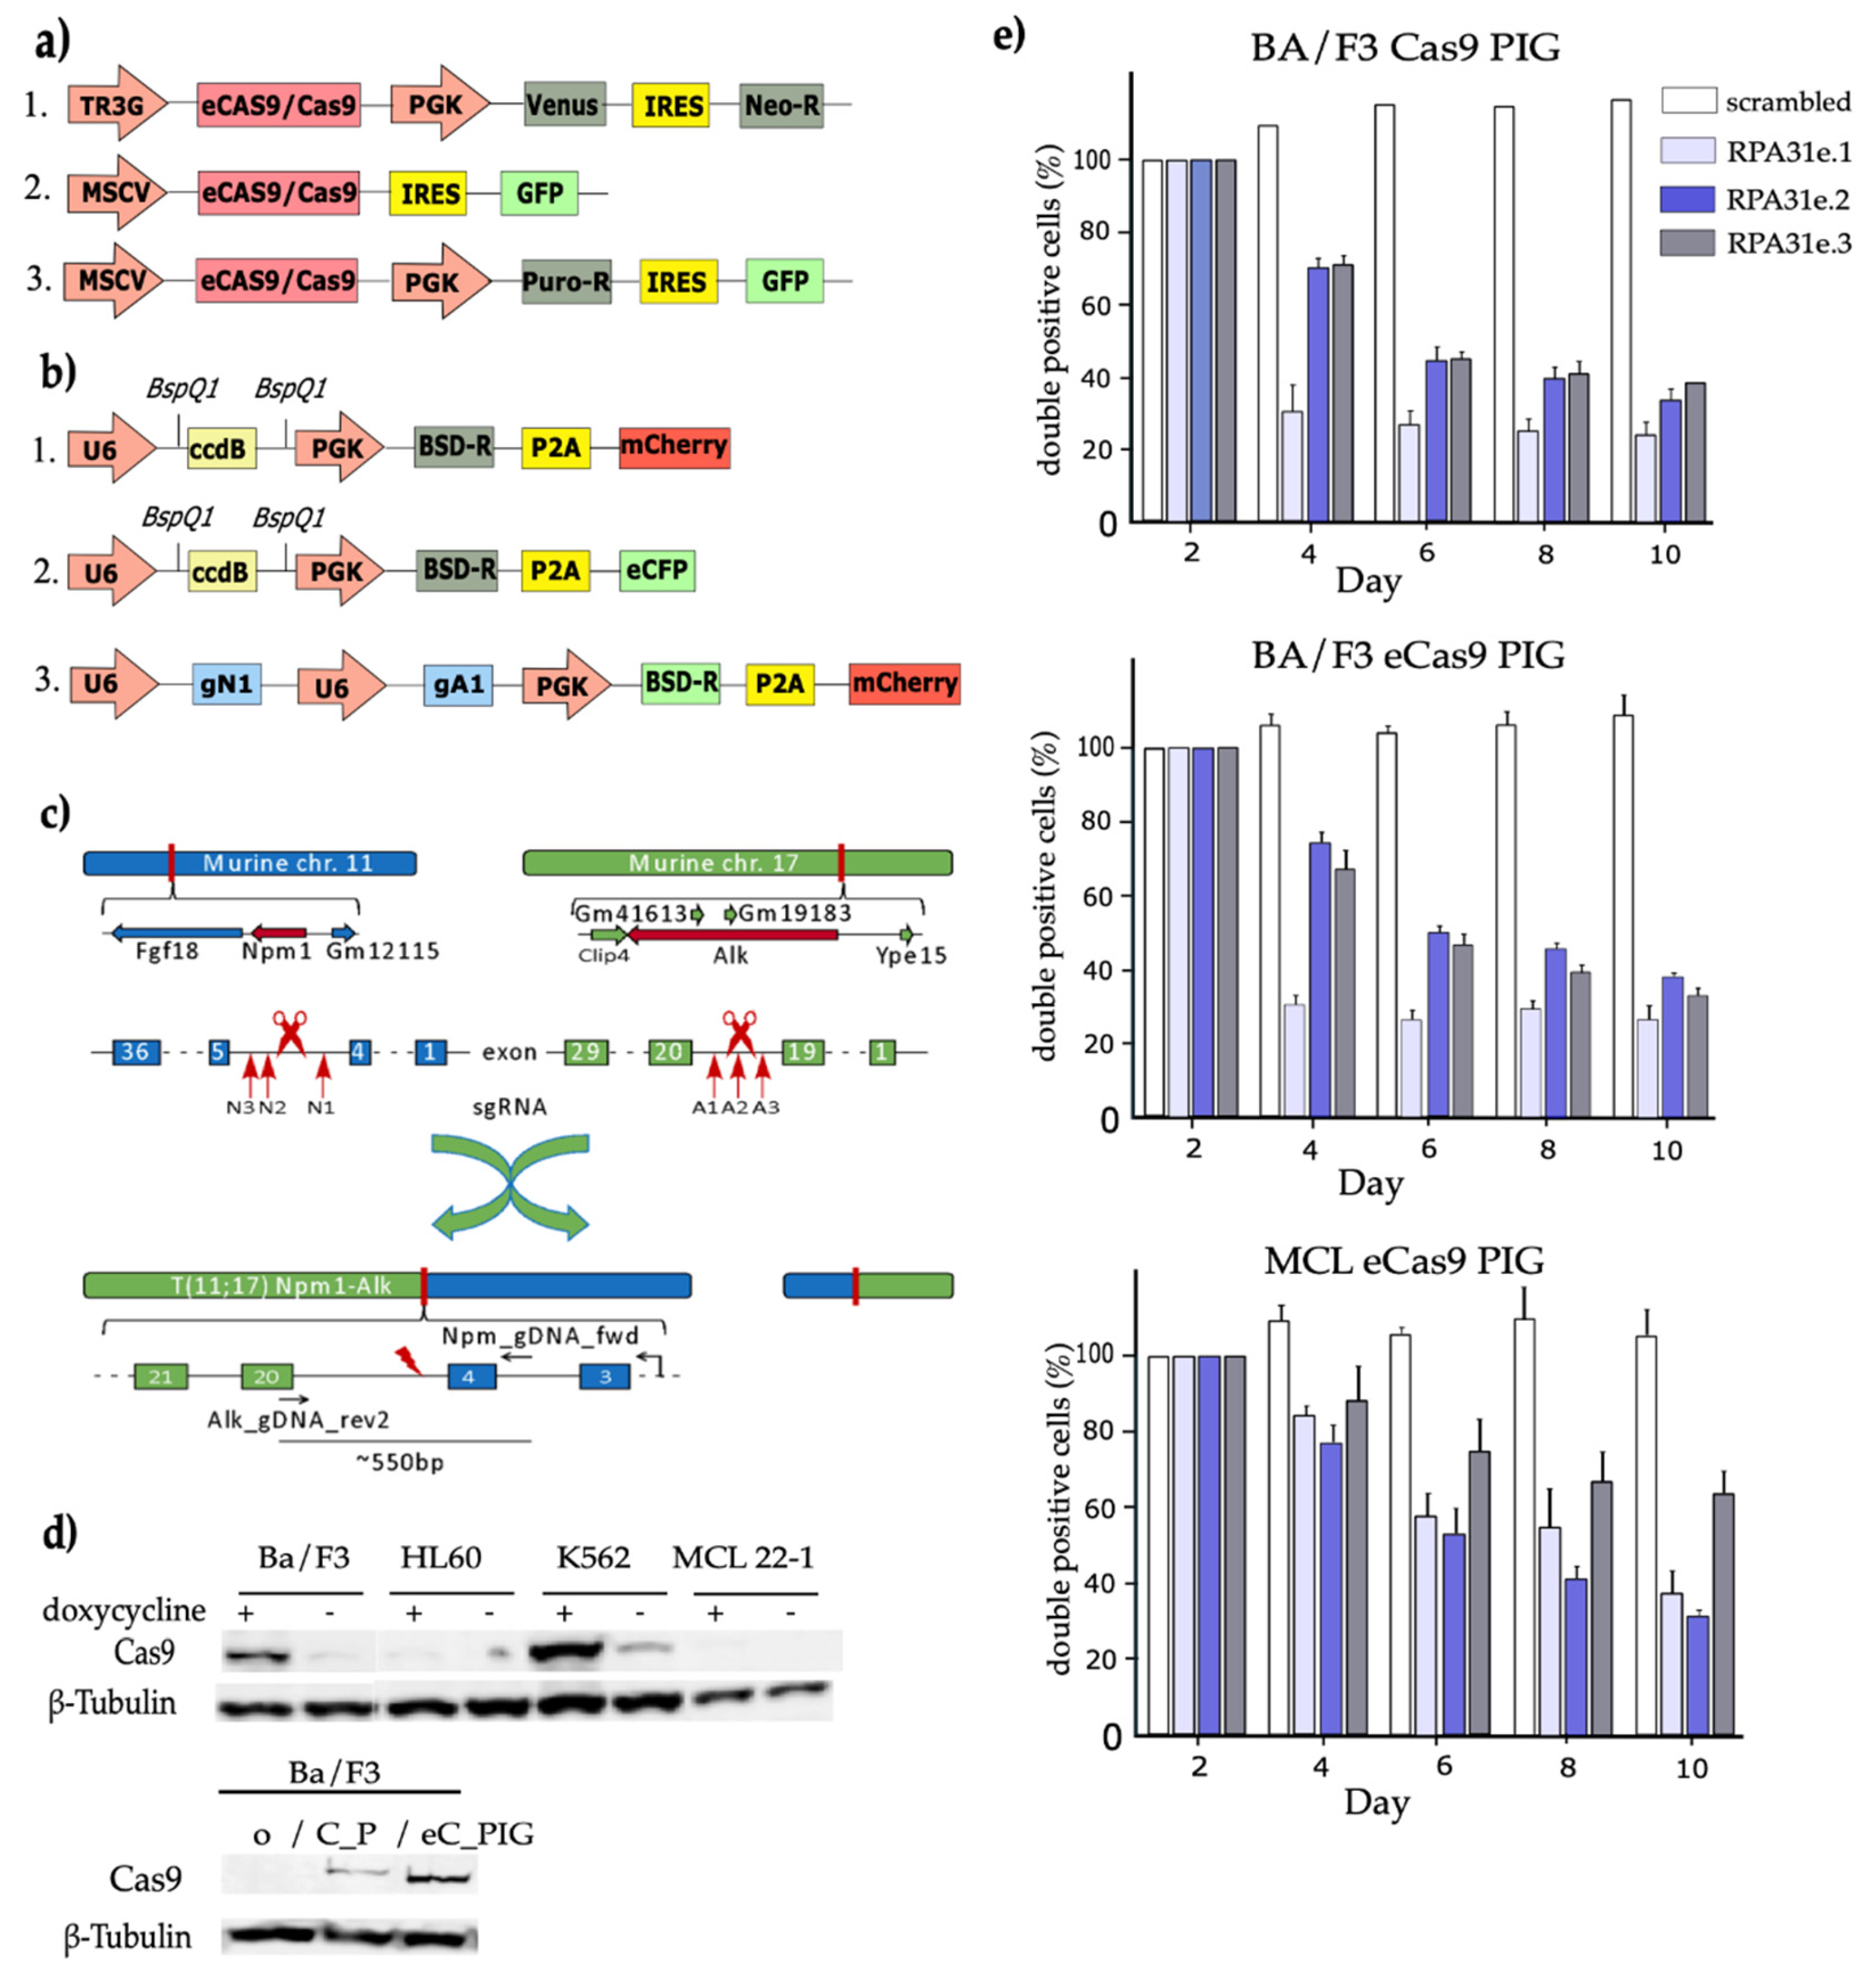
Figure 2.
a) Flow cytometric monitoring of cell viability of IL-3 deprived Ba/F3 cells after Cas9 and sgRNA expression with either 2 separate plasmids expressing gRNA (comb) or the 2GABC plasmid. b) Alk Western blot of several constitutive Cas9 constructs with or without sgRNAs in Ba/F3 cells. β-tubulin control. c) PCR of the resulting Npm1-Alk translocation from different constructs. Below Sanger-Sequencing of the respective PCR product. (C_P: MSCV_Cas9_Puro; C_PIG: Cas9_PIG; eC_PIG: eCas9_PIG; gA1: GBACy_Alk_1; gN1: GBAC_Npm1_1, 2GN1A1: 2GBAC_Npm1-Alk). d) M-FISH analysis of viable Ba/F3 samples. Karyotyping of the genome of Ba/F3 cells with no infection (1st row), overexpressing plasmid Npm1-Alk (2nd row), infected with a Cas9 vector and double infected with sgRNA vectors (3rd row) and infected with a Cas9 vector and a single infection of dual sgRNA vector (4th row). Shown are one out of four assays performed each.e) Cutpoint efficiency: Schematic ratio of mutated gDNA to wildtype gDNA of cells infected with either GBAC Npm1_1 (Npm1), Npm1_2 (Npm2), Npm1_3 (Npm3), Alk_1 (Alk1), Alk_2 (Alk2) or Alk_3 (Alk3).
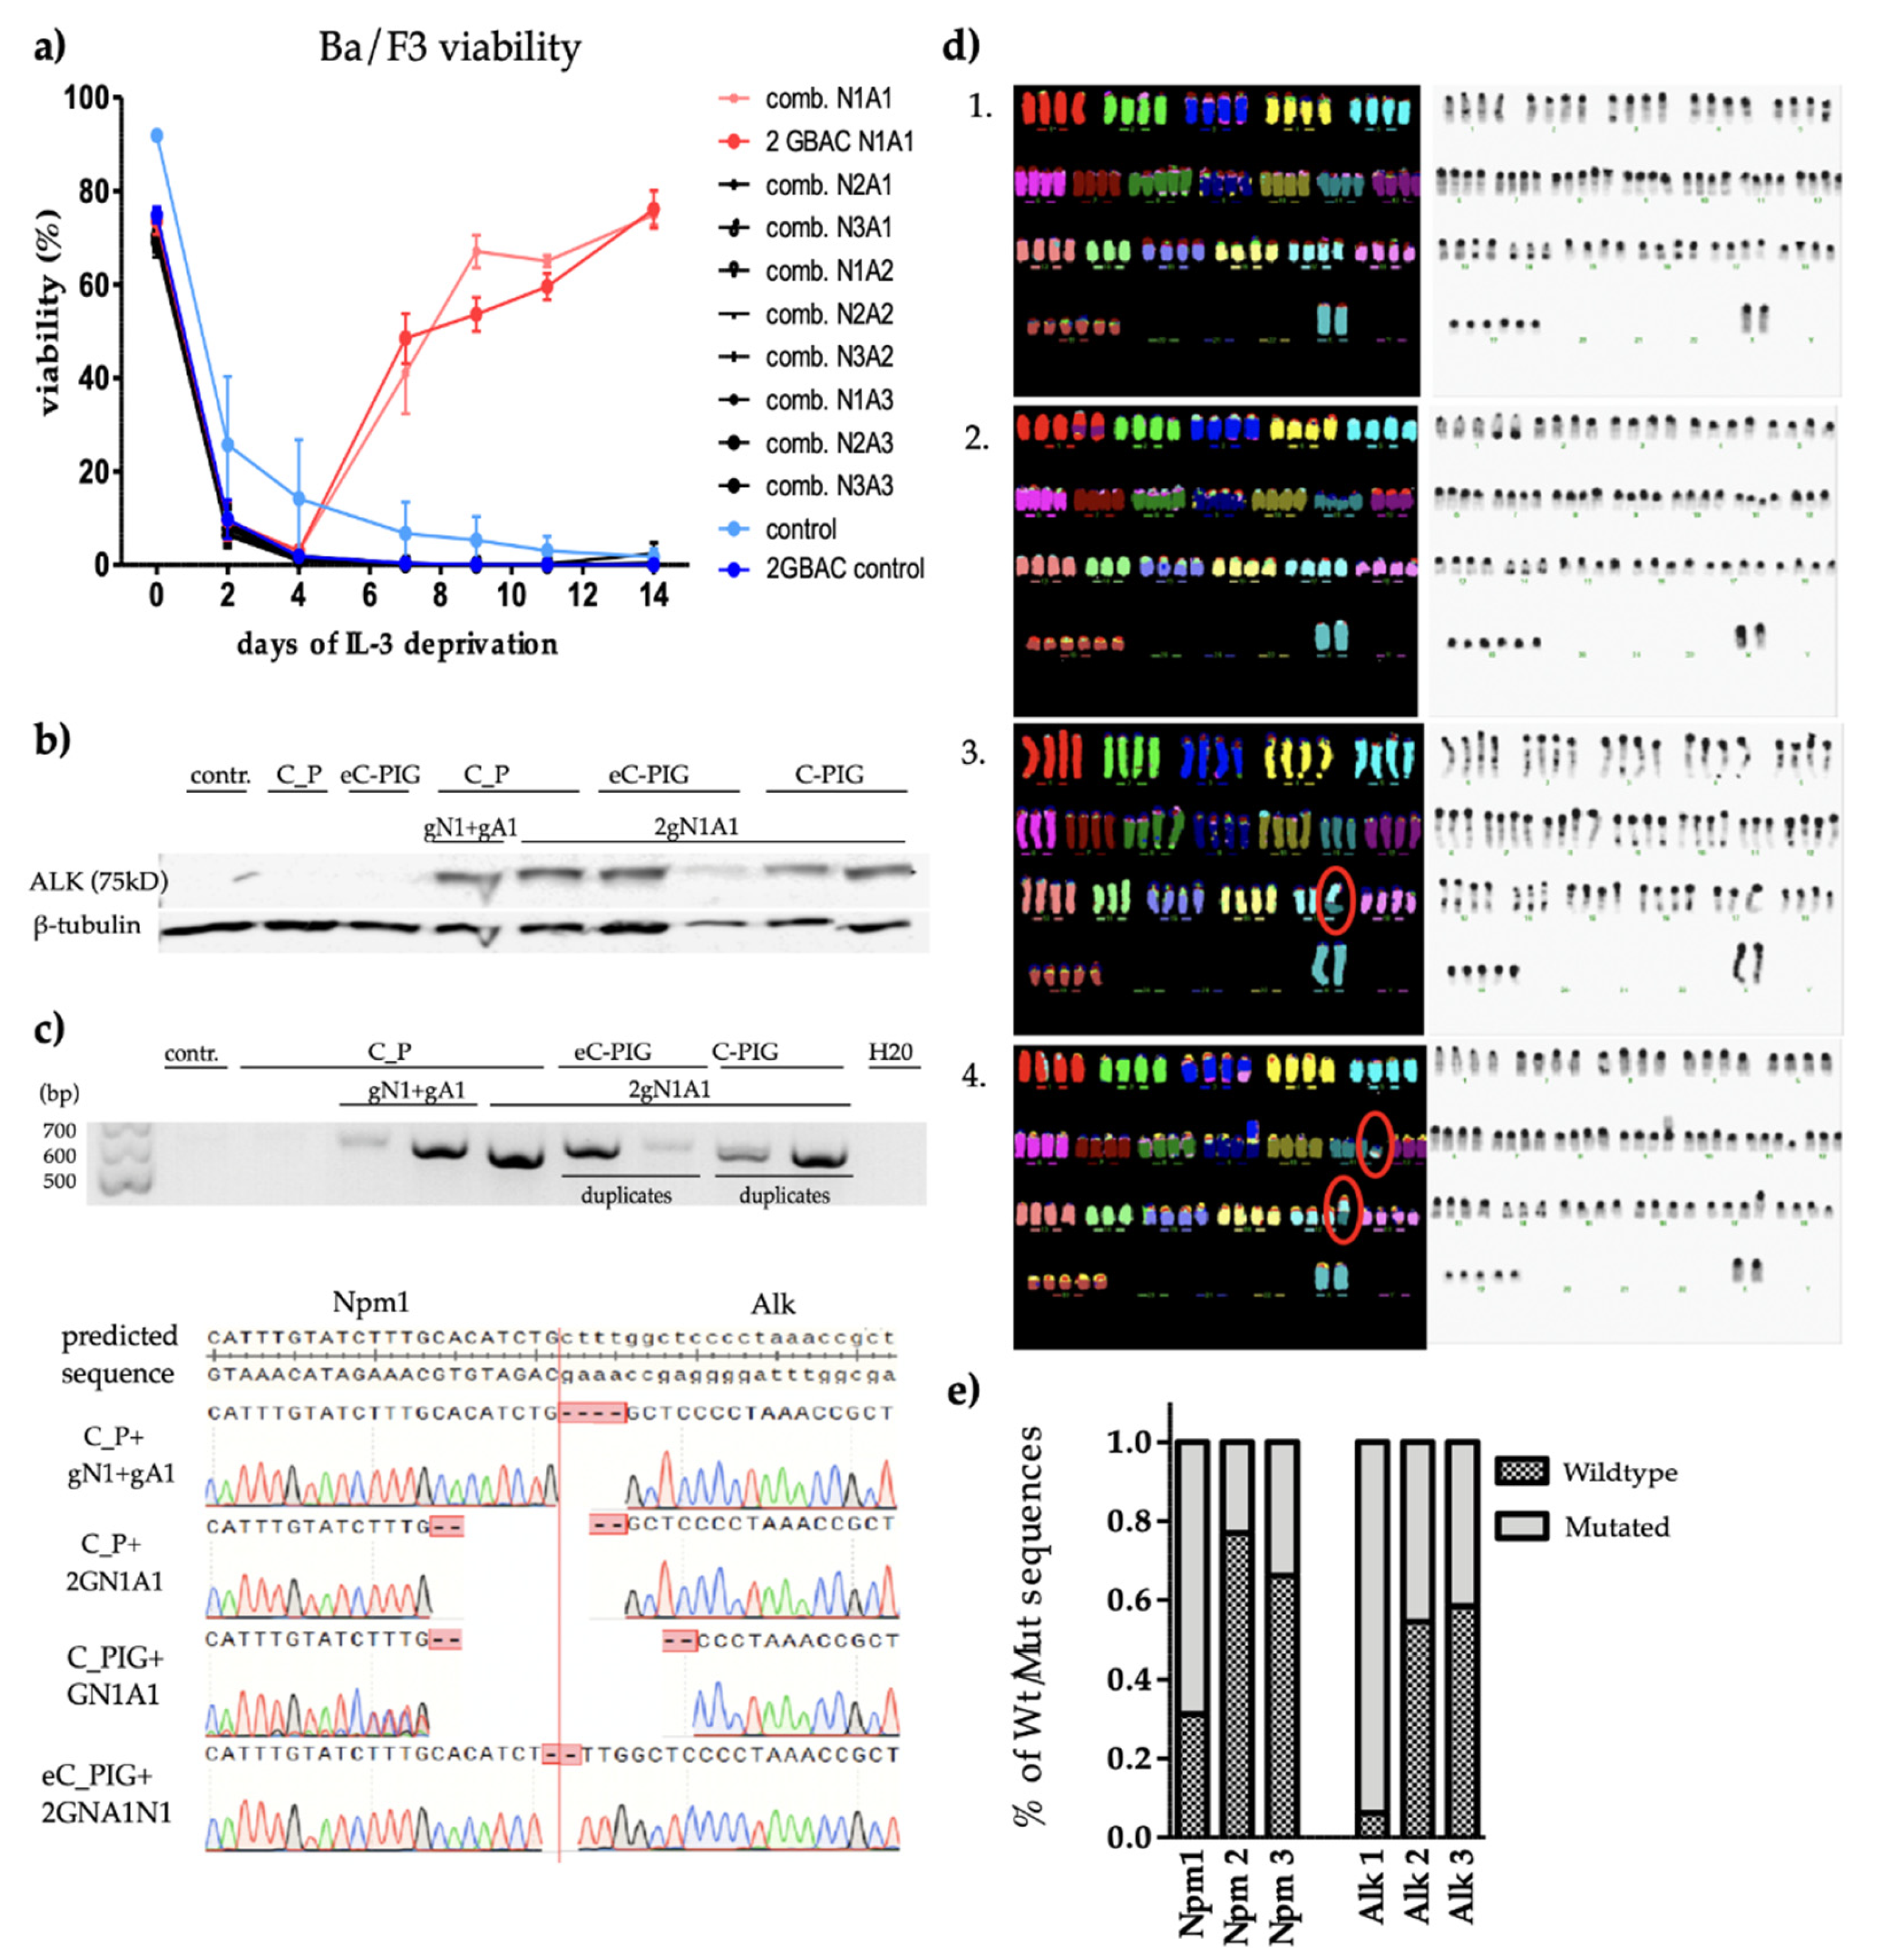
Figure 3.
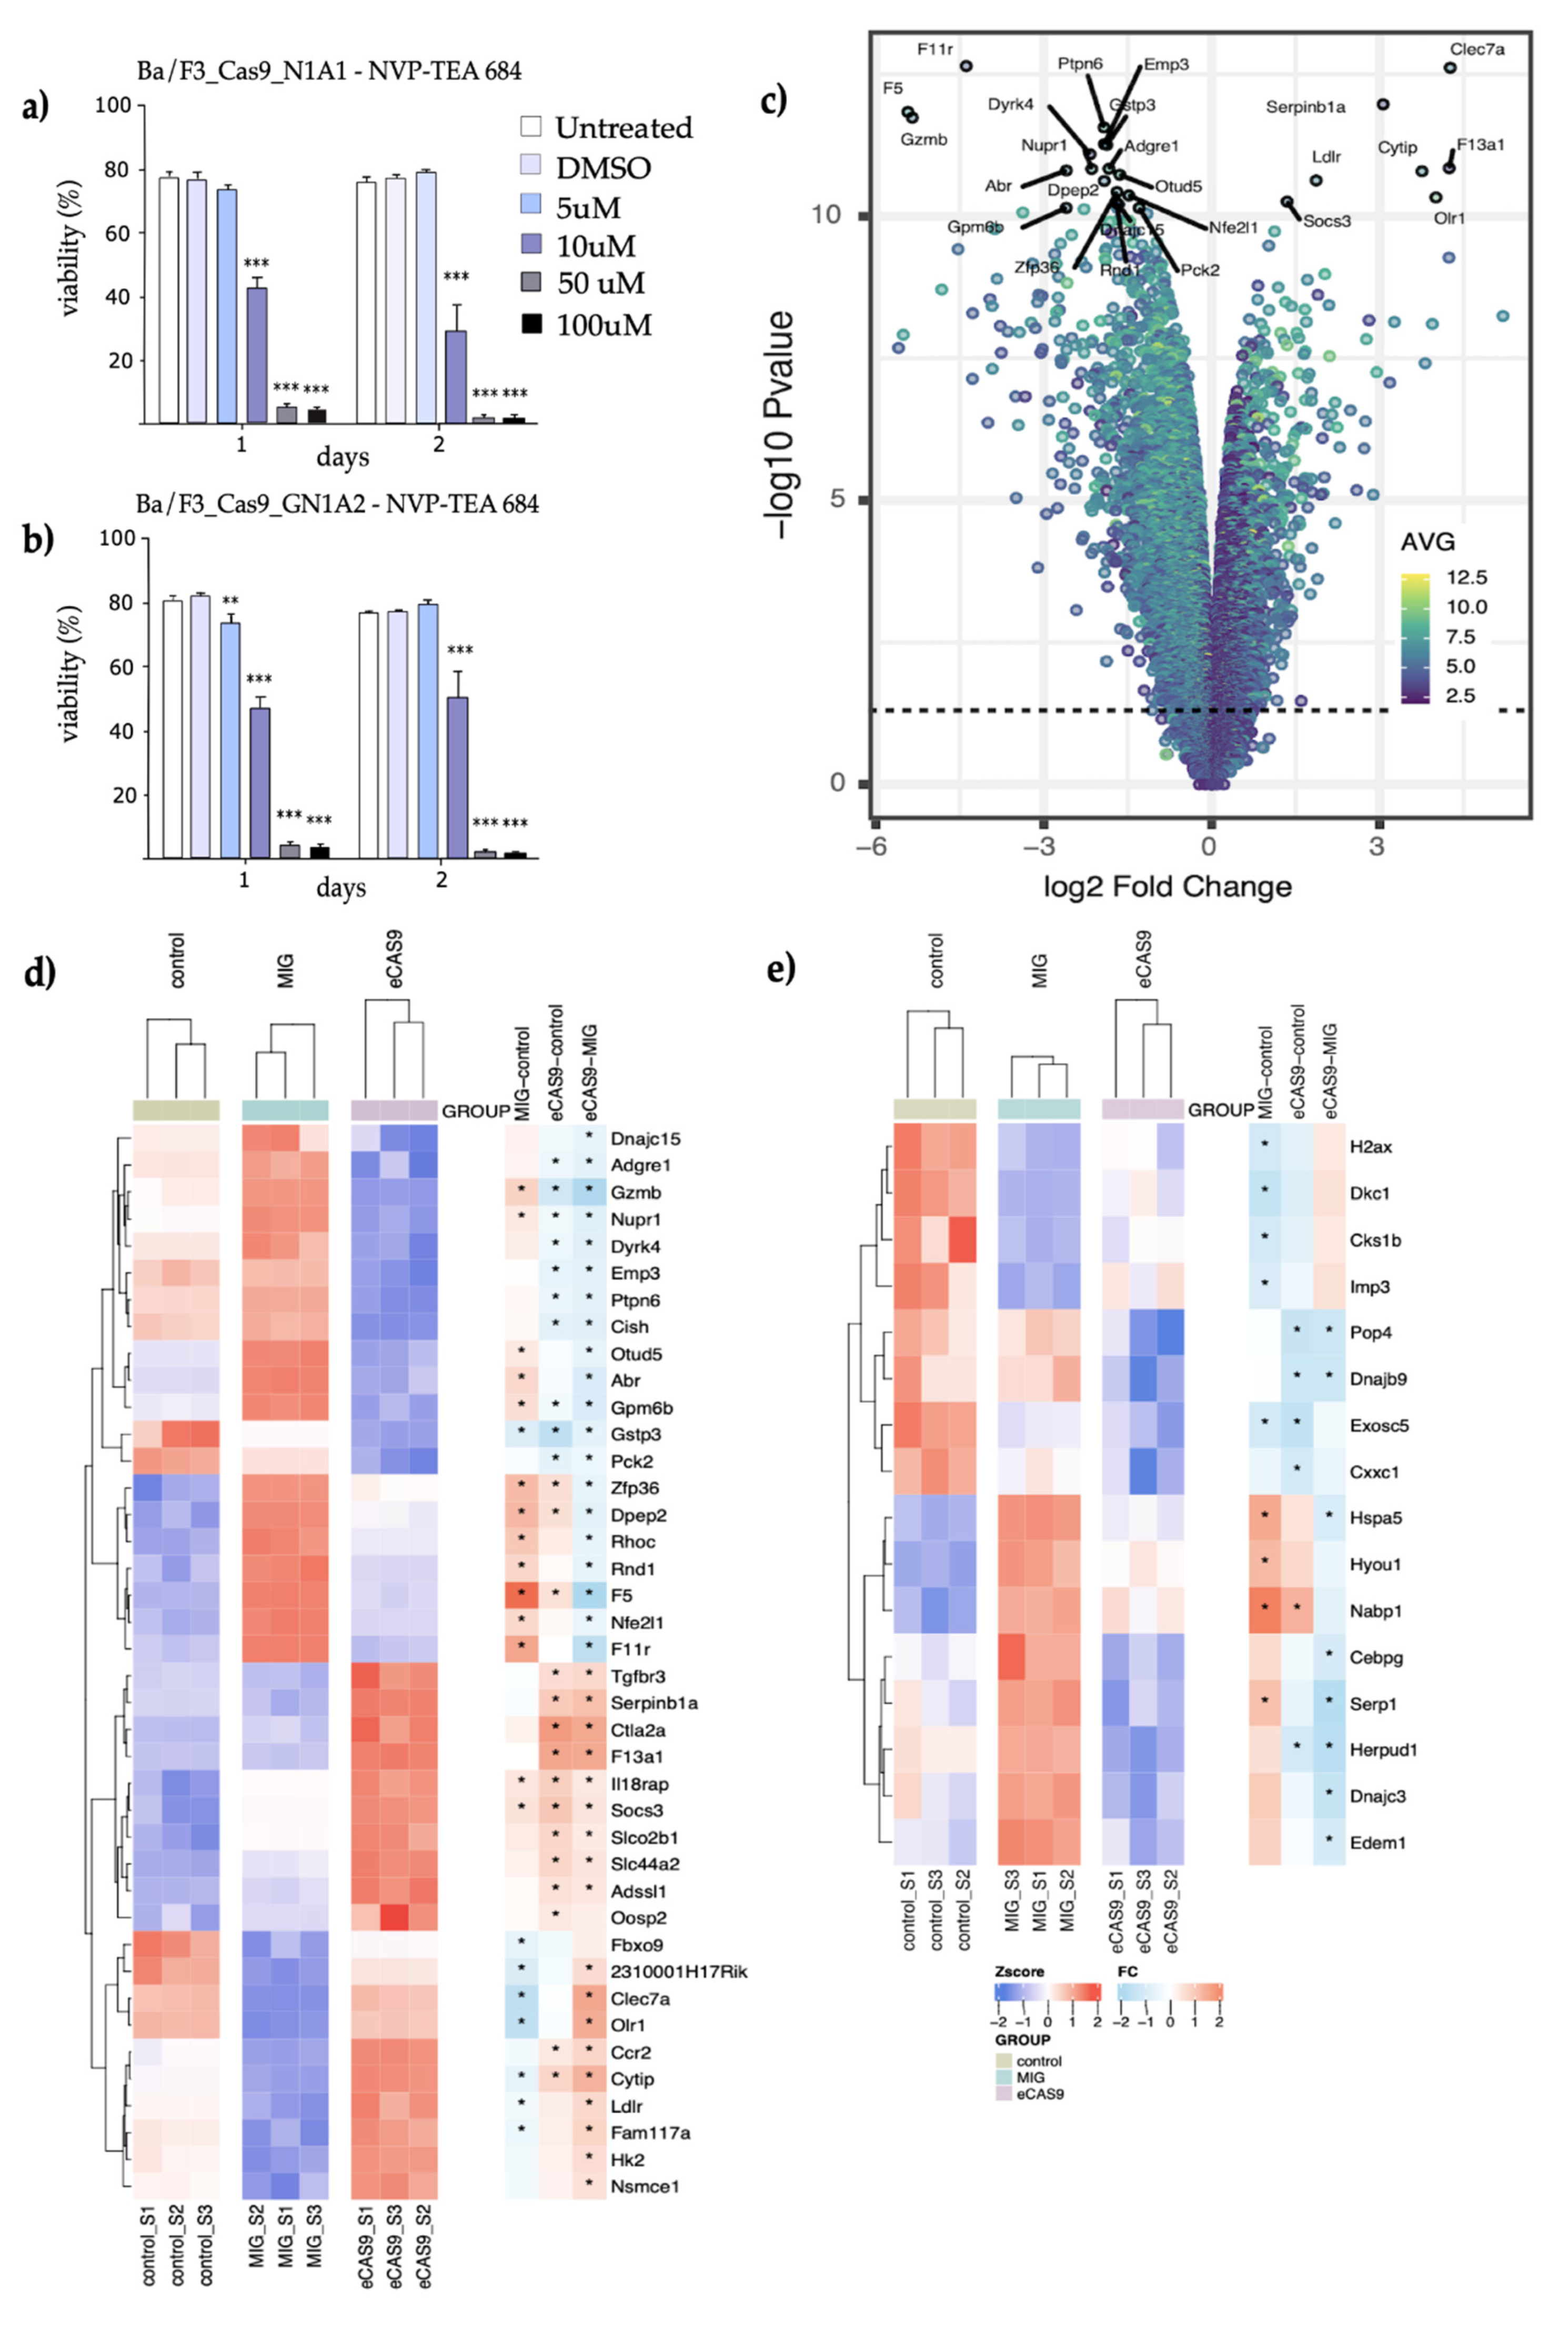
a) - c) Ba/F3_Cas9_N1A1 and Ba/F3_Cas9_2GN1A2 cells treated with different concentration of the Alk inhibitor (NVP-TAE648), viability was monitored via flow cytometry over the course of 48 hours (performed in technical triplicates), Ba/F3_Cas9 cells were used as negative control.Significance was tested compared to the untreated control on each day with a p-value of p<0,05 (*), p<0,01 (**) or p<0,001 (***). d) Gene set enrichment analysis comparing gene expression levels between MIG cDNA expressing cells to eCAS9 NPM-ALK translocated cells and a control group. e) Log2 fold Change in gene expression pattern in Ba/F3 cells transformed by CRISPR-mediated Npm-Alk translocation in comparison to Ba/F3 cells overexpressing the Npm-Alk cDNA.
Figure 3.
a) - c) Ba/F3_Cas9_N1A1 and Ba/F3_Cas9_2GN1A2 cells treated with different concentration of the Alk inhibitor (NVP-TAE648), viability was monitored via flow cytometry over the course of 48 hours (performed in technical triplicates), Ba/F3_Cas9 cells were used as negative control.Significance was tested compared to the untreated control on each day with a p-value of p<0,05 (*), p<0,01 (**) or p<0,001 (***). d) Gene set enrichment analysis comparing gene expression levels between MIG cDNA expressing cells to eCAS9 NPM-ALK translocated cells and a control group. e) Log2 fold Change in gene expression pattern in Ba/F3 cells transformed by CRISPR-mediated Npm-Alk translocation in comparison to Ba/F3 cells overexpressing the Npm-Alk cDNA.
Disclaimer/Publisher’s Note: The statements, opinions and data contained in all publications are solely those of the individual author(s) and contributor(s) and not of MDPI and/or the editor(s). MDPI and/or the editor(s) disclaim responsibility for any injury to people or property resulting from any ideas, methods, instructions or products referred to in the content. |
© 2025 by the authors. Licensee MDPI, Basel, Switzerland. This article is an open access article distributed under the terms and conditions of the Creative Commons Attribution (CC BY) license (http://creativecommons.org/licenses/by/4.0/).
Copyright: This open access article is published under a Creative Commons CC BY 4.0 license, which permit the free download, distribution, and reuse, provided that the author and preprint are cited in any reuse.


