
Submitted:
27 May 2025
Posted:
28 May 2025
You are already at the latest version
Abstract
Multi-criteria Decision Making (MCDM) could be the key towards truly holistically green sustainability, within the context of chemical process plants (CPPs). ASPEN Plus v12.0 was utilised for two representative CPP cases: isopropanol (IPA) via isopropyl acetate, and green ammonia (NH3) production. An integrated Fuzzy Analytic Hierarchy Process (FAHP) and Technique for Order of Preference by Similarity to Ideal Solution (TOPSIS) was modelled in MATLAB, to prioritise the holistically green and sustainable pathways. Life cycle assessments (LCAs) were employed to select the pathways, and the most suitable sub-criteria per four criteria: social, economic, environmental, and technical. In descending order of optimality, the pathways were ranked as follows for green NH3 and IPA, respectively: Hydropower (HPEA) > Wind Turbine (WGEA) > Biomass Gasification (BGEA)/Solar Photovoltaic (PVEA) > Nuclear High Temperature (NTEA), and Propylene Indirect Hydration (IAH) > Direct Propylene Hydration (PH) > Acetone Hydrogenation (AH). Sensitivity analysis evaluated the FAHP-TOPSIS framework to be overall robust. However, there are potential uncertainties within and/or among sub-criteria, particularly in the social dimension, due to software and data limitations. Future research would seek to integrate FAHP with VIKOR, and Preference Ranking Organization Method for Enrichment Evaluation (PROMETHEE-II).
Keywords:
Multi-criteria Decision Making
; AHP
; TOPSIS
; Ammonia
; Isopropanol
; Life Cycle Assessment
1. Introduction
Multi-criteria Decision Making/Analysis (MCDM/A) is an instrumental research branch of decision-making theory [1]. MCDM/A can be divided into two categories: Multi-objective Decision Making (MODM) and Multi-attribute Decision Making (MADM). MODM involves obtaining a set of continuous, competing alternatives—from two or more criteria—that require simultaneous optimisation, with respect to constraints via multi-objective programming; examples include genetic algorithm (GA) and Particle Swarm Optimisation (PSO) [1-3].
In comparison, MADM looks at problems that have a limited number of discrete, predetermined alternatives; examples include Complex Proportional Assessment (COPRAS) and its progenitor method, Simple Additive Weighting (SAW) [2,3]. Due to their versality and multi-dimensional applications, MCDM methods have been implemented throughout various disciplines, from (municipal solid) waste management, to the production of raw materials [4-6]. MCDM/A can be utilised individually or as part of an integrated model, such as fuzzy Analytic Hierarchy Process (FAHP) or FAHP-Technique for Order of Preference by Similarity to Ideal Solution (TOPSIS). Resultantly, different MCDM methods can provide varying ranking results based on their methodologies and the decision-makers themselves [7]. Decision-makers can then class and prioritise alternative solutions, based on criteria rankings, and choose which one is the overall “best” [8-11]. A simple example of a MCDM process is provided in Figure 1.
In more recent years, MCDM/A methods have enabled decision-makers to approach green sustainability and sustainable development from a more holistic perspective. This is increasingly more important, as human society and the environment may suffer from severe and irreversible consequences [9-11,13]. Sustainability has existed as a concept for centuries, but it is only in the past century that humanity started to grow aware of the consequences in various dimensions; socially, economically, and/or environmentally [14-17]. MCDM/A could be the key towards achieving green sustainability in chemical process plants (CPPs), in a holistic approach that has not been fully explored in past literature [18-22]. An integrated MCDM framework (FAHP-TOPSIS) was used to prioritise holistically green and/or sustainable pathways for two representative CPP case studies: isopropanol (IPA) synthesis via isopropyl acetate, and green NH3 production.
2. Materials and Methods
2.1. FAHP-TOPSIS
The FAHP-TOPSIS model was coded in MATLAB by Li et al (2023). FAHP was used to derive the criteria weights for MCDM evaluation, based on said criteria and sub-criteria, with more accuracy and reliability than the standard AHP methodology. FAHP enabled the use of linguistic “fuzzy” variables for non-numerical (i.e. qualitative) data in MCDM, with Saaty’s relatively straightforward 1-9 pairwise comparison scoring system [20], so long as they were converted into corresponding and/or reciprocal triangular fuzzy numbers (TFNs). This was achieved via a linguistic-based fuzzy comparison matrix, as shown in Appendix A, in which linguistic-based judgements share corresponding TFNs [45] that can then be processed for straightforward application(s) in TOPSIS/additional MCDM ranking methods. TOPSIS was selected for reliable and accurate ranking, due to the availability of MATLAB code, and its many similarities to VIKOR. Section 3.3.1 outlines the TOPSIS methodology in a step-by-step process [23,29].
Flexibility is one of the key attributes of AHP, in addition to its simplicity, ease of use, and its ability—by itself—to make consistent judgements [18,20,22]. However, a certain level of complexity is still required to establish the context of the problem [22], albeit it also cannot compromise the flexibility of the AHP framework [12,21]. Due to its high flexibility, an increasing number of studies have adopted hybridised AHP frameworks with fuzzy logic [6,23]. FAHP has been integrated and/or used in conjunction with fuzzy variations of techniques like VIKOR, PROMETHEE, and genetic programming; this helps address the limitations of each individual approach and optimises the overall decision-making process [6,18,24]. However, AHP is not without its weakness or limitations; interdependency among alternatives, data needing to be collected from experience, and overemphasis/underemphasis of criteria by decision-makers [23,25].
In comparison, TOPSIS was first developed and presented by Hwang & Yoon in 1981 [5,23,26,27]. Alternatives are evaluated and chosen based on their respective distances from the positive-ideal solution (i.e. maximisation of positive criteria; minimisation of negative criteria) and the negative-ideal solution (i.e. maximisation of negative criteria; minimisation of positive criteria) [5,23,25]. The key advantages of TOPSIS are that decision-makers do not need to implement numerous inputs, high computational efficiency, and that the outputs are relatively straightforward to read and understand [23,25,28]. TOPSIS also utilises criteria information to its fullest, while not requiring criteria to be independent, albeit this is only possible when all information is available and accurate [25,28]. Moreover, while there are advantages, TOPSIS does have two notable weaknesses: the requirement of vector normalisation for multi-dimensional problems [23,28], and the relative importance of the distances for the ideal solutions is not properly considered [25,27]. Additionally, a potential weakness/limitation to TOPSIS, is the use of crisp data values. Real-life scenarios are often fraught with uncertainty and relativity [26], which is why the incorporation of fuzzy logic to TOPSIS has become more popular [28,29].
A consistency level of ≤10% (CR≤0.1) was deemed as acceptable [30,31]. To minimise the potential information loss during weight aggregation, the combined coefficient u=0.5 had been assigned. It should also be noted that there is no single ideal method to deriving criteria (and sub-criteria) weights; the literature has varying methodologies that can be equally valid [20,31,32], and thus depends on the surrounding circumstances. Fuzzy pairwise judgement matrices were established for the first layer index (Appendix B) and sub-criteria of each criterion (Appendix C and Appendix D). Said matrices were derived from group evaluations and literature findings. Because CR≤0.1 for all matrices, the consistency levels were deemed acceptable. To derive the objective weights, data must first be normalised in TOPSIS via vector normalisation, due to the differences in scales and/or units of measurement. Positive indicators and negative indicators were calculated via Equation 10 and Equation 11, respectively. Entropy weighting is utilised to calculate the objective (sub-criteria) weights, Wo. Section 3.3.2 elaborates on the calculations of objective (Wo), comprehensive (subjective) (Wc), and combination weights (Wi) in Eqs.12-17.
2.2. Case Studies
An IPA plant at the Sinopec Zhenhai Refining & Chemical Co., Ltd was simulated via ASPEN. The main raw material was propylene, one of the by-products of a related ethylene company project. An annual plant capacity of 80,000 tons of ultra-pure, electronic-grade IPA was specified, produced (along with 51,000 tons of anhydrous ethanol annually) via the esterification with acetic acid, subsequent hydrogenation, and double-effect distillation. Said IPA has a purity of ~99.99%, while the anhydrous ethanol has a >99.5% purity. The technologies behind the processes were upgraded in accordance with “Made in China 2025 (MIC2025)” green development targets [33,34]. Due to its location on one of the company’s reserved development sites, the IPA plant simulation benefits from the following: favourable geography, support from local policies, a plentiful supply of raw material, and well-developed infrastructure (e.g. transportation network). Figure 2 illustrates the process flow diagram, with the entire process simulation in Figure 3, and the plant layout in Figure 4.
A small-scale and modular green NH3 production case study was simulated via Peng-Robinson (PENG-ROB) in ASPEN Plus v12.0. PENG-ROB is the one of the most popular property methods for NH3 production, primarily due to its high reliability and applicability to various system types. This includes (relatively) non-ideal systems, in contrast to the Soave-Redlich-Kwong equation [35]. The standard 3:1 ratio between H2 and N2 was decided for the reaction, R-1, to synthesise liquid ammonia. The flowsheet model for clean, modularised NH3 production (Figure 5) via hydrolysis can be divided into three ‘modules’, all developed by Arrarte (2022): gaseous hydrogen generation via the desalinisation of seawater coupled with PEM electrolysis (blue), gaseous nitrogen via ASU that utilises a cryogenic distillation process (red), and NH3 synthesis (green).
Table 1 shows the potential pathways that were identified via LCAs for each case study. The integrated FAHP-TOPSIS framework covers four criteria regarding IPA and green NH3 production: technical, economic, environmental, and social. Each criterion has three sub-criteria that were specific to each case study (Table 2 and Table 3) were derived based on prevalence and prominence throughout even relatively up-to-date literature [9,36,37]. Three sub-criteria per criterion was decided as the appropriate number; too few would be unusable in the MATLAB model, while too many would have increased the likelihood of data distortion, such as rank reversal). The literature review highlights an apparent lack of in-depth literature that explores the social dimension of holistically green sustainability over the past few decades, and even quite recently, despite the increasing awareness and necessity of holistically green sustainability. Therefore, the social (and by extension, the political) criteria for each case study has been expanded with a greater number of CPP-specific social sub-criteria for MCDM. This was based upon literature findings from Stojcic et al. (2019), Fonseca et al. (2021), Guati-Rojo et al. (2021), and Kurien & Mittal (2022).

Table 1.
Potential green and/or sustainable pathways for IPA synthesis and green NH3 production.
| Case study | Potential pathways |
|---|---|
| IPA via isopropyl acetate | 1. Direct Propylene Hydration (PH) 2. Propylene Indirect Hydration (IAH) Acetone Hydrogenation (AH) |
| Green NH3 | 1. Wind turbine electrolysis (WGEA) 2. Solar photovoltaic electrolysis (PVEA) 3. Hydropower electrolysis (HPEA) 4. Biomass gasification electrolysis (BGEA) 5. Nuclear high temperature electrolysis (NTEA) |
Table 2.
Criteria and sub-criteria for IPA: technical (tech), economic (econ), environmental (env), and social (soc).
Table 2.
Criteria and sub-criteria for IPA: technical (tech), economic (econ), environmental (env), and social (soc).
| Tech (A) | Econ (B) | Env (C) | Soc (D) |
|---|---|---|---|
| A1: Conversion rate | B1: Total operational costs | C1: Human toxicity | D1: Intrinsic safety |
| A2: IPA selectivity | B2: Process complexity | C2: CO2 emissions | D2: Policy relevance |
| A3: Tech maturity | B3: Total annual costs | C3: Pollution | D3: Public perception |
Table 3.
Criteria and sub-criteria for green ammonia production: environmental (env), economic (econ), social
(soc), and technical (tech).
Table 3.
Criteria and sub-criteria for green ammonia production: environmental (env), economic (econ), social
(soc), and technical (tech).
| Env (A) | Econ (B) | Soc (C) | Tech (D) |
|---|---|---|---|
| A1: Biodiversity loss | B1: Total operational costs | C1: Employer safety | D1: Exergy efficiency |
| A2: GHG emissions | B2: Sales prices | C2: Policy applicability | D2: Energy efficiency |
| A3: Global Warming Potential | B3: Net Present Value potential | C3: Public perception | D3: Green performance |
3. Results
3.1. FAHP-TOPSIS
TOPSIS was applied to rank the IPA and green NH3 production pathways. Because the pathway data has already been normalised and transformed into Pij (Appendix E), further manual data processing was not required for the calculations in this section. Only the following sub-criteria weights were used in the ranking calculations: Wo, Wc, and Wi. Said sub-criteria weights were agreed to cover the overall encompassing ‘perspective’ of each pathway, in terms of holistically green sustainability. Table 4 and Table 5 contains the results for the weight aggregation, that were derived from the results in Appendix F.
Table 4.
All weight results by sub-criteria for the IPA synthesis pathways. A=Tech, B=Econ, C=Env, D=Soc.
Table 4.
All weight results by sub-criteria for the IPA synthesis pathways. A=Tech, B=Econ, C=Env, D=Soc.
| Criteria | Sub-criteria | Ws | Wc | CR | Wo | Wi |
|---|---|---|---|---|---|---|
| A | A1 | 0.372 | 0.0455 |
0.0873 |
0.0735 | 0.0607 |
| A2 | 0.221 | 0.0270 | 0.0769 | 0.0479 | ||
| A3 | 0.407 | 0.0499 | 0.0675 | 0.0609 | ||
| B | B1 | 0.418 | 0.168 | 0.0566 | 0.0732 | 0.116 |
| B2 | 0.249 | 0.100 | 0.0675 | 0.0863 | ||
| B3 | 0.333 | 0.134 | 0.0914 | 0.116 | ||
| C | C1 | 0.489 | 0.142 | 0.0455 | 0.0727 | 0.107 |
| C2 | 0.296 | 0.0859 | 0.0734 | 0.0834 | ||
| C3 | 0.216 | 0.0626 | 0.0675 | 0.0683 | ||
| D | D1 | 0.454 | 0.0839 | 0.0349 | 0.0769 | 0.0843 |
| D2 | 0.325 | 0.0601 | 0.183 | 0.110 | ||
| D3 | 0.221 | 0.0408 | 0.0769 | 0.0588 |
Table 5.
All weight results by sub-criteria for the green NH3 production pathways. A=Env, B=Econ, C=Soc, D=Tech.
Table 5.
All weight results by sub-criteria for the green NH3 production pathways. A=Env, B=Econ, C=Soc, D=Tech.
| Criteria | Sub-criteria | Ws | Wc | CR | Wo | Wi |
|---|---|---|---|---|---|---|
| A | A1 | 0.372 | 0.0455 |
0.0873 |
0.0735 | 0.0607 |
| A2 | 0.221 | 0.0270 | 0.0769 | 0.0479 | ||
| A3 | 0.407 | 0.0499 | 0.0675 | 0.0609 | ||
| B | B1 | 0.418 | 0.168 | 0.0566 | 0.0732 | 0.116 |
| B2 | 0.249 | 0.100 | 0.0675 | 0.0863 | ||
| B3 | 0.333 | 0.134 | 0.0914 | 0.116 | ||
| C | C1 | 0.489 | 0.142 | 0.0455 | 0.0727 | 0.107 |
| C2 | 0.296 | 0.0859 | 0.0734 | 0.0834 | ||
| C3 | 0.216 | 0.0626 | 0.0675 | 0.0683 | ||
| D | D1 | 0.454 | 0.0839 | 0.0349 | 0.0769 | 0.0843 |
| D2 | 0.325 | 0.0601 | 0.183 | 0.110 | ||
| D3 | 0.221 | 0.0408 | 0.0769 | 0.0588 |
Di+ and Di- represent the distances from the positive (Equation 11) and negative (Equation 12) ideal solutions, respectively, with u=0.5. Lower Di+ values denote smaller deviations from the positive-ideal solutions and consequently a higher-ranked pathway(s) (Xu et al., 2018). Therefore, IAH and HPEA are the most optimal pathways for their respective case studies. Moreover, the use of individual and combination weights served to validate the pathway rankings via TOPSIS and suggests relatively high ranking stability, albeit this assumption does not consider the impacts of sensitivity analysis (Figure 6 and Figure 7). Table 6 illustrates the distances for IPA and green NH3 pathways.
Goodness-of-fit is the degree of fitness of each potential pathway to the Di- and Di+ values, in accordance with Equation 13. No significant deviations were apparent in the results of each weight type. Moreover, goodness-of-fit for the Di+ (Ci+) appears to be in-line with the pathway rankings for each case study. Table 7 shows the goodness-of-fit, Ci- and Ci+, for each potential pathway in IPA and green NH3 production. Criterion weight (A-D) was altered at +0.1 increments, from +0 to +0.9, with a total of 40 variations with respect to the calculated Ci+ values. Figure 6 and Figure 7 show relative stability for each pathway respective of both case studies, with negligible change(s) in Ci+ for Wi in response to criterion weight change.
3.2. Formatting of Mathematical Components
3.2.1. TOPSIS
3.2.2. Weight calculations
4. Discussion
The FAHP-TOPSIS framework optimises the decision-making process regarding IPA and green NH3 production via pathway prioritisation, based on case-specific criteria and/or sub-criteria, from a holistically green and/or sustainable perspective. FAHP enabled the use of qualitative data via TFNs for criteria and sub-criteria weighting. TOPSIS was selected to rank the pathways, due to its relative stability, accuracy, and available model in MATLAB by Li et al. (2023). The “decision-makers” in this paper are regarded as a more homogeneous identity, primarily for the sake of ease and to focus on the MCDM framework. In real-life, the composition of decision-makers would be more explicitly diverse, from industry professionals to more business-orientated backgrounds.
IAH (0.250) and HPEA (0.180) were prioritised as the most optimal pathways, because they had the smallest Di+ values in Wi, for their respective case studies. Likewise, the least optimal pathways were identified as AH (0.551) and NTEA (0.388). Therefore, the most to least optimal pathways for IPA were IAH>PH>AH. However, there might be slight contention between the prioritisation of PH and AH, due to the closeness in Di+ values. The green NH3 pathways were prioritised as follows: HPEA>WGEA>BGEA/PVEA>NTEA, in which the close Di+ values may also cause contentious ranking between BGEA and PVEA, particularly dependent on criteria and/or sub-criteria weighting. Overall, Ci+ values for Wi aligns with this order of pathway prioritisation, in terms of balance and stability. And as it was highly recommended in the literature, sensitivity analysis (Appendices K-L) was thus carried out to evaluate the overall robustness of the FAHP-TOPSIS framework.
That said, there are uncertainties among sub-criteria by themselves and in relation to each other, especially in terms of potential changes over time. The degree of uncertainty could be attributed to a lack of access to reliable and accurate software, such as that for techno-economic analysis. Sub-criteria like NPV, policy applicability, and equipment costs can be greatly influenced on the contingent of various spatial-temporal and often multi-dimensional drivers; this includes seasonal variations in feedstock supply, local/regional/national socio-political factors, and transportation logistics [49-51]. Model development is contingent on a relatively case-to-case basis, especially if it is designed to be optimised towards truly holistically green sustainability in any CPP.
Therefore, future works should seek to develop and implement a more robust and reliable framework for further overall optimisation; specifically, an integrated FAHP-VIKOR with PROMETHEE-II framework, with a more explicit integration of process systems engineering (PSE) tools, such as LCAs, LCCA, and social-LCAs. VIKOR, while similar to TOPSIS, has normalised values that are independent of the criterion’s evaluation unit via linear normalisation instead of TOPSIS’ vector normalisation [22,30]. Furthermore, VIKOR can provide a more reliable representation of decision-maker viewpoints via compromise solutions without data distortion [30], especially as closeness to the ideal solution may not equate to the most ideal solution(s) [22]. PROMETHEE-II is a popular MCDM method in green sustainable research fields, because it allows for a complete ranking of alternatives [22,36,39]. Additionally, it has a relatively high level of stability and reliability, while also providing decisive results with/without grey data, and without the pre-requisite data normalisation [23,38]. FAHP would provide the appropriate criteria and sub-criteria weightings via decision-makers, which mitigates one of PROMETHEE’s key potential weaknesses; questionably reliable criteria/sub-criteria weighting [25,31].
5. Conclusions
The FAHP-TOPSIS framework serves to validate the implementation of an integrated MCDM framework for prioritising holistically green IPA and NH3 production pathways. However, data must be clearly processed to maximise the understanding and effectiveness of the FAHP-TOPSIS framework. According to the Di+ and Ci+ values (Table 6 and Table 7), the most to least optimal pathway for IPA is IAH>PH>AH, albeit there might be slight contention over the prioritisation of PH and AH, as well as BGEA and PVEA. Meanwhile, the most to least optimal pathway for green NH3 is as follows: HPEA>WGEA>BGEA/PVEA>NTEA. Said orders of pathway prioritisation is further validated via sensitivity analysis for each criterion, which show negligible changes in Ci+ relative to weight change (Appendices K-L) and thus a robust MCDM framework. Moreover, the Ci+ values for Wi aligns with this order of pathway prioritisation, from a more balanced and stable perspective. However, while the MCDM results can provide an overall perspective in respect to each criterion, there are uncertainties among sub-criteria by themselves and in relation to each other, especially in terms of potential changes over time; exact equipment costs, NPV, and the specific social perceptions regarding the case studies.
Nevertheless, the FAHP-TOPSIS framework demonstrates that MCDM can implement greater optimisation within chemical process plants (CPPs) via pathway prioritisation based on holistically green and/or sustainable, case-specific criteria and/or sub-criteria. Future research would seek to develop a more comprehensive sustainability governance platform. This would involve the systematic integration of process systems engineering (PSE) tools—(life-cycle assessments (LCAs), social-LCAs, and life-cycle cost analysis (LCCA)—via Sima Pro with an integrated MCDM framework (FAHP-VIKOR with PROMETHEE-II). The improved methodology framework will further validate the employment of integrated MCDM frameworks for various CPPs. VIKOR would provide a more reliable representation of decision-maker viewpoints, with minimal data distortion, and possible compromise solutions. PROMETHEE-II is commonly applied in green sustainable research fields, as it allows for a complete ranking of alternatives with a relatively high level of stability and reliability. Furthermore, decisive results can be derived with/without grey data, and without the requirement of data normalisation, unlike TOPSIS.
Author Contributions
For research articles with several authors, a short paragraph specifying their individual contributions must be provided. The following statements should be used “Conceptualization, Daniel Li, Zhaomin Li, and Mohamed G. Hassan-Sayed; methodology, Zhaomin Li, and Daniel Li; software, Mohamed G. Hassan-Sayed.; validation, Mohamed G. Hassan-Sayed, and Nuno Bimbo; formal analysis, Daniel Li, Zhaomin Li, and Mohamed G. Hassan-Sayed.; investigation, Zhaomin Li; resources, Mohamed G. Hassan-Sayed; data curation, Daniel Li, and Zhaomin Li; writing—original draft preparation, Daniel Li, and Zhaomin Li.; writing—review and editing, Daniel Li, and Zhaomin Li; visualization, Daniel Li, Zhaomin Li, Mohamed G. Hassan-Sayed; supervision, Mohamed G. Hassan-Sayed, and Nuno Bimbo; project administration, Mohamed G. Hassan-Sayed.; funding acquisition, N/A. All authors have read and agreed to the published version of the manuscript.
Funding
This research received no external funding.
Data Availability Statement
The raw data supporting the conclusions of this article will be made available by the authors on request.
Acknowledgments
I would like to thank my supervisors, Dr Mohamed G. Hassan-Sayed and Dr Nuno Bimbo, for providing advice and mentorship over the course of my degree. Moreover, I would also like to thank Zhaomin Li for their tremendous work and contributions. Last but not least, I would like to thank my family and friends for their continued support throughout the years.
Conflicts of Interest
The authors declare no conflicts of interest.
Funding or Acknowledgement: The authors extend their appreciation to the Deanship of Research and Graduate Studies at King Khalid University for funding this work through Small Research Project under grant number RGP1/70/46.
Abbreviations
The following abbreviations are used in this manuscript:
| MDPI | Multidisciplinary Digital Publishing Institute |
| DOAJ | Directory of open access journals |
| TLA | Three letter acronym |
| LD | Linear dichroism |
Appendix A
Table A1.
Linguistic-based fuzzy comparison matrix of crisp AHP values to TFNs [38].
Table A1.
Linguistic-based fuzzy comparison matrix of crisp AHP values to TFNs [38].
| Linguistic variable | Crisp value (AHP) | TFN |
|---|---|---|
| Equally important (E) | 1 | (1,1,1) |
| Weakly important (W) | 2 | (1/2,1,3/2) |
| Fairly -- (F) | 3 | (1,3/2,2) |
| Strongly -- (S) | 4 | (3/2,2,5/2) |
| Very strongly -- (V) | 5 | (2,5/2,3) |
| Extremely -- (EI) | 6 | (5/2,3,7/2) |
Appendix B
Table A2.
First-layer (i.e., the criteria) subjective pairwise comparison matrix for IPA synthesis. REI, RV, and RF are the reciprocals of EI, V, and F, respectively.
Table A2.
First-layer (i.e., the criteria) subjective pairwise comparison matrix for IPA synthesis. REI, RV, and RF are the reciprocals of EI, V, and F, respectively.
| A | B | C | D | |
|---|---|---|---|---|
| A (Tech) | E | REI | RV | RF |
| B (Econ) | E | F | V | |
| C (Env) | E | F | ||
| D (Soc) | E |
Table A3.
First-layer subjective pairwise comparison matrix for green NH3 production. REI, RV, and RF are the reciprocals of EI, V, and F, respectively.
Table A3.
First-layer subjective pairwise comparison matrix for green NH3 production. REI, RV, and RF are the reciprocals of EI, V, and F, respectively.
| A | B | C | D | |
|---|---|---|---|---|
| A (Env) | E | REI | RV | RF |
| B (Econ) | E | F | V | |
| C (Soc) | E | F | ||
| D (Tech) | E |
Appendix C
Table A4.
Fuzzy judgements converted into TFNs with the CR, subjective criteria weights (Wr), and fuzzy synthetic extent values, S.
Table A4.
Fuzzy judgements converted into TFNs with the CR, subjective criteria weights (Wr), and fuzzy synthetic extent values, S.
| A | B | C | D | CR | Wr | S | |
|---|---|---|---|---|---|---|---|
| A | (1,1,1) | (2/7,1/3,2/5) | (1/3,2/5,1/2) | (1/2,2/3,1) | 0.0186 | 0.122 | 0.0887 0.122 0.182 |
| B | (5/2,3,7/2) | (1,1,1) | (1,3/2,2) | (2,5/2,3) | 0.402 | 0.272 0.408 0.596 |
|
| C | (2,5/2,3) | (1/2,2/3,1) | (1,1,1) | (1,3/2,2) | 0.290 | 0.188 0.289 0.439 |
|
| D | (1,3/2,2) | (1/3,2/5,1/2) | (1/2,2/3,1) | (1,1,1) | 0.185 | 0.119 0.182 0.282 |
Appendix D
Table A5.
Fuzzy judgement matrix for criterion A, where Ws = subjective sub-criteria weight.
| A | A1 | A2 | A3 | CR | Ws | S |
|---|---|---|---|---|---|---|
| A1 | (1,1,1) | (3/2,2,5/2) | (1/2,2/3,1) | 0.0873 | 0.372 | 0.247 0.373 0.570 |
| A2 | (2/5,1/2,2/3) | (1,1,1) | (1/2,2/3,1) | 0.221 | 0.156 0.220 0.338 |
|
| A3 | (1,3/2,2) | (1,3/2,2) | (1,1,1) | 0.408 | 0.247 0.407 0.633 |
Table A6.
Fuzzy judgement matrix for criterion B.
| B | B1 | B2 | B3 | CR | Ws | S |
|---|---|---|---|---|---|---|
| B1 | (1,1,1) | (3/2,1,2) | (1/2,2/3,1) | 0.0566 | 0.418 | 0.250 0.421 0.667 |
| B2 | (1/2,1,3/2) | (1,1,1) | (3/2,1,2) | 0.249 | 0.167 0.246 0.208 |
|
| B3 | (1,3/2,2) | (1/2,1,3/2) | (1,1,1) | 0.333 | 0.208 0.333 0.533 |
Table A7.
Fuzzy judgement matrix for criterion C.
| C | C1 | C2 | C3 | CR | Ws | S |
|---|---|---|---|---|---|---|
| C1 | (1,1,1) | (3/2,1,2) | (3/2,1,2) | 0.0455 | 0.489 | 0.324 0.492 0.723 |
| C2 | (1/2,1,3/2) | (1,1,1) | (1/2,2/3,1) | 0.296 | 0.195 0.295 0.442 |
|
| C3 | (1/2,1,3/2) | (1/2,2/3,1) | (1,1,1) | 0.216 | 0.154 0.213 0.321 |
Table A8.
Fuzzy judgement matrix for criterion D.
| D | D1 | D2 | D3 | CR | Ws | S |
|---|---|---|---|---|---|---|
| D1 | (1,1,1) | (1,3/2,2) | (3/2,2,5/2) | 0.0349 | 0.454 | 0.288 0.458 0.696 |
| D2 | (1/2,2/3,1) | (1,1,1) | (1,3/2,2) | 0.325 | 0.206 0.322 0.506 |
|
| D3 | (2/5,1/2,2/3) | (1/2,2/3,1) | (1,1,1) | 0.221 | 0.156 0.220 0.338 |
Appendix E
Table A9.
Characteristic proportion, Pij, values for the IPA pathways.
| A1 | A2 | A3 | B1 | B2 | B3 | C1 | C2 | C3 | D1 | D2 | D3 | |
|---|---|---|---|---|---|---|---|---|---|---|---|---|
| PH | 0.366 | 0.333 | 0.500 | 0.369 | 5.00E-05 | 0.239 | 6.25E-05 | 0.367 | 5.00E-05 | 6.67E-05 | 1.00E-04 | 0.667 |
| AH | 6.34E-05 | 0.667 | 0.500 | 6.30E-05 | 0.500 | 7.61E-05 | 0.375 | 6.33E-05 | 0.500 | 0.333 | 1.00E-04 | 0.333 |
| IAH | 0.634 | 6.67E-05 | 5.00E-05 | 0.631 | 0.500 | 0.761 | 0.625 | 0.633 | 0.500 | 0.667 | 1.00 | 6.67E-05 |
Table A10.
Characteristic proportion, Pij, values for the the green NH3 pathways.
| A1 | A2 | A3 | B1 | B2 | B3 | C1 | C2 | C3 | D1 | D2 | D3 | |
|---|---|---|---|---|---|---|---|---|---|---|---|---|
| WGEA | 0.0688 | 0.429 | 0.287 | 0.160 | 0.328 | 0.280 | 0.287 | 0.315 | 0.328 | 0.115 | 0.238 | 0.153 |
| PVEA | 0.0424 | 5.38E-05 | 0.00993 | 4.17E-05 | 0.525 | 0.134 | 0.287 | 0.315 | 0.230 | 5.48E-05 | 5.24E-05 | 0.153 |
| HPEA | 0.434 | 0.5384 | 0.347 | 0.121 | 0.0574 | 0.508 | 0.287 | 0.258 | 0.442 | 0.549 | 0.524 | 0.489 |
| BGEA | 0.455 | 0.0110 | 0.356 | 0.417 | 0.0902 | 5.08E-05 | 0.139 | 0.112 | 4.42E-05 | 0.0989 | 5.24E-05 | 0.204 |
| NTEA | 4.55E-05 | 0.0220 | 3.56E-05 | 0.301 | 5.24E-05 | 0.0784 | 2.87E-05 | 3.15E-05 | 4.42E-05 | 0.237 | 0.238 | 4.89E-05 |
Appendix F
Table A11.
ej, gj, and Wo results for each sub-criterion for the IPA synthesis pathways.
| Sub-criterion | ej | gj | Wo |
|---|---|---|---|
| A1 | 0.598 | 0.402 | 0.0735 |
| A2 | 0.580 | 0.420 | 0.0769 |
| A3 | 0.631 | 0.369 | 0.0675 |
| B1 | 0.600 | 0.400 | 0.0732 |
| B2 | 0.631 | 0.369 | 0.0675 |
| B3 | 0.501 | 0.500 | 0.0914 |
| C1 | 0.603 | 0.397 | 0.0727 |
| C2 | 0.599 | 0.401 | 0.0734 |
| C3 | 0.631 | 0.369 | 0.0675 |
| D1 | 0.580 | 0.420 | 0.0769 |
| D2 | 0.00186 | 0.998 | 0.183 |
| D3 | 0.580 | 0.420 | 0.0769 |
| SUM | 5.46 | ||
Table A12.
ej, gj, and Wo results for each sub-criterion for the green NH3 pathways.
| Sub-criterion | ej | gj | Wo |
|---|---|---|---|
| A1 | 0.646 | 0.354 | 0.102 |
| A2 | 0.516 | 0.484 | 0.139 |
| A3 | 0.708 | 0.292 | 0.0837 |
| B1 | 0.793 | 0.207 | 0.0594 |
| B2 | 0.675 | 0.325 | 0.0933 |
| B3 | 0.727 | 0.273 | 0.0784 |
| C1 | 0.838 | 0.162 | 0.0463 |
| C2 | 0.822 | 0.178 | 0.0511 |
| C3 | 0.662 | 0.338 | 0.0969 |
| D1 | 0.714 | 0.286 | 0.0820 |
| D2 | 0.636 | 0.364 | 0.104 |
| D3 | 0.777 | 0.223 | 0.0640 |
| SUM | 3.49 | ||
Appendix G
Table A13.
Original data for the three IPA pathways per each sub-criterion (without units). ‘+’ and ‘-’ denote positive and negative indicators, respectively.
Table A13.
Original data for the three IPA pathways per each sub-criterion (without units). ‘+’ and ‘-’ denote positive and negative indicators, respectively.
| PH | AH | IAH | |
|---|---|---|---|
| A1 (+) | 0.85 | 0.7 | 0.96 |
| A2 (+) | 0.96 | 0.97 | 0.95 |
| A3 (+) | 9 | 9 | 8 |
| B1 (-) | 5.532 | 7.245 | 4.321 |
| B2 (+) | 1 | 2 | 2 |
| B3 (-) | 9.638 | 10.441 | 7.879 |
| C1 (-) | 349.65 | 199.025 | 98.762 |
| C2 (-) | 1476.302 | 2032.015 | 1073.3 |
| C3 (+) | 1 | 2 | 2 |
| D1 (-) | 30 | 25 | 20 |
| D2 (+) | 1 | 1 | 2 |
| D3 (+) | 2 | 1 | 0 |
Table A14.
Original data for the five green NH3 pathways per each sub-criterion (with units, if applicable).
Table A14.
Original data for the five green NH3 pathways per each sub-criterion (with units, if applicable).
| WGEA | PVEA | HPEA | BGEA | NTEA | |
|---|---|---|---|---|---|
| A1, kg (-) | 0.82 | 0.87 | 0.13 | 0.09 | 0.95 |
| A2, kg CO2 eq (-) | 0.47 | 0.86 | 0.37 | 0.85 | 0.84 |
| A3, 10-2 kg Sb eq (-) | 0.35 | 0.63 | 0.29 | 0.28 | 0.64 |
| B1, M$;(t/day) (-) | 3.318 | 4.549 | 3.615 | 1.341 | 2.23 |
| B2 (+) | 0.231 | 0.279 | 0.165 | 0.173 | 0.151 |
| B3, % (+) | 27.3 | 14 | 47.9 | 1.9 | 9 |
| C1, scores (-) | 16 | 16 | 16 | 33 | 49 |
| C2(+) | 0.267 | 0.267 | 0.234 | 0.149 | 0.084 |
| C3(+) | 0.247 | 0.211 | 0.289 | 0.126 | 0.126 |
| D1, % (+) | 16.4 | 9.4 | 42.7 | 15.4 | 23.8 |
| D2 (+) | 0.204 | 0.179 | 0.234 | 0.179 | 0.204 |
| D3 (+) | 0.179 | 0.179 | 0.33 | 0.202 | 0.11 |
Appendix H
Table A15.
Normalised data for the IPA pathways.
| Constant added +0.0001 | PH | AH | IAH |
|---|---|---|---|
| A1 (+) | 0.577 | 0.0001 | 1.0001 |
| A2 (+) | 0.5001 | 1.0001 | 0.0001 |
| A3 (+) | 1.0001 | 1.0001 | 0.0001 |
| B1 (-) | 0.586 | 0.0001 | 1.0001 |
| B2 (+) | 0.0001 | 1.0001 | 1.0001 |
| B3 (-) | 0.314 | 0.0001 | 1.0001 |
| C1 (-) | 0.0001 | 0.600 | 1.0001 |
| C2 (-) | 0.580 | 0.0001 | 1.0001 |
| C3 (+) | 0.0001 | 1.0001 | 1.0001 |
| D1 (-) | 0.0001 | 0.5001 | 1.0001 |
| D2 (+) | 0.0001 | 0.0001 | 1.0001 |
| D3 (+) | 1.0001 | 0.5001 | 0.0001 |
Table A16.
Normalised data for the green NH3 pathways.
| Constant added +0.0001 | WGEA | PVEA | HPEA | BGEA | NTEA |
|---|---|---|---|---|---|
| A1, kg (-) | 0.151 | 0.0931 | 0.954 | 1.0001 | 0.0001 |
| A2, kg CO2 eq (-) | 0.796 | 0.0001 | 1.0001 | 0.0205 | 0.0409 |
| A3, 10-2 kg Sb eq (-) | 0.806 | 0.0279 | 0.972 | 1.0001 | 0.0001 |
| B1, M$;(t/day) (-) | 0.384 | 0.0001 | 0.291 | 1.0001 | 0.723 |
| B2 (+) | 0.625 | 1.0001 | 0.109 | 0.171975 | 0.0001 |
| B3, % (+) | 0.552 | 0.263 | 1.0001 | 0.0001 | 0.154 |
| C1, scores (-) | 1.0001 | 1.0001 | 1.0001 | 0.485 | 0.0001 |
| C2(+) | 1.0001 | 1.0001 | 0.820 | 0.355 | 0.0001 |
| C3(+) | 0.742 | 0.522 | 1.0001 | 0.0001 | 0.0001 |
| D1, % (+) | 0.210 | 0.0001 | 1.0001 | 0.180 | 0.433 |
| D2 (+) | 0.455 | 0.0001 | 1.0001 | 0.0001 | 0.455 |
| D3 (+) | 0.314 | 0.314 | 1.0001 | 0.418 | 0.0001 |
References
- REZAEI, J. 2015. Best-worst multi-criteria decision-making method. Omega, 53, pp.49-57.
- PENADÉS PLÀ, V. , GARCÍA-SEGURA, T., MARTÍ, J. & YEPES, V. 2016. A Review of Multi-Criteria Decision-Making Methods Applied to the Sustainable Bridge Design. Sustainability 2016, 8, 1295. [Google Scholar] [CrossRef]
- ZAVADSKAS, E. , ANTUCHEVICIENE, J. & CHATTERJEE, P. 2019. Multiple Criteria Decision Making (MCDM) Techniques for Business Processes Information Management. [CrossRef]
- WANG, J.-J. , JING, Y.-Y., ZHANG, C.-F. & ZHAO, J.-H. Review on multi-criteria decision analysis aid in sustainable energy decision-making. Renewable and Sustainable Energy Reviews 2009, 13, 2263–2278. [Google Scholar] [CrossRef]
- BEHZADIAN, M. , KHANMOHAMMADI OTAGHSARA, S., YAZDANI, M. & IGNATIUS, J. A state-of the-art survey of TOPSIS applications. Expert Systems with Applications 2012, 39, 13051–13069. [Google Scholar] [CrossRef]
- ALI, Y. , HAROON, M., ABDULLAH, M. & KHAN, A. 2019. THE BEST MANUFACTURING PROCEDURE FOR THE COMMERCIAL PRODUCTION OF UREA, USING AHP BASED TOPSIS. [CrossRef]
- BANDYOPADHYAY, S. Comparison among multi-criteria decision analysis techniques: a novel method. Progress in Artificial Intelligence 2020, 10. [Google Scholar] [CrossRef]
- STOJČIĆ, M. , ZAVADSKAS, E. K., PAMUČAR, D., STEVIĆ, Ž. & MARDANI, A. Application of MCDM Methods in Sustainability Engineering: A Literature Review 2008–2018. Symmetry. [CrossRef]
- FONSECA, J. D. , COMMENGE, J.-M., CAMARGO, M., FALK, L. & GIL, I. D. Multi-criteria optimization for the design and operation of distributed energy systems considering sustainability dimensions. Energy 2021, 214, 118989. [Google Scholar] [CrossRef]
- KANNAN, D. , MOAZZENI, S., DARMIAN, S. M. & AFRASIABI, A. A hybrid approach based on MCDM methods and Monte Carlo simulation for sustainable evaluation of potential solar sites in east of Iran. Journal of Cleaner Production 2021, 279, 122368. [Google Scholar] [CrossRef]
- MUHAMMAD, L. J. , BADI, I., HARUNA, A. A. & MOHAMMED, I. A. Selecting the Best Municipal Solid Waste Management Techniques in Nigeria Using Multi Criteria Decision Making Techniques. Reports in Mechanical Engineering 2021, 2, 180–189. [Google Scholar] [CrossRef]
- CHOURABI, Z. , KHEDHER, F. , DHOUIB, A. & CHEIKHROUHOU, M. Multi-criteria decision making in workforce choice using AHP, WSM and WPM. The Journal of The Textile Institute 2018, 110, 1–10. [Google Scholar] [CrossRef]
- NARWANE, V. S. , YADAV, V. S., RAUT, R. D., NARKHEDE, B. E. & GARDAS, B. B. Sustainable development challenges of the biofuel industry in India based on integrated MCDM approach. Renewable Energy 2021, 164, 298–309. [Google Scholar] [CrossRef]
- TOBISZEWSKI, M. , MECHLIŃSKA, A., ZYGMUNT, B. & NAMIEŚNIK, J. Green analytical chemistry in sample preparation for determination of trace organic pollutants. TrAC Trends in Analytical Chemistry 2009, 28, 943–951. [Google Scholar] [CrossRef]
- GEISSDOERFER, M. , SAVAGET, P., BOCKEN, N. M. P. & HULTINK, E. J. 2017. The Circular Economy – A new sustainability paradigm? Journal of Cleaner Production,. [CrossRef]
- KIRCHHERR, J. , REIKE, D. & HEKKERT, M. 2017. Conceptualizing the circular economy: An analysis of 114 definitions. Resources, Conservation and Recycling,. [CrossRef]
- DE MARCO, B. A. , RECHELO, B. S., TÓTOLI, E. G., KOGAWA, A. C. & SALGADO, H. R. N. Evolution of green chemistry and its multidimensional impacts: A review. Saudi Pharmaceutical Journal 2019, 27, 1–8. [Google Scholar] [CrossRef]
- HO, W. , XU, X. & DEY, P. K. Multi-criteria decision making approaches for supplier evaluation and selection: A literature review. European Journal of Operational Research 2010, 202, 16–24. [Google Scholar] [CrossRef]
- NAZIM, M. , WALI MOHAMMAD, C. & SADIQ, M. A comparison between fuzzy AHP and fuzzy TOPSIS methods to software requirements selection. Alexandria Engineering Journal 2022, 61, 10851–10870. [Google Scholar] [CrossRef]
- SAATY, R. W. The analytic hierarchy process—what it is and how it is used. Mathematical Modelling 1987, 9, 161–176. [Google Scholar] [CrossRef]
- VAIDYA, O. & KUMAR, S. Analytic Hierarchy Process: An Overview of Applications. European Journal of Operational Research 2006, 169, 1–29. [Google Scholar] [CrossRef]
- JAMWAL, A. , AGRAWAL, R., SHARMA, M. & KUMAR, V. Review on multi-criteria decision analysis in sustainable manufacturing decision making. International Journal of Sustainable Engineering 2021, 14, 202–225. [Google Scholar] [CrossRef]
- WU, Z. & ABDUL-NOUR, G. Comparison of Multi-Criteria Group Decision-Making Methods for Urban Sewer Network Plan Selection. CivilEng. [CrossRef]
- BEHZADIAN, M. , KAZEMZADEH, R. B., ALBADVI, A. & AGHDASI, M. PROMETHEE: A comprehensive literature review on methodologies and applications. European Journal of Operational Research 2010, 200, 198–215. [Google Scholar] [CrossRef]
- KUMAR, A. , SAH, B., SINGH, A. R., DENG, Y., HE, X., KUMAR, P. & BANSAL, R. C. A review of multi criteria decision making (MCDM) towards sustainable renewable energy development. Renewable and Sustainable Energy Reviews 2017, 69, 596–609. [Google Scholar] [CrossRef]
- CHEN, C.-T. Extensions of the TOPSIS for group decision-making under fuzzy environment. Fuzzy Sets and Systems 2000, 114, 1–9. [Google Scholar] [CrossRef]
- OPRICOVIC, S. & TZENG, G.-H. Compromise solution by MCDM methods: A comparative analysis of VIKOR and TOPSIS. European Journal of Operational Research 2004, 156, 445–455. [Google Scholar] [CrossRef]
- KABIR, G. , SADIQ, R. & TESFAMARIAM, S. A review of multi-criteria decision-making methods for infrastructure management. Structure and Infrastructure Engineering 2014, 10, 1176–1210. [Google Scholar] [CrossRef]
- BALIOTI, V. , TZIMOPOULOS, C. & EVANGELIDES, C. Multi-Criteria Decision Making Using TOPSIS Method Under Fuzzy Environment. Application in Spillway Selection. Proceedings 2018, 2, 637. [Google Scholar] [CrossRef]
- KARAMI, A. 2011. UTILIZATION AND COMPARISON OF MULTI ATTRIBUTE DECISION MAKING TECHNIQUES TO RANK BAYESIAN NETWORK OPTIONS Master Degree Project in Informatics One year Level ECTS 30 Spring term Year 2011.
- PRASAD, V. & PAPPU, K. Role of Consistency in Analytic Hierarchy Process – Consistency Improvement Methods. Indian Journal of Science and Technology 2017, 10, 1–5. [Google Scholar]
- XU, D. , LV, L., REN, X. , REN, J. & DONG, L. Route selection for low-carbon ammonia production: A sustainability prioritization framework based-on the combined weights and projection ranking by similarity to referencing vector method. Journal of Cleaner Production 2018, 193, 263–276. [Google Scholar] [CrossRef]
- Institute for Development (ISDP). 2018. Made in China 2025. [Online]. [Accessed 10 February 2024]. Available from: https://isdp.eu/content/uploads/2018/06/Made-in-China-Backgrounder.pdf.
- WANG, J. , WU, H. & CHEN, Y. Made in China 2025 and manufacturing strategy decisions with reverse QFD. International Journal of Production Economics 2020, 224, 107539. [Google Scholar] [CrossRef]
- ASPENTECH. 2013. Aspen HYSYS: Property and Methods Technical Reference. [Online]. [Accessed 13 January 2025]. Available from: https://esupport.aspentech.com/FileAachment?id=a0g0B00000GfNrw.
- GUATI-ROJO, A. , DEMSKI, C., POORTINGA, W. & VALERA-MEDINA, A. Public Attitudes and Concerns about Ammonia as an Energy Vector. Energies 2021, 14, 7296. [Google Scholar] [CrossRef]
- KURIEN, C. & MITTAL, M. Review on the production and utilization of green ammonia as an alternate fuel in dual-fuel compression ignition engines. Energy Conversion and Management 2022, 251, 114990. [Google Scholar] [CrossRef]
- ZHANG, Y. ZHANG, Y., SONG, Z., PAN, H. 2023. A Lfpp-Fahp Based Evaluation Model of Blasting Scheme for Tunnel Undercrossing Existing Buildings. Available at SSRN: hps://ssrn.com/abstract=4331303 or. [CrossRef]
- OLABANJI, O. M. & MPOFU, K. Hybridized fuzzy analytic hierarchy process and fuzzy weighted average for identifying optimal design concept. Heliyon 2020, 6, e03182. [Google Scholar] [CrossRef]
- OSMAN, O. , SGOURIDIS, S. & SLEPTCHENKO, A. Scaling the production of renewable ammonia: A techno-economic optimization applied in regions with high insolation. Journal of Cleaner Production 2020, 271, 121627. [Google Scholar] [CrossRef]
- CHEHADE, G. & DINCER, I. Progress in green ammonia production as potential carbon-free fuel. Fuel 2021, 299, 120845. [Google Scholar] [CrossRef]
- SALMON, N. & BAÑARES-ALCÁNTARA, R. A global, spatially granular techno-economic analysis of offshore green ammonia production. Journal of Cleaner Production 2022, 367, 133045. [Google Scholar] [CrossRef]
Figure 1.
A simplified top-to-bottom MCDM process model [12].
Figure 1.
A simplified top-to-bottom MCDM process model [12].
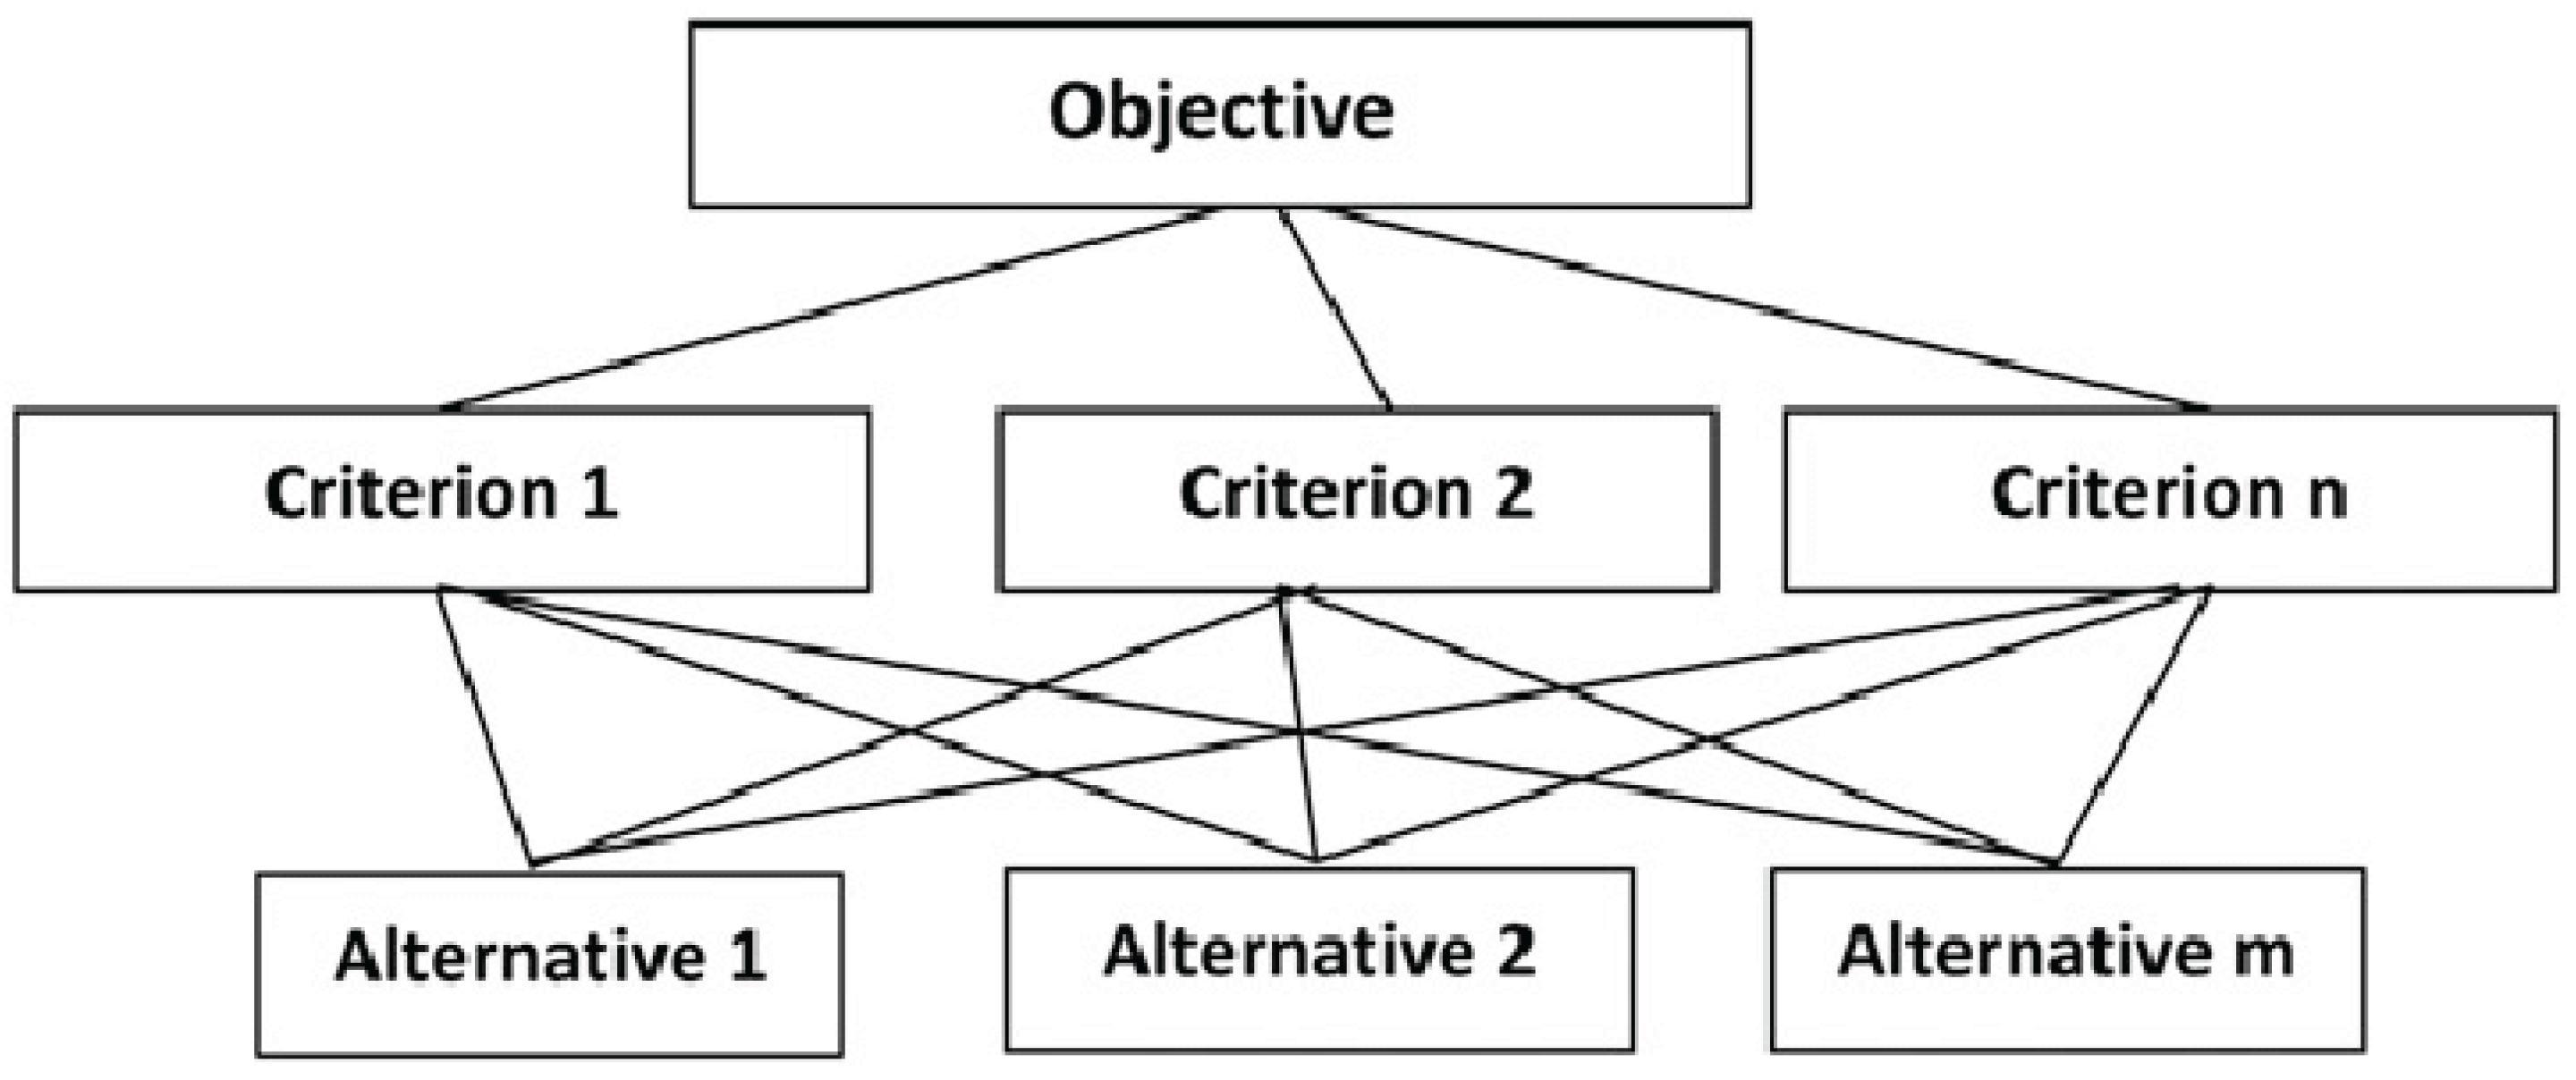
Figure 2.
Process flow diagram for IPA synthesis; a=1) isopropyl acetate synthesis, b=2) isopropanol synthesis, c=3) isopropanol & alcohol refining.
Figure 2.
Process flow diagram for IPA synthesis; a=1) isopropyl acetate synthesis, b=2) isopropanol synthesis, c=3) isopropanol & alcohol refining.
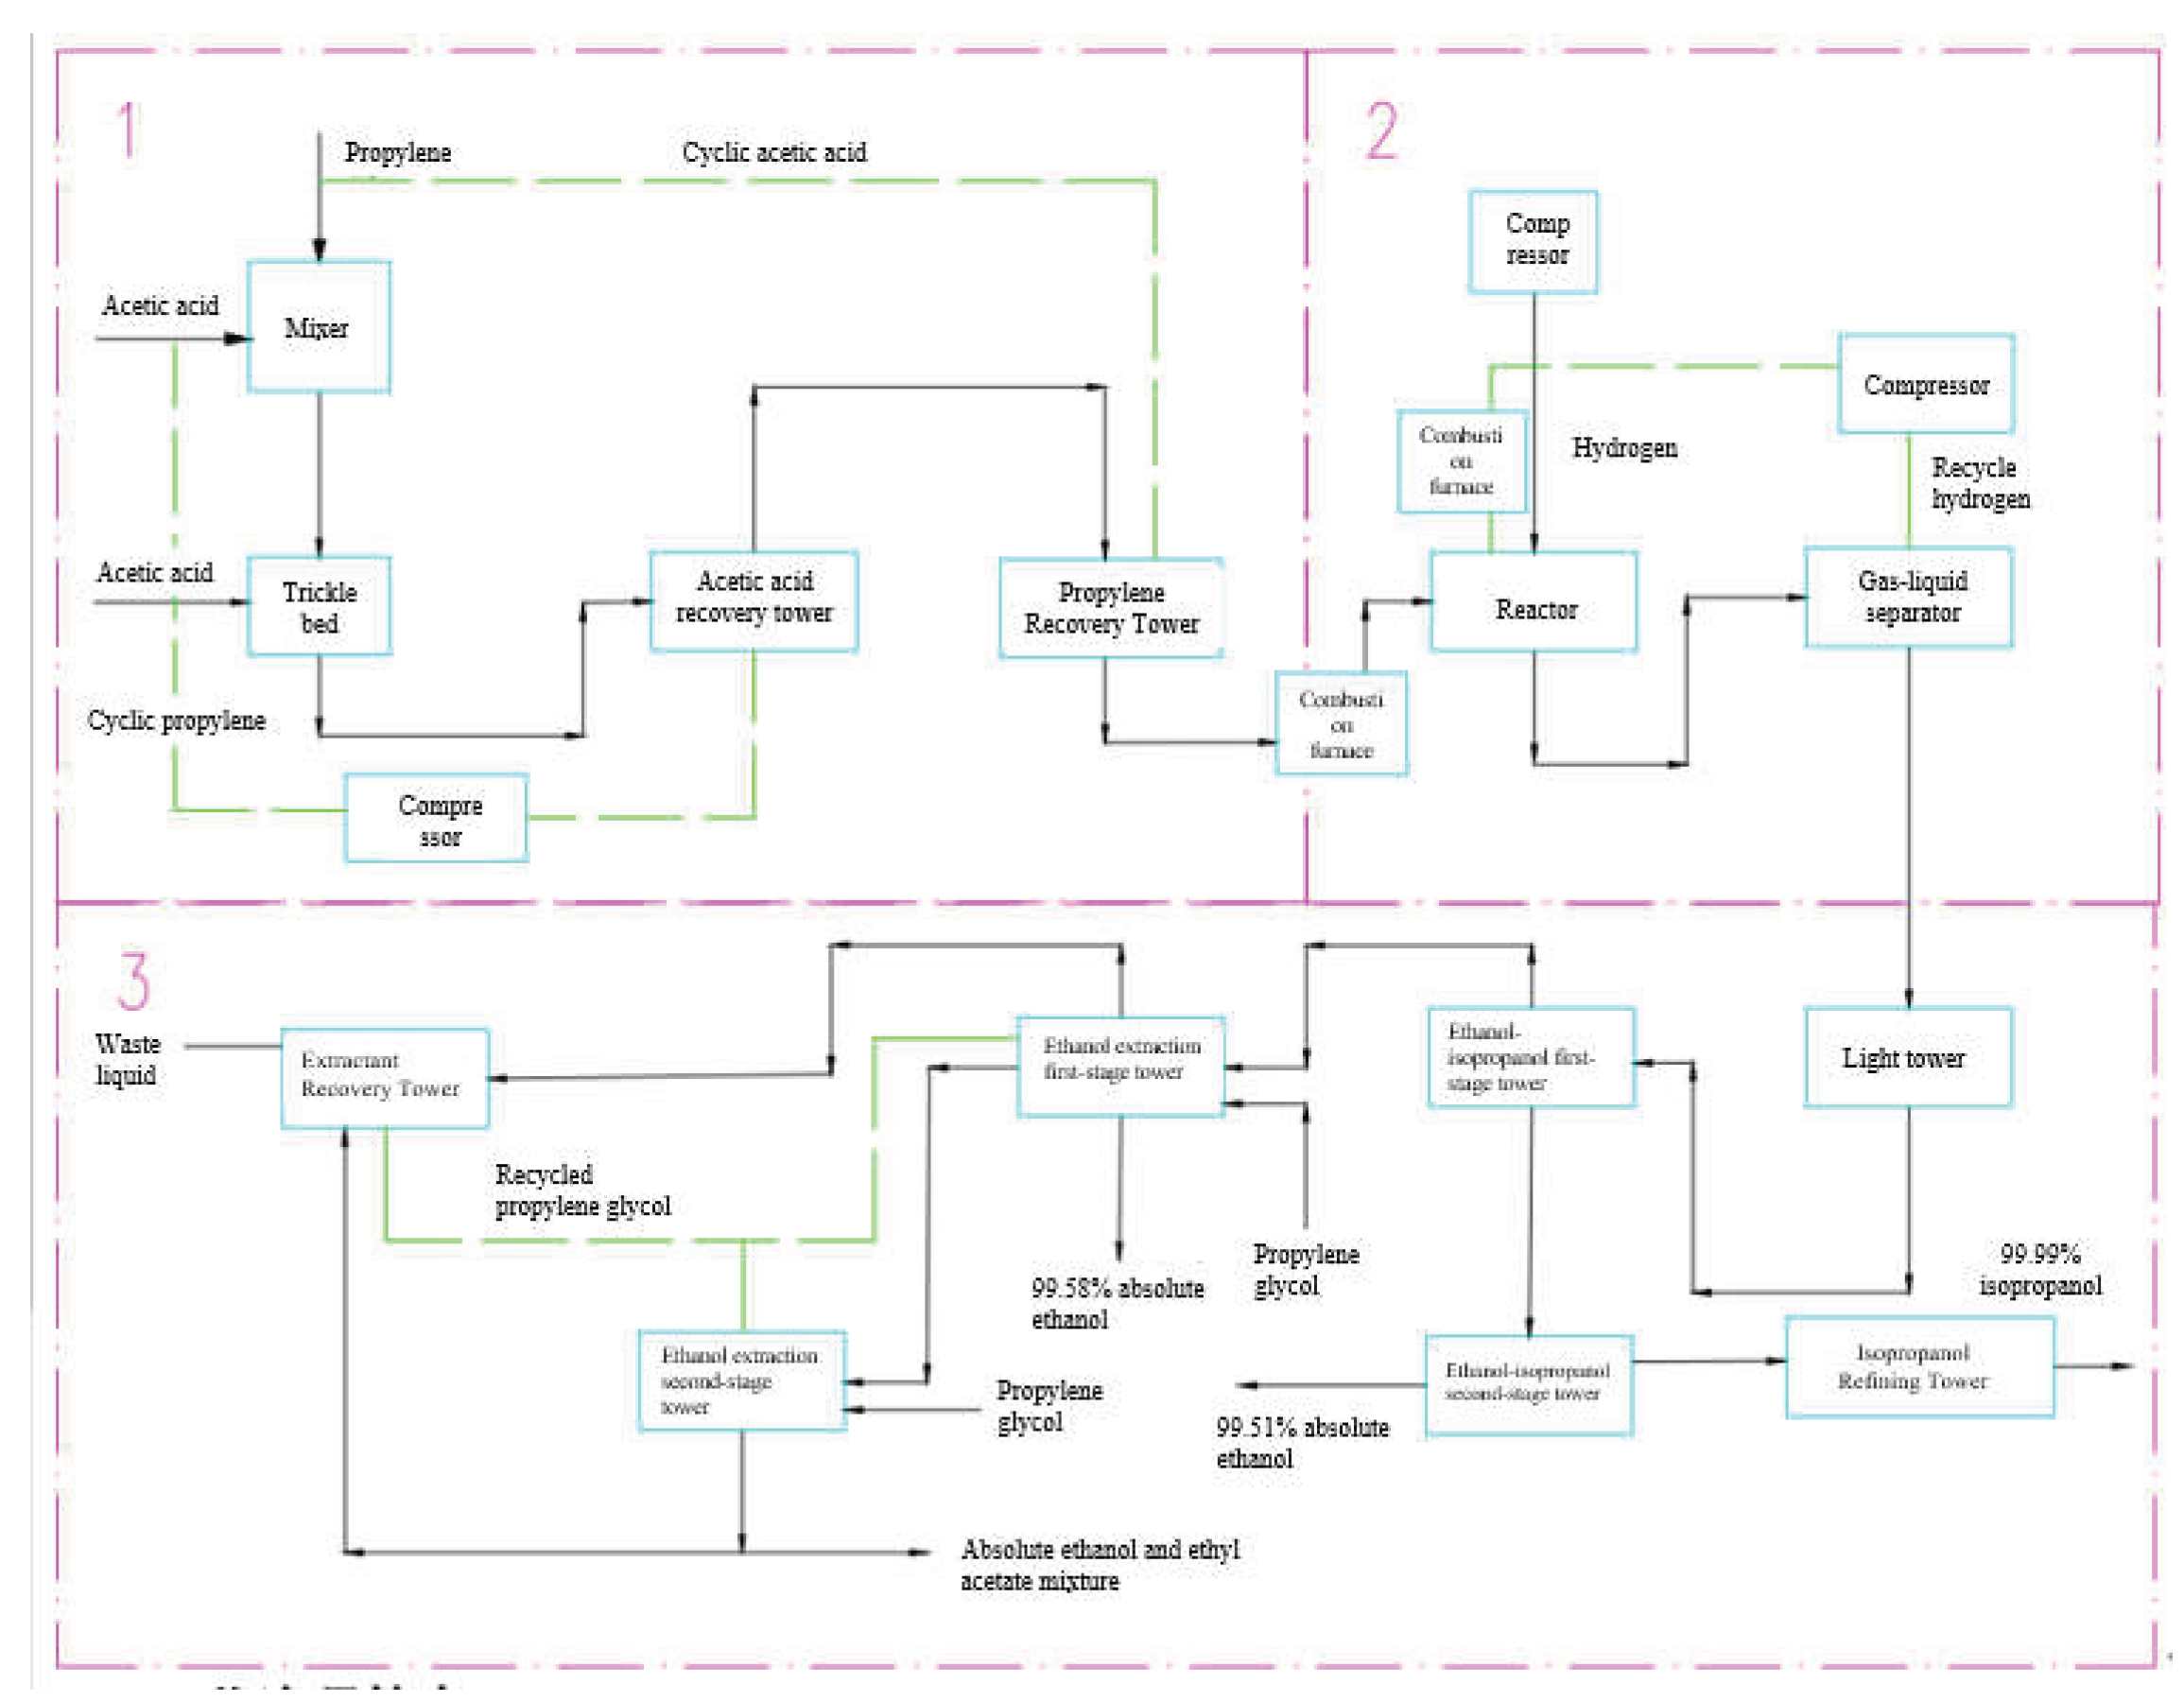
Figure 3.
Complete process simulation per section, as modelled in ASPEN v12.
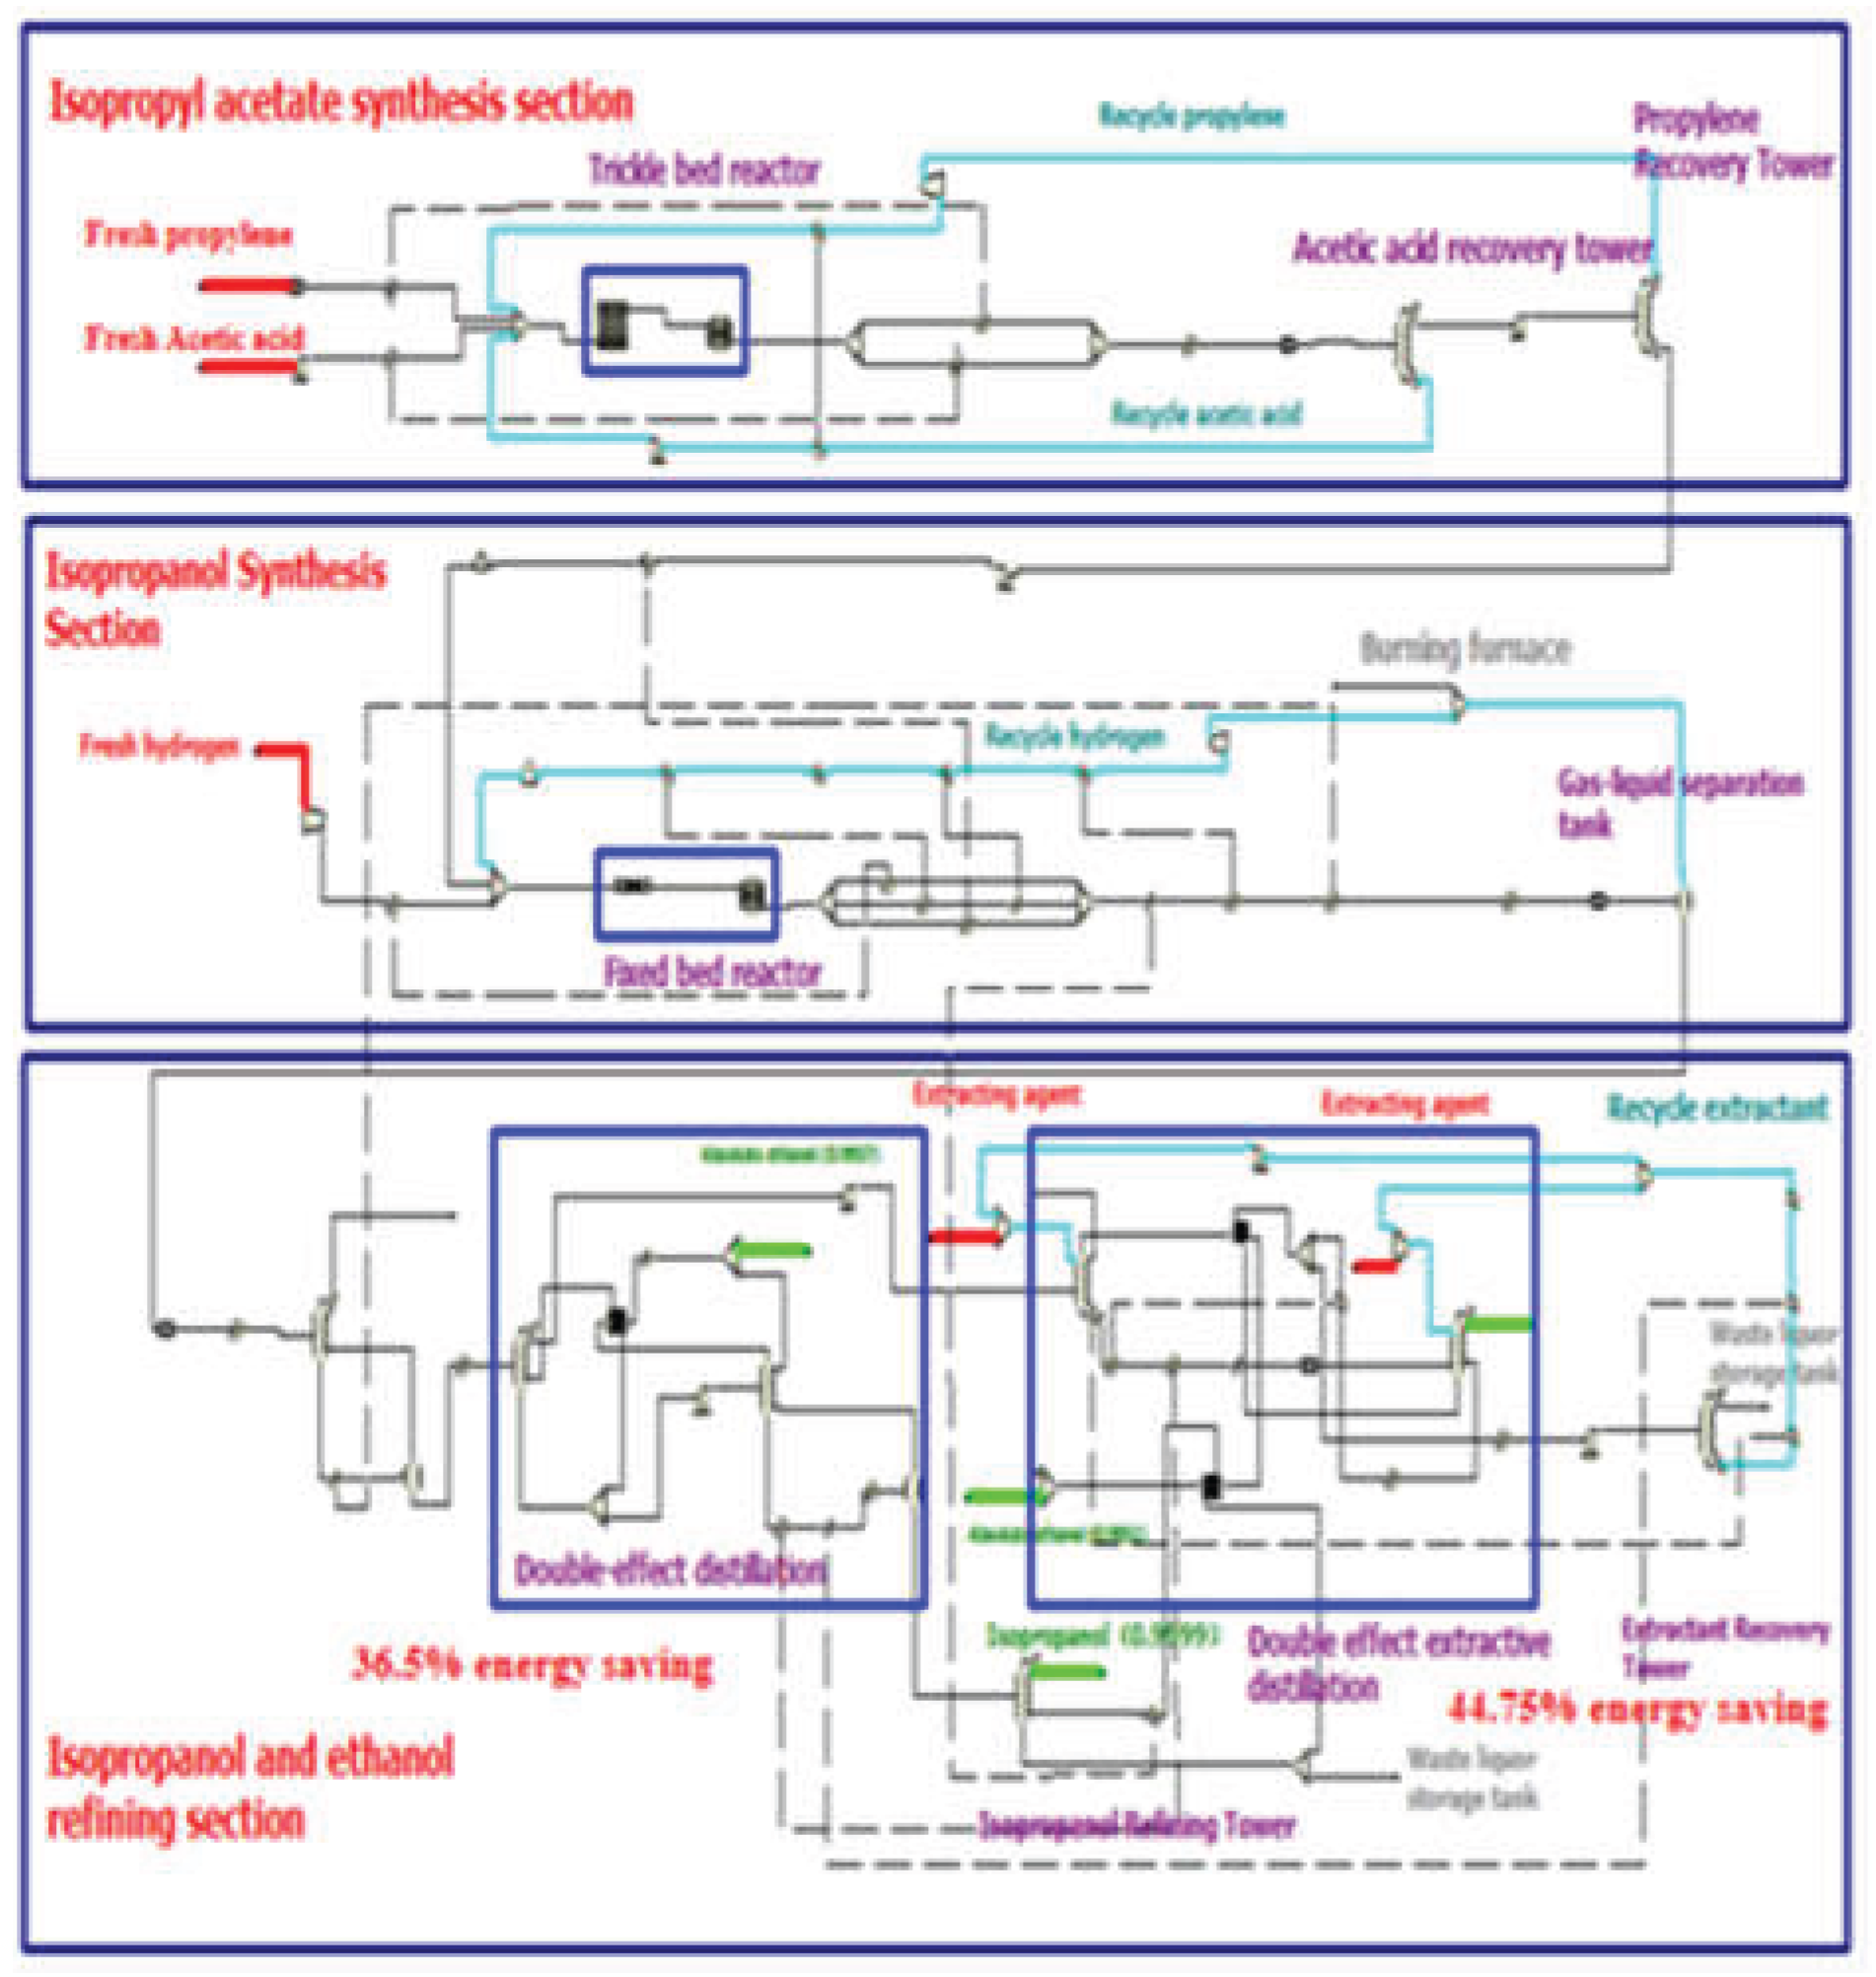
Figure 4.
Detailed plant layout of the simulated IPA synthesis plant.
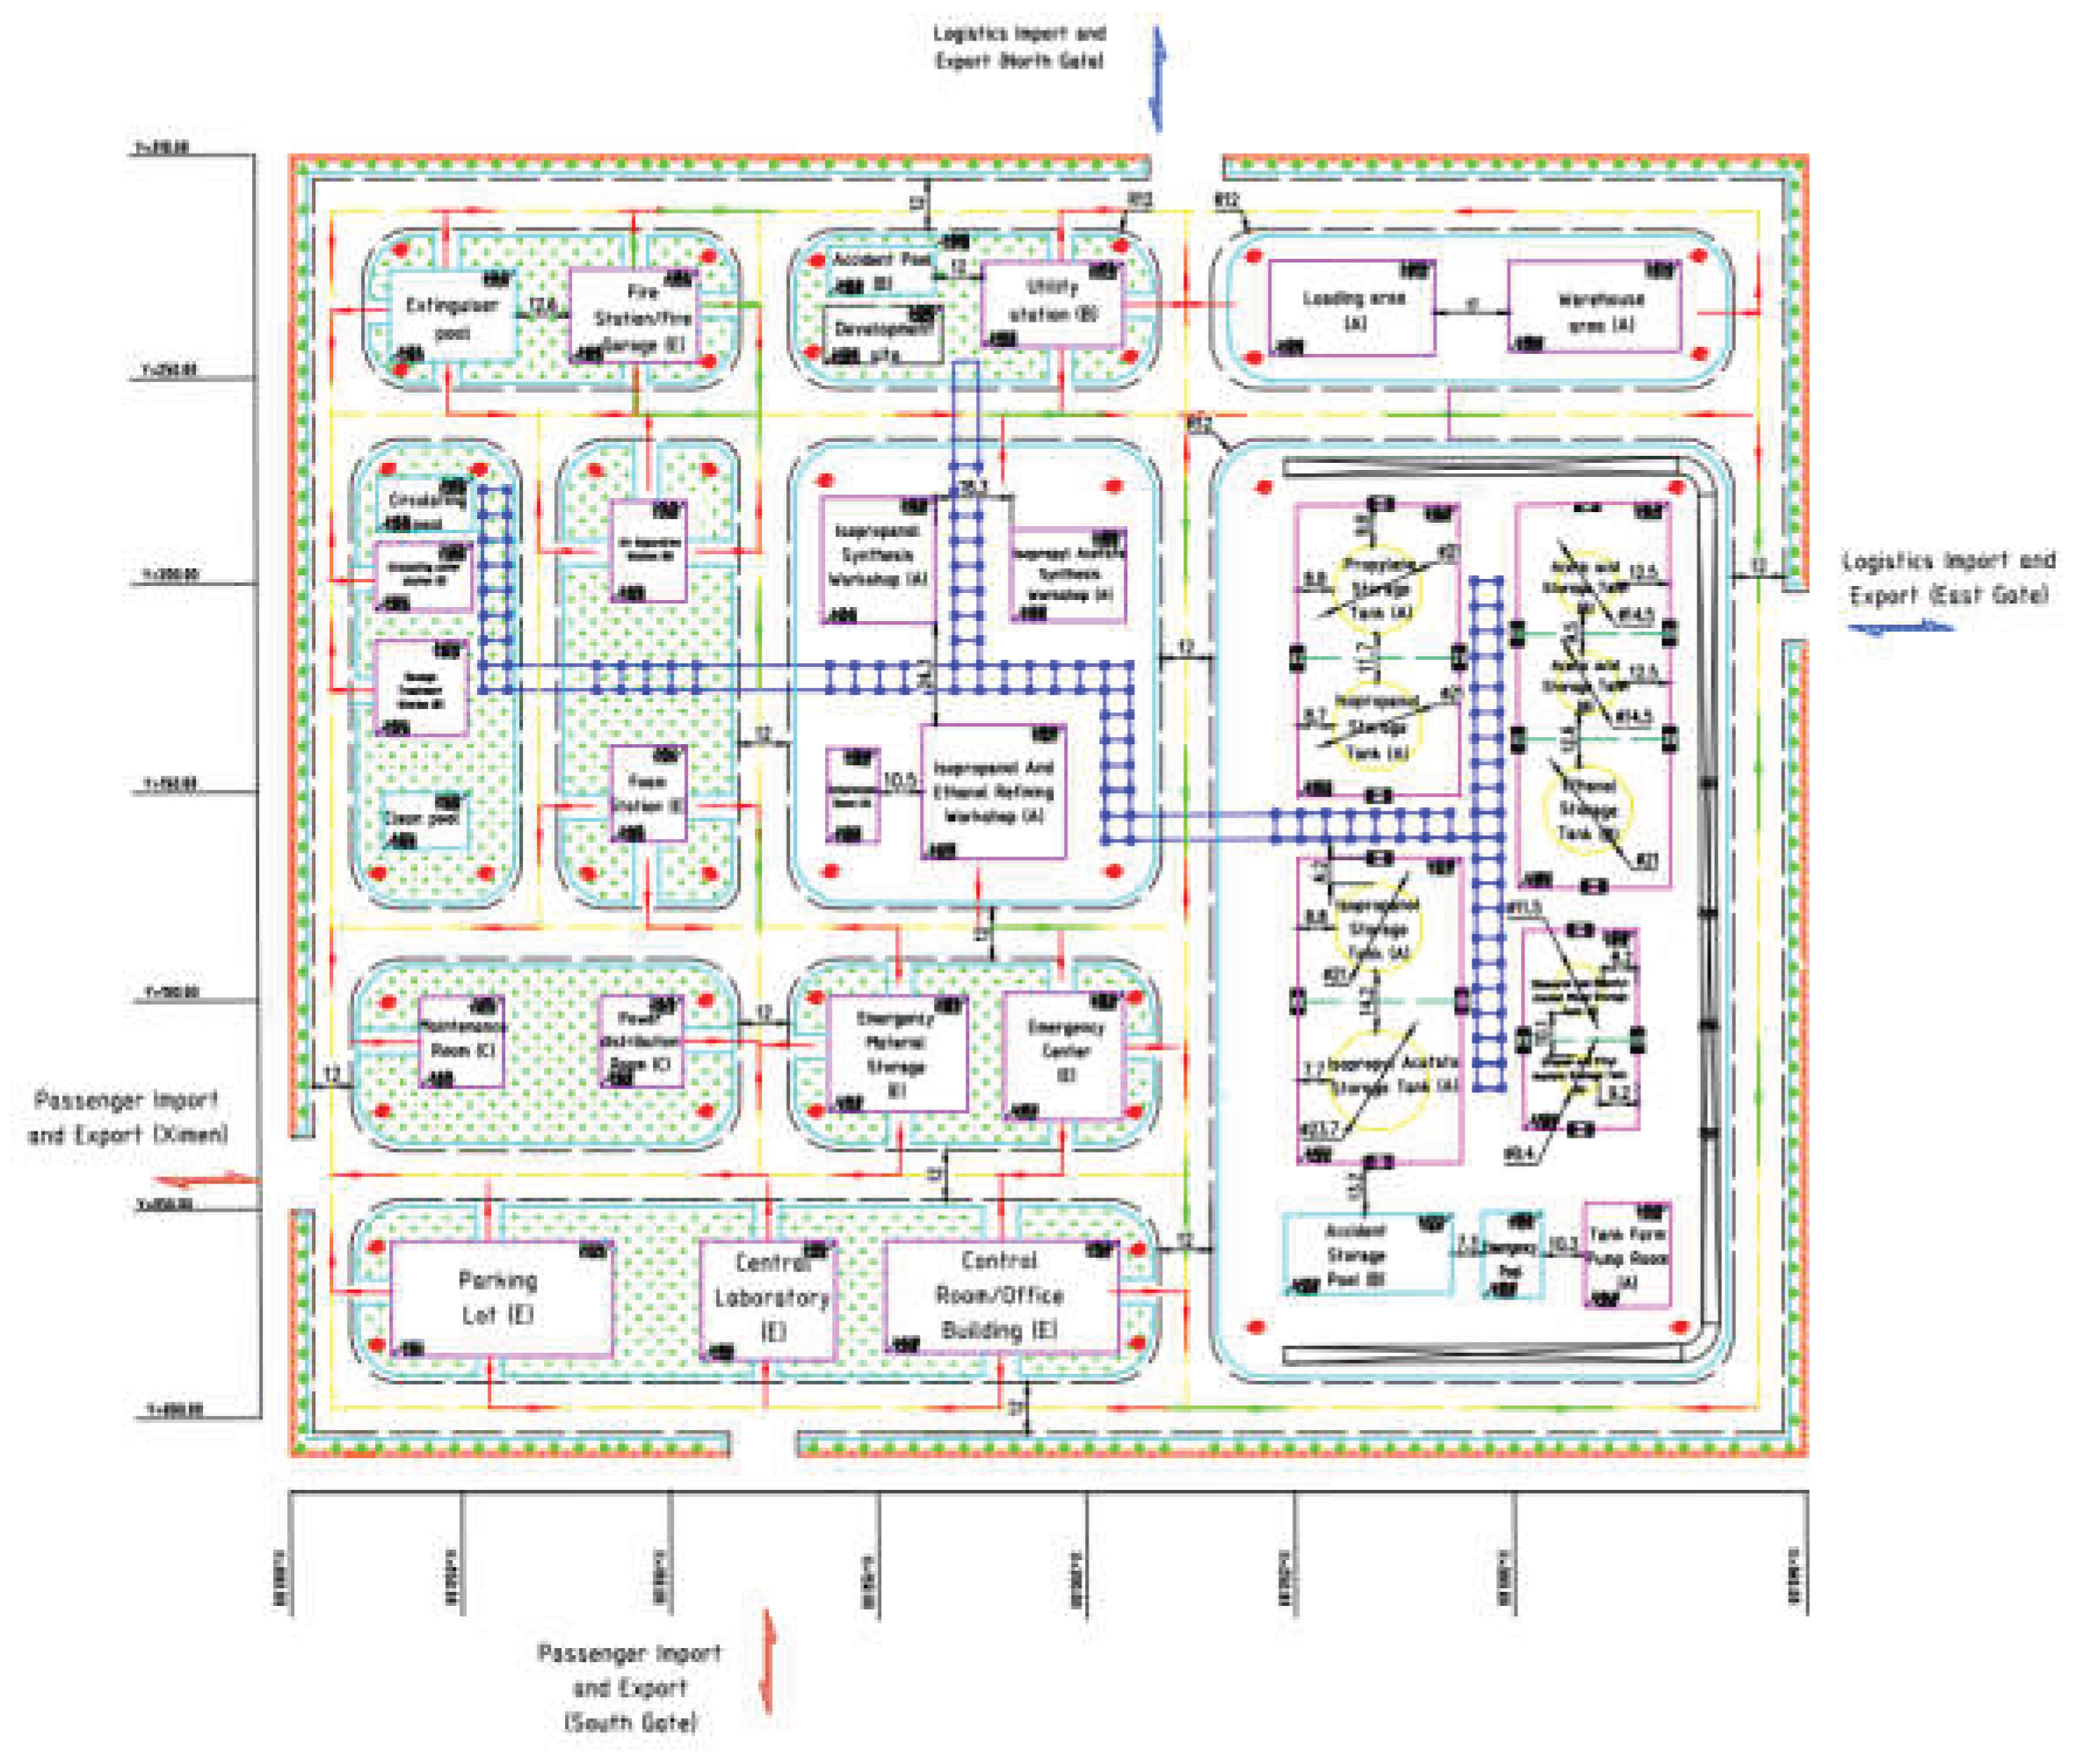
Figure 5.
Clean NH3 production flowsheet model. Three modules: hydrogen generation (blue), nitrogen generation (red), NH3 synthesis (green). ‘H2-OUT’ (blue) and ‘N2’ (red) streams are input streams for the NH3 synthesis module.
Figure 5.
Clean NH3 production flowsheet model. Three modules: hydrogen generation (blue), nitrogen generation (red), NH3 synthesis (green). ‘H2-OUT’ (blue) and ‘N2’ (red) streams are input streams for the NH3 synthesis module.
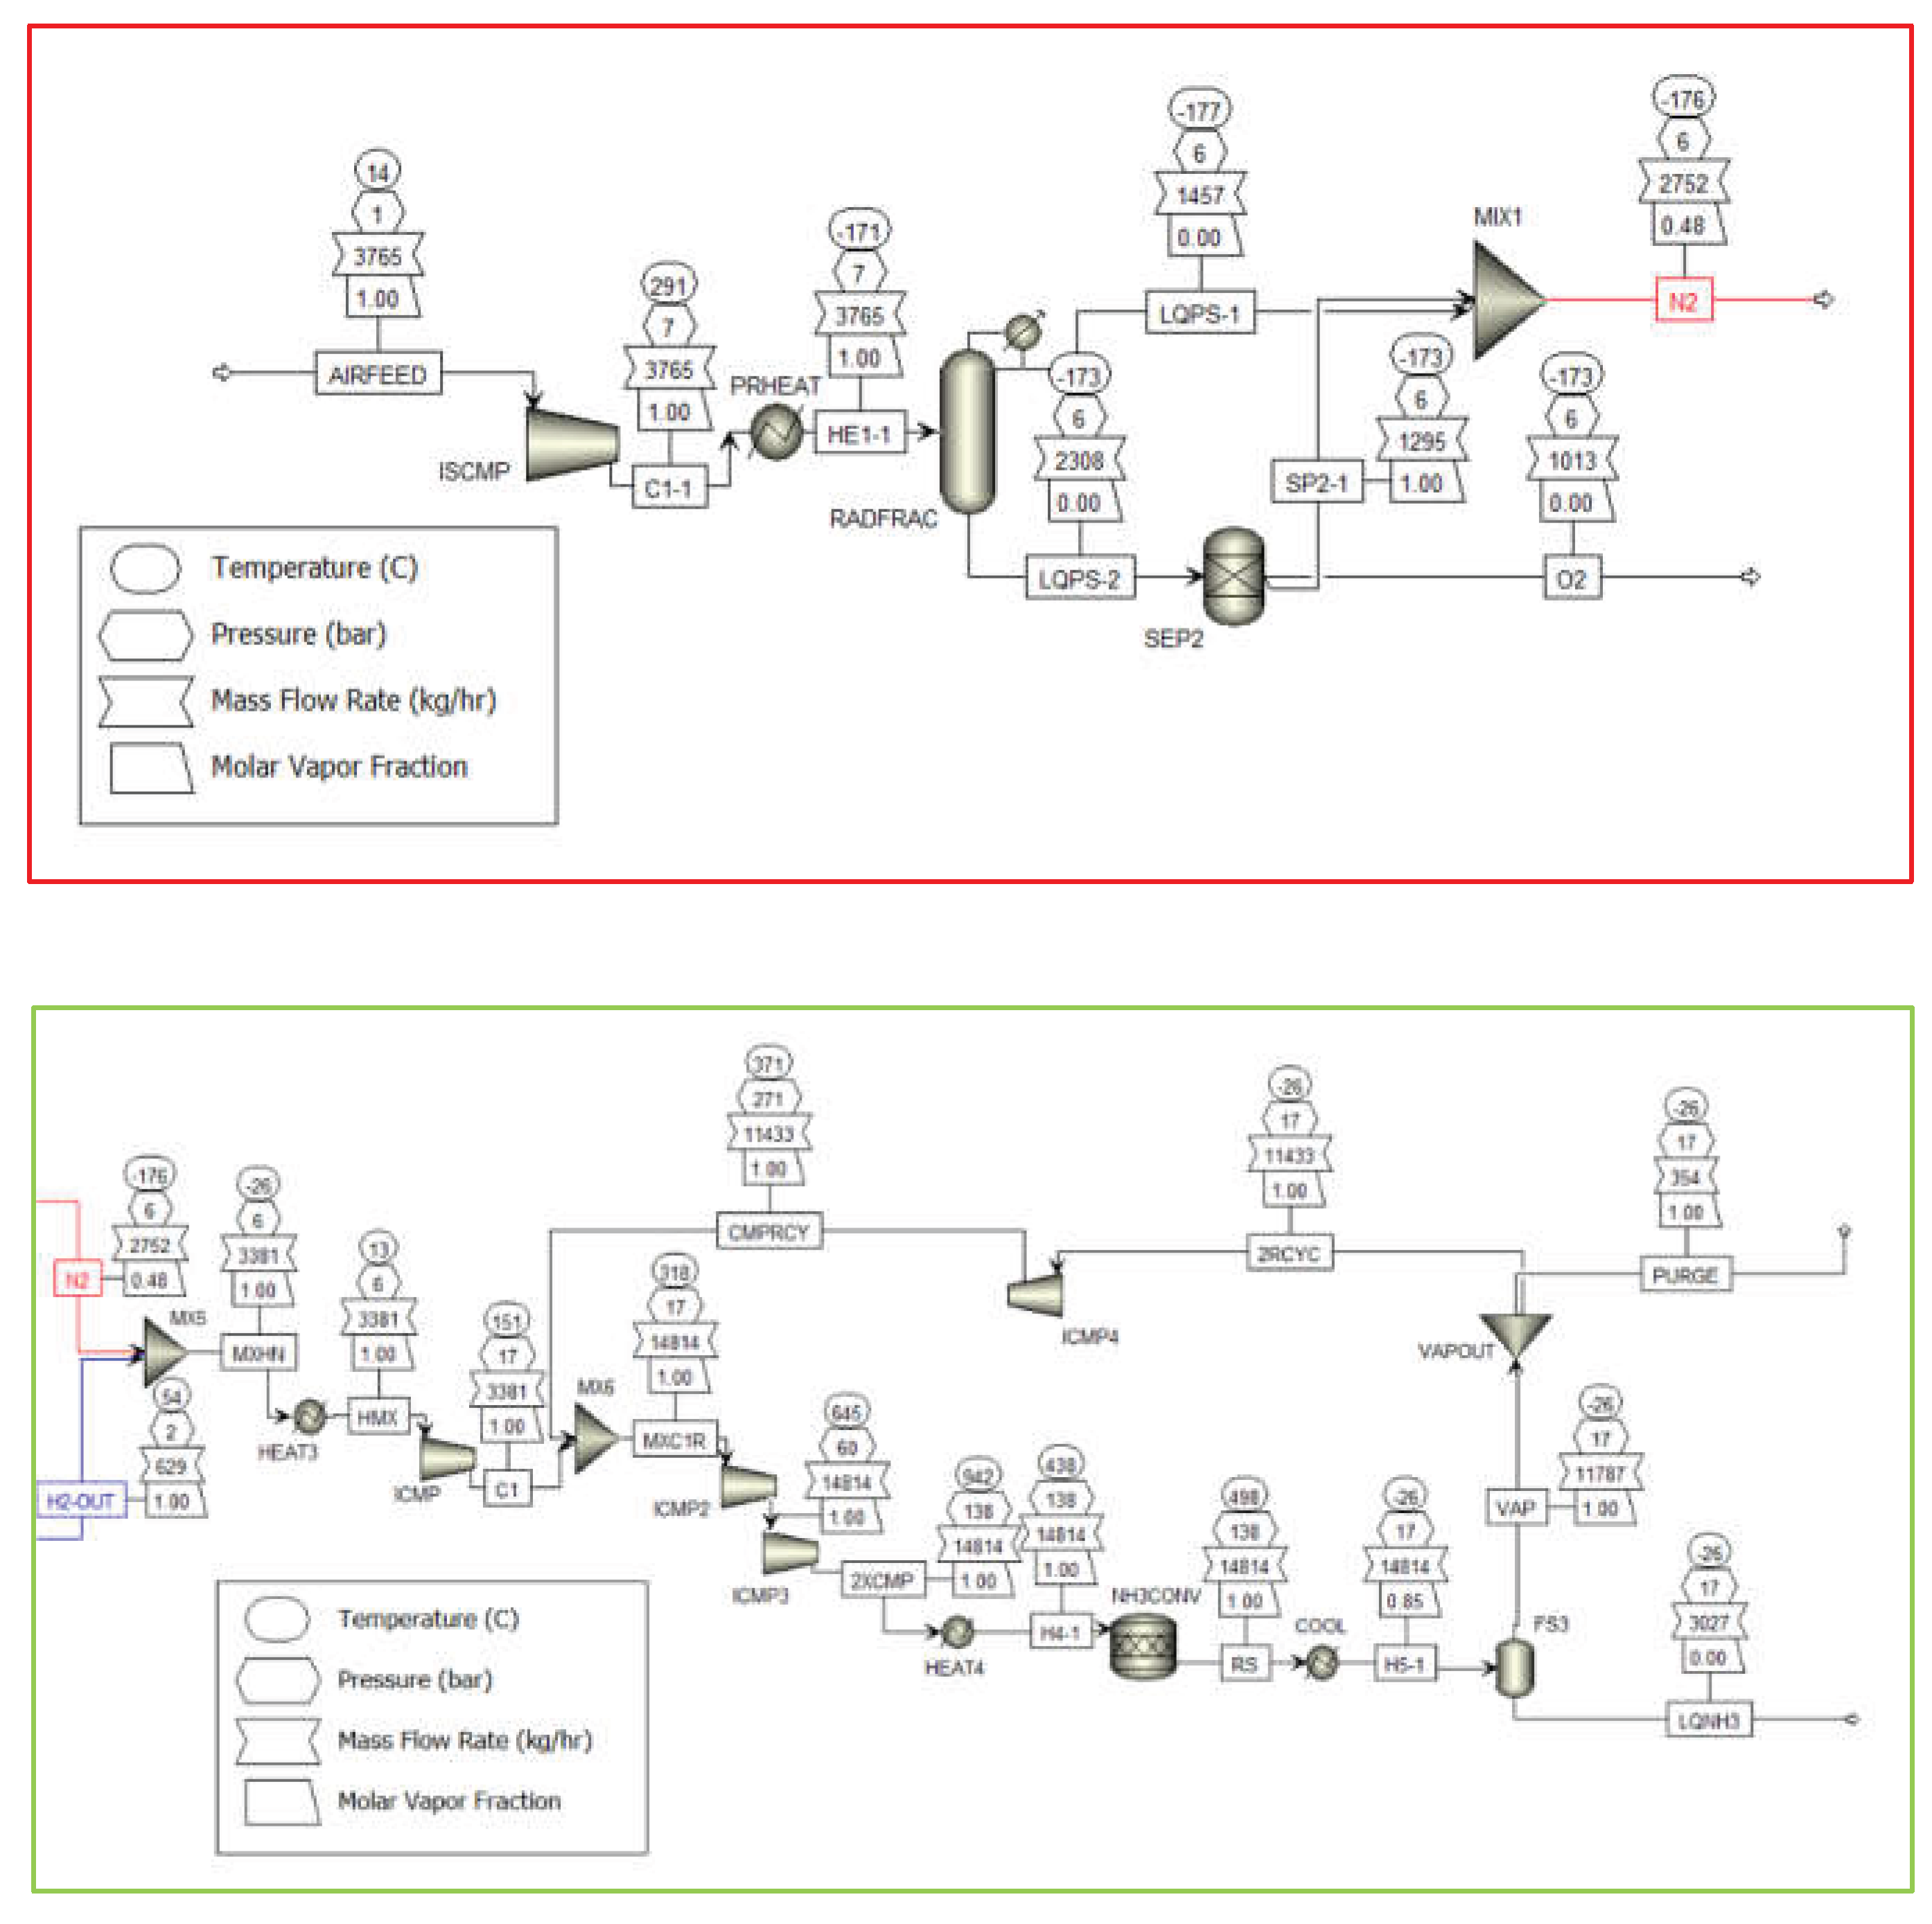
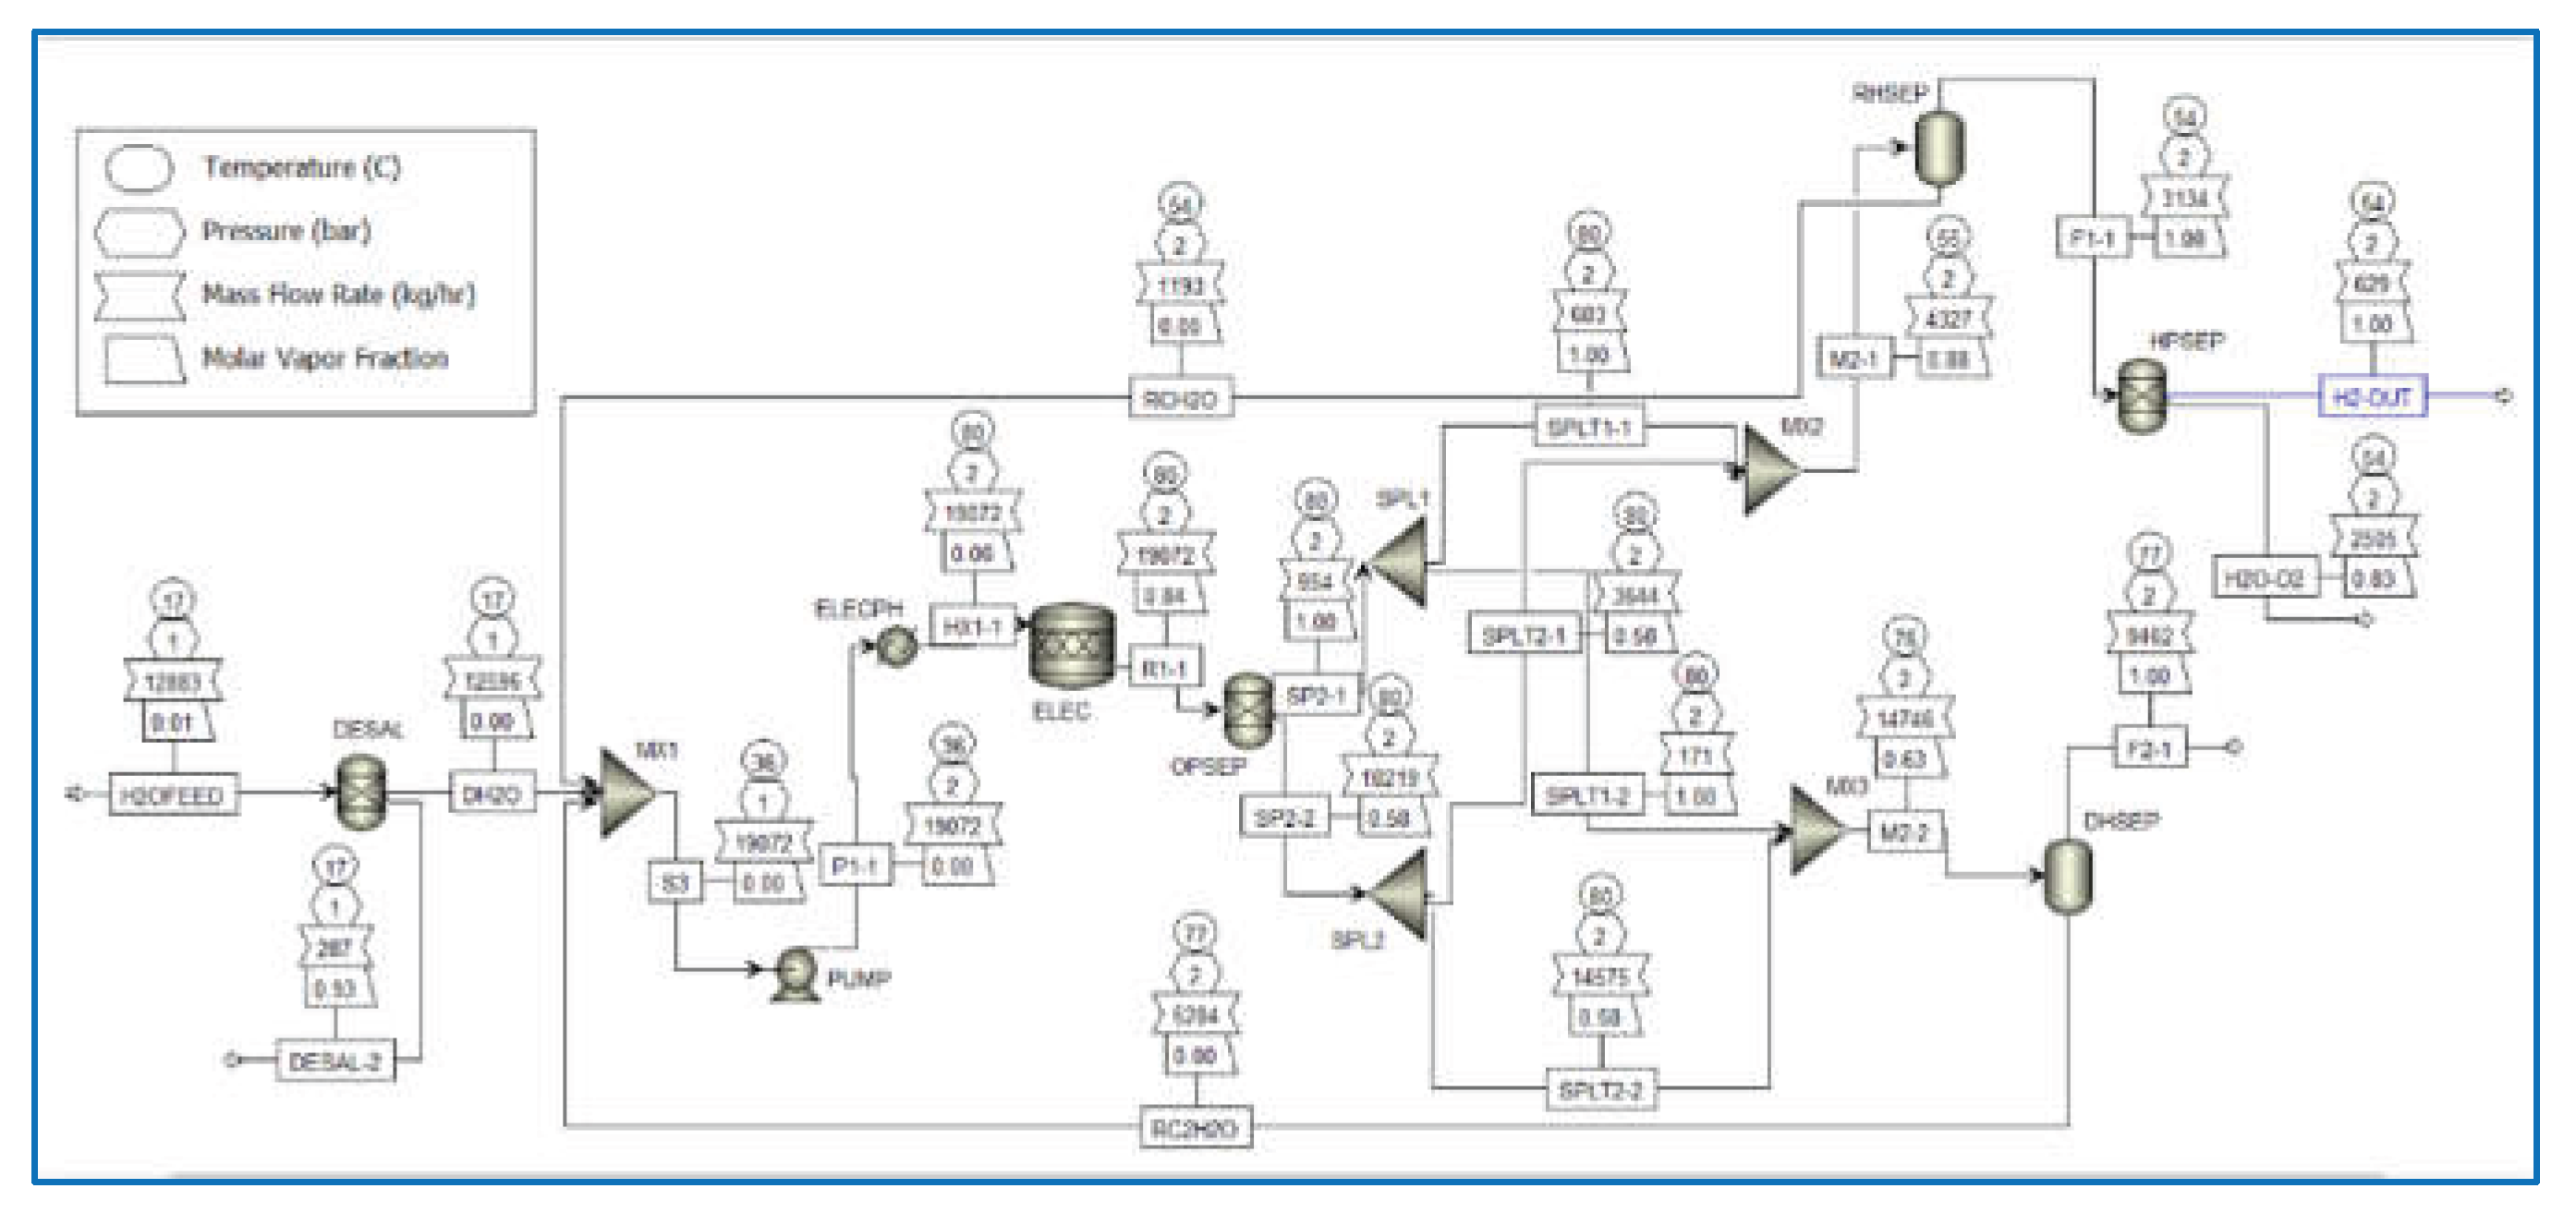
Figure 6.
Ci+ results relative to changes in technical (A; top-left), economic (B; top-right), environmental (C; bottom-left), and social (D; bottom-right) criterion weights for IPA pathways
Figure 6.
Ci+ results relative to changes in technical (A; top-left), economic (B; top-right), environmental (C; bottom-left), and social (D; bottom-right) criterion weights for IPA pathways
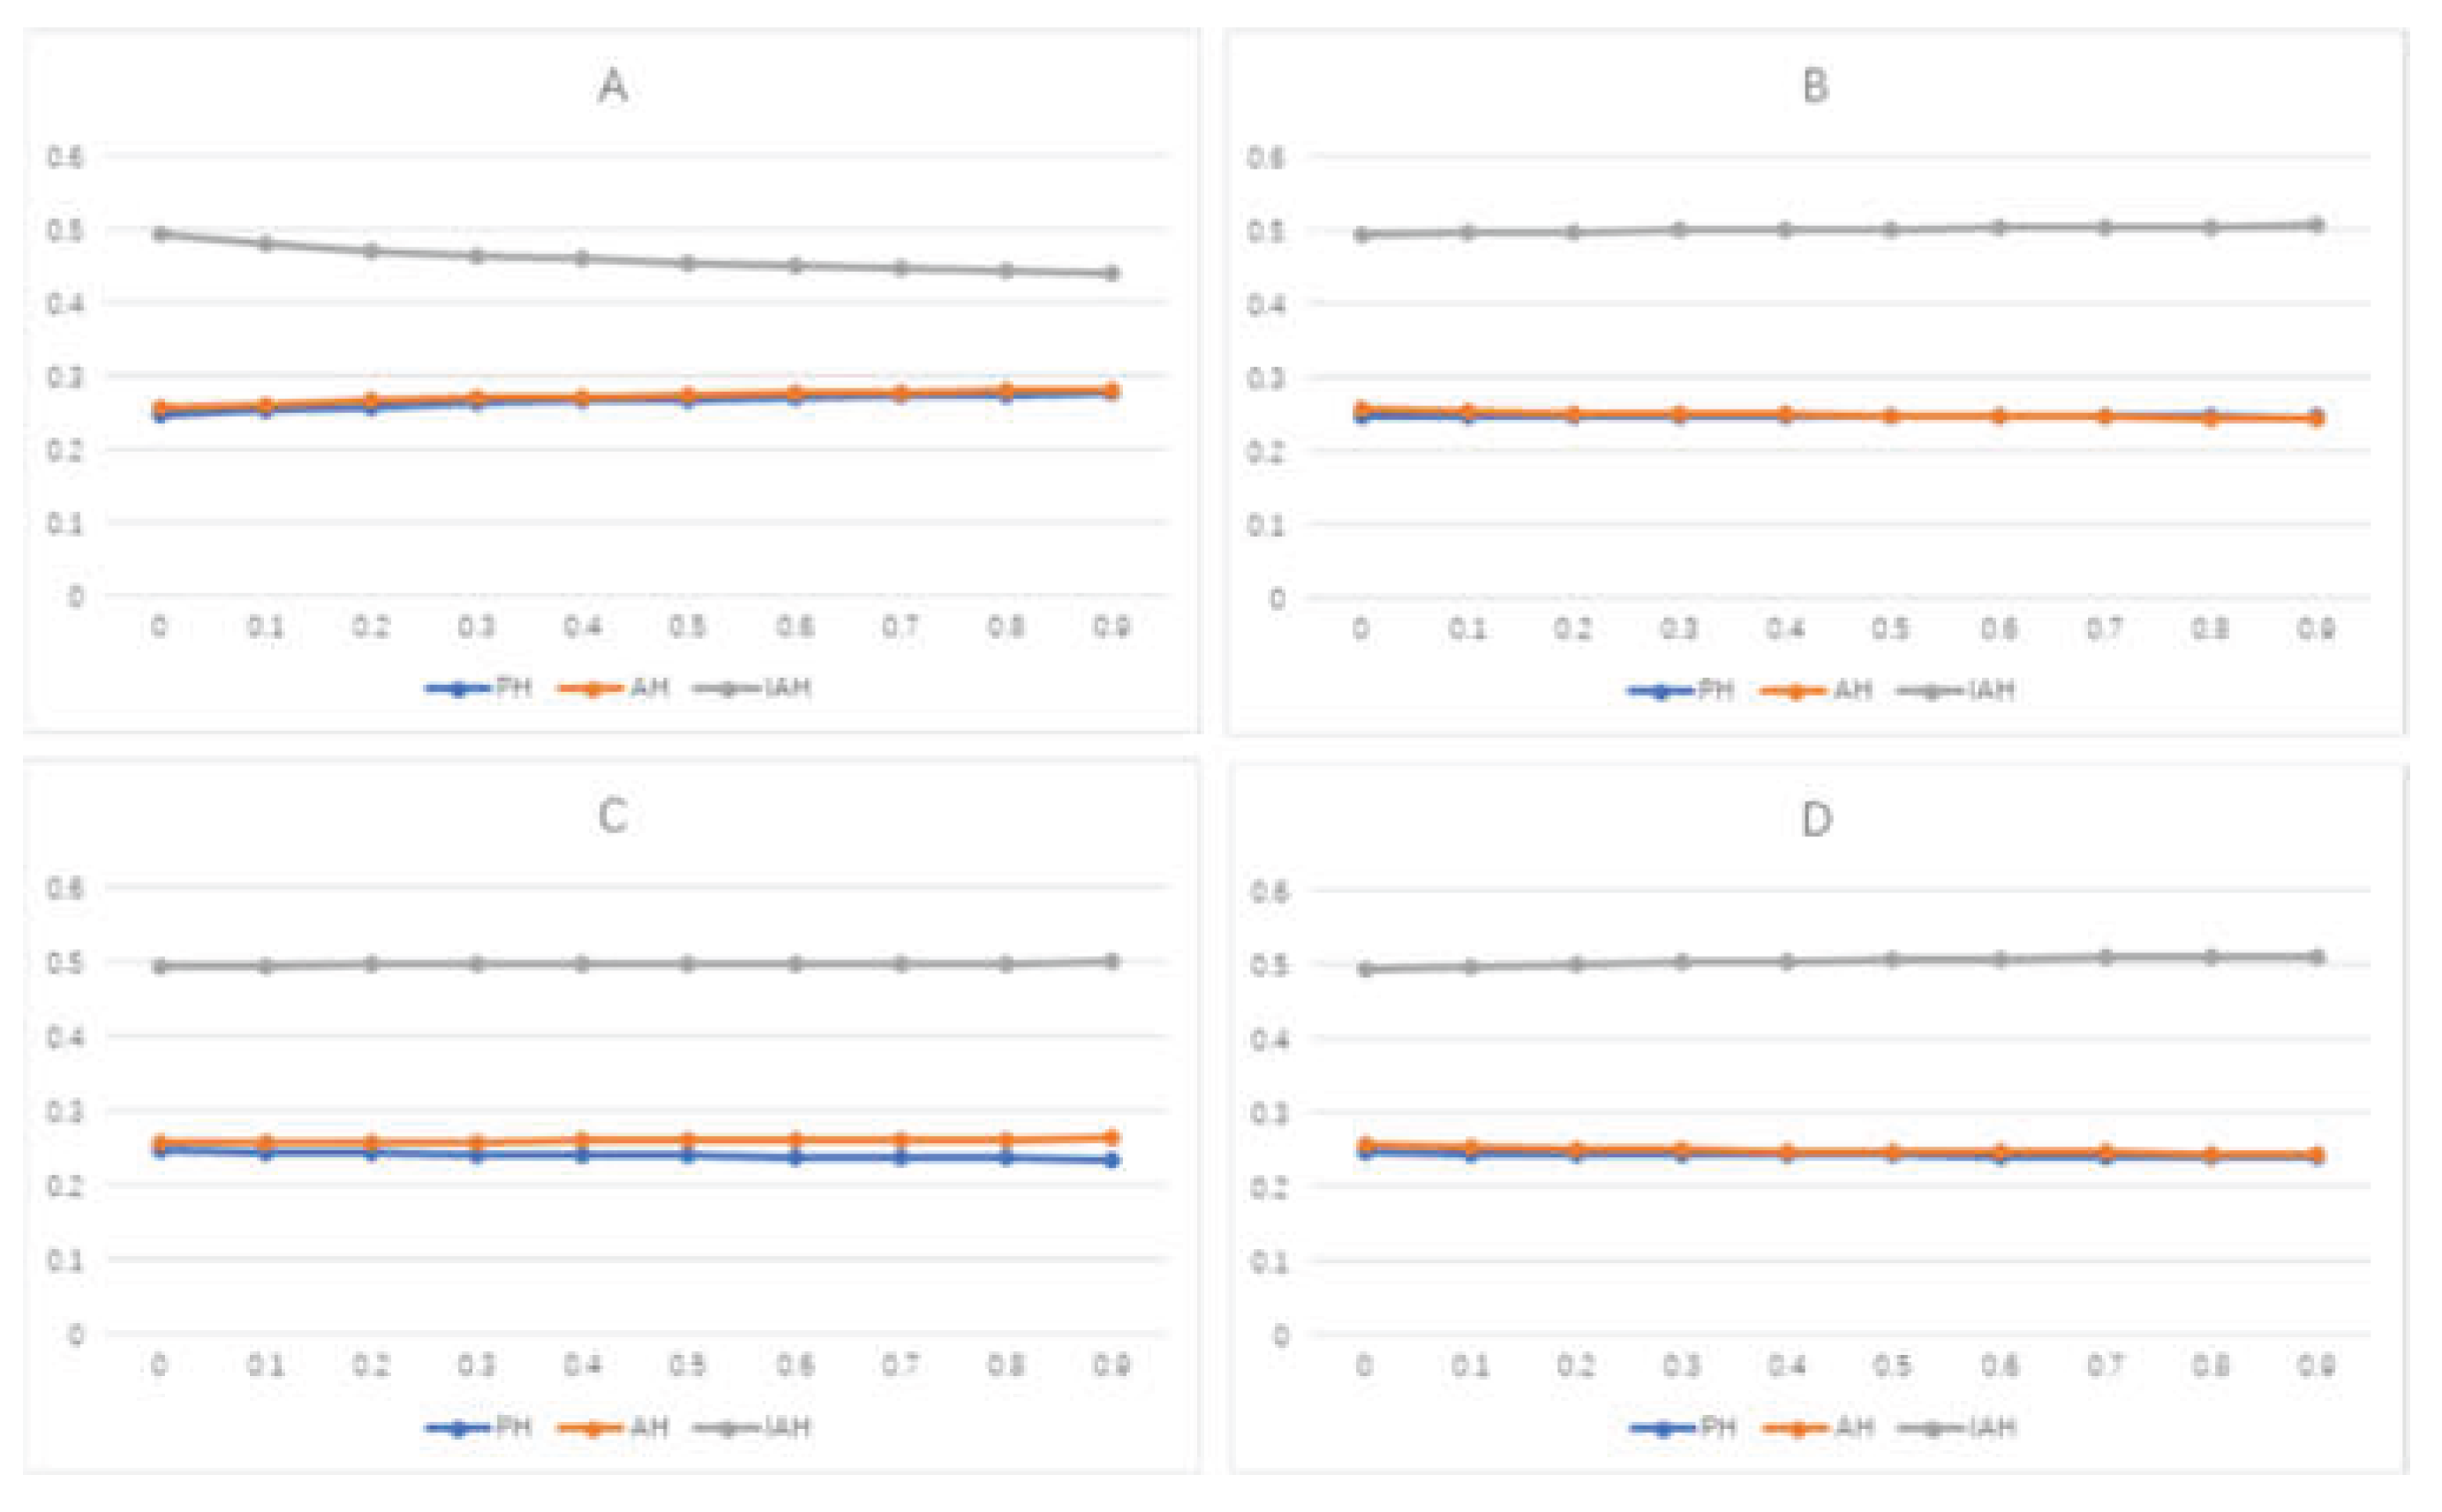
Figure 7.
Ci+ results relative to changes in environmental (A; top-left), economic (B; top-right), social (C; bottom-left), and technical (D; bottom-right) criterion weights for green NH3 pathways
Figure 7.
Ci+ results relative to changes in environmental (A; top-left), economic (B; top-right), social (C; bottom-left), and technical (D; bottom-right) criterion weights for green NH3 pathways
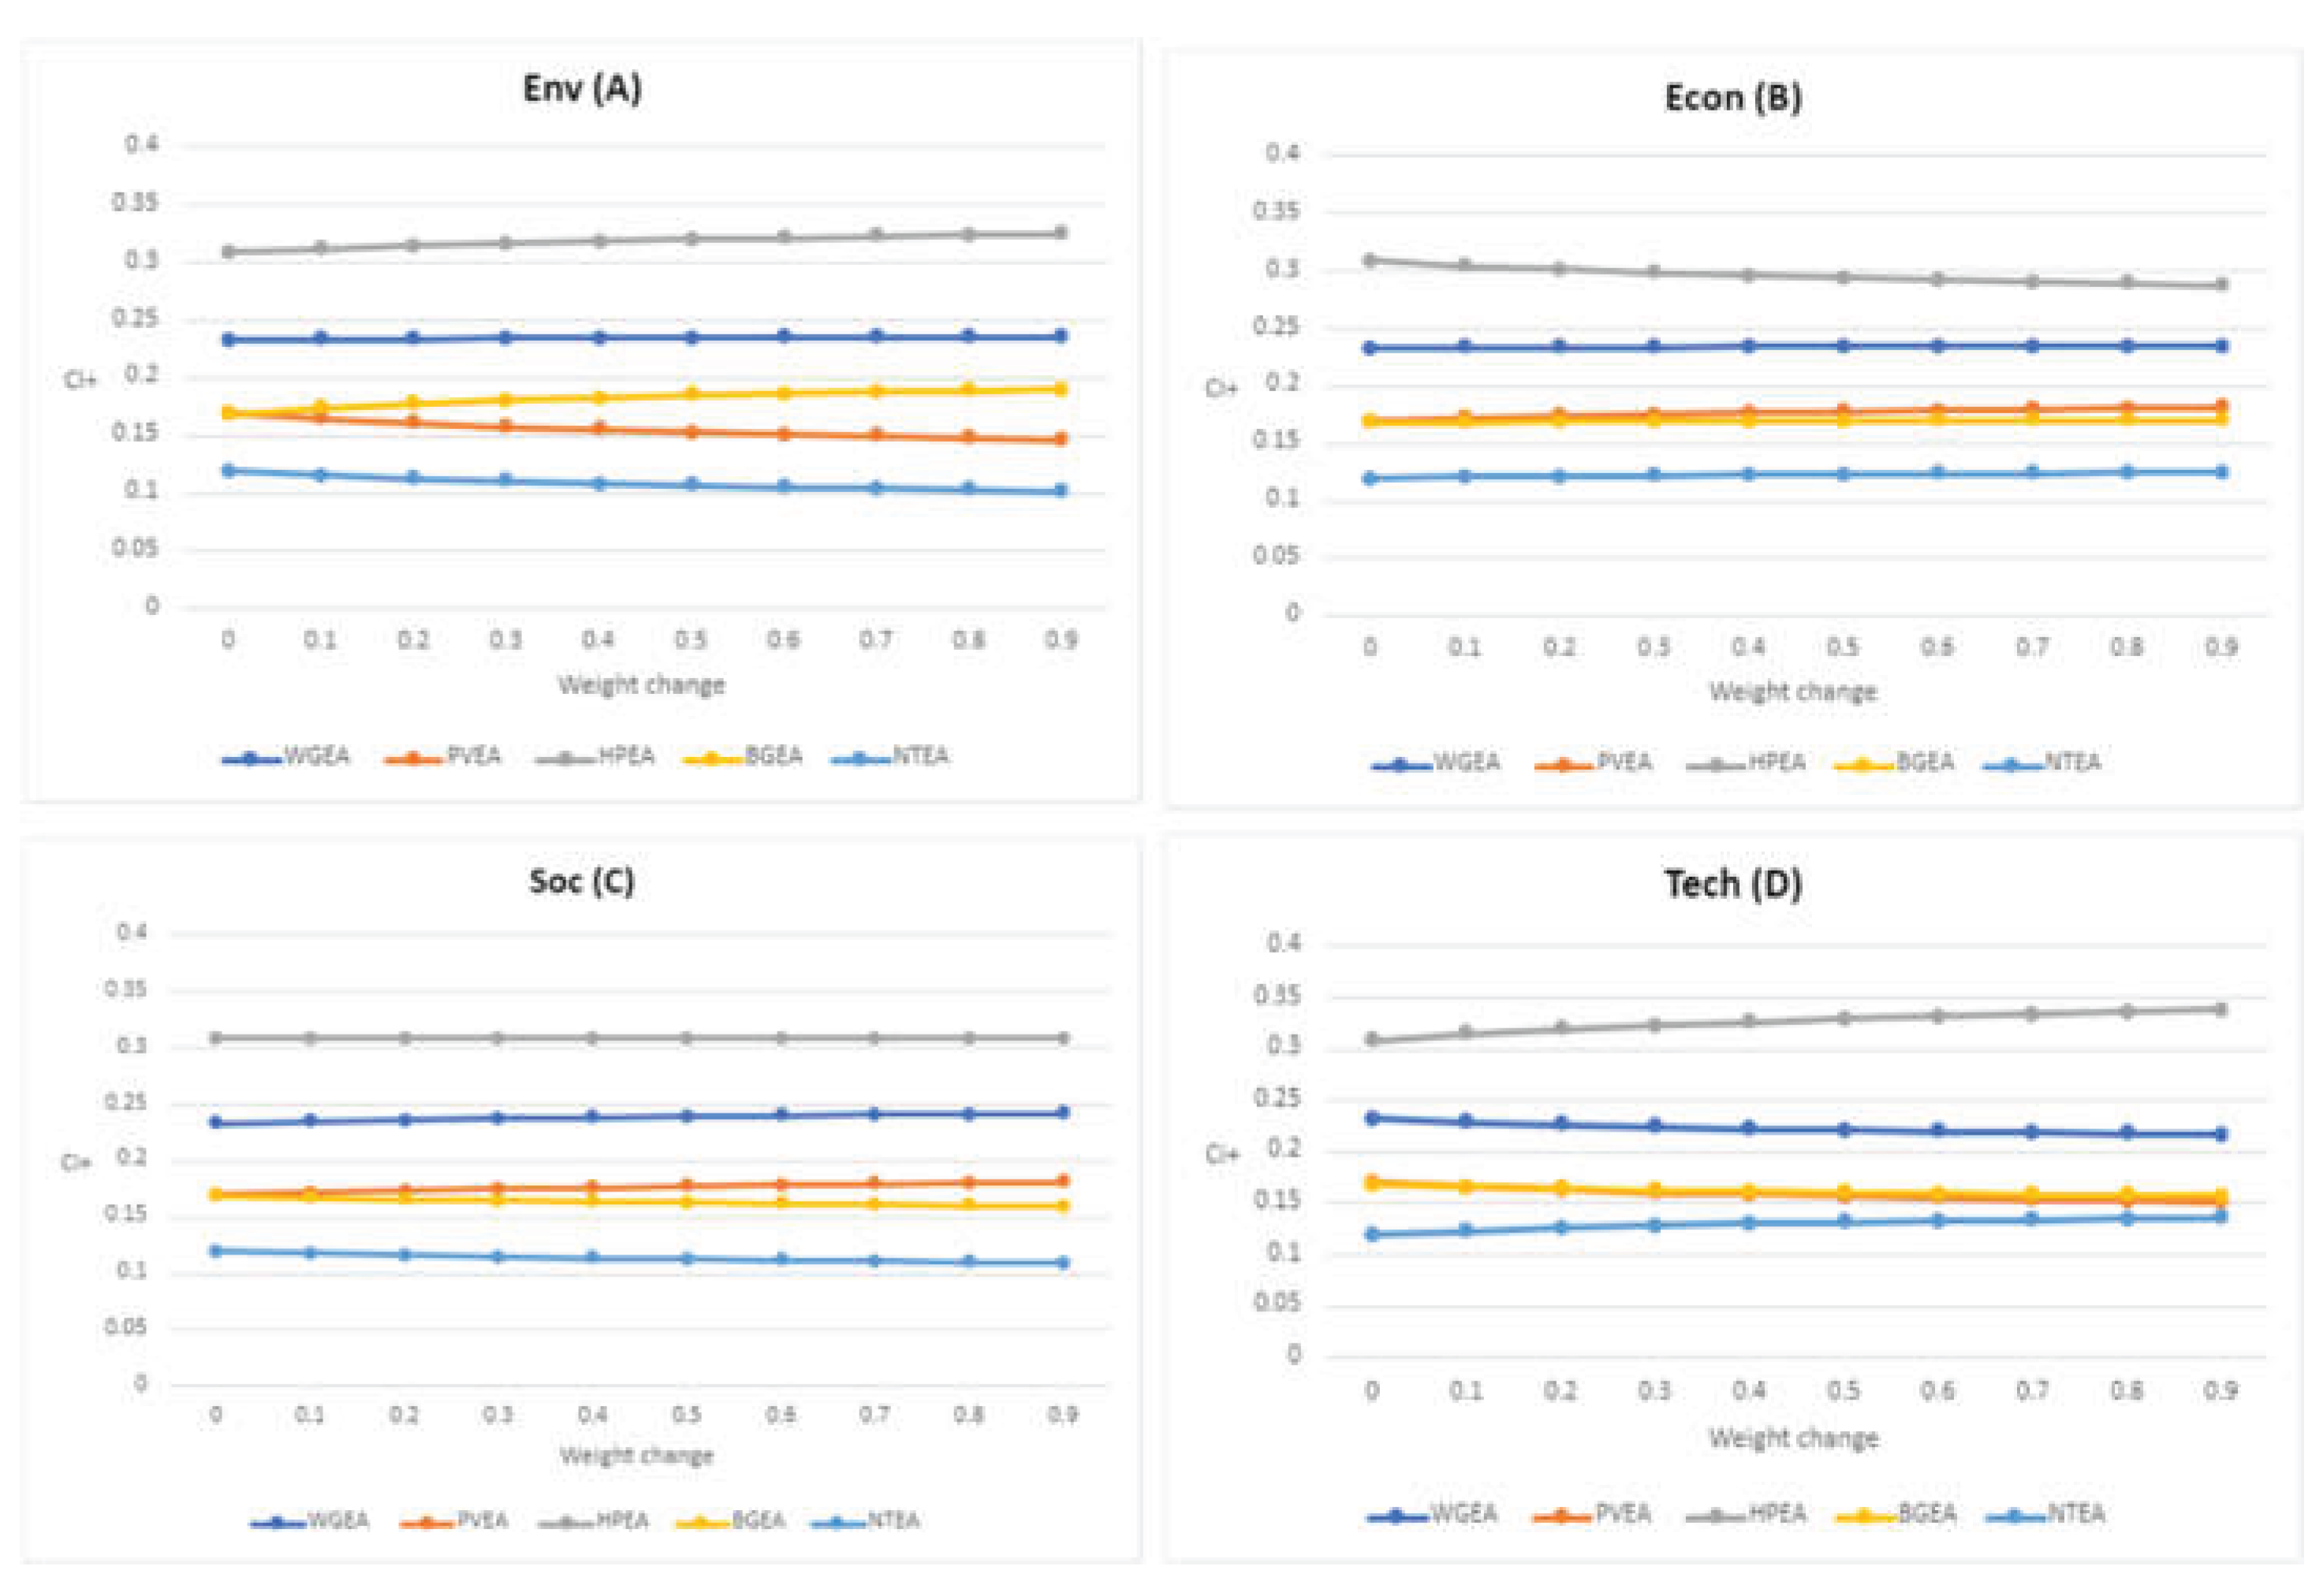
Table 6.
Distances from the positive and negative ideal solutions for each IPA (top) and green NH3 (bottom) pathway. Combination, objective, and (comprehensive) subjective sub-criteria weights only.
Table 6.
Distances from the positive and negative ideal solutions for each IPA (top) and green NH3 (bottom) pathway. Combination, objective, and (comprehensive) subjective sub-criteria weights only.
| Wi | Wo | Wc | ||||
| Di+ | Di- | Di+ | Di- | Di+ | Di- | |
| PH | 0.532 | 0.298 | 0.573 | 0.307 | 0.504 | 0.286 |
| AH | 0.551 | 0.326 | 0.588 | 0.335 | 0.529 | 0.315 |
| IAH | 0.250 | 0.632 | 0.292 | 0.648 | 0.206 | 0.625 |
| Wi | Wo | Wc | ||||
| Di+ | Di- | Di+ | Di- | Di+ | Di- | |
| WGEA | 0.244 | 0.267 | 0.247 | 0.280 | 0.235 | 0.259 |
| PVEA | 0.366 | 0.225 | 0.392 | 0.207 | 0.344 | 0.233 |
| HPEA | 0.180 | 0.404 | 0.161 | 0.431 | 0.192 | 0.375 |
| BGEA | 0.365 | 0.222 | 0.386 | 0.219 | 0.341 | 0.228 |
| NTEA | 0.388 | 0.142 | 0.411 | 0.128 | 0.364 | 0.156 |
Table 7.
Goodness-of-fit for each IPA (top) and green NH3 (bottom) pathway. Combination, objective, and comprehensive subjective sub-criteria weights only.
Table 7.
Goodness-of-fit for each IPA (top) and green NH3 (bottom) pathway. Combination, objective, and comprehensive subjective sub-criteria weights only.
| Wi | Wo | Wc | ||||
| Ci- | Ci+ | Ci- | Ci+ | Ci- | Ci+ | |
| PH | 0.359 | 0.248 | 0.349 | 0.249 | 0.362 | 0.244 |
| AH | 0.371 | 0.257 | 0.363 | 0.259 | 0.373 | 0.251 |
| IAH | 0.716 | 0.495 | 0.689 | 0.492 | 0.752 | 0.752 |
| Wi | Wo | Wc | ||||
| Ci- | Ci+ | Ci- | Ci+ | Ci- | Ci+ | |
| WGEA | 0.522 | 0.233 | 0.531 | 0.241 | 0.525 | 0.229 |
| PVEA | 0.381 | 0.170 | 0.345 | 0.157 | 0.404 | 0.176 |
| HPEA | 0.692 | 0.309 | 0.728 | 0.330 | 0.662 | 0.289 |
| BGEA | 0.378 | 0.169 | 0.362 | 0.164 | 0.401 | 0.175 |
| NTEA | 0.268 | 0.120 | 0.238 | 0.108 | 0.299 | 0.299 |
Disclaimer/Publisher’s Note: The statements, opinions and data contained in all publications are solely those of the individual author(s) and contributor(s) and not of MDPI and/or the editor(s). MDPI and/or the editor(s) disclaim responsibility for any injury to people or property resulting from any ideas, methods, instructions or products referred to in the content. |
© 2025 by the authors. Licensee MDPI, Basel, Switzerland. This article is an open access article distributed under the terms and conditions of the Creative Commons Attribution (CC BY) license (http://creativecommons.org/licenses/by/4.0/).
Copyright: This open access article is published under a Creative Commons CC BY 4.0 license, which permit the free download, distribution, and reuse, provided that the author and preprint are cited in any reuse.


