Submitted:
04 February 2026
Posted:
05 February 2026
You are already at the latest version
Abstract
Background: Olea europaea leaves are rich in phytochemicals that have various biological and pharmacological activities. This study aimed to identify the phytochemical profile of Olea europaea olive leaves extract via Gas Chromatography–Mass Spectrometry (GC/MS) and to analyze their potential effect against MCF-7 breast cancer cell lines. Methods: Leaves were obtained from a farmland in Tikrit city of Iraq during October 2024, washed, dried, ground to a fine powder, and extracted with methanol by soaking. This extract was concentrated with rotary evaporator and analyzed by GC/MS. The cytotoxic activity of the extract against the MCF-7 cell lines was evaluated by MTT cytotoxicity assay. Cells were treated with different extract concentrations (100–3.125 µg/mL) for 72 hours. Results: GC-MS analysis leaves had shown the presence of ten major chemical constituents. A dose-dependent reduction in cytotoxic cell viability was detected, followed by typical apoptotic morphological changes. The IC₅₀ value (9.6µg/mL) was calculated from the dose–response curve, indicating measurable cytotoxicity. Conclusion: Olea europaea leaves possess bioactive constituents capable of exerting significant cytotoxic effects on breast cancer cells. Further studies are required to isolate and characterize the active compounds and to explain their specific properties both in-vitro and in-vivo analysis.
Keywords:
breast cancer
; GC/MS
; leaves
; MCF-7
; olives
1. Introduction
Olea europaea, which belongs to the Oleaceae family, is an evergreen subtropical tree that is known as the olive tree [1]. It is highly distributed in the Mediterranean region and has major implications in ecological, social, and economic fields. Olive tree is characterized by its ability to grow under variety of soil types, climate conditions, elevations, and temperature systems [2]. Olea europaea has various therapeutic utilities that have been indicated in traditional medicine. Literatures reported that Olea europaea had the ability to lower the blood levels of sugar, cholesterol, and uric acid. In addition to that, it was reported that it had been used in the management of diabetes, hypertension, and inflammation. It also has aids in the treatment of respiratory and urinary tract infections, stomach and intestinal diseases, asthma, hemorrhoids, and diarrhea [3]. It has been reported widely that olives can be considered as a functional food because olive has various biophenolic and other bioactive components. The use of olive oil’s volatile constituents in flavor industry development has been indicated as an interesting topic of the recent research [4]. Bioactive constituents of olive leaves have been reported. Olive leaves extracts exhibit radioprotective, antioxidant, and antiproliferative properties against cancer and endothelial cells both in-vitro and in-vivo analysis researches. They are also possess antibacterial properties against a wide range of microorganisms [5,6], and exhibited strong anticancer effects against a variety of cancer types [7]. The presence of various biophenol compounds in olive’s extract is has the ability to modulate cancer cell growth development by either triggering apoptosis or restraining proliferation through a variety of mechanisms [8]. In Mediterranean countries, olive leaves have been commonly used in traditional herbal medicine to prevent and treat various diseases as several potentially bioactive compounds had been identified in olive extract that have anticancer properties [7]. Previous studies have revealed the usefulness of olive leaves extract in controlling colorectal, prostate, leukemia, breast, bladder, and skin cancers in vitro settings [9,10,11,12,13]. Therefore, this study aims to identify the phytochemical profile of Olea europaea olive leaves extract via GC/MS and to analyze their potential effect against MCF-7 breast cancer cell lines.
2. Results
2.1. GC/ MS analysis of Olea europaea
The GC-MS analysis of Olea europaea leaves had shown the presence of ten major chemical constituents. The identification of each compound was based on its peak area percentage, retention time, and molecular structure. The chromatogram (Figure 1) demonstrates the distinct peaks corresponding to these compounds. The relative abundance of each compound, reflected by the peak area percentage, indicates their varying concentrations within the extract. Detailed chemical structures of the identified compounds are shown in Figure 2, Figure 3, Figure 4, Figure 5, Figure 6, Figure 7, Figure 8, Figure 9, Figure 10 and Figure 11. These findings confirm the complex chemical composition of Olea europaea leaves which may contribute to its biological and pharmacological properties.
2.2. Cytotoxicity Evaluation
Figure 12A illustrates MCF-7 cells that were treated with the extracted materials of Olea europaea leaves with noticeable morphological changes detected, for example membrane blebbing, cell shrinkage or the apoptotic bodies’ formation could refer to a cell death.
A reduction in the density of a cell compared to control wells could suggest cytotoxic effects and apoptosis. In contrast and as shown in Figure 1B, the untreated cells appear well-spread, with normal polygonal shape, forming a dense and uniform monolayer and without any sign of damage.
Figure 13 shows the inhibitory curve, which reports the cytotoxic result of different concentrations of Olea europaea leaves extract against MCF-7 cells. A pure elevation in the cell death percentage was reported when the concentration of the extract increases, representing a dose-dependent inhibitory effect. Higher extract doses showed greater cytotoxic effect.
The Olea europaea IC50 value on cancer cells was calculated from the dose–response curve that is represented in Figure 14. The x-axis is the test compound concentration (µg) while the cell inhibition percentage is represented on the y-axis. The IC50 value is represented by the log concentration of the Olea europaea leaves extract prepared.
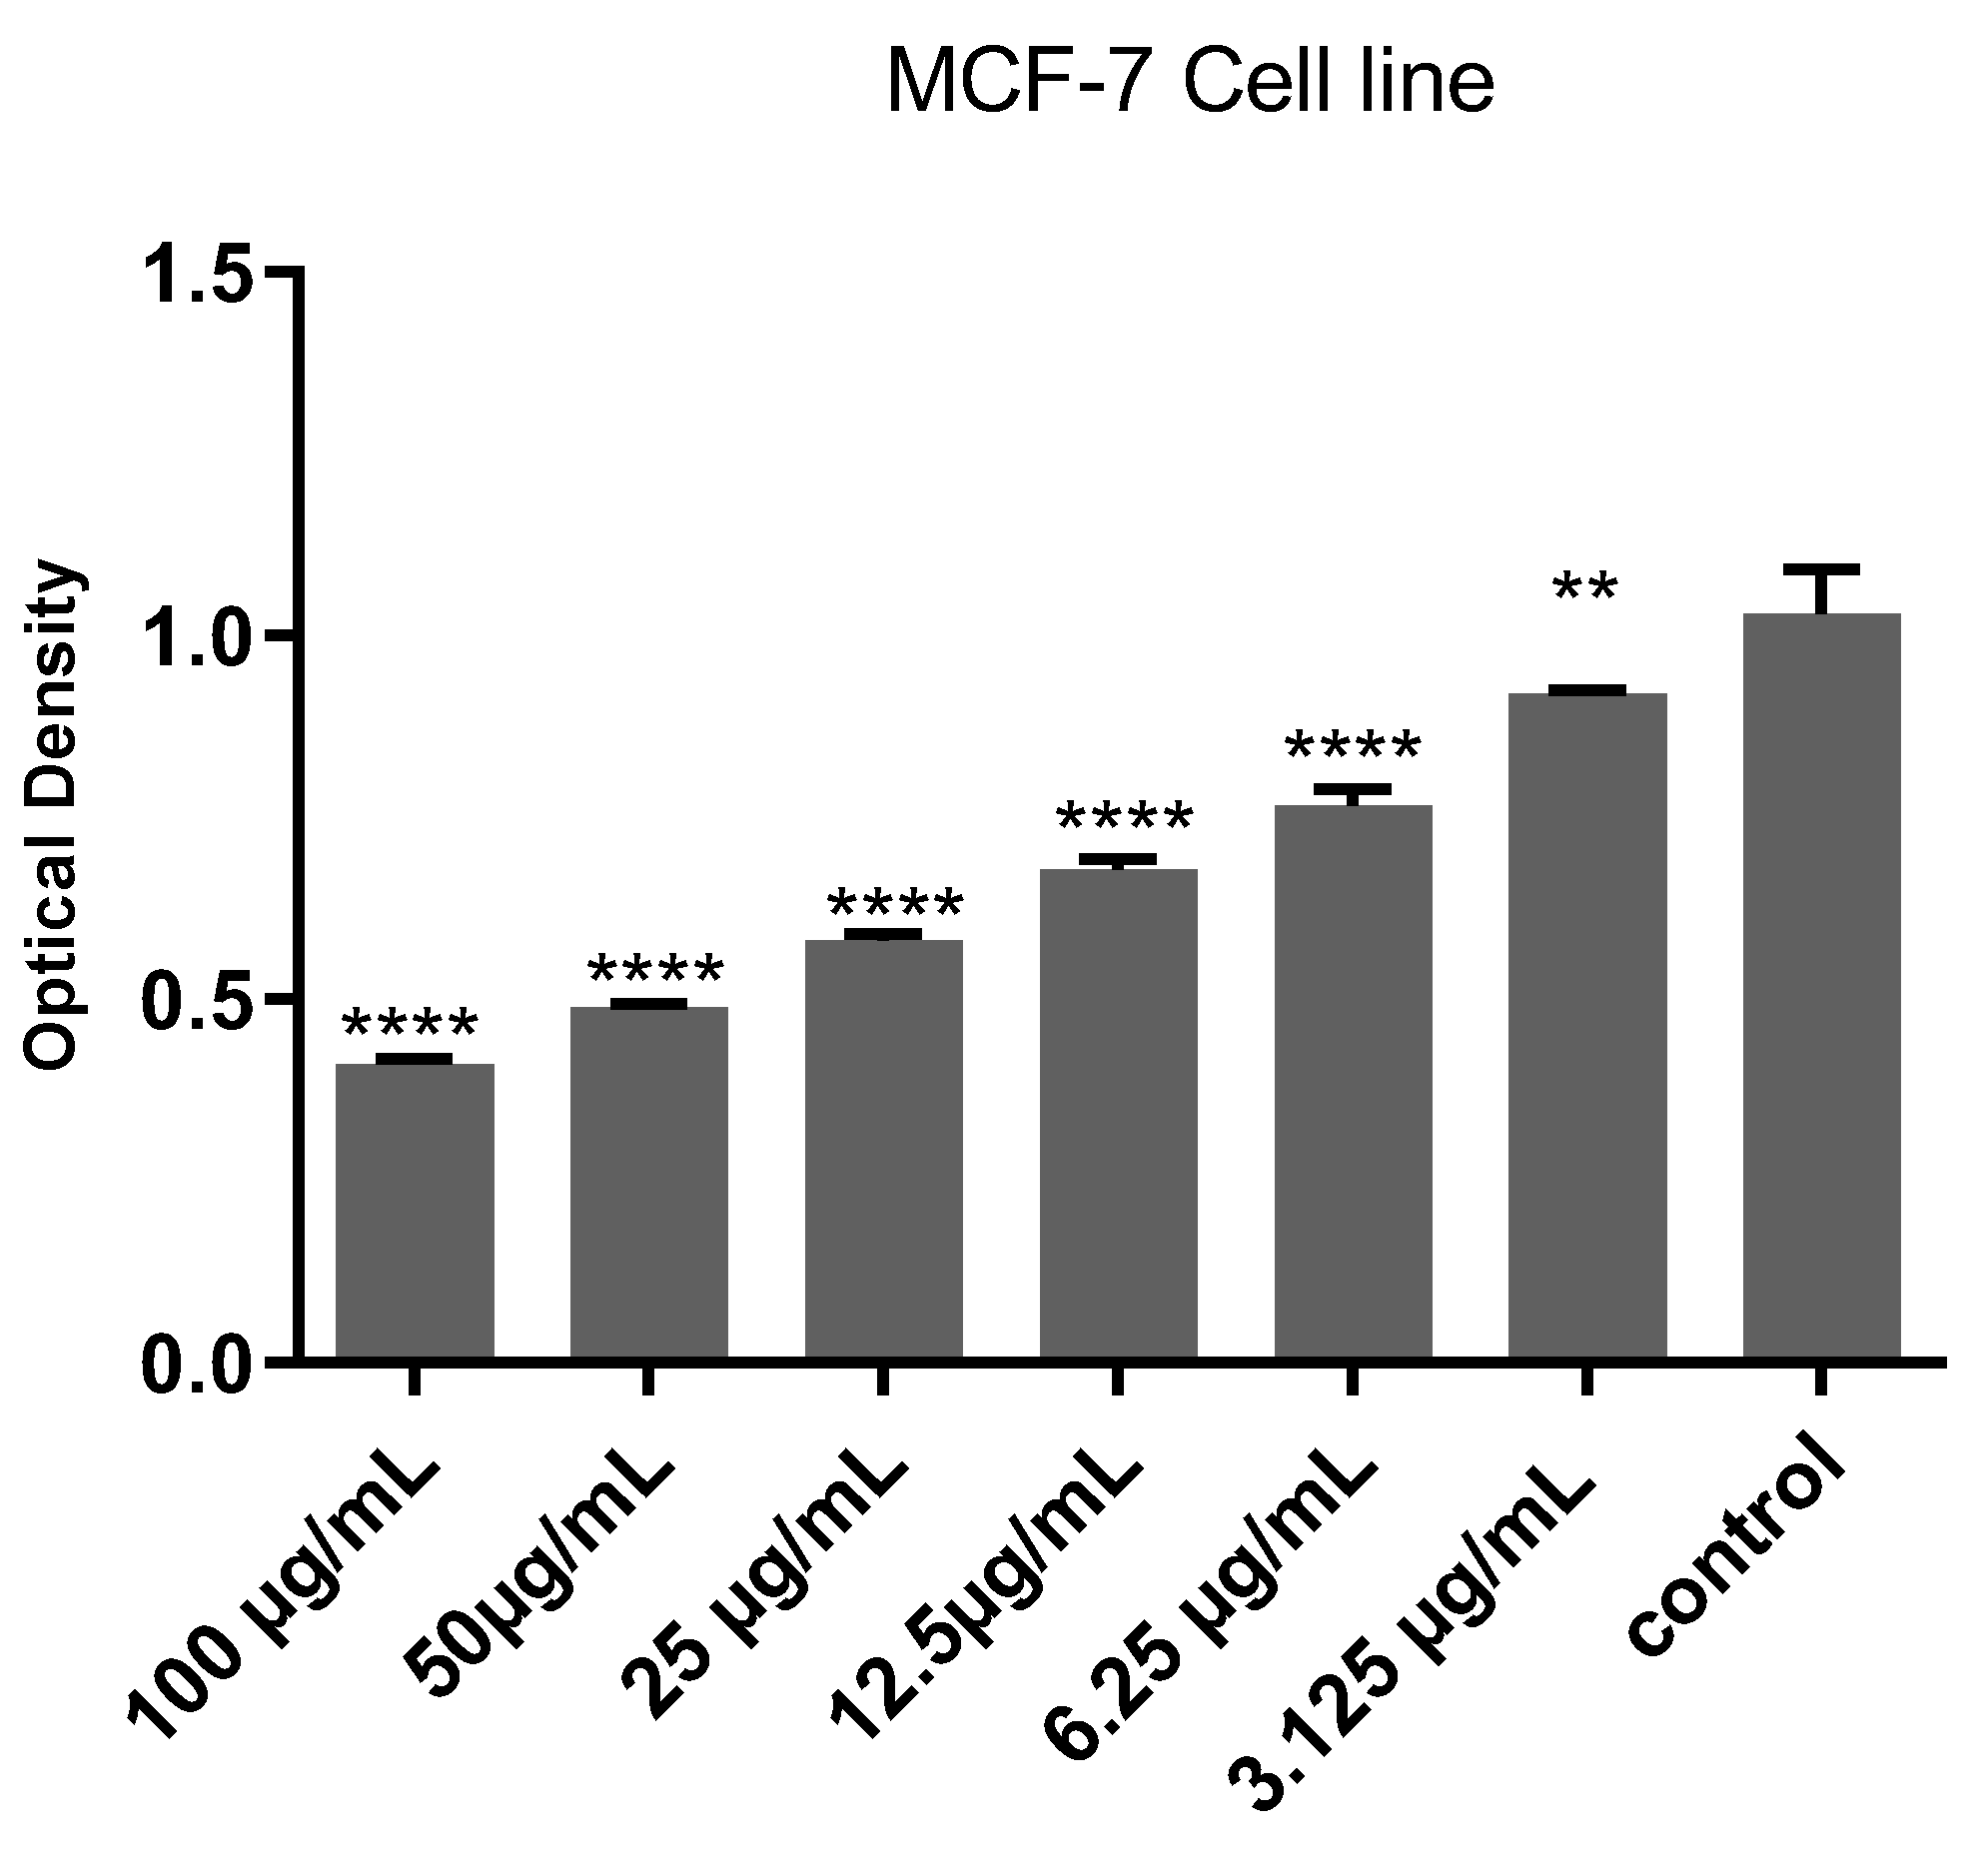
A significant, dose-dependent cytotoxic effect of Olea europaea leaves extract on MCF-7 cells was reported in this study as shown in Figure 15 that represents the post hoc Tukey’s test. As the plant extract concentration increases, there is a statistically significant reductions in cell viability when compared to other lower concentrations and the control group (p < 0.0001).
3. Discussion
The phytochemical composition of Olea europaea leaves extract and its cytotoxic effect were considered in this study by using GC/MS analysis and the MTT assay on MCF-7 breast cancer cells respectively. Ten major chemical compounds were recognized by the GC/MS analysis of Olea europaea leaves extract. Each of these compounds varied in abundance and retention time and advocated a complex mixture of bioactive constituents that were responsible for various biological activities detected in olive leaves extract. Previous studies were reported similar findings where the extract of olive leaves were shown to have various classes of phytochemical constituents such as flavonoids, phenolic compounds, fatty acid and triterpenes derivatives that contribute to their pharmacological effects [14,15]. In particular, the GCMS analysis conducted by Ahmed et al. on forty two various olive samples from variouse geographical regions revealed the presence of more than 100 compounds that belong to hydrocarbons, acids, alcohols, esters, ketones, ethers, and aldehydes chemical classes [16].
The cytotoxicity assay verified a clear dose-dependent inhibitory effect of the Olea europaea leaf extract on MCF-7 cell lines. Morphological findings, including membrane blebbing, cell shrinkage, and apoptotic body formation, strongly refer to the fact that the extract of Olea europaea leaf has the ability to induce apoptosis. The significant cell viability reduction at higher extract concentrations of Olea europaea leaf (p < 0.0001) supports its potent antiproliferative activity. Minimal alterations at lower dosages could suggest that a strong cytotoxic effect requires a threshold concentration. So at higher doses, the olive leaves extract has anticancer properties. Büker et al. confirmed that the Olea europaea leaves extract used alone or combined with various chemotherapeutic agents had the ability to lower MCF-7 cell line viability through apoptotic mechanisms [17]. Furthermore, Jaafar et al. quantified oleanolic acid from Olea europaea leaves in Iraq and confirmed its cytotoxicity against breast ductal carcinoma AMJ13 cells with similar dose-dependent inhibition, confirming the reliability of these results across different extraction methods [18].
The Olea europaea leaves extract profile of GC/MS analysis supports these outcomes as several compounds are identified for their anticancer and antioxidant properties. The presence of these compounds may contribute synergistically to the overall cytotoxic effect. Studies have reported that olive-derived compounds such as hydroxytyrosol and oleuropein can suppress cancer progress by their ability to prevent reactive oxygen species generation and induce mitochondrial apoptosis [19,20]. Alharbi et al. also reported that olive leaves and oil extracts were rich in antioxidant constituents that had the ability to suppress multiple cancer cell lines proliferation, including MCF-7, confirming the synergistic interaction of terpenoid and phenolic compounds [21]. Therefore, the antiproliferative activity observed in this study might be attributed to the combined effects of these phytochemicals rather than a single compound.
4. Materials and Methods
4.1. Plant Material
Olea europaea leaves that were cultivated in a farmland in Tikrit city of Iraq (34.7086267°N 43.6971042°E) during October 2024 were used in this study. The plants were grown under direct sunlight with average daily range of temperature of 30-35 °C. Collected Olea europaea leaves after being thoroughly cleaned with distilled water and allowed to dry in the shade, were ground into a fine powder using a mechanical grinder.
4.2. Extraction Procedure
One hundred grams of the fine powder of leaves materials were allowed to soak in 1500 mL of methanol (Sigma-Aldrich, USA) at room temperature with frequent shaking. Three days later, the methanolic solution was filtered off. In order to obtain a dark green residue, a rotary evaporator (Henan, China) was performed in the evaporation process of the filtrate to dryness under a vacuumed condition.
For cytotoxicity evaluation, a stock solution of 100 mg/mL was prepared by dissolving the extract in DMSO (Sigma-Aldrich, USA). This was serially diluted to obtain final concentrations ranging from 100 to 3.125 µg/mL.
4.3. GC/MS of Olea Europaea Exctract
The extracted material of Olea europaea leaves was evaluated using a Shimadzu GC/MS-QP 2010 Ultra system equipped with a GC 2010 Plus gas chromatograph (Shimadzu, Japan). The analysis conditions were carefully controlled, with the column temperature set at 70 °C and the injection temperature at 240 °C. The splitless mode of injection was performed with a sampling time of one minute. The maintenance of the flow control was performed by pressure at 100 kPa, with a flow rate in the column of 1.53 mL/min and a linear velocity of 45.4 cm/sec. The purge flow was fixed to 3.0 mL/min, and the split ratio was 10. The oven temperature program for the hexane fraction began at 70 °C with a 3-minute hold, followed by an increase of 12 °C per minute to 150 °C with a 2-minute hold, then another increase of 12 °C per minute to 240 °C with an 8-minute hold, with a total run time of 31.5 minutes. For the leaf oils, the oven temperature started at 60 °C with a 2-minute hold, then increased by 10 °C per minute to 300 °C with a 10-minute hold, totaling 38 minutes of run time. The mass fragmentation patterns of the different compounds were compared to the instrument’s database for accurate identification.
4.4. Cytotoxicity Assay
The breast cancer cell line known as Michigan Cancer Foundation-7 (MCF-7) was isolated from a 69-year-old white woman according to Soule et al., 1973 [22].
The MCF-7 cell lines were cultured in Minimum Essential Medium (US Biological, USA) enhanced with 10% (v/v) fetal bovine serum (Capricorn-Scientific, Ebsdorfergrund, Germany), and 100µg streptomycin, and 100 IU penicillin (Capricorn-Scientific, Ebsdorfergrund, Germany) and incubated at 37 °C in a humidified atmosphere. For experiments, exponentially expanding cells were utilized [23].
4.5. MTT Assay
The MTT (3-(4,5-dimethylthiazol-2-yl)-2,5-diphenyltetrazolium bromide) cytotoxicity assay was used for evaluating cell viability and cytotoxicity. This colorimetric assay is based on the ability of viable cells to reduce the yellow MTT color to purple formazan crystals by mitochondrial dehydrogenases effect. The cells were usually added to a 96-well plate and treated with various plant extract concentrations. MTT was applied to each well after an incubation period and then incubated once more. Viable cells convert MTT into formazan, which can be solubilized, and its concentration was measured by using a spectrophotometer at a specific wavelength (usually 570 nm). A directly proportional effect between the amount of formazan produced and the number of viable cells is present and therefore, a decrease in formazan production (and thus a decrease in absorbance) after treatment with the test compound can indicate cytotoxicity. The half-maximal inhibitory concentration (IC50), which is the concentration of the test compound that reduces cell viability by 50%, can be calculated from the dose-response curve [24].
Cells were added to a 96-well microplate (NEST Biotech, China) at a density of 10000 cells, then they were incubated at 37 °C for 72 h until monolayer confluence was obtained. The cells were exposed to a range of concentrations (100, 50, 25, 12.5, 6.2, 3.1 ug). After 72h of infection, twenty eight µL of (2 mg/ml) MTT dye solution was seeded in each well, and the incubation was continued for three hours. DMSO at a total of 100 μl was added to each well and incubated for 15 min. A microplate reader was used to measure the optical density at 492 nm [25]. The cytotoxicity percentage was calculated by:
Cytotoxicity % = (OD Control – OD sample)/OD Control × 100,
were OD control is the mean optical density of untreated wells, while the OD Sample being the optical density of treated wells [26].
4.6. Statistical Analysis
ANOVA followed by Tukey’s post hoc test was performed to determine the significant differences between the groups. The significance level of p < 0.05 was set, while values of p < 0.001 and p < 0.0001 were considered highly significant. The statistical analysis was conducted with GraphPad Prism version 9.0 (GraphPad Software, San Diego, CA, USA).
5. Conclusions
The results of this study confirm that Olea europaea leaves have bioactive constituents able to exert significant cytotoxic effects on breast cancer cells. This highlights that olive leaf extracts can be considered as a promising natural source of anticancer agents. However, further studies are required to isolate and characterize the individual active compounds and to explore their specific mechanisms of action both in vitro and in vivo analysis.
Author Contributions
Conceptualization, A.O.; methodology, A.O and A.A.; software, A.A.; validation, O.A. and A.A.; formal analysis, O.A.; investigation, O.A.; resources, A.A.; data curation, O.A. and A.A.; writing—original draft preparation, O.A. and A.A.; writing—review and editing, O.A. and A.A.; visualization, A.A.; supervision, O.A.; project administration, O.A.; funding acquisition, O.A. and A.A. All authors have read and agreed to the published version of the manuscript.
Funding
This research received no external funding.
Institutional Review Board Statement
Not applicable.
Informed Consent Statement
Not applicable.
Data Availability Statement
Data will be available upon request.
Conflicts of Interest
The authors declare no conflicts of interest.
References
- Pessoa, H. R.; Zago, L.; Difonzo, G.; Pasqualone, A.; Caponio, F.; Ferraz da Costa, D. C. Olive Leaves as a Source of Anticancer Compounds: In Vitro Evidence and Mechanisms. Molecules (Basel, Switzerland), 2024,29(17), 4249. [CrossRef]
- Hussain, S.Z.; Naseer, B.; Qadri, T.; Fatima, T.; Bhat, T.A. Olive (Olea europaea L.)—Morphology, Taxonomy, Composition and Health Benefits. In: Fruits Grown in Highland Regions of the Himalayas. Springer, Cham, 2021. [CrossRef]
- Shafiq, M.; Iqbal, M. Z.; Athar, M. The beneficial effects of olive tree (Olea europaea L.) in the nutritional, pharmaceutical and industrial application: a review. J. Plant Develop. 2024,31: 247-266. [CrossRef]
- Bavaro, A.R.; Tarantini, A.; Bruno, A.; Logrieco, A.F.; Gallo, A.; Mita, G.; Valerio, F.; Bleve, G.; Cardinali, A. Functional foods in Mediterranean diet: exploring the functional features of vegetable case-studies obtained also by biotechnological approaches. Aging Clin Exp Res. 2024 Oct 16;36(1):208. [CrossRef]
- Magyari-Pavel, I. Z.; Moacă, E.-A.; Avram, Ș.; Diaconeasa, Z.; Haidu, D.; Ștefănuț, M. N.; Rostas, A. M.; Muntean, D.; Bora, L.; Badescu, B.; Iuhas, C.; Dehelean, C. A.; Danciu, C. Antioxidant Extracts from Greek and Spanish Olive Leaves: Antimicrobial, Anticancer and Antiangiogenic Effects. Antioxidants, 2024,13(7), 774. [CrossRef]
- Rishmawi, S.; Haddad, F.; Dokmak, G.; Karaman, R. A Comprehensive Review on the Anti-Cancer Effects of Oleuropein. Life (Basel, Switzerland), 2022,12(8), 1140. [CrossRef]
- Antoniou, C.; Hull, J. The Anti-cancer Effect of Olea europaea L. Products: a Review. Curr. Nutr. Rep., 2021,10(1), 99–124. [CrossRef]
- Maleki Dana, P.; Sadoughi, F.; Asemi, Z. Yousefi, B. The role of polyphenols in overcoming cancer drug resistance: a comprehensive review. Cell Mol Biol Lett. 2022 Jan 3;27(1):1. [CrossRef]
- Albogami, S.; Hassan, A. M. Assessment of the Efficacy of Olive Leaf (Olea europaea L.) Extracts in the Treatment of Colorectal Cancer and Prostate Cancer Using In Vitro Cell Models. Molecules (Basel, Switzerland), 2021,26(13), 4069. [CrossRef]
- Uğuz, A. C.; Rocha-Pimienta, J.; Martillanes, S.; Garrido, M.; Espino, J.; Delgado-Adámez, J. Chlorophyll Pigments of Olive Leaves and Green Tea Extracts Differentially Affect Their Antioxidant and Anticancer Properties. Molecules (Basel, Switzerland), 2023,28(6), 2779. [CrossRef]
- Shah, Z.A.; Mujawah, A.A.H.; Ullah, I.; Rauf, A.; Rashid, U.; Khalil, A.A.; Shah, S.M.M.; Pervaiz, A.; Shaheen, F.; Al-Awthan, Y.S.; Qureshi, M.N.; Al-Duais, M.A.; Bahattab, O.; Almarhoon, Z.M.; Mabkhot, Y.N.; Mubarak, M.S. Antioxidant and Cytotoxic Activity of a New Ferruginan A from Olea ferruginea: In Vitro and In Silico Studies. Oxid Med Cell Longev. 2022 Jan 20;2022:8519250. [CrossRef]
- De Cicco, P.; Ercolano, G.; Tenore, G. C.; Ianaro, A. Olive leaf extract inhibits metastatic melanoma spread through suppression of epithelial to mesenchymal transition. Phytother Res, 2022,36(10), 4002–4013. [CrossRef]
- Spagnuolo, C.; Moccia, S.; Tedesco, I.; Crescente, G.; Volpe, M. G.; Russo, M.; Russo, G. L. Phenolic Extract from Extra Virgin Olive Oil Induces Different Anti-Proliferative Pathways in Human Bladder Cancer Cell Lines. Nutrients, 2022,15(1), 182. [CrossRef]
- Wed Fathi Ibrahim, Ahmed Chaloob Saddam, Terezie Tolar-Peterson. Study of Chemical Composition and Phytochemical Compounds Of Local Olive (Olea Europaea L.) Leaves. Iraqi J. Agric. Sci., 2025,56(4), 1482-1491. [CrossRef]
- Zaïri, A.; Nouir, S.; Zarrouk, A.; Haddad, H.; Khelifa, A.; Achour, L. Phytochemical profile, cytotoxic, antioxidant, and allelopathic potentials of aqueous leaf extracts of Olea europaea. Food Science & Nutrition, 2020,8(9), 4805-4813. [CrossRef]
- Ahmad, R.; Alqathama, A.; Alam, M.M.; Riza M.; AbdallaA. N.; Aldholmi M.; Al− Said, H.M.; Aljishi, F.S.; Althomali, E.H.; Alabdullah, M.M.; Altaweel, N.H.; Almubarak, A.F.; Asghar, S.S.. Biological quality and phytochemical profiling of olive fruits using gas chromatography–mass spectrometry (GCMS) analysis. Chem. Biol. Technol. Agric. 2023,10, 45. [CrossRef]
- Büker, E.; Kiran, F.; Taliboglu, S.; Casoni, D.; Ipekel, A. In Vitro Evaluation of Olive Leaf (Olea europaea L.) Extract as a Functional Food Component in Combination with Chemotherapeutics in MCF-7 Breast Cancer Cells. Pharmaceuticals (Basel, Switzerland), 2025,18(7), 965. [CrossRef]
- Jaafar, N.S.; Alshammaa, D.A.; Abdul-lalil, T.Z.; Ibrahem, N.M. Quantitative Determination and Cytotoxic Effect of Oleanolic Acid from Olea europaea Leaves Extract Cultivated in Iraq. Iraqi J. Pharm. Sci. 2022,31(2), 244-250. [CrossRef]
- Liu, L.; Ahn, K.S.; Shanmugam, M.K.; Wang, H.; Shen, H.; Arfuso, F.; Chinnathambi, A.; Alharbi, S.A.; Chang, Y.; Sethi, G.; Tang, F.R. Oleuropein induces apoptosis via abrogating NF-κB activation cascade in estrogen receptor–negative breast cancer cells. J. Cell. Biochem., 2019,120(3), 4504-4513. [CrossRef]
- Calahorra, J.; Martínez-Lara, E.; Granadino-Roldán, J.M.; Cañuelo, A.; Blanco, S.; Oliver, F.J.; Siles, E. Crosstalk between hydroxytyrosol, a major olive oil phenol, and HIF-1 in MCF-7 breast cancer cells. Sci Rep. 2020 Apr 14;10(1):6361. [CrossRef]
- Alharbi, R.M.; Gomah, N.H.; Ragab, W.S.M.; Awad, N.S.; Abdein, M.A. Antiproliferative Activity of Antioxidants-Rich Extracts from Olea europaea L. Leaves and Oil Against Six Cancerous Human Cell Lines. Int. J. Fruit Sci., 2024,24(1), 349–362. [CrossRef]
- Soule, H.D.; Vazguez, J.; Long, A.; Albert, S.; Brennan, M. A human cell line from a pleural effusion derived from a breast carcinoma. J Natl Cancer Inst. 1973 Nov;51(5):1409-16. [CrossRef]
- Salman, M.I.; Al-Shammari, A.M.; Emran, M.A. 3-Dimensional coculture of breast cancer cell lines with adipose tissue-Derived stem cells reveals the efficiency of oncolytic Newcastle disease virus infection via labeling technology. Front. Mol. Biosci. 2022,9, 754100. [CrossRef]
- Al-Shammari, A. M.; Salman, M. I. Antimetastatic and antitumor activities of oncolytic NDV AMHA1 in a 3D culture model of breast cancer. Front. Mol. Biosci., 2024,11, 1331369. [CrossRef]
- Salman, M.I.; Emran, M.A.; Al-Shammari, A.M. Spheroid-formation 3D engineering model assay for in vitro assessment and expansion of cancer cells. In Proceedings of the AIP Conference Proceedings, Yogyakarta, Indonesia, 10–11 November 2021; AIP Publishing: Melville, NY, USA, 2021; Volume 2372, No. 1 . [CrossRef]
- Freshney, R. Ian. Culture of animal cells: a manual of basic technique and specialized applications. John Wiley & Sons, 2015. [CrossRef]
Figure 1.
GC/MS chromatogram over the time range 2.0-27.0 min of Olea europaea leaves extract.
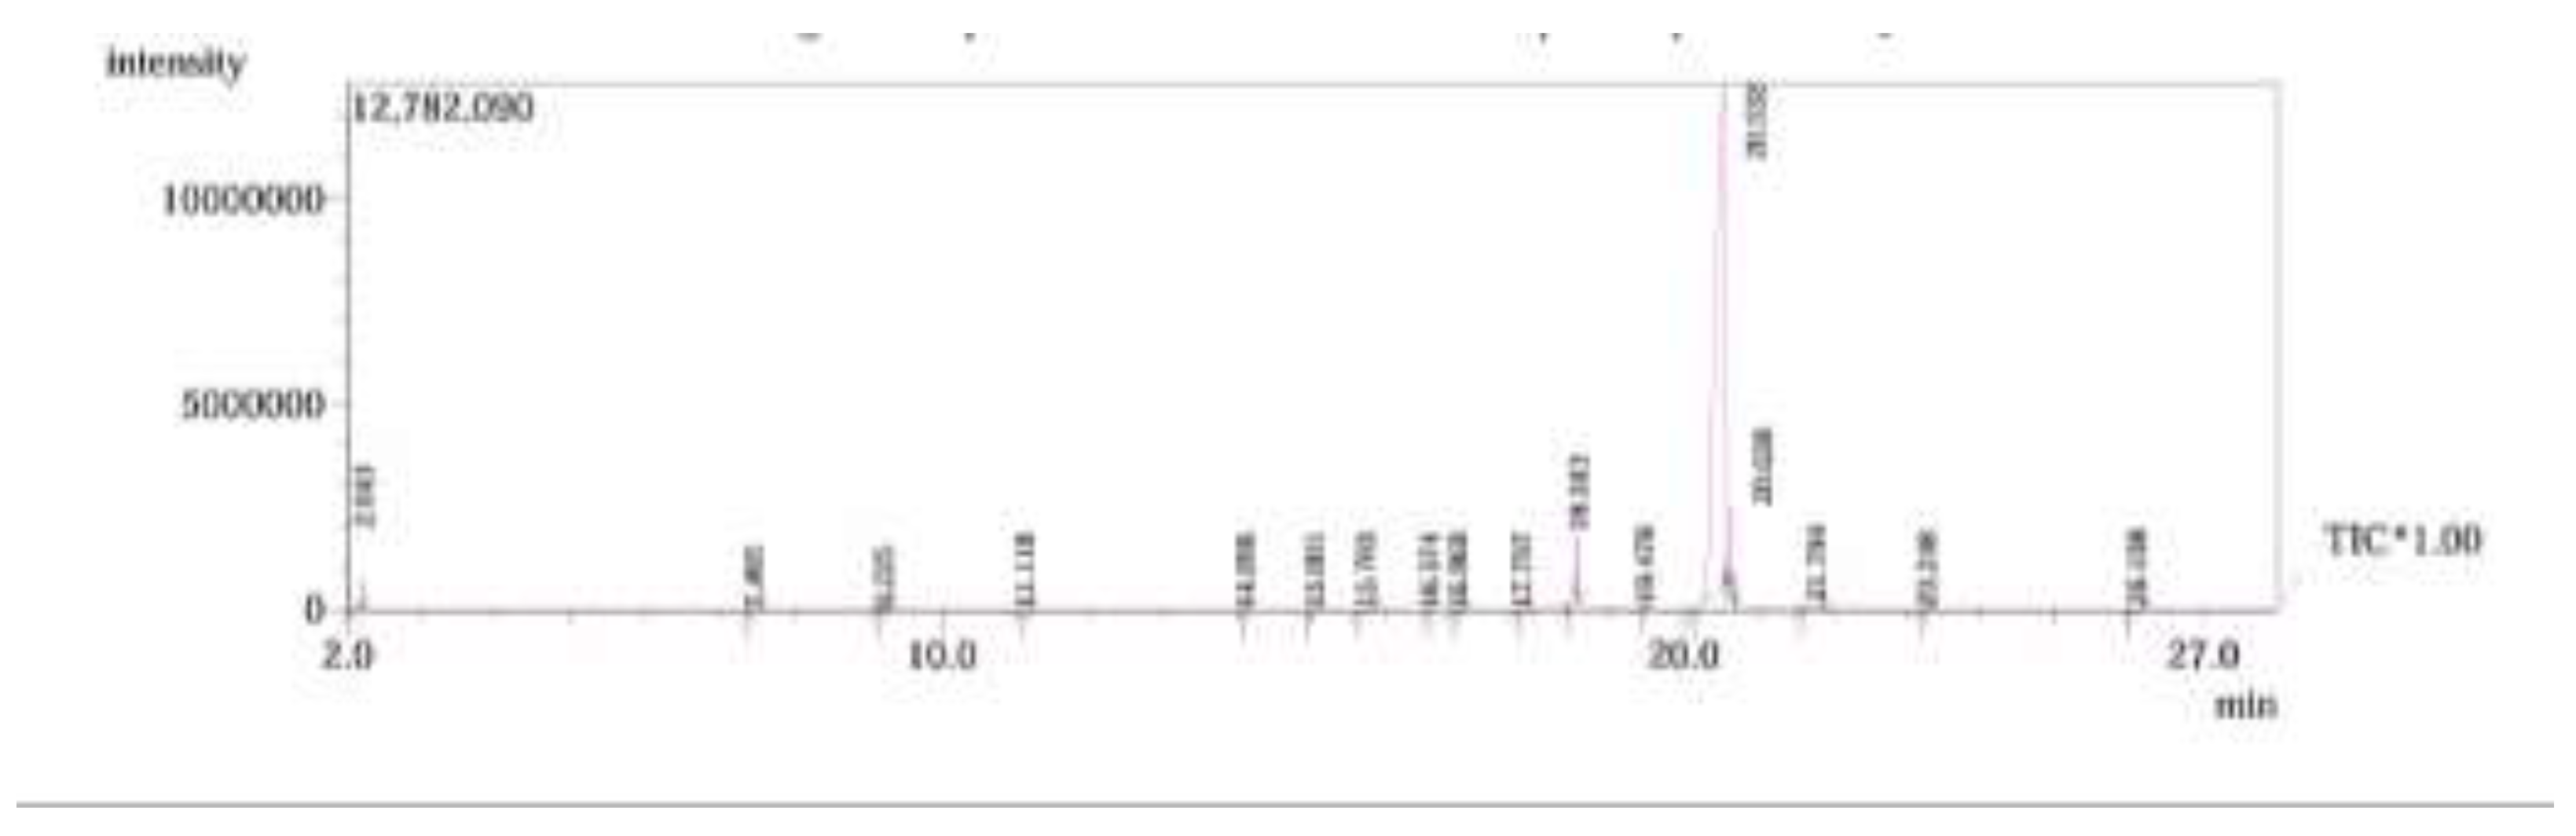
Figure 2.
Chromatographic profile and chemical structure of identified compound 1 (Isoxazolidine).
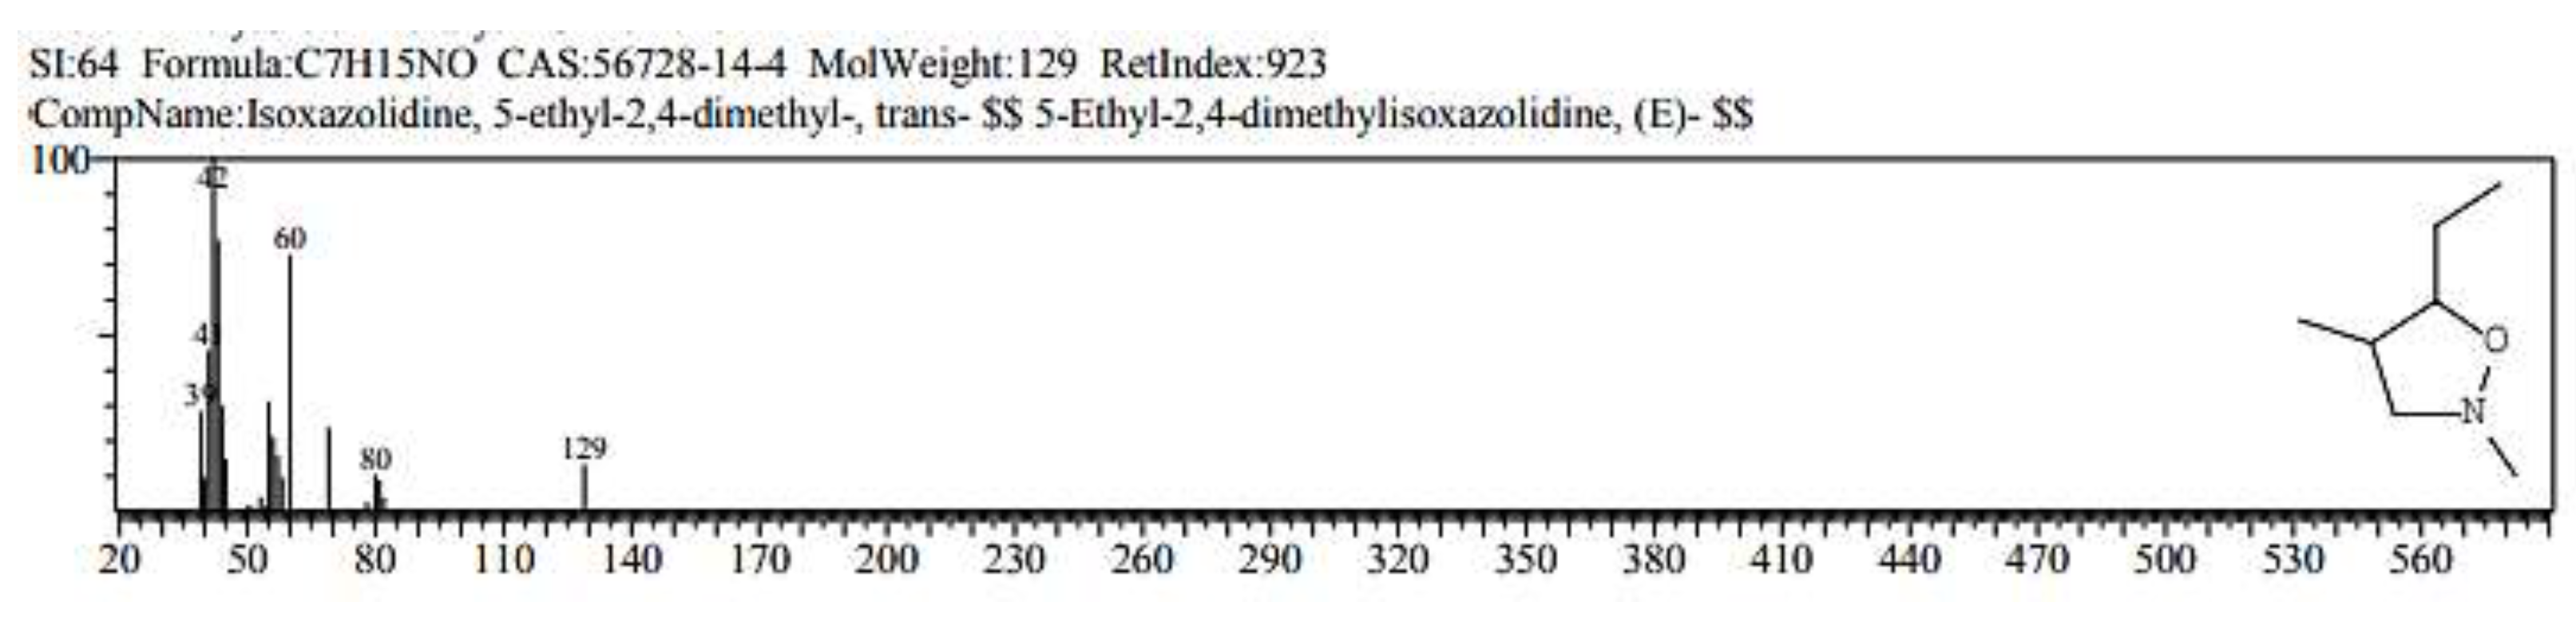
Figure 3.
Chromatographic profile and chemical structure of identified compound 2 (Hexanoic acid). .
Figure 3.
Chromatographic profile and chemical structure of identified compound 2 (Hexanoic acid). .
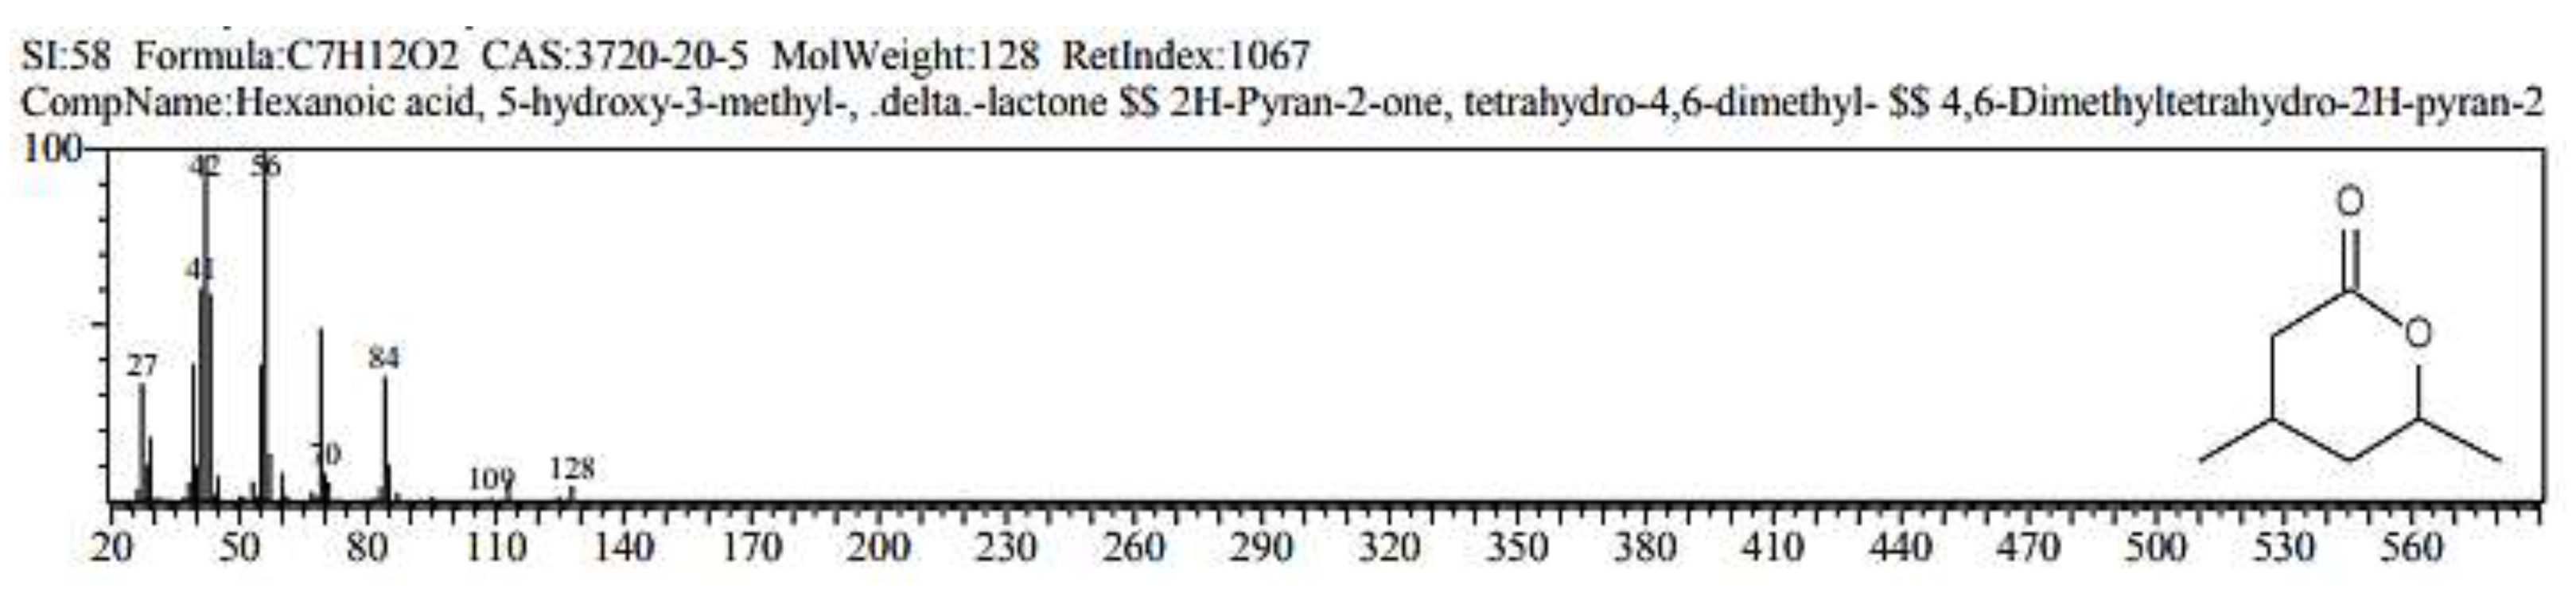
Figure 4.
Chromatographic profile and chemical structure of identified compound 3 (L-proline). .
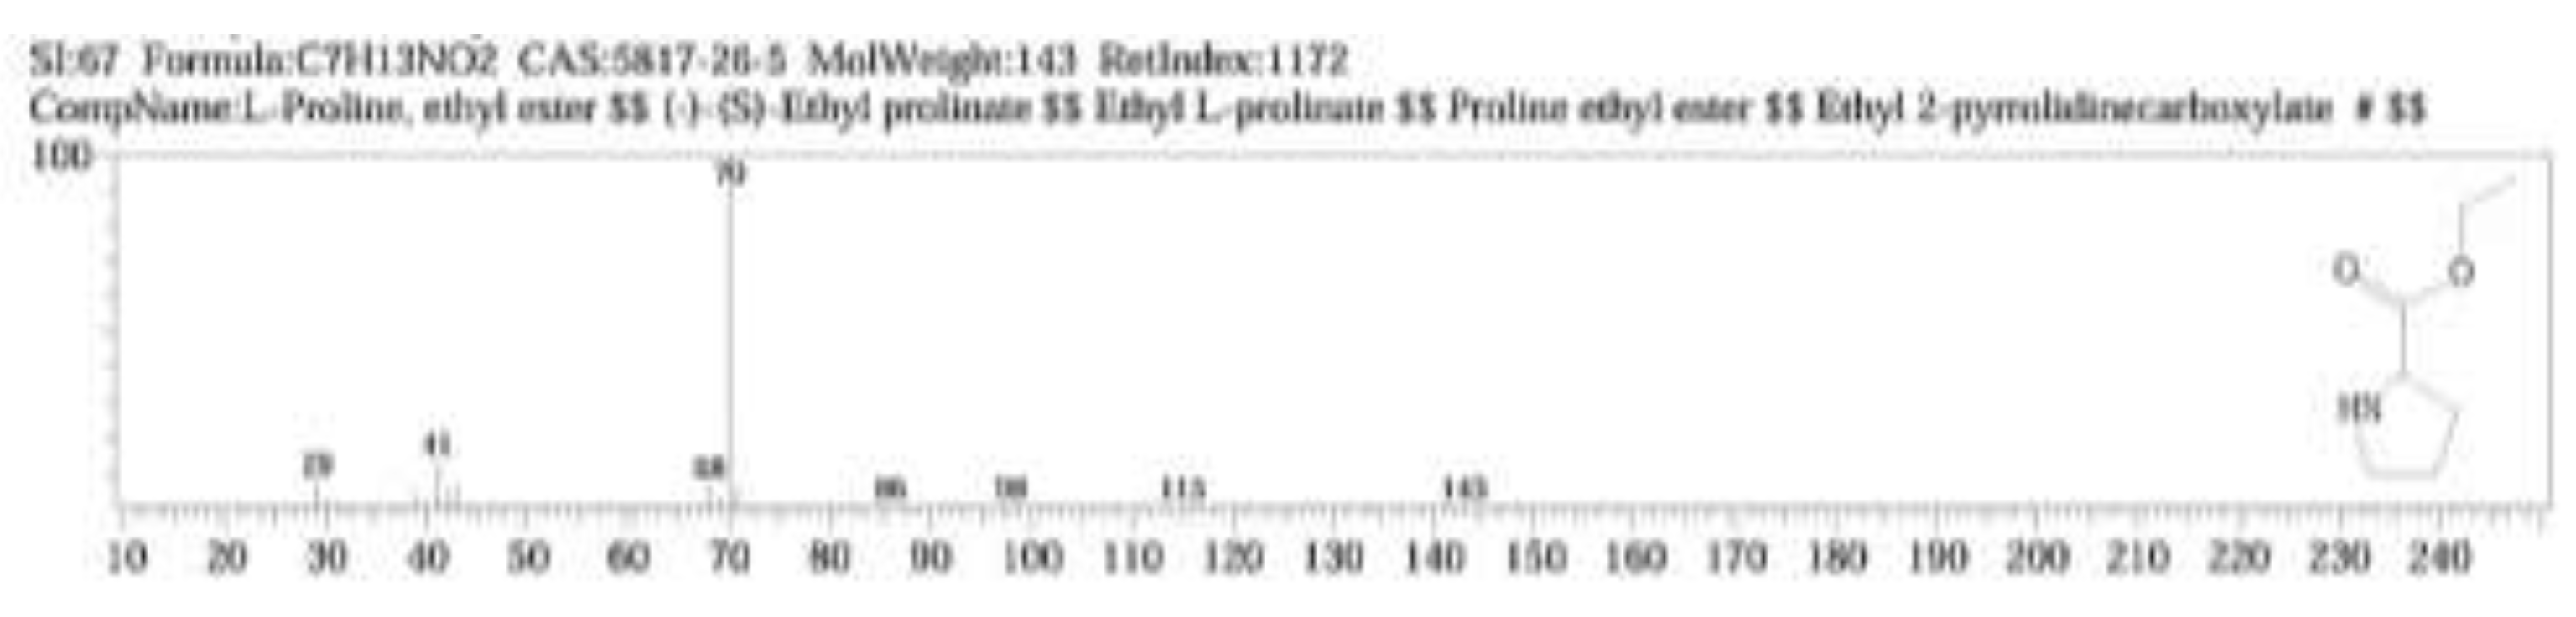
Figure 5.
Chromatographic profile and chemical structure of identified compound 4 (Pentanoic acid). .
Figure 5.
Chromatographic profile and chemical structure of identified compound 4 (Pentanoic acid). .
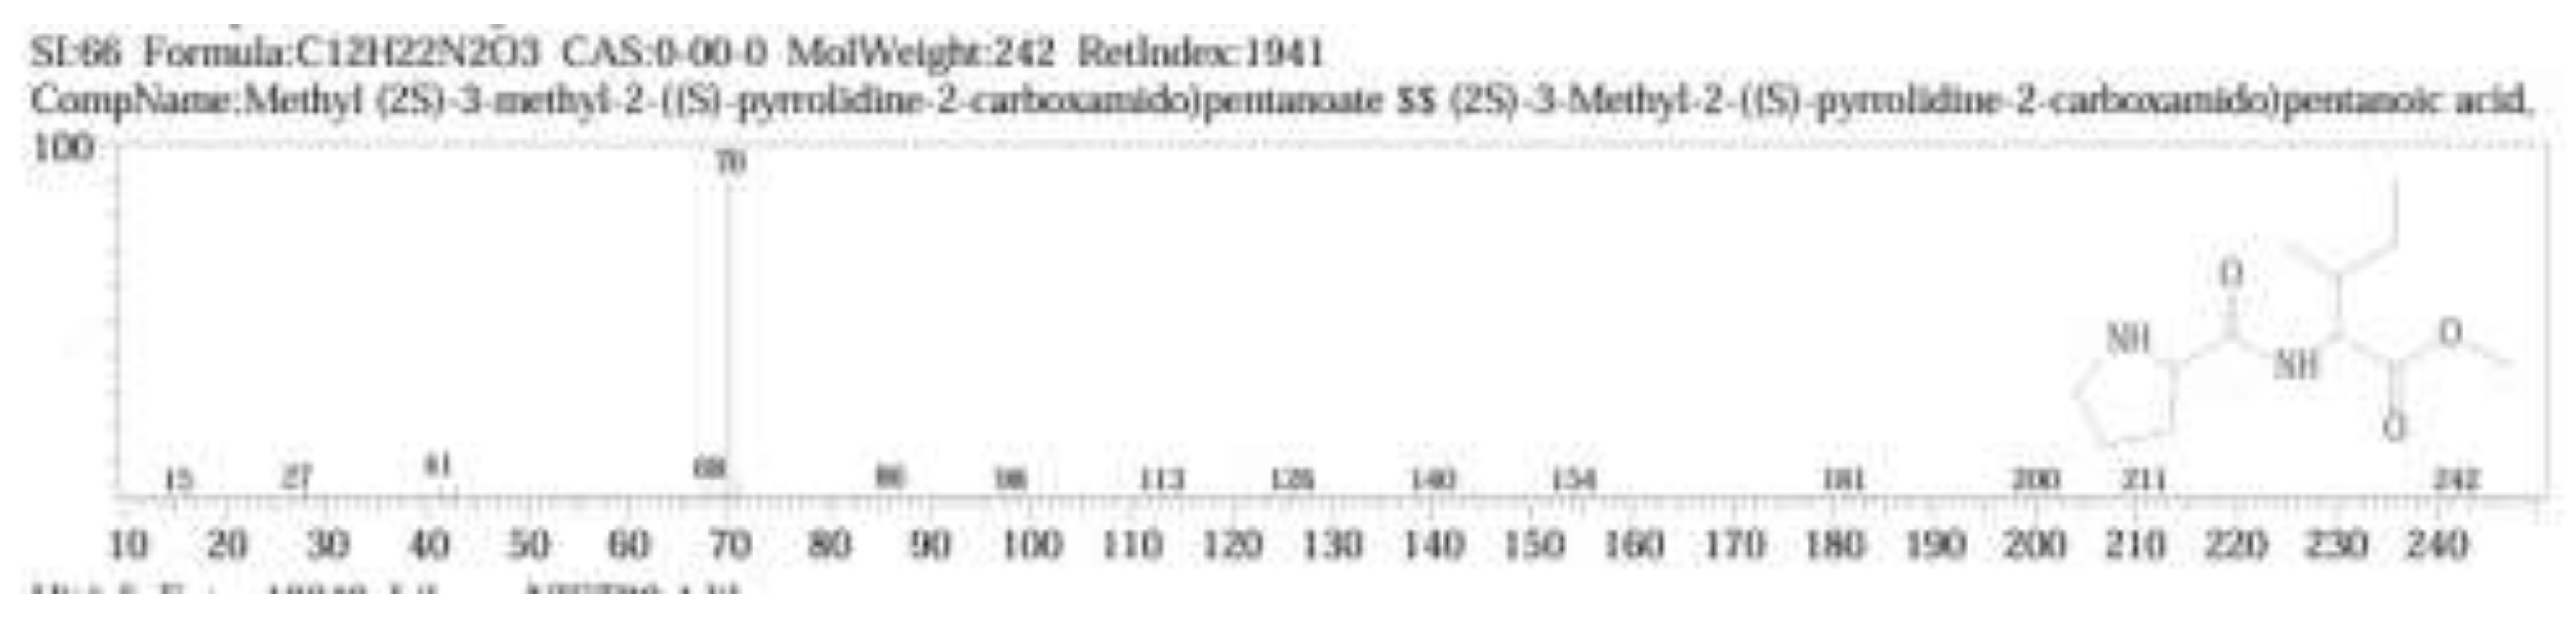
Figure 6.
Chromatographic profile and chemical structure of identified compound 5 (D-alanine)..
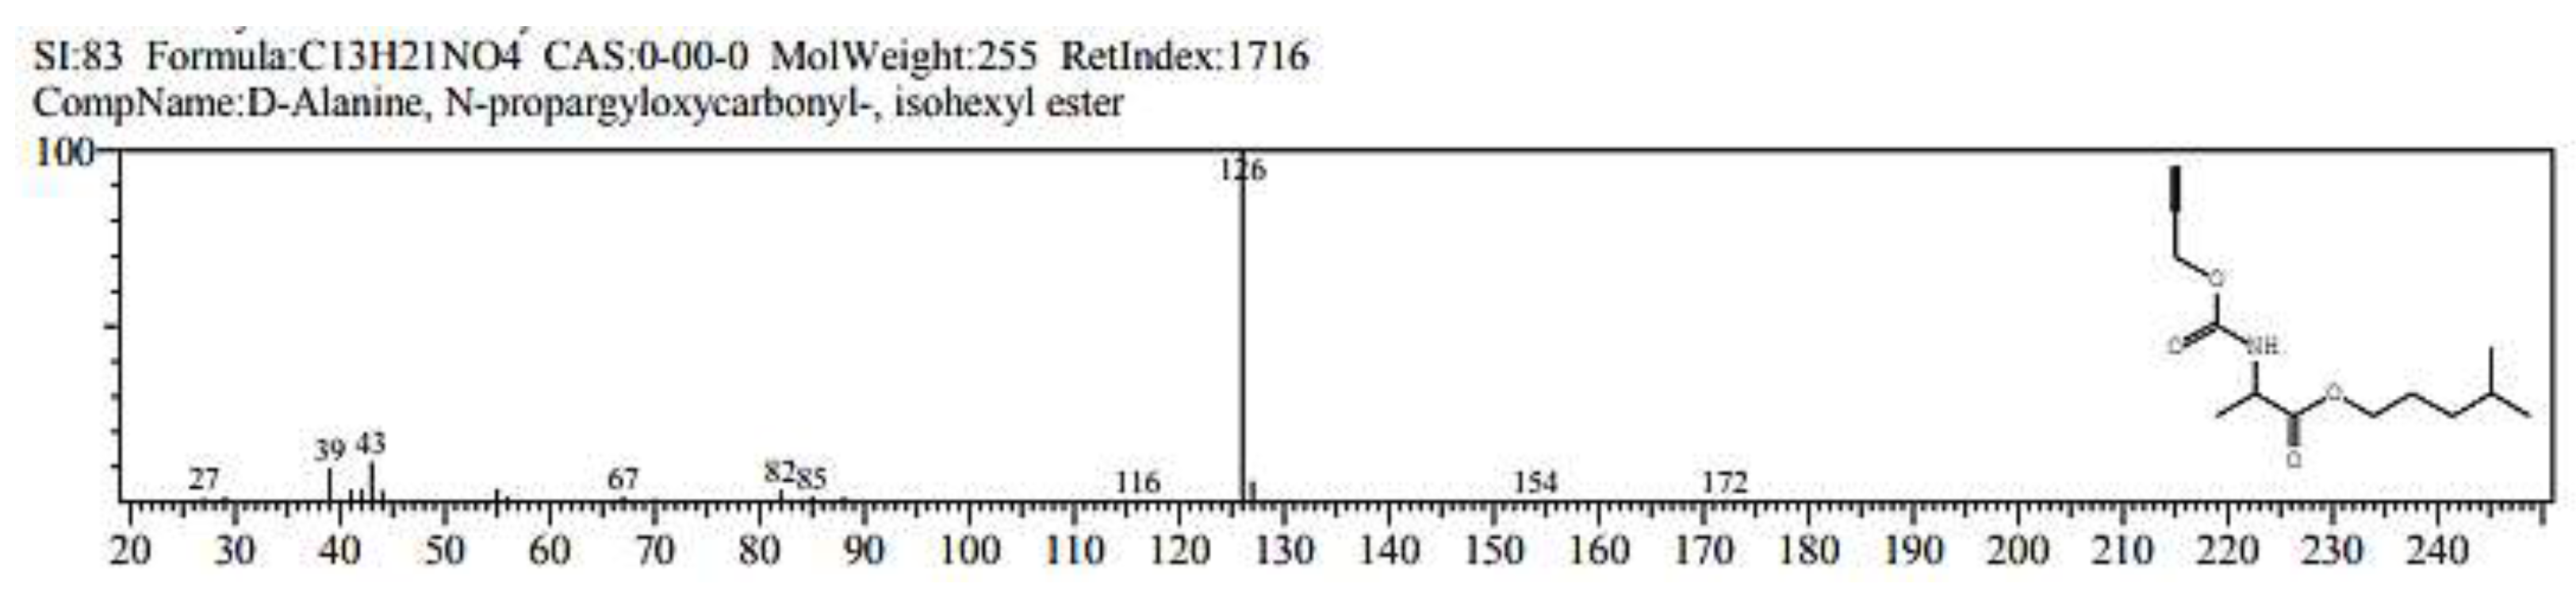
Figure 7.
Chromatographic profile and chemical structure of identified compound 6 (Benzoic acid)..
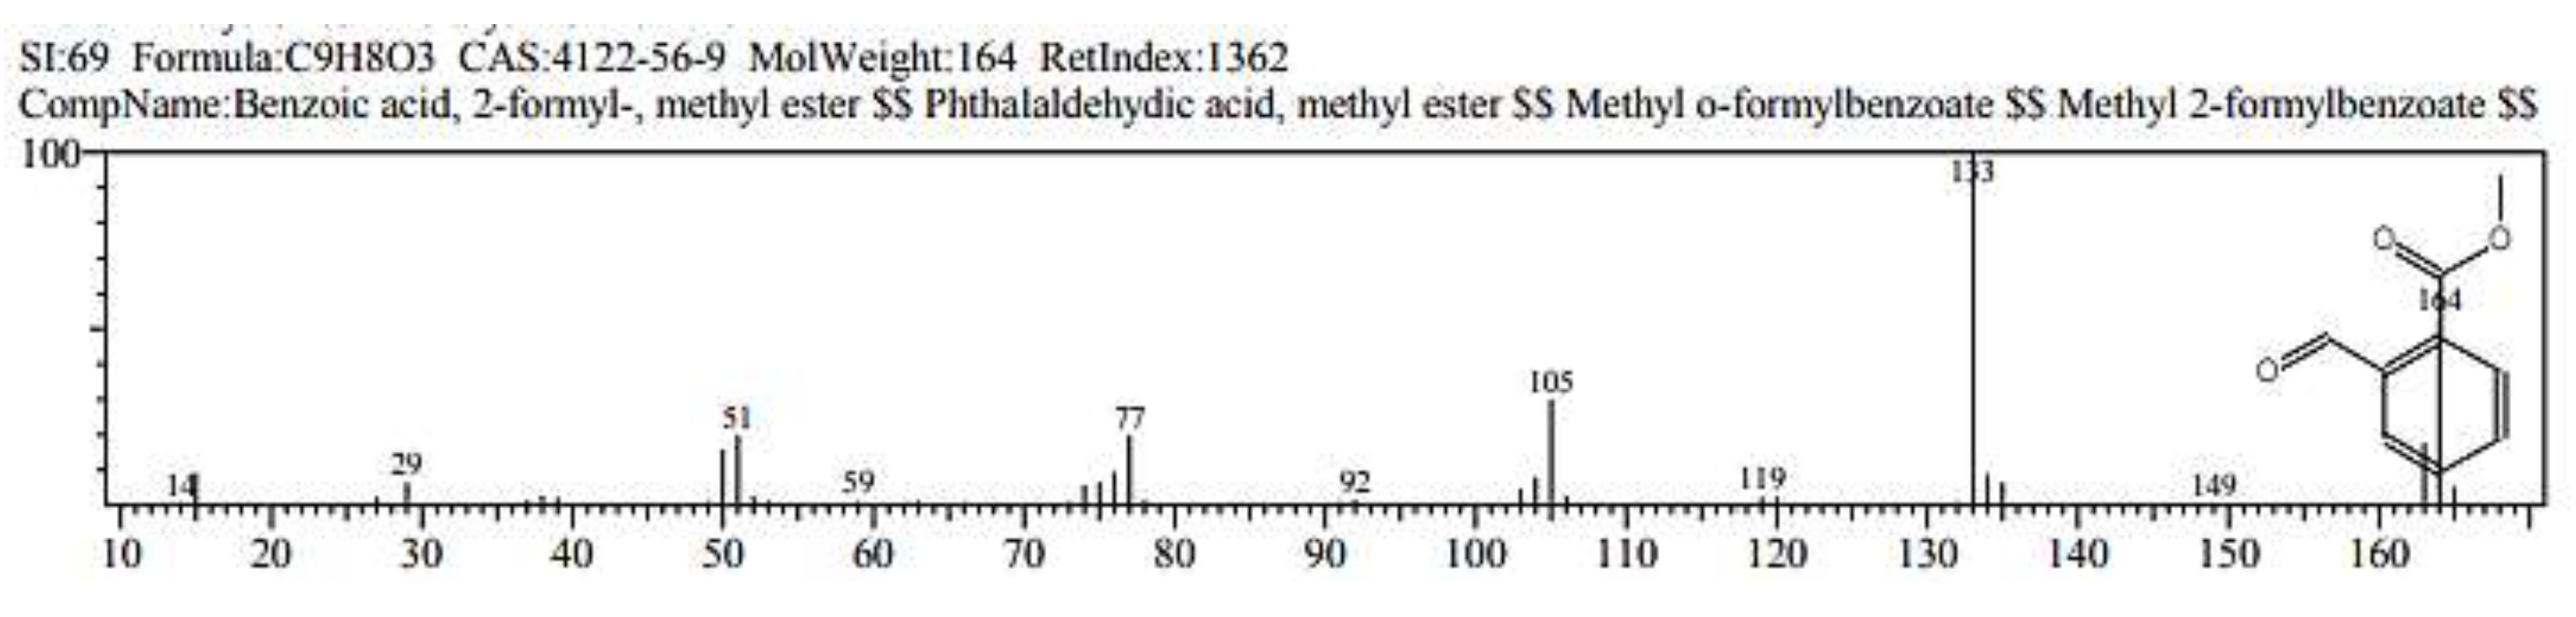
Figure 8.
Chromatographic profile and chemical structure of identified compound 7 (Phthalic acid).
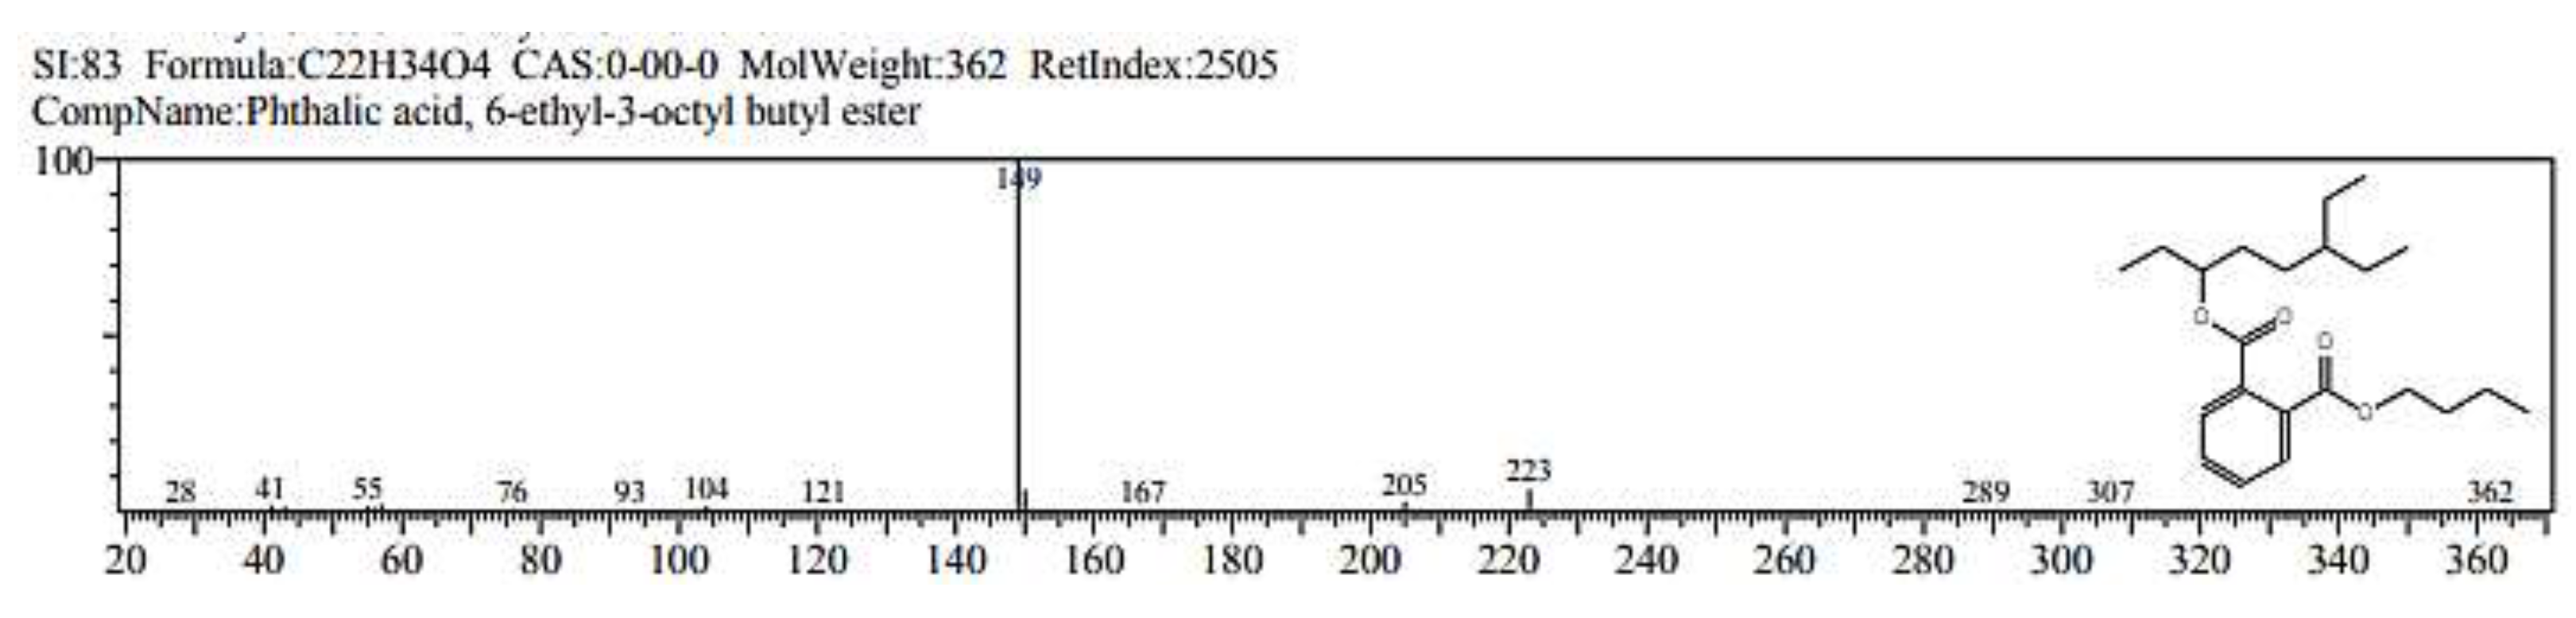
Figure 9.
Chromatographic profile and chemical structure of identified compound 8 (Citronellol).
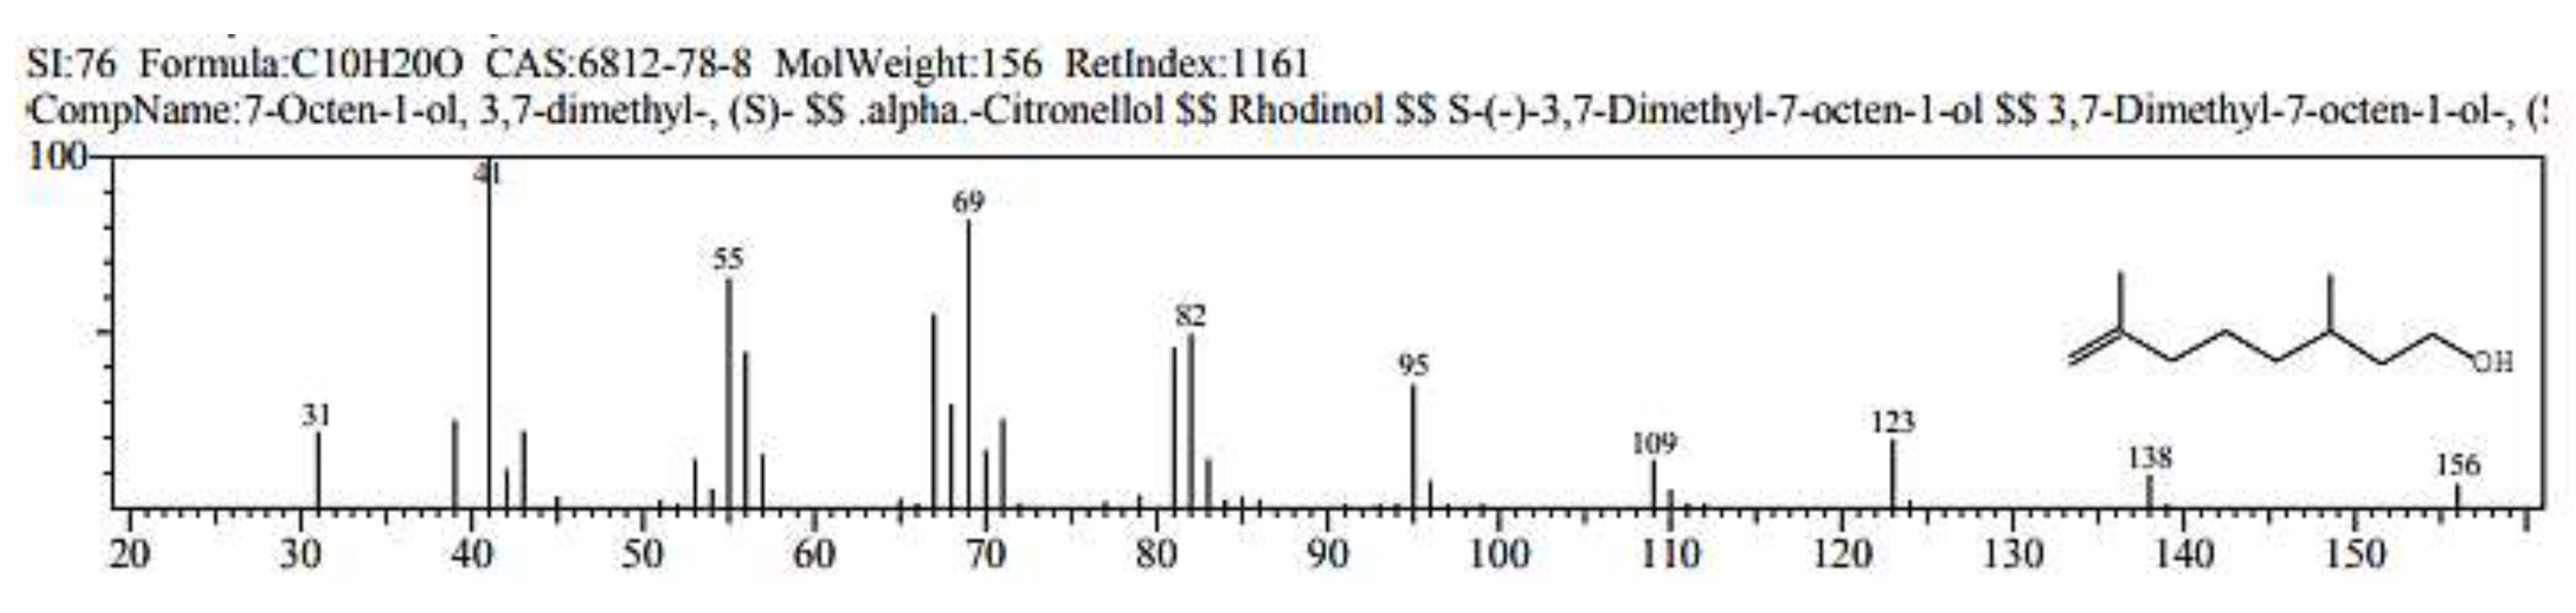
Figure 10.
Chromatographic profile and chemical structure of identified compound 9 (Benzeneacetic acid). .
Figure 10.
Chromatographic profile and chemical structure of identified compound 9 (Benzeneacetic acid). .
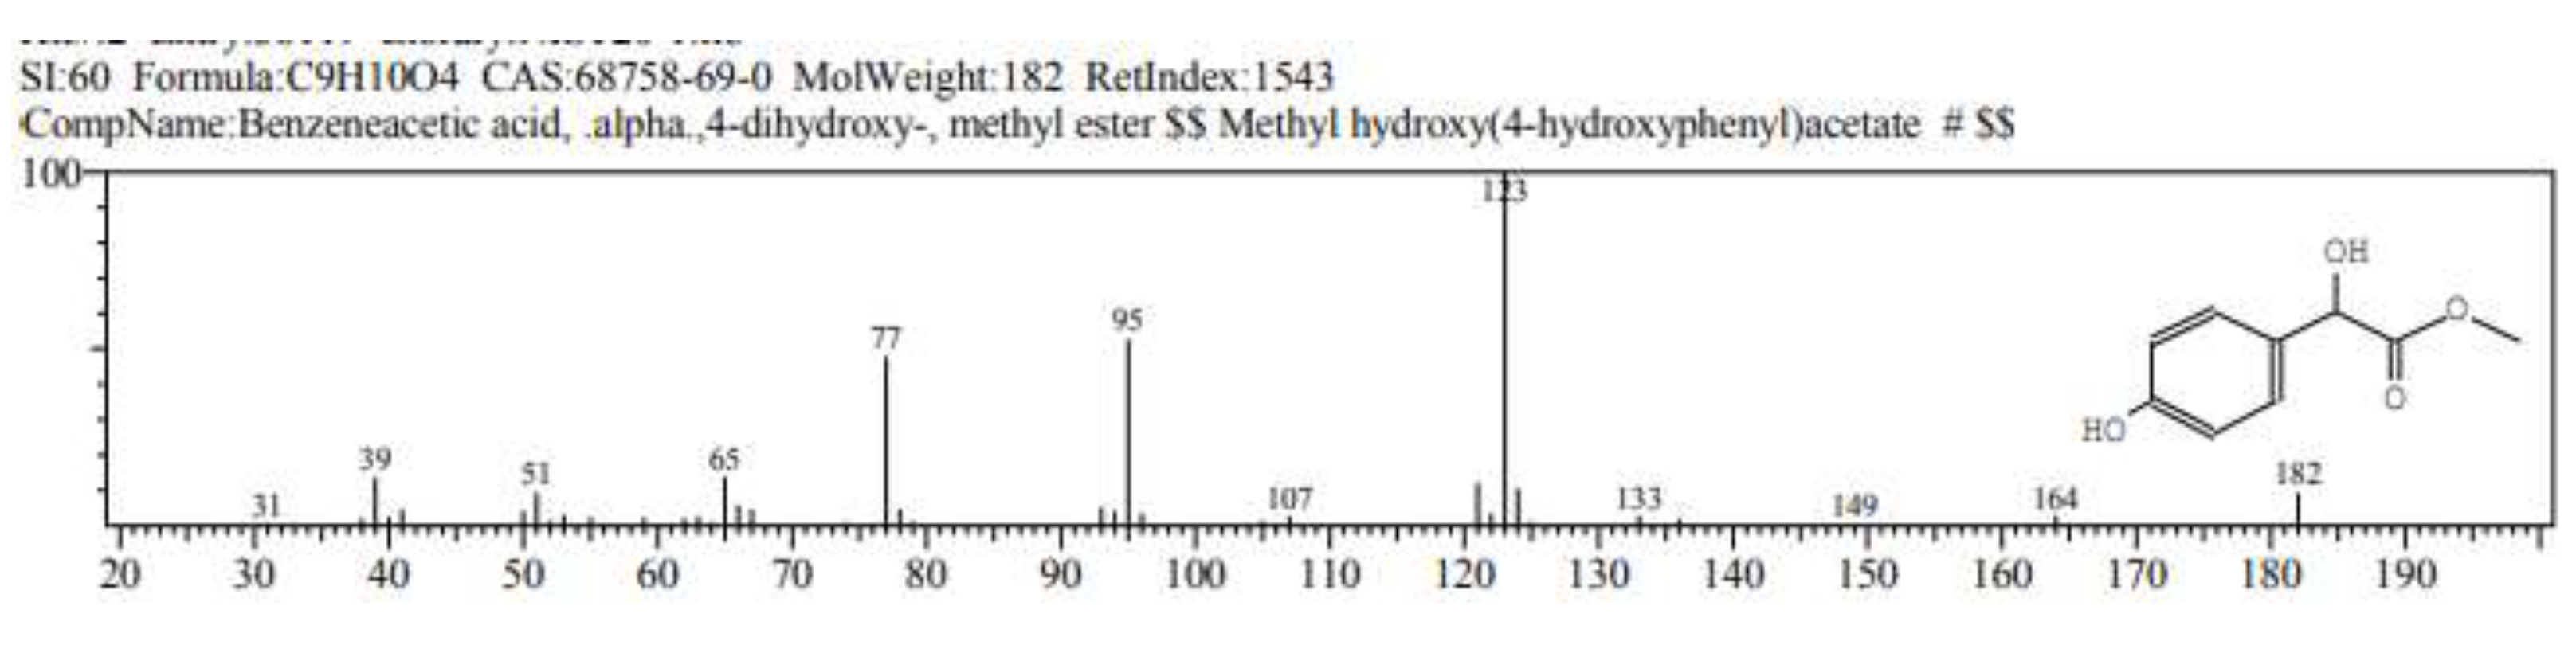
Figure 11.
Chromatographic profile and chemical structure of identified compound 10 (Urea). .
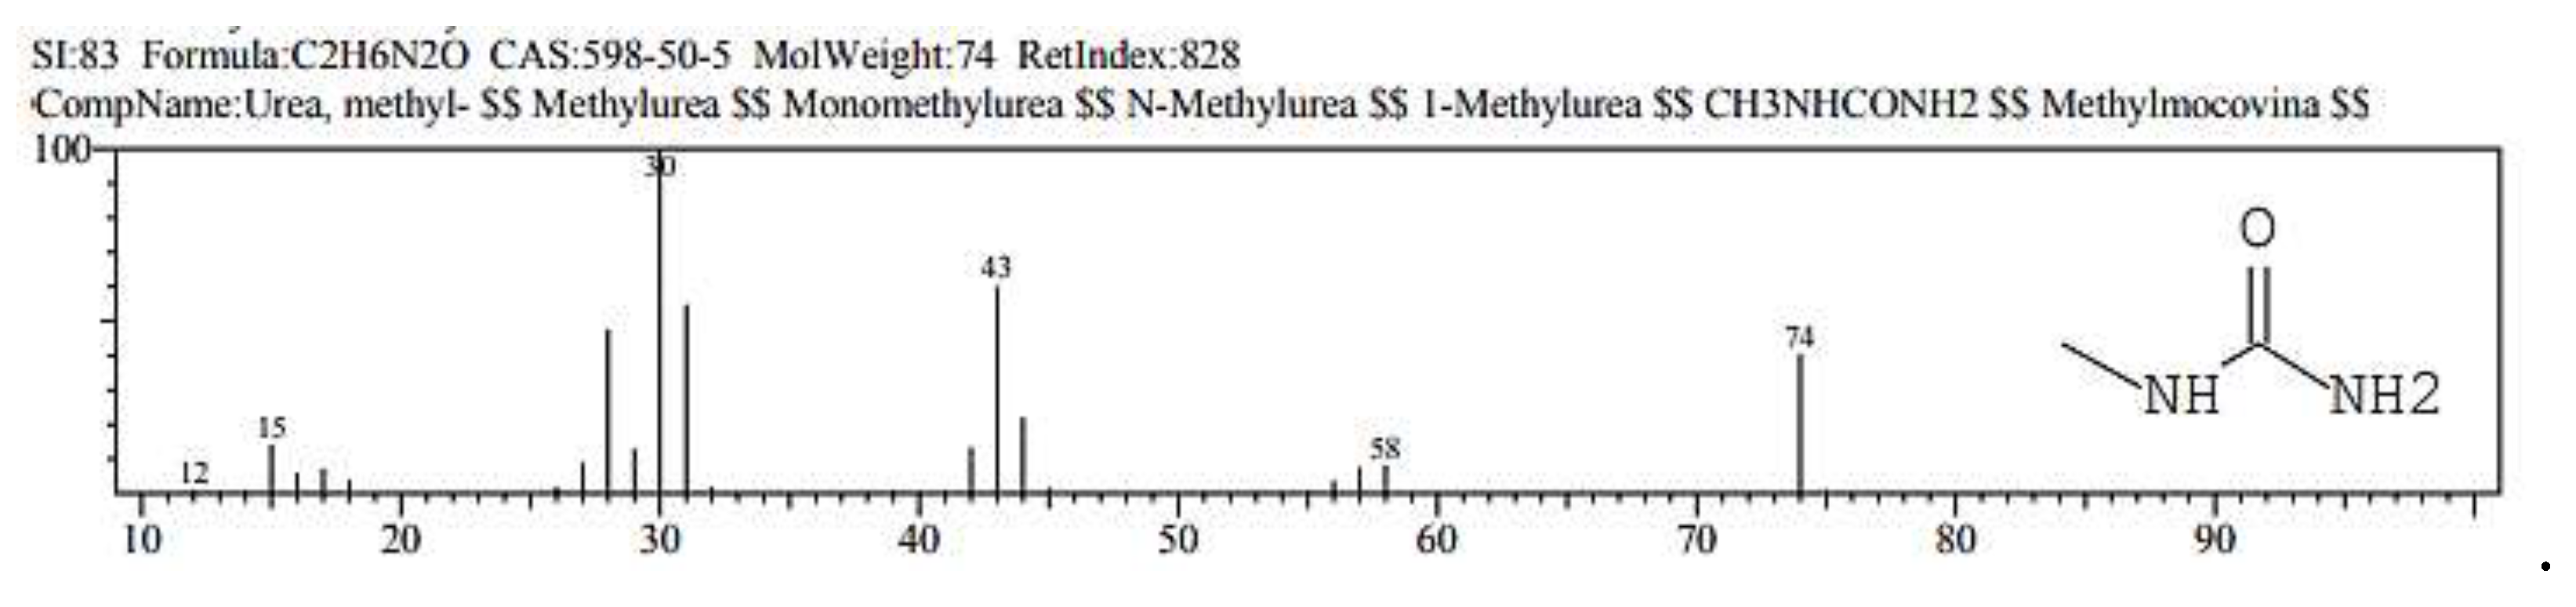
Figure 12.
Olea europaea leaves extract effect on MCF-7 Cells. (a) Treated MCF-7 Cells. (b) Un-treated MCF-7. Images were captured using Olympus BX45 microscope without built-in scale calibration. Scale bars are not available due to equipment limitations at the time of capture.
Figure 12.
Olea europaea leaves extract effect on MCF-7 Cells. (a) Treated MCF-7 Cells. (b) Un-treated MCF-7. Images were captured using Olympus BX45 microscope without built-in scale calibration. Scale bars are not available due to equipment limitations at the time of capture.
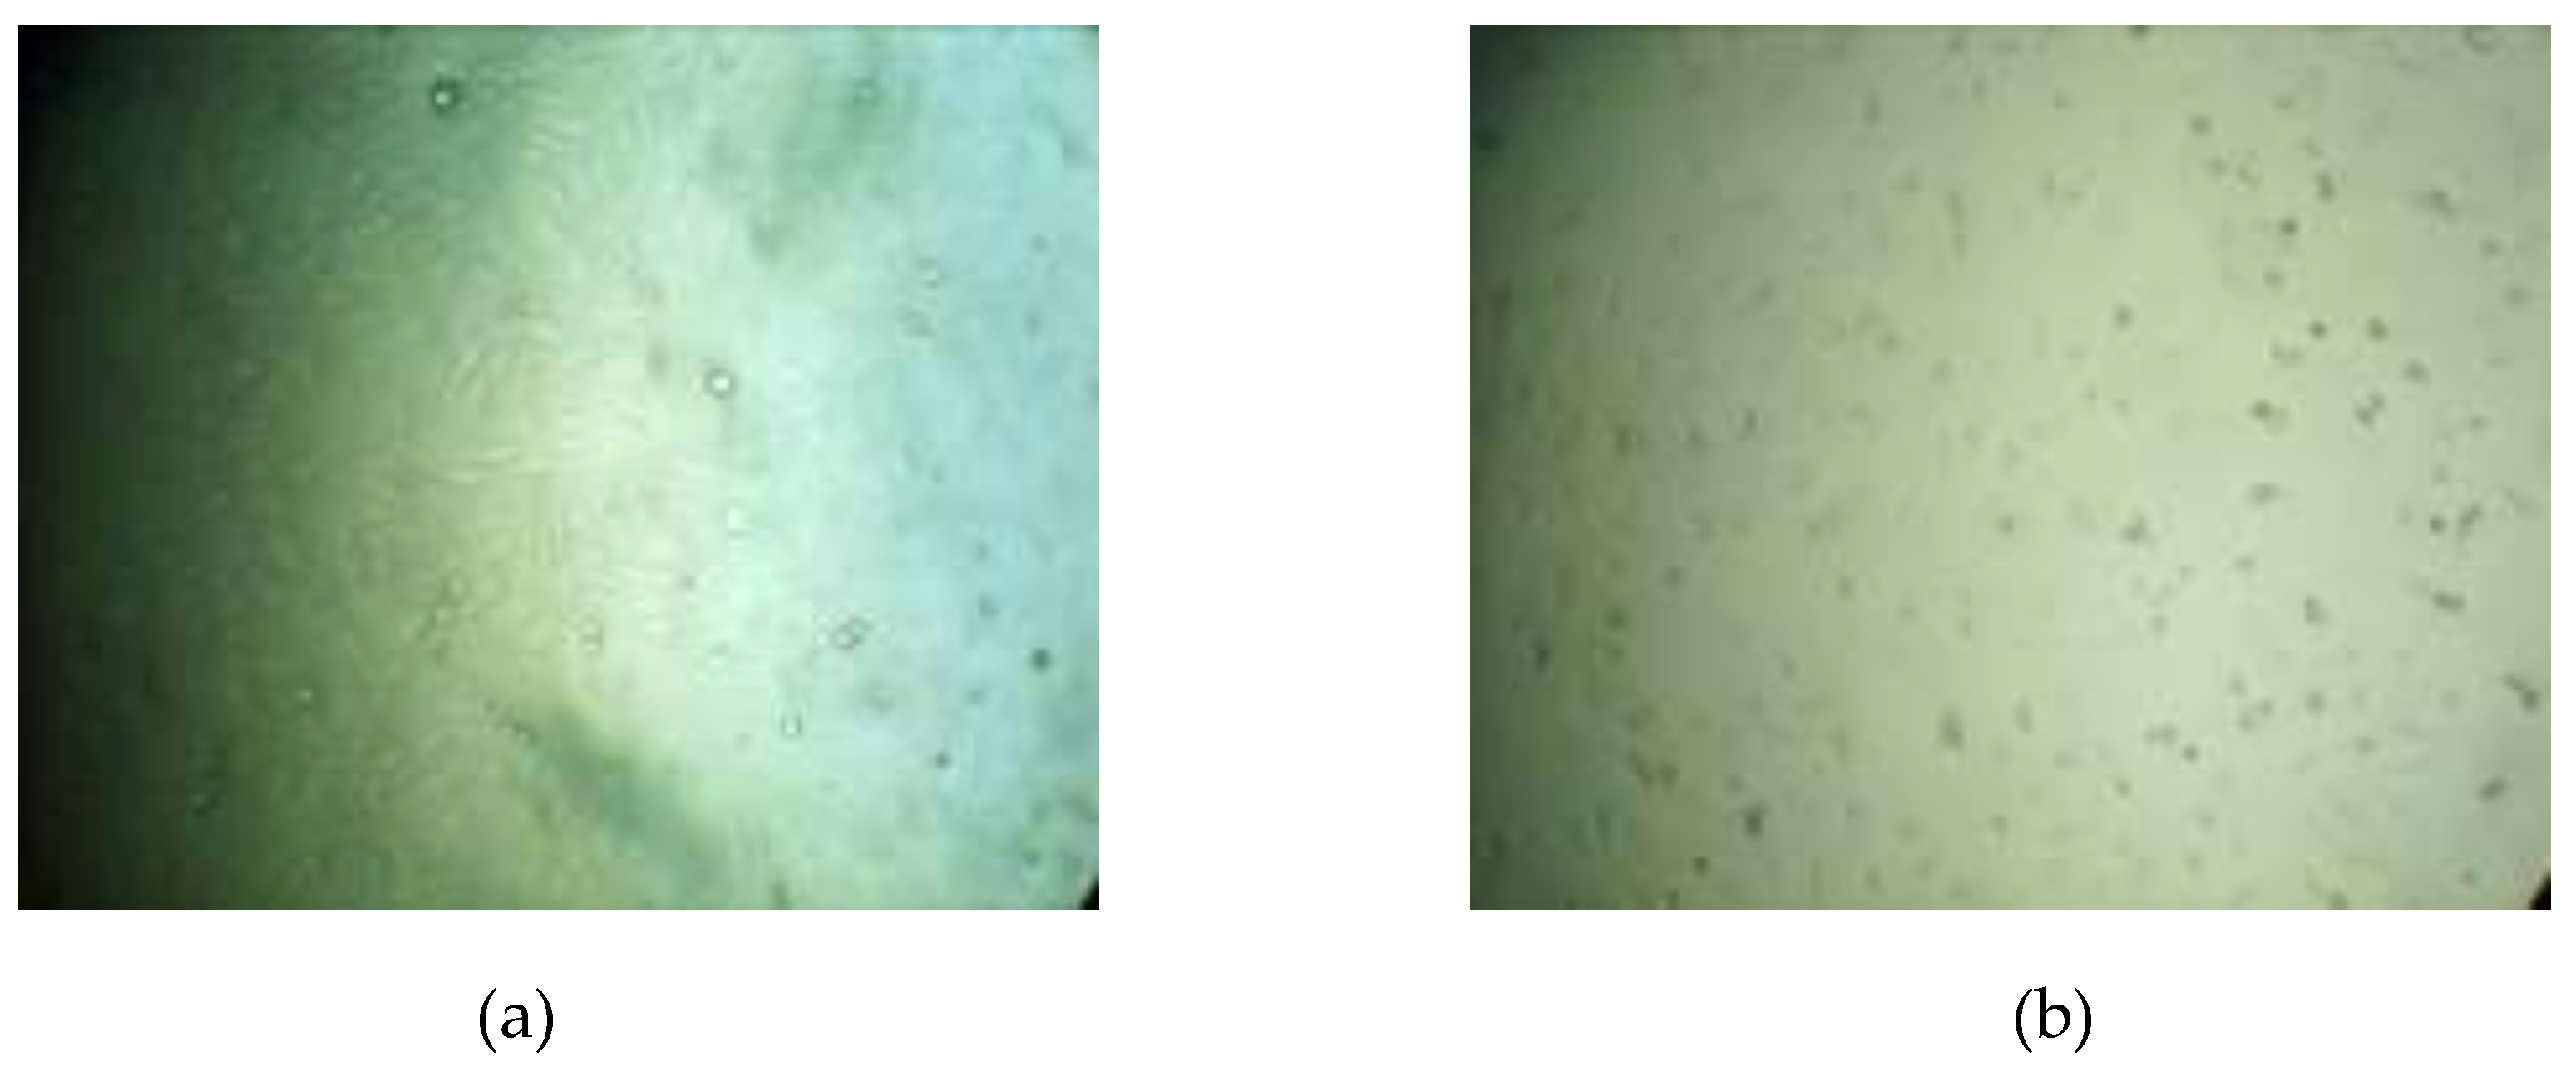
Figure 13.
The inhibitory curve of Olea europaea effect on cell viability. The x-axis is the concentration of the extract (µg/mL), while the y-axis demonstrates the cytotoxicity percentage.
Figure 13.
The inhibitory curve of Olea europaea effect on cell viability. The x-axis is the concentration of the extract (µg/mL), while the y-axis demonstrates the cytotoxicity percentage.
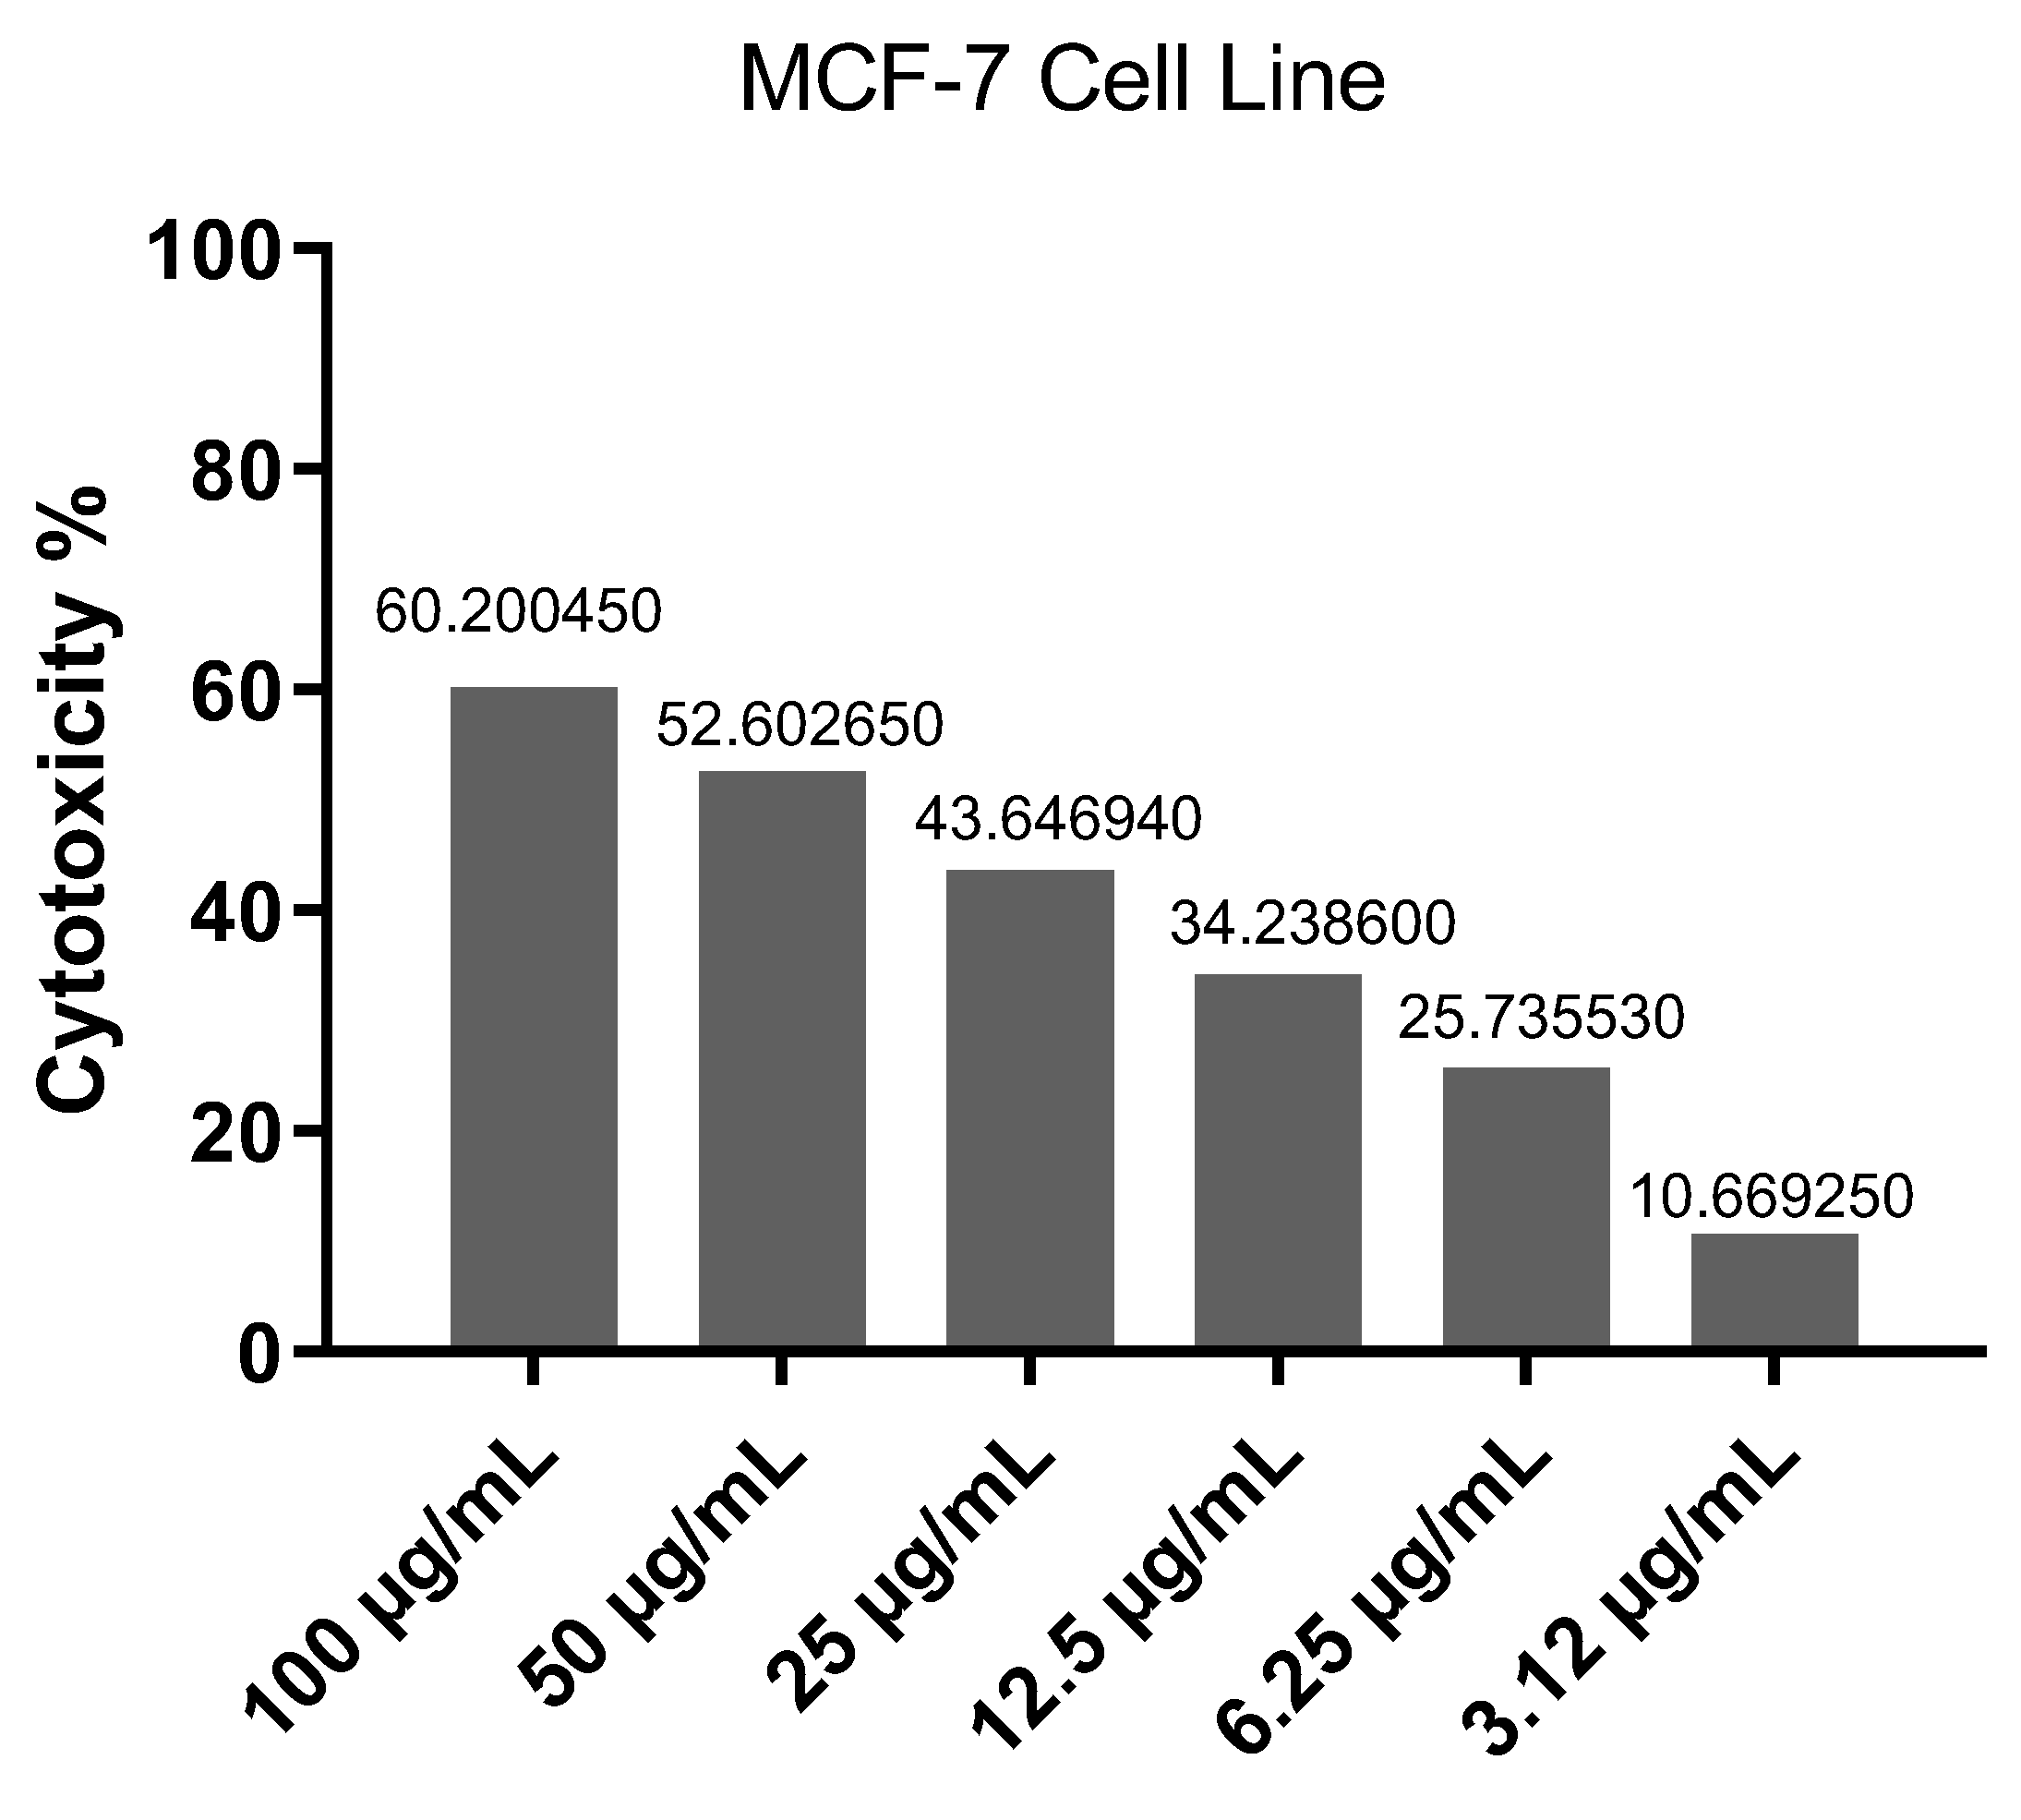
Figure 14.
IC50 effect of Olea europaea on cell viability. The concentration of the plant extract (µg/mL) is presented on the x-axis while the cell inhibition percentage is presented on the y-axis. The IC50 value is expressed in µg/mL.
Figure 14.
IC50 effect of Olea europaea on cell viability. The concentration of the plant extract (µg/mL) is presented on the x-axis while the cell inhibition percentage is presented on the y-axis. The IC50 value is expressed in µg/mL.
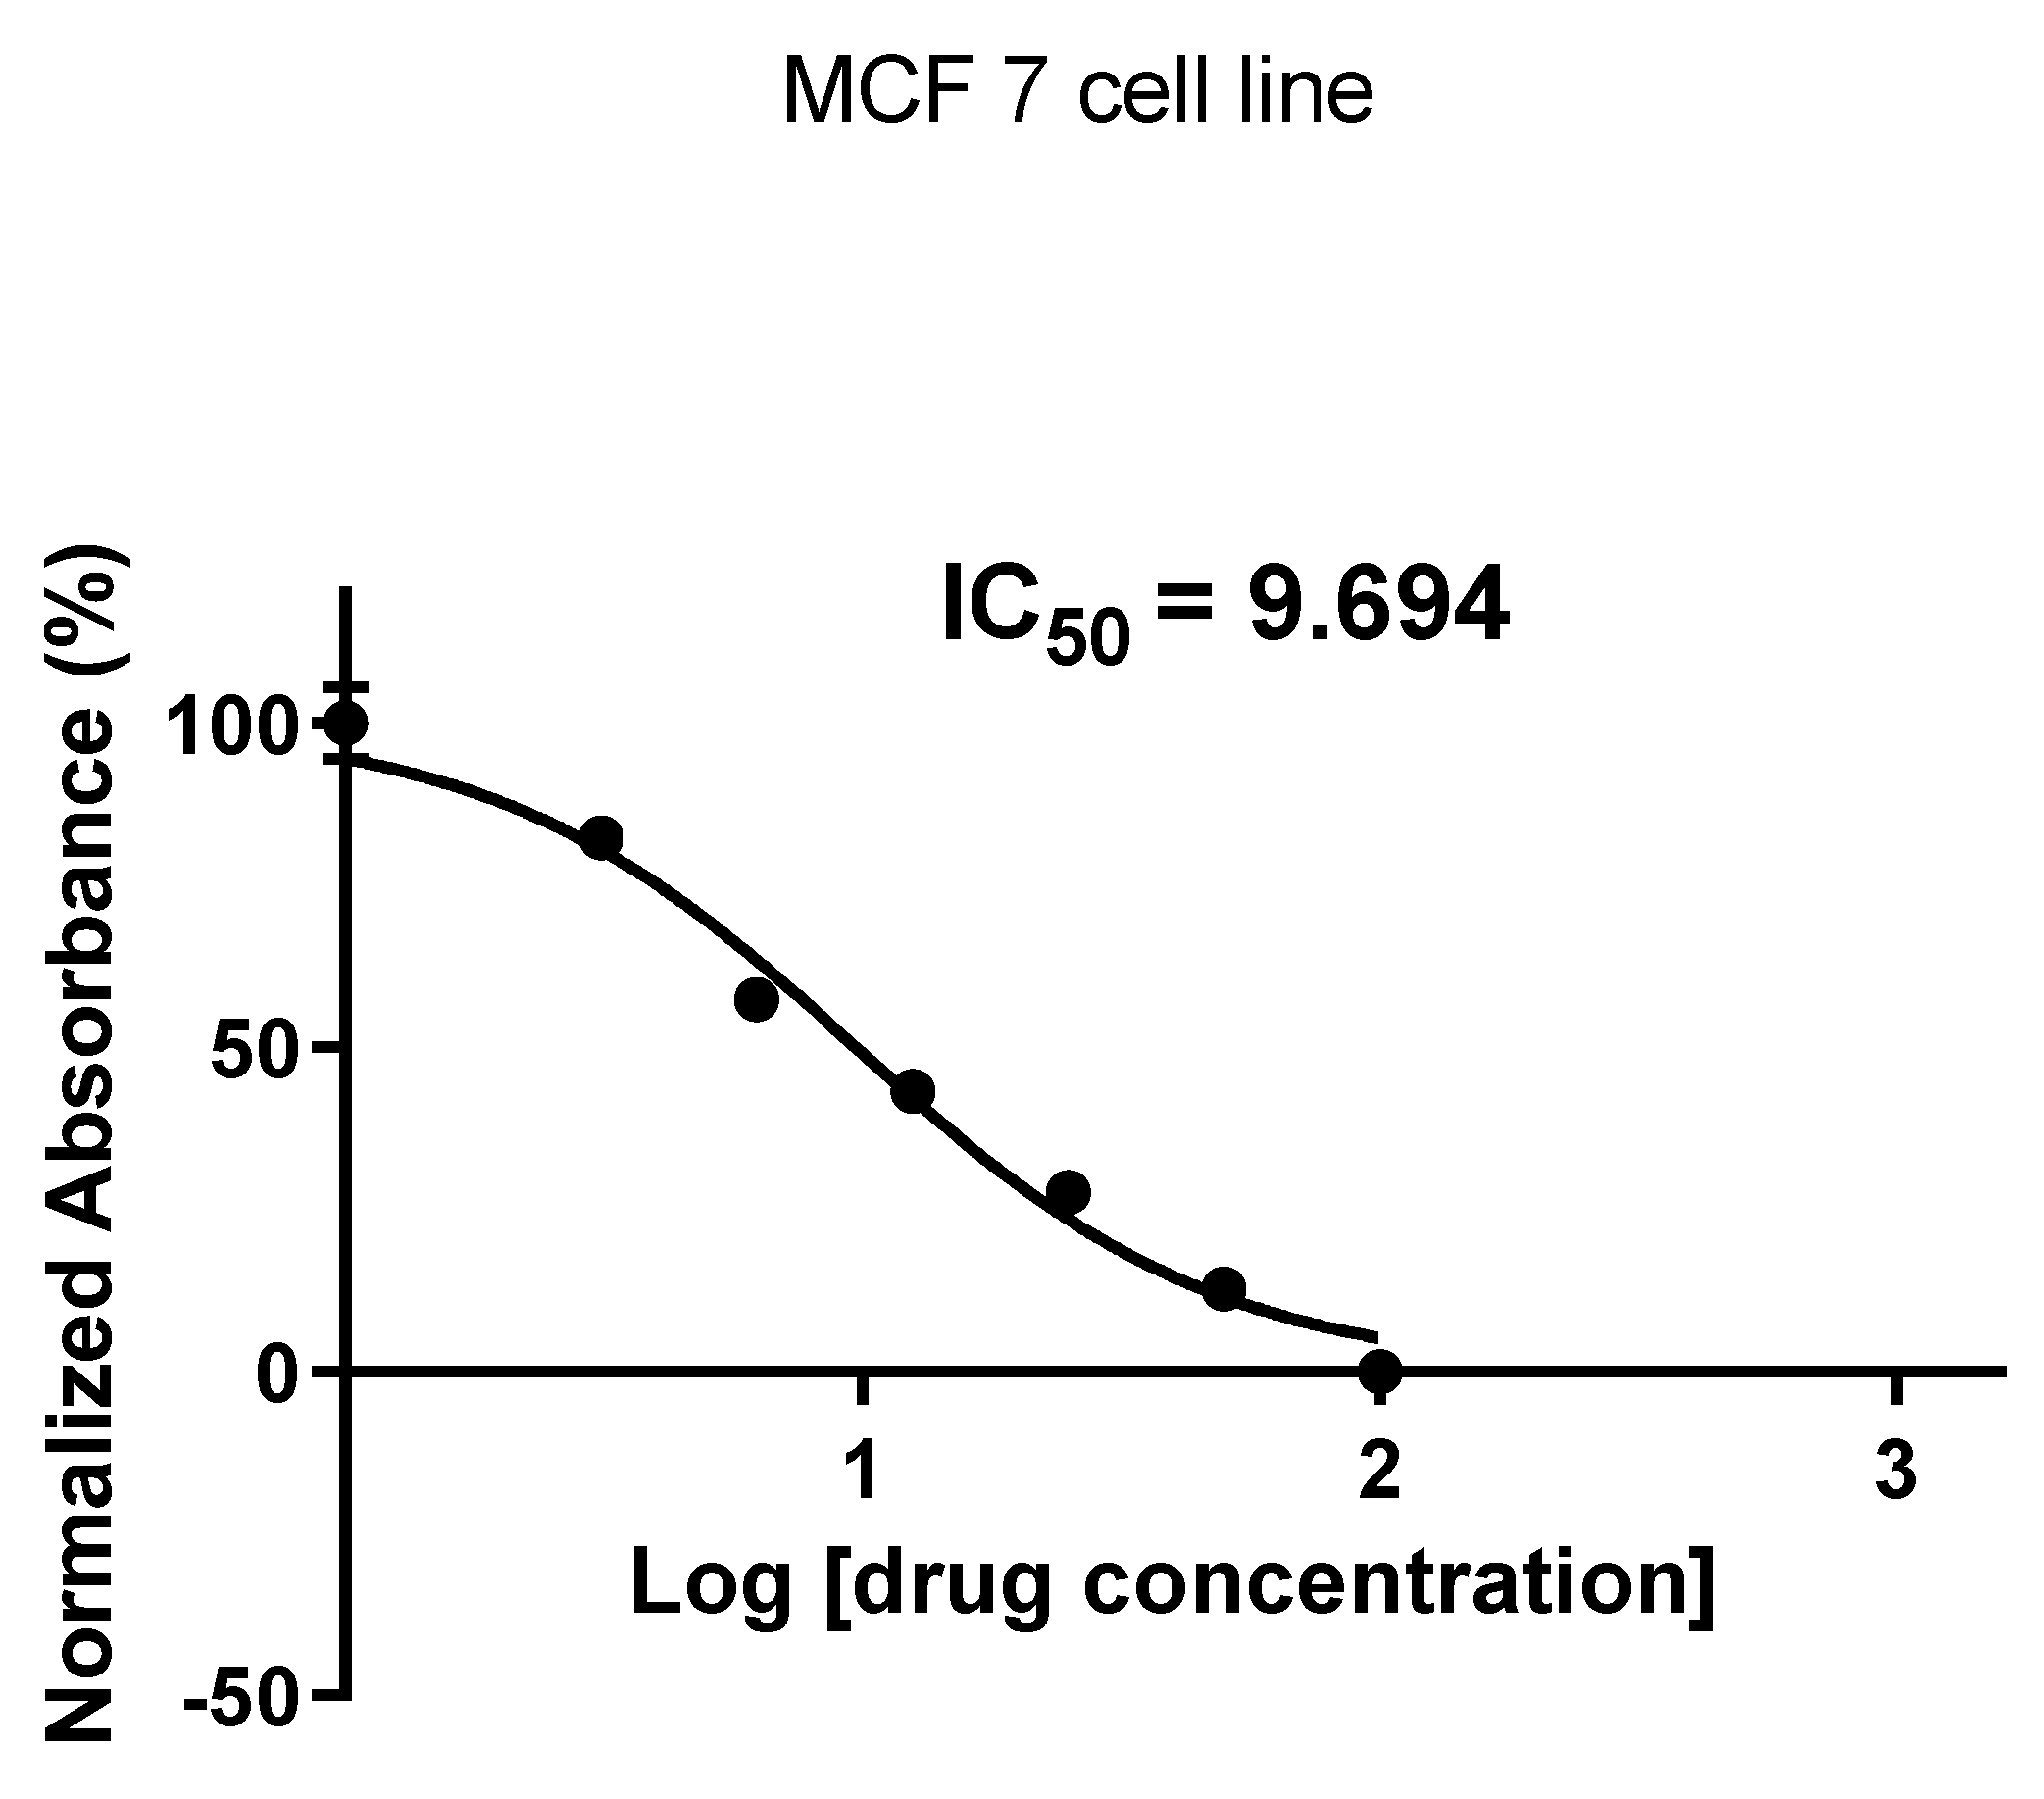
Figure 15.
Optical density curve for cells treated with the extract of Olea europaea leave. Various extract solution concentrations are presented on the x-axis while the y-axis represents the optical density value at 492 nm. Each data point represents the mean ± standard deviation of triplicates. **** indicates p < 0.0001; ** indicates p < 0.01.
Disclaimer/Publisher’s Note: The statements, opinions and data contained in all publications are solely those of the individual author(s) and contributor(s) and not of MDPI and/or the editor(s). MDPI and/or the editor(s) disclaim responsibility for any injury to people or property resulting from any ideas, methods, instructions or products referred to in the content. |
© 2026 by the authors. Licensee MDPI, Basel, Switzerland. This article is an open access article distributed under the terms and conditions of the Creative Commons Attribution (CC BY) license (http://creativecommons.org/licenses/by/4.0/).
Copyright: This open access article is published under a Creative Commons CC BY 4.0 license, which permit the free download, distribution, and reuse, provided that the author and preprint are cited in any reuse.


