Submitted:
05 February 2026
Posted:
20 February 2026
You are already at the latest version
Abstract
Objective: The relationship between social demographic factors and biomarker expression is less studied. Methods: We have reviewed 645 endometrial carcinomas with demographic information including race/ethnicity, marital status, religious belief, body mass index (BMI), and pathology staging as well as DNA mismatch repair enzyme expression (MMR) status. Statistical analysis was performed by using various programs in R-package. Results: A total of 645 hysterectomy specimens of endometrial carcinoma, including 463 low grade carcinomas (72%) and 182 high grade carcinomas (28%) were reviewed. Race/ethnicity and marital status were found significantly associated with patient’s age (p<0.01), BMI/obesity (p<0.01) and religious belief (p<0.01). Patients’ marital status was also significantly associated with tumor grade (p=0.01). MMR deficiency was statistically associated with patients’ age (p<0.01) and marital status (p=0.02) in overall endometrial carcinoma. MMR deficiency was also significantly associated with tumor grade (p<0.01), nodal metastasis (p<0.01), and FIGO stages (p<0.01) in low grade endometrial carcinoma but not in high grade endometrial carcinoma. Conclusion: Social demographic factors appear not only as risk factors for pathogenesis but also affect the tumor pathology grade, MMR expression status, clinical stages, nodal metastasis and ultimately treatment and prognosis. These correlative data also provide preliminary and incremental basis for more rigorous prospective study for MMR expression in endometrial carcinoma.
Keywords:
endometrial carcinoma
; mismatch repair enzyme status
; sociodemographic factors
; MLH1 methylation
; epigenetics
Introduction
Endometrial carcinoma is the most common gynecological malignancy. Endometrial carcinoma has been traditionally classified as type 1 and type 2 carcinomas based on the broad pathogenic mechanisms [1]. Type 1 endometrial carcinoma is low grade with indolent clinical courses, hormonal dependence, and it related to social, environmental and metabolic factors in pathogenesis. Histologically type 1 endometrial carcinoma is low grade endometrioid adenocarcinoma encompassing FIGO grade 1 and FIGO grade 2. Type 2 endometrial carcinoma is high grade with aggressive clinical courses and independent of environmental, hormonal and metabolic influences, and its pathogenesis is related more to genetic/genomic abnormalities [1]. Type 2 endometrial carcinoma exhibits broad histological spectrum including high grade endometrioid adenocarcinoma (FIGO grade 3), serous carcinoma, clear cell carcinoma and mixed histologic types with high grade carcinoma components. Increasing effort was made to classify the endometrial carcinoma using molecular tools, and molecular classification of endometrioid carcinoma appears to predict tumor behavior and prognosis more accurately [2,3,4].
Social demographic factors can affect human health and disease in general [5,6]. It is known that these social factors not only exert a wide spectrum of influences on human health but also affect the wellbeing of pregnancy, pregnancy complications and newborns with significant pathological and molecular changes in placentas [7,8,9]. The influence of these social factors on endometrial carcinoma has been extensively studied, especially on type 1 endometrial carcinoma, because these social factors including race/ethnicity, marital status, religious belief, body mass index can influence hormonal levels and endocrine function of patients with endometrial carcinoma [10,11,12,13]. Some of the social demographic factors are also known to be modifiable and many of these factors serve as proxies of patients’ nutritional status/obesity, access to health care, psychological/social and emotional health (anxiety/depression)[12,14]. However, the relationship between these social factors and specific biomarker expressions in tumors is less examined. DNA mismatch repair protein (MMRP) status in tumor cells is known to be therapeutically important for checkpoint inhibitors in many cancer types and MMRP deficient tumors are known to be sensitive to anti-PD-1 therapeutics [15,16,17]. Screening for MMRP expression in endometrial carcinoma has become standard practice not only for therapeutic purposes but also for molecular and pathological classification of endometrioid carcinoma [17,18,19,20]. We have retrospectively reviewed the hysterectomy specimens in a single institution and examined the relationship between these social determinants of health and tumor stages, lymph node status, clinical stages and MMRP status, and our data provide important link of social demographic factors to specific biomarker status in endometrial carcinoma.
Materials and Methods
The retrospective study is exempt from institutional review board approval according to section 46.101(b) of 45CFR 46, which states that research involving the study of existing pathologic and diagnostic specimens in such a manner that subjects cannot be identified is exempt from the Department of Health and Human Services Protection of Human Research Subjects. It was performed in accordance with STROBE guideline in reporting for cohort study. Hysterectomy specimens for neoplasia were searched in the medical record from 2018 to November 2023 and included in the study using the routine hematoxylin-eosin (H&E) stain. The clinical patients’ information including demographics was self-reported into the existing electronic medical records for medical purposes, and these data were obtained by reviewing the medical records and entered in Excel spreadsheet, together with pathologic staging information including tumor type, histology, lymph node status, pelvic washing cytology status. Only uterine epithelial neoplasms (endometrial carcinomas) were included in the study and uterine mesenchymal tumors (sarcomas) were excluded. The patients’ racial/ethnic data were retrieved from the medical record as self-reported according to the Center for Medicare and Medicaid Services (CMS) criteria as Asian, non-Hispanic Black, Hispanic, and non-Hispanic White. The racial/ethnic data also included “unknown”, “others”, or “declined” as one group without further information. No racial/ethnic subclassification information was available. Marital status was also retrieved from the medical record as Married, Single, Divorced/separated, and Widowed. Religious belief was recorded in binary fashion as “Yes” or “No”, and no specific religious type was used for analysis. The patients’ body mass index (BMI) was retrieved from the medical record. Statistical analysis was performed by using various programs of R-Package including baseline characteristic table and multi-variant ANOVA tests (http://statistics4everyone.blogspot.com/2018/01/fathers-data-visualization.html).
Surgical staging including sentinel lymph node biopsies were performed as standard practice at our institution for endometrial carcinoma, and sentinel lymph node workup included level sectioning and immunostaining for pancytokeratin (AE1/AE3) in all lymph node sections [21]. Immunostaining for AE1/AE3 was performed by using Ventana Benchmark ultra (Roche Corporation). Immunostaining for DNA mismatch repair proteins including MLH1, MSH2, MSH6 and PMS2 was performed by using Ventana Benchmark Ultra instrument (Roche Corporation). Positive nodal metastasis was recorded including sentinel lymph nodes positive only for immunostaining for AE1/AE3 (isolated tumor cells). Pathology reporting of tumors was performed as standard practice by using software of standard synoptic format from College of American Pathologists (CAP) updated and maintained by CAP. FIGO staging system was from FIGO stage 2009, and new FIGO staging of 2023 or molecular classification were not included in the data.
Results:
1, Social demographic factors in endometrial carcinoma:
A total 905 hysterectomy specimens were reviewed from January 2018 to November 2023 including 645 endometrial carcinomas and 463 of which were low grade endometrial carcinoma (FIGO grade 1 and 2, type 1 carcinoma) and 182 high grade endometrial carcinomas (FIGO grade 3, serous carcinoma, clear cell carcinomas and mixed type high grade carcinoma, type 2 carcinoma). There were 99 Asian patients (15.3%), 21 non-Hispanic Black patients (3.2%), 129 Hispanic patients (20%), 343 White patients (53.2%) and 53 patients identified as “Others” (8.2%) (Table 1). There were statistically significant differences in BMI (p<0.01), obesity classes (p<0.01), religious belief (p<0.01) and patient ages (p<0.01) among different racial/ethnic groups of patients (Figure 1). BMI was significantly higher in ethnic black patients and lower i Asian patients (Figure 1). The racial/ethnic White patients were significantly older than those of other racial/ethnic groups (p<0.01), and this may be due to the demographics and population structure in the area. There was no statistically significant difference between the race/ethnicity and marital status of patients (p=0.13) (Table 1). There was no significant difference between tumor pathology/histology, tumor stage or nodal metastasis and patients’ race/ethnicity (Table 1).
Marital status of patients was not only statistically significantly associated with patients’ religious belief (p=0.03), patients’ BMI/obesity (p<0.01) and patients’ age (p<0.01), but also the tumor pathology grade (p=0.01) (Table 2), and MMRP status (p=0.02) (see section 3 below). High grade endometrial carcinoma was seen significantly more common in Single and Widowed patients, and low grade carcinoma was significantly more in Married patients (Table 2). Pre-operative BMI/obesity was statistically associated with patients’ race/ethnicity (p<0.01), marital status (p<0.01), patients’ age (p<0.01), tumor pathology grade (p<0.01) and marginally associated with nodal metastatic status (p=0.05) (Table 3). BMI was significantly higher in Single patients and lower in widowed patients (Figure 1).
2, Low grade and high grade endometrial carcinoma:
The entire cohort of endometrial carcinoma was divided as low grade (n=463)(71.8%) and high grade endometrial carcinoma (n=182)(28.2%) based on the guideline of College of American Pathologists (CAP). There were statistically significant differences in marital status of patients with low grade and those with high grade endometrial carcinomas (Table 4) (p=0.01). There was significantly higher rate of high grade endometrial carcinoma in the single and widowed groups of patients, and higher rate of low grade carcinoma in the married patients (p=0.01). Patients’ BMI and obesity were statistically associated with low grade carcinoma (p<0.01), as expected and previously described [1,12,22]. High grade carcinoma was statistically associated with higher tumor stages, higher rates of nodal metastasis and distant metastasis and FIGO stages (p<0.01 for all) as expected (Table 4).
3, MMRP status and endometrial carcinoma:
A total 464 hysterectomy specimens with MMRP status were available for our study, and 107 specimens demonstrated MMRP deficiency by immunohistochemical staining (23%), and 7 were suspected of Lynch syndrome with aberrant expression of MMRP proteins (1.5%), similar to those described previously [23,24]. Totally 82 of these MMRP deficient tumors were tested for MLH1 gene promoter hypermethylation by the reference lab, and all of these tumors except for 1 case were found to be hypermethylated at MLH1 gene promoter (81 cases positive, 98.7%, excluding the 7 cases of Lynch syndrome). Only 1 case was found to be MMRP deficient by immunohistochemistry but no hypermethylation of MLH1 promoter. No additional NGS sequencing was performed on all the MMRP deficient tumor samples. Totally 25 cases were not submitted for MLH1 gene promoter hypermethylation tests including 7 cases of suspected Lynch syndrome. MMRP deficiency was statistically associated with older patient age (p<0.01), marital status (p=0.02) and of marginal significance with nodal metastasis (p=0.05) (Table 5) (Figure 2). When low grade endometrial carcinoma was separated from high grade carcinoma, MMRP deficiency was significantly associated with higher tumor pathology grade (FIGO grade 2 versus FIGO grade 1) (p<0.01), higher percentage of nodal metastasis (p<0.01), higher FIGO stages (p=0.02) (Table 5). The distribution of MMRP status of endometrial carcinoma and histologic tumor grade was shown in Figure 2. In addition, MMRP deficiency was found statistically higher in divorced patients (p=0.02) (Table 5). There was no association between MMRP status and race/ethnicity, patients’ BMI/obesity. There was no significant association between religious belief and tumor pathology, clinical stages, and other patients’ social determinants (data not shown). Multivariate linear regression analysis (Logistic regression model) revealed the disappearance of any association between these social demographic factors and MMRP status except for the patient’s age and the widowed patients (Table 6), indicating more complex social/biological process with confounding factors. The statistically significant association between the patients’ age and MMRP deficiency may be due to the demographics and population structure in the area as previously mentioned.
Low grade endometrial carcinomas were examined separately using the same social determinants of health described above and pathological staging information, and similar results/trends were observed to those described above in overall endometrial carcinoma (data not shown)
Discussion:
Summary of Main Results:
Our hysterectomy data of endometrial carcinoma from a single institution demonstrated statistically significant association between race/ethnicity and other social demographic factors and tumor histopathology, nodal metastasis and FIGO tumor stages, although most of these associations disappeared after multivariate regression analyses. Racial/ethnic disparity of endometrial carcinoma has been demonstrated previously in mortality and outcomes in large studies, although quality of the race/ethnicity reporting in endometrial carcinoma was controversial [25,26,27,28,29]. Our hysterectomy data is more related to incidence and presentation of endometrial carcinoma among various racial/ethnic groups. Our data show significant differences in tumor stages and nodal metastasis among groups with different marital status and different BMI. These social demographic factors become increasingly important in cancer care and correlate with various biological processes through non-genomic (non-hereditary) molecular mechanisms.
Results in the Context of Published Literature:
Routine testing of MMRP status in colon cancer for Lynch syndrome has been conducted over decades and routine testing MMRP in endometrial carcinoma has been standard practice in recent years recommended by CAP [16,30,31]. A large majority of endometrial carcinoma with MMRP deficiency is due to MLH1 gene promoter hypermethylation and only small percentage of MMRP deficiency is suspected due to hereditary Lynch syndrome in our data, similar to those described for colonic carcinoma [32]. Our data showed that marital status of patients with endometrial carcinoma was significantly associated with MMRP deficiency, and the divorced patients showed the highest percentage of tumor MMRP deficiency among all groups of patients. MMRP deficiency was associated with higher tumor pathology grade, high rate of nodal metastasis, and higher FIGO stages. These results were only seen in low grade endometrial carcinoma (FIGO grade 1-2). These data illustrated the importance of marital status in not only social emotional/psychological wellbeing but also the biological behavior of the tumors, which in turn influences the patients’ treatment and prognosis. The link between the social demographic factors and the molecular mechanisms of pathogenesis of MMRP deficiency was previously shown to be through epigenetics such as DNA methylation (hypermethylation of MLH1 gene promoter) or modification [24,33,34,35] . New molecular classification of endometrial carcinoma emphasizes the prognostic importance of MMRP deficient tumor category with significant implication for treatment [33,36,37,38,39]. Complete molecular classification of endometrial carcinoma requires next generation DNA sequencing (NGS), to determine if the tumor is POLE mutant, and there is no alternative cost-effective diagnostic modality to date, although tumor infiltrating lymphocyte count was attempted as a proxy diagnostic tool for POLE mutations with moderate values [40]. Active research in endometrial carcinoma has been conducted in regard to the new molecular classification and prognosis as well as patients' management [41,42,43]. It is also important to note that absence of Pax2 gene expression in endometrium was diagnostic for atypical hyperplasia of endometrium/endometrioid intraepithelial neoplasia (EIN), and absence of Pax2 gene expression was mediated through gene promoter methylation [44,45,46].
Strength and Weakness:
Our data from a single institution in a large Metropolitan area with a diverse patient population showed the importance of race/ethnicity and social demographic factors in endometrial carcinoma in relation to tumor grades, tumor stages, and MMRP status. Some of these social demographic factors can be modified through a variety of societal measures to improve care and outcome of patients with endometrial carcinoma. The limitation is that our study is an epidemiological correlation survey without mechanistic results. Our data were self-reported and obtained from the existing medical record, and these data cannot be further classified to more granular levels. The social demographic data such as race/ethnicity and religious belief (faith) in medical records were rather broad without significant details. The race/ethnicity groups can be further divided for more detailed accurate assessment in prospective studies with specific design of racial/ethnic subclassification. It is also challenging to measure and quantify patients’ social wellbeing and emotional stress of marital status, and religious belief (faith). Prospective survey studies with more defined questionnaires will be needed for further evaluation on the effects of these social demographic factors on cancer care. Furthermore, the MMRP deficient tumor samples were not NGS sequenced, and although rare, MLH1 and/or PMS2 gene mutations leading to MMRP deficiency by IHC cannot be entirely excluded.
Implications for Practice:
Race/ethnicity and social demographic factors become increasingly important factors in patients risk assessment and these factors influence tumor stages and biological behaviors through epigenetic modification and ultimately affect treatments and prognosis of patients with endometrial carcinoma. Measuring social and emotional stress through biomarker testing will be a significant advance in care and management of patients with endometrial carcinoma.
Author Contributions
PZ has overall conceptualized the study, collected and analyzed the data, wrote the manuscript and supervised the study. AM, SM, CW, and OB reviewed the data and edited the manuscript. AC and MS helped collect the data and analysis. All authors reviewed and approved the manuscript.
Funding
No funding was received for the study.
Clinical trial number
Not applicable.
Ethical statement
All data in this study was de-identified and the retrospective study is exempt from institutional review board approval according to section 46.101(b) of 45CFR 46, which states that research involving the study of existing pathologic and diagnostic specimens in such a manner that subjects cannot be identified is exempt from the Department of Health and Human Services Protection of Human Research Subjects.
Financial disclosure
Authors disclose no conflict of interests.
References
- Bokhman, J.V., Two pathogenetic types of endometrial carcinoma. Gynecol Oncol, 1983. 15(1): p. 10-7. [CrossRef]
- Talhouk, A., et al., A clinically applicable molecular-based classification for endometrial cancers. Br J Cancer, 2015. 113(2): p. 299-310. [CrossRef]
- Hoang, L.N., et al., Interobserver Agreement in Endometrial Carcinoma Histotype Diagnosis Varies Depending on The Cancer Genome Atlas (TCGA)-based Molecular Subgroup. Am J Surg Pathol, 2017. 41(2): p. 245-252. [CrossRef]
- Kandoth, C., et al., Integrated genomic characterization of endometrial carcinoma. Nature, 2013. 497(7447): p. 67-73.
- Helpman, L., et al., Disparities in the survival of endometrial cancer patients in a public healthcare system: A population-based cohort study. Gynecol Oncol, 2022. 167(3): p. 532-539. [CrossRef]
- Helpman, L., et al., Endometrial cancer presentation is associated with social determinants of health in a public healthcare system: A population-based cohort study. Gynecol Oncol, 2020. 158(1): p. 130-136. [CrossRef]
- Zhang, P., et al., Differences in Prevalence of Pregnancy Complications and Placental Pathology by Race and Ethnicity in a New York Community Hospital. JAMA Netw Open, 2022. 5(5): p. e2210719. [CrossRef]
- Zhang, P., et al., Potential association between marital status and maternal and neonatal complications and placental pathology in singleton pregnancy. Reproductive Medicine, 2023. 4: p. 28 - 33. [CrossRef]
- Martinez, C.A., et al., Epigenetic modifications appear in the human placenta following anxiety and depression during pregnancy. Placenta, 2023. 140: p. 72-79. [CrossRef]
- Liu, L., et al., Differential trends in rising endometrial cancer incidence by age, race, and ethnicity. JNCI Cancer Spectr, 2023. 7(1). [CrossRef]
- Njoku, K., et al., Impact of socio-economic deprivation on endometrial cancer survival in the North West of England: a prospective database analysis. BJOG, 2021. 128(7): p. 1215-1224. [CrossRef]
- Rota, M., et al., Modelling body mass index and endometrial cancer risk in a pooled-analysis of three case-control studies. BJOG, 2016. 123(2): p. 285-92. [CrossRef]
- Van Arsdale, A., et al., Association of obesity with survival in patients with endometrial cancer. Gynecol Oncol, 2019. 154(1): p. 156-162.
- Sarink, D., et al., Racial/ethnic differences in anthropometric and hormone-related factors and endometrial cancer risk: the Multiethnic Cohort Study. Br J Cancer, 2021. 124(10): p. 1724-1733. [CrossRef]
- Kumarasinghe, A.P., et al., DNA mismatch repair enzyme immunohistochemistry in colorectal cancer: a comparison of biopsy and resection material. Pathology, 2010. 42(5): p. 414-20. [CrossRef]
- Cunningham, J.M., et al., The frequency of hereditary defective mismatch repair in a prospective series of unselected colorectal carcinomas. Am J Hum Genet, 2001. 69(4): p. 780-90. [CrossRef]
- Chapel, D.B., et al., Immunohistochemistry for mismatch repair protein deficiency in endometrioid endometrial carcinoma yields equivalent results when performed on endometrial biopsy/curettage or hysterectomy specimens. Gynecol Oncol, 2018. 149(3): p. 570-574. [CrossRef]
- Chapel, D.B., et al., Interpretation of Mismatch Repair Protein Immunohistochemistry in Endometrial Carcinoma Should Consider Both Lynch Syndrome Screening and Immunotherapy Susceptibility: An Illustrative Case Report. Int J Gynecol Pathol, 2020. 39(3): p. 233-237. [CrossRef]
- de Freitas, D., et al., Clinicopathological characteristics of endometrial carcinomas according to DNA mismatch repair protein status. Heliyon, 2023. 9(6): p. e17495.
- Konstantinopoulos, P.A., et al., Phase II Study of Avelumab in Patients With Mismatch Repair Deficient and Mismatch Repair Proficient Recurrent/Persistent Endometrial Cancer. J Clin Oncol, 2019. 37(30): p. 2786-2794. [CrossRef]
- Nagar, H., et al., Sentinel node biopsy for diagnosis of lymph node involvement in endometrial cancer. Cochrane Database Syst Rev, 2021. 6(6): p. CD013021.
- Lindemann, K., et al., Body mass, diabetes and smoking, and endometrial cancer risk: a follow-up study. Br J Cancer, 2008. 98(9): p. 1582-5. [CrossRef]
- Ryan, N.A.J., et al., The proportion of endometrial tumours associated with Lynch syndrome (PETALS): A prospective cross-sectional study. PLoS Med, 2020. 17(9): p. e1003263. [CrossRef]
- Ramchander, N.C., et al., Distinct Immunological Landscapes Characterize Inherited and Sporadic Mismatch Repair Deficient Endometrial Cancer. Front Immunol, 2019. 10: p. 3023. [CrossRef]
- Clarke, M.A., et al., Racial and Ethnic Differences in Hysterectomy-Corrected Uterine Corpus Cancer Mortality by Stage and Histologic Subtype. JAMA Oncol, 2022. 8(6): p. 895-903. [CrossRef]
- Baskovic, M., et al., Racial disparities in outcomes for high-grade uterine cancer: A California cancer registry study. Cancer Med, 2018. 7(9): p. 4485-4495. [CrossRef]
- Cote, M.L., et al., The Growing Burden of Endometrial Cancer: A Major Racial Disparity Affecting Black Women. Cancer Epidemiol Biomarkers Prev, 2015. 24(9): p. 1407-15.
- Karia, P.S., et al., Racial and ethnic differences in type II endometrial cancer mortality outcomes: The contribution of sociodemographic, clinicopathologic, and treatment factors. Gynecol Oncol, 2023. 168: p. 119-126. [CrossRef]
- Raimondo, D., et al., Race and ethnicity reporting in endometrial cancer literature. Int J Gynecol Cancer, 2023. 33(9): p. 1402-1407. [CrossRef]
- Kim, J.H., et al., Clinicopathologic significance of DNA mismatch repair protein status in endometrial cancer. Taiwan J Obstet Gynecol, 2022. 61(3): p. 415-421. [CrossRef]
- Kim, M.K., et al., Clinicopathologic significance of mismatch repair protein expression in endometrioid endometrial cancer. Taiwan J Obstet Gynecol, 2023. 62(5): p. 724-728. [CrossRef]
- Zhang, P., et al., Differences in Prevalence of Colorectal Carcinoma by Gender and Marital Status and Expression of DNA Mismatch Repair Proteins. International Journal of Translational Medicine, 2024. 4(3): p. 584-594. [CrossRef]
- Pasanen, A., M. Loukovaara, and R. Bützow, Clinicopathological significance of deficient DNA mismatch repair and MLH1 promoter methylation in endometrioid endometrial carcinoma. Mod Pathol, 2020. 33(7): p. 1443-1452. [CrossRef]
- Uribe, Y., et al., Intersectionality Between Epigenetics and Cancer Health Disparities Stemming from Social Determinants of Health (SDoH) Through a Gynecologic Oncology Lens: A Narrative Review. Clin Obstet Gynecol, 2023. 66(1): p. 53-62. [CrossRef]
- Nowakowski, R., et al., Variances in the Expression Profile of the EMT-Related Genes in Endometrial Cancer Lines In Vitro Study. Curr Pharm Biotechnol, 2022. 23(4): p. 594-608. [CrossRef]
- Loukovaara, M., A. Pasanen, and R. Bützow, Mismatch Repair Deficiency as a Predictive and Prognostic Biomarker in Molecularly Classified Endometrial Carcinoma. Cancers (Basel), 2021. 13(13). [CrossRef]
- Addante, F., et al., Mismatch Repair Deficiency as a Predictive and Prognostic Biomarker in Endometrial Cancer: A Review on Immunohistochemistry Staining Patterns and Clinical Implications. Int J Mol Sci, 2024. 25(2). [CrossRef]
- Alexa, M., A. Hasenburg, and M.J. Battista, The TCGA Molecular Classification of Endometrial Cancer and Its Possible Impact on Adjuvant Treatment Decisions. Cancers (Basel), 2021. 13(6). [CrossRef]
- Travaglino, A., et al., Prognostic value of the TCGA molecular classification in uterine carcinosarcoma. Int J Gynaecol Obstet, 2022. 158(1): p. 13-20. [CrossRef]
- Raffone, A., et al., Tumor-infiltrating lymphocytes and POLE mutation in endometrial carcinoma. Gynecol Oncol, 2021. 161(2): p. 621-628. [CrossRef]
- Restaino, S., et al., Management of Patients Diagnosed with Endometrial Cancer: Comparison of Guidelines. Cancers (Basel), 2023. 15(4). [CrossRef]
- Ferrari, F.A., et al., Performance of molecular classification in predicting oncologic outcomes of fertility-sparing treatment for atypical endometrial hyperplasia and endometrial cancer. Int J Gynecol Cancer, 2025. 35(1): p. 100016. [CrossRef]
- Loukovaara, M., et al., Clinicopathologic stratification demonstrates survival differences between endometrial carcinomas with mismatch repair deficiency and no specific molecular profile: a cohort study. Int J Gynecol Cancer, 2025. 35(1): p. 100048. [CrossRef]
- Aguilar, M., et al., Reliable Identification of Endometrial Precancers Through Combined Pax2, β-Catenin, and Pten Immunohistochemistry. Am J Surg Pathol, 2022. 46(3): p. 404-414. [CrossRef]
- Lucas, E., et al., Utility of a PAX2, PTEN, and β-catenin Panel in the Diagnosis of Atypical Hyperplasia/Endometrioid Intraepithelial Neoplasia in Endometrial Polyps. Am J Surg Pathol, 2023. 47(9): p. 1019-1026. [CrossRef]
- Sahoo, S.S., et al., PAX2 is Transcriptionally Silenced by a Distinct Mechanism of Epigenetic Reprogramming to Initiate Endometrial Carcinogenesis. bioRxiv, 2024.
Figure 1.
Relationship between the race/ethnicity and the marital status and the body mass index.
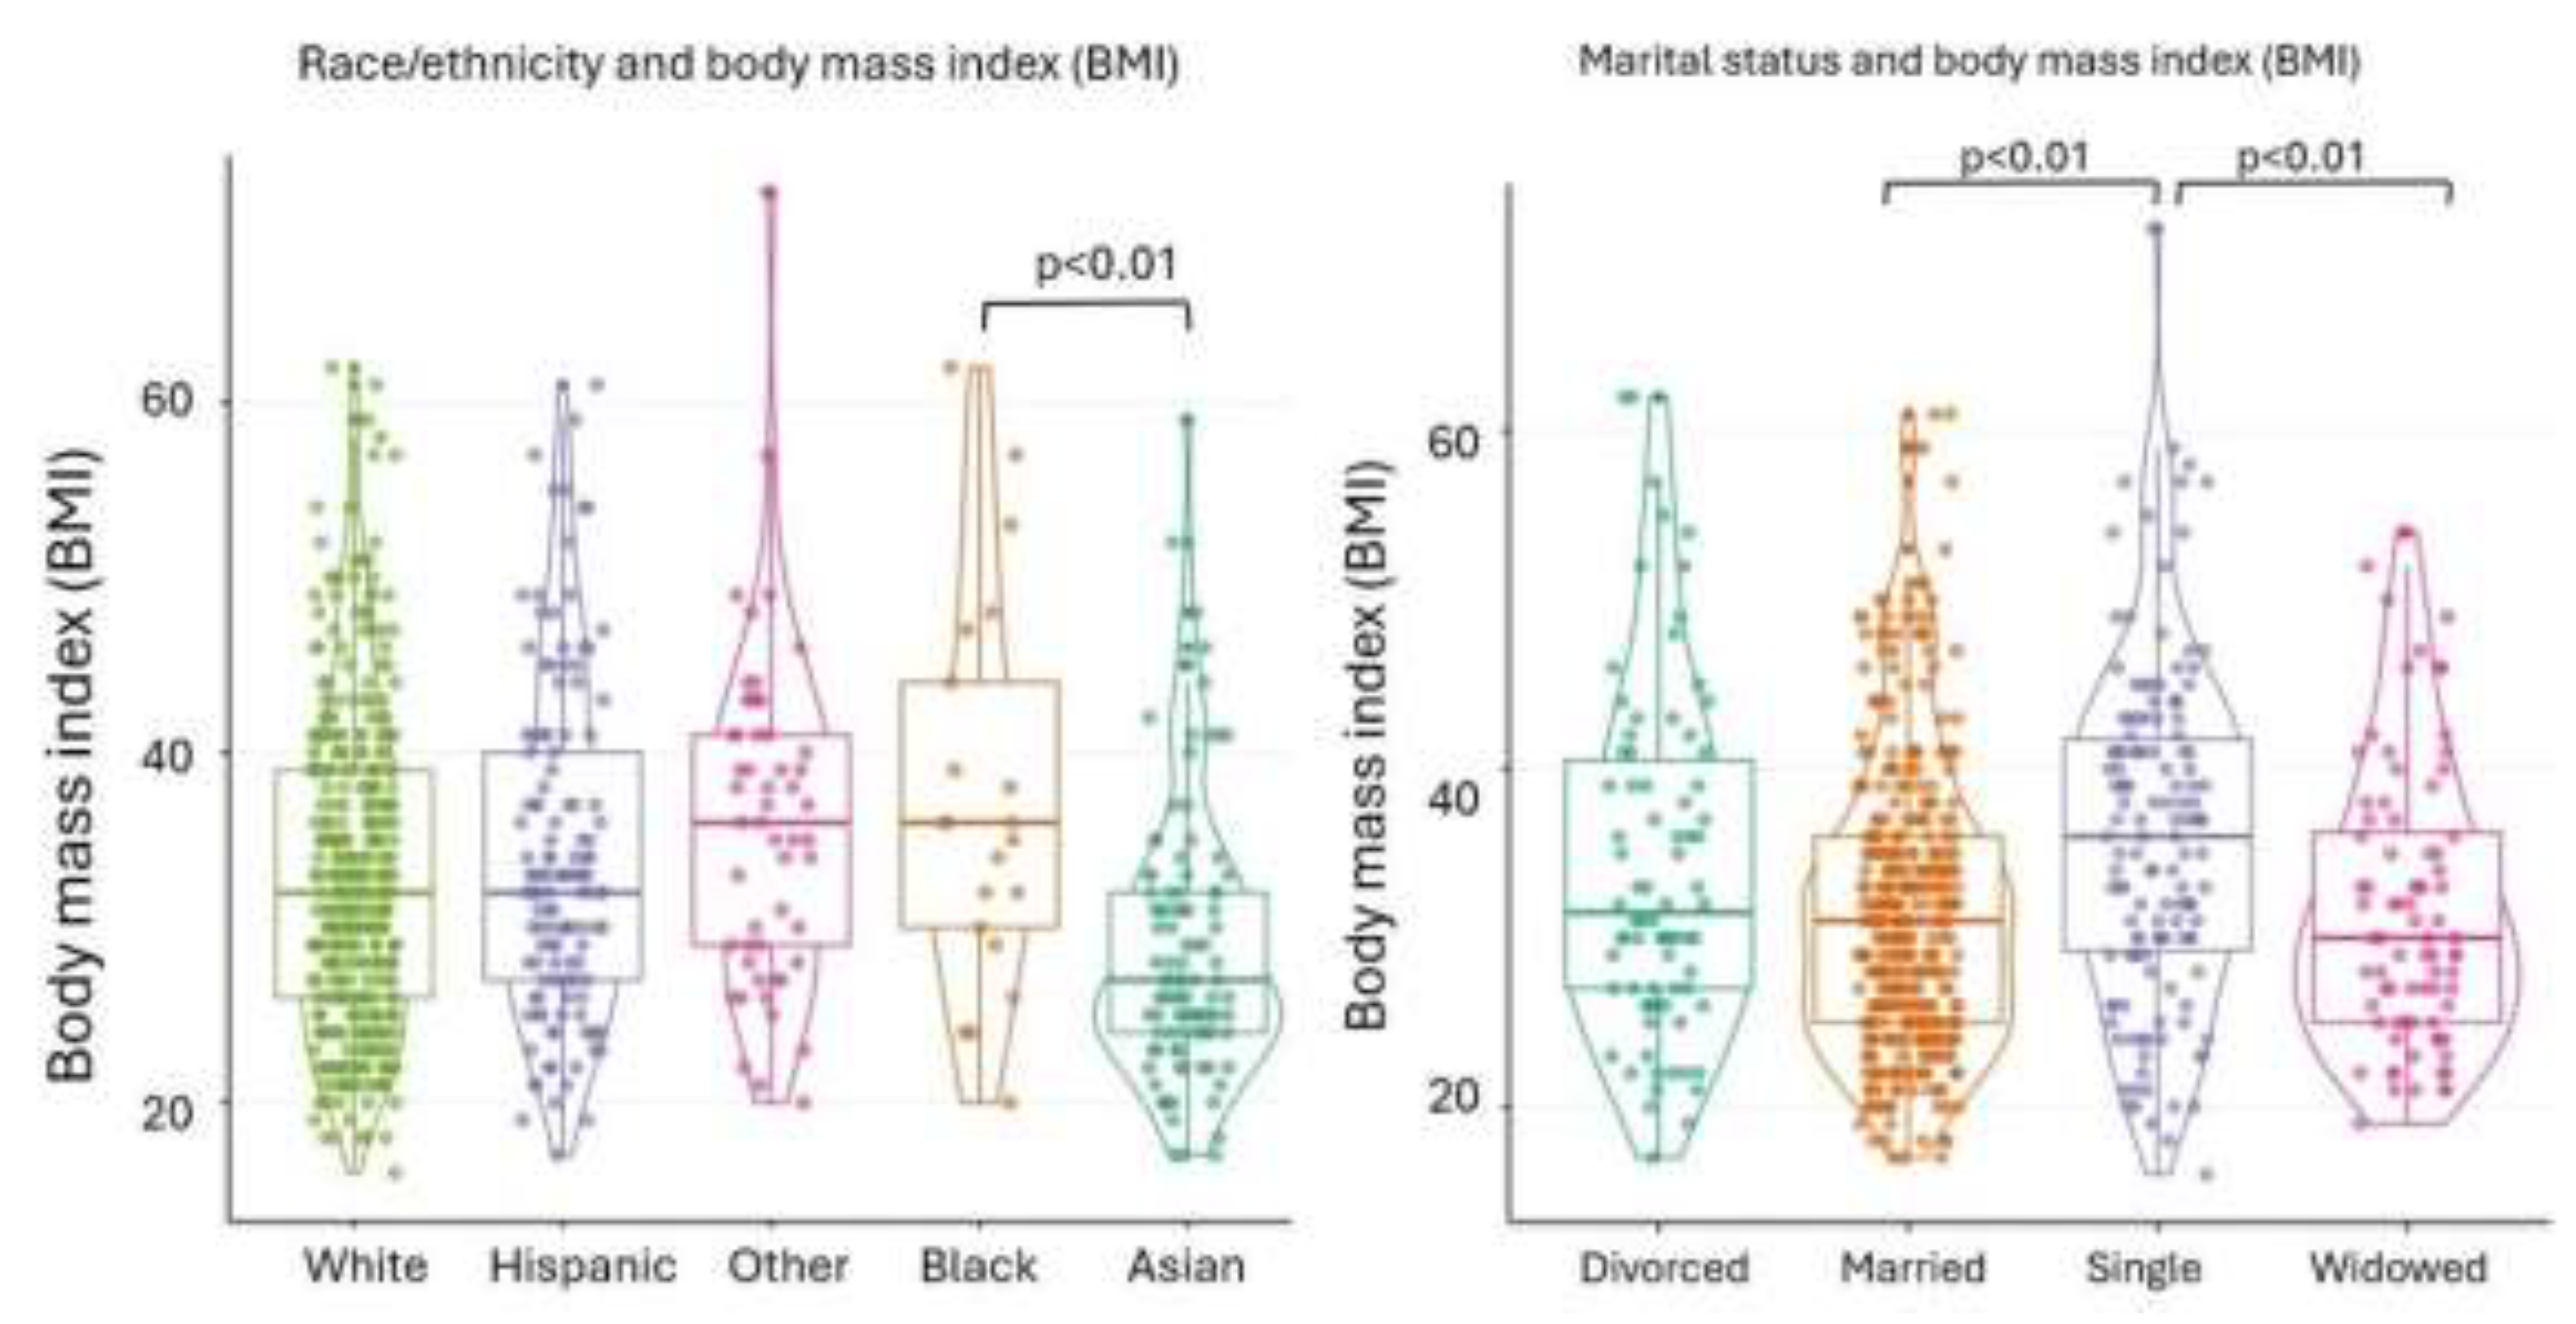
Figure 2.
Distribution of MMRP-deficient and MMRP-proficient endometrial carcinoma with the patient’s age and tumor grade. Left panel showed relationship between the patient’s age (year) and the MMRP status. Right panel represented a conditioning plot with the numbers of endometrial carcinomas of tumor grades and MMRP status. The data was also presented in Table 5. MMR-p – MMR proficient, MMR-d – MMR deficient.
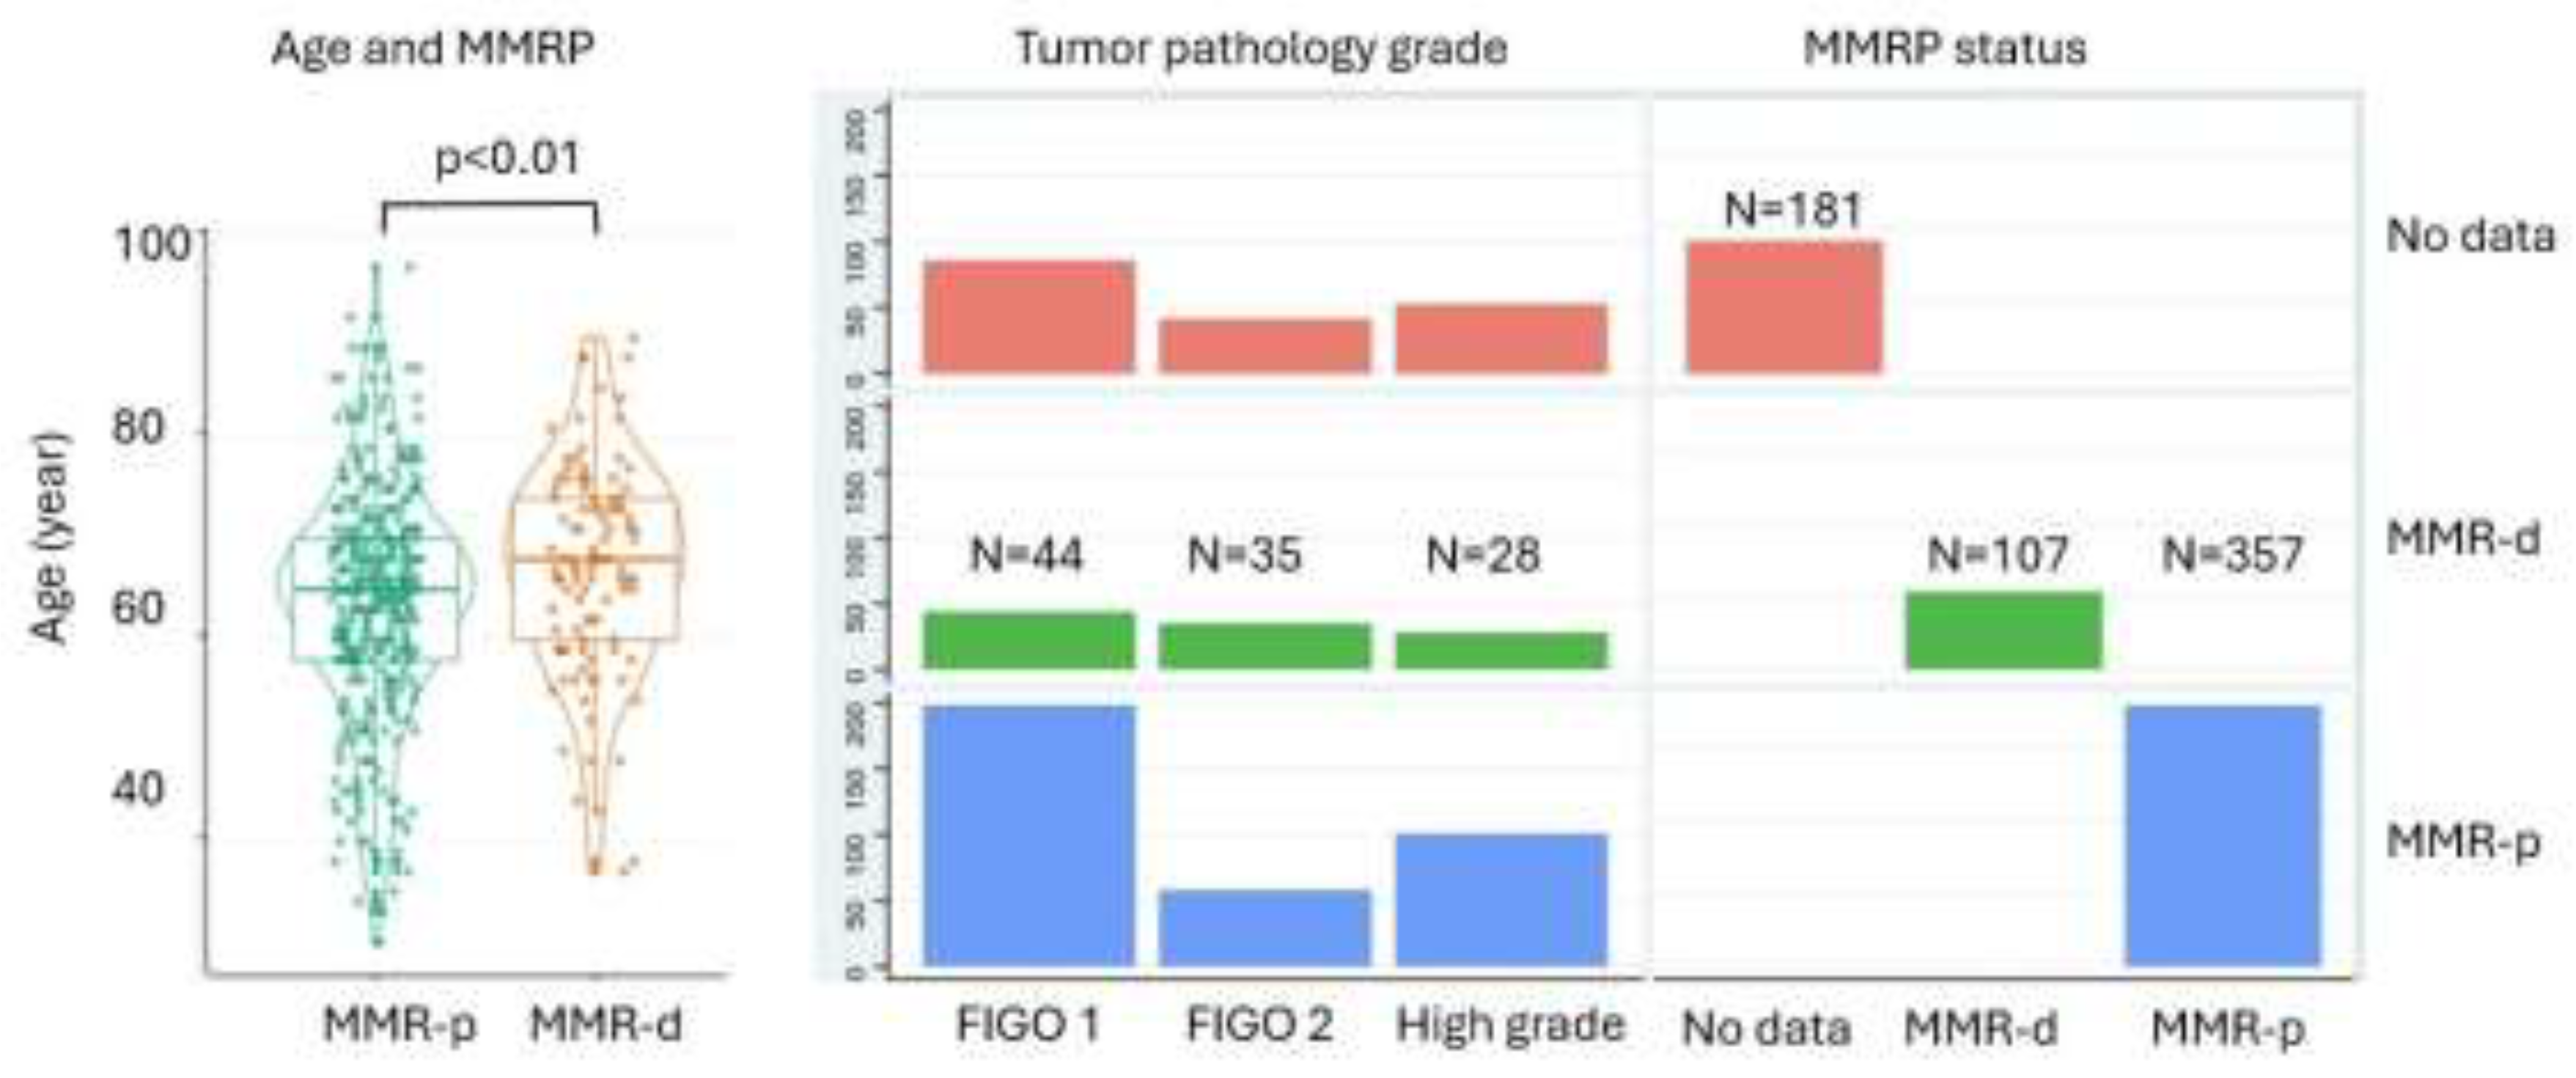

Table 1.
Racial/ethnicity and Endometrial Carcinoma.
| Race/ethnicity | Asian | Black | Hispanic | Other | White | Total | P value |
|---|---|---|---|---|---|---|---|
| (N=99)(15.3%) | (N=21)(3.3%) | (N=129)(20%) | (N=53)(8.2%) | (N=343)(53.2%) | (N=645) | ||
| Marital status | 0.13 | ||||||
| - Divorced | 9 ( 9.1%) | 3 (14.3%) | 13 (10.1%) | 6 (11.3%) | 47 (13.7%) | 78 (12.1%) | |
| - Married | 63 (63.6%) | 12 (57.1%) | 66 (51.2%) | 24 (45.3%) | 184 (53.6%) | 349 (54.1%) | |
| - Single | 20 (20.2%) | 4 (19.0%) | 33 (25.6%) | 19 (35.8%) | 62 (18.1%) | 138 (21.4%) | |
| - Widowed | 7 ( 7.1%) | 2 ( 9.5%) | 17 (13.2%) | 4 ( 7.5%) | 50 (14.6%) | 80 (12.4%) | |
| Religion | 71 (71.7%) | 16 (76.2%) | 113 (87.6%) | 36 (67.9%) | 237 (69.1%) | 473 (73.3%) | <0.01 |
| Body mass index (BMI) | 27.0 [24.0;32.0] | 36.0 [30.0;44.0] | 32.0 [27.0;40.0] | 36.0 [29.0;41.0] | 32.0 [26.0;39.0] | 32.0 [26.0;39.0] | <0.01 |
| Obesity | <0.01 | ||||||
| - Non-obese (BMI <25) | 30 (30.3%) | 3 (14.3%) | 19 (14.7%) | 4 ( 7.5%) | 67 (19.5%) | 123 (19.1%) | |
| - Overweight (BMI 25-29) | 31 (31.3%) | 2 ( 9.5%) | 24 (18.6%) | 12 (22.6%) | 65 (19.0%) | 134 (20.8%) | |
| - Class I (BMI 30-34) | 21 (21.2%) | 4 (19.0%) | 39 (30.2%) | 6 (11.3%) | 77 (22.4%) | 147 (22.8%) | |
| - Class II (BMI 35-39) | 5 ( 5.1%) | 6 (28.6%) | 14 (10.9%) | 14 (26.4%) | 57 (16.6%) | 96 (14.9%) | |
| - Class III (BMI 40/over) | 12 (12.1%) | 6 (28.6%) | 33 (25.6%) | 17 (32.1%) | 77 (22.4%) | 145 (22.5%) | |
| Patient age (year) | 61.0 [55.0;69.5] | 60.0 [58.0;68.0] | 62.0 [54.0;70.0] | 60.0 [55.0;68.0] | 68.0 [63.0;74.5] | 66.0 [59.0;72.0] | <0.01 |
| Positive washing cytology | 4 ( 4.7%) | 3 (14.3%) | 11 ( 9.2%) | 3 ( 6.0%) | 22 ( 6.8%) | 43 ( 7.2%) | 0.51 |
| Tumor grade | 0.08 | ||||||
| - High grade | 26 (26.3%) | 9 (42.9%) | 47 (36.4%) | 13 (24.5%) | 87 (25.4%) | 182 (28.2%) | |
| - Low grade | 73 (73.7%) | 12 (57.1%) | 82 (63.6%) | 40 (75.5%) | 256 (74.6%) | 463 (71.8%) | |
| MMRP status | 0.34 | ||||||
| - Proficient | 54 (84.4%) | 11 (84.6%) | 80 (80.0%) | 27 (73.0%) | 185 (74.0%) | 357 (76.9%) | |
| - Deficient | 10 (15.6%) | 2 (15.4%) | 20 (20.0%) | 10 (27.0%) | 65 (26.0%) | 107 (23.1%) |
The values expressed were mean with percentage of total with 95% confidence intervals. p < .05 is considered significant, and bolded.
Table 2.
Marital Status and Endometrial Carcinoma.
| Marital status | Divorced | Married | Single | Widowed | Total | P value |
|---|---|---|---|---|---|---|
| (N=78)(12.1%) | (N=349)(54.1%) | (N=138)(21.4%) | (N=80)(12.4%) | (N=645) | ||
| Race/ethnicity | 0.13 | |||||
| - Asian | 9 (11.5%) | 63 (18.1%) | 20 (14.5%) | 7 ( 8.8%) | 99 (15.3%) | |
| - Black | 3 ( 3.8%) | 12 ( 3.4%) | 4 ( 2.9%) | 2 ( 2.5%) | 21 ( 3.3%) | |
| - Hispanic | 13 (16.7%) | 66 (18.9%) | 33 (23.9%) | 17 (21.2%) | 129 (20.0%) | |
| - Other | 6 ( 7.7%) | 24 ( 6.9%) | 19 (13.8%) | 4 ( 5.0%) | 53 ( 8.2%) | |
| - White | 47 (60.3%) | 184 (52.7%) | 62 (44.9%) | 50 (62.5%) | 343 (53.2%) | |
| Religious belief | 61 (78.2%) | 250 (71.6%) | 94 (68.1%) | 68 (85.0%) | 473 (73.3%) | 0.03 |
| Body mass index (BMI) | 31.5 [27.0;41.0] | 31.0 [25.0;36.0] | 36.0 [29.0;42.0] | 30.0 [25.0;36.5] | 32.0 [26.0;39.0] | <0.01 |
| Obesity | <0.01 | |||||
| - Non-obese (BMI <25) | 12 (15.4%) | 75 (21.5%) | 20 (14.5%) | 16 (20.0%) | 123 (19.1%) | |
| - Overweight (BMI 25-29) | 15 (19.2%) | 82 (23.5%) | 15 (10.9%) | 22 (27.5%) | 134 (20.8%) | |
| - Class I (BMI 30-34) | 18 (23.1%) | 84 (24.1%) | 28 (20.3%) | 17 (21.2%) | 147 (22.8%) | |
| - Class II (BMI 35-39) | 13 (16.7%) | 47 (13.5%) | 26 (18.8%) | 10 (12.5%) | 96 (14.9%) | |
| - Class III (BMI 40/over) | 20 (25.6%) | 61 (17.5%) | 49 (35.5%) | 15 (18.8%) | 145 (22.5%) | |
| Patient age (year) | 68.0 [62.0;73.0] | 65.0 [59.0;71.0] | 62.0 [56.0;68.0] | 74.5 [68.0;81.5] | 66.0 [59.0;72.0] | <0.01 |
| Positive washing cytology | 4 ( 5.5%) | 24 ( 7.4%) | 10 ( 7.9%) | 5 ( 6.8%) | 43 ( 7.2%) | 0.93 |
| Tumor grade | 0.01 | |||||
| - High grade | 19 (24.4%) | 84 (24.1%) | 45 (32.6%) | 34 (42.5%) | 182 (28.2%) | |
| - Low grade | 59 (75.6%) | 265 (75.9%) | 93 (67.4%) | 46 (57.5%) | 463 (71.8%) | |
| MMRP status | 0.02 | |||||
| - Proficient | 37 (61.7%) | 189 (77.5%) | 81 (81.0%) | 50 (83.3%) | 357 (76.9%) | |
| - Deficient | 23 (38.3%) | 55 (22.5%) | 19 (19.0%) | 10 (16.7%) | 107 (23.1%) |
The values expressed were mean with percentage of total with 95% confidence intervals. p < 0.05 is considered significant, and bolded.
Table 3.
Obesity and Endometrial carcinoma.
| Obesity | Non-obese | Overweight | Class I | Class II | Class III | p | |
|---|---|---|---|---|---|---|---|
| (N=123)(19.1%) | (N=134)(20.8%) | (N=147)(22.8%) | (N=96)(14.9%) | (N=145)(22.5%) | |||
| Race/ethnicity | <0.01 | ||||||
| - Asian | 30 (24.4%) | 31 (23.1%) | 21 (14.3%) | 5 ( 5.2%) | 12 ( 8.3%) | ||
| - Black | 3 ( 2.4%) | 2 ( 1.5%) | 4 ( 2.7%) | 6 ( 6.2%) | 6 ( 4.1%) | ||
| - Hispanic | 19 (15.4%) | 24 (17.9%) | 39 (26.5%) | 14 (14.6%) | 33 (22.8%) | ||
| - Other | 4 ( 3.3%) | 12 ( 9.0%) | 6 ( 4.1%) | 14 (14.6%) | 17 (11.7%) | ||
| - White | 67 (54.5%) | 65 (48.5%) | 77 (52.4%) | 57 (59.4%) | 77 (53.1%) | ||
| Marital status | <0.01 | ||||||
| - Divorced | 12 ( 9.8%) | 15 (11.2%) | 18 (12.2%) | 13 (13.5%) | 20 (13.8%) | ||
| - Married | 75 (61.0%) | 82 (61.2%) | 84 (57.1%) | 47 (49.0%) | 61 (42.1%) | ||
| - Single | 20 (16.3%) | 15 (11.2%) | 28 (19.0%) | 26 (27.1%) | 49 (33.8%) | ||
| - Widowed | 16 (13.0%) | 22 (16.4%) | 17 (11.6%) | 10 (10.4%) | 15 (10.3%) | ||
| Body mass index (BMI) | 22.0 [21.0;24.0] | 27.0 [26.0;28.0] | 32.0 [31.0;33.0] | 37.0 [35.0;38.0] | 45.0 [41.0;49.0] | <0.01 | |
| Patient age (year) | 69.0 [60.5;75.5] | 67.0 [62.0;74.0] | 66.0 [60.0;71.5] | 64.0 [58.0;69.5] | 62.0 [56.0;69.0] | <0.01 | |
| Tumor grade | <0.01 | ||||||
| - High grade | 52 (42.3%) | 36 (26.9%) | 47 (32.0%) | 26 (27.1%) | 21 (14.5%) | ||
| - Low grade | 71 (57.7%) | 98 (73.1%) | 100 (68.0%) | 70 (72.9%) | 124 (85.5%) | ||
| Tumor stage (TNM-T) | 0.11 | ||||||
| - T1 | 92 (76.0%) | 107 (80.5%) | 115 (78.2%) | 75 (78.9%) | 129 (89.6%) | ||
| - T2 | 8 ( 6.6%) | 11 ( 8.3%) | 10 ( 6.8%) | 11 (11.6%) | 7 ( 4.9%) | ||
| - T3 | 21 (17.4%) | 15 (11.3%) | 21 (14.3%) | 9 ( 9.5%) | 8 ( 5.6%) | ||
| - T4 | 0 ( 0.0%) | 0 ( 0.0%) | 1 ( 0.7%) | 0 ( 0.0%) | 0 ( 0.0%) | ||
| Nodal metastasis (TNM-N) | 21 (18.9%) | 15 (12.6%) | 31 (23.1%) | 18 (20.0%) | 13 (10.7%) | 0.05 |
The values expressed were mean with percentage of total with 95% confidence intervals. p < 0.05 is considered significant, and bolded.
Table 4.
High Grade versus Low Grade Endometrial Carcinoma.
| Tumor grade | High grade | Low grade | Total | p value |
|---|---|---|---|---|
| (N=182)(28.2%) | (N=463)(71.8%) | (N=645) | ||
| Marital status | 0.01 | |||
| - Divorced | 19 (10.4%) | 59 (12.7%) | 78 (12.1%) | |
| - Married | 84 (46.2%) | 265 (57.2%) | 349 (54.1%) | |
| - Single | 45 (24.7%) | 93 (20.1%) | 138 (21.4%) | |
| - Widowed | 34 (18.7%) | 46 ( 9.9%) | 80 (12.4%) | |
| Body mass index (BMI) | 30.0 [24.0;35.0] | 33.0 [27.0;41.0] | 32.0 [26.0;39.0] | <0.01 |
| Obesity | <0.01 | |||
| - Non-obese (BMI <25) | 52 (28.6%) | 71 (15.3%) | 123 (19.1%) | |
| - Overweight (BMI 25-29) | 36 (19.8%) | 98 (21.2%) | 134 (20.8%) | |
| - Class I (BMI 30-34) | 47 (25.8%) | 100 (21.6%) | 147 (22.8%) | |
| - Class II (BMI 35-39) | 26 (14.3%) | 70 (15.1%) | 96 (14.9%) | |
| - Class III (BMI 40/over) | 21 (11.5%) | 124 (26.8%) | 145 (22.5%) | |
| Patient age (year) | 68.0 [63.0;76.0] | 64.0 [58.0;71.0] | 66.0 [59.0;72.0] | <0.01 |
| Positive washing cytology | 30 (17.9%) | 13 ( 3.0%) | 43 ( 7.2%) | <0.01 |
| T stage (TNM-T) | <0.01 | |||
| - T1 | 104 (58.1%) | 414 (89.8%) | 518 (80.9%) | |
| - T2 | 21 (11.7%) | 26 ( 5.6%) | 47 ( 7.3%) | |
| - T3 | 53 (29.6%) | 21 ( 4.6%) | 74 (11.6%) | |
| - T4 | 1 ( 0.6%) | 0 ( 0.0%) | 1 ( 0.2%) | |
| Nodal metastasis (TNM-N) | 48 (31.2%) | 50 (11.8%) | 98 (17.0%) | <0.01 |
| Distant metastasis (TNM-M) | 25 (83.3%) | 5 (22.7%) | 30 (57.7%) | <0.01 |
| FIGO stage (2009) | <0.01 | |||
| - No data | 15 ( 8.2%) | 17 ( 3.7%) | 32 ( 5.0%) | |
| - I | 81 (44.5%) | 384 (82.9%) | 465 (72.1%) | |
| - II | 12 ( 6.6%) | 17 ( 3.7%) | 29 ( 4.5%) | |
| - III | 46 (25.3%) | 40 ( 8.6%) | 86 (13.3%) | |
| - IV | 28 (15.4%) | 5 ( 1.1%) | 33 ( 5.1%) | |
| MMRP status | 0.76 | |||
| - Proficient | 101 (78.3%) | 256 (76.4%) | 357 (76.9%) | |
| - Deficient | 28 (21.7%) | 79 (23.6%) | 107 (23.1%) |
The values expressed were mean with percentage of total with 95% confidence intervals. p < 0.05 is considered significant, and bolded.
Table 5.
MMRP Status and Endometrial Carcinoma.
| Total Endometrial Carcinoma Low Grade Endometrial Carcinoma | ||||||||
|---|---|---|---|---|---|---|---|---|
| MMRP status | Proficient | Deficient | Total | p | Proficient | Deficient | Total | p |
| (N=357)(76.9%) | (N=107)(23.1%) | (N=464) | (N=256)(76.4%) | (N=79)(23.6%) | (N=335) | |||
| Marital status | 0.02 | 0.02 | ||||||
| - Divorced | 37 (10.4%) | 23 (21.5%) | 60 (12.9%) | 27(10.5%) | 19 (24.1%) | 46 (13.7%) | ||
| - Married | 189 (52.9%) | 55 (51.4%) | 244 (52.6%) | 144(56.2%) | 41 (51.9%) | 185(55.2%) | ||
| - Single | 81 (22.7%) | 19 (17.8%) | 100 (21.6%) | 55(21.5%) | 13 (16.5%) | 68 (20.3%) | ||
| - Widowed | 50 (14.0%) | 10 ( 9.3%) | 60 (12.9%) | 30 (11.7%) | 6 ( 7.6%) | 36 (10.7%) | ||
| Patient age (year) | 65.0 [58.0;70.0] | 68.0 [60.0;74.0] | 66.0 [59.0;72.0] | <0.01 | 63.0 [56.0;69.0] | 68.0 [59.5;73.0] | 64.0 [58.0;71.0] | <0.01 |
| Positive washing cytology | 24 ( 7.3%) | 8 ( 8.0%) | 32 ( 7.4%) | 0.97 | 7 ( 3.0%) | 2 ( 2.7%) | 9 ( 2.9%) | 1.00 |
| Low grade | <0.01 | |||||||
| - FIGO 1 | -- | -- | -- | 198(77.3%) | 44 (55.7%) | 242(72.2%) | ||
| - FIGO 2 | -- | -- | -- | 58 (22.7%) | 35 (44.3%) | 93 (27.8%) | ||
| Nodal metastasis (TNM-N) | 47 (14.6%) | 24 (23.5%) | 71 (16.7%) | 0.05 | 22 ( 9.4%) | 18 (23.7%) | 40 (12.9%) | <0.01 |
| Distant metastasis (TNM-M) | 15 (51.7%) | 6 (50.0%) | 21 (51.2%) | 1.00 | 1 ( 8.3%) | 3 (42.9%) | 4 (21.1%) | 0.23 |
| FIGO stage (2009) | 0.55 | 0.02 | ||||||
| - No data | 16 ( 4.5%) | 3 ( 2.8%) | 19 ( 4.1%) | 11 ( 4.3%) | 1 ( 1.3%) | 12 ( 3.6%) | ||
| - I | 260 (72.8%) | 73 (68.2%) | 333(71.8%) | 214(83.6%) | 59 (74.7%) | 273(81.5%) | ||
| - II | 16 ( 4.5%) | 6 ( 5.6%) | 22 ( 4.7%) | 8 ( 3.1%) | 3 ( 3.8%) | 11 ( 3.3%) | ||
| - III | 46 (12.9%) | 20 (18.7%) | 66(14.2%) | 22 ( 8.6%) | 13 (16.5%) | 35 (10.4%) | ||
| - IV | 19 ( 5.3%) | 5 ( 4.7%) | 24 ( 5.2%) | 1 ( 0.4%) | 3 ( 3.8%) | 4 ( 1.2%) | ||
The values expressed were mean with percentage of total with 95% confidence intervals. p < 0.05 is considered significant, and bolded.
Table 6.
Multivariate (Logistic) regression analysis for MMR deficiency.
| Estimate | STD error | t-value | p value | |
| Race/ethnicity | ||||
| - Black | 0.210 | 0.193 | 1.086 | 0.28 |
| - Hispanic | 0.086 | 0.092 | 0.939 | 0.35 |
| - Others | 0.125 | 0.113 | 1.105 | 0.27 |
| - White | 0.072 | 0.080 | 0.889 | 0.38 |
| Marital status | ||||
| -Married | -0.100 | 0.075 | -1.33 | 0.18 |
| - Single | -0.114 | 0.087 | -1.307 | 0.19 |
| - Widowed | -0.239 | 0.101 | -2.375 | 0.02* |
| BMI/Obesity | ||||
| BMI | -0.006 | 0.007 | -0.828 | 0.41 |
| Patient’s age | 0.007 | 0.003 | 2.885 | 0.004* |
| T-stage | 0.009 | 0.114 | 0.077 | 0.94 |
| Nodal stage | 0.117 | 0.116 | 1.004 | 0.32 |
| FIGO stage (2009) | ||||
| - FIGO I | 0.013 | 0.066 | 0.200 | 0.84 |
| - FIGO II | 0.040 | 0.173 | 0.228 | 0.82 |
| - FIGO III | 0.089 | 0.270 | -0.330 | 0.74 |
| - FIGO IV | 0.400 | 0.245 | 1.632 | 0.10 |
BMI – body mass index. Estimate indicates the changes of independent variables in relation to dependent variables. Positive value indicates direct relation, and negative value indicates inverse relation. t-value (statistics) indicates the magnitude and the significance of the variables. p < 0.05 is considered significant, and bolded.
Disclaimer/Publisher’s Note: The statements, opinions and data contained in all publications are solely those of the individual author(s) and contributor(s) and not of MDPI and/or the editor(s). MDPI and/or the editor(s) disclaim responsibility for any injury to people or property resulting from any ideas, methods, instructions or products referred to in the content. |
© 2026 by the authors. Licensee MDPI, Basel, Switzerland. This article is an open access article distributed under the terms and conditions of the Creative Commons Attribution (CC BY) license (http://creativecommons.org/licenses/by/4.0/).
Copyright: This open access article is published under a Creative Commons CC BY 4.0 license, which permit the free download, distribution, and reuse, provided that the author and preprint are cited in any reuse.


