Submitted:
18 February 2026
Posted:
23 February 2026
You are already at the latest version
Abstract
Seasonal precipitation forecasting remains challenging in regions with complex topography and high climatic variability, such as the state of Minas Gerais, Brazil. This study evaluates the performance of an Artificial Intelligence (AI)–based ensemble approach for seasonal precipitation prediction during 2024 and compares its results with those obtained from the NCEP Climate Forecast System version 2 (NCEP-CFSv2), a model from the North American Multi-Model Ensemble (NMME). The AI model was trained using high-resolution precipitation data from the MERGE-CPTEC dataset and applied to generate seasonal forecasts. Model performance was assessed using Root Mean Square Error (RMSE), Mean Square Error (MSE), and Relative Error (RE). Observed seasonal precipitation anomalies for 2024 were also examined to contextualize forecast skill under different climatic conditions. The results show that the AI-based forecasts consistently outperform the NCEP-CFSv2 from NMME across all seasons, exhibiting lower error metrics and improved representation of spatial precipitation patterns. The highest forecast skill was observed during winter (JJA), when atmospheric conditions are more stable and precipitation variability is low. During the wet seasons (DJF and SON), despite increased convective activity and spatial heterogeneity, the AI model maintained greater spatial coherence and closer agreement with observations than the dynamical forecasts. Overall, the findings demonstrate that AI-based approaches represent a promising and computationally efficient complementary tool for regional-scale seasonal precipitation forecasting, particularly in climatically heterogeneous regions.
Keywords:
artificial intelligence
; neural network
; seasonal prediction
; precipitation
1. Introduction
Precipitation forecast plays a crucial role in water resource management, agriculture, and climate disaster mitigation. Reliable forecasts are particularly critical in regions prone to hydroclimatic extremes, where the increasing frequency and intensity of droughts and floods amplified by anthropogenic climate change poses significant socioeconomic and environmental challenges [1,2,3,4].
In Brazil, seasonal climate forecasting is of strategic importance because much of the national economy depends on rainfall-driven systems, such as energy production [5] and agriculture [6]. The state of Minas Gerais, located in southeastern Brazil, represents a particularly sensitive region. With an area of 586,000 km2 and a diverse topography that includes high mountain ranges in the south and lower plateaus in the north, Minas Gerais exhibits substantial climatic heterogeneity [7]. Orographic effects increase rainfall in elevated central and southern areas, while the northern and western regions tend to experience drier conditions [8].
The rainy season is strongly influenced by the South Atlantic Convergence Zone (SACZ), a persistent convective band that can produce long-lasting rainfall episodes [9,10,11]. When the SACZ remains stationary, widespread floods and landslides often occur in central and southern Minas Gerais, as seen in late 2021 and early 2022 [12,13,14]. Conversely, in years when the SACZ is weak or displaced, northern Minas Gerais often experiences prolonged droughts, severely impacting agriculture and water availability [15].
Despite their importance, seasonal precipitation forecasts for Minas Gerais remain highly challenging. The region lies in a climatic transition zone between tropical and subtropical regimes, where the influence of large-scale drivers such as the El Niño–Southern Oscillation (ENSO) is moderate and inconsistent [16]. ENSO phases that strongly determine rainfall in northern and northeastern Brazil often have weaker and less predictable effects in Minas Gerais [17,18]. Capturing such complex and region-specific climate signals remains particularly difficult for traditional forecasting approaches, which rely on dynamical models.
Traditional forecasting approaches are based on dynamical models, known as General Circulation Models (GCMs), which numerically solve the fundamental equations governing atmospheric and oceanic processes [19]. Seasonal predictions derived from GCMs, such as those provided by the North American Multi-Model Ensemble (NMME) and the European Centre for Medium-Range Forecasts (ECMWF) seasonal forecasting system (SEAS5), have advanced significantly in recent decades [20,21]. However, despite these improvements, such models remain computationally intensive and continue to face limitations in both spatial and temporal resolution, which constrain their ability to capture regional climatic variability with sufficient accuracy [22,23].
Artificial intelligence (AI), and machine learning (ML) techniques in particular, have emerged as promising alternatives. Unlike dynamical models, AI-based approaches can efficiently process large volumes of observational and reanalysis data, identify nonlinear relationships, and generate forecasts with reduced computational cost. Neural networks and ensemble learning methods, for example, have shown potential to capture complex spatiotemporal rainfall patterns [24]. Leading meteorological institutions such as the ECMWF and the UK Met Office are increasingly incorporating AI techniques into operational forecasting, reporting improvements in accuracy and efficiency [25]. Recent advances have demonstrated that machine learning can outperform traditional models in subseasonal-to-seasonal forecasting, particularly when trained on high-resolution precipitation datasets [26,27].
In this context, the present study explores the use of artificial neural networks to improve seasonal precipitation forecasting in Minas Gerais. By training models on a high-resolution dataset and applying ensemble techniques, this research aims to predict four consecutive seasons, evaluating the extent to which AI can overcome the limitations of traditional models and provide more accurate rainfall predictions throughout the year. Given the state’s climatic diversity, its socioeconomic dependence on stable rainfall regimes, and the recurrent risks posed by precipitation extremes, improving these year-round seasonal forecasts offers a pathway to strengthen agricultural planning, optimize hydropower generation, and enhance disaster risk reduction strategies.
The remainder of this paper is organized as follows: Section 2 describes the dataset employed and the methodology adopted. Section 3 presents the results obtained with the AI models, while Section 4 provides a detailed discussion of these findings. Finally, Section 5 summarizes the main conclusions and highlights the study’s limitations.
2. Materials and Methods
2.1. Study Area
The state of Minas Gerais, located in the southeast Brazil, is known for its vast territorial expanse and a wide diversity of landscapes and climates, as shown in Figure 1. With an area of approximately 586,521 km2, Minas Gerais borders the states of Bahia, Goiás, Mato Grosso do Sul, Espírito Santo, São Paulo, and Rio de Janeiro. This geographical diversity results in significant variations in altitude, ranging from lower areas in the northeast and west of the state to mountainous regions in the south, such as the Serra da Mantiqueira, where peaks can reach around 2,800 meters in elevation (Figure 1.b).
Precipitation in Minas Gerais exhibits a pronounced seasonal cycle typical of a tropical–subtropical transition region. Based on the MERGE climatology for the 25-year period (1998-2022), rainfall shows strong spatial contrasts and clear seasonal dependence (Figure 2). Austral summer (December-January-February, DJF) corresponds to the wettest season, with higher precipitation concentrated over the central, southern, and southeastern portions of the state, where mean daily values frequently exceed 8 mm day−1. This pattern is primarily associated with the South Atlantic Convergence Zone (SACZ) and orographic effects in elevated areas.
During autumn (March-April-May, MAM), precipitation decreases across most of the state, marking the transition from the wet to the dry season. Rainfall remains moderate in southern and eastern regions, influenced by residual convective activity and frontal systems. Winter (June-July-August, JJA) is the driest season, with precipitation values generally below 1 mm day−1 over most of Minas Gerais. This period is characterized by the dominance of subsident atmospheric conditions and reduced convective activity, particularly in the northern and western mesoregions.
Spring (September-October-November, SON) marks the onset of the rainy season, with increasing precipitation over the western and southern sectors. Rainfall during this season exhibits high spatial and temporal variability, reflecting the transitional nature of large-scale circulation patterns and the gradual re-establishment of convective systems.
The strong seasonal contrasts in precipitation, combined with complex topography and regional atmospheric drivers, make Minas Gerais a challenging area for seasonal precipitation forecasting. These characteristics justify the use of high-resolution datasets and advanced modeling approaches, such as artificial intelligence-based methods, to improve the representation of regional rainfall variability.
2.2. Data Sources
The precipitation dataset used as the primary source in this study was obtained from MERGE [30,31]. This product, generated by the Center for Weather Forecast and Climate Studies, National Institute for Space Research (CPTEC/INPE), provides monthly data with a spatial resolution of 0.1° x 0.1° for the period from 1998 to present.
Additionally, data from the NCEP-CFSv2 model from NMME, with a 1.0° x 1.0° resolution (December 2023 to November 2024) was utilized solely for comparative purposes to evaluate the AI-generated seasonal forecasts against established dynamic models [20].
2.3. Methods
2.3.1. Analysis of Precipitation Data over the State of Minas Gerais
After acquiring the precipitation data, seasonal climatology was calculated for a 25-year period (1998 - 2022) to establish a reference baseline. The climatology was computed separately for each of the four climatological seasons: summer (DJF), autumn (MAM), winter (JJA), and spring (SON).
Seasonal precipitation anomalies for the target year (2024) were then calculated as the difference between the observed seasonal precipitation and the corresponding climatological mean for each season. This procedure allowed the identification of positive and negative departures from average conditions and enabled the characterization of the hydroclimatic conditions prevailing during the study year.
The analysis of seasonal anomalies provided a framework to contextualize the 2024 precipitation patterns within the historical record, facilitating the interpretation of forecast performance under conditions close to or deviating from climatological norms. This step is essential for assessing the representativeness of the target year and for supporting the evaluation of AI-based seasonal precipitation forecasts.
2.3.2. Hyperparameter Optimization
To enhance the model’s performance and ensure the most effective architecture for seasonal forecasting, a systematic hyperparameter optimization was conducted using a Random Search algorithm [32]. This approach allowed for an efficient exploration of the configuration space by randomly selecting combinations of parameters to minimize the Mean Square Error (MSE) during the validation phase. The search space was defined with the following variations: the number of neurons per hidden layer was selected from the set {16, 32, 50, 64, 96}, and the number of hidden layers ranged from 1 to 3. Following this optimization process, the configuration that yielded the highest accuracy was selected as the final model for generating the four-season precipitation forecasts.
Table 1 summarizes the optimal hyperparameter configurations selected through the Random Search procedure for each target seasonal forecast. The number of hidden layers and neurons reported correspond to the architectures that minimized the MSE during the validation phase, considering the training period from 2001 to 2022 for each season.
2.3.3. AI Model Training and Validation
The forecasting models were developed using artificial neural networks trained on the MERGE dataset to predict one station each. To ensure seasonal consistency, the training for each specific season was conducted exclusively using data from the same season in previous years. For instance, to forecast the DJF period, the model’s input consisted solely of DJF historical data. The same logic was applied to the other three seasons (MAM, JJA, and SON), allowing the network to capture the specific climate drivers and variability unique to each period. For the testing phase, used to evaluate the model’s ability to generalize to unseen data, data from the year 2023 were selected. Additionally, 10% of the training set data were randomly selected for internal model validation at each epoch.
The AI model training was implemented using the TensorFlow library in Python, a widely used tool for large-scale numerical computation and machine learning. The choice of this Machine Learning methodology was based on the study by Anochi [24].
The neural network was structured in layers, where input data were processed by multiple neurons until reaching the output layer. During training, the model iteratively adjusted its internal weights to improve prediction accuracy, with each full cycle of updates referred to as an epoch.
Model performance during training and validation was assessed using the Mean Square Error (MSE) as the evaluation metric. For each iteration, the MSE was computed according to Equation (1) and used to guide the optimization of the neural network.
where n is the number of time steps; x is the observed data; and y is the model’s prediction.
Additionally, the execution time of each model was measured, from the initial data processing to the generation of the final plots. As expected, execution time increased with data resolution.
2.3.4. AI Model Predictions and Ensemble Approach
Forecast simulations were performed for all four climatological seasons using 2024 as the target year [12]. For austral summer (DJF), the seasonal period was defined as December 2023 and January–February 2024, following standard climatological conventions. MERGE precipitation dataset was adopted due to its high temporal resolution and frequent updates, which make it particularly suitable for near-real-time applications and for the analysis of recent and ongoing events. These characteristics allow the proposed methodology to be applied not only in retrospective analyzes but also in current and operational forecasting contexts, especially in regions prone to extreme precipitation events such as Minas Gerais
To further improve predictive accuracy, an ensemble strategy was employed. In this approach, the same model was run multiple times with different initializations and data partitions, and the forecasts were combined. Specifically, the model was executed 20 times, and the final prediction corresponded to the mean of all individual runs (Figure 3). By averaging across members, the ensemble reduced random variability, minimized overfitting effects, and yielded a more robust and stable forecast.
The model’s predictions were evaluated against observed precipitation data, i.e., the raw data not included in the neural network, using three performance metrics: bias (Eq. 2), Root Mean Square Error (RMSE) (Eq. 3), Relative Error (RE) [33] (Eq. 4), and MSE (Eq. 1). Bias measures the systematic difference between predicted and observed values, with an ideal value of zero, indicating no systematic over- or underestimation. RMSE quantifies the magnitude of prediction errors, where lower values, ideally close to zero, reflect greater accuracy. RE provides a comparison of each model’s RMSE to the “typical” model error, defined as the median RMSE across all models. A negative RE indicates that a model performs better than the typical model, whereas a positive RE indicates worse performance.
In this framework, the best-performing models are those with bias ≈ 0, RMSE approaching 0, and negative RE values, indicating accuracy close to observations and performance superior to the typical model. To facilitate spatial interpretation, RE and RMSE results were summarized in heatmaps for each mesoregion of Minas Gerais.
where E is the RMSE of the predicted data, and Ē is the median of all RMSEs of the model forecasts.
3. Results
3.1. Observed Precipitation Anomalies in 2024
Observed seasonal precipitation anomalies for 2024 were calculated relative to a 25-year period (1998–2022) derived from the MERGE dataset and are presented in Figure 4. The anomaly fields provide a reference for assessing whether the study year exhibited conditions close to or distinct from the climatological mean.
During austral summer (DJF; Figure 4.a), precipitation anomalies exhibit a heterogeneous spatial pattern across Minas Gerais. Predominantly negative anomalies are observed over the central, southern, and southwestern portions of the state, indicating rainfall below the climatological average in these regions. In contrast, positive anomalies are evident in northern and northeastern mesoregions, reflecting localized above-average precipitation during the peak of the rainy season.
In autumn (MAM; Figure 4.b), precipitation anomalies are generally weak and spatially uniform, with values close to zero over most of the state. This pattern indicates precipitation conditions largely consistent with the climatological mean, with only isolated areas presenting small positive or negative departures.
Winter (JJA; Figure 4.c) is characterized by anomalies close to zero throughout Minas Gerais, reflecting the climatologically dry and stable conditions typical of this season. The limited spatial variability observed during JJA suggests minimal deviation from average winter precipitation.
In spring (SON; Figure 4.d), anomalies display increased spatial variability. Negative anomalies dominate central and eastern mesoregions, while localized positive anomalies are observed in western and southern areas. This pattern suggests a spatially heterogeneous onset of the rainy season in 2024, with delayed precipitation in some regions and above-average rainfall in others.
Overall, the observed anomaly patterns indicate that DJF and SON presented the most pronounced departures from climatological conditions in 2024, whereas MAM and JJA were closer to average conditions. These seasonal contrasts provide important context for the evaluation of AI-based seasonal precipitation forecasts presented in the following sections.
3.2. Seasonal Precipitation Forecasts Using AI Models
The ensemble forecasts for the four seasons of 2024, generated by the AI model trained with MERGE data, are presented in Figure 5 (a-d), alongside the observed data (e-h). The comparison allows for a direct visual assessment of the model’s ability to reproduce the spatial distribution and seasonal variability of precipitation over Minas Gerais.
For austral summer (DJF), the AI model (Figure 5.a) presents the spatially heterogeneous distribution of precipitation across Minas Gerais, with the blue-shaded areas highlighting regions of higher rainfall accumulations. When compared to observations (Figure 5e), the forecast captures the overall distribution of rainfall, although differences in precipitation intensity are evident in localized areas, particularly in regions affected by strong convective variability.
During the transition seasons, Autumn (MAM) and Spring (SON), the model demonstrated a high capacity to represent the seasonality. During autumn (MAM), the model successfully represents the seasonal reduction in precipitation and its spatial pattern. Forecasted (Figure 5.b) and observed (Figure 5.f) fields show good agreement, especially over southern and eastern mesoregions, indicating the model’s ability to capture transitional precipitation regimes. For spring (SON), the AI forecast (Figure 5.d) indicates an increase in precipitation over western and southern sectors, consistent with the observed reestablishment of rainfall (Figure 5.h). While the spatial pattern is generally well reproduced, differences in precipitation magnitude are observed in regions characterized by higher variability during the onset of the rainy season.
In winter (JJA), both forecasted (Figure 5.c) and observed (Figure 5.g) precipitation fields indicate widespread dry conditions across the state. The high degree of similarity between simulated and observed patterns reflects the reduced spatial variability of precipitation during this season.
Overall, the AI model demonstrates skill in reproducing the large-scale spatial distribution of precipitation across all seasons, with stronger agreement during periods of lower variability and increased discrepancies during wetter and transitional seasons.
3.3. Seasonal Performance Metrics
The quantitative performance of the AI ensemble forecasts is summarized in Table 2 using RMSE, MSE, and RE. These metrics provide an objective evaluation of forecast accuracy across the four climatological seasons.
The lowest error values are observed during the winter season (JJA), with RMSE of 0.1435 and MSE of 0.0206, indicating high agreement between predicted and observed precipitation. Autumn (MAM) also presents relatively low errors (RMSE = 0.6306), reflecting the reduced variability of precipitation during this transitional season.
Higher RMSE values are obtained for summer (DJF = 0.9449) and spring (SON = 0.9469), which correspond to periods dominated by convective activity and greater spatial and temporal variability. Despite these challenges, Relative Error values remain negative for all seasons, indicating that the AI ensemble performs better than the reference median model used for comparison.
The spatial distribution of forecast errors, represented by RMSE maps in Figure 6 and aggregated by mesoregions, reveals clear seasonal differences in model performance. During DJF (Figure 6.a) and SON (Figure 6.d), higher RMSE values are observed in regions characterized by strong spatial variability and convective activity, particularly over central and western mesoregions.
In contrast, JJA (Figure 6.c) exhibits uniformly low RMSE values across most of the state, indicating high spatial consistency between forecasts and observations under predominantly dry and stable atmospheric conditions. Autumn (MAM; Figure 6b) presents intermediate RMSE values, with relatively homogeneous spatial patterns and lower errors compared to DJF and SON, reflecting the reduced convective influence during the transition from the wet to the dry season.
Overall, the spatial RMSE patterns are consistent with the seasonal dependence identified in the aggregated performance metrics, confirming improved forecast skill during periods of lower precipitation variability and increased uncertainty during convectively active seasons.
3.4. Comparison Between AI and NCEP-CFSv2 Seasonal Forecasts
A comparison between the AI ensemble forecasts and the NCEP-CFSv2 is presented in Table 2 and Figure 7. The results show that the AI-based approach consistently outperforms the dynamical seasonal forecasts across all seasons.
Notably, the AI model significantly outperformed the NCEP-CFSv2 dynamic model in all evaluated seasons. For DJF, the AI model achieved an RMSE of 0.9449, while the NCEP-CFSv2 reached 2.2247, representing a substantial reduction in error. This trend is consistent across all seasons, highlighting the AI’s superior ability to downscale and adjust forecasts to the regional climatology of Minas Gerais.
Seasonal precipitation forecasts produced by the NCEP-CFSv2 ensemble for 2024 are shown in Figure 7 and are compared with both the AI-based forecasts (Figure 5a-d) and the observed precipitation fields (Figure 5e–h). The comparison highlights substantial differences in the ability of the two approaches to represent the spatial variability and seasonal evolution of precipitation over Minas Gerais.
During austral summer (DJF; Figure 7a), the NCEP-CFSv2 forecasts depict a smoothed precipitation pattern with reduced spatial gradients when compared to both the AI forecasts and the observed precipitation. While the NCEP-CFSv2 captures the general wet-season conditions, it underrepresents localized precipitation maxima observed over central and southern mesoregions, which are better resolved by the AI model.
In autumn (MAM; Figure 7b), the NCEP-CFSv2 forecasts present relatively homogeneous precipitation fields across the state, with limited spatial contrast. This behavior contrasts with the AI forecasts, which show improved representation of regional-scale variability and closer agreement with observations, particularly in transition regions between wetter and drier areas.
Winter (JJA; Figure 7c) forecasts from the NCEP-CFSv2 exhibit very low precipitation values over most of the state, consistent with the observed dry-season conditions. In this season, both the AI and NCEP-CFSv2 models show good agreement with observations, reflecting the dominance of large-scale atmospheric stability and reduced convective activity.
During spring (SON; Figure 7d), the NCEP-CFSv2 forecasts display smoother spatial patterns and delayed intensification of precipitation compared to observations. The AI model more accurately represents the spatial distribution and magnitude of precipitation associated with the onset of the rainy season, particularly in central and eastern mesoregions.
Overall, the comparison indicates that the AI-based forecasts provide improved spatial detail and better agreement with observed precipitation patterns, especially during convectively active seasons (DJF and SON).
4. Discussion
The application of Artificial Neural Networks for seasonal precipitation forecasting over Minas Gerais demonstrated a strong capacity to reproduce spatial and seasonal rainfall patterns. The use of the MERGE dataset as a high-resolution input source proved particularly advantageous, allowing the model to represent regional-scale variability that is commonly underestimated or smoothed by global dynamical forecasting systems [22,23].
A central result of this study is the marked seasonal dependence of forecast performance. The highest skill observed during winter (JJA) reflects the predominance of stable atmospheric conditions and the climatologically dry regime over the region, which reduces precipitation variability and forecast uncertainty. Similar behavior has been reported in previous studies, where both statistical and dynamical models tend to exhibit improved performance during dry seasons characterized by large-scale atmospheric control[22,24,27,34]. In contrast, the wet seasons (DJF and SON) represent a more challenging forecasting environment due to the influence of mesoscale and convective systems, including the SACZ, local convection, and orographic effects [8,9,10]. These processes introduce strong spatial heterogeneity and temporal intermittency, which are difficult to capture using seasonal forecasting approaches.
Despite these challenges, the AI-based forecasts maintained relatively low error levels during DJF and SON when compared to the NCEP-CFSv2 from models NMME ensemble. The RMSE spatial patterns indicate that the AI model was more effective in reproducing localized precipitation features, particularly in central and southern mesoregions, where convective activity and topographic influences are more pronounced. These findings are consistent with recent literature highlighting the ability of machine learning models to capture nonlinear relationships and subgrid-scale variability when trained on high-resolution observational datasets [24,34].
The comparison with the NCEP-CFSv2 forecasts further emphasizes the limitations of traditional dynamical models in regions with complex terrain such as Minas Gerais. While the NCEP-CFSv2 ensemble successfully represents large-scale circulation signals and broad seasonal tendencies, it exhibits smoother precipitation fields and higher error metrics, particularly during convectively active seasons. This behavior suggests that, although dynamical models are essential for representing physical processes at the global scale, their coarse spatial resolution constrains their ability to accurately simulate regional precipitation magnitude and spatial gradients [20,21,22].
The spatial analysis of forecast errors indicates that transitional zones, such as the boundary between the drier northern regions and the wetter southern highlands, remain challenging for both approaches. RMSE patterns in these areas suggest sensitivity to sharp climatic gradients and highlight the importance of incorporating additional predictors related to topography and land–atmosphere interactions [35]. Nevertheless, the relative error analysis confirms that the AI ensemble consistently outperforms the reference median model, particularly during JJA and MAM, reinforcing its robustness across distinct climatic regimes. These results are in line with broader assessments showing that AI and machine learning can complement or surpass dynamical systems in seasonal and subseasonal prediction when appropriately trained and calibrated [26,36].
Overall, the results indicate that AI-based seasonal forecasting represents a promising complementary approach to traditional dynamical models, especially for regional-scale applications in climatically heterogeneous areas.
5. Conclusions
This study assessed the potential of artificial intelligence to enhance seasonal precipitation forecasting over Minas Gerais by comparing AI-based predictions with those produced by the traditional NCEP-CFSv2 dynamical ensemble for the year 2024. The results indicate that the proposed AI methodology, trained using the high-resolution MERGE-CPTEC dataset, achieved improved performance relative to the NCEP-CFSv2 forecasts across all four climatological seasons.
The AI model consistently exhibited lower RMSE and MSE values, with the highest skill observed during the dry winter season (JJA), when atmospheric conditions are more stable and precipitation variability is reduced. During the wet seasons (DJF and SON), which are characterized by enhanced convective activity and greater spatial heterogeneity, the AI forecasts maintained better spatial coherence and closer agreement with observations than the dynamical baseline, despite the increased forecasting complexity.
Beyond quantitative accuracy, the results demonstrate the operational potential of the neural network ensemble approach. The ensemble strategy contributed to forecast stability by reducing random variability and mitigating overfitting, while the ability to generate high-resolution seasonal forecasts at a substantially lower computational cost than global dynamical models represent a key advantage for regional applications. Such efficiency is particularly relevant for meteorological centers that require timely information to support decision-making in sectors such as agriculture and water resource management.
Future research should aim to further improve this framework by incorporating additional large-scale atmospheric predictors, such as sea surface temperature anomalies and wind field indices, to enhance the representation of climate drivers and extreme events. Moreover, the exploration of advanced deep learning architectures capable of capturing longer-term temporal dependencies may improve forecast skill during transitional periods between dry and wet seasons, reinforcing the role of AI-based approaches as complementary tools in regional climate prediction.
Author Contributions
Conceptualization, J.A.A. and M.H.S.; methodology, J.A.A. and M.H.S.; software, M.J.G.; validation, J.A.A. and M.H.S.; formal analysis, M.J.G.; investigation, M.J.G.; resources, M.J.G.; data curation, M.J.G.; writing—original draft preparation, M.J.G.; writing—review and editing, M.J.G., J.A.A. and M.H.S.; visualization, M.J.G.; supervision, J.A.A. and M.H.S.; project administration, J.A.A. and M.H.S.; funding acquisition, CNPq and INPE.
Funding
This work was carried out within the scope of the Programa Institucional de Bolsas de Iniciação Científica (PIBIC) at INPE, in alignment with the Climate priority area of the Estratégia Nacional de Ciência, Tecnologia e Inovação (ENCTI).
Institutional Review Board Statement
Not applicable.
Informed Consent Statement
Not applicable.
Data Availability Statement
All the data used in this study are publicly available.
Acknowledgments
The first author acknowledges the financial support provided by the Brazilian National Council for Scientific and Technological Development (CNPq) through a research scholarship. During the preparation of this manuscript, the authors used ChatGPT (OpenAI) to assist with language refinement. The authors have reviewed and edited the content generated by this tool and take full responsibility for the accuracy, interpretation, and integrity of the final manuscript.
Conflicts of Interest
The funders had no role in the design of the study; in the collection, analysis, or interpretation of data; in the writing of the manuscript; or in the decision to publish the results.
Abbreviations
The following abbreviations are used in this manuscript:
| AI | Artificial Intelligence |
| CPTEC | Center for Weather Forecast and Climate Studies |
| DJF | Austral summer |
| ECMWF | European Centre for Medium-Range Forecasts |
| ENSO | El Niño–Southern Oscillation |
| GCM | General Circulation Models |
| JJA | Austral winter |
| MAM | Austral autumn |
| ML | Machine Learning |
| MSE | Mean Square Error |
| NMME | North American Multi-Model Ensemble |
| RE | Relative Error |
| RMSE | Root Mean Square Error |
| SACZ | South Atlantic Convergence Zone |
| SEAS5 | ECMWF seasonal forecasting system |
| SON | Austral spring |
References
- Seneviratne, S.I.; Zhang, X.; Adnan, M.; Badi, W.; Dereczynski, C.; Di Luca, A.; Ghosh, S.; Iskandar, I.; Kossin, J.; Lewis, S.; et al. Weather and Climate Extreme Events in a Changing Climate; Climate Change 2021: The Physical Science Basis. Contribution of Working Group I to the Sixth Assessment Report of the Intergovernmental Panel on Climate Change 2021.
- Cunha, A.P.M.A.; Zeri, M.; Leal, K.D.; Costa, L.; Cuartas, L.A.; Marengo, J.A.; Tomasella, J.; Vieira, R.M.; Barbosa, A.A.; Cunningham, C.; et al. Extreme Drought Events over Brazil from 2011 to 2019. Atmosphere (Basel). 2019, 10, doi:10.3390/atmos10110642. [CrossRef]
- Beniston, M.; Stephenson, D.B. Extreme Climatic Events and Their Evolution under Changing Climatic Conditions. Glob. Planet. Change 2004, 44, 1–9, doi:10.1016/j.gloplacha.2004.06.001. [CrossRef]
- Avila-Diaz, A.; Benezoli, V.; Justino, F.; Torres, R.; Wilson, A. Assessing Current and Future Trends of Climate Extremes across Brazil Based on Reanalyses and Earth System Model Projections. Clim. Dyn. 2020, 55, 1403–1426, doi:10.1007/s00382-020-05333-z. [CrossRef]
- Von Sperling, E. Hydropower in Brazil: Overview of Positive and Negative Environmental Aspects. In Proceedings of the Energy Procedia; 2012; Vol. 18.
- Rattis, L.; Brando, P.M.; Macedo, M.N.; Spera, S.A.; Castanho, A.D.A.; Marques, E.Q.; Costa, N.Q.; Silverio, D. V.; Coe, M.T. Climatic Limit for Agriculture in Brazil. Nat. Clim. Chang. 2021, 11, doi:10.1038/s41558-021-01214-3. [CrossRef]
- The Physical Geography of Brazil; Salgado, A.A.R., Santos, L.J.C., Paisani, J.C., Eds.; Springer International Publishing: Cham, 2019; ISBN 978-3-030-04332-2.
- Luiz-Silva, W.; Oscar-Júnior, A.C.; Cavalcanti, I.F.A.; Treistman, F. An Overview of Precipitation Climatology in Brazil: Space-Time Variability of Frequency and Intensity Associated with Atmospheric Systems. Hydrological Sciences Journal 2021, 66, doi:10.1080/02626667.2020.1863969. [CrossRef]
- Kodama, Y.M. Large-Scale Common Features of Sub-Tropical Convergence Zones (The Baiu Frontal Zone, the SPCZ, and the SACZ) Part II: Conditions of the Circulations for Generating the STCZs. Journal of the Meteorological Society of Japan 1993, 71, doi:10.2151/jmsj1965.71.5_581. [CrossRef]
- Kodama, Y. Large-Scale Common Features of Subtropical Precipitation Zones ( the Baiu Frontal Zone , the SPCZ , and the SACZ ) Part I: Characteristics of Subtropical Frontal Zones. Journal of the Meteorological Society of Japan 1992, 70.
- da Fonseca Aguiar, L.; Cataldi, M. Social and Environmental Vulnerability in Southeast Brazil Associated with the South Atlantic Convergence Zone. Natural Hazards 2021, 109, doi:10.1007/s11069-021-04926-z. [CrossRef]
- Marengo, J.A.; Seluchi, M.E.; Cunha, A.P.; Cuartas, L.A.; Goncalves, D.; Sperling, V.B.; Ramos, A.M.; Dolif, G.; Saito, S.; Bender, F.; et al. Heavy Rainfall Associated with Floods in Southeastern Brazil in November–December 2021. Natural Hazards 2023, 116, doi:10.1007/s11069-023-05827-z. [CrossRef]
- de Mello, C.R.; Viola, M.R. Mapeamento de Chuvas Intensas No Estado de Minas Gerais. Rev. Bras. Cienc. Solo 2013, 37, doi:10.1590/S0100-06832013000100004. [CrossRef]
- Silva, P.N.; Escobar, G.C.J.; Reboita, M.S. Eventos Extremos de Precipitação No Estado de Minas Gerais Associados Com a Ocorrência de Episódios de Zona de Convergência Do Atlântico Sul. Revista Brasileira de Geografia Física 2020, 13, doi:10.26848/rbgf.v13.3.p1013-1023. [CrossRef]
- Nobre, C.A.; Marengo, J.A.; Seluchi, M.E.; Cuartas, L.A.; Alves, L.M. Some Characteristics and Impacts of the Drought and Water Crisis in Southeastern Brazil during 2014 and 2015. J. Water Resour. Prot. 2016, 08, doi:10.4236/jwarp.2016.82022. [CrossRef]
- Minuzzi, R.B.; Sediyama, G.C.; Ribeiro, A.; Costa, J.M.N. da El Niño: Ocorrência e Duração Dos Veranicos Do Estado de Minas Gerais. Revista Brasileira de Engenharia Agrícola e Ambiental 2005, 9, doi:10.1590/s1415-43662005000300011. [CrossRef]
- De Souza, E.B.; Ambrizzi, T. ENSO Impacts on the South American Rainfall during 1980s: Hadley and Walker Circulation. Atmosfera 2002, 15.
- Rasmusson, E.M.; Mo, K. Linkages between 200-Mb Tropical and Extratropical Circulation Anomalies during the 1986-1989 ENSO Cycle. J. Clim. 1993, 6, 595–616.
- Lam, R.; Sanchez-Gonzalez, A.; Willson, M.; Wirnsberger, P.; Fortunato, M.; Alet, F.; Ravuri, S.; Ewalds, T.; Eaton-Rosen, Z.; Hu, W.; et al. Learning Skillful Medium-Range Global Weather Forecasting. Science (1979). 2023, 382, doi:10.1126/science.adi2336. [CrossRef]
- Kirtman, B.P.; Min, D.; Infanti, J.M.; Kinter, J.L.; Paolino, D.A.; Zhang, Q.; Van Den Dool, H.; Saha, S.; Mendez, M.P.; Becker, E.; et al. The North American Multimodel Ensemble: Phase-1 Seasonal-to-Interannual Prediction; Phase-2 toward Developing Intraseasonal Prediction. Bull. Am. Meteorol. Soc. 2014, 95, doi:10.1175/BAMS-D-12-00050.1. [CrossRef]
- Johnson, S.J.; Stockdale, T.N.; Ferranti, L.; Balmaseda, M.A.; Molteni, F.; Magnusson, L.; Tietsche, S.; Decremer, D.; Weisheimer, A.; Balsamo, G.; et al. SEAS5: The New ECMWF Seasonal Forecast System. Geosci. Model Dev. 2019, 12, doi:10.5194/gmd-12-1087-2019. [CrossRef]
- Coelho, C.A.S.; Stephenson, D.B.; Balmaseda, M.; Doblas-Reyes, F.J.; van Oldenborgh, G.J. Toward an Integrated Seasonal Forecasting System for South America. J. Clim. 2006, 19, doi:10.1175/JCLI3801.1. [CrossRef]
- Shimizu, M.H.; Anochi, J.A.; Santos, D.J. Assessing NOAA/GFDL Models Performance for South American Seasonal Climate: Insights from CMIP6 Historical Runs and Future Projections. Climate 2024, 13, 4, doi:10.3390/cli13010004. [CrossRef]
- Anochi, J.A.; de Almeida, V.A.; de Campos Velho, H.F. Machine Learning for Climate Precipitation Prediction Modeling over South America. Remote Sens. (Basel). 2021, 13, doi:10.3390/rs13132468. [CrossRef]
- Conti, S. Artificial Intelligence for Weather Forecasting. Nature Reviews Electrical Engineering 2024, 1, doi:10.1038/s44287-023-00009-2. [CrossRef]
- Chen, L.; Zhong, X.; Li, H.; Wu, J.; Lu, B.; Chen, D.; Xie, S.-P.; Wu, L.; Chao, Q.; Lin, C.; et al. A Machine Learning Model That Outperforms Conventional Global Subseasonal Forecast Models. Nat. Commun. 2024, 15, 6425, doi:10.1038/s41467-024-50714-1. [CrossRef]
- Anochi, J.A.; Shimizu, M.H. Precipitation Forecasting and Drought Monitoring in South America Using a Machine Learning Approach. Meteorology 2024, 4, 1, doi:10.3390/meteorology4010001. [CrossRef]
- IBGE Divisão Regional Do Brasil Em Mesorregioes e Microrregiões Geográficas. J. Chem. Inf. Model. 1990, I.
- Amante, C.; Eakins, B. Etopo1. NOAA Technical Memorandum NESDIS NGDC-24 2009.
- Rozante, J.R.; Gutierrez, E.R.; Fernandes, A. de A.; Vila, D.A. Performance of Precipitation Products Obtained from Combinations of Satellite and Surface Observations. Int. J. Remote Sens. 2020, 41, doi:10.1080/01431161.2020.1763504. [CrossRef]
- Rozante, J.R.; Moreira, D.S.; de Goncalves, L.G.G.; Vila, D.A. Combining TRMM and Surface Observations of Precipitation: Technique and Validation over South America. Weather Forecast. 2010, 25, doi:10.1175/2010WAF2222325.1. [CrossRef]
- Zabinsky, Z.B. Random Search Algorithms. In Wiley Encyclopedia of Operations Research and Management Science; 2010.
- Gleckler, P.J.; Taylor, K.E.; Doutriaux, C. Performance Metrics for Climate Models. Journal of Geophysical Research: Atmospheres 2008, 113, doi:10.1029/2007JD008972. [CrossRef]
- Monego, V.S.; Anochi, J.A.; de Campos Velho, H.F. South America Seasonal Precipitation Prediction by Gradient-Boosting Machine-Learning Approach. Atmosphere (Basel). 2022, 13, doi:10.3390/atmos13020243. [CrossRef]
- Yanting, D.; Boxian, W.; Qiwei, Y.; Shuaitao, R.; Fen, Y.; Lei, S. High-Resolution Climate Prediction in Mountainous Terrain Using a ConvLSTM-XGBoost Hybrid Model with Dynamic Bayesian Weighting. Sci. Rep. 2025, 15, doi:10.1038/s41598-025-20882-1. [CrossRef]
- Materia, S.; García, L.P.; van Straaten, C.; O, S.; Mamalakis, A.; Cavicchia, L.; Coumou, D.; de Luca, P.; Kretschmer, M.; Donat, M. Artificial Intelligence for Climate Prediction of Extremes: State of the Art, Challenges, and Future Perspectives. WIREs Climate Change 2024, 15, doi:10.1002/wcc.914. [CrossRef]
Figure 1.
(a) Mesoregions of the state of Minas Gerais according to the Brazilian Institute of Geography and Statistics [28]. (b) Topography of the State of Minas Gerais in meters based on ETOPO 2022 topography data with a spatial resolution of 0.0167° x 0.0167° [29].
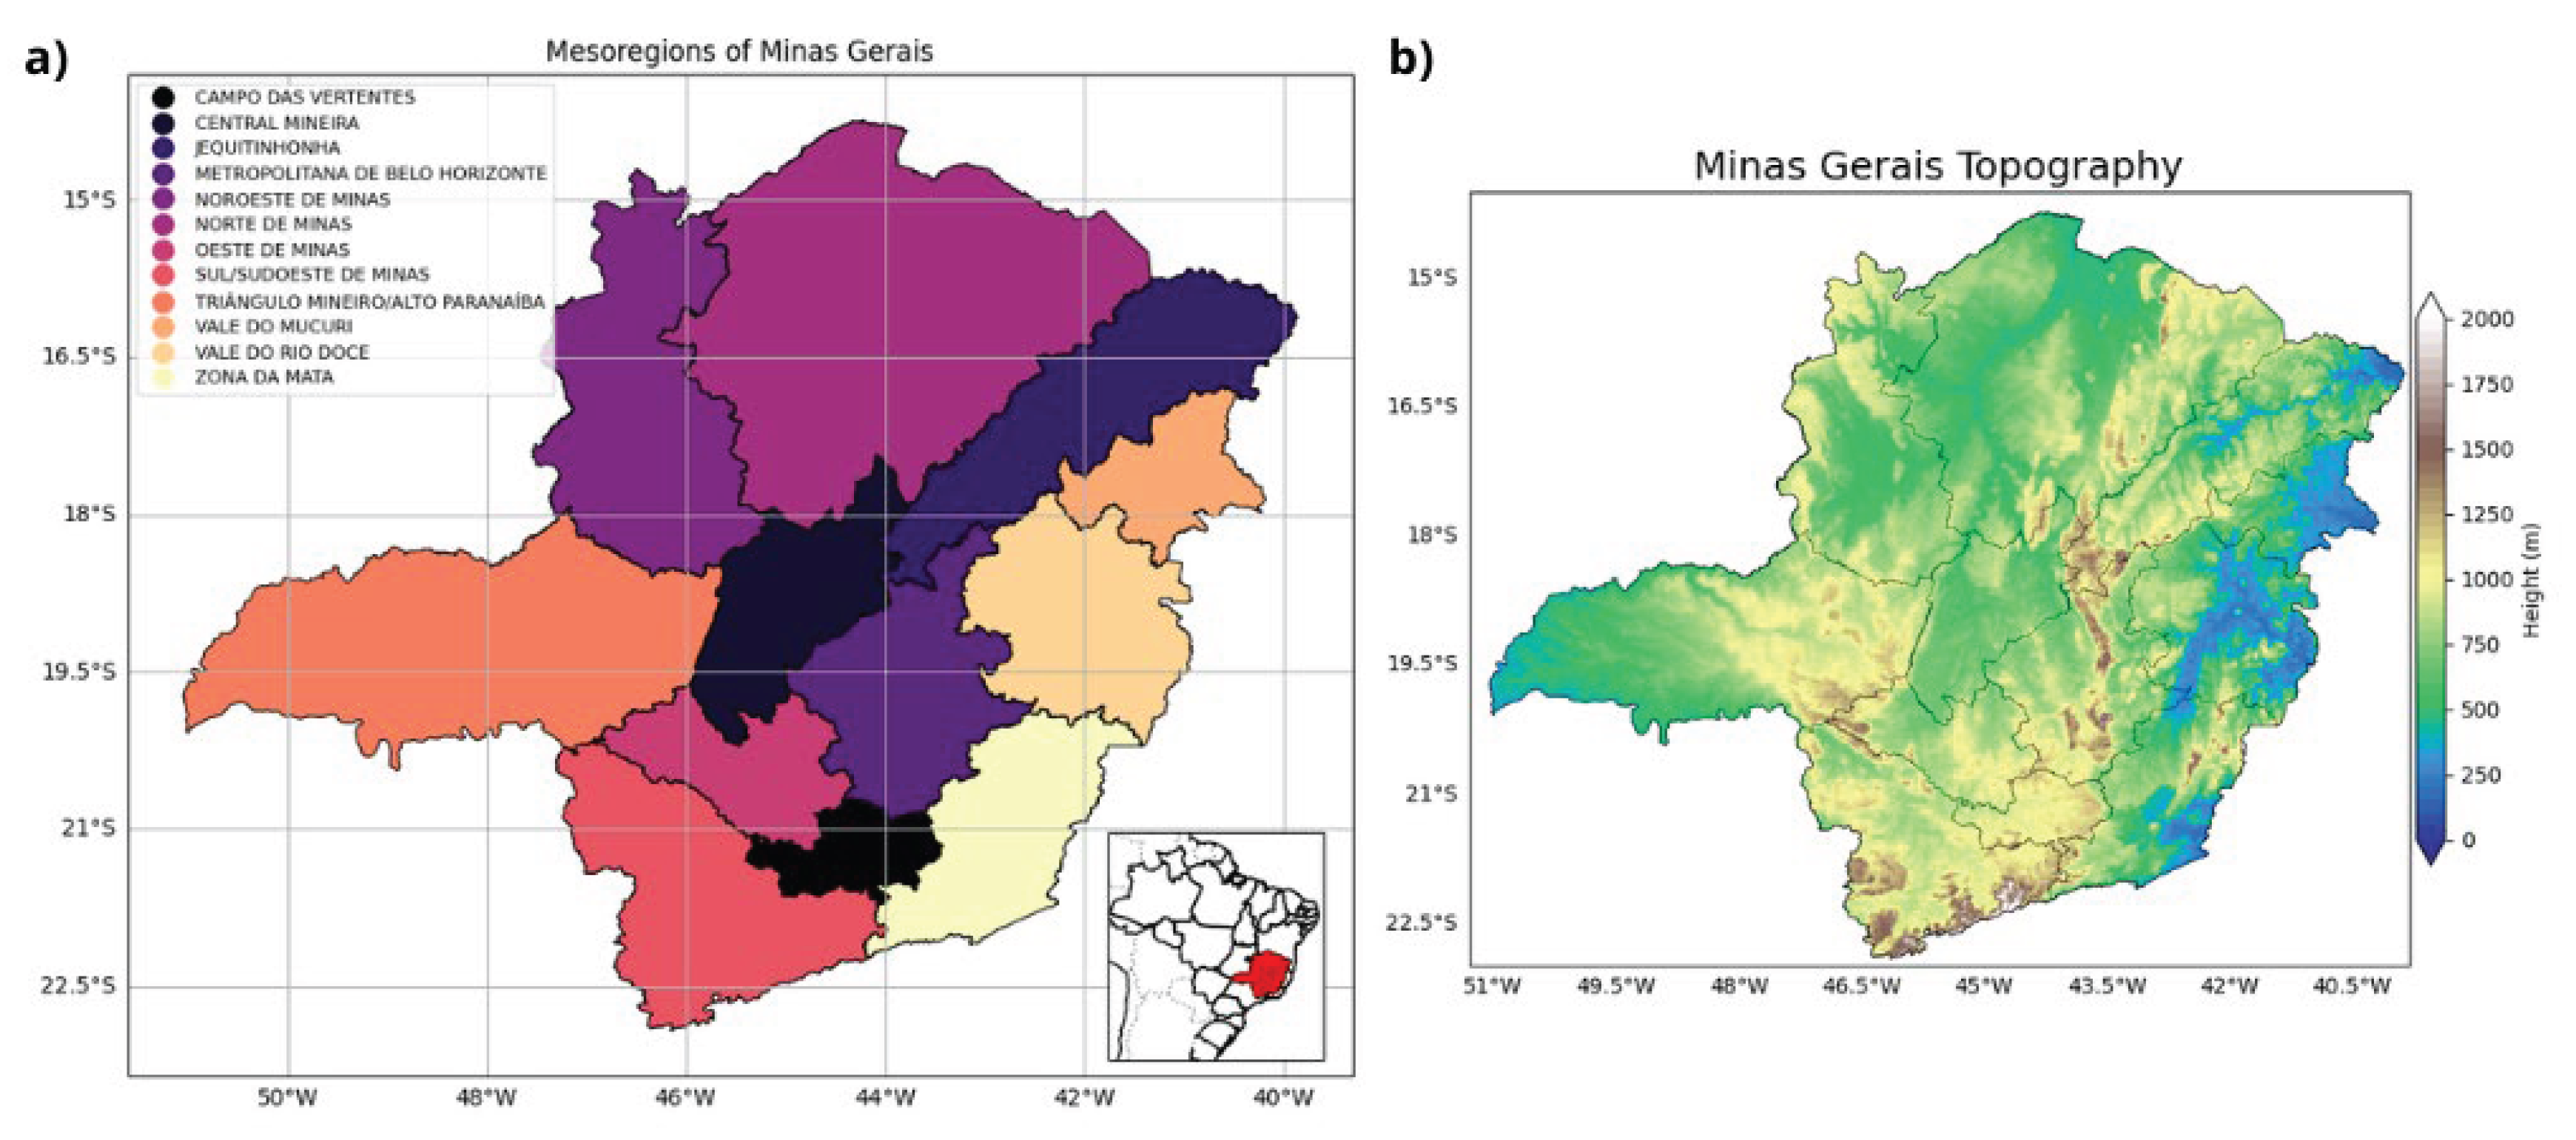
Figure 2.
Climatological precipitation (1998-2022) from MERGE dataset for Austral (a) Summer (December-January, February, DJF); (b) Autumn (March-April-May, MAM); (c) Winter (June-July-August, JJA); (d) Spring (September-October-November, SON).
Figure 2.
Climatological precipitation (1998-2022) from MERGE dataset for Austral (a) Summer (December-January, February, DJF); (b) Autumn (March-April-May, MAM); (c) Winter (June-July-August, JJA); (d) Spring (September-October-November, SON).
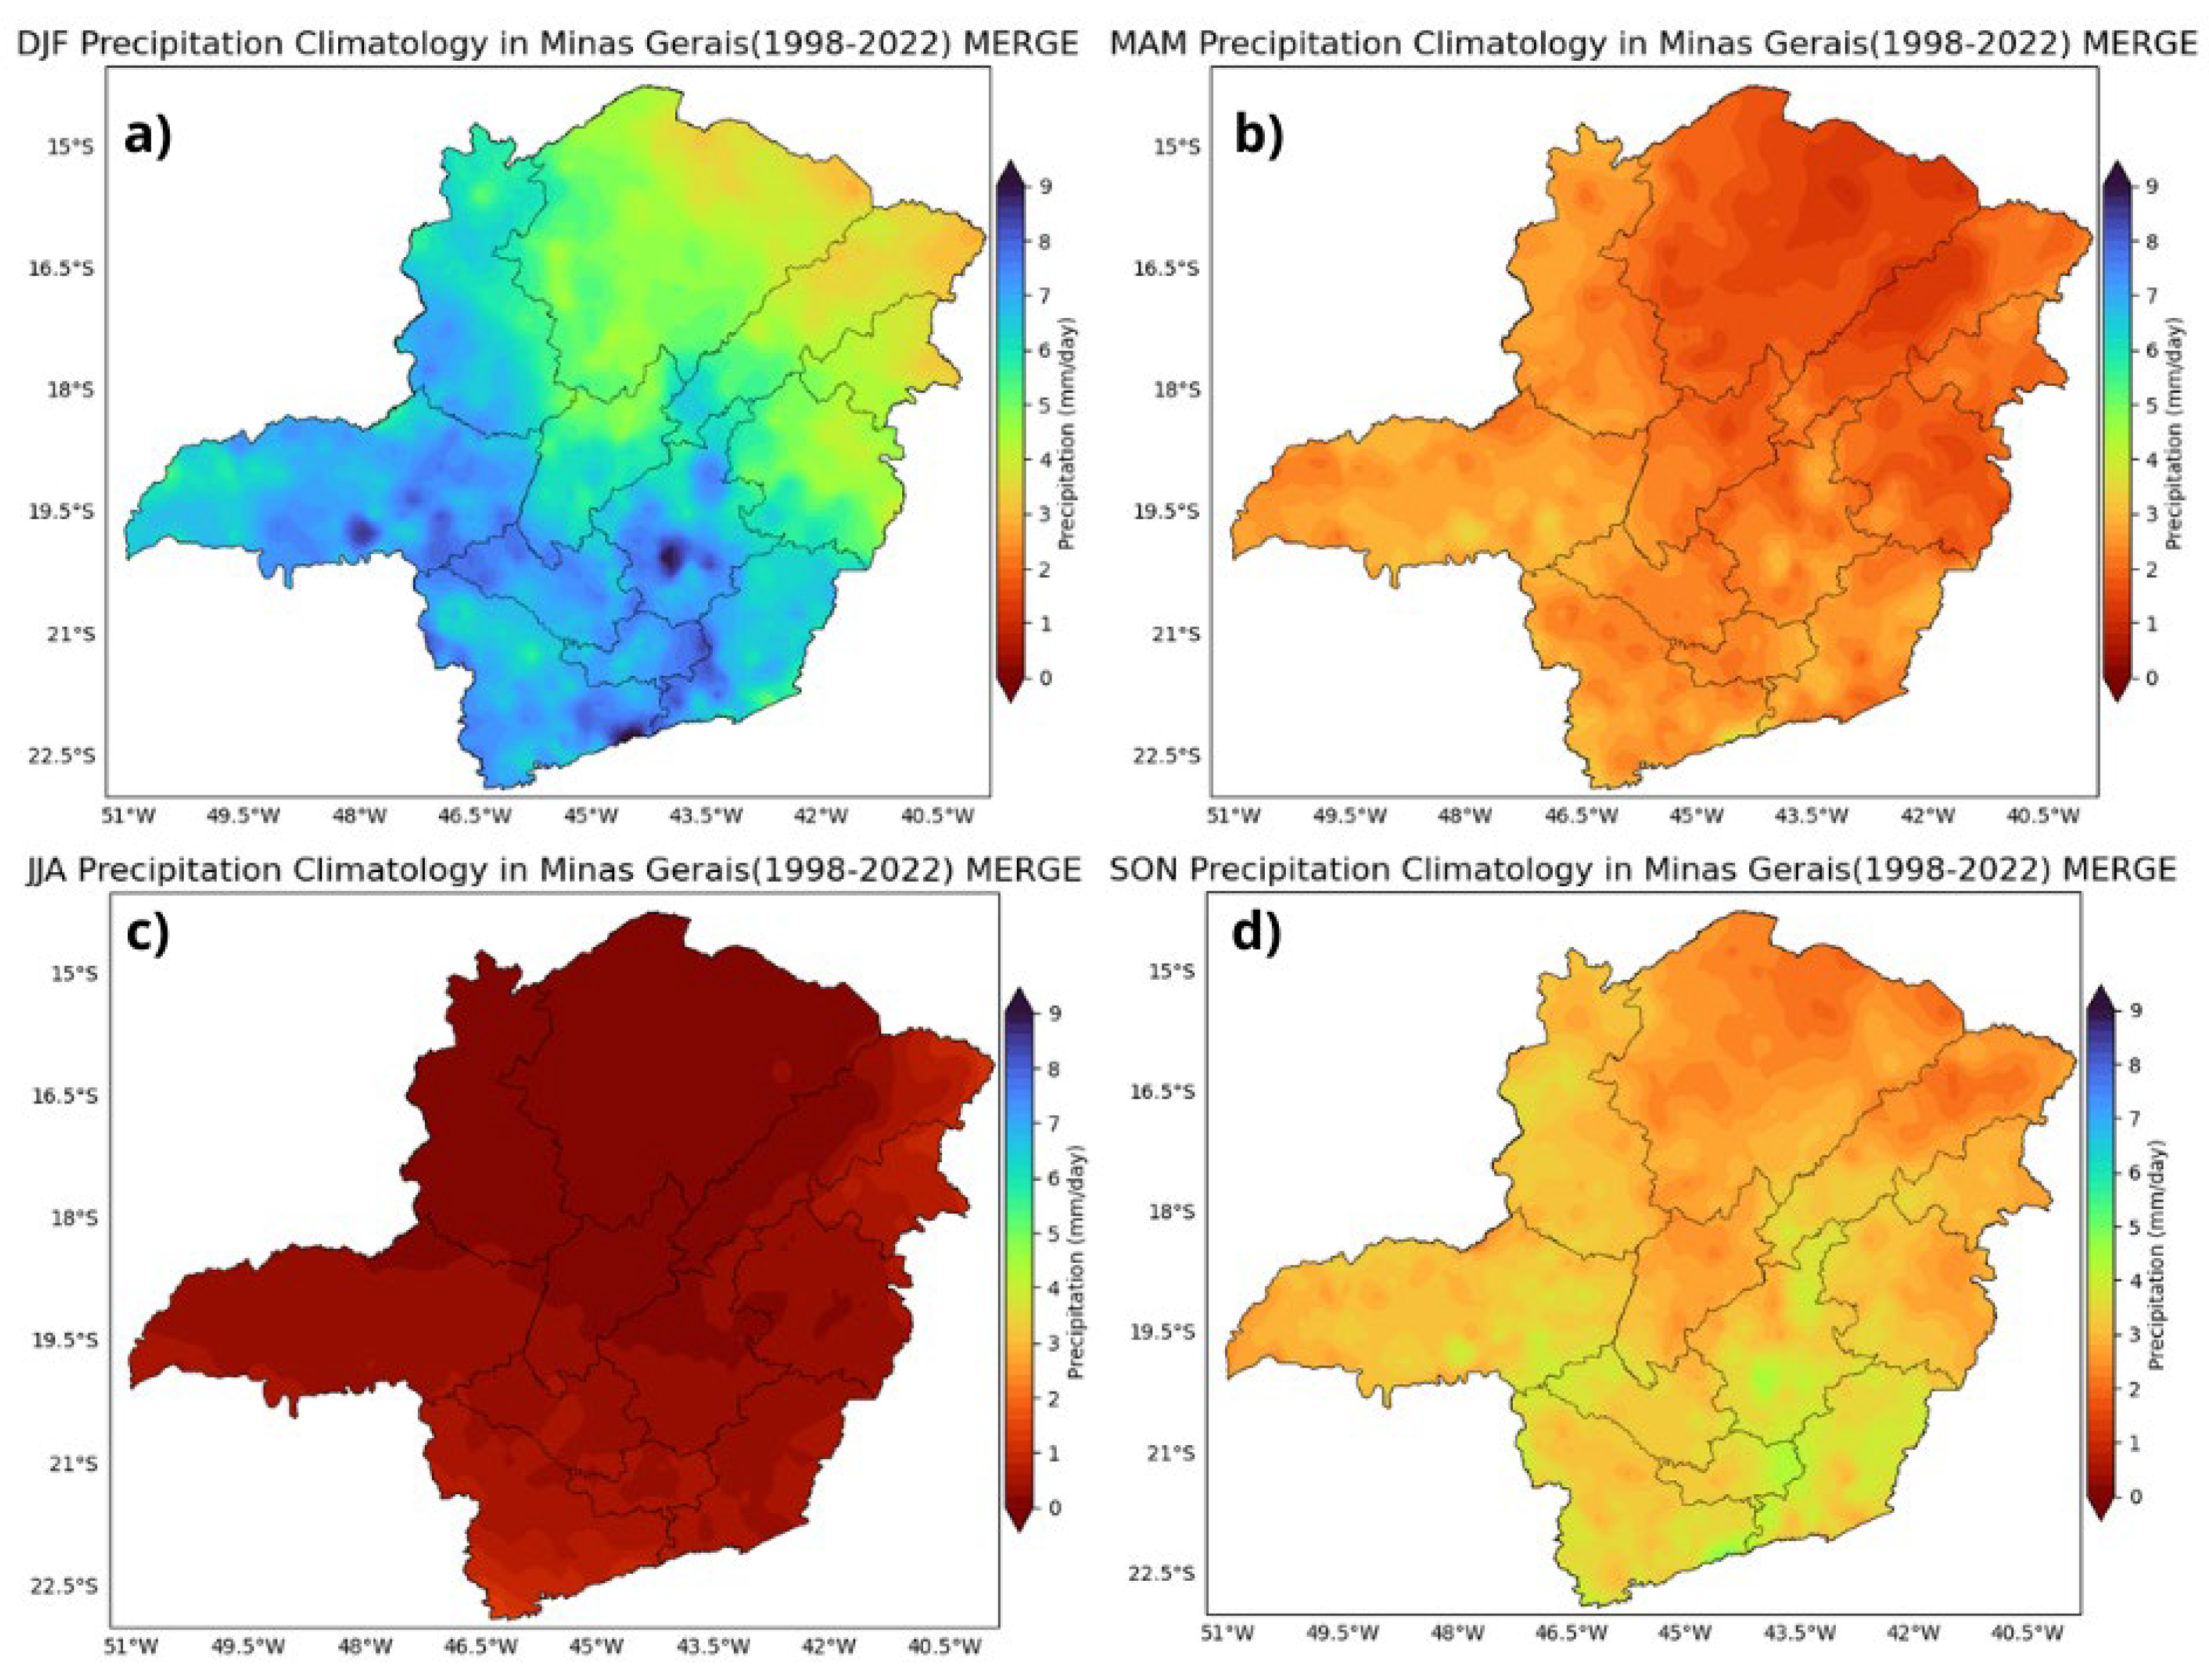
Figure 3.
Conceptual diagram of the ensemble technique. Input data are processed in multiple runs, generating independent forecasts. These forecasts are then combined, usually by averaging, to produce the final ensemble prediction, which reduces random errors and provides a more robust estimate.
Figure 3.
Conceptual diagram of the ensemble technique. Input data are processed in multiple runs, generating independent forecasts. These forecasts are then combined, usually by averaging, to produce the final ensemble prediction, which reduces random errors and provides a more robust estimate.
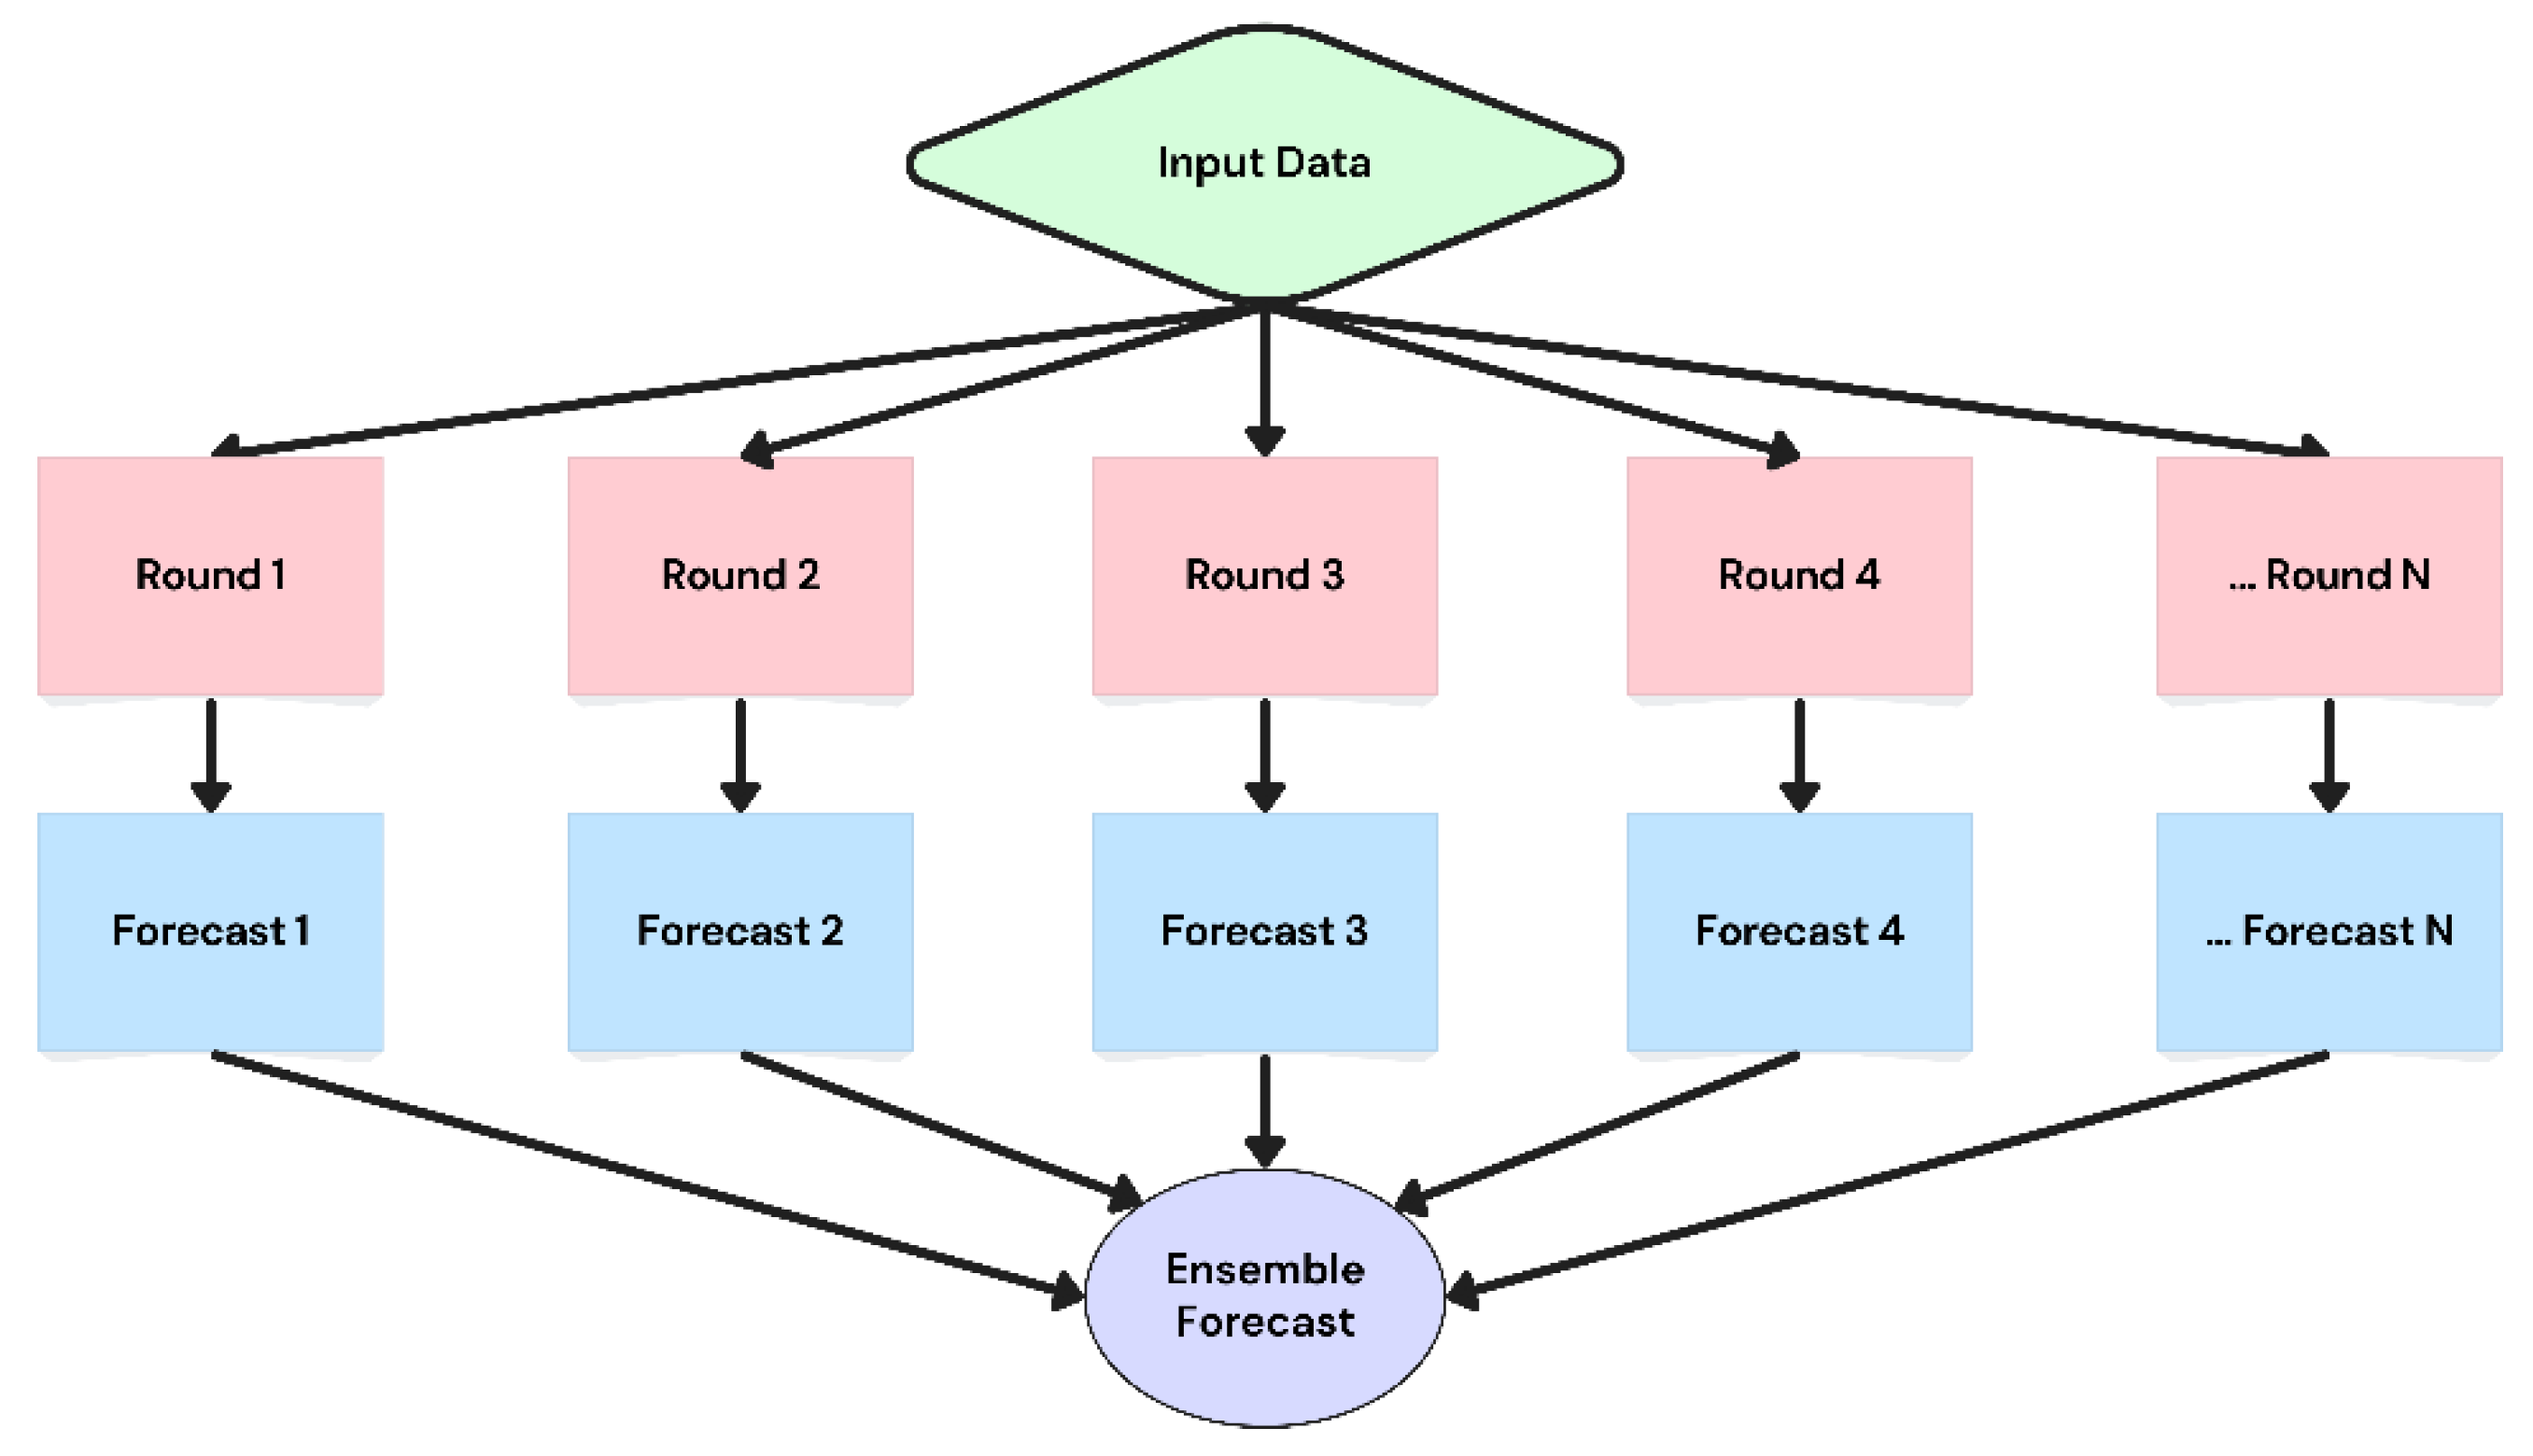
Figure 4.
Seasonal precipitation anomalies for 2024 relative to the 1998–2022 period derived from the MERGE dataset: (a) DJF, (b) MAM, (c) JJA, and (d) SON.
Figure 4.
Seasonal precipitation anomalies for 2024 relative to the 1998–2022 period derived from the MERGE dataset: (a) DJF, (b) MAM, (c) JJA, and (d) SON.
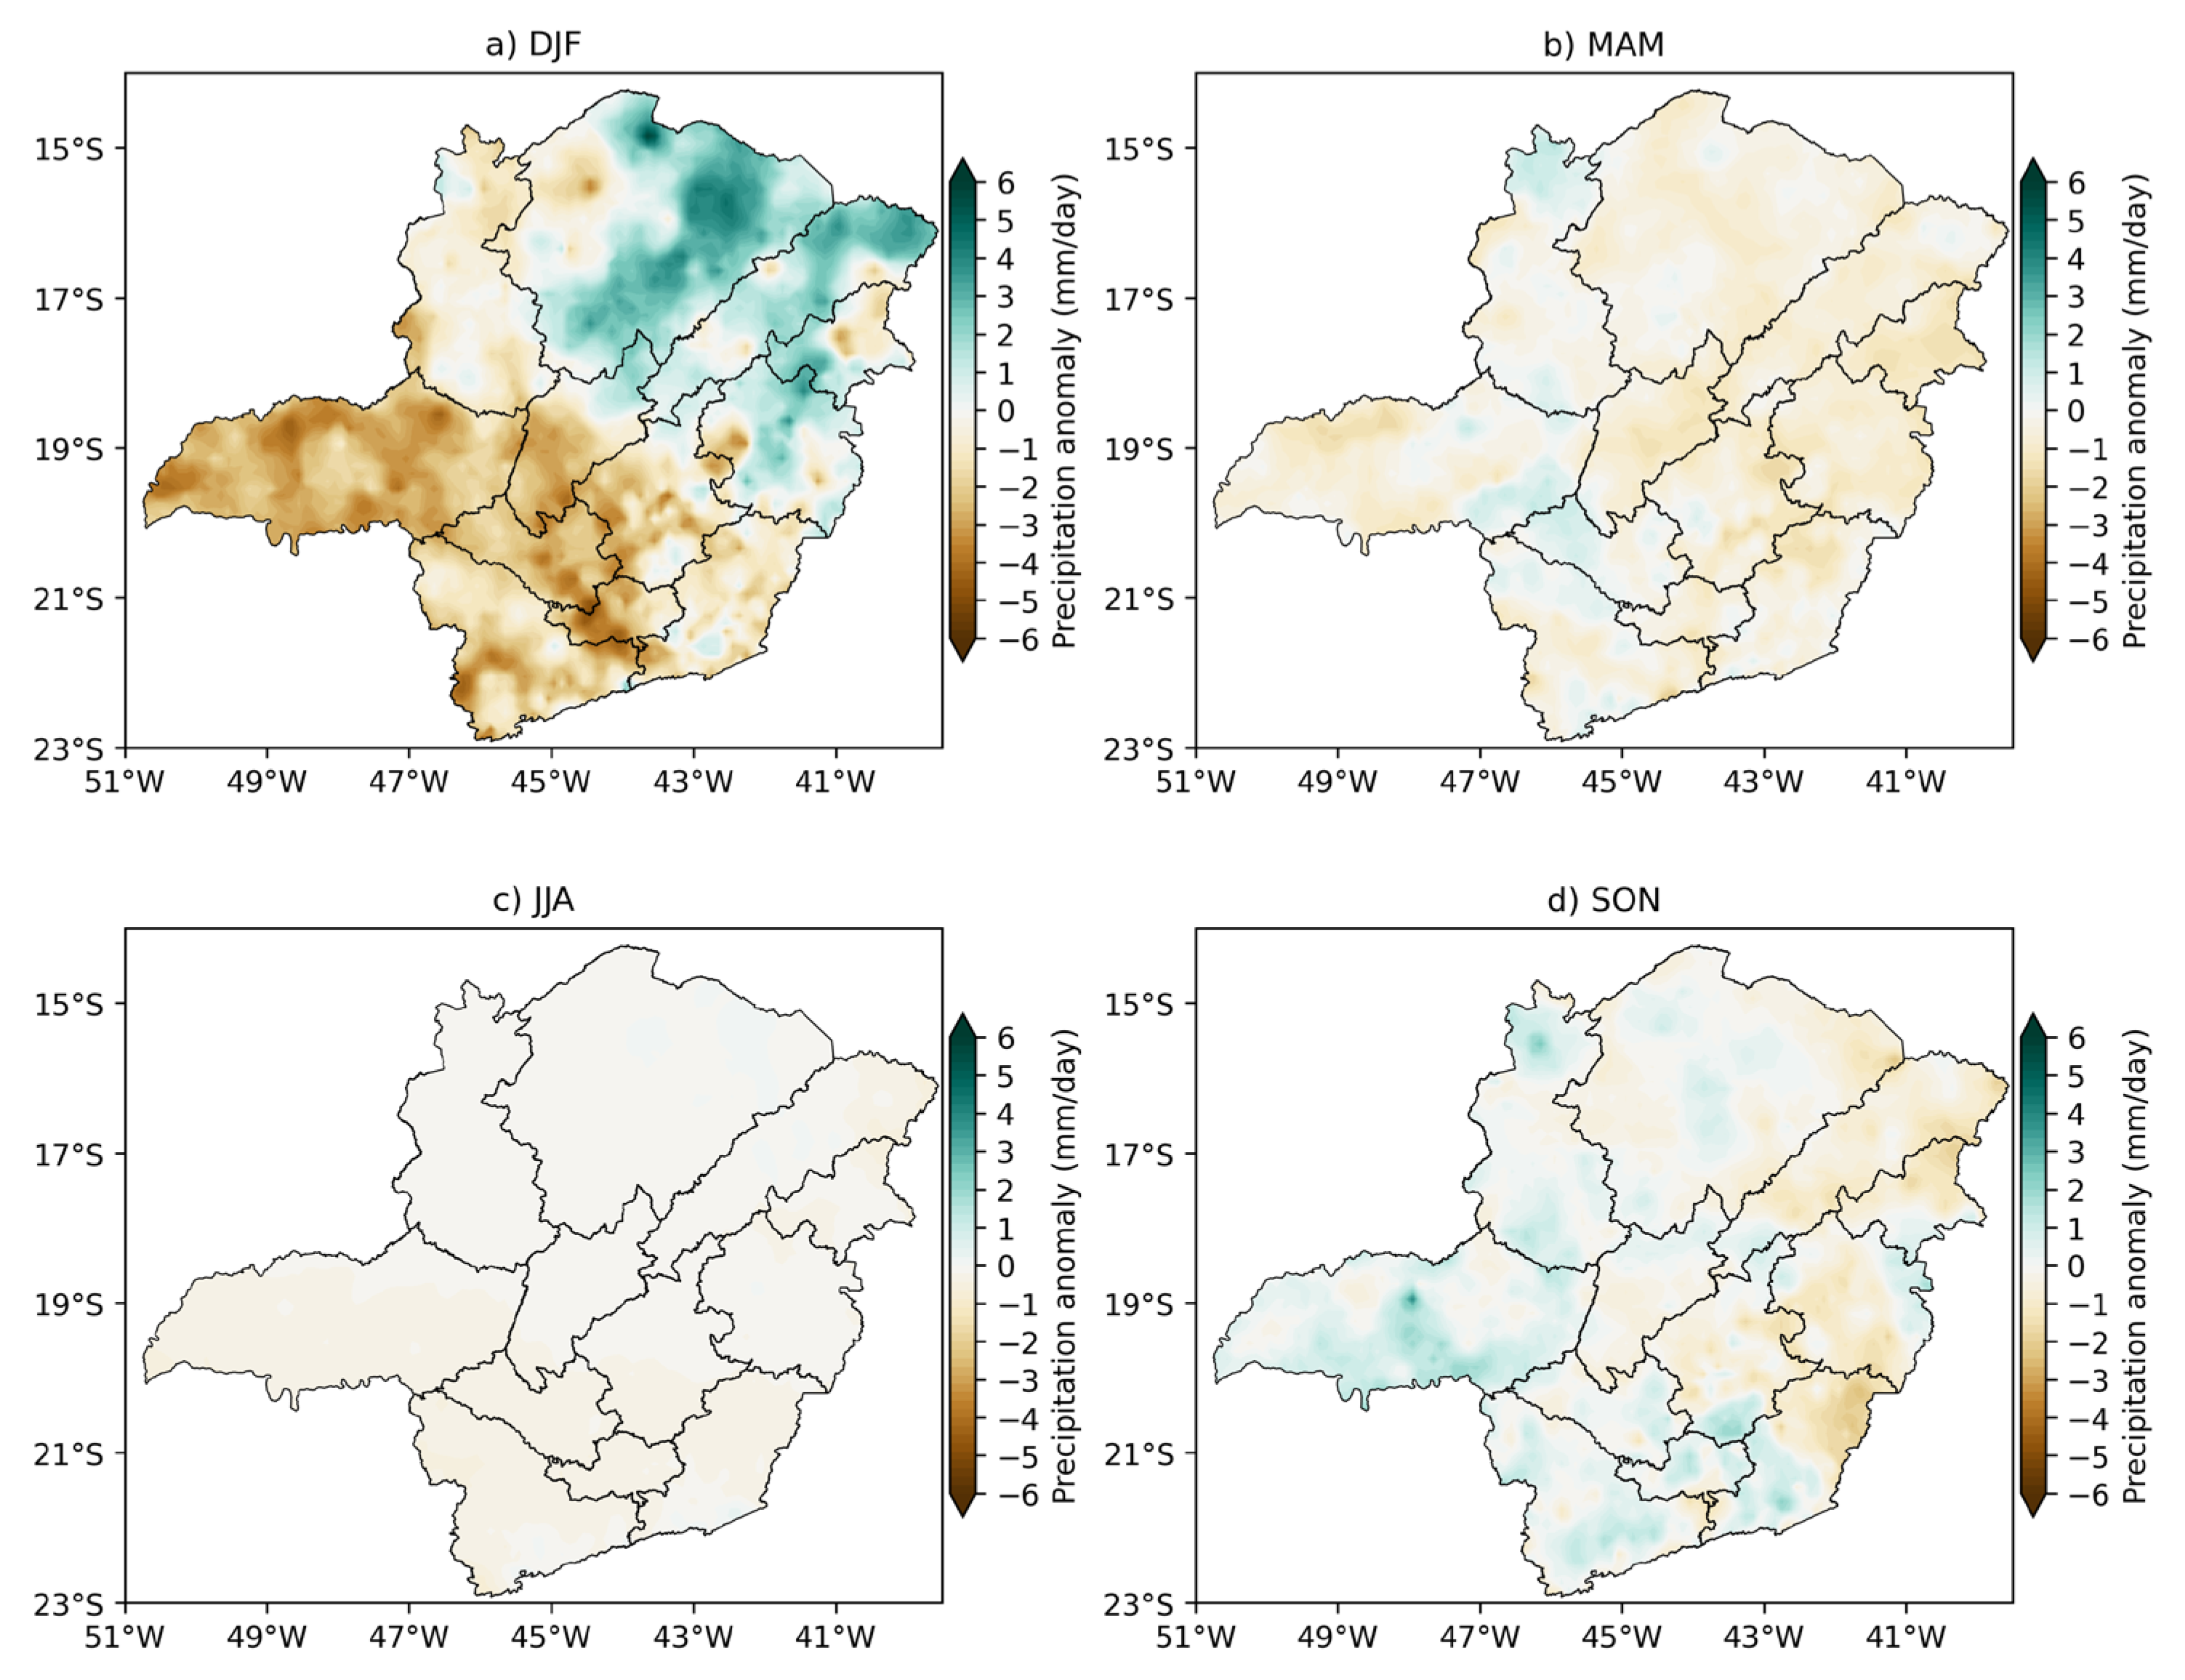
Figure 5.
Seasonal precipitation forecasts generated by the AI ensemble model for 2024 and corresponding observed precipitation over Minas Gerais. Panels (a–d) show the AI-based forecasts for (a) DJF, (b) MAM, (c) JJA, and (d) SON. Panels (e–h) present the observed precipitation fields for the same seasons derived from the MERGE dataset.
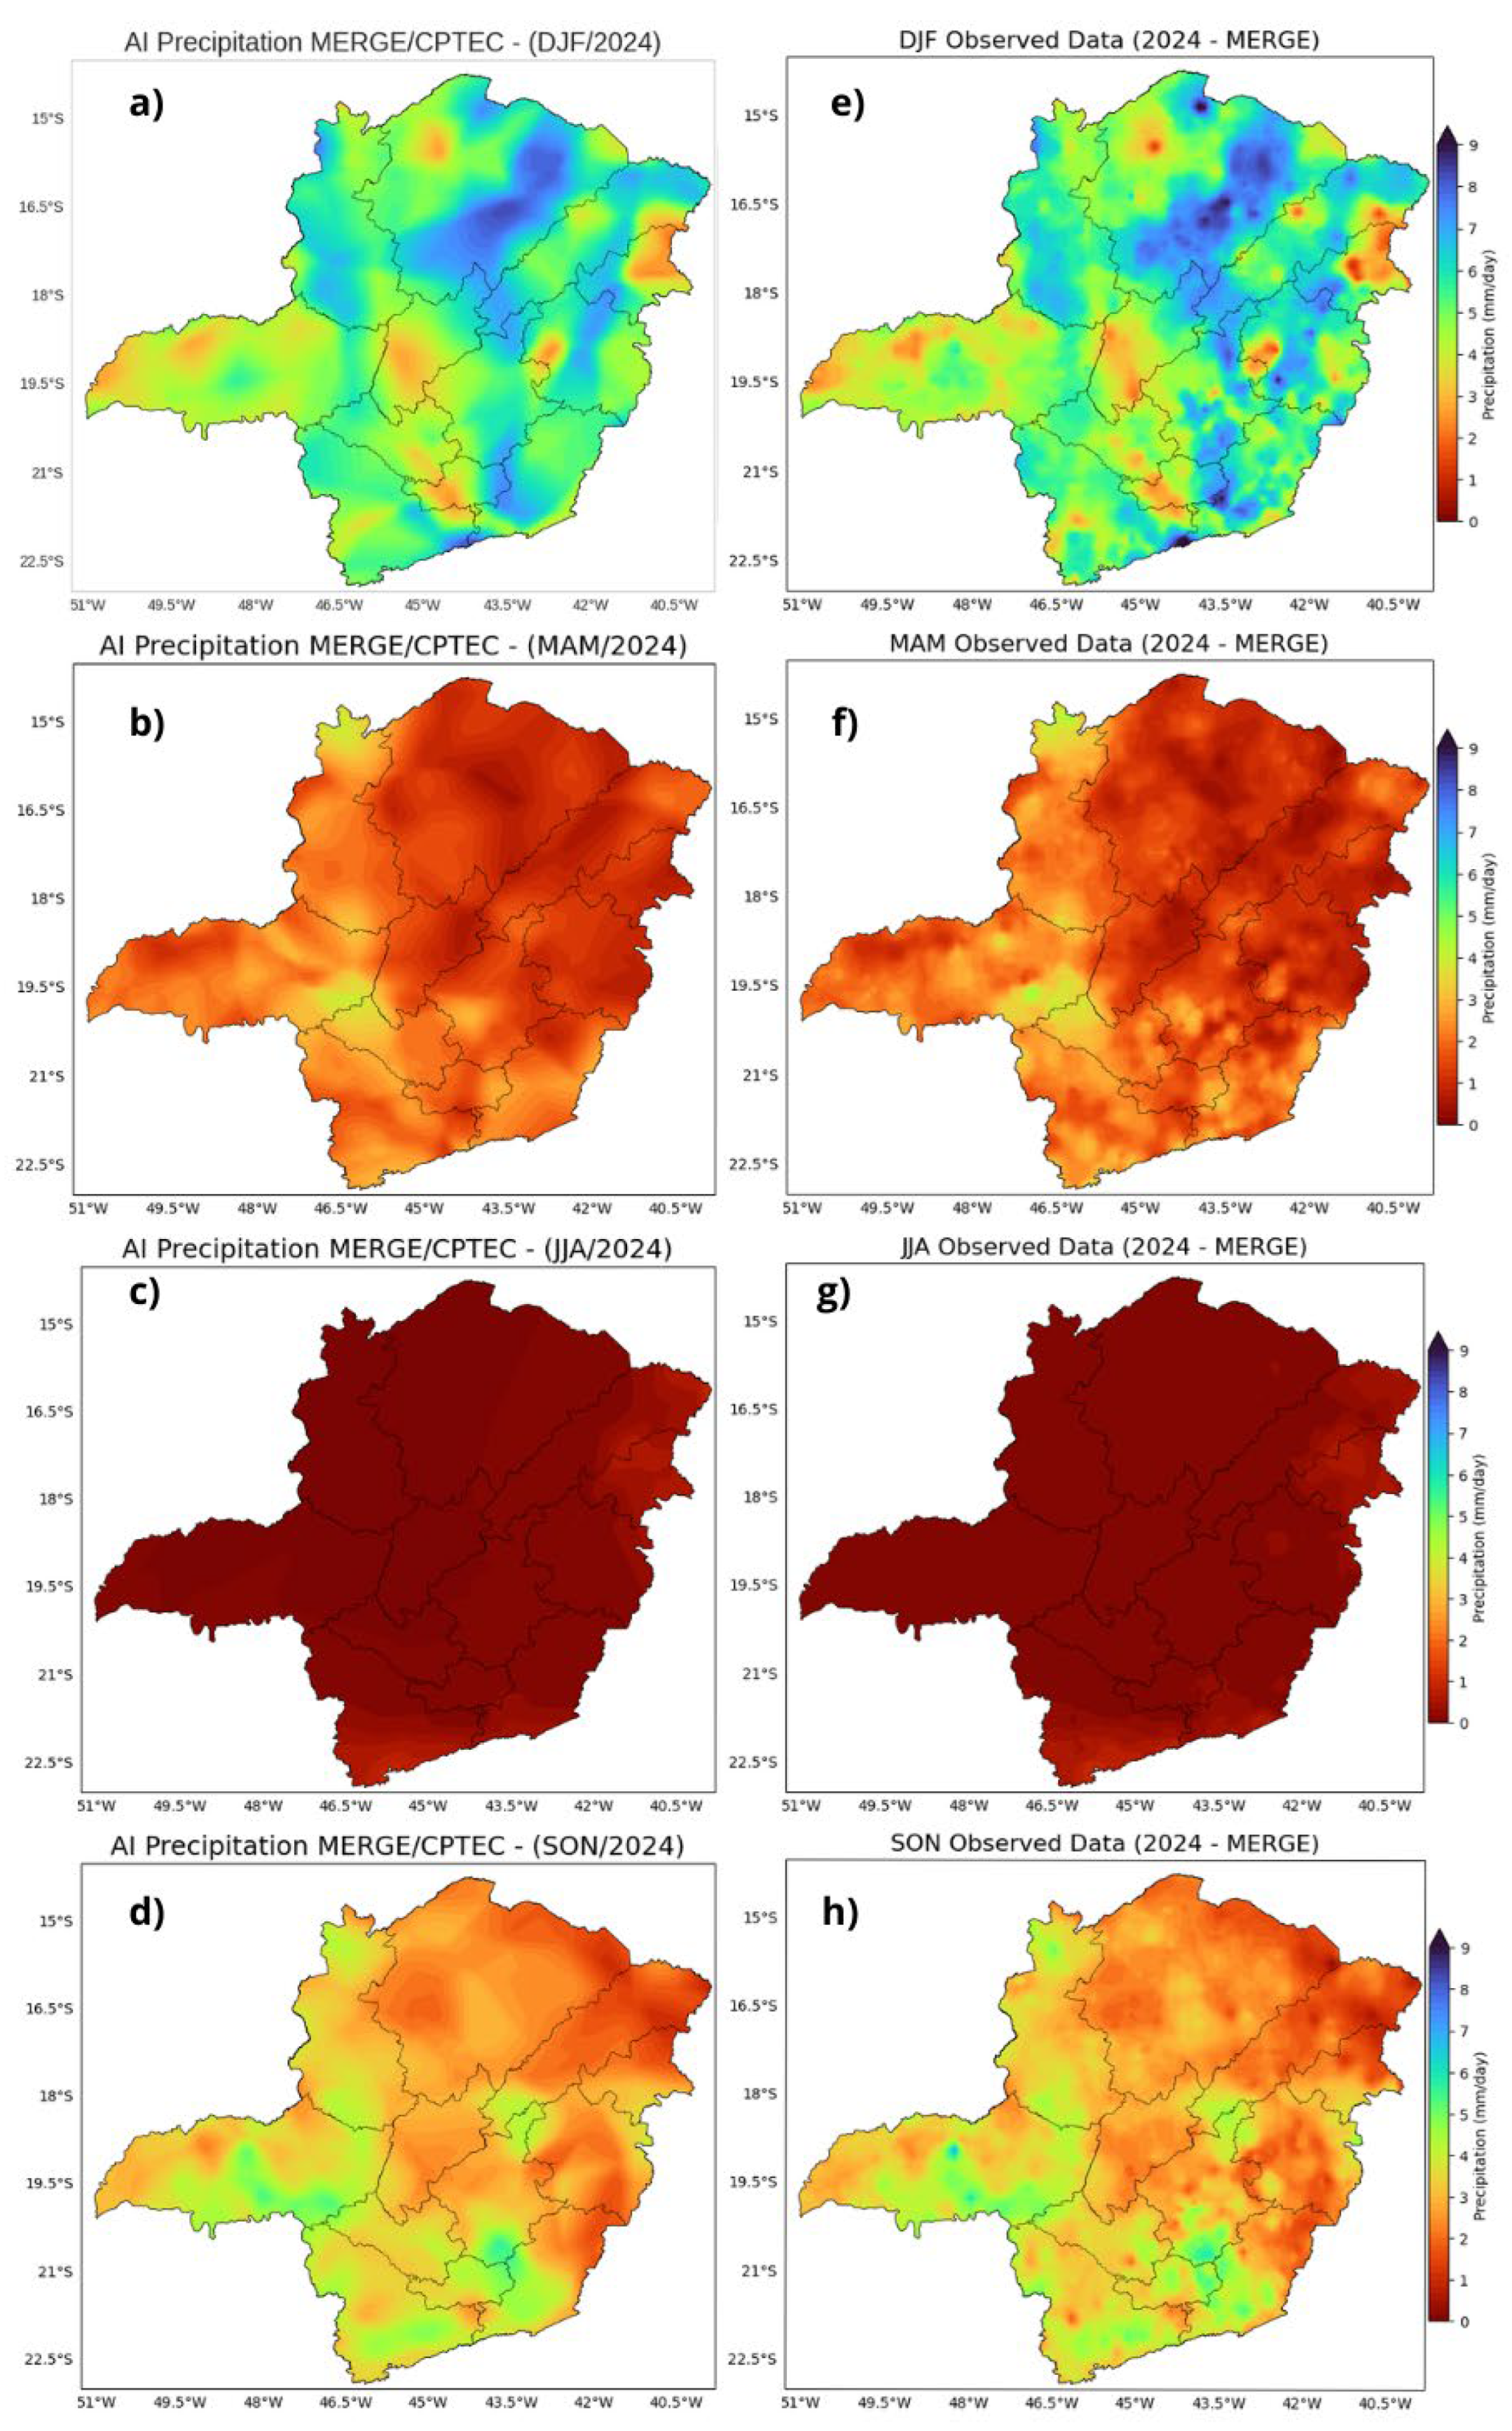
Figure 6.
Spatial distribution of RMSE for the AI seasonal precipitation forecasts in 2024: (a) DJF, (b) MAM, (c) JJA, and (d) SON.
Figure 6.
Spatial distribution of RMSE for the AI seasonal precipitation forecasts in 2024: (a) DJF, (b) MAM, (c) JJA, and (d) SON.
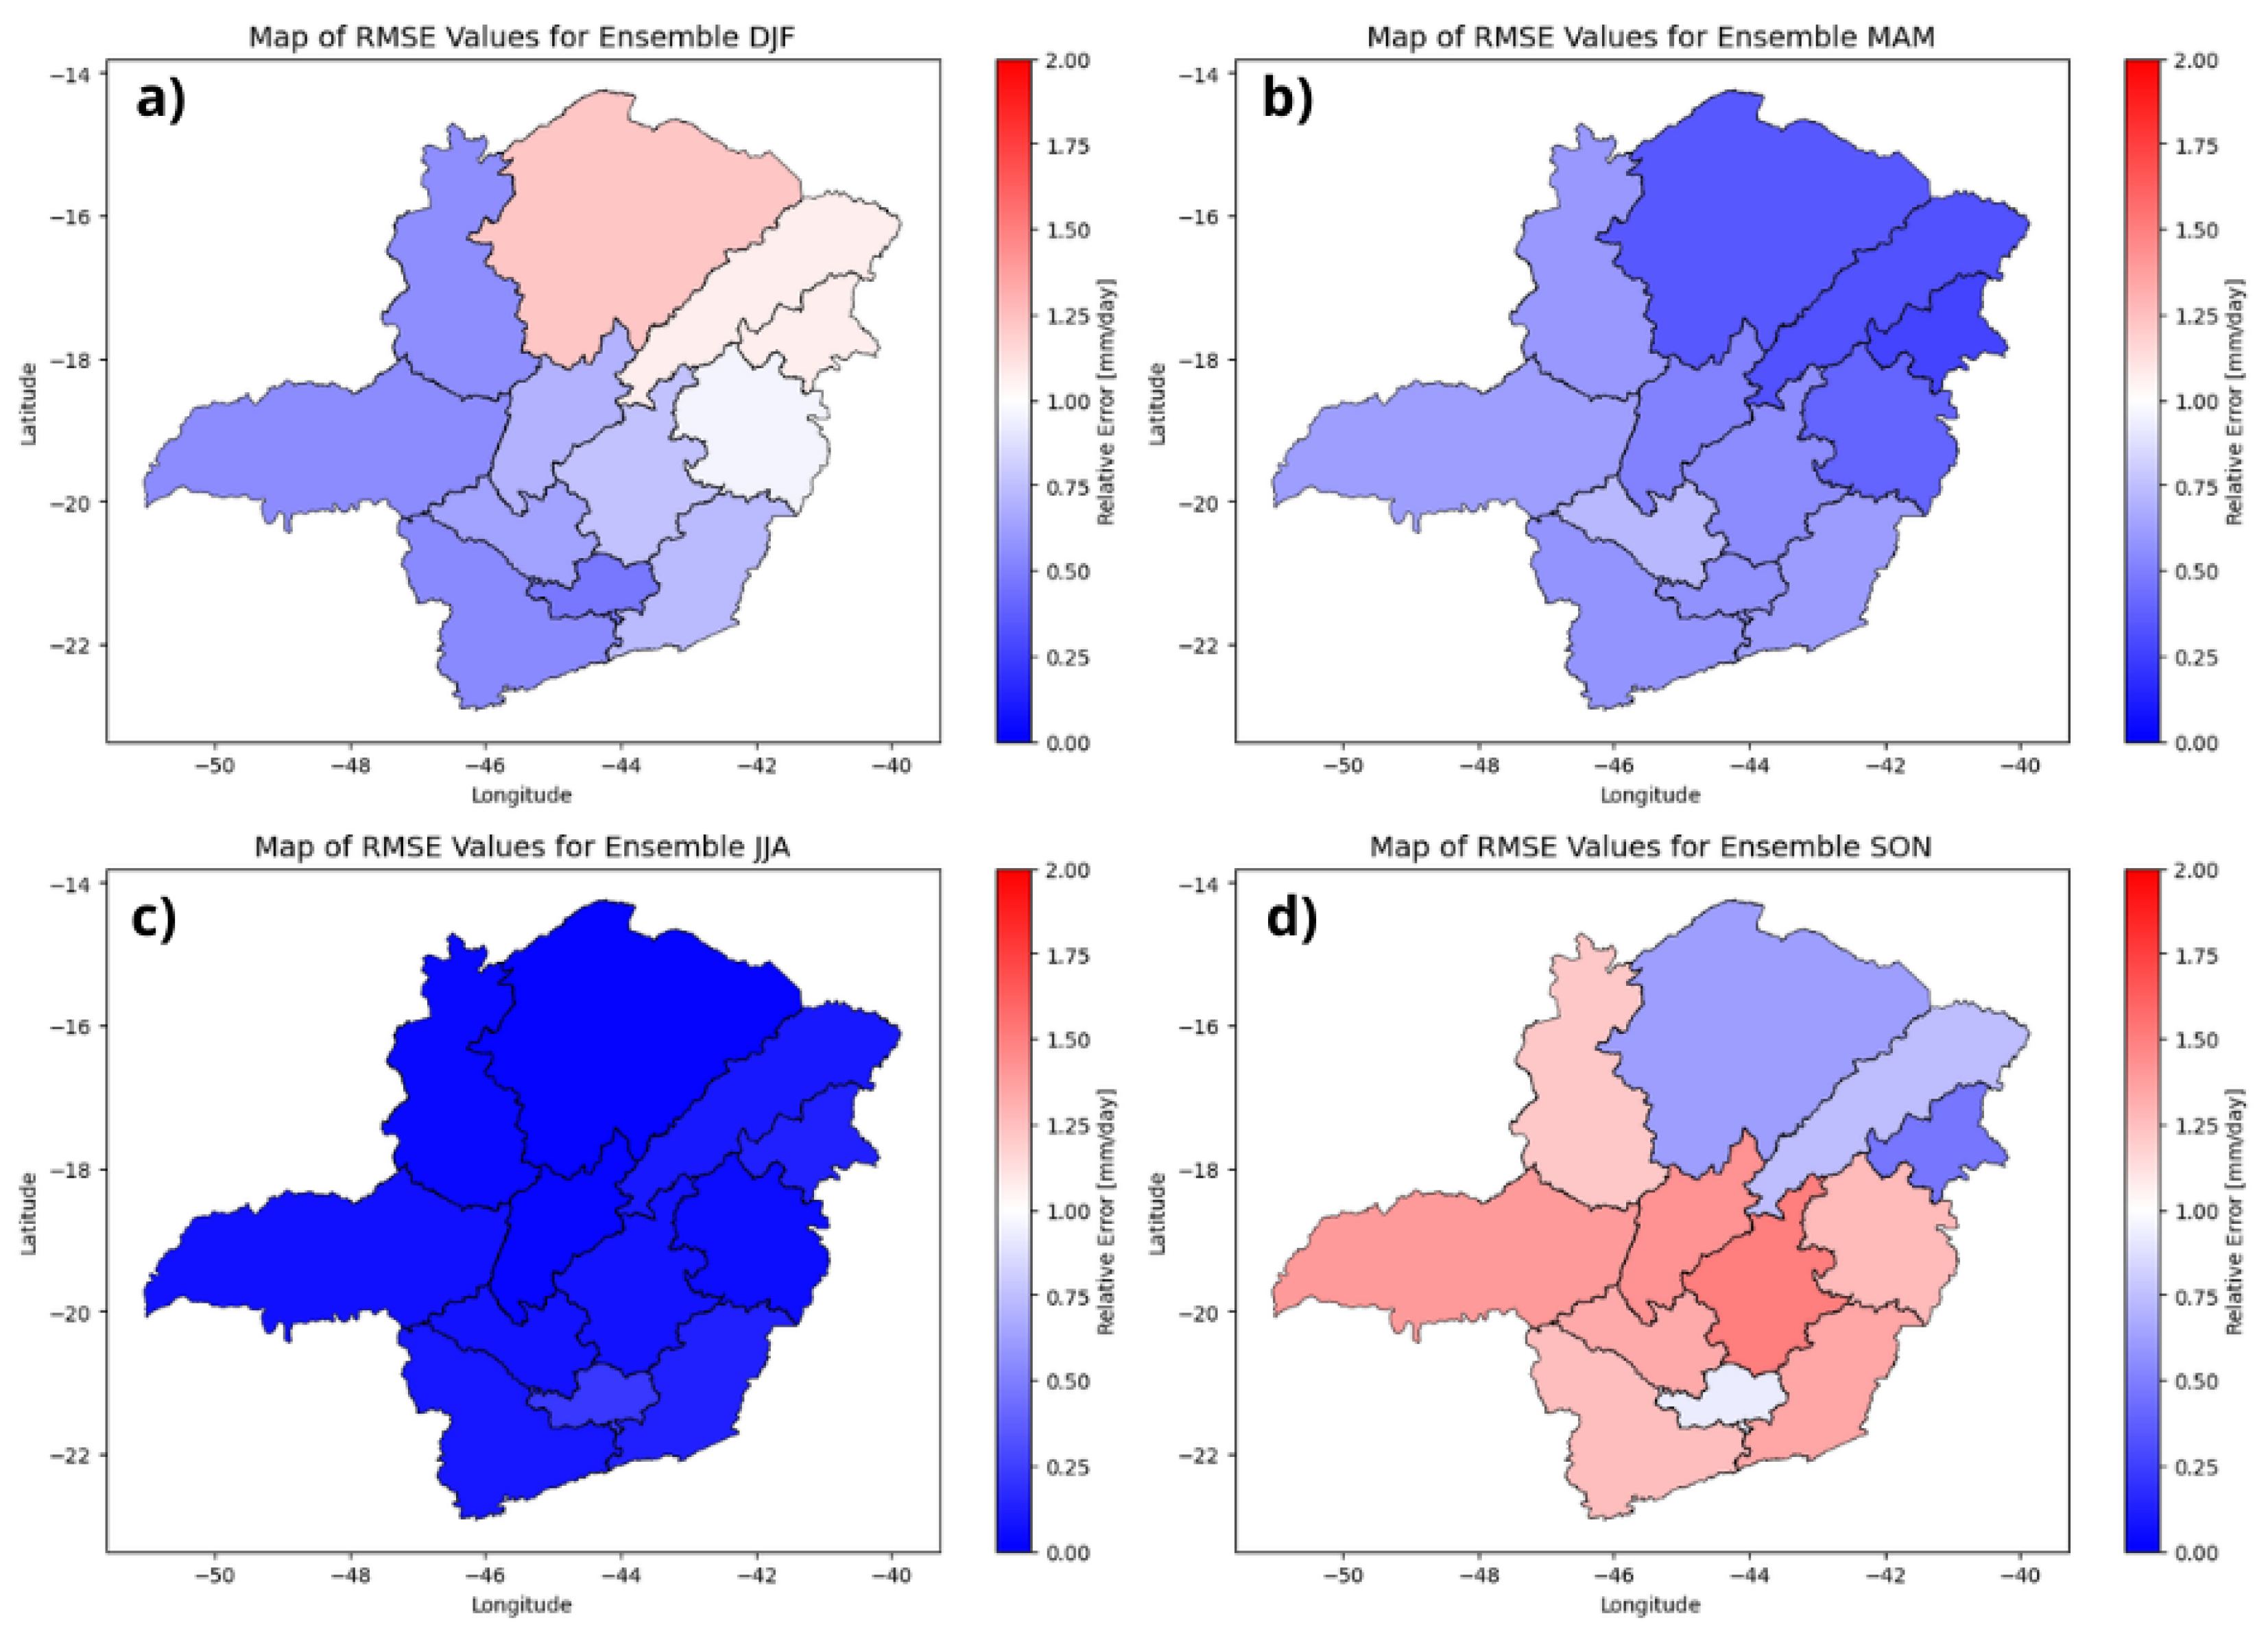
Figure 7.
Seasonal precipitation forecasts generated by the NCEP-CFSv2 model from NMME for 2024 over Minas Gerais.
Figure 7.
Seasonal precipitation forecasts generated by the NCEP-CFSv2 model from NMME for 2024 over Minas Gerais.
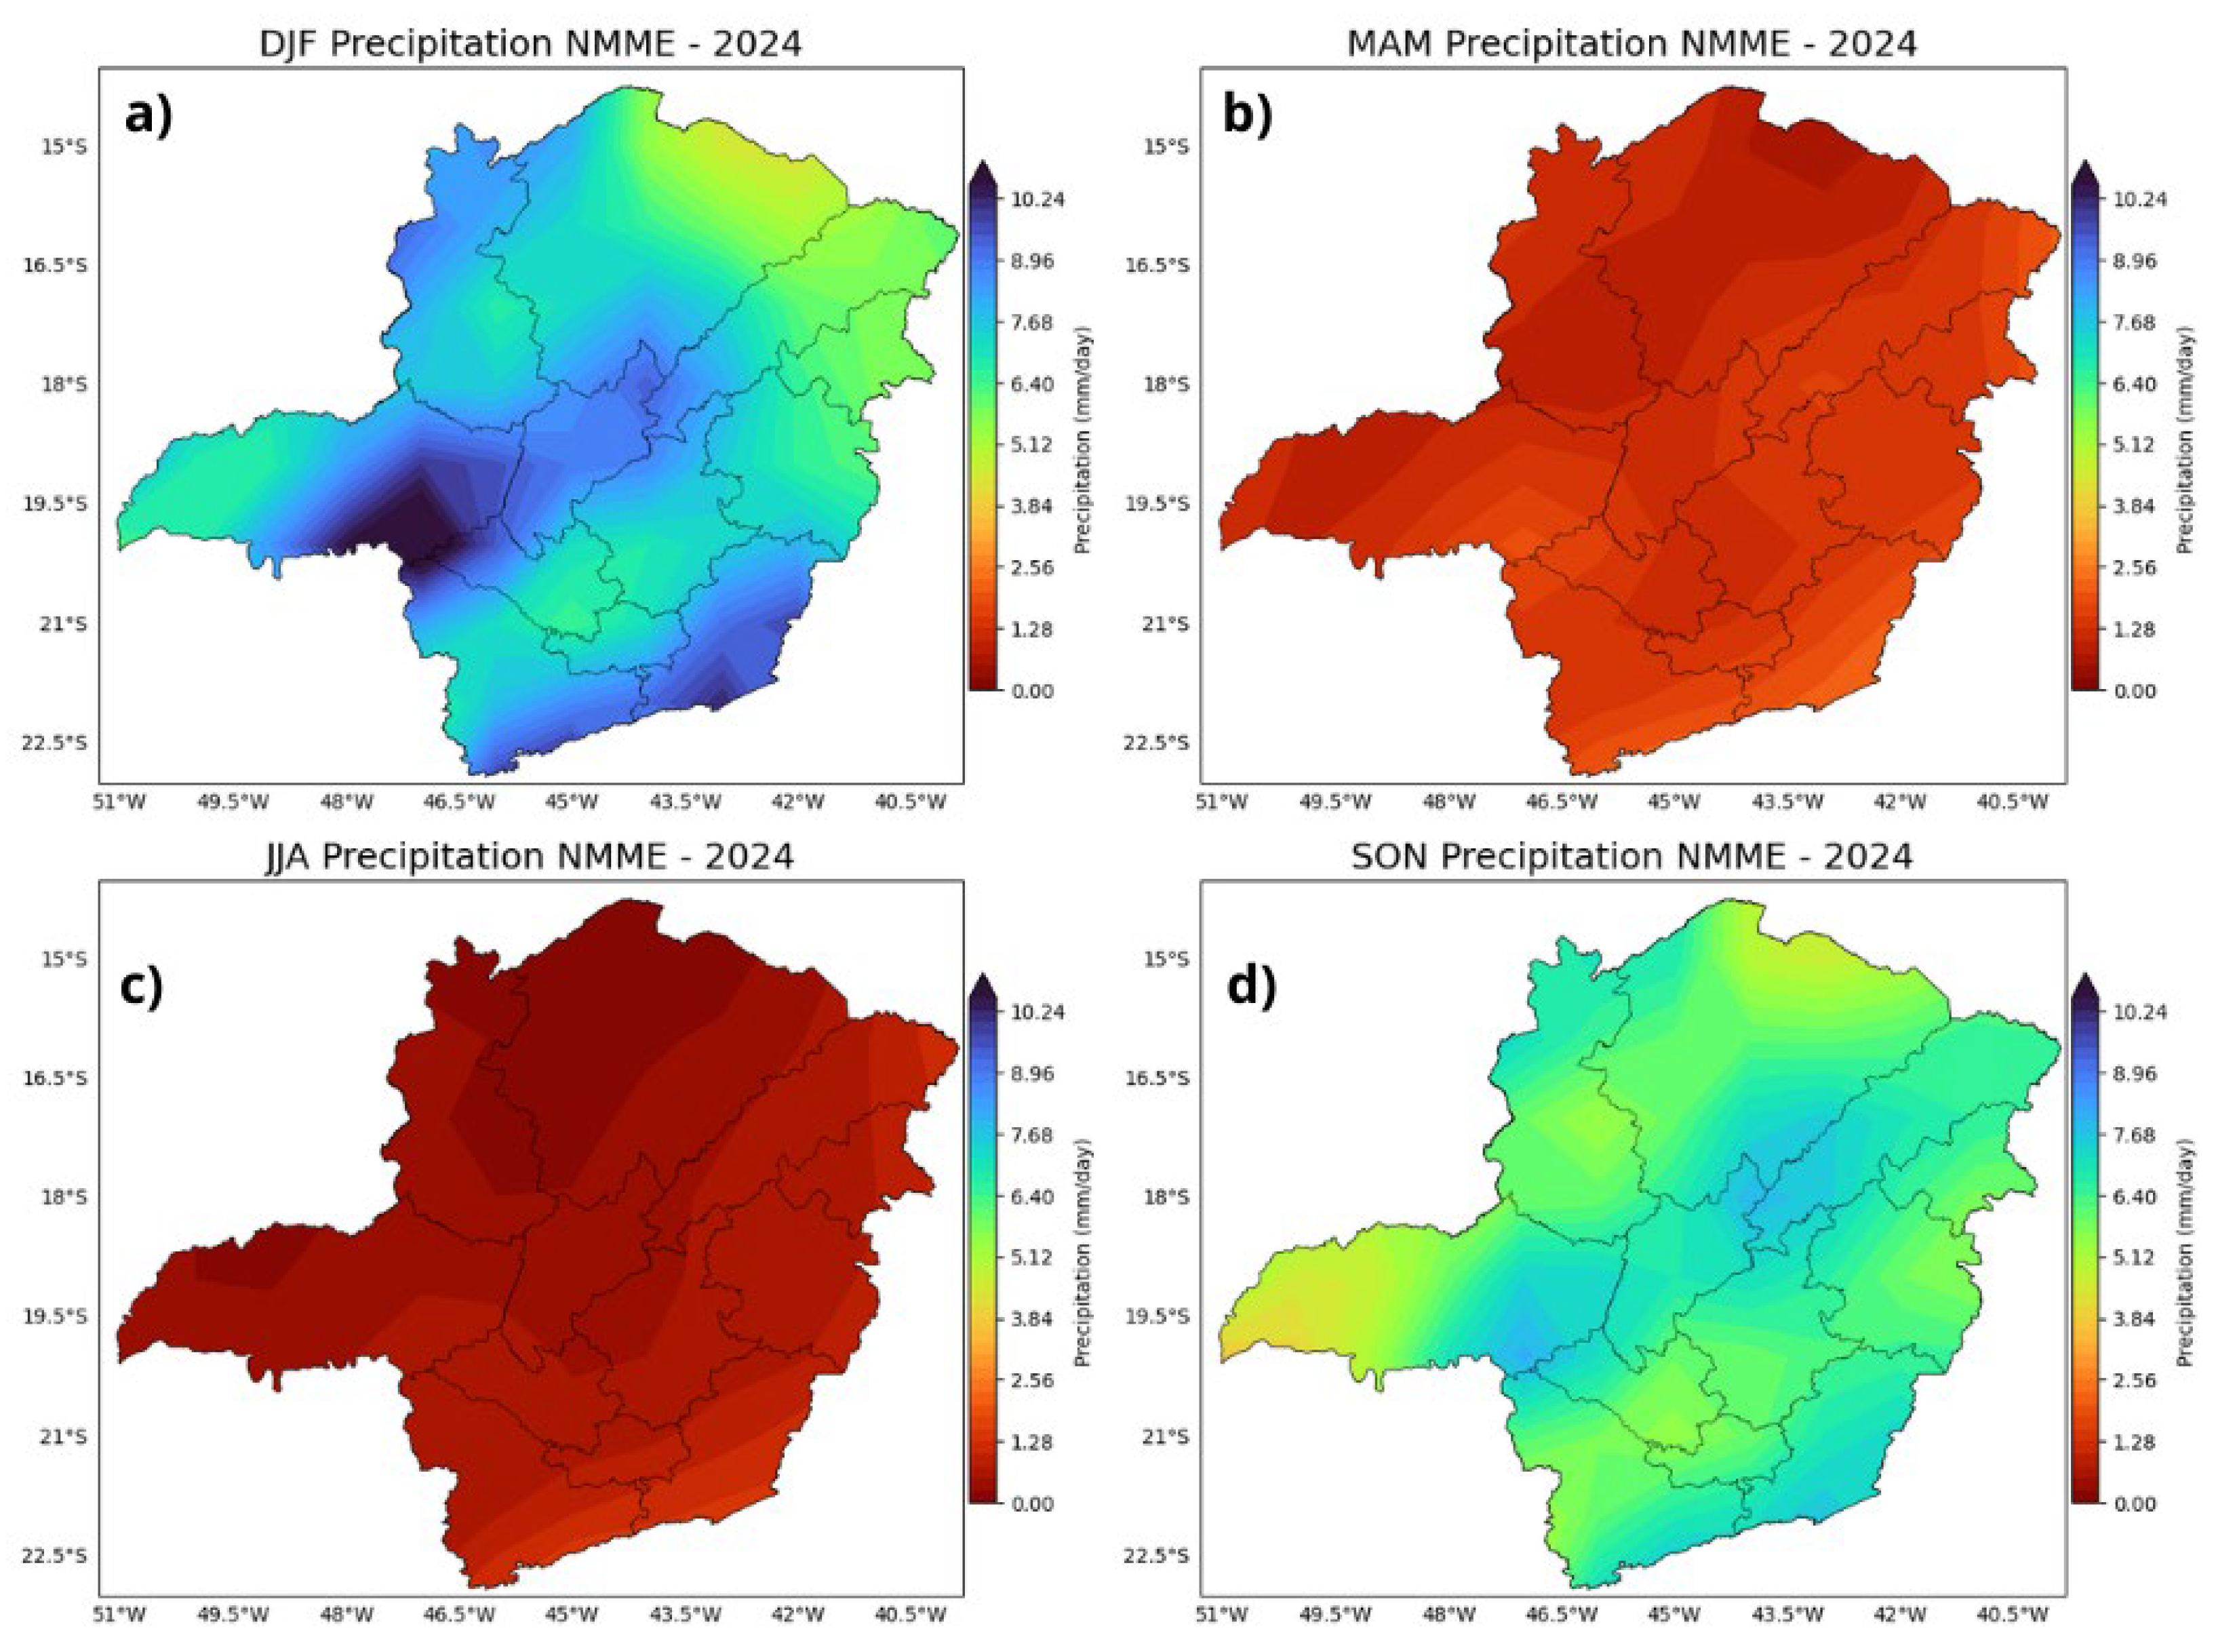

Table 1.
Configuration parameters of the AI models implemented in this study.
| Target Forecast | Layers | Number of neurons | Training Period |
|---|---|---|---|
| DJF - 2024 | 3 | 64 | DJF 2001 to 2022 |
| MAM - 2024 | 3 | 96 | MAM 2001 to 2022 |
| JJA - 2024 | 3 | 96 | JJA 2001 to 2022 |
| SON - 2024 | 3 | 96 | SON 2001 to 2022 |
Table 2.
Evaluation of prediction by neural network vs NCEP-CFSv2.
| Evaluation of prediction by neural network | Evaluation NCEP-CFSv2 | ||||
|---|---|---|---|---|---|
| Season | RMSE | MSE | RE | RMSE NCEP-CFSv2 | MSE NCEP-CFSv2 |
| DJF | 0.9449 | 0.8928 | -4.7594 e-10 | 2.2247 | 4.9495 |
| MAM | 0.6306 | 0.3976 | -1.2010 e-10 | 1.1901 | 1.4164 |
| JJA | 0.1435 | 0.0206 | -5.2871 e-10 | 1.1851 | 1.4045 |
| SON | 0.9469 | 0.8967 | -2.0973 e-09 | 1.9291 | 3.7213 |
Each cell’s color represents the RMSE and MSE values, with blue indicating lower errors and red indicating higher errors.
Disclaimer/Publisher’s Note: The statements, opinions and data contained in all publications are solely those of the individual author(s) and contributor(s) and not of MDPI and/or the editor(s). MDPI and/or the editor(s) disclaim responsibility for any injury to people or property resulting from any ideas, methods, instructions or products referred to in the content. |
© 2026 by the authors. Licensee MDPI, Basel, Switzerland. This article is an open access article distributed under the terms and conditions of the Creative Commons Attribution (CC BY) license (http://creativecommons.org/licenses/by/4.0/).
Copyright: This open access article is published under a Creative Commons CC BY 4.0 license, which permit the free download, distribution, and reuse, provided that the author and preprint are cited in any reuse.


