Submitted:
18 February 2026
Posted:
19 February 2026
You are already at the latest version
Abstract
Accurate classification of physical activity (PA) intensity is essential for exercise prescription, rehabilitation monitoring, and evaluation of guideline adherence; however, widely used wrist-worn accelerometer cut-points may substantially misclassify physiological intensity. This study evaluated absolute accelerometer thresholds during a maximal 2400m run in military office workers and examined whether individualized cut-points improve agreement with physiological intensity. Seventy-four military office workers completed the test while wearing a wrist-worn ActiGraph GT9X Link and a chest-worn Zephyr BioHarness. Participants achieved near-maximal physiological effort, with peak heart rate averaging 187 ± 11 bpm (95 ± 4.2% age-predicted HRmax). Despite this high intensity, absolute wrist-worn cut-points classified only 34.5% of participants as performing vigorous activity for most of the test. Individualized cut-points, derived from each participant’s individual reference intensity, calculated as the three highest consecutive one-minute epochs during the 2400m test, substantially improved validity. Agreement with %HRmax increased from fair (κ = 0.31), using absolute thresholds, to good (κ = 0.74), using individualized thresholds, and intraclass correlation increased from 0.52 to 0.81. These findings demonstrate that absolute cut-points markedly underestimate high-intensity activity, potentially leading to inaccurate exercise load monitoring and misinterpretation of training intensity. Individualized calibration during a standardized maximal running test provides a feasible, scalable strategy to improve the validity of intensity assessment using wearables in occupational, clinical, and sports settings.
Keywords:
accelerometry
; physical activity intensity
; military office workers
; individualized cut-points
1. Introduction
Physical activity (PA) assessment using accelerometry has become the gold standard for objectively measuring PA levels and energy expenditure in free-living populations [1,2]. However, the interpretation of accelerometer data relies heavily on intensity thresholds that categorize activity as sedentary, light, moderate, or vigorous. Traditional approaches utilize absolute thresholds based on metabolic equivalents (METs), where moderate activity is defined as 3-5.9 METs and vigorous activity as ≥6 METs [3,4].
The fundamental assumption underlying absolute thresholds is that the physiological cost of activities remains constant across individuals regardless of their fitness level [5]. This assumption becomes increasingly problematic when assessing PA in active populations, such as military personnel, who may possess a higher physical fitness than the general population used to derive these thresholds [6,7].
Recent research has demonstrated that absolute intensity cut-offs are inadequate for 95% of individuals in many samples, with substantial discrepancies between absolute and relative PA levels [8]. Notably, the choice of accelerometer metrics and cut points has profound implications for study outcomes, with research demonstrating that different processing approaches can yield dramatically different results. Willems et al. (2024) investigated how different approaches to absolute cut-points affect estimates of physical activity patterns, showing that compliance with 24-hour movement behavior guidelines ranged from 0% to 25% depending on the metric used, while sedentary time ranged from 35% to 59% across processing methods [8]. These findings underscore that researchers can reach fundamentally different conclusions about physical activity patterns, guideline adherence, and associations with health outcomes depending on the absolute cut-point approach used.
The placement of accelerometers also significantly influences measurement accuracy and the applicability of thresholds. While hip-worn devices have been extensively validated, wrist-worn accelerometers have gained popularity due to improved compliance and user acceptance [9,10]. However, wrist placement adds complexity to data interpretation, as arm movements during activities may not directly correlate with whole-body energy expenditure, particularly during running, where arm-swing patterns vary among individuals [11].
The concept of absolute PA intensity thresholds originated from metabolic studies conducted primarily in laboratory settings using indirect calorimetry to measure oxygen consumption during various activities [12]. These studies established that certain activities consistently require specific energy expenditure levels, leading to the development of MET-based classification systems. While MET values accurately reflect the metabolic cost of activities under controlled conditions, translating them into universal accelerometer cut points is problematic because this approach assumes uniform accelerometer responses across individuals and fails to account for substantial inter-individual variation in movement patterns, body composition, and accelerometer placement effects [13,14].
Research examining the validity of absolute accelerometer thresholds across diverse populations has revealed significant limitations in how these devices capture the established MET classifications. Studies demonstrate that when accelerometer-derived absolute moderate and vigorous cut-points are applied universally, they rank high-fitness participants as having more moderate and vigorous physical activity, whereas using individual relative thresholds (40% of oxygen-uptake reserve) shows the lowest-fitness individuals accumulate the most moderate and vigorous physical activity, completely reversing group classifications [15]. This finding highlights the fundamental disconnection between absolute accelerometer threshold approaches and the underlying physiological effort. While the MET cost of activities remains consistent, accelerometer responses fail to capture the relative physiological effort required by individuals with different fitness capacities.
Recent evidence strongly supports the use of relative intensity measures that account for individual fitness capacity. Fridolfsson et al. (2023) investigated associations between accelerometer-measured absolute and relative physical activity intensity and cardiometabolic health in 4,234 middle-aged adults [16]. Their findings revealed that while both intensity measures were associated with health indicators, the dose-response relationship between moderate and vigorous intensity and health outcomes was stronger for relative intensity than for absolute intensity across different fitness levels. Critically, absolute and relative moderate and vigorous intensity cut-offs intersected at only the 5th fitness percentile, indicating that absolute intensity cut-offs are too low for 95% of individuals. While 99% of individuals fulfilled physical activity recommendations based on absolute intensity measures, only 21% fulfilled recommendations based on relative intensity measures—a dramatic difference with profound implications for public health guidelines. This evidence suggests that relative physical activity intensity better reflects health-relevant intensity across fitness levels, supporting the transition from absolute to relative intensity paradigms in accelerometer-based physical activity assessment [16].
The limitations of absolute thresholds have prompted researchers to explore individualized approaches to PA assessment. Multiple methodological and applied studies propose and validate individualized or population-specific thresholds as feasible and superior alternatives to one-size-fits-all cut-points [16,17,18]. Piecewise exponential models can fit individual activity intensity profiles with high accuracy, producing unique thresholds for each person that map to sedentary, light, moderate, and vigorous activity levels [19]. Population-standardized age- and sex-specific cut-points have been proposed as a feasible alternative to generic moderate- and vigorous-intensity cut-points, which are often derived from small, non-representative laboratory samples [20].
This study aimed to examine the differences between absolute and relative PA measurement using wrist-worn ActiGraph GT9X accelerometers in military office workers performing a maximal 2400m running test. Specifically, we investigated: the extent to which absolute thresholds fail to capture high-intensity exercise in this population; the agreement between chest-worn accelerometry and heart rate monitoring, and between wrist-worn accelerometry, across different threshold approaches; and the feasibility of developing individualized cut-points based on a standardized maximal exercise test. The 2400-meter (1.5-mile) running test was selected because it is a standardized military fitness assessment that can serve as an individual reference-intensity measure, providing an individual-specific reference point for calibrating accelerometer thresholds to physiological capacity. This approach offers a practical method for developing individualized cut-points that align absolute accelerometer measurements with relative physiological intensity. In addition, similar running tests are used internationally by other armed forces and law enforcement agencies as aerobic fitness standards, including the British Armed Forces and several European police services [21]. The widespread use of this test across uniformed services further supports its applicability as a field-based criterion measure for calibrating accelerometer-derived intensity thresholds.
2. Materials and Methods
2.1. Study Design and Participants
This study examined 74 military office workers recruited from the Belgian Defence. Participants were active-duty Belgian military personnel with primarily desk-based occupational duties who maintained current military fitness standards. Inclusion criteria included: active-duty military status, mainly sedentary occupational activities (>6 hours/day of desk work), and absence of musculoskeletal injuries that would prevent maximal running effort. Exclusion criteria included: recent or chronic injuries or illnesses that prevented maximal exercise and inability to provide informed consent. All participants provided written informed consent.
2.2. Materials
2.2.1. ActiGraph GT9X Link Accelerometer (Wrist-Worn)
Participants wore ActiGraph GT9X Link tri-axial accelerometers (ActiGraph LLC, Pensacola, FL) on their non-dominant wrist using an elastic wristband. Devices were initialized to collect raw acceleration data at 100 Hz and synchronized to a common start time. The GT9X measures acceleration along three orthogonal axes (vertical, anteroposterior, and mediolateral) and provides raw acceleration data processed using General Generic Intermediate Results (GGIR) algorithms [22].
For this study, we used established non-dominant wrist-worn cut-points for physical activity levels: sedentary (<44.8), light (44.8-100.5), moderate (100.6-428.8), and vigorous (≥428.8). These thresholds represent absolute physical activity levels derived from metabolic measurements in general population samples [23].
2.2.2. Zephyr Bio Harness (Chest-Worn)
The Zephyr BioHarness 3.0 (Zephyr Technology Corporation, Annapolis, MD) provided continuous physiological monitoring, including heart rate, breathing rate, and chest acceleration. The device was positioned across the chest at the level of the xiphoid process using the manufacturer’s elastic strap. Heart rate data were used as the criterion measure for exercise intensity assessment, while accelerometer data were used to compare chest-worn versus non-dominant wrist-worn accelerometry.
2.3. Testing Protocol
2.3.1. Pre-Test Procedures
Participants reported to the military facility, having avoided caffeine and vigorous exercise for 24 hours before testing. Anthropometric measurements (height, weight, body composition) were recorded using a Tanita MC-780MA (Tanita Corporation, Japan) bioelectrical impedance analysis technology, and ActiGraph GT9X and Zephyr Bio Harness were fitted and checked for proper function. Participants completed a standardized warm-up consisting of 5 minutes of light jogging. Resting heart rate was not collected in this study due to logistical constraints. Therefore, relative intensity calculations were based on the percentage of maximal heart rate (%HRmax).
2.3.2. 2400m Running Test
The maximal 2400 m running test was selected as it represents a standardized military fitness assessment. The test was conducted on a standard 400m outdoor track. Participants were instructed to complete the 2400m distance maximum effort, representing maximal effort throughout the test. Split times were provided every 400m to maintain participant awareness of pace and distance covered. Standardized verbal encouragement was provided throughout the test to ensure maximal effort. Heart rate and accelerometer data were collected continuously throughout the test.
2.4. Data Processing and Analysis
2.4.1. Accelerometer Data Processing
Raw tri-axial accelerometer data from Zephyr BioHarness (chest-worn) and ActiGraph GT9X (non-dominant wrist-worn) devices were exported in gravitational units (g) and processed. For each 30-second epoch, vector magnitude units (VMU) were calculated as the square root of the sum of squared accelerations across the three axes (VMU = √(x² + y² + z²)). Gravitational acceleration (1 g) was subtracted to isolate the dynamic component of movement, and negative values were set to zero, yielding metrics comparable to the Euclidean Norm Minus One (ENMO). A 30-second epoch was chosen because the goal was to assess sustained movement intensity during steady-state running rather than short-term fluctuations.
To enable direct comparison between devices, the signals were resampled and filtered using identical settings. All data processing and signal calibration were performed in R (version 4.3.1) using the GGIR package (version 3.0.8), which provides standardized algorithms for raw accelerometry analysis. VMU values were expressed in gravitational units and used to compare movement-intensity patterns between chest- and wrist-worn sensors.
To compare absolute with relative physical activity levels, we calculated the percentage of test time spent in each physical activity category (sedentary, light, moderate, vigorous) using absolute thresholds [23]. Given the nature of this 2400-meter maximal running test, participants typically reach vigorous relative intensity within the first 2 minutes, and heart rate remains above the moderate-intensity threshold (≥60% HRmax) for the remainder of the effort. Consequently, we expected that participants would operate above 70% of maximum heart rate throughout the test, resulting in negligible time spent in sedentary or light-intensity categories and almost all time classified as moderate or vigorous activity [24].
2.4.2. Heart Rate and VO2max Data Processing
Relative physical activity was determined for each participant based on heart rate data collected during the 2400 m all-out running test. Maximum heart rate (HRmax) was identified as the 10-second rolling average recorded during the 2400m running test. Relative intensity was calculated for each heart rate value (10-second rolling average) recorded during the test, expressed as a percentage of HRmax ((%) = (Exercise HR / HRmax) × 100) and categorized according to established physiological thresholds (light = 50–59 % HRmax, moderate = 60–69 %, vigorous = 70–84 %, and very vigorous ≥ 85 %) [25].
VO₂max was estimated from performance on the 2400 m running test. Estimated aerobic capacity (VO₂max, mL/kg/min) was calculated using the Cooper field-test equation, which predicts maximal oxygen uptake based on run time: VO2max = 483/T + 3.5, where T stands for time to complete 2400m in minutes. This method is used and has been validated in adult populations for predicting cardiorespiratory fitness [26].
2.4.3. Individualized Cut-Points Development Method
For each individual participant, an individual reference intensity was calculated as the mean VMU of the three highest consecutive one-minute epochs during the 2400 m test, expressed in gravitational units (g). To empirically align absolute accelerometer-derived intensity with relative physiological intensity, McNemar’s test was applied to each participant to assess classification agreement between heart rate–based physical activity levels and VMU-based absolute physical activity levels. Iterative comparisons were performed to identify, for each participant, the percentage of the individual reference intensity (VMU) that provided the highest classification concordance with the corresponding relative physical activity levels (%HRmax). This individualized approach yielded adapted, subject-specific absolute cut-points for light, moderate, vigorous, and very vigorous activity, ensuring optimal alignment between accelerometer-based and heart rate–based physical activity levels.
2.5. Statistical Analysis
Descriptive statistics were calculated for all study variables. Agreement between heart rate–based and accelerometer-based intensity classifications (categorized as light, moderate, and vigorous) was evaluated using Cohen’s kappa coefficient. Pearson correlation coefficients were used to examine linear relationships between continuous intensity measures obtained from the Zephyr (chest-worn) and ActiGraph GT9X (wrist-worn) devices, as well as between absolute and relative measurement approaches. Bland–Altman analyses were performed to assess the agreement, systematic bias, and 95% limits of agreement between chest- and wrist-worn accelerometer measurements. Receiver Operating Characteristics (ROC) analyses were conducted to evaluate the discriminatory ability of absolute and adapted cut-points. Area under the curve (AUC) values were calculated with 95% confidence intervals and interpreted according to established criteria (AUC 0.50–0.69 = poor to fair, 0.70–0.79 = acceptable, ≥ 0.80 = excellent). Statistical significance was set at p < 0.05. All analyses were conducted using R statistical software (version 4.3.1).
3. Results
3.1. Participant Characteristics
The study sample consisted of 74 military office workers (43 male, 31 female) with a mean age of 39.3 ± 9.3 years (range: 21-56 years). Participants had a mean body mass index of 24.6 ± 2.9 kg/m² (range: 17.9-30.5). Mean height was 174.8 ± 7.9 cm, and mean weight was 75.7 ± 11.8 kg (Table 1).
Military rank distribution showed 40.3% Officers, 32.9% Non-Commissioned Officers, and 26.8% Enlisted Ranks. Job functions were primarily administrative (71.2%) and management (15.1%) roles, confirming the office worker population. All participants provided informed consent and declared their fitness to perform maximal physical testing, and none were taking medication that could affect their heart rate.
3.2. Heart Rate Responses
Maximum heart rate during the test averaged 187 ± 11.4 bpm, representing 95 ± 4.2% of age-predicted maximum heart rate (220-age). This confirms that participants achieved near-maximal physiological effort during the test. Mean heart rate during the 2400m test was 165 ± 10.9 bpm, representing 85 ± 3.7% of the individual's maximum heart rate achieved during the test. Using traditional relative-intensity zones based on %HRmax, 100% of participants exceeded the vigorous-intensity threshold (77% HRmax) during the test.
3.3. Device Comparison: ActiGraph versus Zephyr
Significant differences were observed between measurement systems during the 2400m test. The ActiGraph GT9X Link (wrist-worn) recorded higher vector magnitude values compared to the Zephyr Bio Harness chest acceleration, reflecting greater upper-limb movement during running (Table 2). The correlation between Zephyr and ActiGraph vector magnitude measurements was moderate (r = 0.67, p < 0.01), indicating substantial inter-device variability. Bland-Altman analysis revealed a systematic bias of + 0.57 g (95% CI: +0.23 to +0.91 g) for wrist-worn measurements, with limits of agreement ranging from -0.34 to +1.48 g.
3.4. Absolute versus Individualized Threshold Performance
Analysis of ActiGraph GT9X Link data using established absolute thresholds showed patterns of physical activity misclassification. Despite the maximal-effort nature of the 2400m test and the confirmed high physiological demands, only 34.5% of participants (n=26) achieved a vigorous-intensity classification for the majority (>50%) of their test time using absolute accelerometer thresholds. The distribution of time spent in each intensity category was as follows: Sedentary: 2.1 ± 4.3%; Light: 23.7 ± 18.9%; Moderate: 48.6 ± 22.1%; Vigorous: 25.6 ± 19.8%.
These results indicate that 65.5% of participants (n=48) failed to achieve vigorous intensity classification for the majority of their maximal running effort, despite clear physiological evidence of high-intensity exercise. Furthermore, 47.3% of participants (n=35) spent more time classified as light intensity than moderate or vigorous intensity during their maximal effort.
In contrast, individualized absolute cut-points based on the individual reference intensity showed markedly different classifications. Among the disagreeing pairs, 31 participants showed improved classification with the adapted thresholds. The odds of improved classification using adapted thresholds were over ten times higher (OR = 10.33, 95% CI: 3.12–34.21).
Receiver Operating Characteristic Analysis showed fair discrimination for absolute thresholds and excellent discrimination for adapted thresholds (Table 3).
Intraclass correlation analysis showed moderate agreement between absolute thresholds and %HRmax (ICC = 0.52, 95% CI: 0.35–0.66), while adapted thresholds demonstrated excellent agreement with %HRmax (ICC = 0.81, 95% CI: 0.73–0.87). The improvement in agreement was significant (ΔICC = 0.29, 95% CI: 0.18–0.40, p < 0.001).
3.5. Agreement between Measurement Approaches
Agreement between heart rate-based physical activity levels (%HRmax zones) and accelerometer-based physical activity levels improved substantially when using individualized, adapted rather than absolute cut-points. Cohen’s kappa coefficient increased from 0.31 (fair agreement) with absolute thresholds to 0.74 (good agreement) with individualized thresholds (p < 0.001).
The correlation between heart rate percentage and accelerometer-derived intensity also strengthened when using individualized cut-points (r = 0.78 vs r = 0.45 for absolute thresholds, p < 0.01). This improvement suggests that individualized thresholds better capture the physiological reality of physical activity across individuals with varying fitness levels.
3.6. Individual Variability in Cut-Point Development
Substantial inter-individual variability was observed in individual reference intensity. Individual moderate physical activity accelerometer cut points ranged from 0.48 to 1.12 g, with a coefficient of variation of 28.4%. Participants with faster 2400m completion times generally demonstrated higher individual reference intensities (r = -0.58, p < 0.01). However, this relationship was not perfect, suggesting that additional factors beyond exercise performance contributed to variability in accelerometer-derived intensity metrics. Although not directly measured in this study, differences in running economy, gait mechanics, and arm movement patterns contributed to measurement variability and reduced accuracy when using traditional absolute thresholds [26].
Analysis of cut-point distributions revealed systematic patterns across fitness levels (Figure 1). Higher-fitness participants required higher cut-points for equivalent relative physical activity (r = 0.77, p < 0.001), with cut-point values ranging from 0.48g in low-fitness to 1.12g in high-fitness individuals.
4. Discussion
This study demonstrates important limitations of applying absolute accelerometer cut-points to classify physical activity intensity in military office workers. Despite participants reaching near-maximal physiological effort during the 2400m running test, as confirmed by heart rate responses averaging 94.8% of maximum, only 34.5% of the participants were classified as performing vigorous activity using established absolute thresholds for non-dominant wrist-worn ActiGraph GT9X devices [23]. Individualized cut-points, derived from the individual reference intensity of each participant, substantially improved measurement accuracy, increasing agreement between accelerometer and heart rate measures from fair (κ = 0.31) to good (κ = 0.74). These findings indicate that accounting for interindividual physiological differences improves accelerometer-based estimates of physical activity. However, it remains uncertain whether a field-based maximal running test represents the optimal criterion for calibration, and further research comparing this approach with laboratory-based treadmill or cardiopulmonary exercise testing is warranted. In addition, accelerometer placement should be considered in calibration protocols, as wrist-worn sensors respond differently to movement patterns than chest-worn devices.
Our findings align closely with the study by Fridolfsson et al. (2023), which demonstrated that absolute moderate and vigorous physical activity cut points are too low for 95% of individuals in their large middle-aged sample [16]. The systematic underestimation of physical activity using absolute thresholds observed in our military population mirrors their findings and extends this concern to active occupational groups. The stronger dose-response relationship between relative intensity and health indicators reported by Fridolfsson et al. provides compelling evidence that relative measures better capture physiologically meaningful activity. The substantial difference between absolute and relative threshold classifications observed in our study parallels the inequity Fridolfsson et al. found between absolute and relative adherence to physical activity recommendations. This consistency across different populations and measurement contexts strengthens the argument for transitioning from absolute to relative PA paradigms in accelerometer-based PA assessment. Importantly, Fridolfsson et al.’s (2023) findings regarding cardiometabolic health associations provide crucial context for interpreting our results. Their demonstration that relative intensity showed stronger and more consistent associations with components of metabolic syndrome across fitness levels suggests that our individualized approach may better capture health-relevant physical activity. The fact that only 9% of their participants met with recommendations for both relative PA and sufficient fitness levels underscores the inadequacy of current absolute approaches. It supports our call for individualized calibration methods.
The comparison between the ActiGraph GT9X and Zephyr BioHarness systems revealed insights into measurement system agreement and the challenges of non-dominant wrist-worn accelerometry during running activities. The higher vector magnitude values recorded by the wrist-worn ActiGraph (1.82 ± 0.30 g vs 1.25 ± 0.18 g for chest-worn) reflect the greater contribution of arm movement to acceleration signals during running. This finding is consistent with previous research demonstrating that wrist placement captures different movement patterns compared to traditional hip or chest locations [28,29,30]. The moderate correlation between devices (r = 0.67) and systematic bias (+0.57 g) highlights the importance of device-specific calibration. These results further reinforce the need for individualized or placement-specific adjustments to wrist-worn thresholds to avoid misclassification.
The 2400m running test serves as an optimal, individualized reference intensity metric for calibrating accelerometer outputs within military populations, conferring notable methodological and practical advantages. This approach capitalizes on established military fitness assessment protocols, necessitating no supplementary equipment or training interventions, as the test is routinely incorporated into standard physical evaluations. The measurement of heart rate responses during the test provides an objective indicator of near-maximal physiological effort, thereby establishing a valid criterion for physical activity intensity calibration that inherently accounts for interindividual variability in fitness levels. Although running economy, gait mechanics, and arm movement patterns likely influence accelerometer signals, these factors were not directly measured in this study and should be explored in future research as potential contributors to individual differences in acceleration-based intensity. Furthermore, the individualized reference intensity methodology employed herein offers a pragmatic compromise between laboratory-based maximal oxygen uptake (VO₂max) testing and generic population-derived absolute intensity thresholds. By defining relative physical activity intensities as percentages of individual test performance, this method captures physiological nuances while maintaining applicability in field settings [24]. Future work should evaluate whether similar individualized calibration approaches are effective across a wider range of military tasks and free-living activities.
Several limitations should be considered when interpreting these results. The study examined only running activity during a standardized test, and generalizability to other military activities, occupational tasks, or free-living conditions requires additional validation. Results are specific to the ActiGraph GTX9 and Zephyr BioHarness systems. Other accelerometer models or heart rate monitors may show different agreement patterns. The military office worker population, while diverse in fitness levels, is relatively homogeneous in terms of age, health status, and physical activity background. The adapted thresholds were developed using data-driven approaches specific to this sample. Independent validation in separate populations is needed to confirm their broader applicability. The use of %HRmax rather than heart rate reserve (HRR) for relative-intensity calculations may have influenced the development of the threshold. Finally, future research should explore automated approaches to deriving individualized cut-points to support integration into clinical and operational monitoring systems.
5. Conclusions
This study highlights significant limitations of absolute accelerometer thresholds in assessing physical activity among military personnel. Despite maximal physiological effort during a 2400 m running test, confirmed by heart rate responses averaging 94.8% of maximum, only 34.5% of participants achieved vigorous-intensity classification using established absolute thresholds for wrist-worn ActiGraph GT9X devices. Individualized cut-points derived from each participant’s reference intensity substantially improved classification agreement with heart rate–based intensity. In summary, accounting for individual physiological differences enhances the validity of accelerometer-based intensity classification and offers a more accurate representation of physical activity in active populations.
Author Contributions
Conceptualization, M.P. and T.R.; methodology, M.P.; software, M.P.; validation, M.P. and P.C.; formal analysis, M.P.; investigation, M.P.; resources, M.P and D.V.T.; data curation, M.P.; writing—original draft preparation, M.P.; writing—review and editing, T.R., D.V.T. and P.C.; visualization, M.P.; supervision, P.C.; project administration, M.P.; funding acquisition, M.P. All authors have read and agreed to the published version of the manuscript.
Funding
The author(s) declare no financial support was received for the research and/or publication of this article. This research received funding from grant HFM/22-02 from the Royal Higher Institute for Defense.
Institutional Review Board Statement
The study was conducted in accordance with the Declaration of Helsinki, and approved by the Ethics Committee of CHU/UVC Brugmann (CE 2023/190, 12/12/2023).
Informed Consent Statement
Informed consent was obtained from all subjects involved in the study.
Data Availability Statement
Due to the military nature of the data (i.e., confidential information), the data presented in this study cannot be made publicly available. Data can be made available upon request with permission of the third party. To submit a request, please contact the corresponding author.
Acknowledgments
The authors want to thank the Belgian Royal High Institute of Defense, who made this study possible.
Conflicts of Interest
The authors declare no conflicts of interest related to the content of the present paper. Any affiliations, funding sources, or external influences have been disclosed in accordance with ethical guidelines.
Abbreviations
The following abbreviations are used in this manuscript:
| ENMO | Euclidean Norm Minus One |
| g | Gravitational unit |
| GGIR | General generic intermediate resilts |
| HRmax | Maximal heart rate |
| HRR | Heart rate reserve |
| MET | Metabolic equivalent |
| PA | Physical Activity |
| ROC | Receiver operating characteristics |
| VMU | Vector magnitude units |
References
- Troiano, R. P.; Berrigan, D.; Dodd, K. W.; Mâsse, L. C.; Tilert, T.; McDowell, M. Physical activity in the United States measured by accelerometer. Medicine & Science in Sports & Exercise 2008, 40, 181–188. [Google Scholar] [CrossRef]
- Matthews, C. E.; Chen, K. Y.; Freedson, P. S.; Buchowski, M. S.; Beech, B. M.; Pate, R. R.; Troiano, R. P. Amount of time spent in sedentary behaviors in the United States, 2003-2004. American Journal of Epidemiology 2008, 167, 875–881. [Google Scholar] [CrossRef]
- Pate, R. R.; Pratt, M.; Blair, S. N.; Haskell, W. L.; Macera, C. A.; Bouchard, C. Physical activity and public health: a recommendation from the Centers for Disease Control and Prevention and the American College of Sports Medicine. JAMA 1995, 273, 402–407. [Google Scholar] [CrossRef]
- Garber, C. E.; Blissmer, B.; Deschenes, M. R.; Franklin, B. A.; Lamonte, M. J.; Lee, I. M.; Niemand, D.C.; Swain, D. P. American College of Sports Medicine position stand. Quantity and quality of exercise for developing and maintaining cardiorespiratory, musculoskeletal, and neuromotor fitness in apparently healthy adults: guidance for prescribing exercise. Medicine & Science in Sports & Exercise 2011, 43, 1334–1359. [Google Scholar] [CrossRef]
- Ainsworth, B. E.; Haskell, W. L.; Herrmann, S. D.; Meckes, N.; Bassett, D. R., Jr.; Tudor-Locke, C.; Greer, J. L.; Vezina, J.; Whitt-Glover, M. C.; Leon, A. S. 2011 Compendium of Physical Activities: a second update of codes and MET values. Medicine & Science in Sports & Exercise 2011, 43, 1575–1581. [Google Scholar] [CrossRef]
- Heinrich, K. M.; Spencer, V.; Fehl, N.; Poston, W. S. Mission essential fitness: comparison of functional circuit training to traditional Army physical training for active duty military. Military Medicine 2012, 177, 1125–1130. [Google Scholar] [CrossRef]
- Knapik, J. J.; Sharp, M. A.; Canham-Chervak, M.; Hauret, K.; Patton, J. F.; Jones, B. H. Risk factors for training-related injuries among men and women in basic combat training. Medicine & Science in Sports & Exercise 2001, 33, 946–954. [Google Scholar] [CrossRef] [PubMed]
- Willems, I.; Verbestel, V.; Dumuid, D.; Calders, P.; Lapauw, B.; De Craemer, M. A comparative analysis of 24-hour movement behaviors features using different accelerometer metrics in adults: Implications for guideline compliance and associations with cardiometabolic health. PLOS ONE 2024, 19, e0309931. [Google Scholar] [CrossRef]
- Freedson, P.; Bowles, H. R.; Troiano, R.; Haskell, W. Assessment of physical activity using wearable monitors: recommendations for monitor calibration and use in the field. Medicine & Science in Sports & Exercise 2012, 44((1) Suppl 1, S1–S4. [Google Scholar] [CrossRef]
- Troiano, R. P.; McClain, J. J.; Brychta, R. J.; Chen, K. Y. Evolution of accelerometer methods for physical activity research. British Journal of Sports Medicine 2014, 48, 1019–1023. [Google Scholar] [CrossRef] [PubMed]
- Staudenmayer, J.; Pober, D.; Crouter, S.; Bassett, D.; Freedson, P. An artificial neural network to estimate physical activity energy expenditure and identify physical activity type from an accelerometer. Journal of Applied Physiology 2009, 107, 1300–1307. [Google Scholar] [CrossRef] [PubMed]
- Brooks, G. A.; Butte, N. F.; Rand, W. M.; Flatt, J. P.; Caballero, B. Chronicle of the Institute of Medicine physical activity recommendation: how a physical activity recommendation came to be among dietary recommendations. The American Journal of Clinical Nutrition 2004, 79, 921S–930S. [Google Scholar] [CrossRef]
- Plasqui, G.; Westerterp, K. R. Physical activity assessment with accelerometers: an evaluation against doubly labeled water. Obesity 2007, 15, 2371–2379. [Google Scholar] [CrossRef]
- Crouter, S. E.; Clowers, K. G.; Bassett, D. R., Jr. A novel method for using accelerometer data to predict energy expenditure. Journal of Applied Physiology 2006, 100, 1324–1331. [Google Scholar] [CrossRef]
- Husu, P. S08-4 In terms of individual fitness, people with low cardiorespiratory fitness are physically the most active. European Journal of Public Health 2022, 32 (Supplement_2), ckac093–043. [Google Scholar] [CrossRef]
- Fridolfsson, J.; Arvidsson, D.; Ekblom-Bak, E.; Ekblom, Ö.; Bergström, G.; Börjesson, M. Accelerometer-measured absolute versus relative physical activity intensity: cross-sectional associations with cardiometabolic health in midlife. BMC Public Health 2023, 23, 2322. [Google Scholar] [CrossRef]
- Phillips, K.; Stanley, K. G.; Fuller, D. R. A theory-based model of cumulative activity. Scientific Reports 2022, 12. [Google Scholar] [CrossRef]
- Siddique, J.; Aaby, D.; Montag, S. E.; Sidney, S.; Sternfeld, B.; Welch, W. A.; Carnethon, M. R.; Liu, K.; Craft, L. L.; Gabriel, K. P.; Gibbs, B. B.; Reis, J. P.; Freedson, P. Individualized Relative-Intensity Physical Activity Accelerometer cut points. Medicine & Science in Sports & Exercise 2019, 52, 398–407. [Google Scholar] [CrossRef]
- Moore, C. C.; Cuthbertson, C. C.; Sotres-Alvarez, D.; Castaneda, S. F.; Cordero, C.; Daviglus, M. L.; Mossavar-Rahmani, Y.; Perreira, K. M.; Evenson, K. R. Step-Based Metrics and Translations of Physical Activity Guidelines among Adults in the HCHS/SOL. Medicine & Science in Sports & Exercise 2023, 55, 1423–1433. [Google Scholar] [CrossRef]
- Eyre, E. L.; Tallis, J.; Wilson, S.; Wilde, L.; Akhurst, L.; Wanderleys, R.; Duncan, M. J. Research Tracker 6 accelerometer calibration and validation in comparison to GENEActiv, ActiGraph, and gas analysis in young adults. Journal for the Measurement of Physical Behaviour 2019, 2, 176–187. [Google Scholar] [CrossRef]
- Wilkinson, D. M.; Blacker, S. D.; Richmond, V. L.; Rayson, M. P.; Bilzon, J. L. J. Relationship Between the 2.4-km Run and Multistage Shuttle Run Test Performance in Military Personnel. Military Medicine 2014, 179, 203–207. [Google Scholar] [CrossRef] [PubMed]
- Van Hees, V. T.; Gorzelniak, L.; León, E. C. D.; Eder, M.; Pias, M.; Taherian, S.; Ekelund, U.; Renström, F.; Franks, P. W.; Horsch, A.; Brage, S. Separating Movement and Gravity Components in an Acceleration Signal and Implications for the Assessment of Human Daily Physical Activity. PLoS ONE 2013, 8, e61691. [Google Scholar] [CrossRef] [PubMed]
- Hildebrand, M.; Hansen, B. H.; Van Hees, V. T.; Ekelund, U. Evaluation of raw acceleration sedentary thresholds in children and adults. Scandinavian Journal Of Medicine And Science in Sports 2016, 27, 1814–1823. [Google Scholar] [CrossRef]
- Kaufmann, S.; Gronwald, T.; Herold, F.; Hoos, O. Heart Rate Variability-Derived Thresholds for Exercise Intensity Prescription in Endurance Sports: A Systematic Review of Interrelations and Agreement with Different Ventilatory and Blood Lactate Thresholds. Sports Medicine - Open 2023, 9, 59. [Google Scholar] [CrossRef]
- American College Of Sports Medicine. ACSM’s Guidelines for Exercise Testing and Prescription, 11th ed.; | Wolters Kluwer, 2021. [Google Scholar]
- A means of assessing maximal oxygen intake. Correlation between field and treadmill testing. PubMed. 1968. Available online: https://pubmed.ncbi.nlm.nih.gov/5694044/.
- Lin, W.; Karahanoglu, F. I.; Psaltos, D.; Adamowicz, L.; Santamaria, M.; Cai, X.; Demanuele, C.; Di, J. Can Gait Characteristics Be Represented by Physical Activity Measured with Wrist-Worn Accelerometers? Sensors 2023b, 23, 8542. [Google Scholar] [CrossRef]
- Schwendinger, F.; Knaier, R.; Wagner, J.; Infanger, D.; Lichtenstein, E.; Hinrichs, T.; Rowlands, A.; Schmidt-Trucksass, A. Relative and absolute intensity accelerometer metrics decipher the effects of age, sex, and occupation on physical activity. BMC Public Health 2025, 25. [Google Scholar] [CrossRef]
- Sasaki, J. E.; John, D.; Freedson, P. S. Validation and comparison of ActiGraph activity monitors. Journal of Science and Medicine in Sport 2011, 14, 411–416. [Google Scholar] [CrossRef]
- Hildebrand, M.; Van Hees, V. T.; Hansen, B. H.; Ekelund, U. Age group comparability of raw accelerometer output from wrist-and hip-worn monitors. Medicine & Science in Sports & Exercise 2014, 46, 1816–1824. [Google Scholar] [CrossRef]
Figure 1.
Distribution and variability of cut-points across fitness levels. Panel A shows box plots of individualized cut-points by fitness tertile with the traditional absolute threshold (red dashed line) for comparison. Panel B presents the correlation between VO₂max and individualized cut-points (r = 0.77).
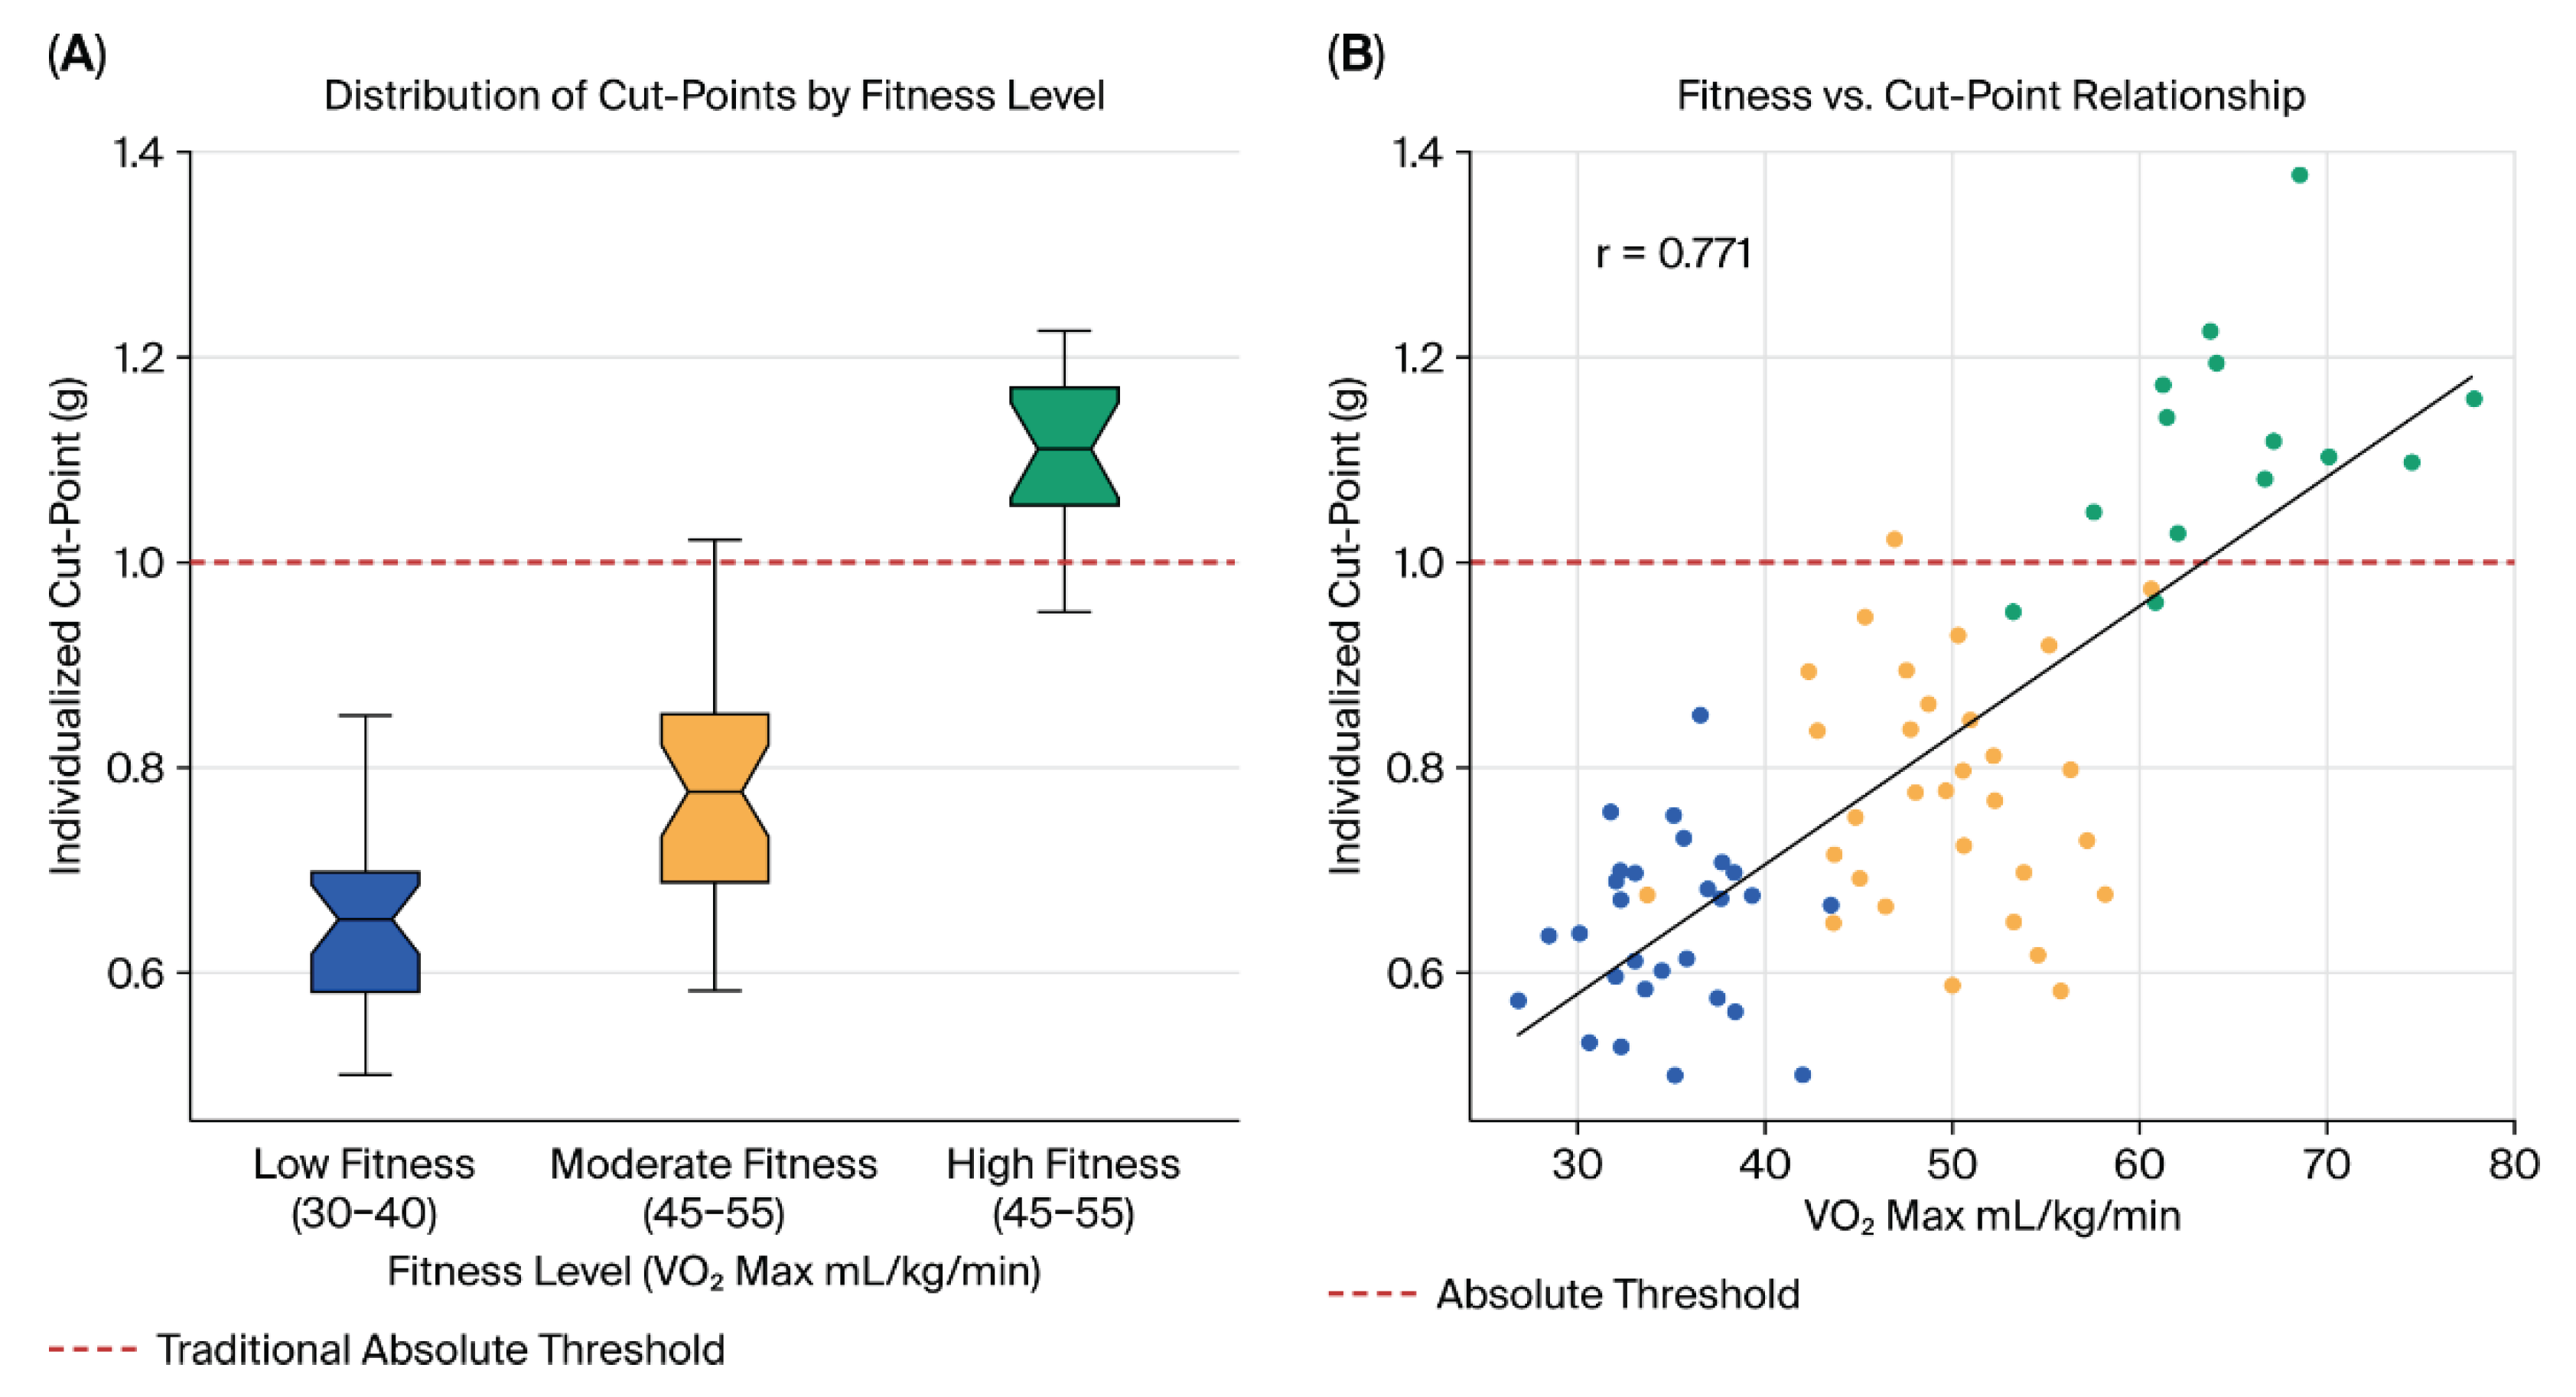

Table 1.
Participants Demographics.
| Characteristic | Mean ± SD | Range | N |
|---|---|---|---|
| Age (years) | 39.3 ± 9.3 | 21-56 | 74 |
| Height (cm) | 174.8 ± 7.9 | 157-195 | 74 |
| Weight (kg) | 75.7 ± 11.8 | 51-100 | 74 |
| BMI (kg/m²) | 24.6 ± 2.9 | 17.9-30.5 | 74 |
| Gender | N | % | |
| Male | 43 | 58.1% | |
| Female | 31 | 41.9% | |
| Military Rank | N | % | |
| Officers | 31 | 40.3% | |
| Non-Commissioned Officers | 24 | 32.9% | |
| Enlisted Ranks | 19 | 26.8% | |
| Job Function | N | % | |
| Administrative Function | 53 | 71.2% | |
| Management Function | 11 | 15.1% | |
| Logistics | 10 | 13.7% |
Table 2.
Comparison of Zephyr (chest-worn) and ActiGraph GT9X (non-dominant wrist-worn) measurements during 2400m running test.
Table 2.
Comparison of Zephyr (chest-worn) and ActiGraph GT9X (non-dominant wrist-worn) measurements during 2400m running test.
| Parameter | Zephyr (Chest) | ActiGraph GT9X (Wrist) |
|---|---|---|
| Mean Vector Magnitude (g) | 1.25 ± 0.18 | 1.82 ± 0.30* |
| Peak Vector Magnitude (g) | 2.40 ± 0.25 | 3.10 ± 0.42* |
| Mean HR (bpm) | 165.2 ± 10.9 | — |
| %VO₂max (estimated) | 93% ± 5 | — |
| Estimated METs | 10.5 ± 1.1 | 13.2 ± 1.8* |
| Step Frequency (steps/min) | 172 ± 6 | 178 ± 7* |
*Values are mean ± SD. Significantly different from Zephyr measurement (p < 0.05).
Table 3.
Receiver Operating Characteristics Analysis.
| Threshold Type | AUC (95% CI) | Classification |
|---|---|---|
| Absolute Thresholds | 0.68 (0.58-0.78) | Fair |
| Adapted Thresholds | 0.89 (0.82-0.96) | Excellent |
| Difference | 0.21 (0.11-0.31) | p < 0.001 |
Disclaimer/Publisher’s Note: The statements, opinions and data contained in all publications are solely those of the individual author(s) and contributor(s) and not of MDPI and/or the editor(s). MDPI and/or the editor(s) disclaim responsibility for any injury to people or property resulting from any ideas, methods, instructions or products referred to in the content. |
© 2026 by the authors. Licensee MDPI, Basel, Switzerland. This article is an open access article distributed under the terms and conditions of the Creative Commons Attribution (CC BY) license (http://creativecommons.org/licenses/by/4.0/).
Copyright: This open access article is published under a Creative Commons CC BY 4.0 license, which permit the free download, distribution, and reuse, provided that the author and preprint are cited in any reuse.


