
Submitted:
06 January 2019
Posted:
08 January 2019
You are already at the latest version
Abstract
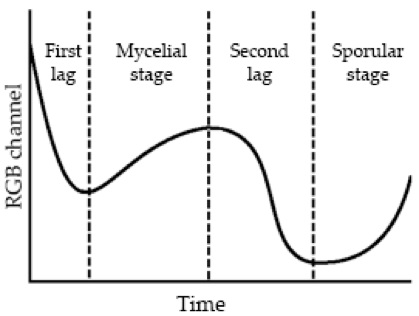
Fusarium graminearum is a cereal pathogen responsible for economic losses worldwide every year. An understanding of its growth is key to control its infection, but current growth models are limited because their size-based approach provides little information about the mold's metabolism. Recently, a RGB (red, green and blue) imaging analysis demonstrated the predictability of F. graminearum color change as it grows in yeast extract agar (YEA). This study aimed to verify the same phenomenon in oats (aw = 0.94, 0.97 and 0.99) and rice (aw = 0.97, 0.98 and 0.99). Photos were taken using a professional camera and a smartphone (iPhone 6) after incubation and during the subsequent 16 days, and average RGB was quantified using ImageJ software. The photos showed very similar color variations, regardless of the type of grain or aw. The mold first adopted a k-selection strategy by growing as a mycelium and then a r-selection strategy, increasing spore production. All RGB channels showed positive Pearson correlations between them (p < 0.001) and it was possible to design a model showing two lag phases, the first prior to a mycelial phase and the second prior to a sporular phase at the end of the experiment.
Keywords:
Fusarium graminearum
; RGB
; oats
; rice
; growth
Copyright: This open access article is published under a Creative Commons CC BY 4.0 license, which permit the free download, distribution, and reuse, provided that the author and preprint are cited in any reuse.


