Preprint
Article

Circuit-Based Approaches for a Superconducting-Like Behavior with Relatively High Critical Current Density

Altmetrics

Downloads

810

Views

1272

Comments

0

This version is not peer-reviewed

Submitted:

20 February 2024

Posted:

20 February 2024

Read the latest preprint version here

Alerts
Abstract
In general, a superconductor has zero resistance, although it requires significant refrigeration or high pressures with high manufacturing costs, which prevents it into practical applications. In other words, solving these issues implies main superconducting researches. To solve these problems, this paper describes a new type of superconductivity, which is independent for temperatures and which operates without pressures. The principles of the presented system are as follows:First a voltage source, a current source and a load are connected in series. Then, the voltage of the voltage source is adjusted to balance the voltage of the load. Under this condition, the balance of the two voltages provides a zero voltage between the taps of the current source and the generated current from the voltage source becomes zero because of the internal infinite resistance of the current source. As a result, the electric powers generated by the two sources are zero, and therefore, the load cannot generate Joule heating because of energy conservation. However, the current from the current source (not the voltage source) is not zero; therefore, we can predict that the resistance of the load must be zero. As a theory, we derived a new electric field and transient attractive force, which result in a very short coherence of an electron pair because there is not the Coulomb repulsive force due to the existence of the above transient attractive force. Note that both the forces are derived by the Poisson equation, which implies that they cannot be compatible. Therefore, the pair combination energy from spins becomes extremely strong, which is not destroyed by the normal heat energy. Moreover, every center-of-mass motion of electron pair results in the Bose-Einstein condensation and the macroscopic wave function, which produces the London equation (i.e., the Meissner effect). Moreover, by introducing the equivalent circuit, this paper conducted numerical calculations. As a result, we could derive numerically zero resistance and responses for additional static magnetic fields as a discharged current, which implies the Meissner effect. Note that this paper has prepared Appendix section, which provides a guide to reproduce actual experiments and preliminary experimental results. These results in the Appendix indicate the zero resistances and Meissner effects.
Keywords: 
Subject: Physical Sciences  -   Condensed Matter Physics

1. Introduction

Let us consider a brief history of superconductor studies as the background for this paper. Since the initial discovery of superconductivity, more than a century has passed. During this time, many significant achievements have been made. For example, Bardeen–Cooper–Schrieffer theory [1], which found that the carrier of a superconductor has the combination of a Cooper pair, was established. Then, ceramic cuprates whose critical temperatures [2,3,4,5,6] are beyond that of LN2 were found. Further, MgB2 [7,8] and Fe-based superconductors [9,10,11,12,13,14] appeared. Moreover, recently H-based superconductors with high critical temperatures and with high pressures [15,16,17] were found. These superconductors promoted studies in condensed matter physics [21,22,23,24,25]. However, the common weak point of the above superconductors is that they require refrigeration or pressures. To overcome this weak point, many previous studies have created some compounds which would be expected to work at higher temperatures. However, most of them did not succeed.
Approximately 10 years ago, we demonstrated a new type of superconductivity using theoretical and experimental techniques [18,19,20]. That is, it is a circuit-based approach not a compound. This superconductivity is generated when a diffusion current from a current source is supplied to a doped semiconductor and an electrostatic field from a condenser cancels the Ohmic voltage of the semiconductor. As a result, the internal voltages are zero but the current remains without refrigeration. Accordingly, this new superconductivity bypasses the problem of refrigeration because it is not related to temperatures.
In the present paper, we describe further new type of superconductivity, which demonstrates extreme progress compared with the above-mentioned superconductivity discovered 10 years ago. The features of this study are
  • The method generates superconductivity without refrigeration and without pressures;
  • Its critical current is sufficiently high;
  • It does not require specific substances or the mounting of specific setups; and
  • The mechanism of this new type of superconductivity is explained in terms of condensed matter physics.
To distinguish the abovementioned two new types of superconductivity, we will refer to the one developed 10 years ago as PNS (referring to the Previous New Superconductivity).
Compared with PNS, the present superconductivity differs in the following aspects.
  • The critical current density is much larger. This fact is important when considering practical applications. In PNS, the critical current was less than 10 μA, which prevents it from being used in practical applications; however, the critical current of the present superconductivity is estimated to be 104 A order. This value will pose no problems for practical applications.
  • It is clear that the mechanism is the Meissner effect. In PNS, we knew that the superconductor discharged a current as a result of the application of static magnetic fields. However, the details of that mechanism were not clear. In the present study, producing a new electric field, we were able to derive the concrete London equation and identify the mechanism as the Meissner effect. A key point is that the sample in an experiment discharges a current to release the additional energy derived from the applied magnetic field energy.
  • Numerical simulations result in clear superconductivity. In PNS, we could not establish a simulation method; however, the present superconductivity system implies a pure electrical circuit, which enabled us to employ simulation software for electrical circuit calculations (e.g., the PSIM software) by introducing an equivalent circuit. The use of this simulation method enabled us to investigate this system via various approaches.
  • It is not necessary to prepare the specific device. In PNS, we had to produce the device which is a sandwich of semiconductor, insulator and condenser pole plates. Although this device confirmed the zero resistance, it is hard to put it into general practice. However, the present method of this paper does not require the production of the device or materials. This is a new and significant point compared with PNS.
To conclude, the mechanism of our new superconductivity including PNS enables a comprehensive understanding of the generated superconductivity.
As relevant fields, superconducting circuits, quantum circuits or micro-circuits are studied by another researcher [26,27,28,29]. However, most of them employ the existing refrigerated superconductors. For example, the concepts of the existing superconductors are employed like Josephson junctions, a critical temperature, a critical current or an order parameter and so on. However, our superconductivity does not require any refrigeration, which is different from the existing superconductors.
In this paper, we will first review the characteristics of both the voltage and current sources. Then, the principle of our system is described. The mechanism of pairing and forming the macroscopic wave function is discussed theoretically with obtaining the London equation. Moreover, a critical current equation is formulated. The Methods section proposes an equivalent circuit with calculations of the inductance of the internal toroid. In the Results section, we calculate concrete values of the critical currents and use the PSIM software to calculate the time dependences of the voltages and currents in the sample.
Moreover, importantly, we have prepared Appendix A of a guide to reproduce the experiments and of the presentation of preliminary experimental results. We believe that this appendix is significant because it provides a solution of obtaining a superconductor, which enables us to enhance performances of every electrical device. Although it is all right that the results of the experiments in this appendix are placed in the main body but because they are preliminary tests, we located the descriptions at the end of the paper as an Appendix A.
In summary, the contents of the theory are simple but novel and thus it provides a new knowledge to the field of condensed matter physics like a new paring system, new forces or a new type of Bose-Einstein condensation. Furthermore, this theory is supported by the numerical results and the preliminary experimental results from Appendix A.

2. Principle

2.1. Review of Voltage and Current Sources

In our proposed system, voltage and current sources are employed, which are elements of a general electrical circuit. Figure 1 shows schematics of these sources. The voltage source generates a constant voltage while its current is varied depending on the connected load. The internal resistance of this voltage source is ideally zero. Conversely, the current source supplies a constant current (not voltage) to the load, which is not related to the electrical resistance of the load. Therefore, its voltage is varied depending on the resistance of the load. In contrast to the voltage source, the internal resistance of the current source is ideally infinite. Moreover, a current from the current source stems from a diffusion current, which is related to a collector current in transistors. This fact will be important later when discussing the theory.

2.2. Principle

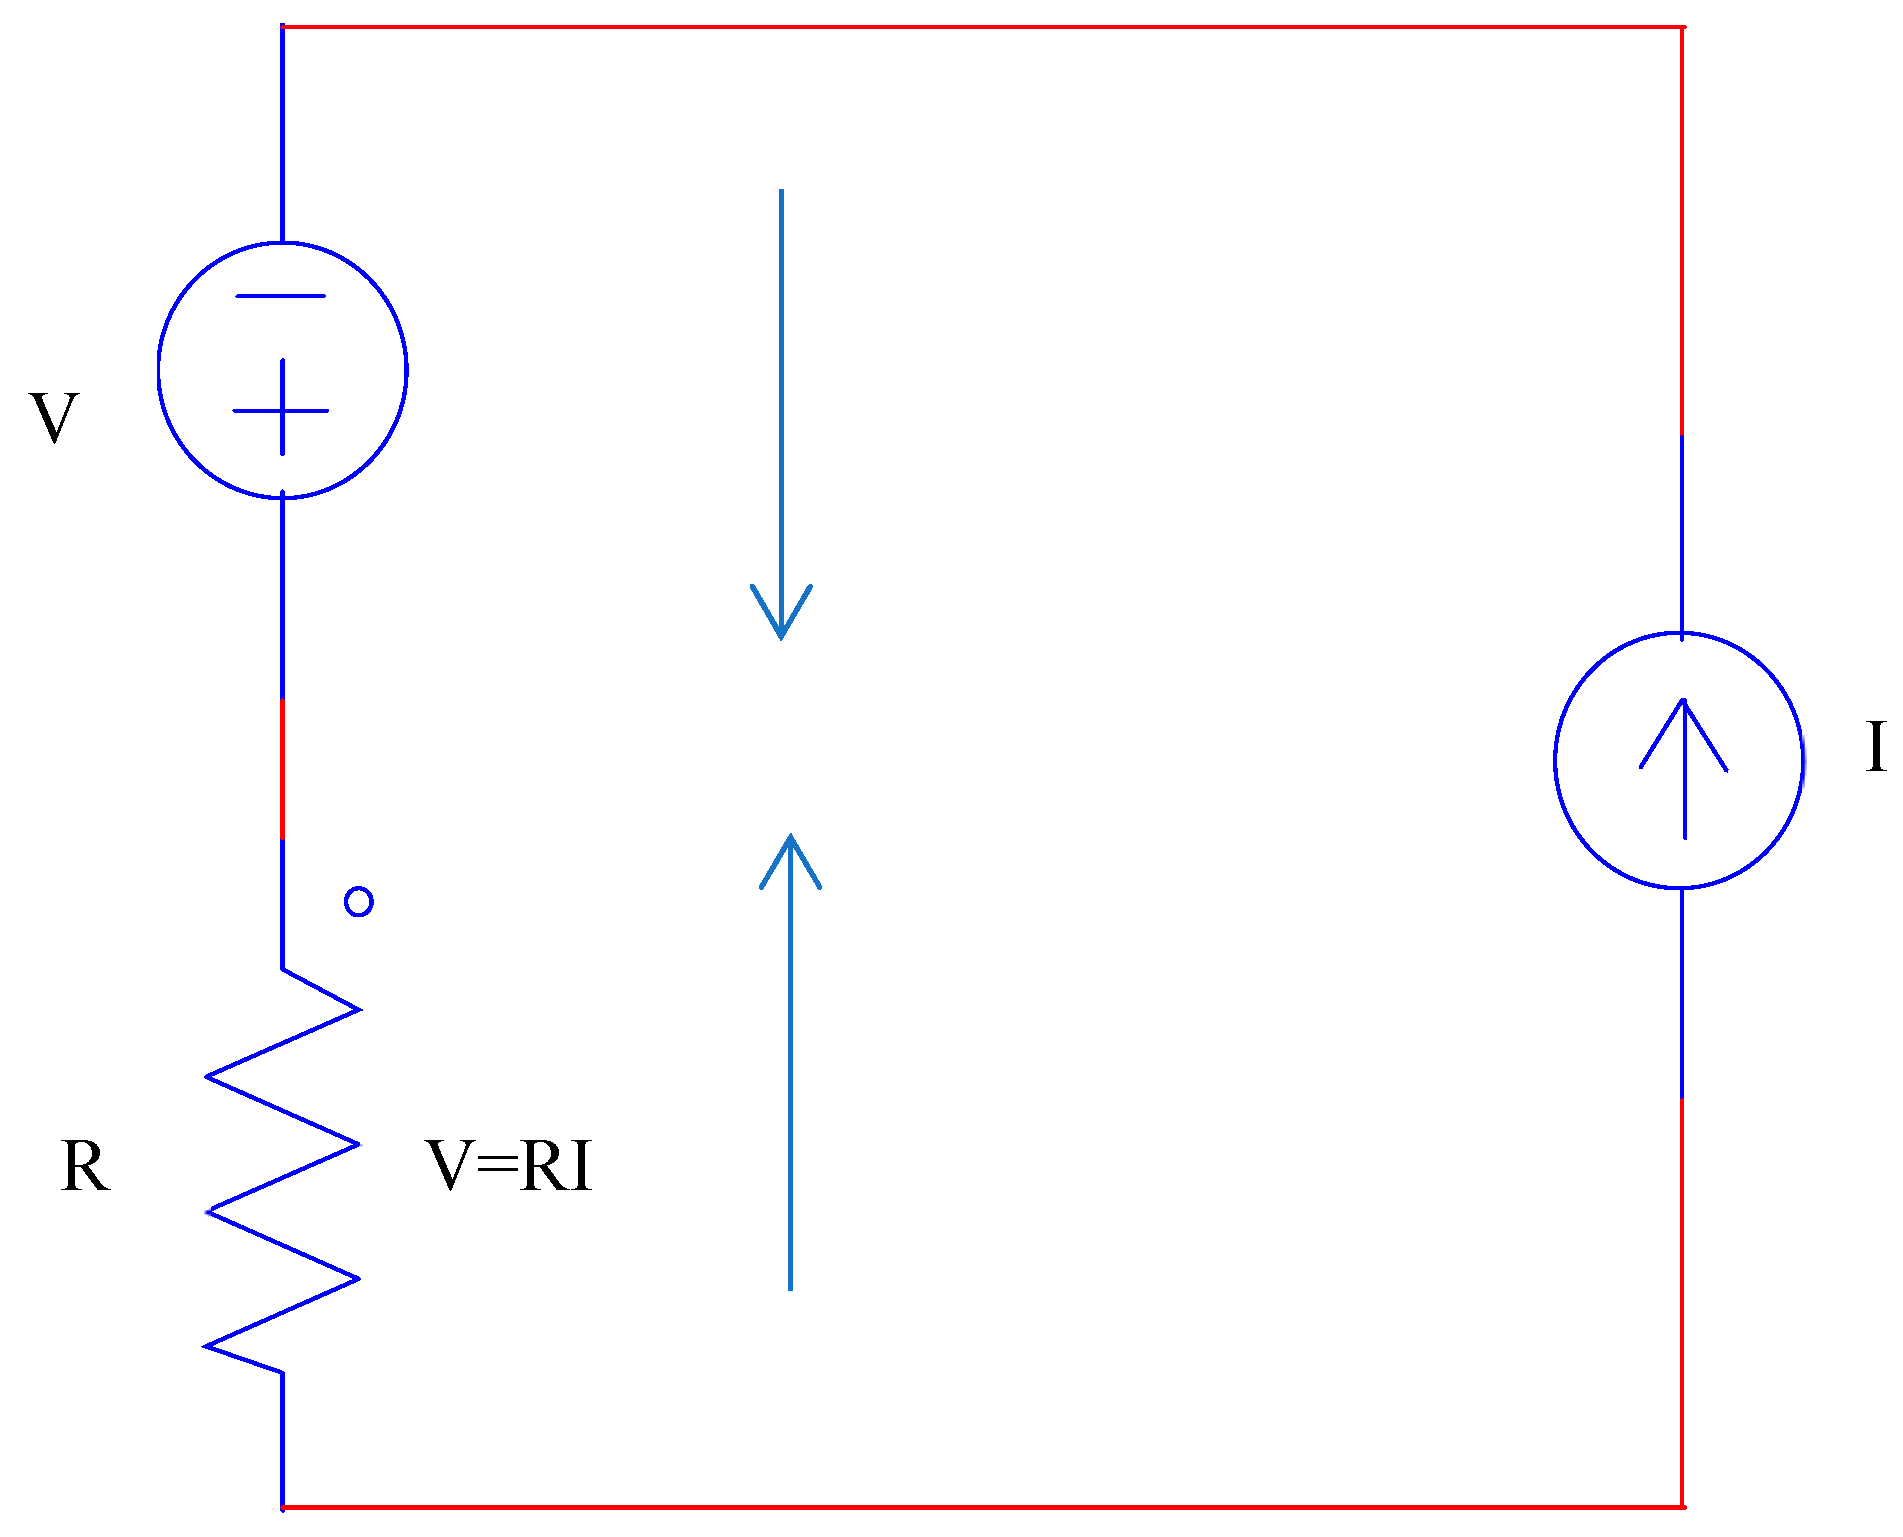
As shown in Figure 2, a voltage source, a current source, and a load are connected in series. As previously mentioned, the internal resistance of the voltage source is zero, whereas the internal resistance of the current source is infinite. Moreover, the output voltage is equal to the voltage from the load, as derived via Ohm’s law. Considering these points, the following can be said:
  • The generating current from the voltage source is zero because of the infinite resistance of the current source. Therefore, this source generates only the voltage V.
  • For the current source, because of the balance of the two voltages of the voltage source and the load, the voltage between the taps of the current source becomes zero. Therefore, this source supplies only the current I to the load.
These characteristics are listed in Table 1.
Considering the above, we see that neither source generates electric power. Therefore, energy conservation requires that the load not receive any energy and that the load not generate Joule heating. Because the current I exists in the load because of the current source, the absence of Joule heating by the load results in zero electric resistance. Therefore, we can predict that this system, in principle, will result in a new type of superconductivity. However, before we reach this conclusion, it is necessary to theoretically examine the mechanism of the superconductivity in terms of condensed matter physics and demonstrate that the Meissner effect is generated.

3. Theory

3.1. Transient State

3.1.1. Spatial Electron Concentration at Transient State

First, we assume that the voltage of the voltage source and the voltage of the load are equal. Then, the diffusion current of the current source is introduced. Considering the conductivity, introducing an average electric field, and substituting a diffusion constant result in a specific and special electron concentration. The voltage balance is
V E = V = R I ,
R = ρ l S ,
where VE, V, R, and I denote the voltage from the voltage source, the voltage of the load, the resistance of the load, and the current from the current source, respectively. In Eq. (1-2), ρ, S, and l denote the resistivity, the area of the load, and the length of the load, respectively. The diffusion current I is expressed as [18,30]
I = S q D d n d ξ ,
where q, D, and n denote the electron charge, the diffusion constant, and the electron concentration, respectively. Therefore, the Ohmic voltage becomes
V = ρ l S S q D d n d ξ = l σ q D d n d ξ ,
where σ denotes the conductivity of the load. Here the following equations are substituted:
σ = q n μ ,
D = μ k B T q ,
V = E i l ,
where μ, kB, T, and Ei denote the average mobility, the Boltzmann constant, the temperature, and the local electric field, respectively. Therefore, the local electric field is
E i = k B T q n d n d ξ .
Solving this equation gives
n = n 0 e x p ( q E i k B T ξ ) .

3.1.2. Attractive Potential and Coiled New Electric Field at the Transient State

We employed the Poisson equation to derive the interaction potential between two electrons at the transient state. Equation (6) gives the concentration in terms of the electrons; substituting this concentration into the Poisson equation produces the following attractive interaction potential ( V α < 0 ) :
V α = n 0 k B 2 T 2 ε E i 2 e x p ( q E i k B T ξ ) ,
where ξ is variable and relative macroscopic distance between the two electrons. Hereafter, we refer to this potential as the transient state potential. It is very important to note that the Coulomb repulsive interaction is also determined using Poisson’s equation. Accordingly, this repulsive interaction does not appear at a macroscopic scale. Instead, the abovementioned interactive potential Vα works. Note that, at the steady state, the macroscopic relative distance ξ becomes zero but microscopic one is not zero. In this sense, at the steady state, we will consider the Schrodinger equation.
In the process of solving the Poisson equation, we derived the following new electric field at the transient state:
V α = n 0 k B 2 T 2 ε E i 2 e x p ( q E i k B T ξ ) .
When defining the circle integral of eq. (8) (i.e., a voltage), this integral must end up within a material. This implies that, in the material, a coil voltage must be defined. The spatial integral of Eq. (8) for ξ results in a negative voltage. As discussed later, we will see that, immediately prior to the transition from the normal state to the superconducting state, this negative voltage appears in our simulation. This new electric field appears at the transient state and thus an inductor voltage will be essential. That is, as discussed later, the spatial integral of eq. (8) will form a coil.

3.1.3. Combination of Two Electrons and Critical Current Density

The transient state attractive interaction potential Vα results in two electrons that approach each other until their distance is only the lattice diameter due to the lack of the Coulomb repulsive interaction at the macroscopic scale. At this moment, the macroscopic relative distance ξ becomes zero. Note that, however, microscopic one is not zero. Therefore, the transient state up to the combination of the two electrons is a macroscopic phenomenon. However, only when the potential Vα vanishes do we need to consider the microscopic scale. As described later, however, at this moment, when the potential Vα vanishes, the relative kinetic energy also vanishes. Therefore, we do not need to consider the Hamiltonian of the quantum mechanics only before the combination of two electrons. Instead, it is necessary to consider the Hamiltonian for quantum mechanics for the center-of mass motion as described later.
As a result of the transient interaction Vα, the two electrons take the location of a lattice, and at a lattice (i.e., macroscopic variable ξ = 0), the total energy ET of the system is expressed as follows:
E T = V α ξ = 0 + V + V p ,   and V α ξ = 0 + P = 0 .
Here, V is the spin magnetic potential [18] expressed as
V = q 2 ħ 2 16 π m 2 z m 3 ,
where m and zm denote the electron mass and the microscopic relative coordinate, respectively. In Eq. (9), P and Vp are the kinetic and zero-point energies in terms of the Debye temperature at the lattices, respectively. Vp is expressed as follows:
V p = 1 2 ħ ω D = 1 2 k B θ D ,
where ωD and θD indicate the Debye angular frequency and temperature, respectively. The following conditions should be satisfied for the two-electron combination:
V α ( ξ = 0 ) V p ,
V P .
For Eq. (12-1) to be satisfied, both electrons must be located at the zero point of a lattice. This condition, i.e., critical current density, will be considered later. To satisfy Eq. (12-2), the microscopic relative distance zm (i.e., the coherence) should be
z m 1.0 × 10 9   m .
If Eq. (12-1) is satisfied, then, Eqs. (12-2) and (13) are also satisfied because the zero-point energy implies the quantum fluctuation energy of a lattice. Therefore, when current density is less than the critical current density, only the spin magnetic potential V remains, and the entire energy takes on a negative value, which implies that the two electrons have a net combination, in which a collision between the two electrons becomes completely inelastic. Consequently, these two electrons combine to form a pair.
Even though the kinetic energy in terms of the relative motions exists in the transient state, as mentioned, in the steady state, only the spin attractive force V remains:
V = q 2 ħ 2 16 π m 2 a 3 ,
where a denotes the constant coherence of an electron pair.
Therefore, this potential is taken to be the superconducting energy gap of our superconductivity. As mentioned, the two-electron pair combines at the distance of a lattice, which is typically estimated to be 1 Å, and, therefore, the magnitude of the energy gap is estimated to be approximately 10-18 J. The typical room temperature energy kBT (where the temperature T = 300 K) is approximately on the order of 10−21 J. Therefore, this superconducting energy gap is much larger than that of room temperature. This implies that the individual electron pair will not be destroyed via normal heating.
Next, let us consider an equation of the critical current density.
At the critical point, i.e., in the case where the inequality of Eq. (12-1) is maximum,
n 0 k B 2 T 2 ε E i 2 = 1 2 k B θ D .
From this equation, the concentration n0 can be expressed as
n 0 = ε E i 2 k B T 2 1 2 θ D .
In Eq. (14), considering the second equation of Eq. (9), the left-hand side of Eq. (14) implies a kinetic energy P. Therefore,
n 0 k B 2 T 2 ε E i 2 = 1 2 m v 2 ,
where m and v denote the mass of the electron and the velocity in terms of the relative motions, respectively. Substituting Eq. (15),
ε E i 2 k B T 2 1 2 θ D k B 2 T 2 ε E i 2 = 1 2 m v 2 .
That is,
1 2 k B θ D = 1 2 m v 2 .
Therefore, the relative velocity is derived to be
v = k B θ D m .
Consequently, the critical current density equation is obtained such that
j c = q n 0 v = q ε E i 2 k B T 2 1 2 θ D k B θ D m .
Note that, in the Results section, we will calculate numerical values of the critical current density using Eq. (20).

3.2. Macroscopic Wave Function and the London Equation at the Steady State

Given that a two-electron pair binds strongly, from the discussion in the previous sections, we now precede to a discussion of Bose–Einstein condensation and the macroscopic wave function at the steady state.
As described later, the Hamiltonian equation of an electron pair in terms of the center-of-mass motion is expressed simply as
H = ħ 2 2 2 m d 2 d x 2 + U .
The potential U in the above equation indirectly implies the electrostatic potential of the two electrons, i.e., the internal electric field at a lattice:
U = x 1 x 2 2 q E i d x = 2 q E i ( x 2 x 1 ) ,
where x1 and x2 denote the positions of the two electrons.
In the steady state, we are now considering the combined electron pair at a lattice, without collisions (i.e., the interactions) with another pair, and thus this temperature-independence allows us to consider that the dimension of the center-of-mass motion whose direction is along Ei (i.e., the movement depends on eq. (22)) is single. Note that the distribution of internal electric field Ei at a lattice is also single dimension. The reason of the absence of interactions between pairs and pairs will be discussed soon. However, at the transient state, the existence of the potential Vα implies that each electron motion depends on temperature T. Moreover, because there are not net collisions between pairs and pairs at the steady state, it is potential for a phase transition that is related to temperatures not to exist [25]. The absence of the interactions with another pair guarantees the physical picture of one body.
The local placements at the identical lattice of the two electrons (i.e., the local and strong combination of the two electrons at a lattice) imply that x1 = x2. Employing the Hamiltonian equation, a wave function of the pair in terms of the center-of-mass motion can be obtained. Note that, at the moment when the electrons have an identical location at a lattice, the potential U in the Hamiltonian equation converts to an eigenvalue (i.e., the kinetic energy in terms of the center-of-mass motion) that stems from the local electric field Ei. Accordingly, the distribution of the local electric field Ei within the lattice vanishes.
φ i = γ exp [ 2 m μ i E i ħ j x ] ,
where μi denotes the mobility of the pair at the lattice. Using the following equations,
J σ i = E I   and
σ i = 2 q V i / i μ i ,
The wave function of an electron pair can be derived such that
φ i = γ exp [ 2 m j ħ x J V i / i 2 q ]
where σi, △Vi, and J denote the conductivity at the lattice, the variation quantity of the volume with respect to the increase in the index i, and the current density, respectively.
Equation (24-1) implies the proportion of Joule electric and electrostatic fields at the lattice-scale level. As mentioned, the above wave function of an electron pair is indexed by i, and a wave function at a subsequent lattice does not interact with this wave function because the distance between the two neighboring lattices is much larger than the coherence of the two electrons. Note that, in the previous section, we mentioned that the coherence of a combined pair is estimated to be approximately 1 Å (i.e, the typical diameter of a lattice). This is the reason why each electron pair does not interact with each other.
The entire wave function is represented in the following equation:
ψ = φ i = γ i exp 2 m j ħ x J Δ v i i 2 q .
Assuming that the index i is infinite and that the sample volume of a load is kept constant, the lattice volume △Vi /i converges to the differential dV. Accordingly, the countable lattice concept becomes ineffective, and a macroscopic continuous body appears. That is, we obtain a macroscopic wave function that is mandatory when considering the mechanism of the new superconductivity, and this macroscopic wave function is needed to derive a London equation (i.e., a Meissner effect):
η exp 2 m j ħ x J 2 q d V ] = η exp [ 2 m j ħ x a J 2 q d S = η exp m I ħ q a j x .
In Eq. (27), the wave number K is
K = m I ħ q a = I 2 M a ,
where M denotes the spin magnetic moment of an electron and a is the constant coherence in terms of our new superconductivity. The spin magnetic moment in this equation can be correlated to the combination energy (i.e., the spin interaction) from Eq. (10) when the microscopic ordinate zm is replaced with the constant coherence a.
K = I 2 4 π a V V 0 ,
where V denotes the spin interaction given in Eq. (10-2).
In Eq. (28-2), the macroscopic current I is independent of the collision time and is therefore a superconducting current. Further, the wave number K in this equation is uniform and is not related to space, e.g., it is not related to the lattice index i. Therefore, all the quantum states converge to a single state, and Bose–Einstein condensation is derived.
Let us consider the Meissner effect derived from the macroscopic wave function. As mentioned, the macroscopic wave function is
ψ = η exp ( m I a ħ q j x ) ,
In this equation, the macroscopic current I appears. In general, a current needs to be continuous in space and time. In this case, therefore, the current I is continuous for the output current I from the current source. Accordingly, this superconducting current must generate a self-magnetic field in the load sample and, if a new superconductivity is generated, this self-magnetic field must be canceled out.
Considering the above self-magnetic field A, the Aharonov–Bohm (AB) effect [11] can be introduced to the macroscopic wave function, Eq. (27):
ψ A = ψ e x p [ ( m I a ħ q x + q ħ A d s ) j ] .
Based on the property of phases,
m I a ħ q x + q ħ A d s = 2 n π .
Taking the differentials to both sides for variable x,
m I a ħ q = q ħ d d x A d s .
That is,
m I a ħ q = q ħ A d s d x .
I j n d S .
Introducing a small angle parameter φ to the differential at the right side,
m a ħ q j n d S = q ħ A φ .
Assuming a differential for integrals for the surface is very small, Eq. (33) becomes
m a ħ q j n × a 2 = q ħ A × φ .
Therefore, we derive a London equation:
j n = q 2 φ m a 3 A .

3.3. Consideration of the Meissner Effect

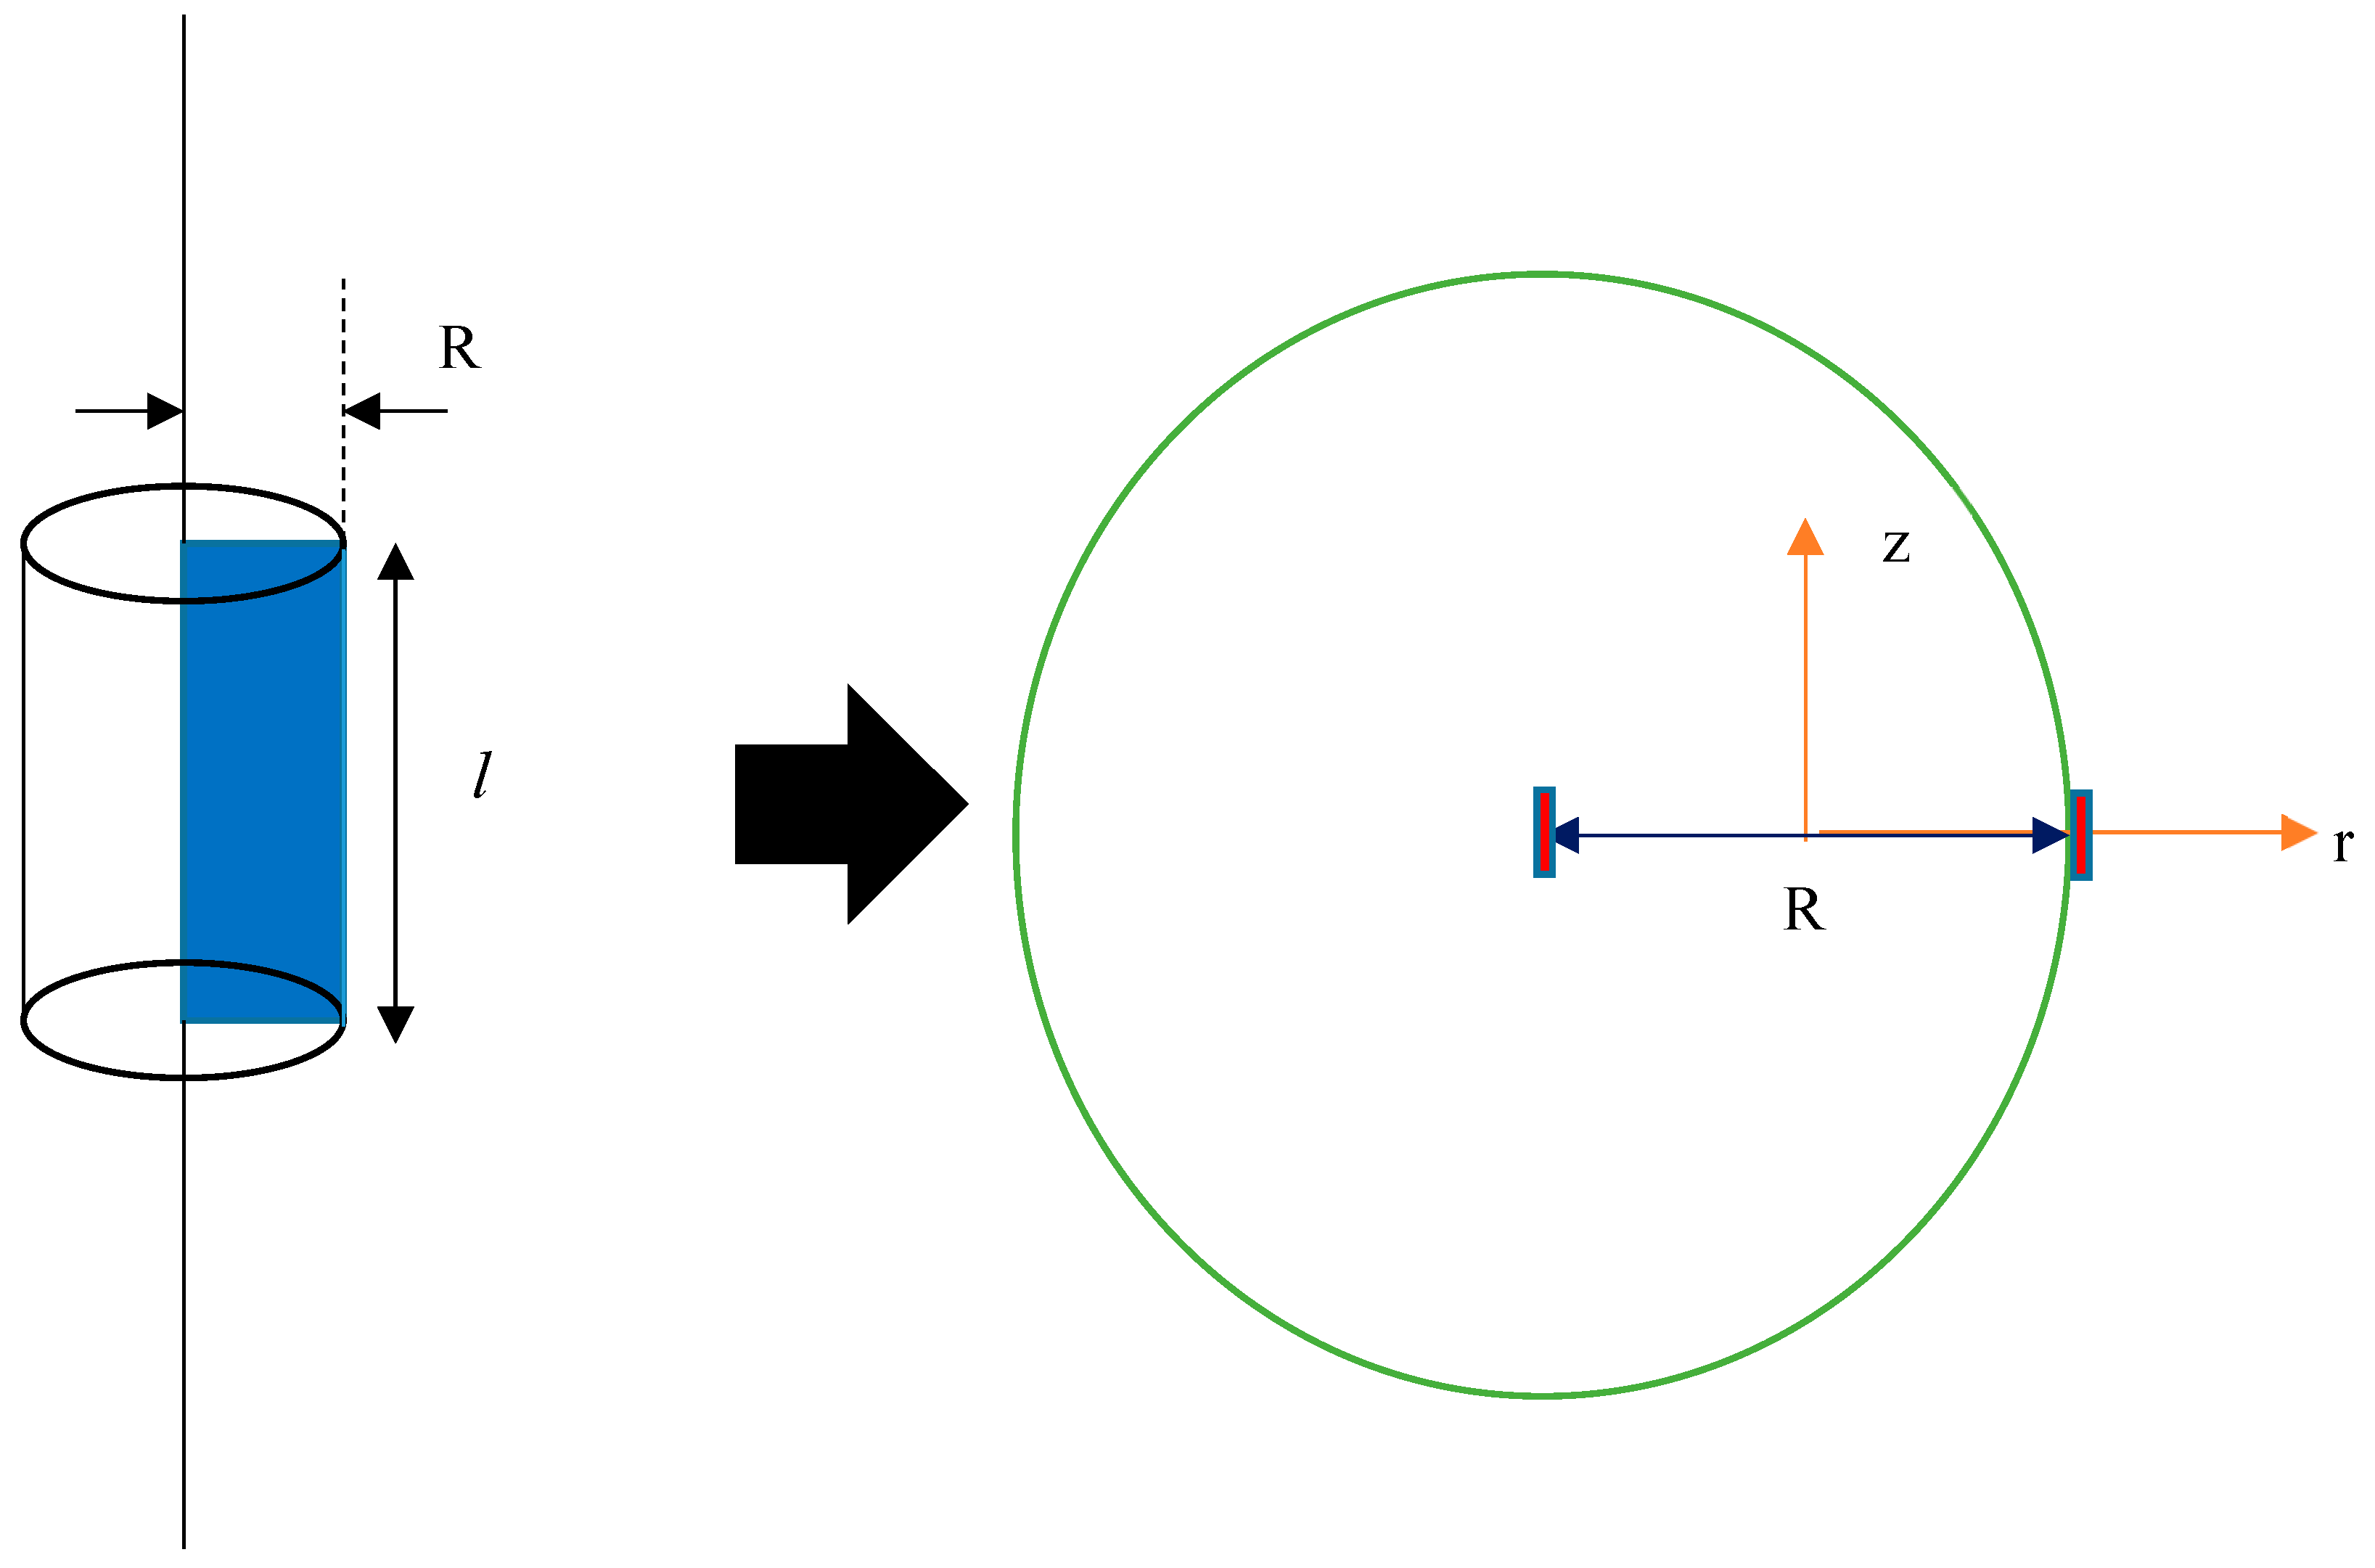
When considering a sample with a cylindrical shape, it is necessary to introduce an internal toroid whose large radius corresponds to that of the cylindrical sample. Then, we consider the renewable coordinate that is tangential to the large circumference as corresponding to the z-axis in cylindrical coordinates; see Figure 3. We refer to this type of coordinates as the “specific cylindrical coordinates.”
From the initial time to the transition time tc, there is a normal self-magnetic field distribution B0 in the sample along the direction of the z-axis of the specific cylindrical coordinates. However, due to the existence of the new electric field eq. (8) at the transient state, internal voltages must be defined within a material. This implies that coils appear at the transient state within the material. In the process of forming coils, negative voltage appears and currents are produced. Owing to the continuous property of the current, this generated current becomes the persistent one of eq. (35) at the steady state. In this process, the generated magnetic field cancels the existing self-magnetic field B0 whose direction is along the z-axis of the specific cylindrical coordinates. Therefore, the internal net magnetic flux density becomes zero despite the existence of the current I. That is, from energy conservation, the magnetic field energy derived from B0 is transformed as a discharged current, which generates a temporal negative voltage, as mentioned previously.
Let us consider the above more concretely. Here, in the right panel of Figure 3, we consider one element coil. However, as discussed soon, this element coil is divided into many local coils. Assuming that the length l in the left panel of Figure 3 is considered to be Na, where N and a denote arbitrary integer and the coherence of a pair respectively, in the conductor, many local divided coils and currents exist. However, considering the analogy of the Stokes’ theorem, these internal local currents of each local divided coil cancel with each other and the net current eventually becomes the most outer current of the blue surface in Figure 3. These phenomena imply that, as described in the theory section, the cancelation of the local currents indicate the perfect inelastic collisions of two electrons and the two electrons bind by the spin magnetic force eq. (10). After that, these combined electrons move uniformly by the local electric field Ei and thus they result in eq. (27) (i.e., the Bose-Einstein condensation). However, the superconducting current I in eq. (27) still generates a self-magnetic field B0 and thus AB effect leads to the London equation (35) whose current distributes along the most outer line of the blue surface in Figure3. Note that, however, forming of BE condensation and London equation actually occur simultaneously. Thus, the exclusion of the internal magnetic field B0 at the transient state is taken over to the steady state. Note that, importantly, if the further magnetic field is applied after the steady state, in order to maintain the value of the persistent current of eq. (35), a current is also discharged.

4. Method

4.1. Equivalent Circuit

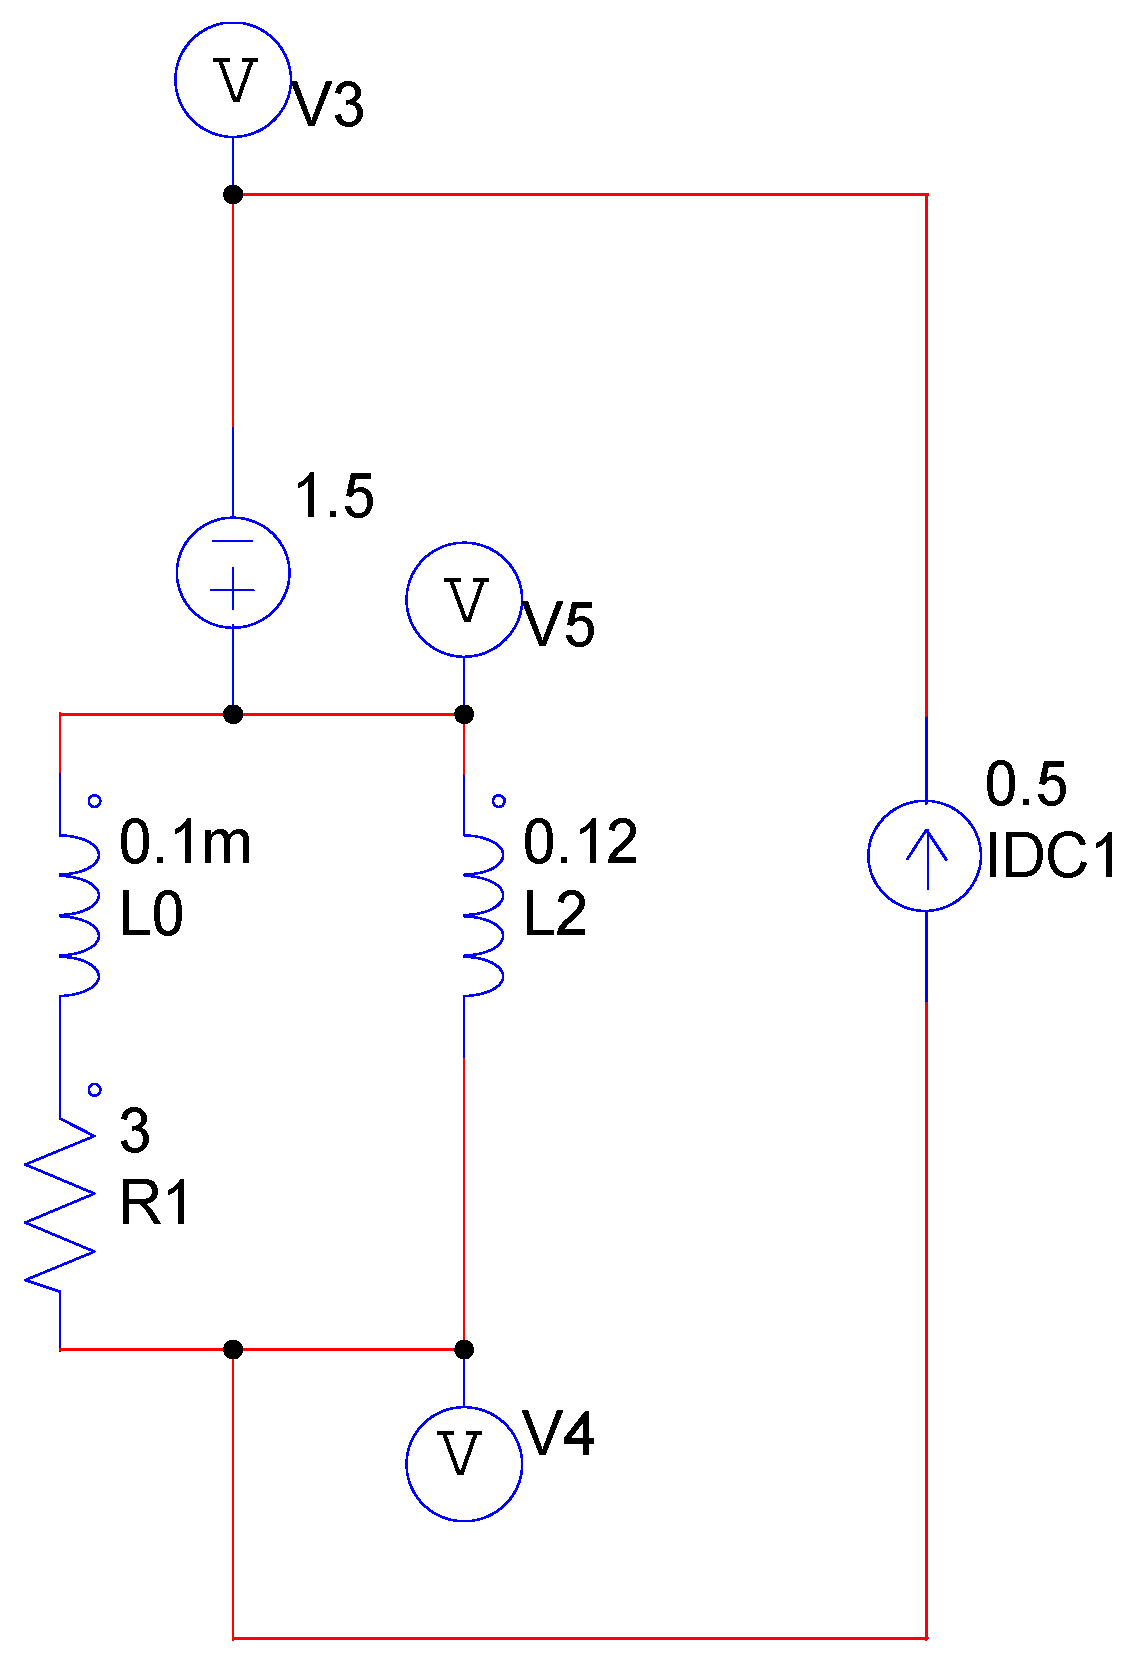
In the previous section, it was found that an internal, local and divided toroid inductance L is produced in the sample. Considering this, we can introduce an equivalent circuit for our system, shown in Figure 4, which has an inductance L.
The sample has both a resistance R named “R1” and an inductance L named “L2”. Moreover, generally any substance has a small inductor factor (i.e. a flux) when subjected to the transport-current. Thus, in the equivalent circuit, this inductor factor L0, which is connected by direct connection with “R1”, is employed. This small inductor factor generates a self-magnetic field. Note that these inductances do not give any influences to the voltage balance shown in Figure 2, because Figure 2 implies the steady state and thus sufficiently long time makes the influences of the inductances cease, and we will forecast that the superconductivity appears.
For the numerical calculations, we employed the PSIM electrical circuit software, which can be purchased from their website.

4.2. Calculation of Inductance L

To simulate the equivalent circuit, we need to estimate a concrete value of the inductance L named “L2”, which is determined by the geometrical factors of a local divided coil. As mentioned, it is necessary to consider the specific cylindrical coordinates, i.e., an internal toroid. The inductance of the toroid is given as
L = μ 0 N 0 2 S ( 2 π R ) 2 ,
where μ0, N0, S, and R denote the magnetic permeability in a vacuum, the turn number, the area, and the radius of the toroid, respectively. Note that the area S is indicated in Figure 3 as a blue surface. However, L2 indicates the transient coil and thus we now consider each divided local coil. Note that each divided local coil is independent to each other until two electrons combine and their currents are canceled. That is, although at the initial state each dived local coil coexists within the blue surface in Figure 3, they are not the series connections or the parallel connections. Thus, the behaviors of the local coils can be represented by an inductance of one local coil. Note that, considering voltage-current characteristics of an inductor, although the voltage and current vary with time, that inductance still remains. For details, see Section 3.3. In eq. (36), the turn number is derived from the fact that each element coil of the internal toroid is distributed with a relative distance that is equal to the coherence a of our superconductivity (see the right panel in Figure 3):
N 0 2 π R a ,
where the coherence a is approximated as 1 Å and thus eq. (37) becomes large. Assuming that S R a , where a is coherence and R is radius for the cross section for the current and that R 1 × 10 5 m , for example, the inductance L is calculated as
L 0.12   H .

4.3. Resistance of a Load

In general, the value of the resistance of a load is determined by both the conductivity and its shape. In this paper, under the condition that the shape of the load of the sample is kept constant, the conductivity is varied. That is, while the inductance L named “L2” is kept constant, the resistance named “R1”of the sample is varied.

5. Results and Discussion

In this paper, to overcome the weak points of the refrigeration and of adding high pressures for existing superconductors, a temperature-independent superconductivity was presented. Here let us consider the results when operating our system. Note that variations of the value of resistances will confirm the reproductions of the phenomenon.

5.1. Circuit Simulations

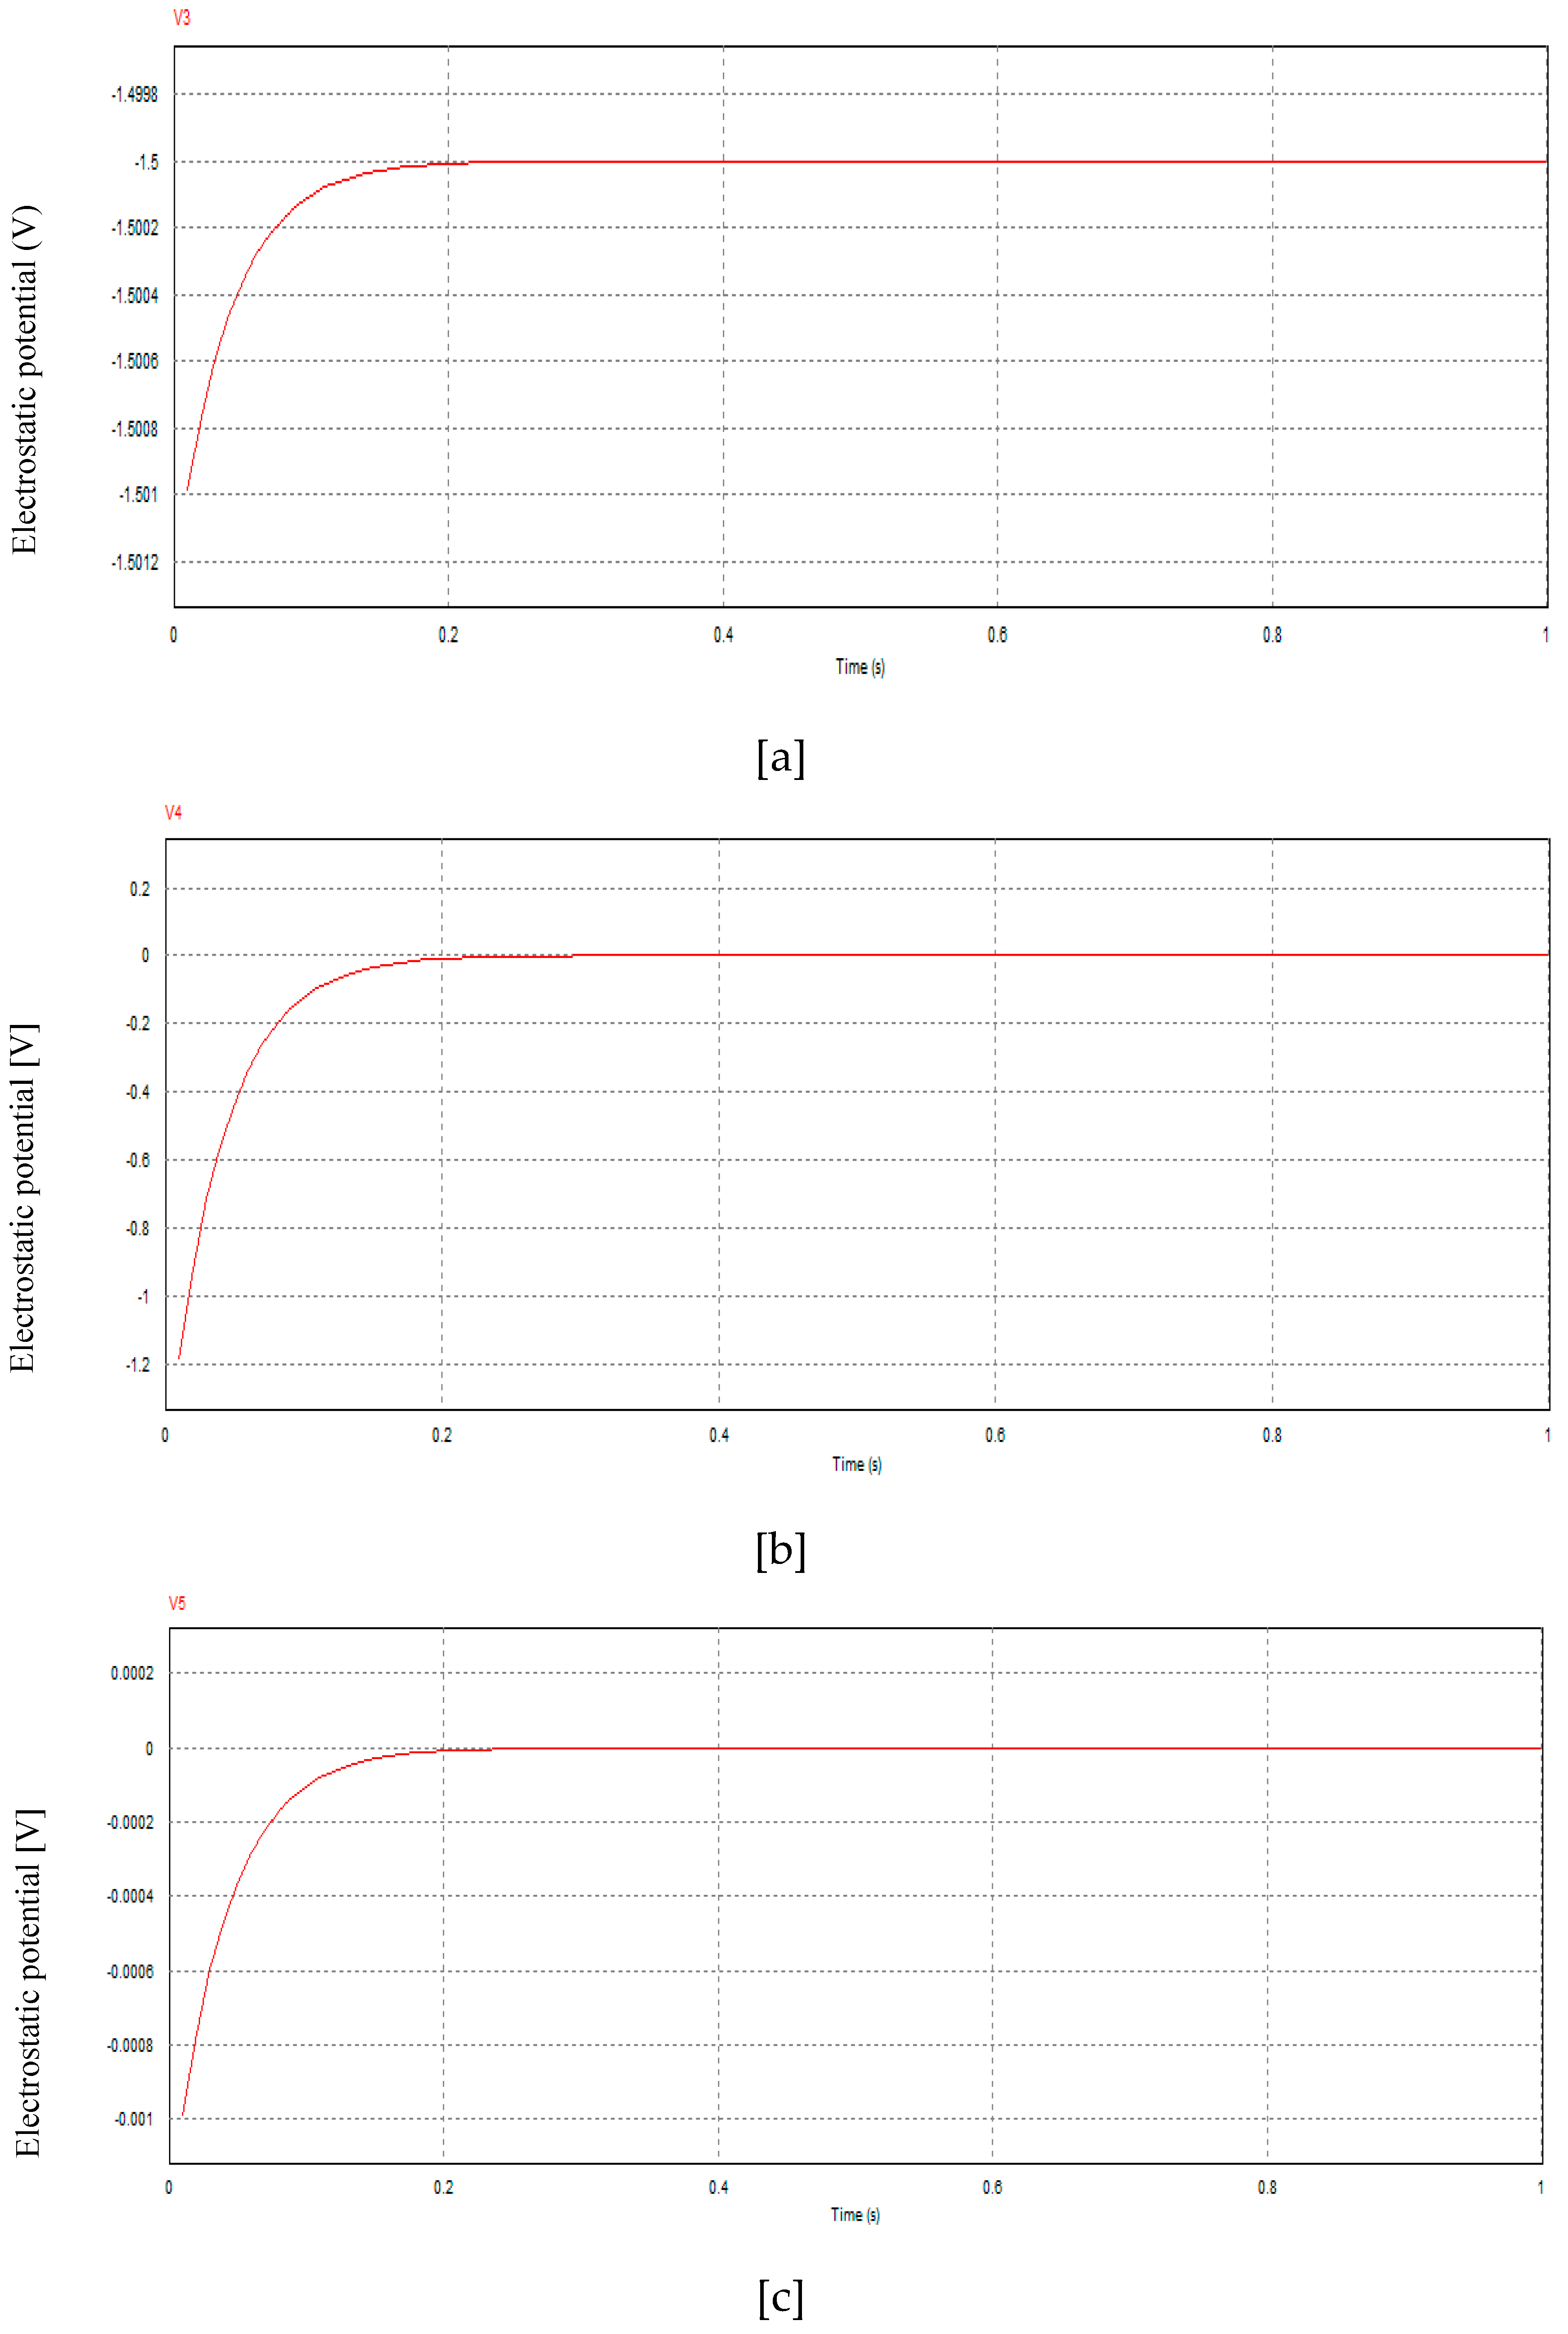
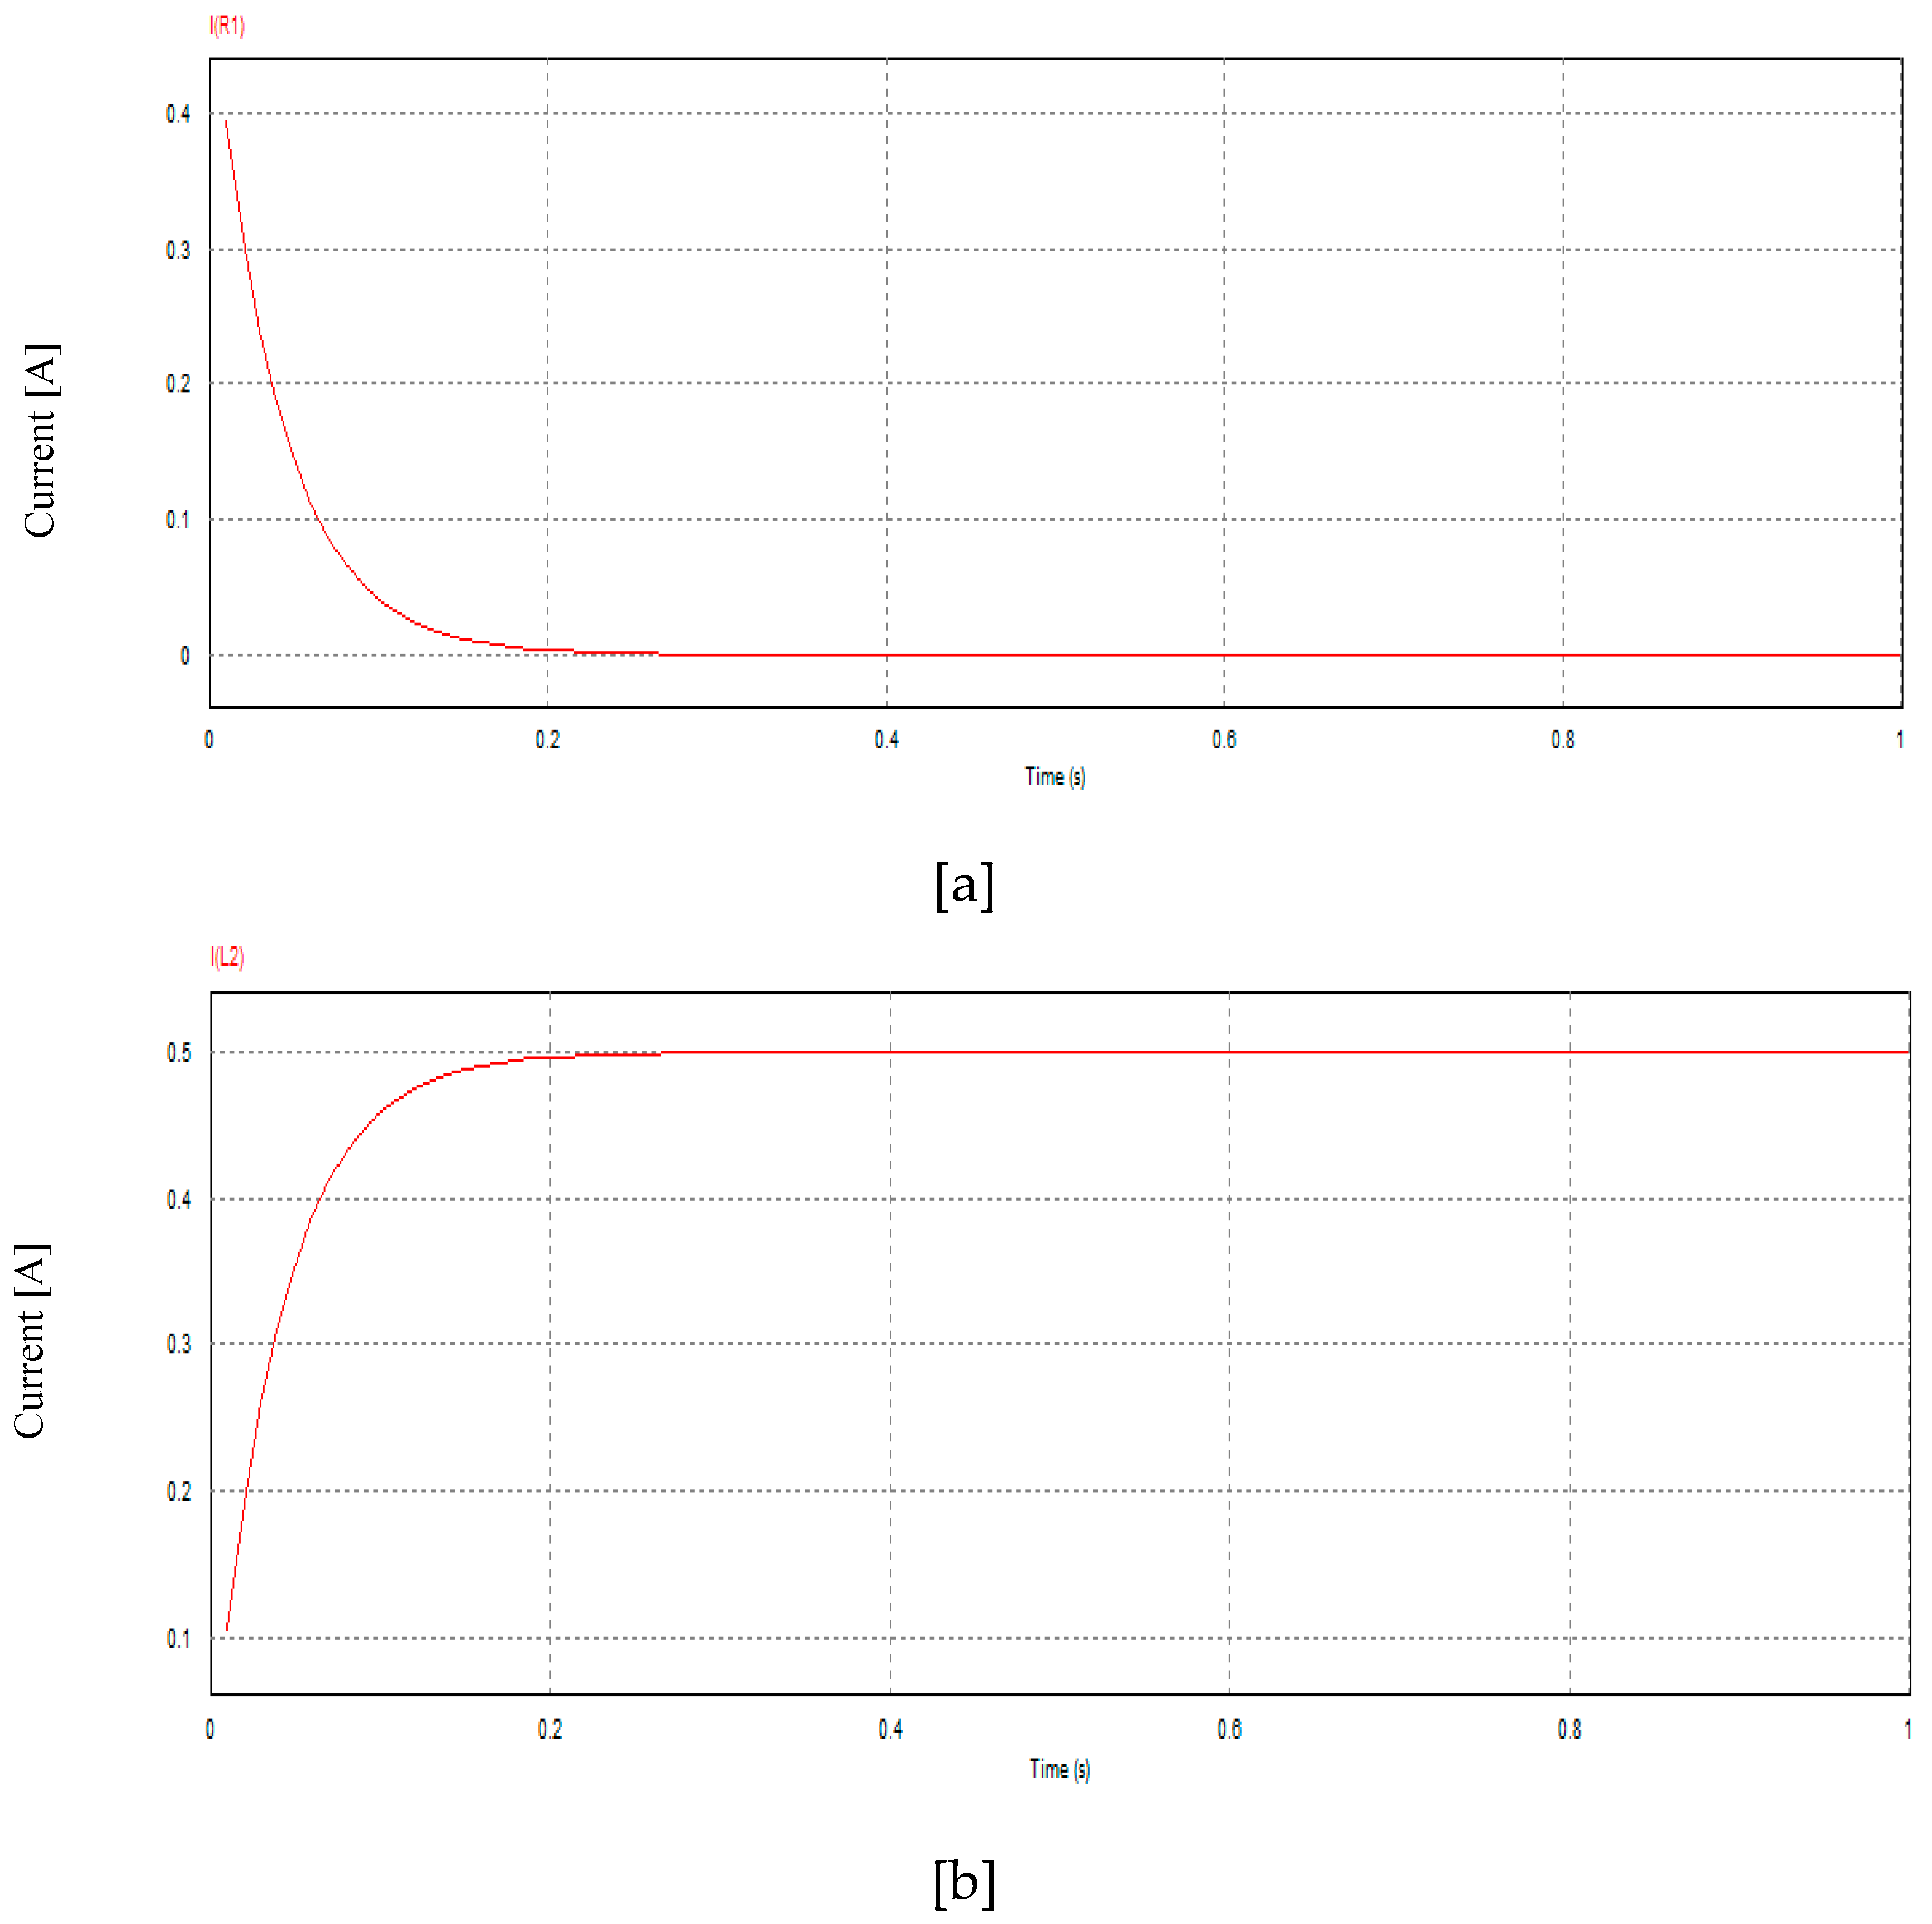
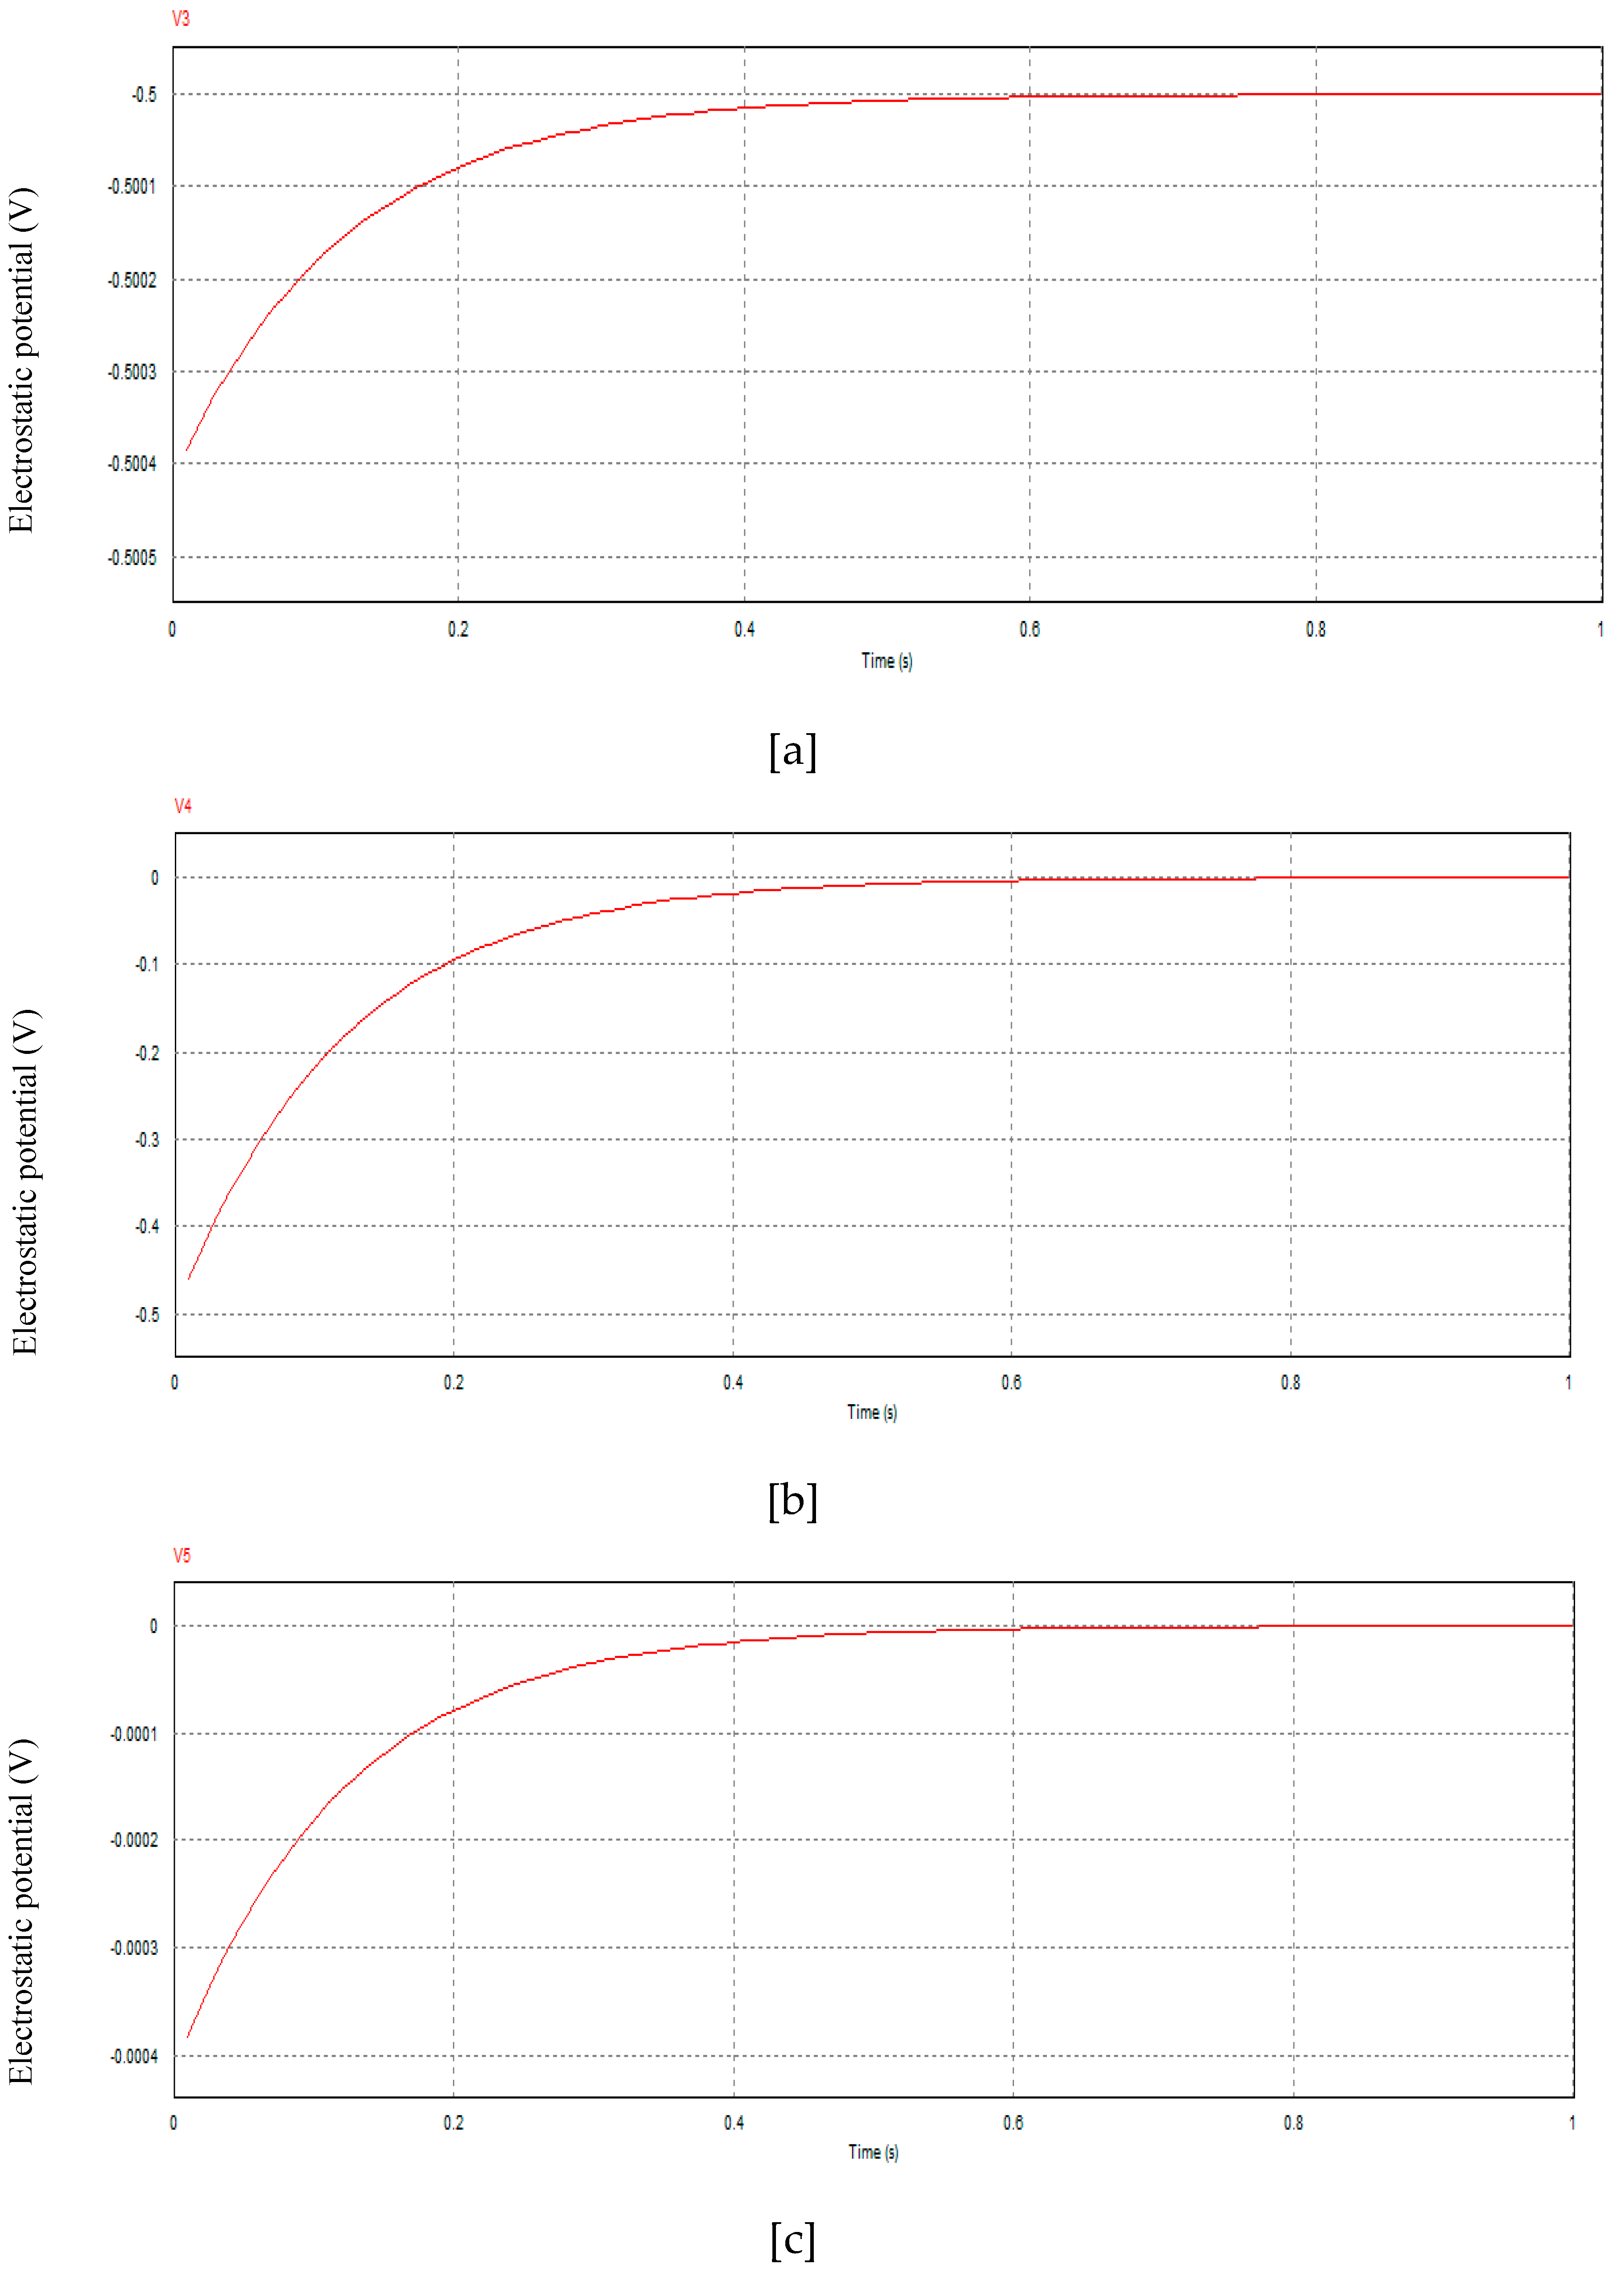
First, we show the result when the load is 3 Ω and the input current is 0.5 A. Figure 5a–c indicate the electrical potentials according to Figure 4. Figure 6 shows the time dependence of each current that exists in the sample. Note that sampling time is 0.01 s.
From the initial time, the probe V4 detects very large negative electric potentials up to 0.2 s. However, at t = 0.2 s, V5 becomes nearly zero and V4 also becomes zero. In addition, in Figure 6, the resistance R1 current reaches zero at 0.2 s, which implies the Joule heating becomes zero and inductor L2 current reaches the steady value at 0.2 s. This implies that the tap voltage between V5 and V4, i.e., the voltage of a sample, becomes zero but the current is retained. As mentioned, a large negative voltage occurs immediately prior to the time of the transition. The negative value originated from V4 implies a demonstration of the Meissner effect.
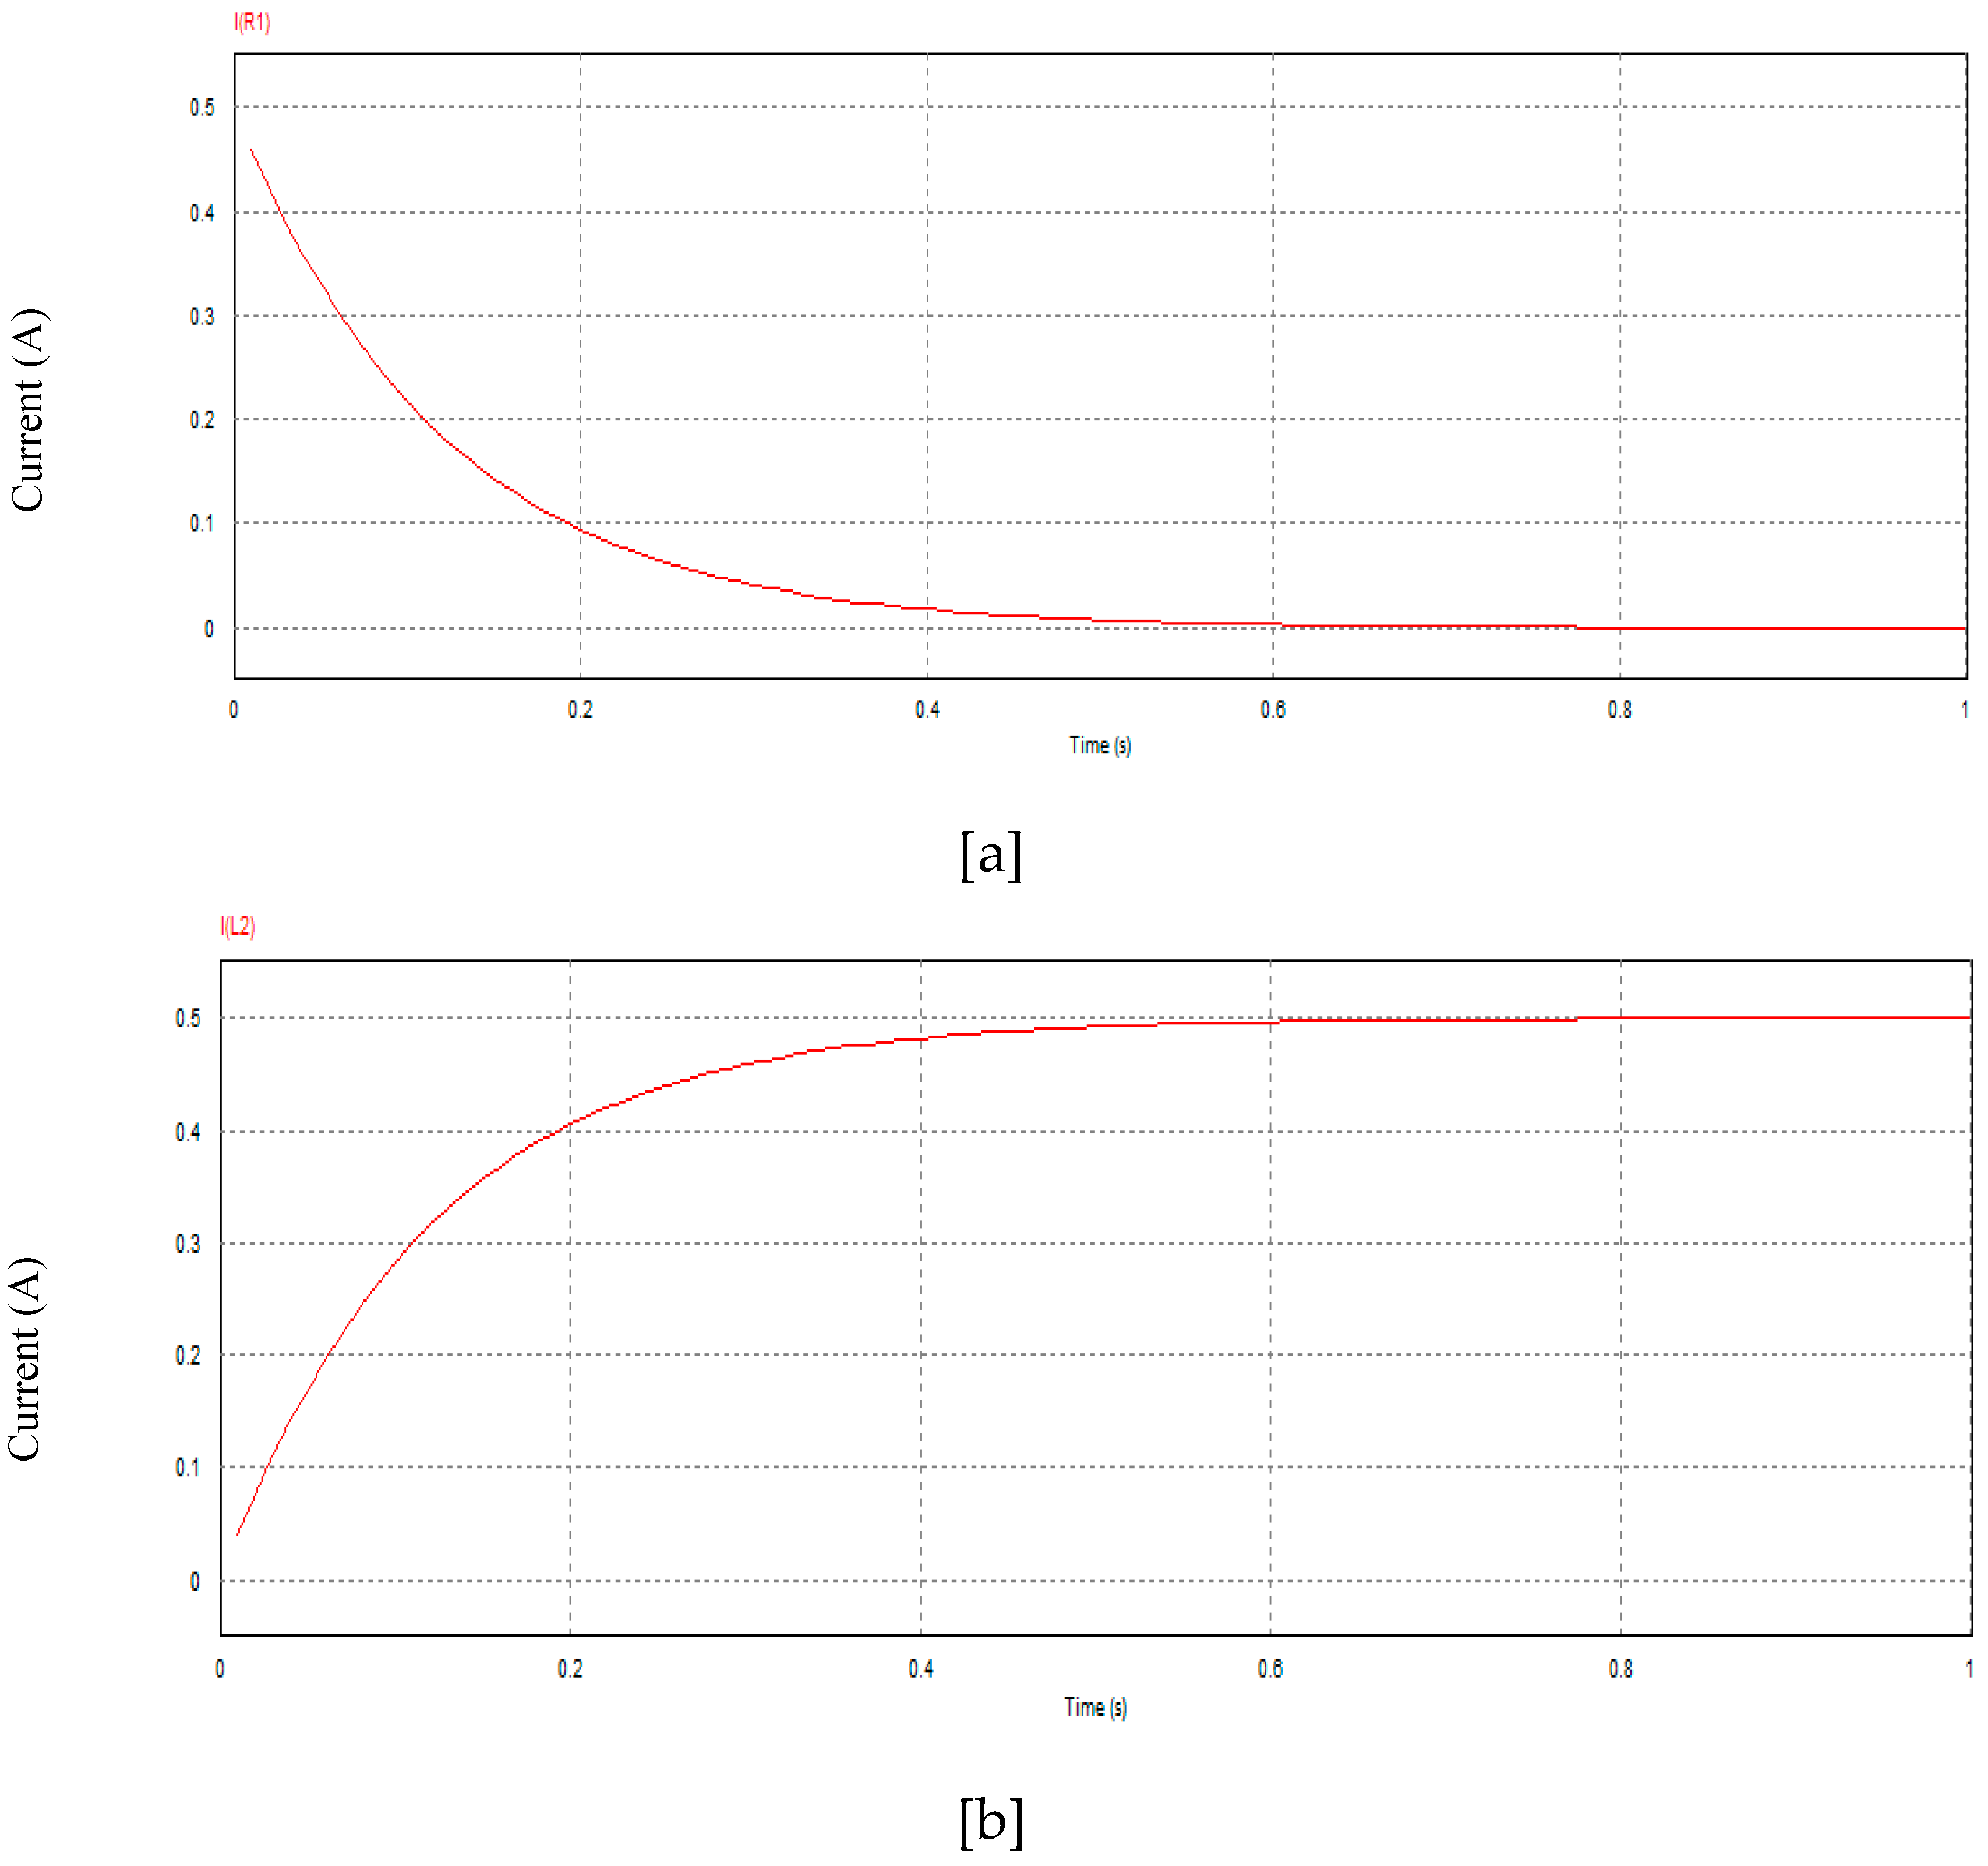
In Figure 7a–c, each electrical potential in the case with 1 Ω is presented, whereas Figure 8 shows the characteristics of the currents in the sample. The reason for varying the resistance is for confirming a reproduced discharged current that corresponds to the additional magnetic field energy (i.e., the Meissner effect). The behaviors of each electrical potential and the current are the same as in the case with 3 Ω; however, the transition time becomes longer shifting to 0.4 s. As an important result, V4 again exhibits a large negative value similar to that in the case with 3 Ω. Therefore, we can conclude that negative voltages appear immediately prior to the transition time demonstrating the Meissner effect predicted by our theory.
Note that each result varies gradually according to time. Thus, as described in the theory section, these results do not define a strict phase transition [25].
Let us consider the result of the probe V3. At the transition, while the V5 reaches 0.0 [V], the V3 detect the output of the voltage source. Considering that the difference between V4 and the V5 at the steady state implies the zero voltage of the sample, only the V3 detect the output of the voltage source. This fact implies that, although the output of the voltage source does not die, the sample voltage (i.e., the sample resistance) reaches zero.

5.2. Values of Critical Current and Comparison with That in PNS

Using Eq. (20), we calculated critical currents. First, let us consider the case of the present paper. When the voltage V = 1 V , then the local electric field is
E i = V E a 1.0 × 10 10   V / m
where VE and a denote the voltage from the voltage source and the coherence of a pair, respectively. As a result of calculation from eq. (20), the critical current Ic is calculated such that
I c = 8.4 × 10 4   A .
In this calculation, the area S0 of the cross section for the current was assumed as, for example,
S 0 1.0 × 10 10   m 2 .
Eqs. (40) and (41) imply that, even though a very thin conductor is employed, a sufficiently large current supply is allowed. The value of Eq. (40) is sufficiently large; therefore, we need not to worry about the basic limitation of the transport current. Table 2 lists the physical constants used in these calculations.
PNS [18,19,20] has the same equation, Eq. (20), for the critical current density. In this case, however, the average electric fields do not stem from the voltage from the output of a voltage source but from the electrostatic fields generated by a condenser. Therefore, Ei in Eq. (20) is derived from the surface charge density σ, which arises from the charge Q on the condenser pole plates. However, because of the extremely small capacitance C (approximately 10−14 F), even when a relatively large voltage is applied to the condenser pole plates, the charge Q is extremely small; in addition, the area of the pole plates is large. Therefore, the surface charge density σ becomes very small. Considering our previous setup [18,19,20],
E i = σ ε 0.11   V / m .
Considering eq. (20) and the above small internal electric field Ei, the critical current must be small.
That is, the critical current in this case is
I c ,   P N S = 2.8 × 10 5   A .
In Table 3, we indicate the additional constants used to calculate the above value.
Comparing the two critical currents, it is clear that the case proposed in this paper has sufficient technical merit. This is important when considering superconductivity applications.

5.4. Summary to Achieve Our Superconductivity

First, the balance of two voltages and a diffusion current result in a specific electron concentration distribution. Using this distribution and the Poisson equation, a new electric field and a transient attractive potential are generated. Because of this solution of the Poisson equation, the Coulomb repulsive potential as the solution of the Poisson equation does not appear at the macroscopic scale, which results in the extreme short-range approach of the two electrons to each other. Under the condition that the kinetic energy in terms of the relative motions dominates the lattice energy (which involves the concept of the critical current density), the two electrons combine via the spin magnetic potential. This spin magnetic potential implies a superconducting energy gap that is much larger than normal heating at room temperature due to the extremely short coherence. Therefore, the combination of two electrons is not destroyed by normal heating. Given that the two electrons bind very strongly, we consider the center-of-mass motion of an electron pair. As a result, the entire wave function of the center-of-mass motion converges to a macroscopic wave function having a single phase. Using the macroscopic wave function and AB effect, the London equation (i.e., the Meissner effect) was derived.

5.5. Limit of This Superconductivity

To function this system of the superconductivity, a current source properly must work. In other words, the initial input impedance of a sample must be sufficiently small such that the current from the current source can be input. In this sense, a sample having too large input impedance should be avoided to employ.

5.6. Summary of Significances of This Study

Let us review significances of our proposed superconductivity. Thus far, the history of the existing superconductors was explained by considering the critical temperatures. That is, the research approach was previously to create a compound which was expected to work at higher temperatures. However, presently, this approach has not yet solved the problem that a superconductor requires significant refrigeration or pressures. On the other hand, because our circuit-based superconductivity is independent for temperatures, we believe that a new history of superconductors will open.
  • 1. We need not prepare specific substances or setups.
It is not necessary to prepare specific substances or compounds because, if the system is implemented correctly, the load is rendered superconductive. Moreover, in PNS, we needed to prepare a setup, in which a condenser, semiconductor disk, and current leads were included. In particular, attaching the current leads to the semiconductor disk was difficult. In the present system, however, such a setup is not necessary, and therefore, we can very simply obtain superconductivity.
  • 2. The critical current density is sufficiently high.
PNS has an extremely small critical current [18,19,20], and this fact prevented it from being used in practical applications. In the present superconductivity, however, the critical current is sufficiently high; therefore, we need not be overly concerned by the values of the transport currents.
  • 3. It is not necessary to secure extremely low temperatures and high pressures.
To implement our system, it is not necessary to secure extremely low temperatures or high pressures because the critical current density of our superconductivity is sufficiently large and the temperature is not basically related to the generation of the superconductivity.
  • 4. Global energy problems might be solved, and some technologies are redirected.
Using our proposed system, efficient energy transmissions or performance improvements of electrical devices like motors, electric wires or magnets can be conducted. Moreover, as demonstrated in the later Appendix A at the end of this chapter, it is possible to make a metal be superconductive, which implies that both the running and manufacturing costs will be significantly reduced. This fact is important to the field of developing electrical devices.

5.7. Important Considerations When Implementing a Superconductor Using This System

Let us consider the time at which the sample load is disconnected from the system after confirming superconductivity. In this case, does the superconductivity remain? We claim that the equivalent circuit in the sample should remain with the persistent current I of the internal toroid. For the details, please see results of the Appendix A in this chapter.

6. Conclusions

In this paper, we proposed a new type of superconductivity, in which circuit-approached and temperature-independent properties exist.
Generally, the existing superconductors require the significant refrigeration or high pressures, which prevent them into practical applications. Nonetheless, the zero-resistance property of the superconductors is very important to every electrical device to improve the performances. Receiving this fact, the present paper proposed a new principle to generate superconductivity with no refrigeration and no pressures.
As a result of both analytical and numerical calculations, a significantly large critical current density and the Meissner effect, as well as the fact that the sample resistance becomes zero, were found. The significance of our superconductivity is that it can be generated very simply with no refrigeration and with no preparation of specific substances or setups and that it achieves a large critical current density. Moreover, this superconductivity does not require high pressures. These properties have not yet been achieved in conventional superconductor studies. As mentioned, however, the presented system cannot make too large load be superconductive.
As a natural follow-up, we need to confirm this phenomenon in actual experiments. However, the Appendix A in this paper presents preliminary experimental results, which confirms the zero resistance and the Meissner effects.

Acknowledgements

(1) We thank Enago (www.enago.jp) for English language review. (2) We sincerely appreciate for Preprints in MDPI to release the preprint version of this paper as follows: https://www.preprints.org/manuscript/201911.0033/v3.

Additional Information

This paper is not related to any competing interests such as funding, employment and personal financial interesting. Moreover, this paper is not related to non-financial competing interesting.

Appendix A

A guide to reproduce the experiment and preliminary experimental results.

Introduction

Let us review the history of discovering the existing superconductors and present the meaning of this Appendix, connecting with the main body of this paper.
Considering the first superconductor whose critical temperature is around 4K, the ceramic cuprates have the significantly high critical temperatures [1a]. Although the several high-Tc compounds [2a,3a] were found, these ceramic cuprates have still the highest critical temperature with no pressures. Although H-based superconductors [4a] have the relatively high critical temperatures, these materials must receive the significantly high pressures, which implies that it is difficult to employ these materials in practical applications. The weak points of the above-mentioned superconductors are the requirements of refrigeration or pressures.
On the other hand, we had presented the first temperature-independent superconductivity about 10 years ago [5a–7a]. Although this previous our superconductivity overcame the weak points of the refrigeration and pressures, this superconductivity has a small critical current and producing the superconducting device makes it difficult to be applicable in practice. Then the present paper offers the temperature-independent superconductivity with high critical current density and without no setups. Although the main body in this paper mentioned the theoretical aspects, the actual experiments were not described. This main body is still significant because of predicting the new superconductivity. However, we attempted to perform the experiments. As a result, it was found that there is a knack when conducting the experiments. According to this knack, little time is required to achieve superconductivity. Therefore, as an additional but important description, this appendix will describe the knack, and brief results of the experiments will be presented. The importance of this appendix is that, by presenting the knack, it will help every researcher to reproduce our presented new superconductivity. In this sense, this appendix complements the contents of the main body. Note that the obtained results should be considered to be preliminary results and thus further follow-ups will be needed.

Method

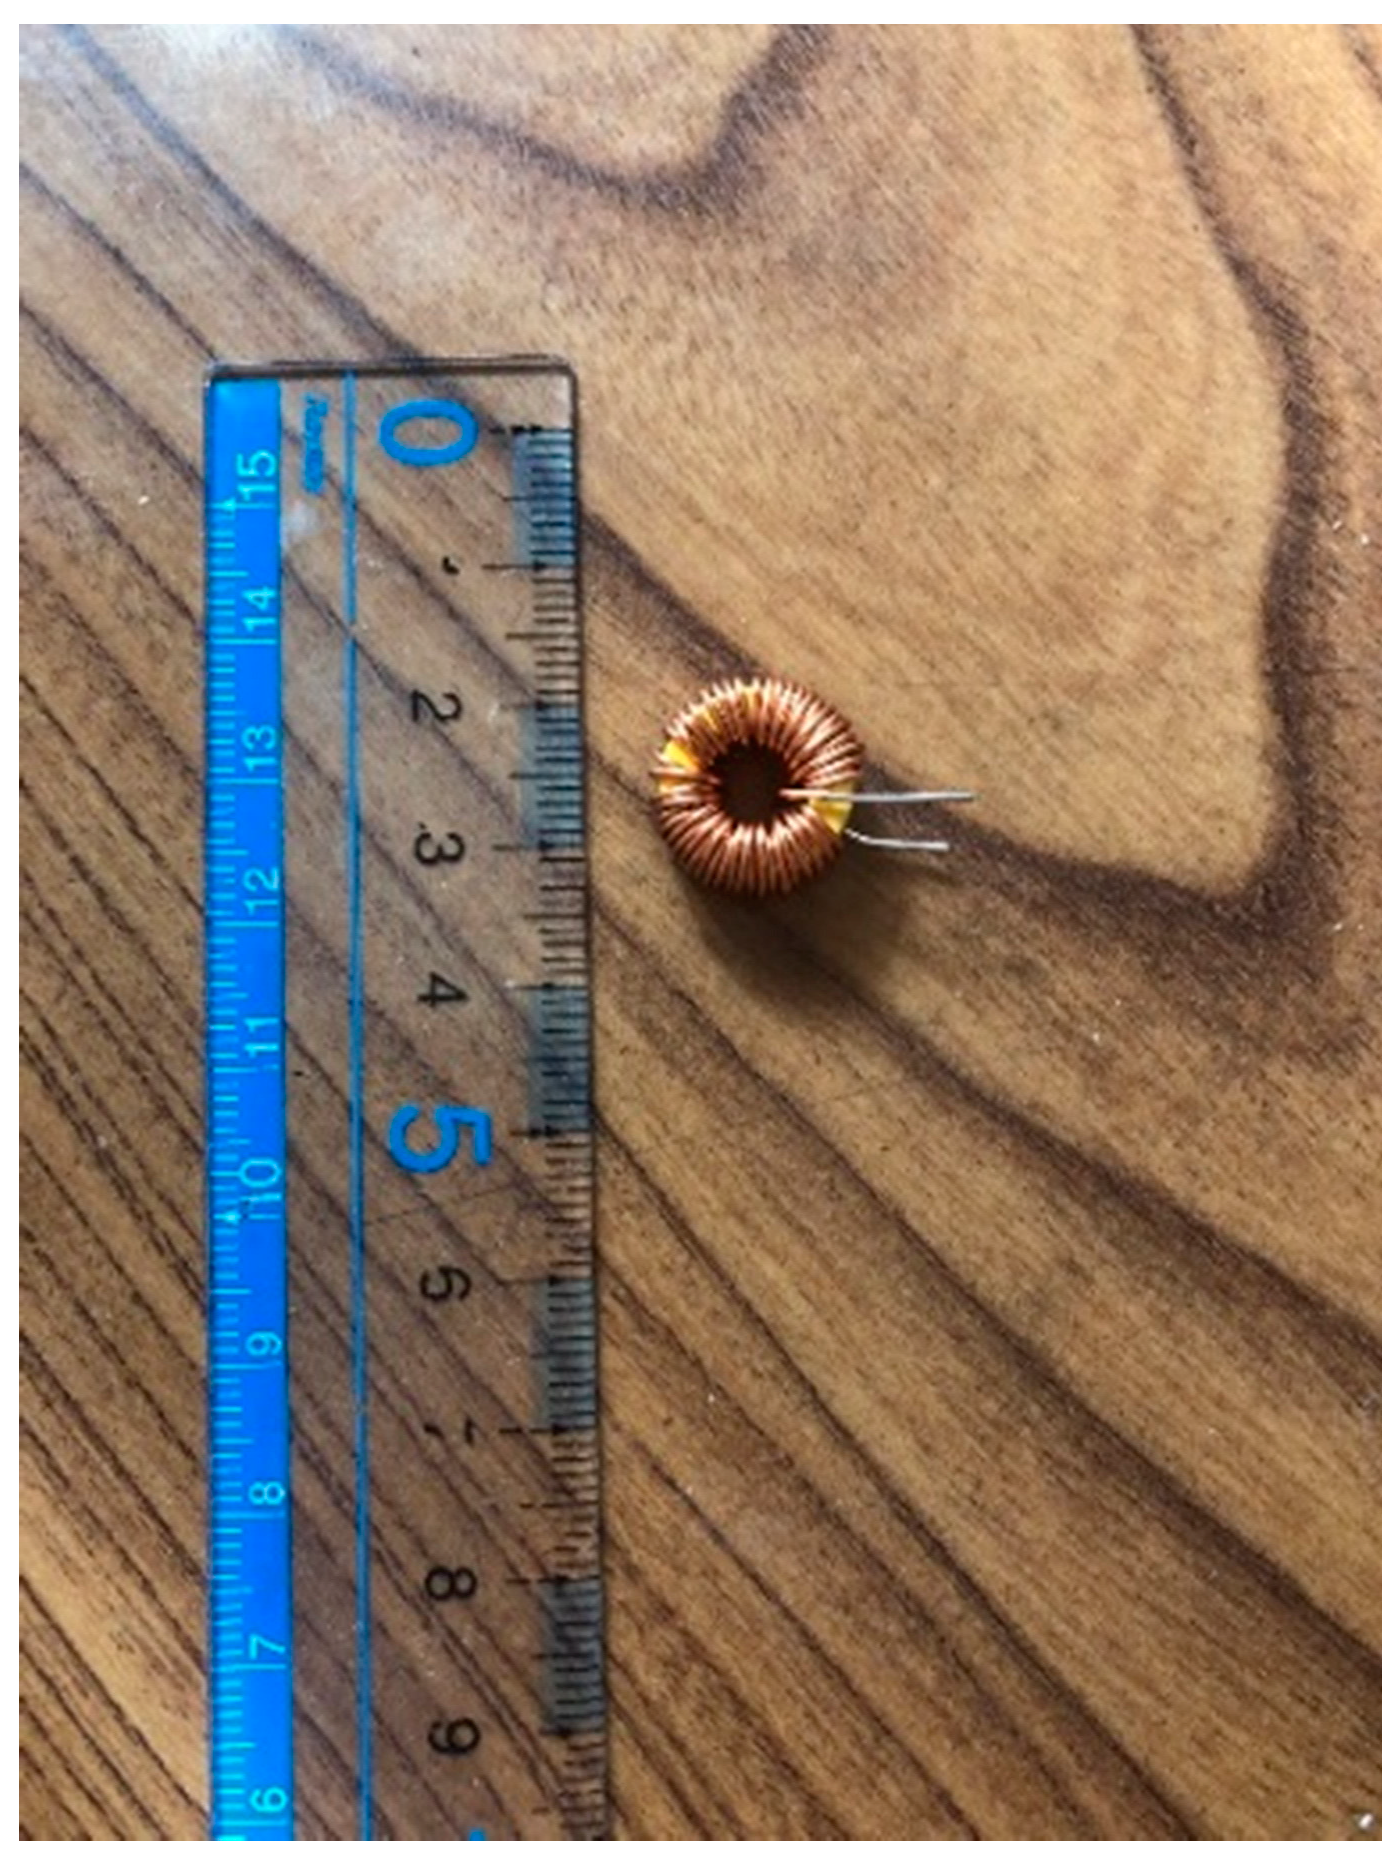
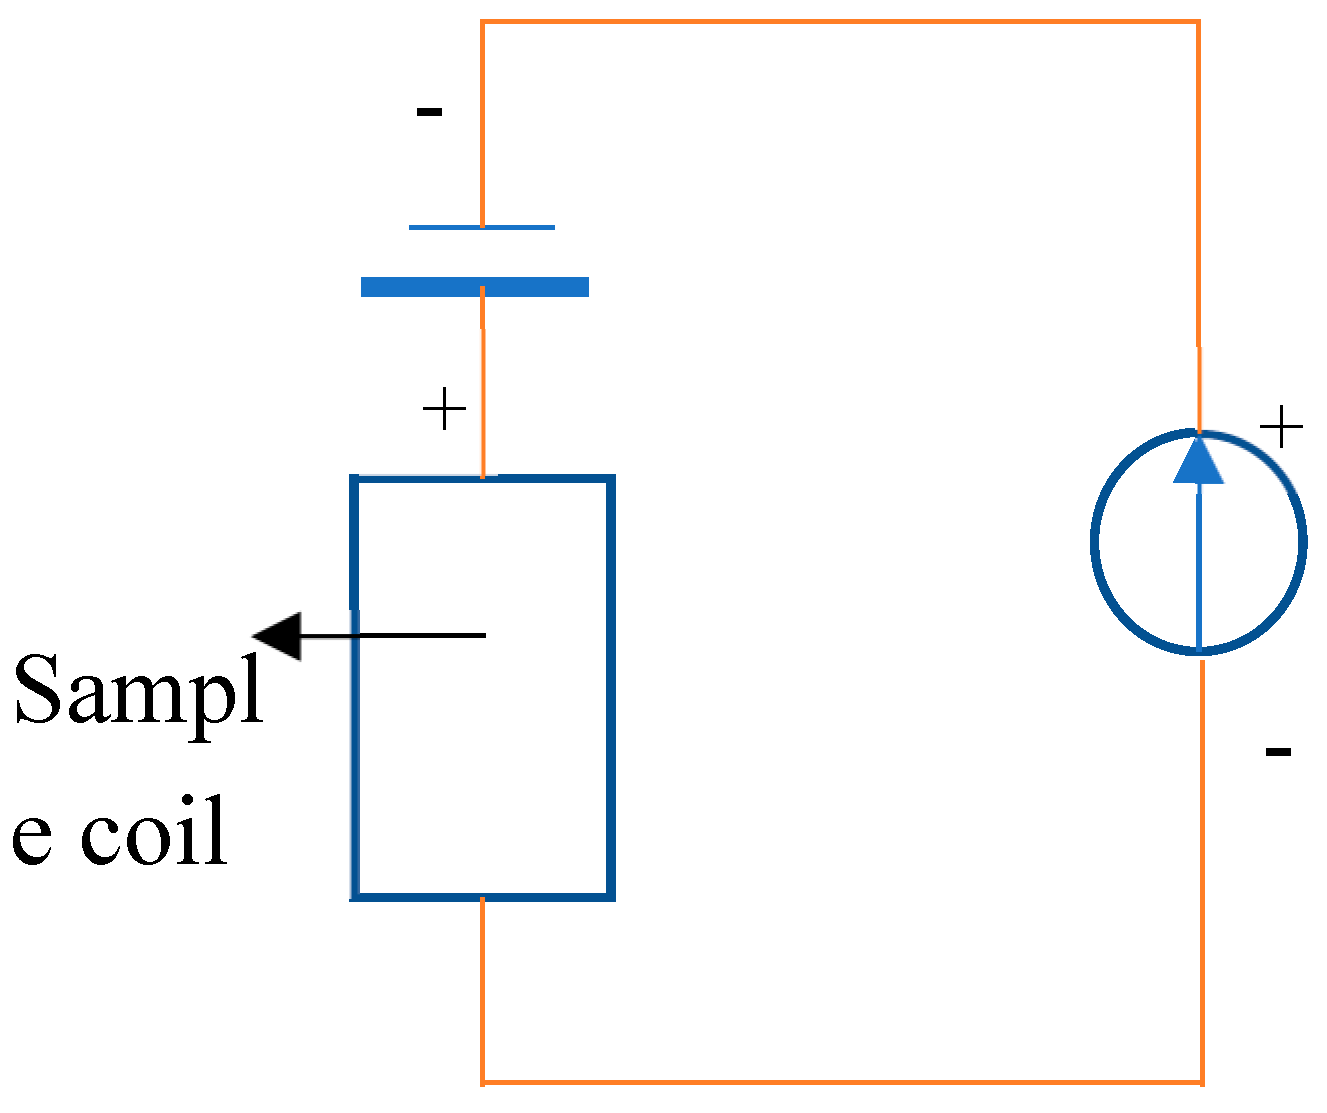
In Figure A1, the circuit of the system is shown. As shown, this circuit is the same as that described in the main text. In this case, a toroid coil is employed as a load. Note that this toroid is an example and thus it does not have a special meaning. Moreover, we must not confuse this sample toroid with the internal and microscopic toroid that was described in the main body. Assuming that parameter l in Figure 3 is sufficiently short, the internal toroid is a part of general macroscopic conductor. The photograph of the coil is shown in Figure A2. In the experiments of this paper, we purchased an assembly of the identical coils including 20 unit (the cost is approximately less than 1,000 yen by a mail order).
Here, let us consider the method of conducting the experiments. The experiments employ two stabilized power supplies. The one is employed as the voltage source (i.e., the cv mode) and the other is used as the current source (i.e., the cc mode)
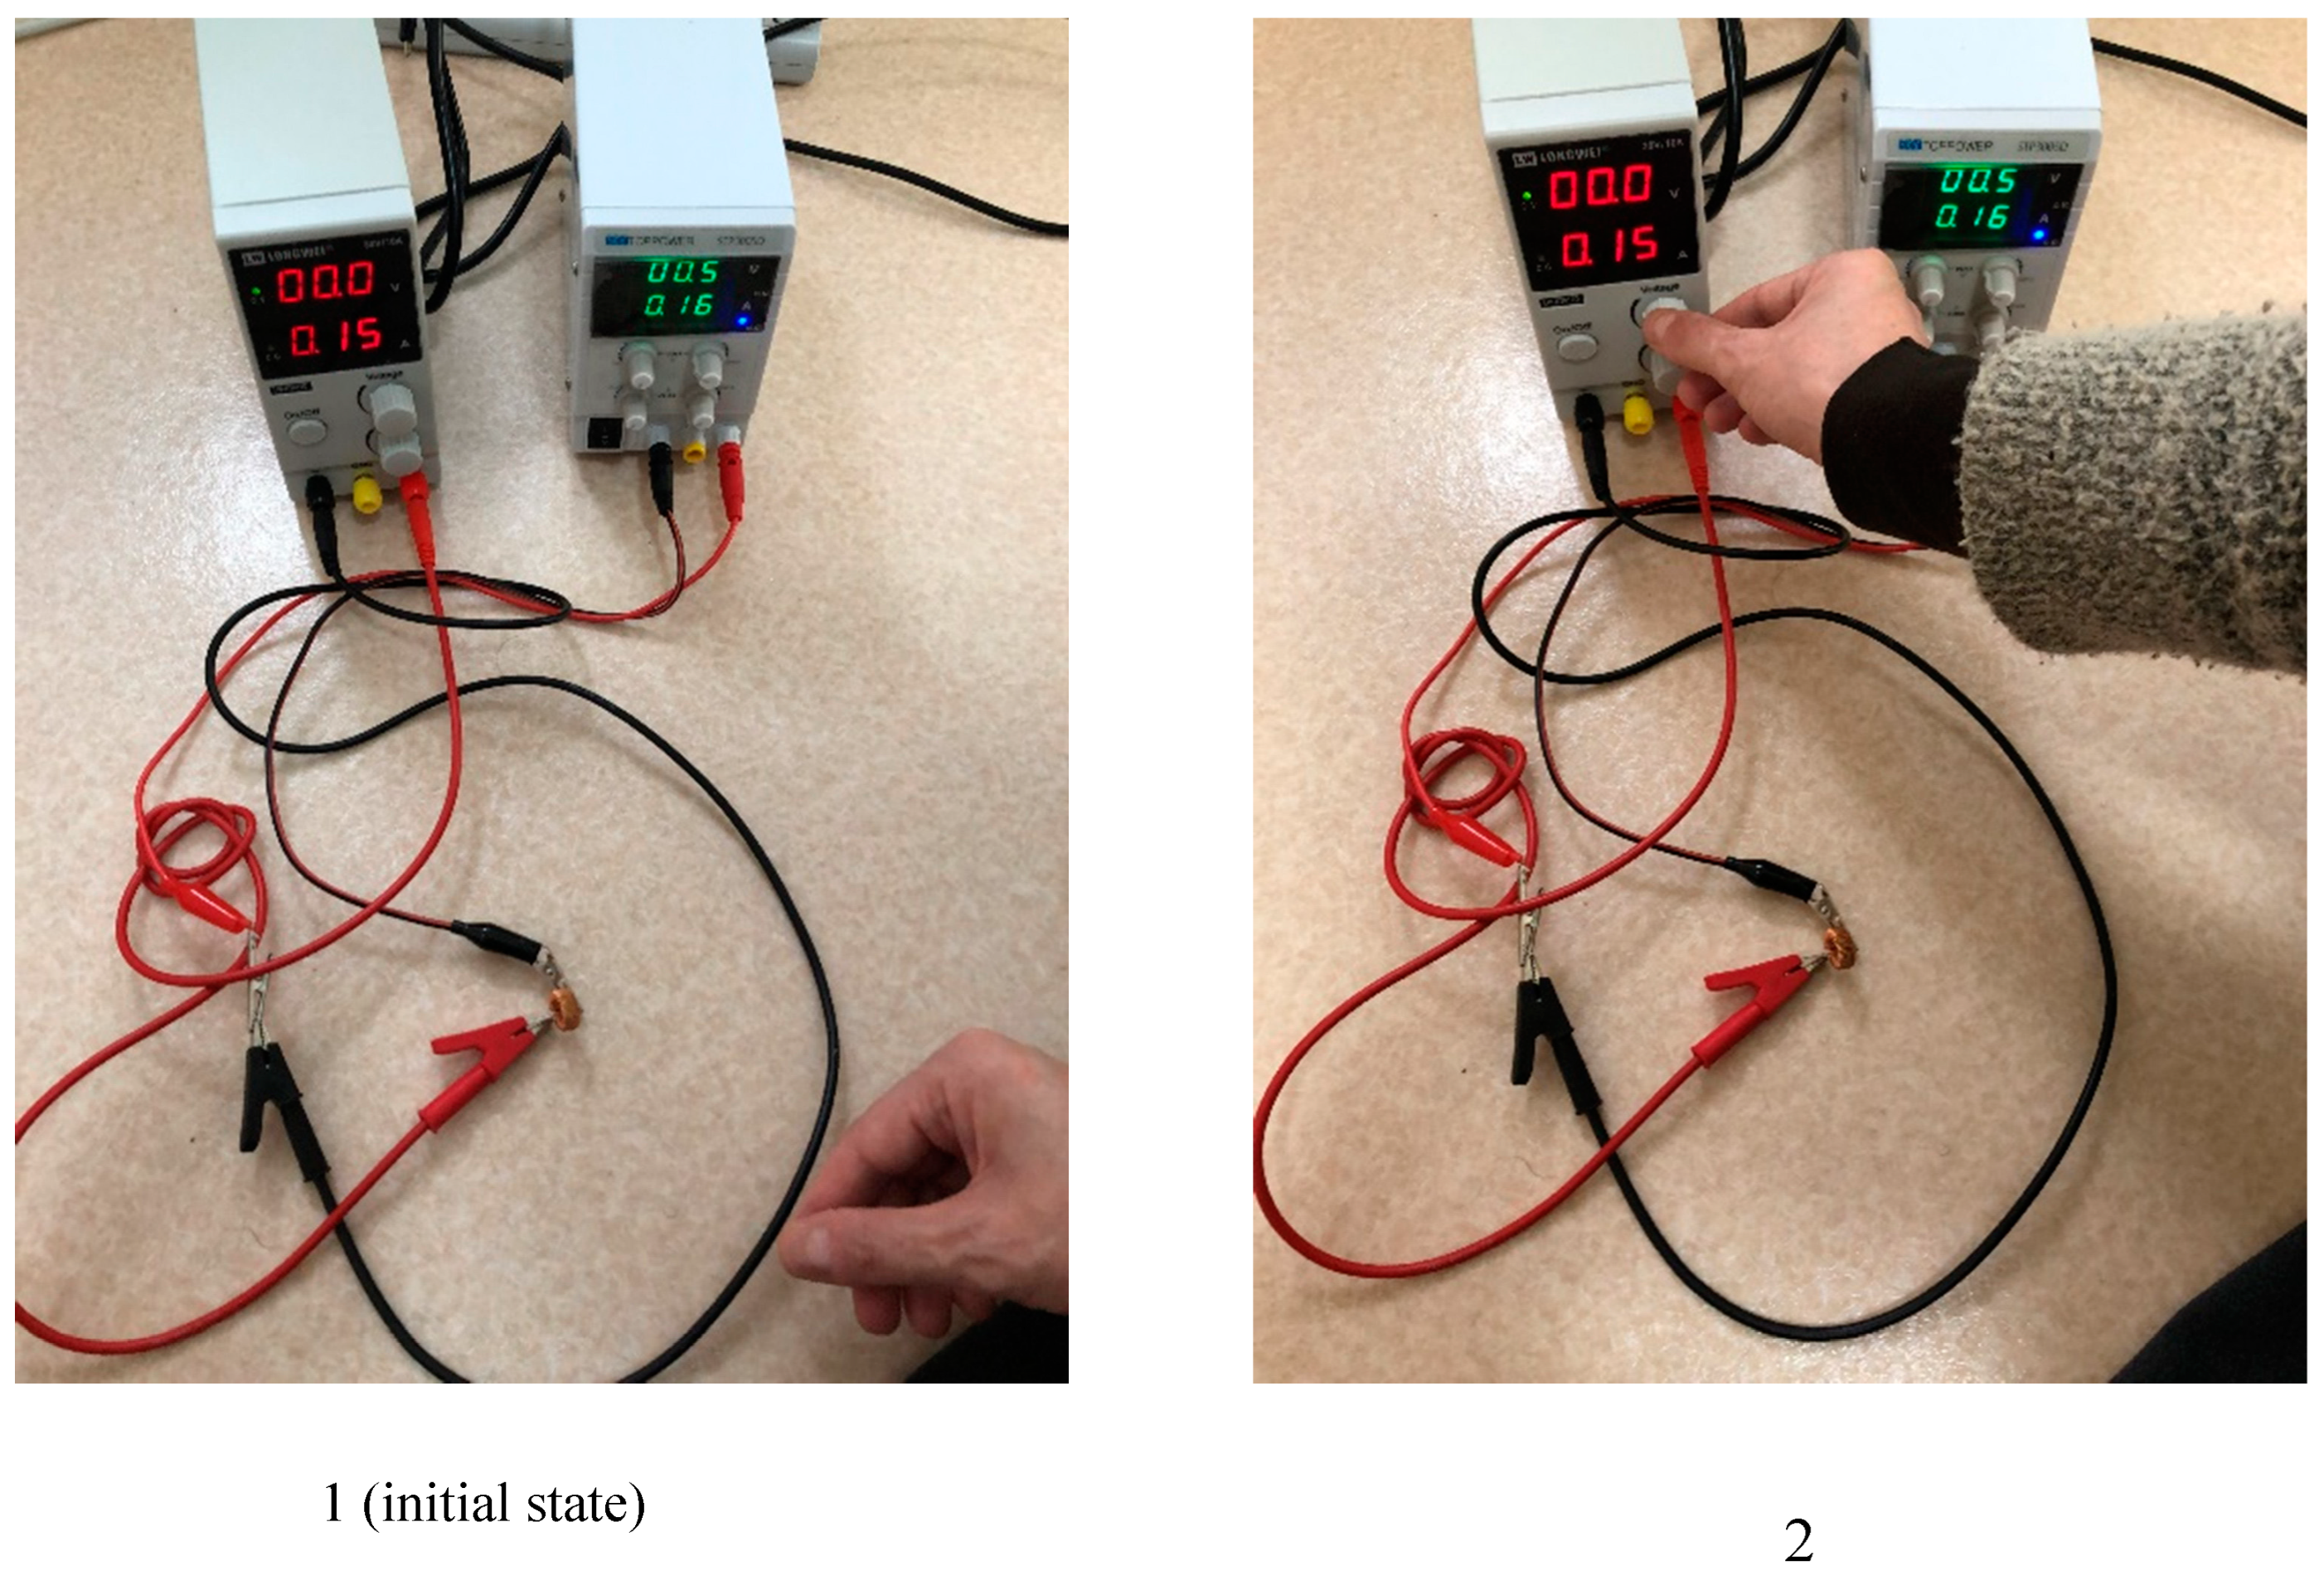
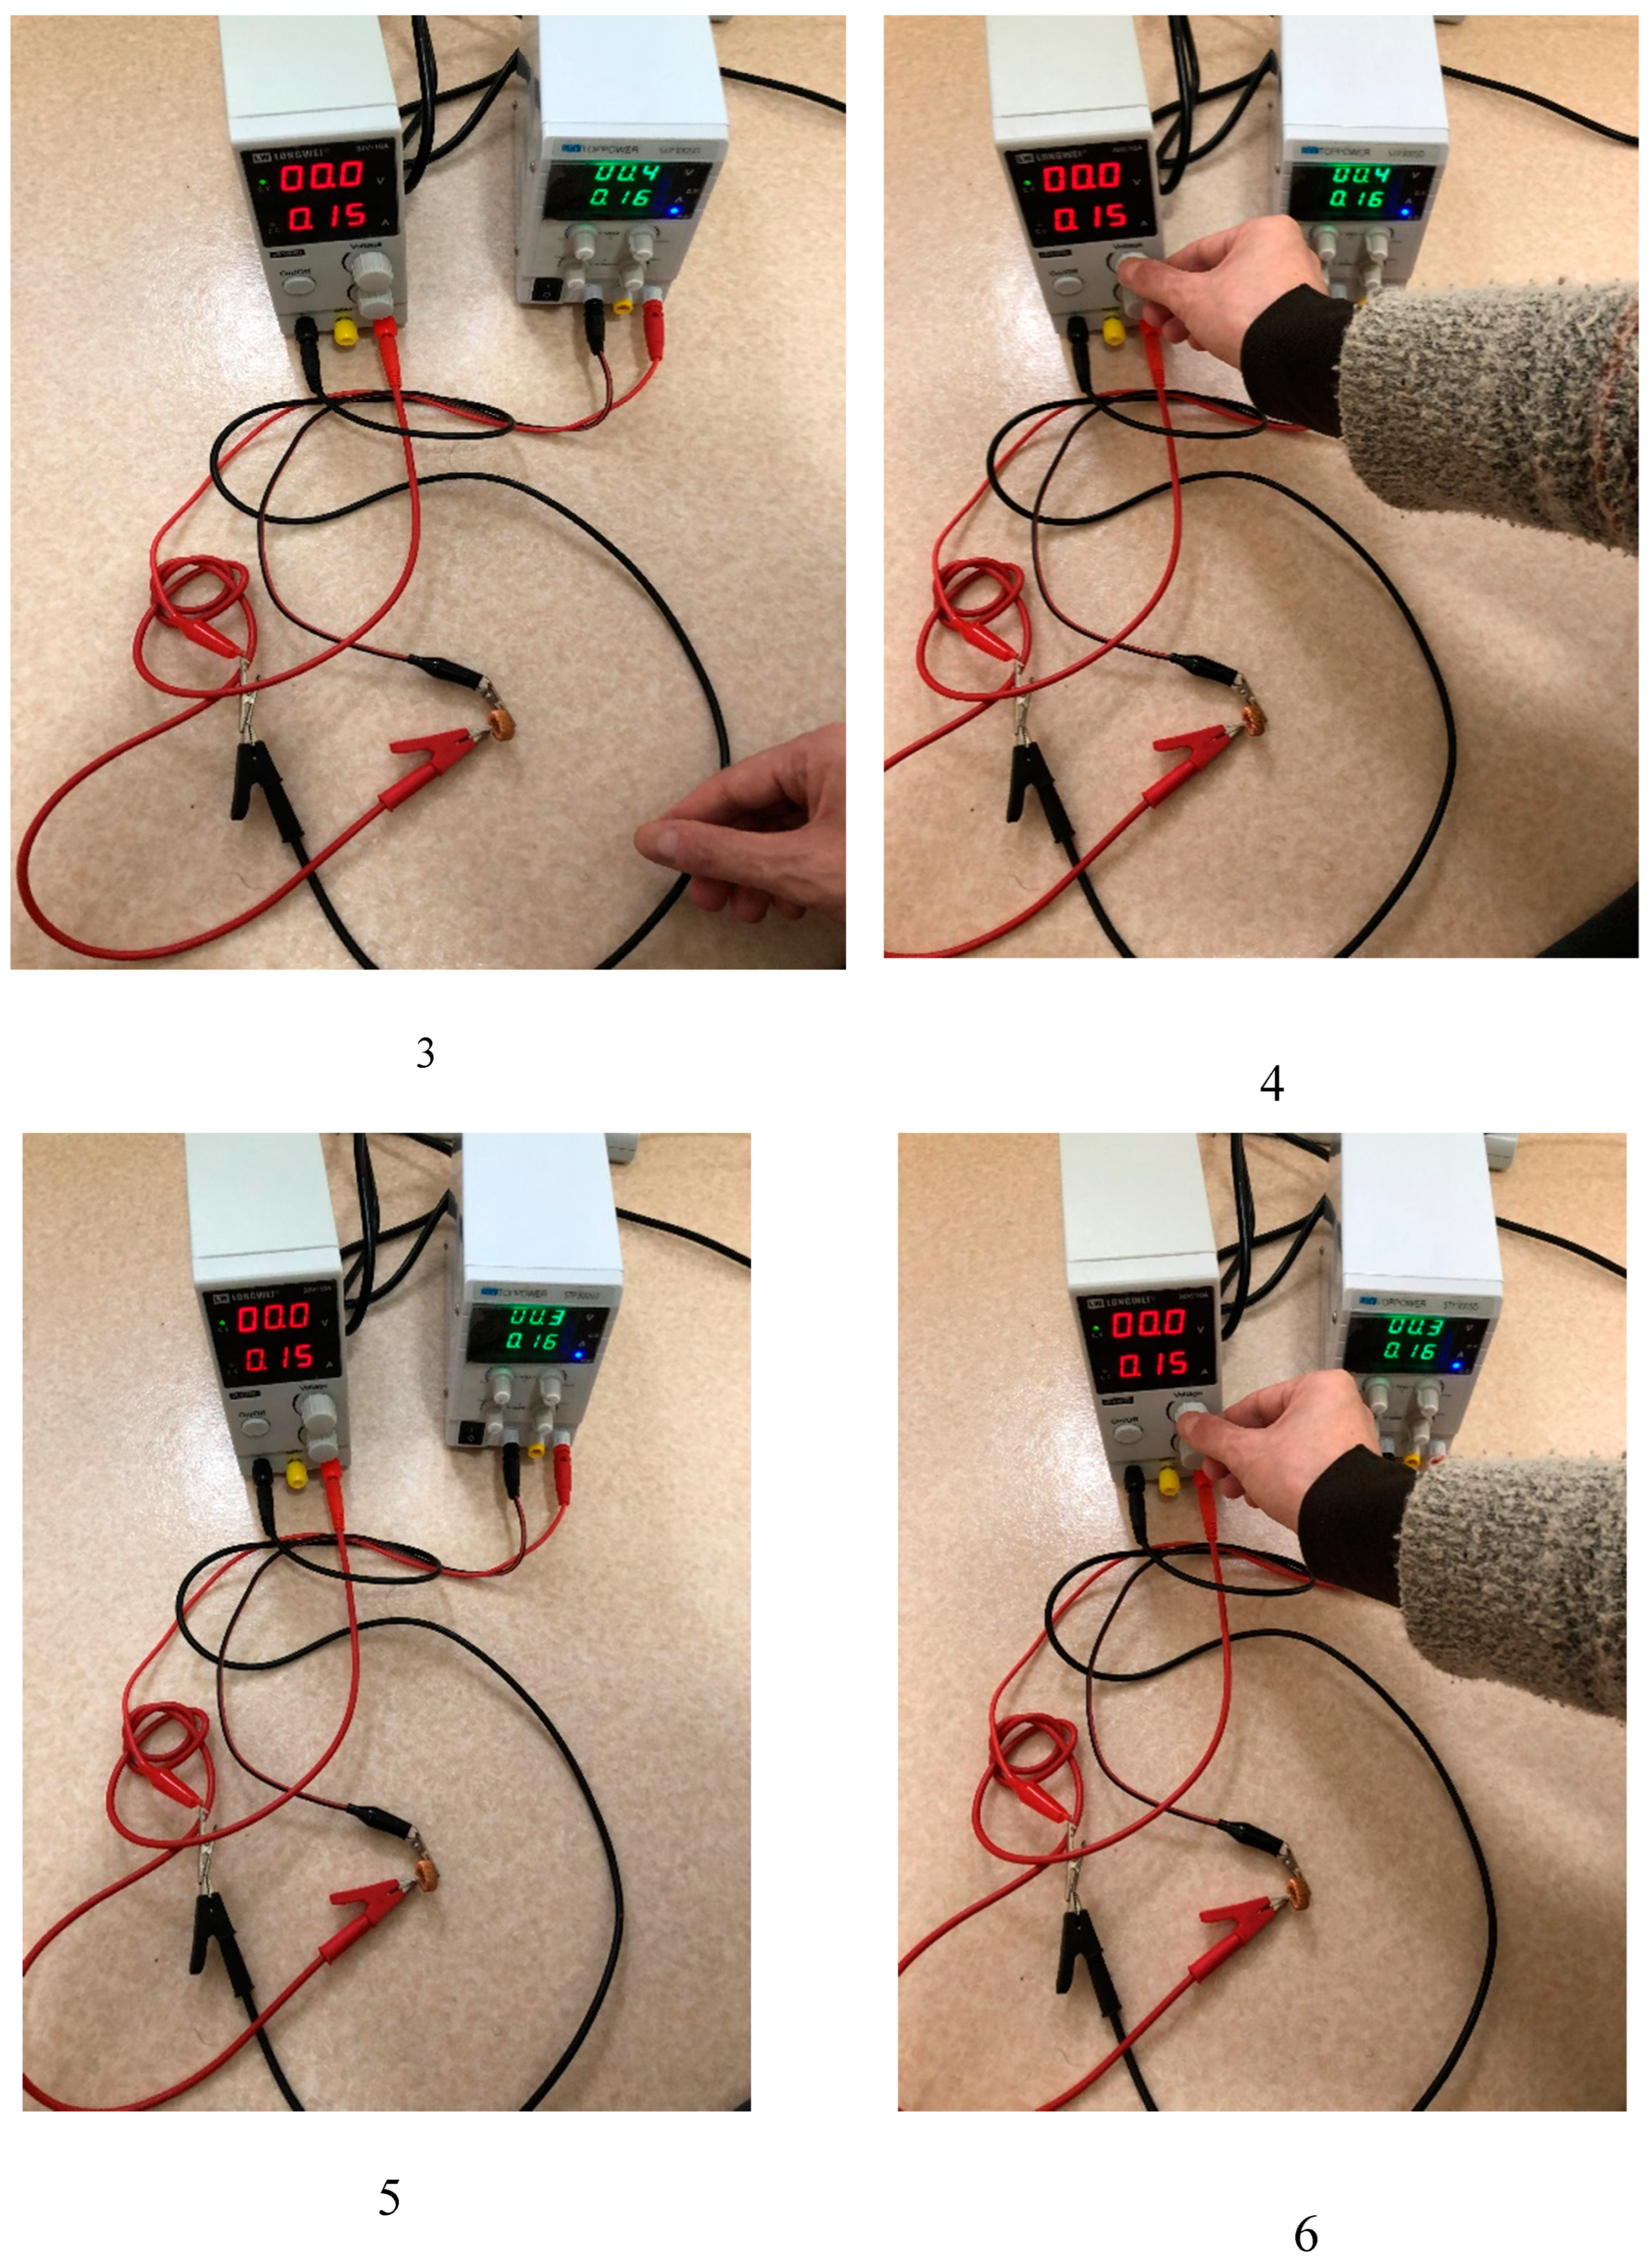
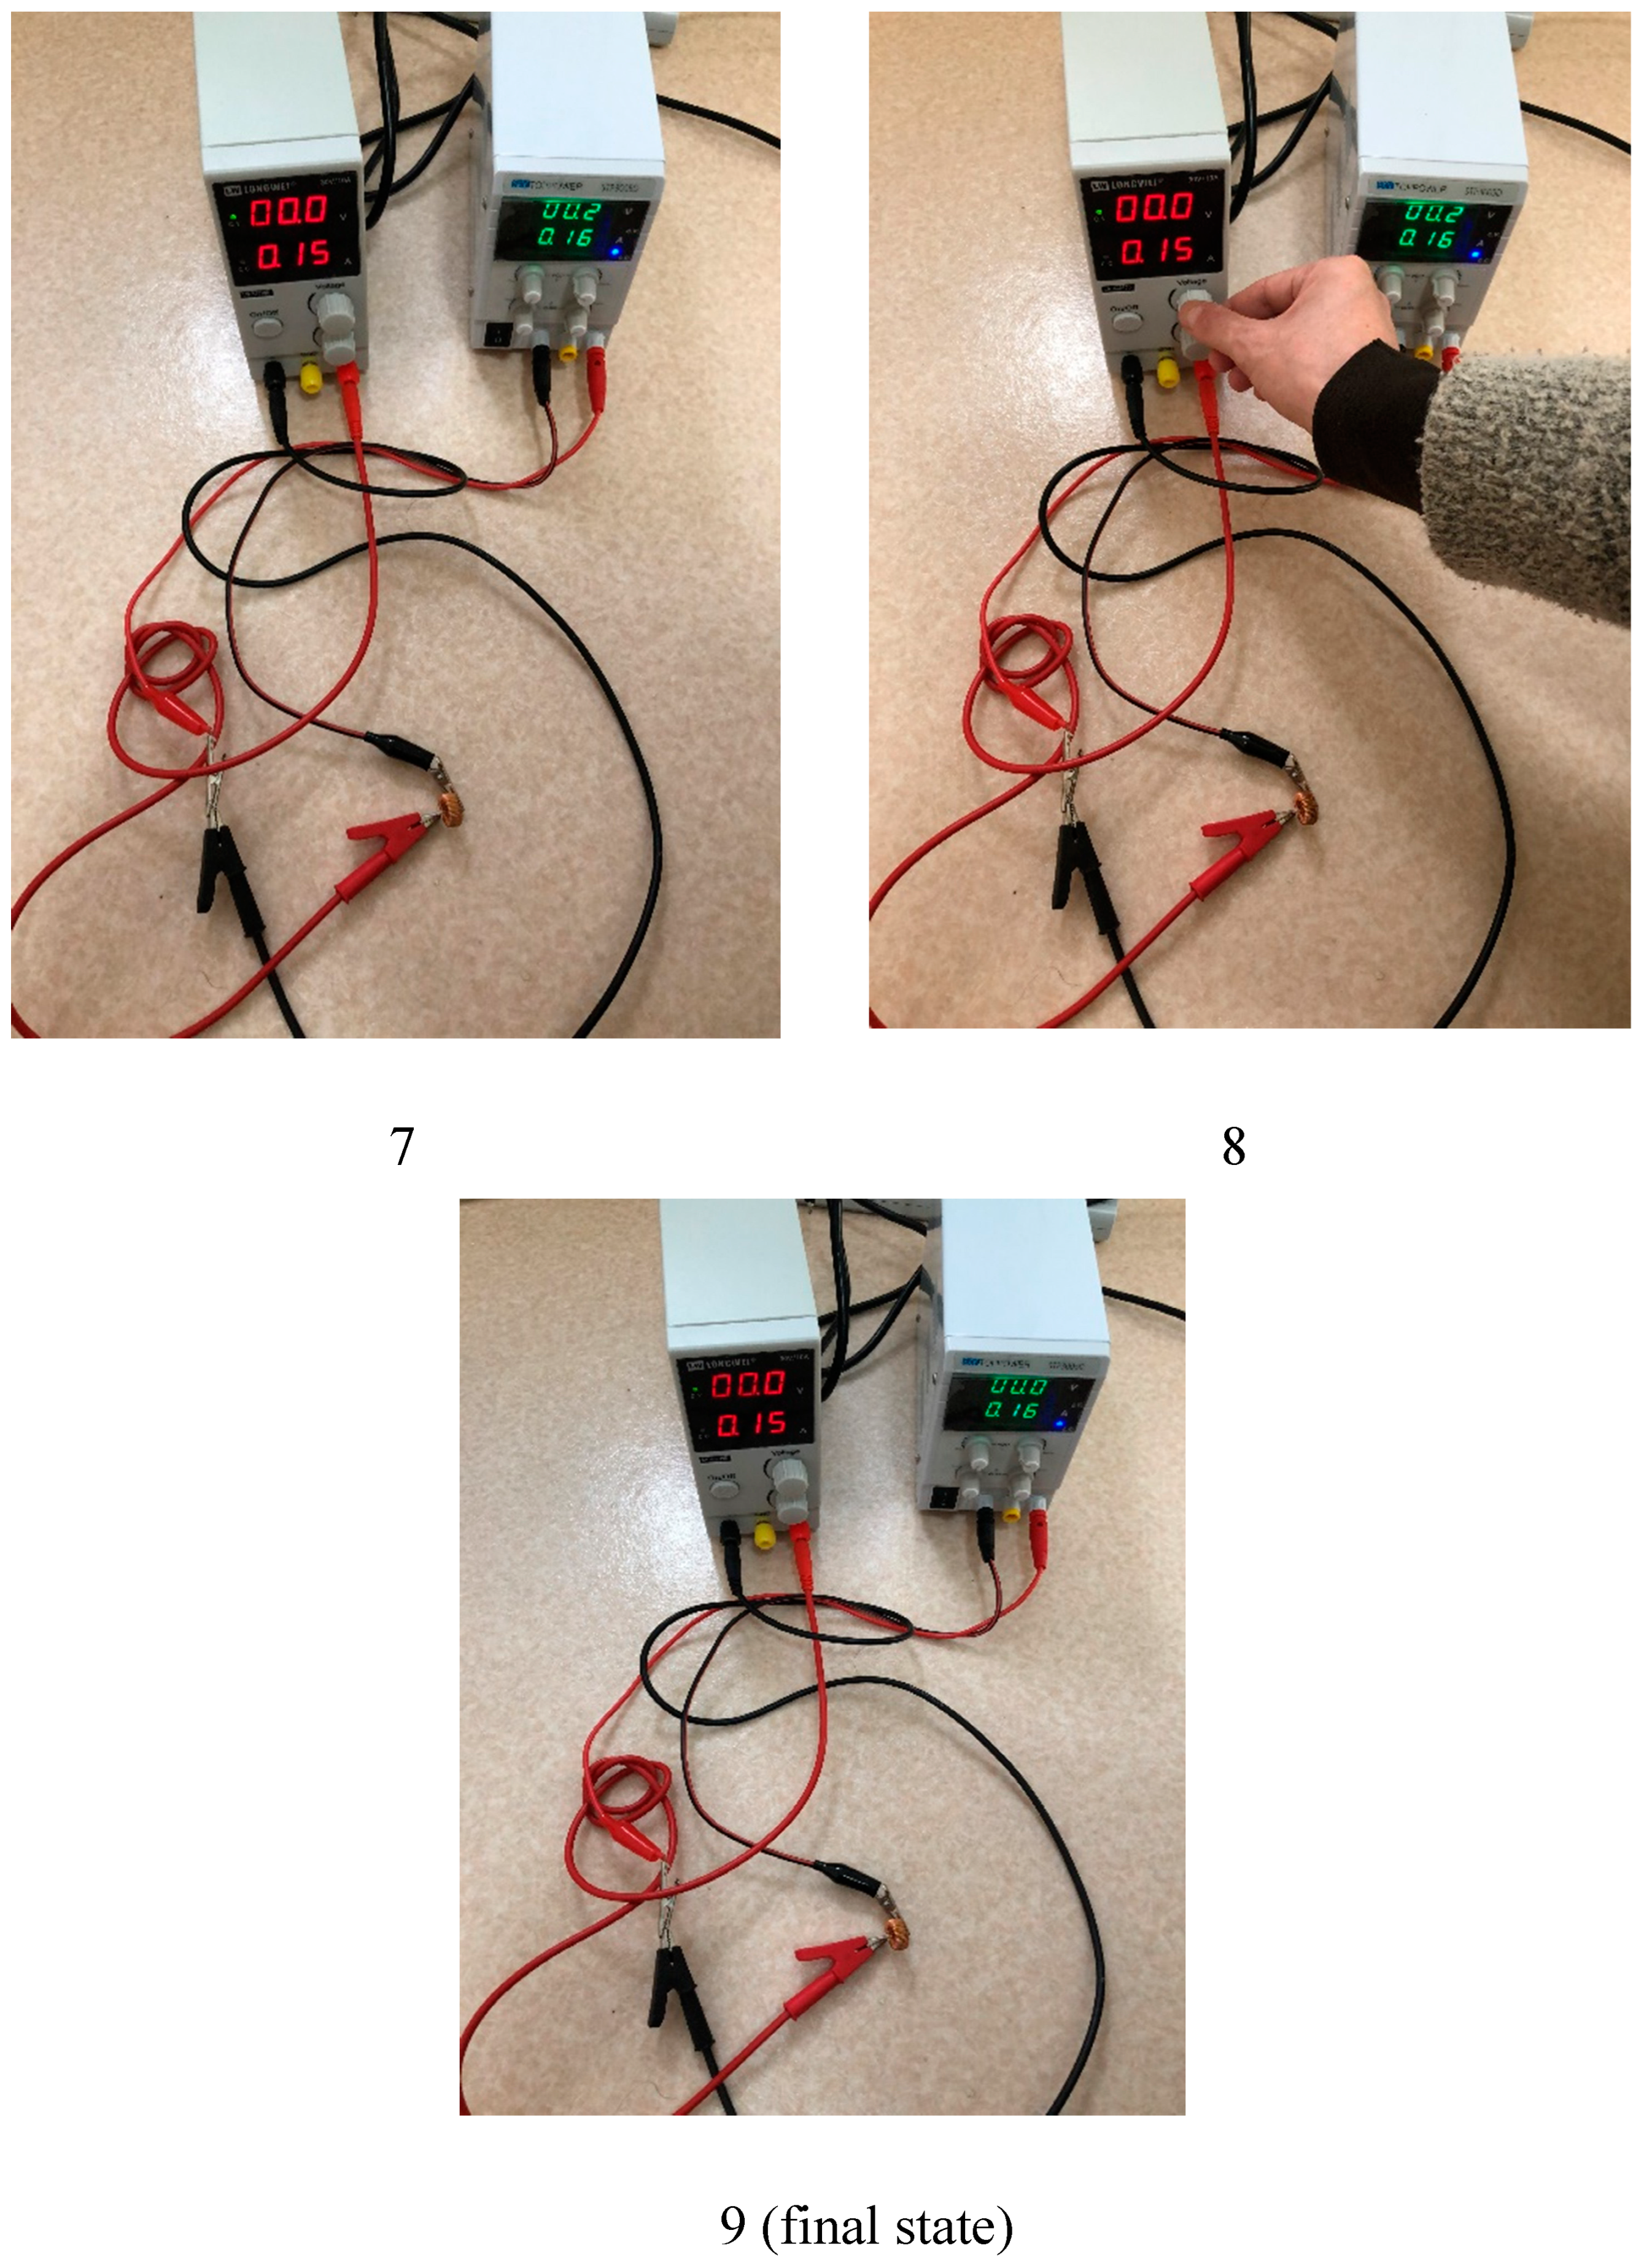
As long as relying on the stabilized power supplies, there is a knack in conducting the experiments. Introducing this knack is the aim of this appendix. Figure A3 shows the sequence of conducting the experiment. As shown, when the volume of the voltage source (i.e., the cv mode of the stabilized power supply) is adjusted, then the voltage of the current source (i.e., the cc mode of the stabilized power supply) is reduced, interlocking with the adjustments of the volume of the voltage source. This is how we can reduce the voltage of the current source intermittently. As shown in the final panel in Figure A3, we can obtain the state in which both the voltages of voltage source and current source are zero and in which non-zero current still exists. Moreover, in addition to confirm the zero resistance, we applied static magnetic fields by two ferrite magnets (i.e., permanent magnets), forming the Helmholtz coil positions. Note that the zero-resistance measurements and the applications of the static magnetic fields were conducted independently for the system. That is, after manipulating this system, the measurements of load-coil resistances and the magnetic-field applications to the coil were conducted independently for the system. Of these, the 4-terminal method was applied.
In Table A1, specifications of load coil are shown. Note that, if the load impedance is sufficiently low such that the cc mode of the current source of the stabilized power supply can operate, any load is accepted to be applied to the system. The coil in this paper is a merely example. In this experiment of the Appendix, three samples, A, B, and C were prepared although these are identical coils, which existed in the assembly package in the time of the purchase. The reason of this preparation is that we would like to confirm the reproduction of the experiment by the iterations.

Results and Discussion

In this appendix, we described a knack to reproduce the experiments. Let us consider the preliminary results.
Table A2 indicates the result of operating the system. Note that this table implies the final state of cc and cv modes from the initial operation of the system. As shown, although the currents are sufficiently large, the voltages are zero, which implies that the electric resistances are zero on operating the system.
In turn, Table A3 shows results of measurements of the electrical resistances of the coils. Note that these measurements were conducted independently for the system. As shown, every coil exhibits almost zero electrical resistance, which implies that, after operating the system and even when the loads are separated from the system, the load preserves the zero electrical resistances. This fact is important when considering the application to some technologies. Note that, although the measuring device voltage indicates always 0.0 mV, Table A3 indicates the limit of measurements. However, it is no doubt that the sample exhibits the zero resistance. As an important notation, we must not apply a current higher than that in operating the current. For example, compering between Table A2 and Table A3 for the sample A, a current for measuring the electrical resistance must not dominate over the value of 0.3 [A]. Moreover, when applying power to the sample independently for the system, we must provide the power slowly and gradually.
More importantly, after we measured the sample voltage by the 4-terminal method and when the power supply was turned off, a very large negative voltage appeared (the maximum -50mV) for large time span (i.e., about 10 s) This fact is related to the descriptions of the main body of this paper [7a].
Table A4 shows generated voltages when applying the static magnetic fields. In this table, I/V respectively denotes the current and the voltage of the stabilized power supply (for the cv mode), and V0 implies the generated voltage of the other taps of the sample, considering 4-terminal method. Note that the provided current must not dominate over the value of that in operating the system. As shown, this implies the response for the static magnetic field; the current in eq. (35) is a persistent current and thus, in order to maintain the value of the persistent current, the additional magnetic field energy must be released, which implies the Meissner effect [7a]. For the samples A and C, after applying the static magnetic fields, the generated voltage (i.e., the electrical resistance) revived to the zero. On the other hand, however, when the sample B received a static magnetic field and after applying the magnetic field, the sample B still generated the voltage even when the stabilized power supply was removed. This implies that the sample B itself became a small power supply. It is necessary to purist the reason as a follow-up. However, by detecting the generated voltage when applying a magnetic field, we could confirm the existence of the persistent current indicated in eq. (35).
Let us consider significances of these results.
  • This appendix could indicate a knack to conduct the experiments. By following this, we can obtain higher probability to reproduce experiments with little time.
  • Because we now can produce a zero-resistance superconductor, without refrigeration, without pressures, and with high currents, it can be applied to various electrical products to enhance their performances. In particular, the energy from solar cells in some deserts can be transmitted to every country, which implies that the primitive energy problem might be solved.
  • Because any substance with a small input-impedance can be accepted and if a metal is employed as a load, the manufacturing costs become significantly low.

Conclusion
In this Appendix, we described the method to conduct the experiments, relying on the stabilized power supplies. The results indicate potentially superconductivity with no refrigeration and with no pressures. Therefore, we could indicate potential applications like energy transmissions with no energy loss, which will provide a solution of global energy problems. A shortcoming is that the system cannot employ too large load, because the current source can work only to a small input-resistance. As a follow-up, it is necessary to conduct experiments with the devises which will detect strictly static magnetic responses because the above-mentioned results are preliminary ones and thus strict and systematic experiments will be needed.
Figure A1. The circuit of the system. This circuit is the same as that in main body in this paper. However, two stabilized power supplies are employed here. The one is for the current source as cc mode and the other is for the voltage source as cv mode.
Preprints 99359 g0a1
Figure A2. Photo of the sample coil.
Preprints 99359 g0a2
Figure A3. Experimental sequence in operating the system. The time order is from photo 1 to photo 9. These assembly implies a knack to conduct the experiment to make the sample be superconductive. Two stabilized power supplies are employed. The left one is the voltage source as cv mode and the right one is the current source as cc mode. As shown, when the volume of the voltage source is added, the voltage of the current source can be reduced, interlocking with the input of the voltage source. Thus, the iteration of adding of the input of the voltage source can make the voltage of the current source be reduced to zero intermittently. Note that the current in the voltage source stems from the output current from the current source.
Preprints 99359 g0a3aPreprints 99359 g0a3bPreprints 99359 g0a3c
Table A1. Specifications of samples. Note that, if the input-resistance of a sample is sufficiently small such that the current from a current source can be input, our system could work, which implies that any substance can be accepted and that there are not specific meanings in the sample in this table. In case, however, material of the present sample is copper.
Inductance 100 μH
Resistance 0.036 Ω
Table A2. The states of the voltage and current sources in operating the system. Note that the voltage V implies the voltage between the taps of the current source.
Sample A Sample B Sample C
V [V] 0.0 0.0 0.0
I [A] 0.3 0.48 0.56
Table A3. The results of the measurements for electrical resistances. Note that the measurements were conducted by 4-terminal method and that these measurements were conducted independently for the system. Moreover, the supplied current must be lower than that in operating the system. Note that the resultant voltages of the sample were always 0.0 mV but we considered the limit of the measuring device.
Sample A Sample B Sample C
Electric resistance [Ω]    Less than
   3.2 × 10⁻⁴
   Less than
   3.9 × 10⁻⁴
   Less than
   1.6 × 10⁻⁴
Table A4. Voltage generations as a result of the applications of the static magnetic fields. Note that V0 implies the voltage between other taps of the 4-terminal method. As shown, energy is generated, receiving the static magnetic field. These responses of the static magnetic fields imply discharged currents such that the sample released the additional magnetic field energy, which implies the Meissner effect.
Sample A Sample B Sample C
I[A]/V[V] 0.4/0.0 0.39/0.0 0.48/0.0
V0 [mV] -1.5 8.9 -12.0
Reference
[1a]
J.G. Bednorz and K.A. Müller, Zeitschrift für Physik B 64, 189–193 (1986)
[2a]
Kamihara et al, J. Am. Chem. Soc 128 (31), 10012-10013 (2006)
[3a]
J. Nagamatsu et al, Nature 410, 63 (2001)
[4a]
M. Somayazulu et al, Phys. Rev. Lett. 122, 027001 (2019)
[5a]
S. Ishiguri, J. Supercond. Nov. Magn. 24, 455 (2011)
[6a]
S. Ishiguri, Int. J. of Mod. Phys. B 27, 1350045 (2013)
[7a]
S. Ishiguri, Preprints 2018, 2018110636 (2019)

References

  1. J. Bardeen, L. Cooper, J.R. Schrieffer, Phys. Rev. 108, 1175 (1957).
  2. J.G. Bednorz and K.A and Müller, Zeitschrift für Physik B. 64, 189–193 (1986).
  3. P.W. Anderson et al, J. Phys.: Condens. Matter 16(24), R755 (2004).
  4. D.J. Scalapino, Phys. Rep. 250, 329 (1995).
  5. T. Moriya and K. Ueda, Advances in Physics 49, 555 (2000).
  6. M. Le. Tacon et al, Nature Physics 2, 537 (2006).
  7. J. Nagamatsu et al, Nature 410, 63 (2001).
  8. S. Souma et al, Nature 423, 65 (2003).
  9. Kamihara et al, J. Am. Chem. Soc 128 (31), 10012-10013 (2006).
  10. N. Ni et al, Phys. Rev. B78, 214515 (2008).
  11. S. Jiang et al, J. Phys. Condens. Matter 21, 382203 (2009).
  12. F. Ronning, et al, J. Phys. Condens. Matter 20, 322201 (2008).
  13. C. Krellner, et al, Phys. Rev. B78, 100504 (R) (2008).
  14. Q. Huang et al, Phys. Rev. Lett. 101, 257703 (2008).
  15. E. Zurek and T. Bi, J. Chem. Phys. 150, 050901 (2019).
  16. M. Somayazulu et al, Phys. Rev. Lett. 122, 027001 (2018).
  17. Z. Zhang et al, Phys. Rev. Lett. 128, 047001 (2022).
  18. S. Ishiguri, J. Supercond. Nov. Magn. 24, 455 (2011).
  19. S. Ishiguri, Int. J. of Mod. Phys. B 27, 1350045 (2013).
  20. S. Ishiguri, Preprints 2018, 2018110636 (2019).
  21. M. Ogata and H. Fukuyama, Rep. Prog. Phys. 71, 659 (2008).
  22. M. Azuma, et al, Phys. Rev. Lett. 73 3463 (1994).
  23. F. C. Zhang and T. M. Rice, Phys. Rev. B 37, 3759 (1988).
  24. Y. Aharonov and D. Bohm, Phys. Rev. 115, 485 (1959).
  25. S. Ishiguri, Preprints 2022, 2022020304 (2022).
  26. H. Wu et al, Nature 604, 653 (2022).
  27. H. Andoh et al, Jpn. J. Appl. Phys. 34 L408 (1995).
  28. I.I. Soloviev et al, Phys. Rev. Applied 16, 14052 (2021).
  29. Y. Yamaguchi and C. Ishii, Physics letters A 84(3), 20, 148-150 (1981).
  30. S. Kobayashi et al, “Fundamentals of Semiconductors and Devices” pp.19-pp.21, Corona Publishing co. Ltd, Tokyo Japan (1998).
  31. S. Ishiguri, Preprints 2019, 2019110033 (2023).
Figure 1. Schematics of the voltage and current sources. The left panel shows the voltage source, which supplies a constant voltage regardless of the value of the connected load. Conversely, the right panel shows the current source, which provides a constant current regardless of the value of the load. This current supply is achieved via the employment of collector currents of transistors. An important point is that their internal resistances, i.e., the input impedances Zin, are opposite to each other. The internal resistance of the voltage source is zero, whereas the internal resistance of the current source is infinite.
Preprints 99359 g001
Figure 2. Schematic of the system generating the superconductivity. After setting a current I from the current source, the output of the voltage source is adjusted to balance the Ohmic voltage from the load. In this way, the voltage over the current source becomes zero but the output current I remains, and the current from the voltage source becomes zero because of the infinite internal resistance of the current source but the output voltage is kept constant. Therefore, the electric powers from the two sources are zero, which implies that the load does not generate Joule heating because of energy conservation. Therefore, we can predict that the resistance of the load will become zero.
Preprints 99359 g002
Figure 3. Schematic of the specific coordinates of an internal toroid. The left panel indicates a load whose macroscopic shape is cylindrical, and R is a radius that is identical to the large radius of a toroid. The right panel shows a cross section of an elemental coil of the internal toroid. The red square of right panel is a cross section of the elemental coil, which is located in the z–r-axes of the specific cylindrical coordinates. Note that these element coils’ cross sections are microscopic and sufficiently small. That is, this is a schematic and therefore an elemental coil is actually very small because its height along the z-axis corresponds to the coherence a of our superconductivity (it is a so-called two-dimensional elemental coil) and that there is generally a ϕ-axis in cylindrical coordinates but the actual area that the magnetic field vectors cross perpendicularly depends on l, depicted as the blue area in the left panel. Note that, in this paper, the length l is assumed to be Na, where N and a denote arbitrary integer and the coherence of our superconductivity, respectively.
Preprints 99359 g003
Figure 4. A circuit for numerical calculations. Note that V3, V4 and V5 imply the probes of electrostatic potentials and that parallel of R1 and L2 implies the equivalent circuit of our superconductivity. However, it is necessary to consider that any substance generally has its very small inductor factor L0 (For example, 0.1mH). As motioned, this small inductor factor generates a self-magnetic field. Even with this inductor factor, the steady state of Figure 2 is not affected. If the value of R1 is varied, then outputs of the voltage source is also varied to maintain the voltage balance at the steady state.
Preprints 99359 g004
Figure 5. Time dependences of the electrical potentials. Note that the perpendicular axes indicate the electrostatic potential [V]. The probe names correspond to those in the schematic circuit shown in Figure 4. The V5 converges to nearly zero after 0.2 s, whereas the V4 indicates negative larger electric potential prior to that time. This negative voltage implies that the additional energy derived from the self-magnetic field was released as a discharge current from the inductance of the toroid.
Preprints 99359 g005
Figure 6. Time dependence of the current in the sample. I (R1) implies the characteristic of current in “R1” and I (L2) is the current of “L2”. Note that the perpendicular axis indicates the current [A]. Corresponding to the behaviors of the electric potentials, the current converges to a steady state after 0.2 s.
Preprints 99359 g006
Figure 7. Time dependences of each electrical potential in the case where the load is 1 Ω. The perpendicular axes indicate the electrostatic potential [V]. Note that the input current is kept constant at 0.5 A but that the input voltage of the voltage source was changed to 0.5 V to balance the voltage. The V5 probe shows that, after 0.4 s, the electrical potential converges to zero, whereas the difference of the V4 and V5 probes indicates negative voltages prior to that time. Therefore, we can see that the surplus energy from the self-magnetic field was released and that this occurred immediately prior to the transition time.
Preprints 99359 g007
Figure 8. Time dependence of the current in the case where the load is 1 Ω. Note that the perpendicular axis indicates the current [A]. Except the transition time, the behaviors are almost same as the cases of 3 Ω.
Preprints 99359 g008
Table 1. Comparisons characteristics between voltage and current sources acting our system.
Voltage (V) Current (A) Electric power (W)
Voltage source Constant V 0 0
Current source 0 Constant I 0
Table 2. Physical constants in the calculation of jc.
Temperature T 300 K
Electron charge q 1.6 × 10 19 C
Boltzmann constant kB 1.38 × 10 23 J/K
Debye temperature θD 120 K
Permittivity ε 8.8 × 10 12 F/m
Coherence a 10 10 m
Output voltage of a voltage source VE 1V
Table 3. Additional physical constants in calculating jc in PNS.
Capacitance C 1.0 × 10 14 F
Applied voltage to condenser Vc 1V
Permittivity ε 8.8 × 10 12 F/m
Surface area of a pole plate of condenser S0 0.01m2
Sored charge of condenser Q 1.0 × 10 14 C
Surface charge density on the pole plates σ 1.0 × 10 12 C/m2
Disclaimer/Publisher’s Note: The statements, opinions and data contained in all publications are solely those of the individual author(s) and contributor(s) and not of MDPI and/or the editor(s). MDPI and/or the editor(s) disclaim responsibility for any injury to people or property resulting from any ideas, methods, instructions or products referred to in the content.
Copyright: This open access article is published under a Creative Commons CC BY 4.0 license, which permit the free download, distribution, and reuse, provided that the author and preprint are cited in any reuse.
Prerpints.org logo

Preprints.org is a free preprint server supported by MDPI in Basel, Switzerland.

Subscribe

© 2024 MDPI (Basel, Switzerland) unless otherwise stated