Preprint
Article

COVID-2019/2020 Pandemic Impacts on the Solid Waste Sector of Rio de Janeiro Municipality, Brazil: Analysis of Waste Production, Challenges, and Recommendations

Altmetrics

Downloads

392

Views

459

Comments

1

A peer-reviewed article of this preprint also exists.

Submitted:

22 October 2023

Posted:

26 October 2023

You are already at the latest version

Alerts
Abstract
Solid waste management is challenging in many countries, especially developing economies. The impacts of the pandemic continue to be felt and have indicated secondary impacts on waste management. This work draws on data on household solid waste (HSW), healthcare waste (HCW), and recyclables collected in the Rio de Janeiro municipality, analyzed from January 2018 to December 2022. As expected, the collection of HCW in Rio de Janeiro municipality experienced a noticeable increase in 2020 and 2021, with an average of 46.9 tons and 54.3 tons collected, respectively. Notably, 2021 saw a significant 30% increase compared to 2019 (p-value<0.001). No significant difference was observed in recyclables collected from 2018 to 2021. The average recyclable amount was 3,638 and 3,747 tons per month in 2020 and 2021. In contrast, the monthly amount was equal to 4,819.5 tons in 2022, representing an increase higher than 32% compared to previous years (p-value<0.05). Our findings can be used to adapt and improve waste systems to cope with similar emergency scenarios in the future, serving as a template for municipalities with similar challenges.
Keywords: 
Subject: Engineering  -   Chemical Engineering

1. Introduction

On January 30, 2020, the World Health Organization (WHO) announced that the Coronavirus disease 2019 (COVID-19) outbreak in China was to be considered a Public Health Emergency of International Concern, representing a significant threat to countries with fragile healthcare systems [1]. The COVID-2019/2020 pandemic, caused by the severe acute respiratory syndrome coronavirus (SARS-CoV-2), not only led to unprecedented public health problems but also put light on several socio-economic problems and eco-environmental threats [2,3].
Effective waste management has difficulties in several nations, particularly within developing economies. [4]. As we have seen during COVID, the pandemic impacted several sectors. For instance, implementing social distancing and quarantine policies has diminished the workforce in every economic domain, leading to significant financial losses. The reduced demand for goods and manufactured products has exacerbated these challenges [3].
The waste management system is critical in a sanitary crisis like COVID-19 to ensure public health quality and avoid the escalation of the vírus. As we saw during the acute pandemic, waste services were heavily impacted in several parts of the globe [5,6]. Seven major waste issues reported during the pandemic in the relevant literature are identified as follows:
1)
The pandemic has changed citizens' habits, bringing waste-generation behavioral trends and new challenges – lockdown and social distancing measures have increased the amount of packaging used for food delivery, online shopping, and household groceries [7,8,9].
2)
The persistence of SARS-CoV-2 on waste surfaces and materials was documented [10]. As a result, waste streams represent a route for viral transmission, a potential risk for the professionals involved in the waste chain [11]. De Almeida et al. [12] documented that coronavirus contamination among waste workers was up to 5.5-fold higher.
3)
The plastic demand has increased, particularly for healthcare and personal protection products (e.g., facemasks, sanitary paper, wipes, and gloves). As a result, this caused plastic waste generation growth [13].
4)
The pandemic caused volatility in secondary material prices and a decline in profits of waste-to-resource companies. Recycling cooperatives and scrap brokers were also affected, mainly in poor and developing nations [12,14]. Besides, the pandemic intensified the mismanagement of recyclable materials, particularly in emerging economies such as Brazil, India, and China, causing further economic losses and adverse social impacts [15]. Scholars argue that the temporary interruption of selective collection and recycling and the relaxation of waste policies during the critical pandemic may negatively affect the waste system in the post-pandemic scenario. Besides, it is worth mentioning that the pandemic has postponed recycling and plastic waste policies in several countries [9,16].
5)
Biomedical waste generation increased, aligning with confirmed COVID-19 cases [17,18]. If improperly collected or treated, contaminated wastes are a significant risk to medical staff and patients and can accelerate disease spread [19,20].
6)
The generation of excessive pandemic-related waste impacted healthcare waste treatment, leading to improper treatment and disposal due to the lack of capacity to deal with the biowaste increment, mainly in cities without the necessary resources to deal with this rise [21].
7)
Waste logistics operations, including waste collection, transportation, and disposal, were hindered during the pandemic, creating additional barriers to the proper waste destination [22].
Identifying changes in times of disaster is a complex endeavor. Studies were published documenting some waste tendencies observed during the recent health emergency crisis. During the outbreak's peak, the volume of hazardous biowaste in the COVID-19 epicenter of China escalated to 247 tons per day, which was nearly six times greater than the pre-pandemic levels. Approximately 600 tons of healthcare waste (HCW) in India were generated daily, representing a roughly 10% increase attributable to the pandemic. Likewise, urban centers, including Manila, Kuala Lumpur, Hanoi, and Bangkok, reported similar upswings in healthcare waste generation [20,23,24].
Regarding household solid waste (HSW), there was an estimated global increase of 43% in food waste and 53% in plastic packaging waste compared to the waste generation levels observed before the pandemic [25]. Other studies explored potential shifts in recyclable materials collection during the health emergency crisis. However, comprehensive numerical data are still lacking [26,27].
In this context, this work draws on data on HSW, HCW, and recyclables collected in the Rio de Janeiro municipality, analyzed from January 2018 to December 2022. This work provides quantitative data and insights into solid waste management systems to support decision-makers in future pandemic-like situations. As highlighted before, solid waste management has become a pivotal concern during pandemics, given the surge in healthcare waste and variations in HSW and recyclables. By enhancing our understanding of how waste production and management evolve during sanitary crises, systems could be adapted and prepared to cope with similar future emergencies, not only in Rio de Janeiro city but across the globe. Our findings can serve as a template for municipalities with similar challenges.

2. Material and methods

2.1. Case Study

The Rio de Janeiro municipality has an entire population living in urban areas. The estimated population is 6.211.423 inhabitants in 2022, and the area is 1.200,329 km2 [28]. The Municipal Human Development Index (HDI-M) in Rio de Janeiro is 0.799 (year 2010), which places it in the range of cities from highly developed nations. In contrast, in 2018, the monthly income was estimated at four minimum wages per capita, approximately US$ 738 per inhabitant [29]. The Rio de Janeiro city is divided into four Zones (i.e., Central, South, North, and West) according to its geographical position concerning the historical city center and similar socio-economic characteristics. In contrast, these zones are characterized by diverse socio-economic realities, as illustrated in Figure 1.

2.2. Data of HSW, HCW, and recyclables collected in Rio de Janeiro Municipality

Quantitative data on waste collected in Rio de Janeiro municipality were extracted from the Municipal Company of Urban Cleaning (COMLURB) internal database. Exploratory evaluation was performed using contemporary literature to provide recommendations for the waste sector. The research process was conducted using the Scopus database. Scopus was selected because of its well-established citation indexing methods and to guarantee that the publications discussed in the present study were peer-reviewed before publication. Integrating qualitative and quantitative data facilitated a comprehensive analysis, providing a holistic understanding of the research context.

2.3. Statistic analysis

The Shapiro-Wilk test confirmed the normality of the data (Table 1S). The non-parametric test Kruskal-Wallis was employed to compare waste production across five independent groups in 2018, 2019, 2020, 2021, and 2022, specifically concerning HSW, HCW, and recyclables categories (Table 2S). Pairwise comparisons were conducted using the Dwass-Steel-Critchlow-Fligner (DSCF) test.
The Spearman correlation test was run to examine whether HSW, HCW, and recyclables were correlated during the analyzed period. No significant correlation was observed (p-value>0.05) (Figure 1S).
All statistical analyses were carried out using JAMOVI software (version 2.3.18) with a significance level (α) set at 5% (α = 0.05).

3. Results

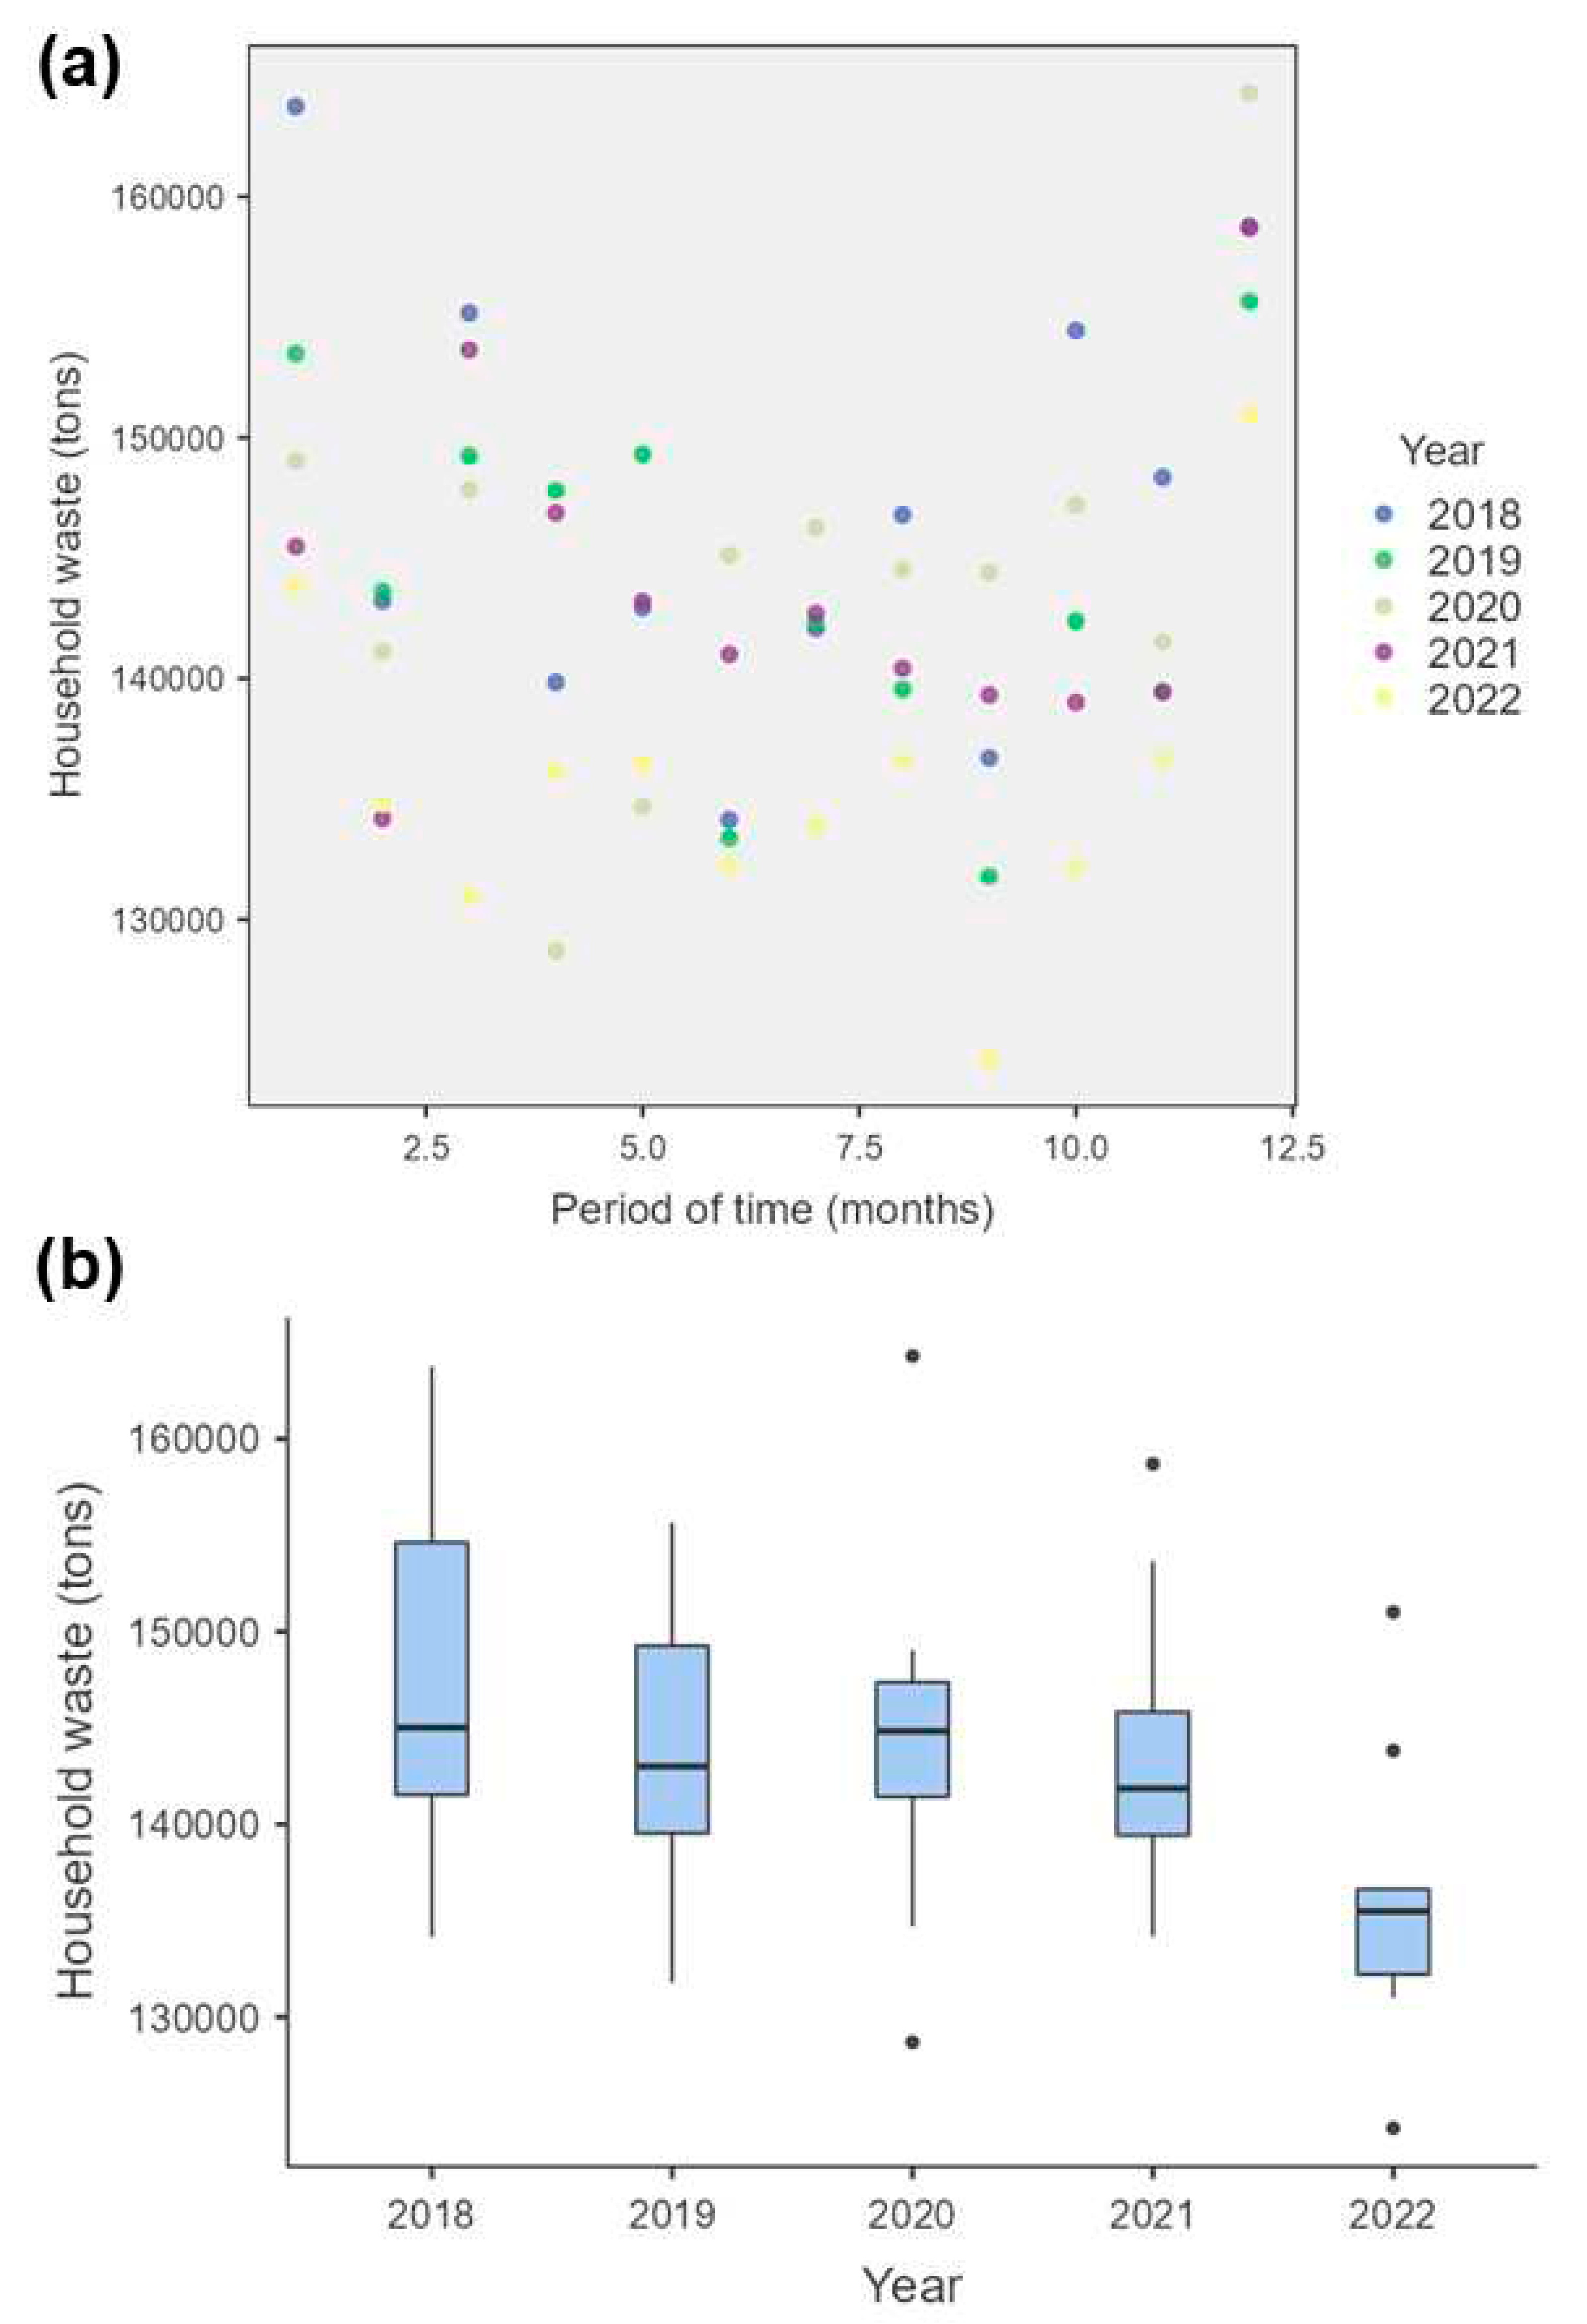
Our findings revealed that the average quantity of household solid waste (HSW) collected in 2022 was lower than in the previous years (Figure 2). The amount of HSW collected was 135,481 tons per month in 2022. This result was significantly lower when compared with 2018 (145,013 tons month-1) (p-value = 0.019) and 2021 (141,855 tons month-1) (p-value = 0.038). Therefore, there were about 7 and 5% reduction of HSW in 2022 compared to 2018 and 2021. No significant difference was recorded during the pandemic period of 2020/2021 and other years (p-value>0.05) (Table 3S). Most interesting data was related to the total amount of HSW collected in the subsequent two months after lockdown and quarantine policies were implemented in the municipality. HSW decreased from 147,849.6 tons in March to 128,694 and 134,692.7 tons in April and May, respectively (Table 1A).
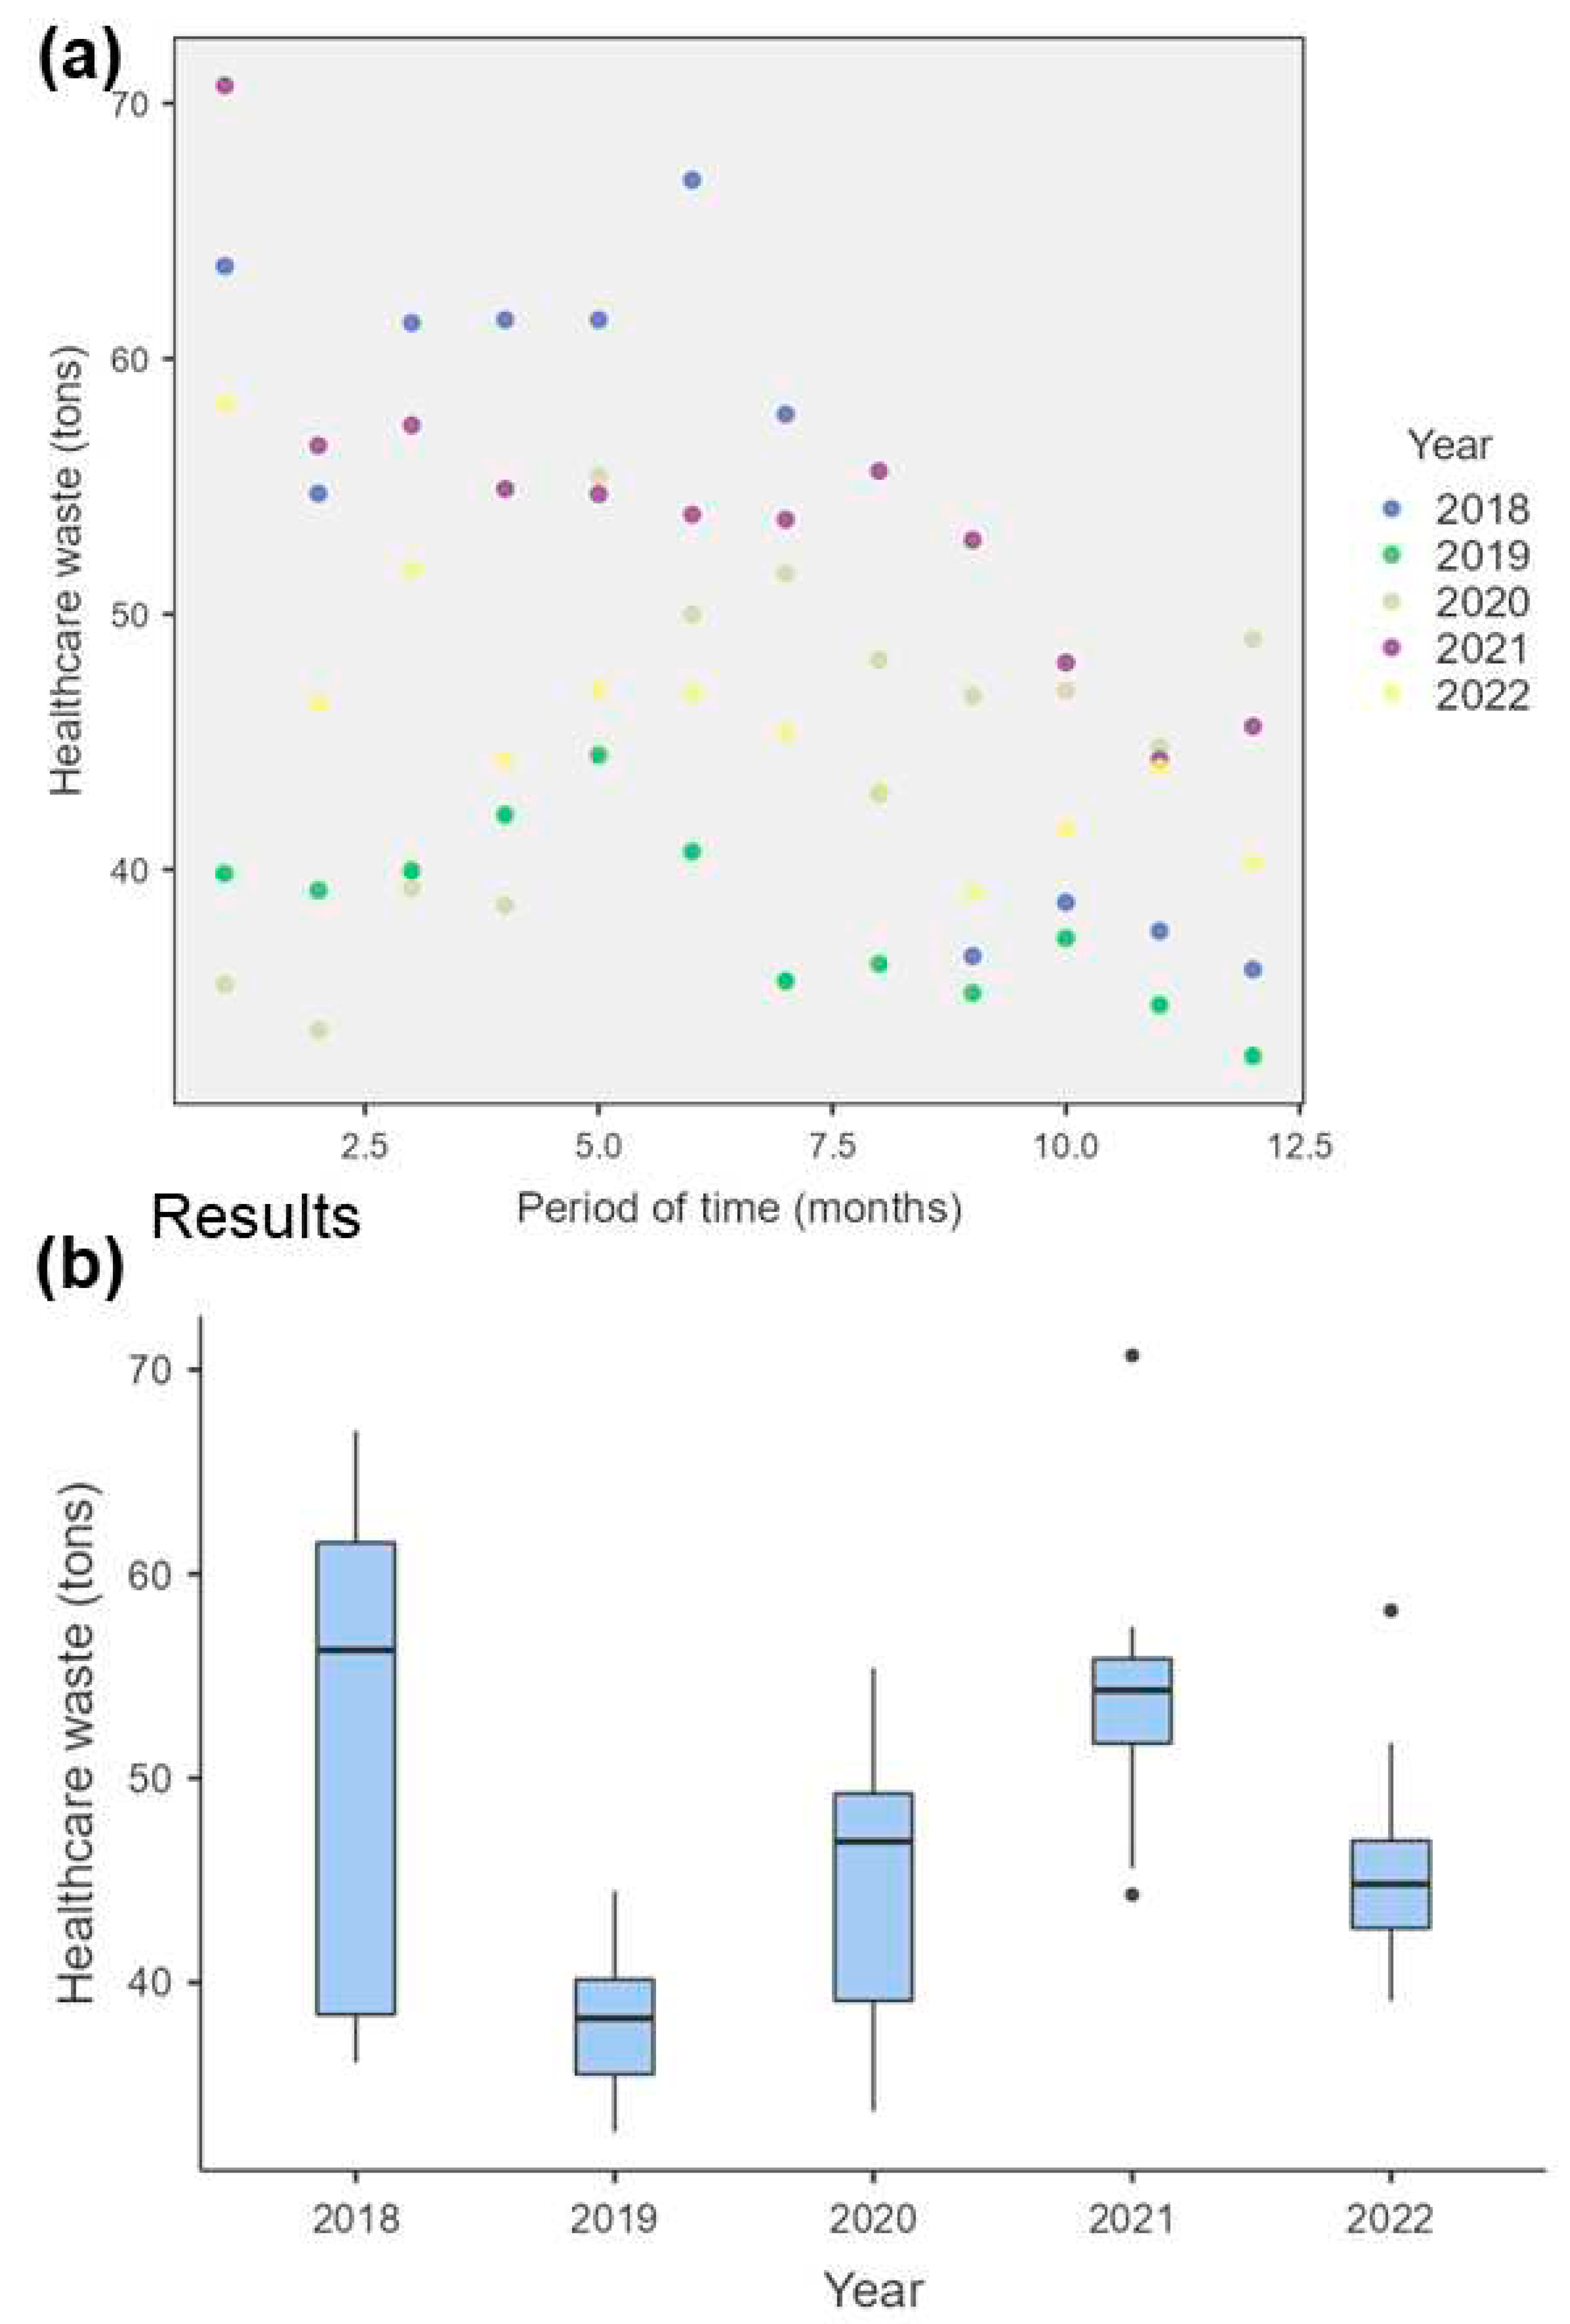
As expected, healthcare waste (HCW) collection increased in Rio de Janeiro municipality in 2020 and 2021. Figure 3 shows that 46.9 and 54.3 tons of HCW were collected in 2020 and 2021 on average. In 2021, there was a significant increase of 30% compared to 2019 (p-value<0.001). However, no significant increase occurred from 2019 to 2020 despite the increment of 19% of HCW collected in the municipality. A significant reduction occurred compared to 2021, and HCW production decreased from 54.3 to 44.81 tons per month in 2022 (p-value = 0.027) (Table 4S).
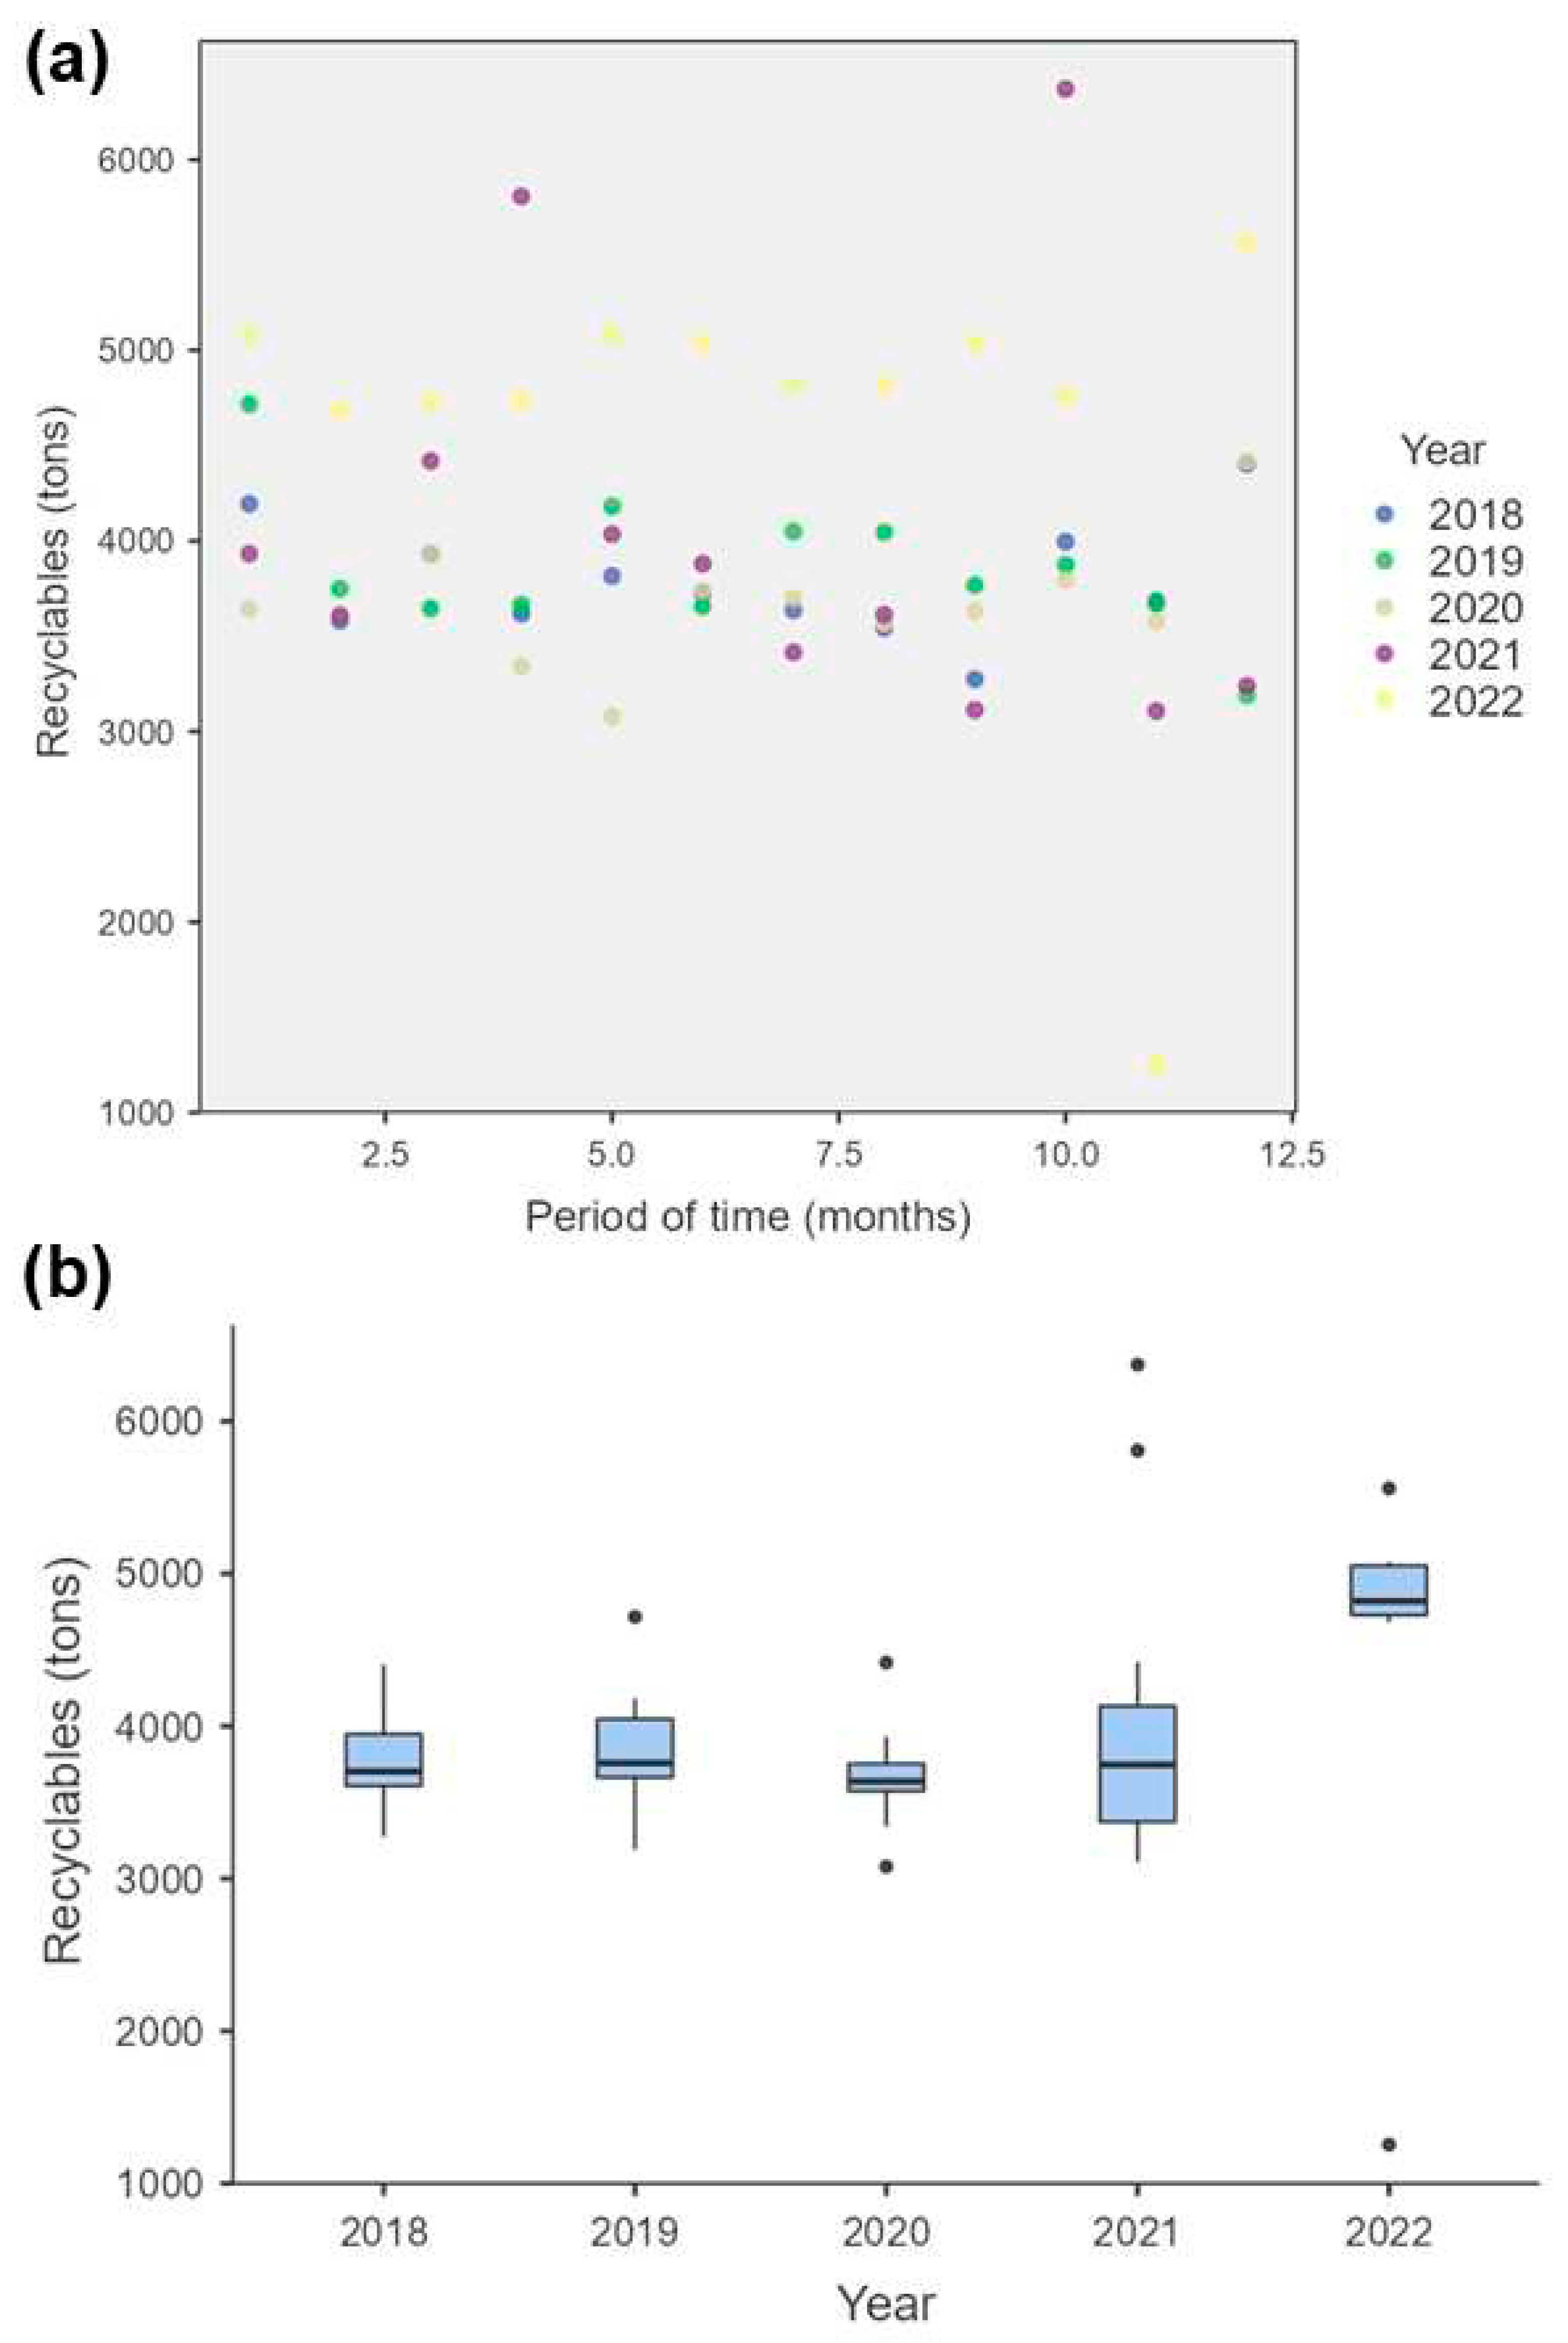
Figure 4 depicts the recyclables collected from 2018 to 2022 in Rio de Janeiro. No significant difference was observed in results from 2018 to 2021. The average recyclable amount was 3,637.5 and 3,746.8 tons per month in 2020 and 2021. In contrast, a significant increase was registered in 2022 (Table 5S). Recyclables collected amounted to 4,819.5 tons monthly in the municipality.

4. Recommendations

Concerning HCW, monitoring treatment facilities' production and installed capacity to assess an eventual need for system expansion is pivotal to constructing a more resilient waste system. Besides, the waste collection frequency needs to be increased and modulated according to specific needs. Temporary alternatives for biowaste management should be utilised in unforeseen circumstances, particularly in poor and developing nations. If existing biowaste plants cannot handle the waste increment, urban incinerators, industrial furnaces, deep burial, and cement kilns should be adopted as provisory solutions [26].
More real-time waste data collection via satellite technology, artificial intelligence, and the Internet of Things for waste amount prediction and transportation optimisation can help thinkers, city stakeholders, and decision-makers strategically plan waste management policies. Transitioning to automated waste systems can reduce health risks in future pandemics [12].
Innovative waste treatment technologies and management models beyond existing ones and a shift to more sustainable material usage are also needed. For example, designing bio-sourced polymers and hybrid packaging materials could enable low-effort efficient recycling [30,31].
On the other hand, full adoption of waste management practices requires governmental policies (e.g., specific regulations and social inclusion) and incentives (e.g., tax justice, subsidies, and waste programmes), which have barely been done in poorer nations and emerging economies, such as Brazil. The lack of investments to build waste facilities – sanitary landfills and waste-to-resource plants, including composting, anaerobic digestion, and recycling facilities − hinders the residues' proper final destination and constitutes a significant problem [12].
Investments in waste sector infrastructure and environmental education – awareness campaigns, consumer/citizens guidance, diffusion of good practices for waste prevention/minimisation/reuse, and training of formal/informal workers − are required during public health emergencies and beyond. Special attention to the informal recycling sector should be given in low- and - middle-income countries. Besides, industries must consolidate their waste management practices and get more involved in municipal waste management systems. In this sense, selective collection and reverse logistics need improvements [32,33].

5. Conclusions

Several studies have been published about waste management during the pandemic; linked to them, potential questions and future research gaps emerge. HCW collection in Rio de Janeiro municipality increased notably in 2020 and 2021, with averages of 46.9 tons and 54.3 tons collected, respectively. Notably, 2021 witnessed a substantial 30% increase compared to 2019 (p-value<0.001). No significant difference was observed in recyclables collected from 2018 to 2021. However, a significant increase occurred in 2022 compared to previous years (p-value<0.05).

Supplementary Materials

The following supporting information can be downloaded at the website of this paper posted on Preprints.org.

Funding

The authors received no financial support for the research, authorship, and publication of this document.

Declaration of conflicting interests

The authors declare no conflict of interest.

Appendix A

Table 1A. Data of HSW, HCW, and recyclables collected in the Rio de Janeiro municipality were analyzed from January 2018 to July 2023.
Year Period Months HSW (ton) HCW (ton) Recyclables (ton)
2018 1 Jan 163746.55 63.63 4194.31
2 Feb 143224.59 54.72 3580.17
3 Mar 155172.86 61.40 3931.76
4 Apr 139841.06 61.53 3616.95
5 May 142943.78 61.53 3815.82
6 Jun 134146.92 67.00 3724.80
7 Jul 142089.29 57.82 3636.79
8 Aug 146800.70 42.99 3542.68
9 Sep 136712.4 36.61 3275.06
10 Oct 154441.42 38.71 3996.04
11 Nov 148349.62 37.59 3681.55
12 Dec 158778.24 36.09 4404.02
2019 1 Jan 153485.66 39.84 4716.88
2 Feb 143625.66 39.18 3748.95
3 Mar 149244.42 39.96 3645.41
4 Apr 147798.85 42.14 3665.81
5 May 149306.42 44.48 4181.51
6 Jun 133381.52 40.70 3656.93
7 Jul 142349.14 35.63 4049.29
8 Aug 139568.45 36.30 4046.25
9 Sep 131792.31 35.17 3767.42
10 Oct 142384.40 37.31 3875.78
11 Nov 139437.36 34.69 3671.25
12 Dec 155666.02 32.69 3190.25
2020 1 Jan 149035.96 35.50 3644.16
2 Feb 141138.40 33.70 3621.14
3 Mar 147849.60 39.27 3931.95
4 Apr 128694.00 38.60 3341.68
5 May 134692.71 55.40 3078.66
6 Jun 145130.90 50.00 3740.24
7 Jul 146265.68 51.60 3701.54
8 Aug 144538.94 48.20 3569.18
9 Sep 144400.87 46.80 3630.87
10 Oct 147209.05 47.00 3794.54
11 Nov 141525.81 44.80 3576.91
12 Dec 164294.98 49.00 4417.44
2021 1 Jan 145484.14 70.70 3932.89
2 Feb 134187.72 56.60 3605.65
3 Mar 153646.36 57.40 4420.20
4 Apr 146875.68 54.90 5808.45
5 May 143194.81 54.70 4035.11
6 Jun 141005.89 53.90 3880.33
7 Jul 142703.85 53.70 3415.98
8 Aug 140424.57 55.60 3613.33
9 Sep 139320.45 52.90 3113.45
10 Oct 139016.00 48.10 6371.67
11 Nov 139459.87 44.30 3107.60
12 Dec 158697.59 45.60 3239.51
2022 1 Jan 143821.50 58.21 5077.26
2 Feb 134789.75 46.50 4681.51
3 Mar 130983.48 51.72 4725.05
4 Apr 136172.35 44.29 4729.70
5 May 136509.18 47.00 5076.00
6 Jun 132250.52 46.92 5045.72
7 Jul 133865.11 45.34 4818.00
8 Aug 136622.78 43.00 4821.14
9 Sep 124236.56 39.10 5042.14
10 Oct 132149.95 41.61 4766.00
11 Nov 136693.95 43.99 1254.51
12 Dec 151005.36 40.25 5560.00
HSW = household solid waste. HCW = healthcare waste.

References

  1. Sohrabi, C.; Alsafi, Z.; O'Neill, N.; Khan, M.; Kerwan, A.; Al-Jabir, A.; Iosifidis, C.; Agha, R. World Health Organization Declares Global Emergency: A Review of the 2019 Novel Coronavirus (COVID-19). Int. J. Surg. 2020, 76, 71–76. [CrossRef]
  2. Jayasinghe, P.A.; Jalilzadeh, H.; Hettiaratchi, P. The Impact of COVID-19 on Waste Infrastructure: Lessons Learned and Opportunities for a Sustainable Future. Int. J. Environ. Res. Public Health 2023, 20. [CrossRef]
  3. Nicola, M.; Alsafi, Z.; Sohrabi, C.; Kerwan, A.; Al-Jabir, A.; Iosifidis, C.; Agha, M.; Agha, R. The Socio-Economic Implications of the Coronavirus Pandemic (COVID-19): A Review. Int. J. Surg. 2020, 78, 185–193. [CrossRef]
  4. Batista, M.; Gusmão Caiado, R.G.; Gonçalves Quelhas, O.L.; Alves Lima, G.B.; Filho, W.L.; Rocha Yparraguirre, I.T. A Framework for Sustainable and Integrated Municipal Solid Waste Management: Barriers and Critical Factors to Developing Countries. J. Clean. Prod. 2021, 127516. [CrossRef]
  5. Sarkodie, S.A.; Owusu, P.A. Impact of COVID-19 Pandemic on Waste Management. Environ. Dev. Sustain. 2021, 23, 7951–7960. [CrossRef]
  6. Mofijur, M.; Fattah, I.M.R.; Alam, M.A.; Islam, A.B.M.S.; Ong, H.C.; Rahman, S.M.A.; Najafi, G.; Ahmed, S.F.; Uddin, M.A.; Mahlia, T.M.I. Impact of COVID-19 on the Social, Economic, Environmental and Energy Domains: Lessons Learnt from a Global Pandemic. Sustain. Prod. Consum. 2021, 26, 343–359. [CrossRef]
  7. Kulkarni, B.N.; Anantharama, V. Repercussions of COVID-19 Pandemic on Municipal Solid Waste Management: Challenges and Opportunities. Sci. Total Environ. 2020, 743, 140693. [CrossRef]
  8. Ganguly, R.K.; Chakraborty, S.K. Integrated Approach in Municipal Solid Waste Management in COVID-19 Pandemic: Perspectives of a Developing Country like India in a Global Scenario. Case Stud. Chem. Environ. Eng. 2021, 3, 100087. [CrossRef]
  9. Liang, Y.; Song, Q.; Wu, N.; Li, J.; Zhong, Y.; Zeng, W. Repercussions of COVID-19 Pandemic on Solid Waste Generation and Management Strategies. Front. Environ. Sci. Eng. 2021, 15, 115. [CrossRef]
  10. Kampf, G.; Todt, D.; Pfaender, S.; Steinmann, E. Persistence of Coronaviruses on Inanimate Surfaces and Their Inactivation with Biocidal Agents. J. Hosp. Infect. 2020, 104, 246–251. [CrossRef]
  11. Di Maria, F.; Beccaloni, E.; Bonadonna, L.; Cini, C.; Confalonieri, E.; La Rosa, G.; Milana, M.R.; Testai, E.; Scaini, F. Minimization of Spreading of SARS-CoV-2 via Household Waste Produced by Subjects Affected by COVID-19 or in Quarantine. Sci. Total Environ. 2020, 743, 140803. [CrossRef]
  12. de Almeida, R.; de Souza, R.G.; Campos, J.C. Lessons and Challenges for the Recycling Sector of Brazil from the Pandemic Outbreak of COVID-19. Waste Dispos. Sustain. Energy 2021. [CrossRef]
  13. Vanapalli, K.R.; Sharma, H.B.; Ranjan, V.P.; Samal, B.; Bhattacharya, J.; Dubey, B.K.; Goel, S. Challenges and Strategies for Effective Plastic Waste Management during and Post COVID-19 Pandemic. Sci. Total Environ. 2021, 750, 141514. [CrossRef]
  14. Zhou, C.; Yang, G.; Ma, S.; Liu, Y.; Zhao, Z. The Impact of the COVID-19 Pandemic on Waste-to-Energy and Waste-to-Material Industry in China. Renew. Sustain. Energy Rev. 2021, 139, 110693. [CrossRef]
  15. Warmadewanthi, I.; Wulandari, D.; Cahyadi, M.N.; Pandebesie, E.S.; Anityasari, M.; Dwipayanti, N.M.U.; Purnama, I.G.H.; Nisaa, A.F. Socio-Economic Impacts of the COVID-19 Pandemic on Waste Bank Closed-Loop System in Surabaya, Indonesia. Waste Manag. Res. J. a Sustain. Circ. Econ. 2021, 0734242X2110179. [CrossRef]
  16. Penteado, C.S.G.; Castro, M.A.S. de Covid-19 Effects on Municipal Solid Waste Management: What Can Effectively Be Done in the Brazilian Scenario? Resour. Conserv. Recycl. 2021, 164, 105152. [CrossRef]
  17. Sangkham, S. Face Mask and Medical Waste Disposal during the Novel COVID-19 Pandemic in Asia. Case Stud. Chem. Environ. Eng. 2020, 2, 100052. [CrossRef]
  18. Agamuthu, P.; Barasarathi, J. Clinical Waste Management under COVID-19 Scenario in Malaysia. Waste Manag. Res. J. a Sustain. Circ. Econ. 2020, 0734242X2095970. [CrossRef]
  19. Yu, H.; Sun, X.; Solvang, W.D.; Zhao, X. Reverse Logistics Network Design for Effective Management of Medical Waste in Epidemic Outbreak: Insights from the Coronavirus Disease 2019 (COVID-19) in Wuhan. SSRN Electron. J. 2020. [CrossRef]
  20. Ramteke, S.; Sahu, B.L. Novel Coronavirus Disease 2019 (COVID-19) Pandemic: Considerations for the Biomedical Waste Sector in India. Case Stud. Chem. Environ. Eng. 2020, 2, 100029. [CrossRef]
  21. Filimonau, V. The Prospects of Waste Management in the Hospitality Sector Post COVID-19. Resour. Conserv. Recycl. 2021, 168, 105272. [CrossRef]
  22. Babaee Tirkolaee, E.; Aydın, N.S. A Sustainable Medical Waste Collection and Transportation Model for Pandemics. Waste Manag. Res. 2021. [CrossRef]
  23. Agamuthu, P.; Barasarathi, J. Clinical Waste Management under COVID-19 Scenario in Malaysia. Waste Manag. Res. 2021, 39, 18–26. [CrossRef]
  24. You, S.; Sonne, C.; Ok, Y.S. COVID-19’s Unsustainable Waste Management. Science (80-. ). 2020, 368, 1438–1438. [CrossRef]
  25. Filho, W.L.; Voronova, V.; Kloga, M.; Paço, A.; Minhas, A.; Salvia, A.L.; Ferreira, C.D.; Sivapalan, S. COVID-19 and Waste Production in Households: A Trend Analysis. Sci. Total Environ. 2021, 777, 145997. [CrossRef]
  26. Urban, R.C.; Nakada, L.Y.K. COVID-19 Pandemic: Solid Waste and Environmental Impacts in Brazil. Sci. Total Environ. 2021, 755, 142471. [CrossRef]
  27. Azevedo, A.M.M. de; Gutberlet, J.; Araújo, S.D. de; Duarte, F.H. Impacts of Covid-19 on Organized Waste Pickers in Selected Municipalities in the State of São Paulo. Ambient. Soc. 2022, 25, 1–25. [CrossRef]
  28. IBGE (Brazilian Institute of Geography and Statistics) Cidades@ Available online: https://www.ibge.gov.br/cidades-e-estados.html (accessed on 15 September 2023).
  29. Brazil, A. Atlas Do Desenvolvimento Humano Do Brasil [In Portuguese]; 2020;
  30. Sharma, H.B.; Vanapalli, K.R.; Cheela, V.S.; Ranjan, V.P.; Jaglan, A.K.; Dubey, B.; Goel, S.; Bhattacharya, J. Challenges, Opportunities, and Innovations for Effective Solid Waste Management during and Post COVID-19 Pandemic. Resour. Conserv. Recycl. 2020, 162, 105052. [CrossRef]
  31. Klemeš, J.J.; Fan, Y. Van; Tan, R.R.; Jiang, P. Minimising the Present and Future Plastic Waste, Energy and Environmental Footprints Related to COVID-19. Renew. Sustain. Energy Rev. 2020, 127, 109883. [CrossRef]
  32. Azevedo, B.D.; Scavarda, L.F.; Caiado, R.G.G. Urban Solid Waste Management in Developing Countries from the Sustainable Supply Chain Management Perspective: A Case Study of Brazil's Largest Slum. J. Clean. Prod. 2019, 233, 1377–1386. [CrossRef]
  33. Azevedo, B.D.; Scavarda, L.F.; Caiado, R.G.G.; Fuss, M. Improving Urban Household Solid Waste Management in Developing Countries Based on the German Experience. Waste Manag. 2021, 120, 772–783. [CrossRef]
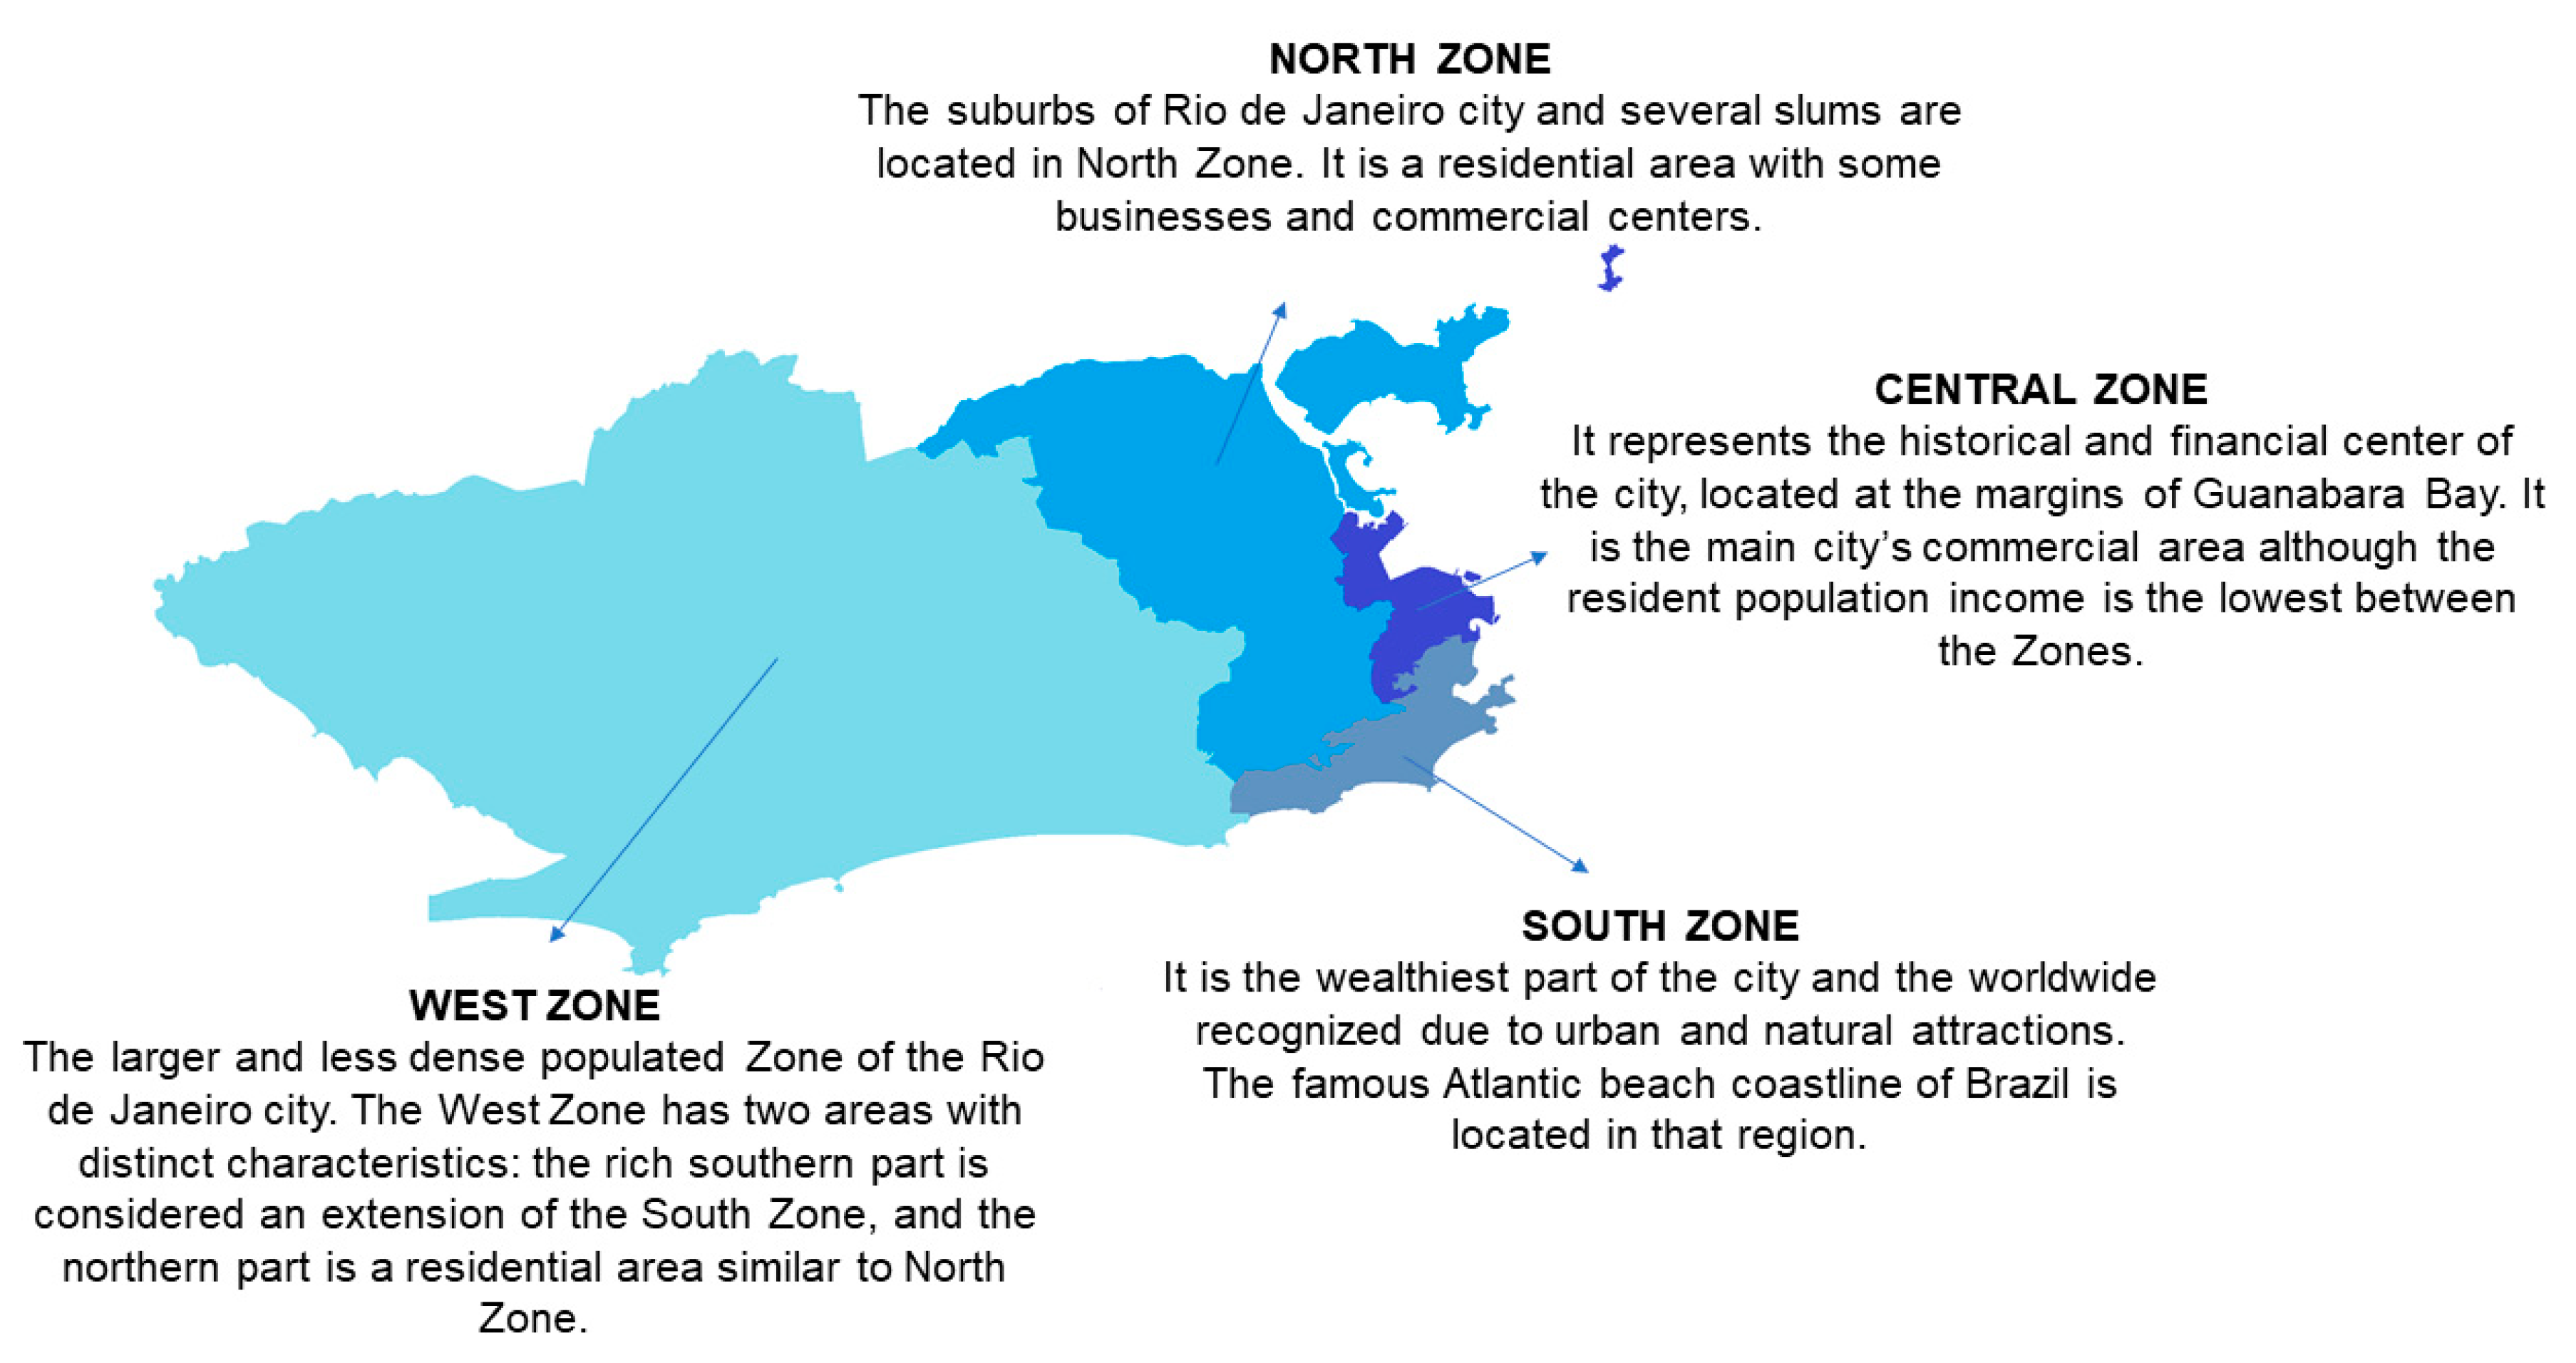
Figure 1. Geographical sub-division of the Rio de Janeiro city.
Preprints 88438 g001
Figure 2. (a) HSW collected from January 2018 to December 2022 in Rio de Janeiro municipality. (b) Boxplot chart of HSW collected from 2018 to 2022. HSW = household solid waste.
Preprints 88438 g002
Figure 3. HCW collected from January 2018 to December 2022 in Rio de Janeiro municipality. (b) Boxplot chart of HCW collected from 2018 to 2022. HCW = healthcare waste.
Preprints 88438 g003
Figure 4. Recyclables collected from January 2018 to December 2022 in Rio de Janeiro municipality. (b) Boxplot chart of recyclables collected from 2018 to 2022.
Preprints 88438 g004
Disclaimer/Publisher’s Note: The statements, opinions and data contained in all publications are solely those of the individual author(s) and contributor(s) and not of MDPI and/or the editor(s). MDPI and/or the editor(s) disclaim responsibility for any injury to people or property resulting from any ideas, methods, instructions or products referred to in the content.
Copyright: This open access article is published under a Creative Commons CC BY 4.0 license, which permit the free download, distribution, and reuse, provided that the author and preprint are cited in any reuse.
Prerpints.org logo

Preprints.org is a free preprint server supported by MDPI in Basel, Switzerland.

Subscribe

© 2024 MDPI (Basel, Switzerland) unless otherwise stated