Submitted:
12 August 2024
Posted:
20 August 2024
You are already at the latest version
Abstract
Keywords:
1. Introduction
2. Decomposing Interspecific Transmission

2.1. The Transmission-Rate,
2.1.1. The Contact-Rate,
2.1.2. The Probability of Successful Transmission,
2.2. Calculation of the Outbreak Potential in the Recipient Host,
3. The Role of Host Community Structure in Interspecific Transmission
4. Linking Host Community- and Disease-Ecology
4.1. Host Community Effects on Pathogen Prevalence
4.2. Pathogen Effects on Host Community
5. Pathogen Adaptation in Multi-Host Systems
6. Future Directions
7. Conclusion
- By reviewing and decomposing the process of disease transmission in multi-host communities, we illustrate how the separate components contribute to determining disease outbreak potential.
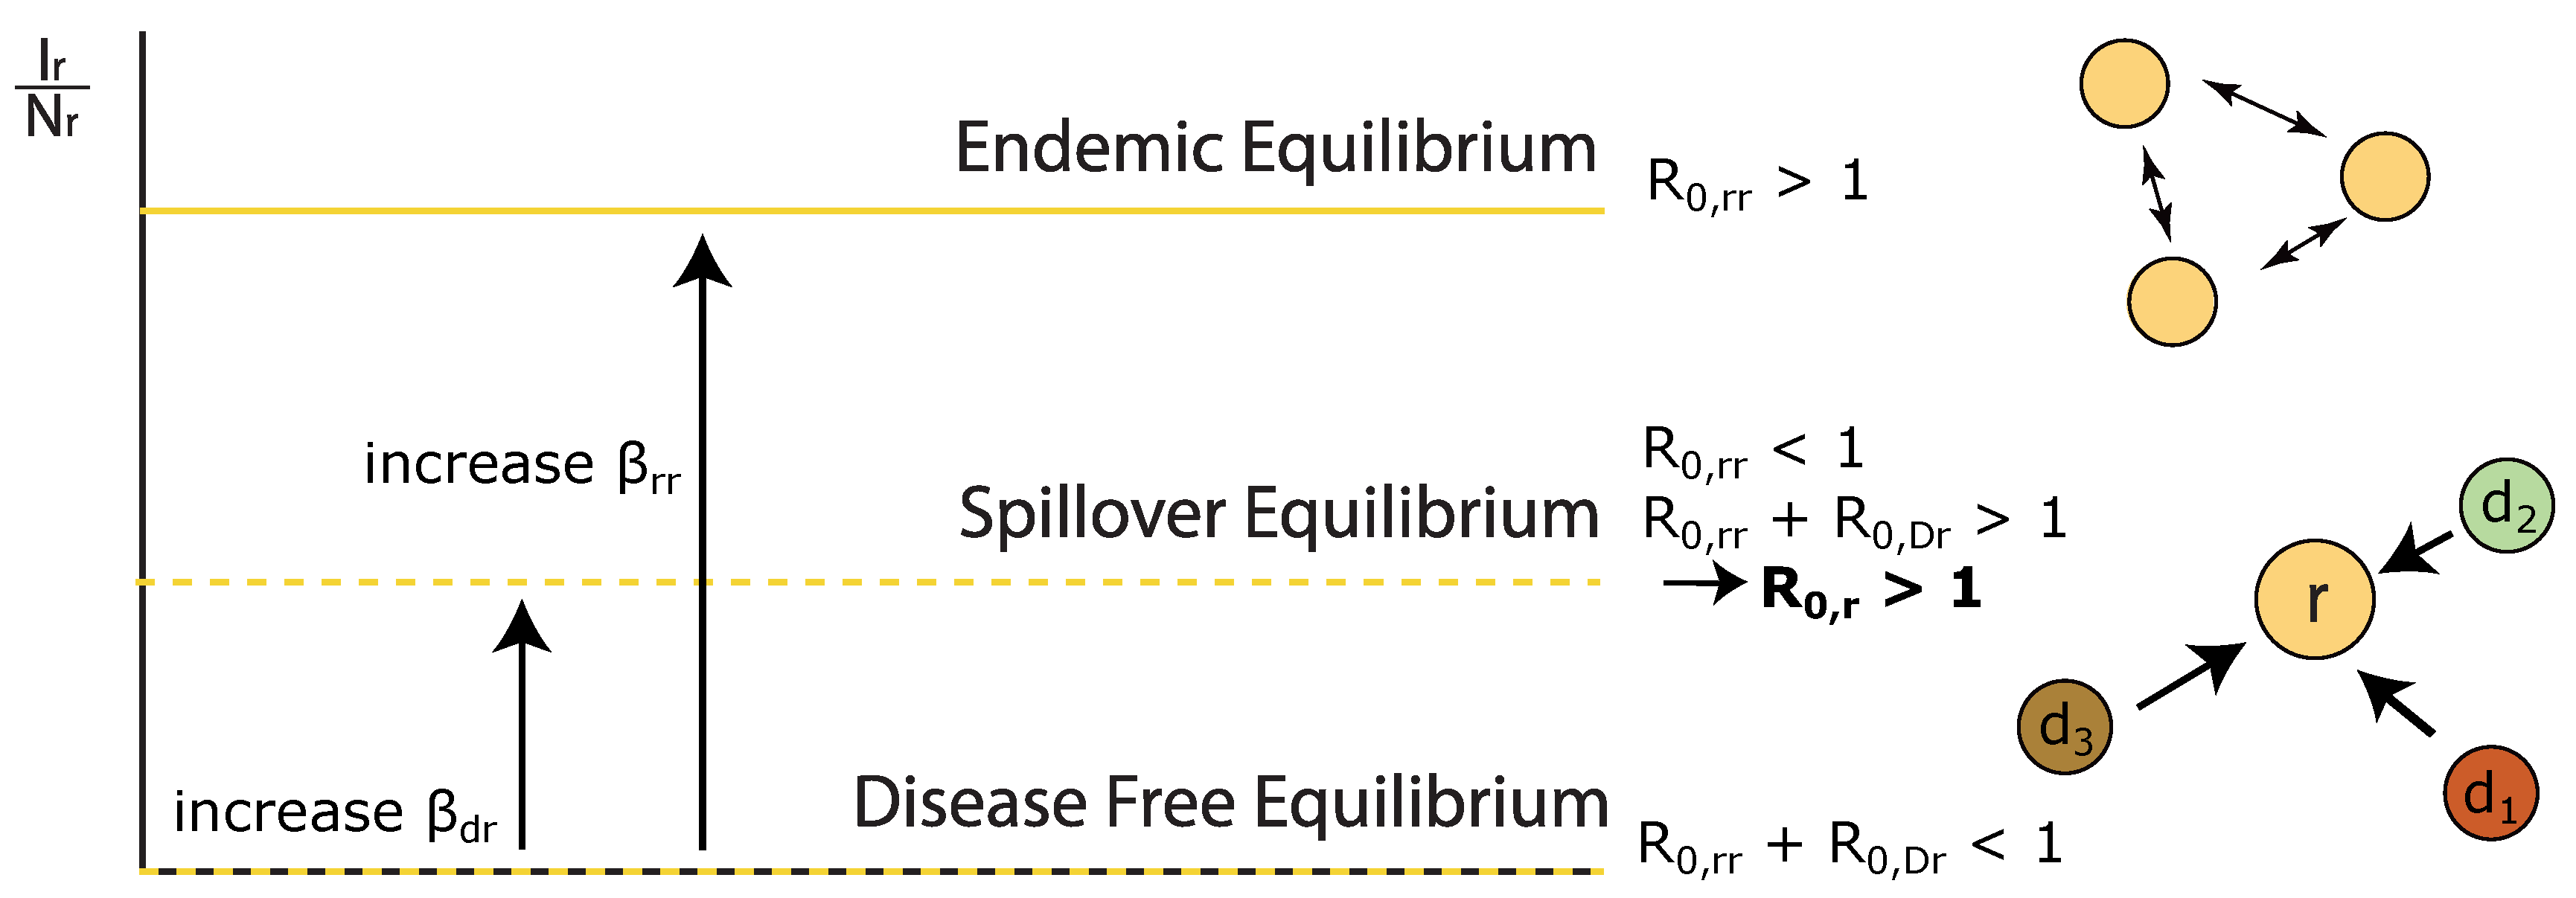
- We describe how the outbreak potential, , within a host is composed of intraspecific and interspecific components which determine whether a disease can be maintained within a host in isolation, or whether interspecific transmission is required to a spillover equilibrium.
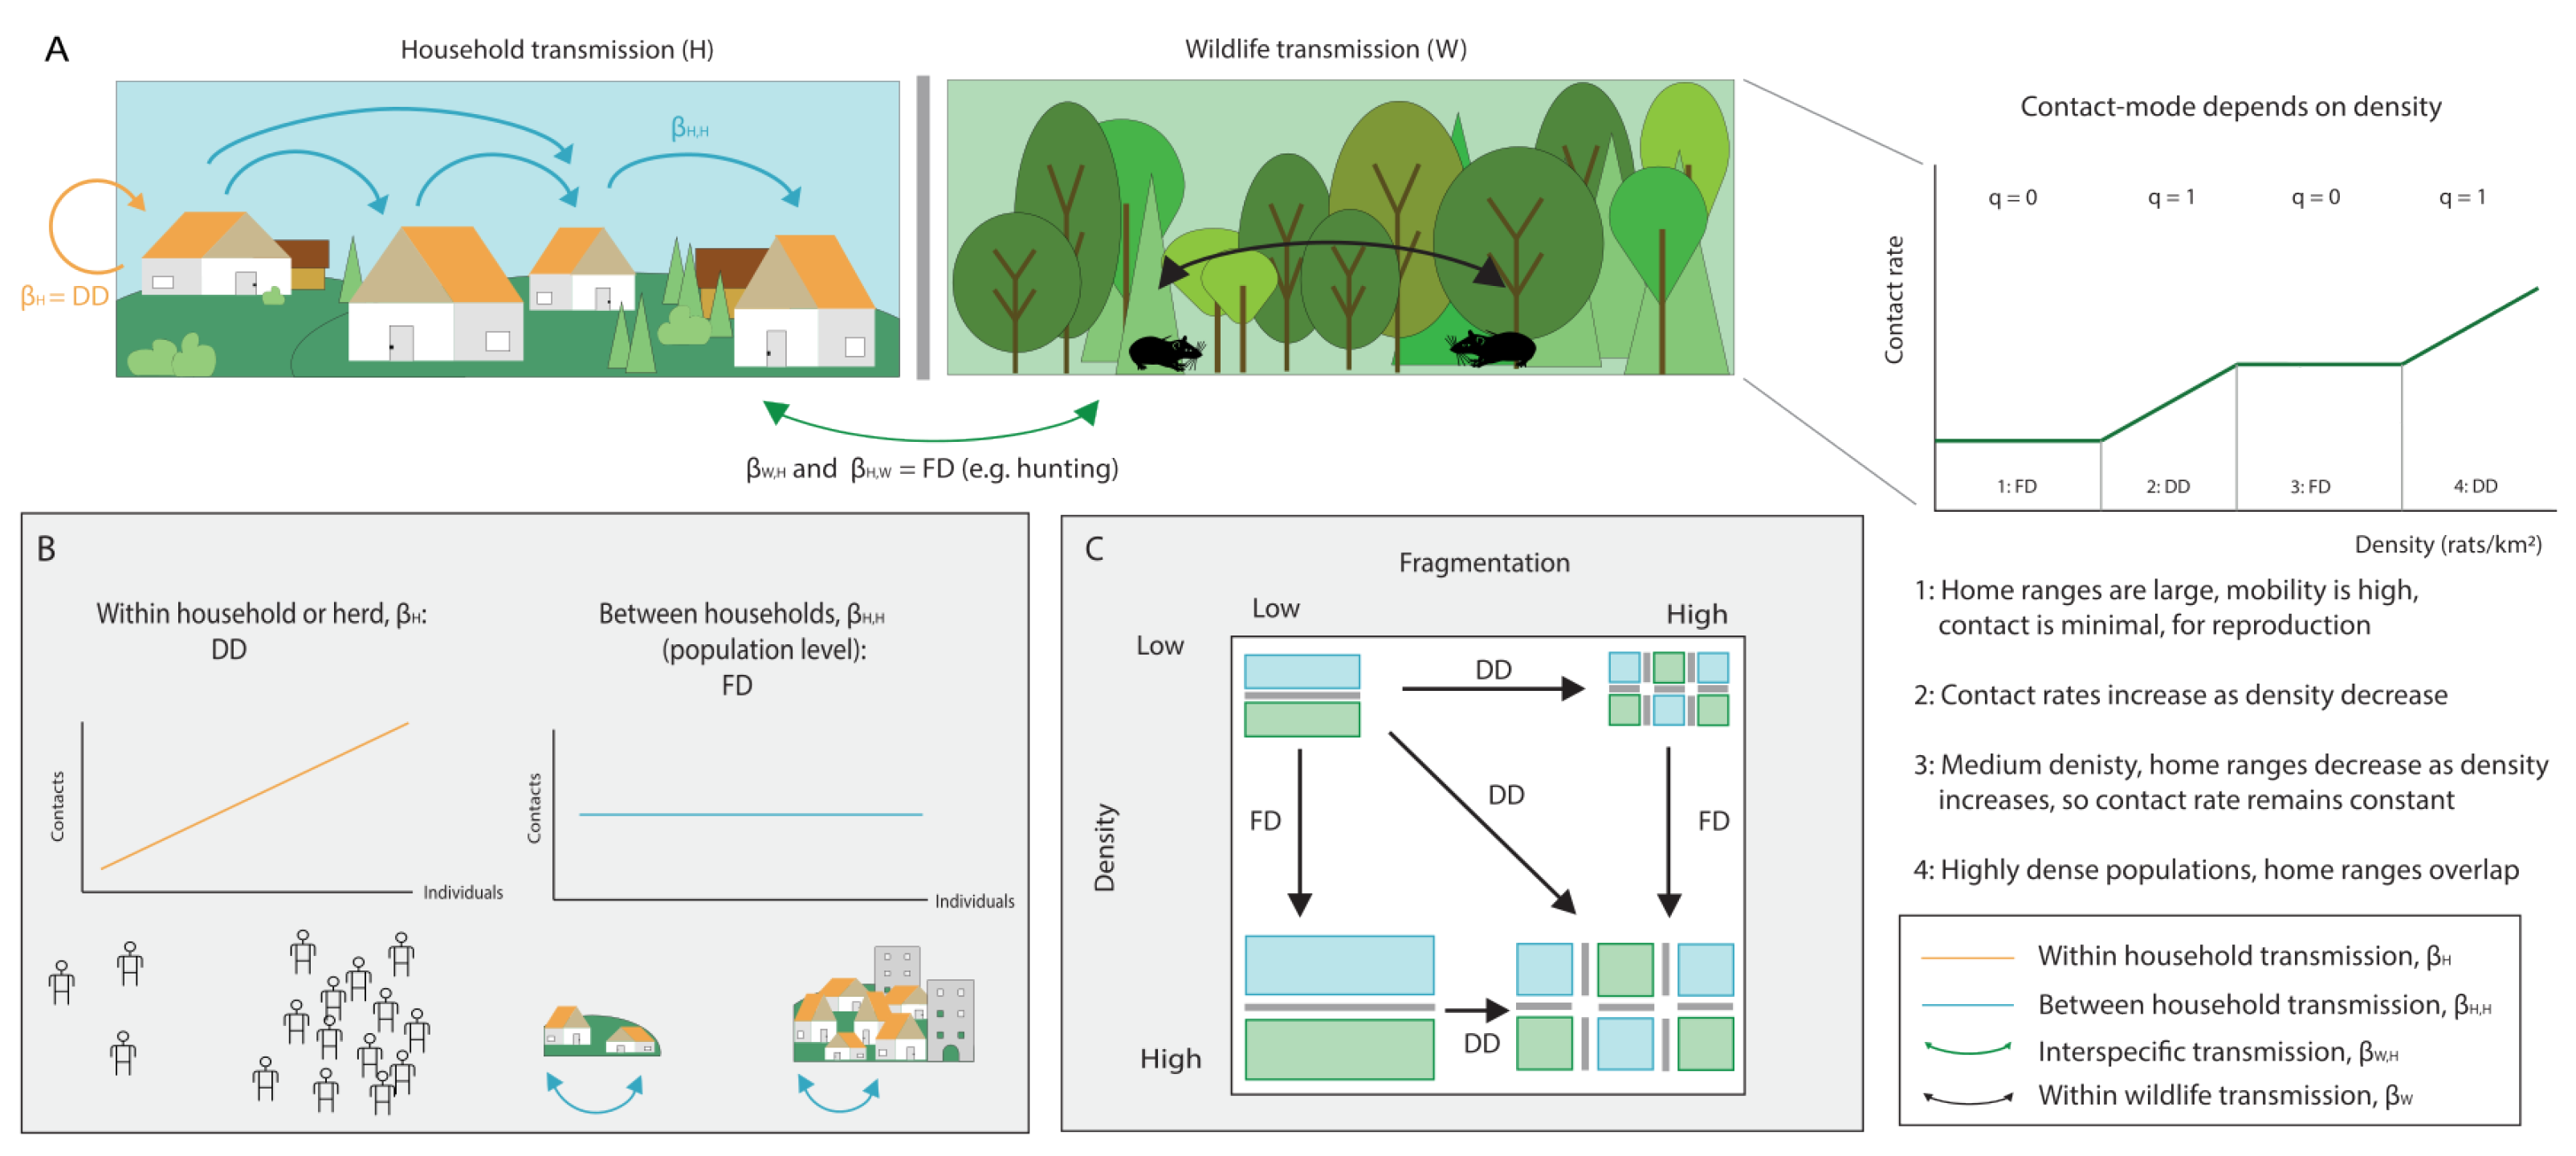
- We highlight that mode of transmission plays an important role in the disease-diversity relationship. Anthropogenic global changes are decreasing space for wildlife and increasing the contact rates between humans and wildlife. In some cases, this can switch interspecific transmission dynamics from density-dependent to frequency-dependent, which can lead to changes in the amplifying or diluting effects of biodiversity on disease prevalence.
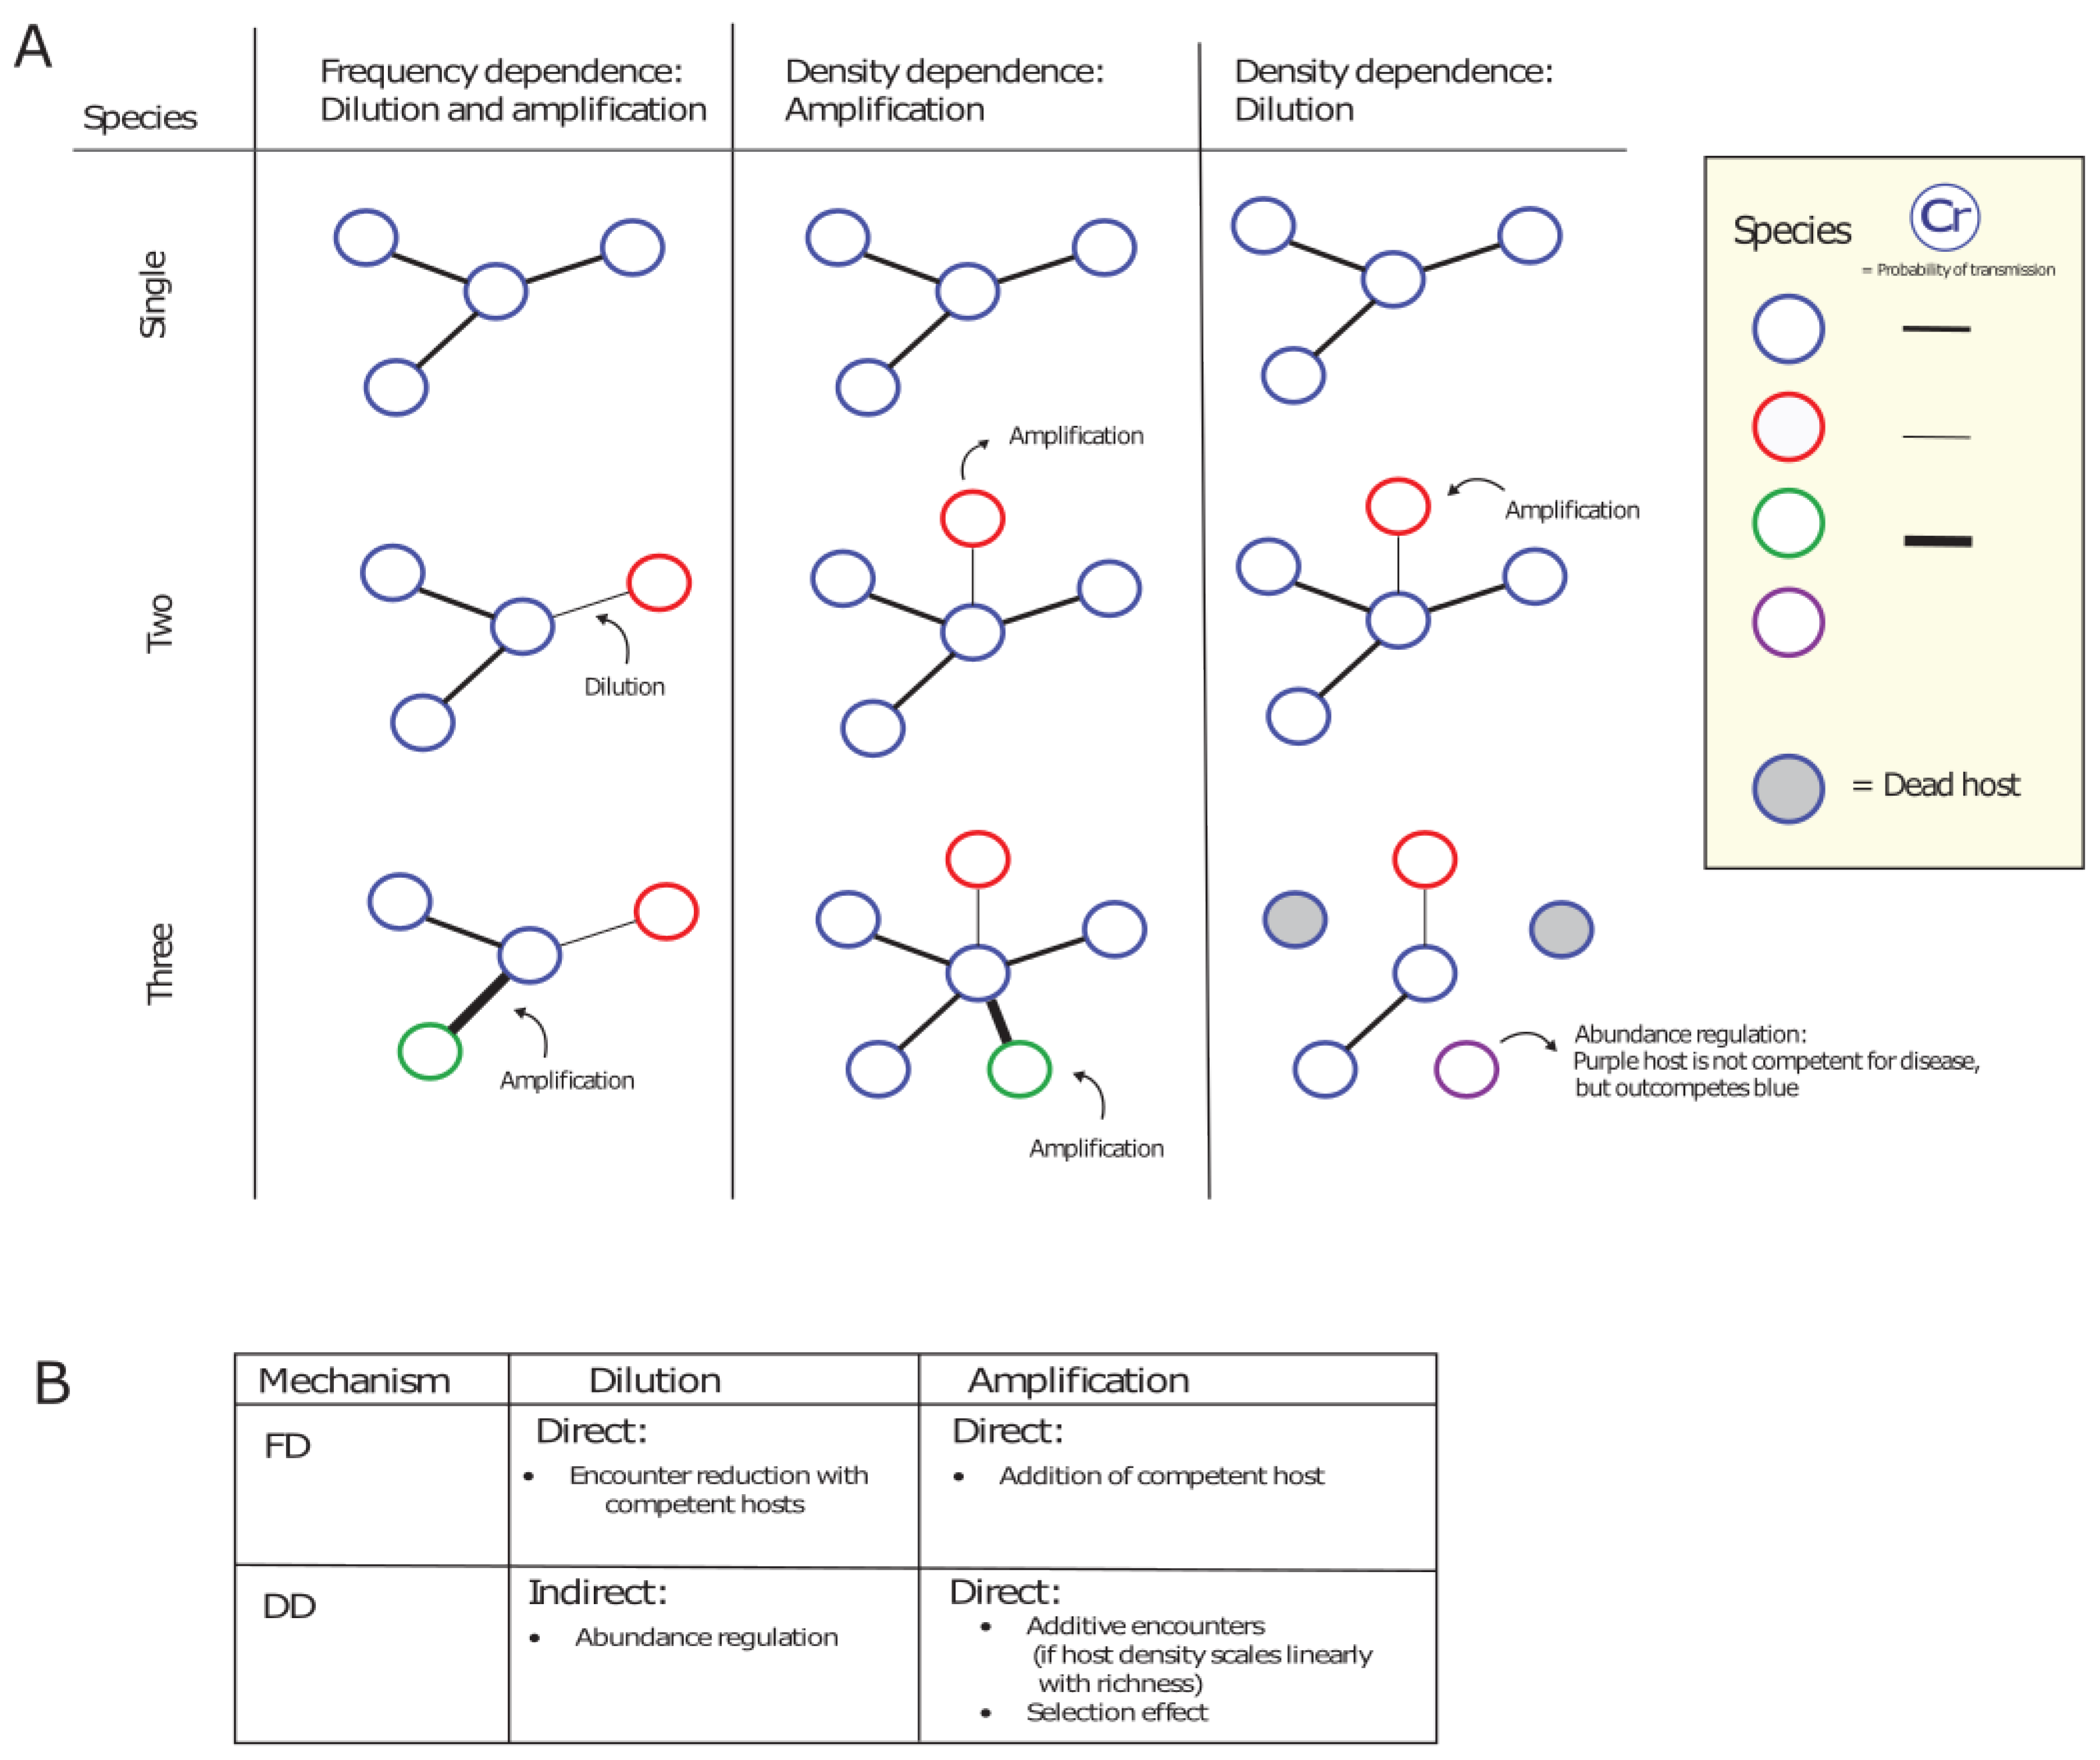
- We draw parallels between well-known disease-diversity relationships and theories of community ecology, and highlight that host competencies and identities play an important role in potential disease dilution and amplification. The well-known and disputed dilution effect can exist of a contact-dependent (FD dilution) as well as a community phylogeny component (phylogenetic dilution).
- In multi-host communities, density-dependent transmission favours the amplifying effect of biodiversity as it assumes indefinitely increasing contacts. However, we expect that contacts will saturate at high host densities, causing a switch to FD transmission. At high host densities we might, therefore, additionally expect a shift in the amplifying/diluting effects of biodiversity.
- Interspecific contacts also play an important role in determining the relationship between host diversity and disease prevalence and we argue there should be a greater focus on the full scale of ecological interactions between hosts when examining the effect of host diversity on disease prevalence.
- Future work is needed to better understand how the composition of host communities determines the prevalence, maintenance and onward transmission of disease, and the likelihood of novel pathogen emergence via host shifts. Accurately defining the interspecific transmission process will be a critical first step.
Appendix A. Derivation of transmission rate β
Appendix B. Generalizing the Derivation of Transmission Rate from the Single-Species Context
Appendix C. Derivation of Endemic Equilibrium for Species r, R 0,r
Appendix D. Interspecific Transmission through WAIFW
Appendix E. Contact Network Model Distributions
- Independent of total population size, N. This is similar to the assumptions of the classic frequency-dependent transmission function
- Increasing linearly with population size, N
- Increasingly less than linear , C being a constant, an intermediate between 1 and 2. This is analogous to the density-dependent transmission function, assuming a constant area.
Appendix E.1. Poisson Distribution
Appendix E.2. Power-Law Truncated Distribution
Appendix E.3. The Exponential Distribution
References
- Jones, K.E.; Patel, N.G.; Levy, M.A.; Storeygard, A.; Balk, D.; Gittleman, J.L.; Daszak, P. Global trends in emerging infectious diseases. Nature 2008, 451, 990–993. [Google Scholar] [CrossRef] [PubMed]
- Dobson, A.; Foufopoulos, J. Emerging infectious pathogens of wildlife. Philosophical Transactions of the Royal Society B: Biological Sciences 2001, 356, 1001–1012. [Google Scholar] [CrossRef] [PubMed]
- Smith, K.F.; Goldberg, M.; Rosenthal, S.; Carlson, L.; Chen, J.; Chen, C.; Ramachandran, S. Global rise in human infectious disease outbreaks. Journal of the Royal Society Interface 2014, 11, 1–6. [Google Scholar] [CrossRef] [PubMed]
- Graham, J.P.; Leibler, J.H.; Price, L.B.; Otte, J.M.; Pfeiffer, D.U.; Tiensin, T.; Silbergeld, E.K. The animal-human interface and infectious disease in industrial food animal production: Rethinking biosecurity and biocontainment. Public Health Reports 2008, 123, 282–299. [Google Scholar] [CrossRef]
- Bar-On, Y.M.; Phillips, R.; Milo, R. The biomass distribution on Earth. Proceedings of the National Academy of Sciences of the United States of America 2018, 115, 6506–6511. [Google Scholar] [CrossRef]
- Daszak, P.; Cunningham, A.A.; Hyatt, A.D. Emerging infectious diseases of wildlife - Threats to biodiversity and human health. Science 2000, 287, 443–449. [Google Scholar] [CrossRef] [PubMed]
- Haydon, D.T.; Cleaveland, S.; Taylor, L.H.; Laurenson, M.K. Identifying reservoirs of infection: A conceptual and practical challenge. Emerging Infectious Diseases 2002, 8, 1468–1473. [Google Scholar] [CrossRef] [PubMed]
- Pedersen, A.B.; Jones, K.E.; Nunn, C.L.; Altizer, S. Infectious diseases and extinction risk in wild mammals. Conservation Biology 2007, 21, 1269–1279. [Google Scholar] [CrossRef]
- Keesing, F.; Belden, L.K.; Daszak, P.; Dobson, A.; Harvell, C.D.; Holt, R.D.; Hudson, P.; Jolles, A.; Jones, K.E.; Mitchell, C.E.; Myers, S.S.; Bogich, T.; Ostfeld, R.S. Impacts of biodiversity on the emergence and transmission of infectious diseases. Nature 2010, 468, 647–652. [Google Scholar] [CrossRef]
- Mollentze, N.; Streicker, D.G.; Murcia, P.R.; Hampson, K.; Biek, R. Virulence mismatches in index hosts shape the outcomes of cross-species transmission. Proceedings of the National Academy of Sciences of the United States of America 2020, 117, 28859–28866. [Google Scholar] [CrossRef]
- Gougherty, A.V.; Davies, T.J. Host phylogenetic diversity predicts the global extent and composition of tree pests. Ecology Letters 2022, 25, 101–112. [Google Scholar] [CrossRef]
- Stewart Merrill, T.E.; Calhoun, D.M.; Johnson, P.T. Beyond single host, single parasite interactions: Quantifying competence for complete multi-host, multi-parasite communities. Functional Ecology 2022, 36, 1845–1857. [Google Scholar] [CrossRef]
- Kermack, W.O.; McKendrick, A.G. A contribution to the mathematical theory of epidemics. Proceedings of the royal society of london. Series A, Containing papers of a mathematical and physical character 1927, 115, 700–721. [Google Scholar]
- Park, A.W.; Farrell, M.J.; Schmidt, J.P.; Huang, S.; Dallas, T.A.; Pappalardo, P.; Drake, J.M.; Stephens, P.R.; Poulin, R.; Nunn, C.L.; Davies, T.J. Characterizing the phylogenetic specialism-generalism spectrum of mammal parasites. Proceedings of the Royal Society B: Biological Sciences 2018, 285. [Google Scholar] [CrossRef] [PubMed]
- Fenton, A.; Pedersen, A.B. Community epidemiology framework for classifying disease threats. Emerging Infectious Diseases 2005, 11, 1815–1821. [Google Scholar] [CrossRef]
- Wolfe, N.D.; Dunavan, C.P.; Diamond, J. Origins of major human infectious diseases. Nature 2007, 447, 279–283. [Google Scholar] [CrossRef]
- Manlove, K.; Wilber, M.; White, L.; Bastille-Rousseau, G.; Yang, A.; Gilbertson, M.L.; Craft, M.E.; Cross, P.C.; Wittemyer, G.; Pepin, K.M. Defining an epidemiological landscape that connects movement ecology to pathogen transmission and pace-of-life. Ecology letters 2022. [Google Scholar] [CrossRef]
- Huang, Y.H.; Kausrud, K.; Hassim, A.; Ochai, S.O.; van Schalkwyk, O.L.; Dekker, E.H.; Buyantuev, A.; Cloete, C.C.; Kilian, J.W.; Mfune, J.K.; others. Environmental drivers of biseasonal anthrax outbreak dynamics in two multihost savanna systems. Ecological Monographs 2022, 92, e1526. [Google Scholar] [CrossRef]
- Michel, A.L.; De Klerk, L.M.; Van Pittius, N.C.; Warren, R.M.; Van Helden, P.D. Bovine tuberculosis in African buffaloes: Observations regarding Mycobacterium bovis shedding into water and exposure to environmental mycobacteria. BMC Veterinary Research 2007, 3, 1–7. [Google Scholar] [CrossRef]
- Miller, M.; Olea-Popelka, F. One Health in the shrinking world: Experiences with tuberculosis at the human-livestock-wildlife interface. Comparative Immunology, Microbiology and Infectious Diseases 2013, 36, 263–268. [Google Scholar] [CrossRef]
- Young, J.S.; Gormley, E.; Wellington, E.M. Molecular detection of Mycobacterium bovis and Mycobacterium bovis BCG (Pasteur) in soil. Applied and environmental microbiology 2005, 71, 1946–1952. [Google Scholar] [CrossRef] [PubMed]
- Brunker, K.; Mollentze, N. Rabies virus. Trends in microbiology 2018, 26, 886–887. [Google Scholar] [CrossRef] [PubMed]
- Cassmann, E.D.; Frese, A.J.; Moore, S.J.; Greenlee, J.J. Transmission of raccoon-passaged chronic wasting disease agent to white-tailed deer. Viruses 2022, 14, 1578. [Google Scholar] [CrossRef] [PubMed]
- Ostfeld, R.S.; Keesing, F. Biodiversity series: the function of biodiversity in the ecology of vector-borne zoonotic diseases. Canadian Journal of Zoology 2000, 78, 2061–2078. [Google Scholar] [CrossRef]
- Keesing, F.; Holt, R.D.; Ostfeld, R.S. Effects of species diversity on disease risk. Ecology Letters 2006, 9, 485–498. [Google Scholar] [CrossRef]
- Ostfeld, R.S.; Keesing, F. Effects of host diversity on infectious disease. Annual Review of Ecology, Evolution, and Systematics 2012, 43, 157–182. [Google Scholar] [CrossRef]
- Halliday, F.W.; Rohr, J.R. Measuring the shape of the biodiversity-disease relationship across systems reveals new findings and key gaps. Nature Communications 2019, 10, 1–10. [Google Scholar] [CrossRef]
- Keesing, F.; Ostfeld, R.S. Impacts of biodiversity and biodiversity loss on zoonotic diseases. Proceedings of the National Academy of Sciences 2021, 118, e2023540118. [Google Scholar] [CrossRef] [PubMed]
- McCallum, H. Models for managing wildlife disease. Parasitology 2016, 143, 805–820. [Google Scholar] [CrossRef]
- Miller, M.A.; Kerr, T.J.; de Waal, C.R.; Goosen, W.J.; Streicher, E.M.; Hausler, G.; Rossouw, L.; Manamela, T.; van Schalkwyk, L.; Kleynhans, L.; others. Mycobacterium bovis Infection in Free-Ranging African Elephants. Emerging Infectious Diseases 2021, 27, 990. [Google Scholar] [CrossRef]
- Jolles, A.E.; Cooper, D.V.; Levin, S.A. Hidden effects of chronic tuberculosis in African buffalo. Ecology 2005, 86, 2358–2364. [Google Scholar] [CrossRef]
- Spickler, A.R. Zoonotic Tuberculosis in Mammals, including Bovine and Caprine Tuberculosis 2019. pp. 1–20.
- Handel, A.; Brown, J.; Stallknecht, D.; Rohani, P. A multi-scale analysis of influenza A virus fitness trade-offs due to temperature-dependent virus persistence. PLoS computational biology 2013, 9, e1002989. [Google Scholar] [CrossRef]
- Fine, A.E.; Bolin, C.A.; Gardiner, J.C.; Kaneene, J.B. A study of the persistence of mycobacterium bovis in the environment under natural weather conditions in Michigan, USA. Veterinary Medicine International 2011, 2011. [Google Scholar] [CrossRef]
- McCallum, H.; Fenton, A.; Hudson, P.J.; Lee, B.; Levick, B.; Norman, R.; Perkins, S.E.; Viney, M.; Wilson, A.J.; Lello, J. Breaking beta: Deconstructing the parasite transmission function. Philosophical Transactions of the Royal Society B: Biological Sciences 2017, 372. [Google Scholar] [CrossRef] [PubMed]
- Ezenwa, V.O.; Etienne, R.S.; Luikart, G.; Beja-Pereira, A.; Jolles, A.E. Hidden consequences of living in a wormy world: Nematode-induced immune suppression facilitates tuberculosis invasion in African buffalo. American Naturalist 2010, 176, 613–624. [Google Scholar] [CrossRef]
- Ezenwa, V.O.; Jolles, A.E. Opposite effects of anthelmintic treatment on microbial infection at individual versus population scales. Science 2015, 347, 175–177. [Google Scholar] [CrossRef]
- Palmer, M.V.; Waters, W.R.; Whipple, D.L. Investigation of the transmission of Mycobacterium bovis from deer to cattle through indirect contact. American journal of veterinary research 2004, 65, 1483–1489. [Google Scholar] [CrossRef] [PubMed]
- Palmer, M.V.; Whipple, D.L. Survival of Mycobacterium bovis on feedstuffs commonly used as supplemental feed for white-tailed deer (Odocoileus virginianus). Journal of Wildlife Diseases 2006, 42, 853–858. [Google Scholar] [CrossRef]
- Barasona, J.A.; Vicente, J.; Díez-Delgado, I.; Aznar, J.; Gortázar, C.; Torres, M.J. Environmental presence of Mycobacterium tuberculosis complex in aggregation points at the wildlife/livestock interface. Transboundary and emerging diseases 2017, 64, 1148–1158. [Google Scholar] [CrossRef]
- Davies, T.J.; Pedersen, A.B. Phylogeny and geography predict pathogen community similarity in wild primates and humans. Proceedings of the Royal Society B: Biological Sciences 2008, 275, 1695–1701. [Google Scholar] [CrossRef]
- Parker, I.M.; Saunders, M.; Bontrager, M.; Weitz, A.P.; Hendricks, R.; Magarey, R.; Suiter, K.; Gilbert, G.S. Phylogenetic structure and host abundance drive disease pressure in communities. Nature 2015, 520, 542–544. [Google Scholar] [CrossRef] [PubMed]
- Anderson, R.M.; May, R.M. Coevolution of Hosts and Parasites. Parasitology 1982, 85, 411–426. [Google Scholar] [CrossRef]
- Blancou, J.; Aubert, M. Transmission of rabies virus: importance of the species barrier. Bulletin de L’academie Nationale de Medecine 1997, 181, 301–11. [Google Scholar] [PubMed]
- Begon, M.; Bennett, M.; Bowers, R.G.; French, N.P.; Hazel, S.M.; Turner, J. A clarification of transmission terms in host-microparasite models: Numbers, densities and areas. Epidemiology and Infection 2002, 129, 147–153. [Google Scholar] [CrossRef]
- Keeling, M.J.; Rohani, P. Modeling infectious diseases in humans and animals; Princeton university press, 2011.
- Smith, M.J.; Telfer, S.; Kallio, E.R.; Burthe, S.; Cook, A.R.; Lambin, X.; Begon, M. Host-pathogen time series data in wildlife support a transmission function between density and frequency dependence. Proceedings of the National Academy of Sciences of the United States of America 2009, 106, 7905–7909. [Google Scholar] [CrossRef]
- White, L.A.; Forester, J.D.; Craft, M.E. Using contact networks to explore mechanisms of parasite transmission in wildlife. Biological Reviews 2017, 92, 389–409. [Google Scholar] [CrossRef]
- Antonovics, J. Transmission dynamics: Critical questions and challenges. Philosophical Transactions of the Royal Society B: Biological Sciences 2017, 372. [Google Scholar] [CrossRef]
- Roberts, M.G.; Heesterbeek, J.A. Quantifying the dilution effect for models in ecological epidemiology. Journal of the Royal Society Interface 2018, 15. [Google Scholar] [CrossRef]
- Fromont, E.; Pontier, D.; Langlais, M. Dynamics of a feline retrovirus (FeLV) in host populations with variable spatial structure. Proceedings of the Royal Society B: Biological Sciences 1998, 265, 1097–1104. [Google Scholar] [CrossRef] [PubMed]
- Ferrari, M.J.; Perkins, S.E.; Pomeroy, L.W.; Bjrnstad, O.N. Pathogens, social networks, and the paradox of transmission scaling. Interdisciplinary Perspectives on Infectious Diseases 2011, 2011. [Google Scholar] [CrossRef]
- Craft, M.E. Infectious disease transmission and contact networks in wildlife and livestock. Philosophical Transactions of the Royal Society B: Biological Sciences 2015, 370. [Google Scholar] [CrossRef]
- Keeling, M.J. The effects of local spatial structure on epidemiological invasions. Philosophical Transactions of the Royal Society B: Biological Sciences 1999, 266, 859–867. [Google Scholar] [CrossRef] [PubMed]
- Cross, P.C.; Lloyd-Smith, J.O.; Bowers, J.A.; Hay, C.T.; Hofmeyr, M.; Getz, W.M. Integrating association data and disease dynamics in a social ungulate: Bovine tuberculosis in African buffalo in the Kruger National Park. Annales Zoologici Fennici 2004, 41, 879–892. [Google Scholar]
- Altizer, S.; Harvell, D.; Friedle, E. Rapid evolutionary dynamics and disease threats to biodiversity. Trends in Ecology and Evolution 2003, 18, 589–596. [Google Scholar] [CrossRef]
- Lively, C.M. The effect of host genetic diversity on disease spread. American Naturalist 2010, 175, 17–20. [Google Scholar] [CrossRef] [PubMed]
- Poullain, V.; Nuismer, S.L. Infection genetics and the likelihood of host shifts in coevolving host-parasite interactions. American Naturalist 2012, 180, 618–628. [Google Scholar] [CrossRef] [PubMed]
- Farrell, M.J.; Govender, D.; Hajibabaei, M.; Van Der Bank, M.; Davies, T.J. Bacterial diversity in the waterholes of the Kruger National Park: An eDNA metabarcoding approach. Genome 2019, 62, 229–242. [Google Scholar] [CrossRef] [PubMed]
- Streicker, D.G.; Fallas González, S.L.; Luconi, G.; Barrientos, R.G.; Leon, B. Phylodynamics reveals extinction–recolonization dynamics underpin apparently endemic vampire bat rabies in Costa Rica. Proceedings of the Royal Society B: Biological Sciences 2019, 286. [Google Scholar] [CrossRef]
- Olival, K.J.; Hosseini, P.R.; Zambrana-Torrelio, C.; Ross, N.; Bogich, T.L.; Daszak, P. Host and viral traits predict zoonotic spillover from mammals. Nature 2017, 546, 646–650. [Google Scholar] [CrossRef]
- Kuiken, T.; Holmes, E.C.; McCauley, J.; Rimmelzwaan, G.F.; Williams, C.S.; Grenfell, B.T. Host species barriers to influenza virus infections. Science 2006, 312, 394–397. [Google Scholar] [CrossRef]
- Streicker, D.G.; Turmelle, A.S.; Vonhof, M.J.; Kuzmin, I.V.; McCracken, G.F.; Rupprecht, C.E. Host phylogeny constrains cross-species emergence and establishment of rabies virus in bats. Science 2010, 329, 676–679. [Google Scholar] [CrossRef] [PubMed]
- Gilbert, G.S.; Webb, C.O. Phylogenetic signal in plant pathogen–host range. Proceedings of the National Academy of Sciences 2007, 104, 4979–4983. [Google Scholar] [CrossRef] [PubMed]
- Gilbert, G.S.; Magarey, R.; Suiter, K.; Webb, C.O. Evolutionary tools for phytosanitary risk analysis: Phylogenetic signal as a predictor of host range of plant pests and pathogens. Evolutionary Applications 2012, 5, 869–878. [Google Scholar] [CrossRef] [PubMed]
- Ssebuliba, E.; Davies, T.J. Assessing the phylogenetic host breadth of millet pathogens and its implication for disease spillover. Ecological Solutions and Evidence 2021, 2, 1–11. [Google Scholar] [CrossRef]
- Gougherty, A.V.; Davies, T.J. A global analysis of tree pests and emerging pest threats. Proceedings of the National Academy of Sciences 2022, 119, e2113298119. [Google Scholar] [CrossRef]
- Gilbert, G.S.; Briggs, H.M.; Magarey, R. The impact of plant enemies shows a phylogenetic signal. PLoS ONE 2015, 10, 1–11. [Google Scholar] [CrossRef]
- Gougherty, A.V.; Davies, T.J. Towards a phylogenetic ecology of plant pests and pathogens. Philosophical Transactions of the Royal Society B 2021, 376, 20200359. [Google Scholar] [CrossRef] [PubMed]
- Farrell, M.J.; Davies, T.J. Disease mortality in domesticated animals is predicted by host evolutionary relationships. Proceedings of the National Academy of Sciences of the United States of America 2019, 116, 7911–7915. [Google Scholar] [CrossRef]
- De Leo, G.A.; Dobson, A.P. Allometry and simple epidemic models for microparasites. Nature 1996, 379, 720–722. [Google Scholar] [CrossRef]
- Dobson, A. Population Dynamics of Pathogens with Multiple Host Species 2004. 164.
- Diekmann, O.; Heesterbeek, J.A.P.; Metz, J.A. On the definition and the computation of the basic reproduction ratio R 0 in models for infectious diseases in heterogeneous populations. Journal of mathematical biology 1990, 28, 365–382. [Google Scholar] [CrossRef] [PubMed]
- Renwick, A.; White, P.; Bengis, R.G. Bovine tuberculosis in southern African wildlife: a multi-species host–pathogen system. Epidemiology & Infection 2007, 135, 529–540. [Google Scholar]
- Rhodes, C.J.; Atkinson, R.P.D.; Anderson, R.M.; Macdonald, D.W. Rabies in Zimbabwe : reservoir dogs and the implications for disease control 1998.
- Fenton, A.; Streicker, D.G.; Petchey, O.L.; Pedersen, A.B. Are all hosts created equal? Partitioning host species contributions to parasite persistence in multihost communities. American Naturalist 2015, 186, 610–622. [Google Scholar] [CrossRef]
- Becker, D.J.; Albery, G.F.; Kessler, M.K.; Lunn, T.J.; Falvo, C.A.; Czirják, G.Á.; Martin, L.B.; Plowright, R.K. Macroimmunology: The drivers and consequences of spatial patterns in wildlife immune defence. Journal of Animal Ecology 2020, 89, 972–995. [Google Scholar] [CrossRef]
- Faust, C.L.; Dobson, A.P.; Gottdenker, N.; Bloomfield, L.S.; McCallum, H.I.; Gillespie, T.R.; Diuk-Wasser, M.; Plowright, R.K. Null expectations for disease dynamics in shrinking habitat: Dilution or amplification? Philosophical Transactions of the Royal Society B: Biological Sciences 2017, 372. [Google Scholar] [CrossRef] [PubMed]
- Faust, C.L.; McCallum, H.I.; Bloomfield, L.S.; Gottdenker, N.L.; Gillespie, T.R.; Torney, C.J.; Dobson, A.P.; Plowright, R.K. Pathogen spillover during land conversion. Ecology Letters 2018, 21, 471–483. [Google Scholar] [CrossRef]
- Murray, K.A.; Daszak, P. Human ecology in pathogenic landscapes: two hypotheses on how land use change drives viral emergence. Current opinion in virology 2013, 3, 79–83. [Google Scholar] [CrossRef]
- Wolfe, N.D.; Daszak, P.; Kilpatrick, A.M.; Burke, D.S. Bushmeat hunting, deforestation, and prediction of zoonotic disease. Emerging infectious diseases 2005, 11, 1822. [Google Scholar] [CrossRef]
- Goldberg, T.L.; Gillespie, T.R.; Rwego, I.B.; Estoff, E.L.; Chapman, C.A. Forest fragmentation as cause of bacterial transmission among nonhuman primates, humans, and livestock, Uganda. Emerging infectious diseases 2008, 14, 1375. [Google Scholar] [CrossRef]
- Streicker, D.G.; Fenton, A.; Pedersen, A.B. Differential sources of host species heterogeneity influence the transmission and control of multihost parasites. Ecology Letters 2013, 16, 975–984. [Google Scholar] [CrossRef] [PubMed]
- Rudolf, V.H.; Antonovics, J. Species coexistence and pathogens with frequency-dependent transmission. American Naturalist 2005, 166, 112–118. [Google Scholar] [CrossRef]
- Johnson, P.T.; Preston, D.L.; Hoverman, J.T.; Richgels, K.L. Biodiversity decreases disease through predictable changes in host community competence. Nature 2013, 494, 230–233. [Google Scholar] [CrossRef] [PubMed]
- Carlson, C.J.; Albery, G.F.; Merow, C.; Trisos, C.H.; Zipfel, C.M.; Eskew, E.A.; Olival, K.J.; Ross, N.; Bansal, S. Climate change increases cross-species viral transmission risk. Nature 2022, 607, 555–562. [Google Scholar] [CrossRef] [PubMed]
- Huang, Z.Y.; de Boer, W.F.; Van Langevelde, F.; Xu, C.; Ben Jebara, K.; Berlingieri, F.; Prins, H.H. Dilution effect in bovine tuberculosis: Risk factors for regional disease occurrence in Africa. Proceedings of the Royal Society B: Biological Sciences 2013, 280, 1–7. [Google Scholar] [CrossRef]
- Huang, Z.Y.; Xu, C.; Van Langevelde, F.; Prins, H.H.; Ben Jebara, K.; De Boer, W.F. Dilution effect and identity effect by wildlife in the persistence and recurrence of bovine tuberculosis. Parasitology 2014, 141, 981–987. [Google Scholar] [CrossRef]
- Loreau, M.; Hector, A. Partitioning selection and complementarity in biodiversity experiments. Nature 2001, 412, 72–76. [Google Scholar] [CrossRef]
- Holt, R.D.; Bonsall, M.B. Apparent Competition. Annual Review of Ecology, Evolution, and Systematics 2017, 48, 447–471. [Google Scholar] [CrossRef]
- Ogden, N.H.; Tsao, J.I. Biodiversity and Lyme disease: Dilution or amplification? Epidemics 2009, 1, 196–206. [Google Scholar] [CrossRef]
- Mihaljevic, J.R.; Joseph, M.B.; Orlofske, S.A.; Paull, S.H. The scaling of host density with richness affects the direction, shape, and detectability of diversity-disease relationships. PloS one 2014, 9, e97812. [Google Scholar] [CrossRef]
- Holt, R.D.; Pickering, J. Infectious Disease and Species Coexistence : A Model of Lotka-Volterra Form Author ( s ): Robert D . Holt and John Pickering Source : The American Naturalist , Vol . 126 , No . 2 ( Aug ., 1985 ), pp . 196-211 Published by : The University of Chicago Press. The American naturalist 1985, 126, 196–211. [Google Scholar] [CrossRef]
- Power, A.G.; Mitchell, C.E. Pathogen spillover in disease epidemics. the american naturalist 2004, 164, S79–S89. [Google Scholar] [CrossRef]
- Janzen, D.H. Herbivores and the number of tree species in tropical forests. The American Naturalist 1970, 104, 501–528. [Google Scholar] [CrossRef]
- Connell, J.; Den Boer, P.; Gradwell, G. Dynamics of populations. Centre for Agricultural Publishing and Documentation, Wageningen, The Netherlands. chapter On the role of natural enemies in preventing competitive exclusion in some marine animals and in rain forest trees, 1971; 298–313. [Google Scholar]
- Gilbert, G.S.; Parker, I.M. The evolutionary ecology of plant disease: a phylogenetic perspective. Annual Review of Phytopathology 2016, 54, 549–578. [Google Scholar] [CrossRef] [PubMed]
- Levine, J.M. Species diversity and biological invasions: Relating local process to community pattern. Science 2000, 288, 852–854. [Google Scholar] [CrossRef]
- Lloyd-Smith, J.O.; Schreiber, S.J.; Kopp, P.E.; Getz, W.M. Superspreading and the effect of individual variation on disease emergence. Nature 2005, 438, 355–359. [Google Scholar] [CrossRef]
- Gandon, S.; Hochberg, M.E.; Holt, R.D.; Day, T. What limits the evolutionary emergence of pathogens? Philosophical Transactions of the Royal Society B: Biological Sciences 2013, 368. [Google Scholar] [CrossRef]
- Yates, A.; Antia, R.; Regoes, R.R. How do pathogen evolution and host heterogeneity interact in disease emergence? Proceedings of the Royal Society B: Biological Sciences 2006, 273, 3075–3083. [Google Scholar] [CrossRef] [PubMed]
- Gandon, S. Evolution of multihost parasites. Evolution 2004, 58, 455–469. [Google Scholar] [CrossRef]
- Remold, S. Understanding specialism when the jack of all trades can be the master of all. Proceedings of the Royal Society B: Biological Sciences 2012, 279, 4861–4869. [Google Scholar] [CrossRef] [PubMed]
- Leggett, H.C.; Buckling, A.; Long, G.H.; Boots, M. Generalism and the evolution of parasite virulence. Trends in Ecology and Evolution 2013, 28, 592–596. [Google Scholar] [CrossRef]
- Pedersen, A.B.; Davies, T.J. Cross-species pathogen transmission and disease emergence in primates. EcoHealth 2009, 6, 496–508. [Google Scholar] [CrossRef] [PubMed]
- Auld, S.K.; Searle, C.L.; Duffy, M.A. Parasite transmission in a natural multihost-multiparasite community. Philosophical Transactions of the Royal Society B: Biological Sciences 2017, 372, 1–10. [Google Scholar] [CrossRef] [PubMed]


Disclaimer/Publisher’s Note: The statements, opinions and data contained in all publications are solely those of the individual author(s) and contributor(s) and not of MDPI and/or the editor(s). MDPI and/or the editor(s) disclaim responsibility for any injury to people or property resulting from any ideas, methods, instructions or products referred to in the content. |
© 2024 by the authors. Licensee MDPI, Basel, Switzerland. This article is an open access article distributed under the terms and conditions of the Creative Commons Attribution (CC BY) license (http://creativecommons.org/licenses/by/4.0/).


