Preprint
Article

Moiré Superconductivity and the Roeser-Huber Formula

Altmetrics

Downloads

342

Views

217

Comments

1

Submitted:

12 February 2023

Posted:

13 February 2023

You are already at the latest version

Alerts
Abstract
As shown previously, a relation between the superconducting transition temperature and some characteristic distance in the crystal lattice holds, which enables the calculation of the superconducting transition temperature, Tc, based only on the knowledge of the electronic configuration and of some details of the crystallographic structure. This relation was found to apply for a large number of superconductors, including the high-temperature superconductors, the iron-based materials, alkali fullerides, metallic alloys, and element superconductors. When applying this scheme called Roeser-Huber formula to Moiré-type superconductivity, i.e., magic-angle twisted bi-layer graphene (tBLG) and bi-layer WSe2, we find that the calculated transition temperatures for tBLG are always higher than the available experimental data, e.g., for the magic angle 1.1∘, we find Tc≈ 4.2–6.7 K. Now, the question arises why the calculation produces larger Tc’s. Two possible scenarios may answer this question: (1) The given problem for experimentalists is the fact that for electric measurements always substrates/caps are required to arrange the electric contacts. When now discussing superconductivity in atomically thin objects, also these layers may play a role forming the Moiré patterns. The consequence of such substrate-induced super-Moiré patterns is that the resulting Moiré pattern always will show a larger cell size, and thus, a lower Tc of the final structure will result. (2) A correction factor to the Roeser-Huber formalism may be required to account for the low charge carrier density of the tBLG. Here, we test both scenarios and find that the introduction of a correction factor η enables a proper calculation of Tc, reproducing the experimental data. We find that η depends exponentially on the value of Tc.
Keywords: 
Subject: Physical Sciences  -   Condensed Matter Physics

1. Introduction

Moiré superconductivity, which was first demonstrated experimentally in 2018, involves creating large, periodic superstructures in 2D materials as compared to the atomic scale. The first sample belonging to this new family of superconductors was found when stacking two graphene layers together with a small misalignment angle, Θ 1.1, called also the magic angle [1,2]. This graphene stack is called twisted bilayer graphene or abbreviated tBLG [2,3]. The misalignment between the two graphene layers creates a Moiré pattern which has a spatial period, a M , being a factor 1/ Θ larger than the unit cell on the atomic level. At the so-called magic angles, the Fermi velocity drops to zero, and the first magic angle is predicted to be Θ magic 1.1. Near this twist angle, the energy bands near charge neutrality, which are separated from other bands by single-particle gaps, become remarkably flat [4,5]. The typical energy scale for the entire bandwidth is about 5-10 meV. Experiments enabled the flatness of these bands to be confirmed by an high effective mass seen in quantum oscillations, and correlated insulating states at half-filling of these bands were observed [1], corresponding to n = ± n s / 2 with n = C · V g / e 0 being the charge carrier density defined by the applied gate voltage V g , C corresponds to the gate capacitance per unit area, and e 0 is the electron charge. Electrostatic doping the material away from these correlated insulating states enabled the observation of tunable zero-resistance states, which correspond to the presence of superconductivity. Very remarkably, the observed superconducting transition temperatures, T c , can be several degrees K high.
Since these first experimental reports, superconductivity in tBLG has been observed in ambient conditions [6,7,8,9,10] and under pressure [3] by other authors in the literature as well, including various twist angles around the magic angle, various charge carrier densities, and different thicknesses of the hexagonal boron nitride (abbreviated h-BN) layers on top and bottom of the tBLG [10]. The superconducting properties, including the critical fields and the superconducting parameters κ , λ L and ξ of these samples, are well documented including a classification of the Moiré superconductors as presented by Talantsev [11].
Furthermore, the superconductivity of a trilayer stack of graphene with a misalingment of ±1.1 was reported [12], in an ABC-type trilayer stack [13], and Arora et al. have combined the tBLG with a monolayer of WSe2 additional to the h-BN layers [14]. The basic idea of Moiré superconductivity was further extended in a report of superconductivity in misaligned ( Θ = 1, 4) double layers of WSe2 [15], but the data provided concerning the superconducting properties of this system are much less convincing as compared to the other reports on tBLG as mentioned also in another recent review [16]. Similar detailed experiments concerning superconductivity on other types of twisted, bi-layered hexagonal lattice materials like stanene or borophene are still missing in the literature [17,18].
The appearance of several superconducting domes in the phase diagram (here, the resistivity is plotted color-coded as a function of temperature, R ( T ) , for various charge carrier densities, n) at different charge carrier concentrations was described by Lu et al. [6]. These superconducting domes, being quite similar to the doping diagram of the cuprate HTSc, are separated by metallic states, insulators and even ferromagnets. Thus, this topic is intensively investigated by band structure calculations [19,20,21,22,23,24] and gives rise to a continuously growing number of new experimental and theoretical aspects [25,26,27,28,29,30,31,32,33,34,35,36,37,38,39,40,41,42,43,44,45,46,47,48,49].
It is important to note here that Moiré patterns can be formed also in cases when different types of 2D-layered materials are stacked together, with or without angular misalignment, or between a 2D layer and a substrate [50,51]. As result, the resulting Moiré lattice parameter, a M , may be considerably larger than the original atomic unit cells of any ingredient. Several details of the mathematics of Moiré patterns were already presented in Refs. [52,53,54,55]. Thus, the stacking of various 2D-layered materials offers a versatile new way to control superconductivity in layered 2D-systems (”Moiré-superconductors”), the full potential of which has been barely explored yet [56,57,58,59,60,61]. So, to further investigate this field and unleash more possibilities to find new materials with higher T c ’s, a relatively simple calculation procedure which can be included in machine-learning approaches, see, e.g., Refs. [62,63,64,65,66,67], is extremely useful.
As the lattice constant of the Moiré pattern plays an important role for the observation of superconductivity, it is straightforward to follow this relation between superconductivity and the characteristic sample dimension in more detail. For high-temperature superconductors (HTSc), and later also for iron-based superconductors (IBS), fullerenes, elemental superconductors and metallic alloys, the Roeser-Huber fomula was developed to calculate the superconducting transition temperature, T c . This approach only requires to find a characteristic length of the sample crystallography, x, and some knowledge about the electronic configuration [68,69,70,71,72,73,74,75,76]. All this information may be found in existing databases. Using the Roeser-Huber formalism, the T c of several superconducting materials could be calculated with only a small error margin [74,76], and recently, the approach was even employed to predict T c of metallic hydrogen with different crystal lattices [77]. In case of double-doped HTSc materials (e.g., the Cu-O-plane of Bi2Sr2CaCu2O8+δ (Bi-2212) doped by oxygen and by additional metal ions like Y or La), two characteristic doping patterns result, and the final T c of the material is calculated as a Moiré-pattern of the two doping arrangements [70]. Thus, it is only straightforward to apply this calculation scheme to the real Moiré superconductors, where a clear crystallographic relation is defined by the orientation of the tBLG and by the unit cell of the tBLG itself.
In the present contribution, the existing literature concerning the superconducting properties with special emphasis on the transition temperatures of the various Moiré superconductors are reviewed, and the application of the Roeser-Huber formalism to Moiré superconductivity is presented including the introduction of a new parameter to account for the variations in charge carrier density.
This paper is organized as follows: In Section 2, some details of the fabrication steps of the tBLG samples are outlined and the resistance measurements performed to observe superconductivity in several superconducting domes are presented. Section 3 discusses the properties of the superconducting phase diagrams of the various Moiré superconductors presented in the literature. Furthermore, we apply in Section 4 the Roeser-Huber model to calculate the superconducting transition temperatures of the Moiré superconductors solely on the base of the electronic configuration and the respective Moiré parameters. Finally, Section 6 gives some conclusions and an outlook for future developments.

2. Materials and Methods

2.1. Moiré superlattices

Figure 1a presents a Moiré superlattice of two graphene layers (blue, red) tilted by an angle of 5 for clarity. The resulting lattice parameter, a M , is indicated by a black line. In Ref. [12], also a tri-layer structure was presented with the top and bottom layers tilted by ±5 with respect to the center layer. This situation is depicted in Figure 1b.
The lattice parameter of graphene is a 0 G = 0.246 nm, and the one of WSe2 is a 0 WSe 2 = 0.353 nm [78]. Then, the possible Moiré patterns of two identical layers at an angle Θ have a periodicity according to
a M = a 0 2 · sin ( Θ / 2 ) ,
with a M denoting the lattice constant of the Moiré superlattice (MSL). Figure 1c depicts the dependence of the Moiré lattice constant, a M , as a function of Θ for graphene as well as for WSe2.
The magic angle Θ is given by [79]
Θ = cos 1 k 2 + 4 k l + l 2 2 · ( k 2 + k l + l 2 ) ,
with k , l being integers. The first magic angle, 1.1, is indicated in Figure 1c by a dashed green line.
The accuracy achieved to determine the tilt angle of the graphene layers is typically ∼0.03 [10]; Stepanov et al. describe the twist homogeneity within a device as good as 0.01 per 10 μ m [9]. Thus, the twist angles are well defined with only small experimental error.

2.2. Samples and resistance measurements

The superlattice density n s = 4 / A was defined to be the density that corresponds to full-filling each set of degenerate superlattice bands, where A 3 a 2 / ( 2 Θ 2 ) is the area of the Moiré unit cell ( a = 0.246 nm is the lattice constant of the underlying graphene lattice) and Θ is the twist angle. The electron density ( n 0 = A 0 1 10 12 cm−2, where A 0 is the area of the moiré unit cell) the observation of correlated states at all integer fillings of ν = n / n 0 (where n denotes the gate-modulated carrier density), at Moiré band filling factors ν = 0, ±1, ±2, ±...
To measure the superconducting properties of tBLG by means of resistance measurements, a structure called device is fabricated using the tear-and-stack or cut-and-stack method encapsulating the tBLG between h-BN layers. This arrangement is then patterned into a Hall bar geometry with multiple leads using electron beam lithography and reactive ion-etching. The final device is placed on Si/SiO2 substrate with an intermediate thick graphite layer serving as back gate. Another graphite layer on top serves for protection. This construction is required to prepare proper electric contacts to the sample. A schematic drawing of the arrangement of the various layers is given in Figure 1d and the device ready for measurement is given as an inset to Figure 2a.
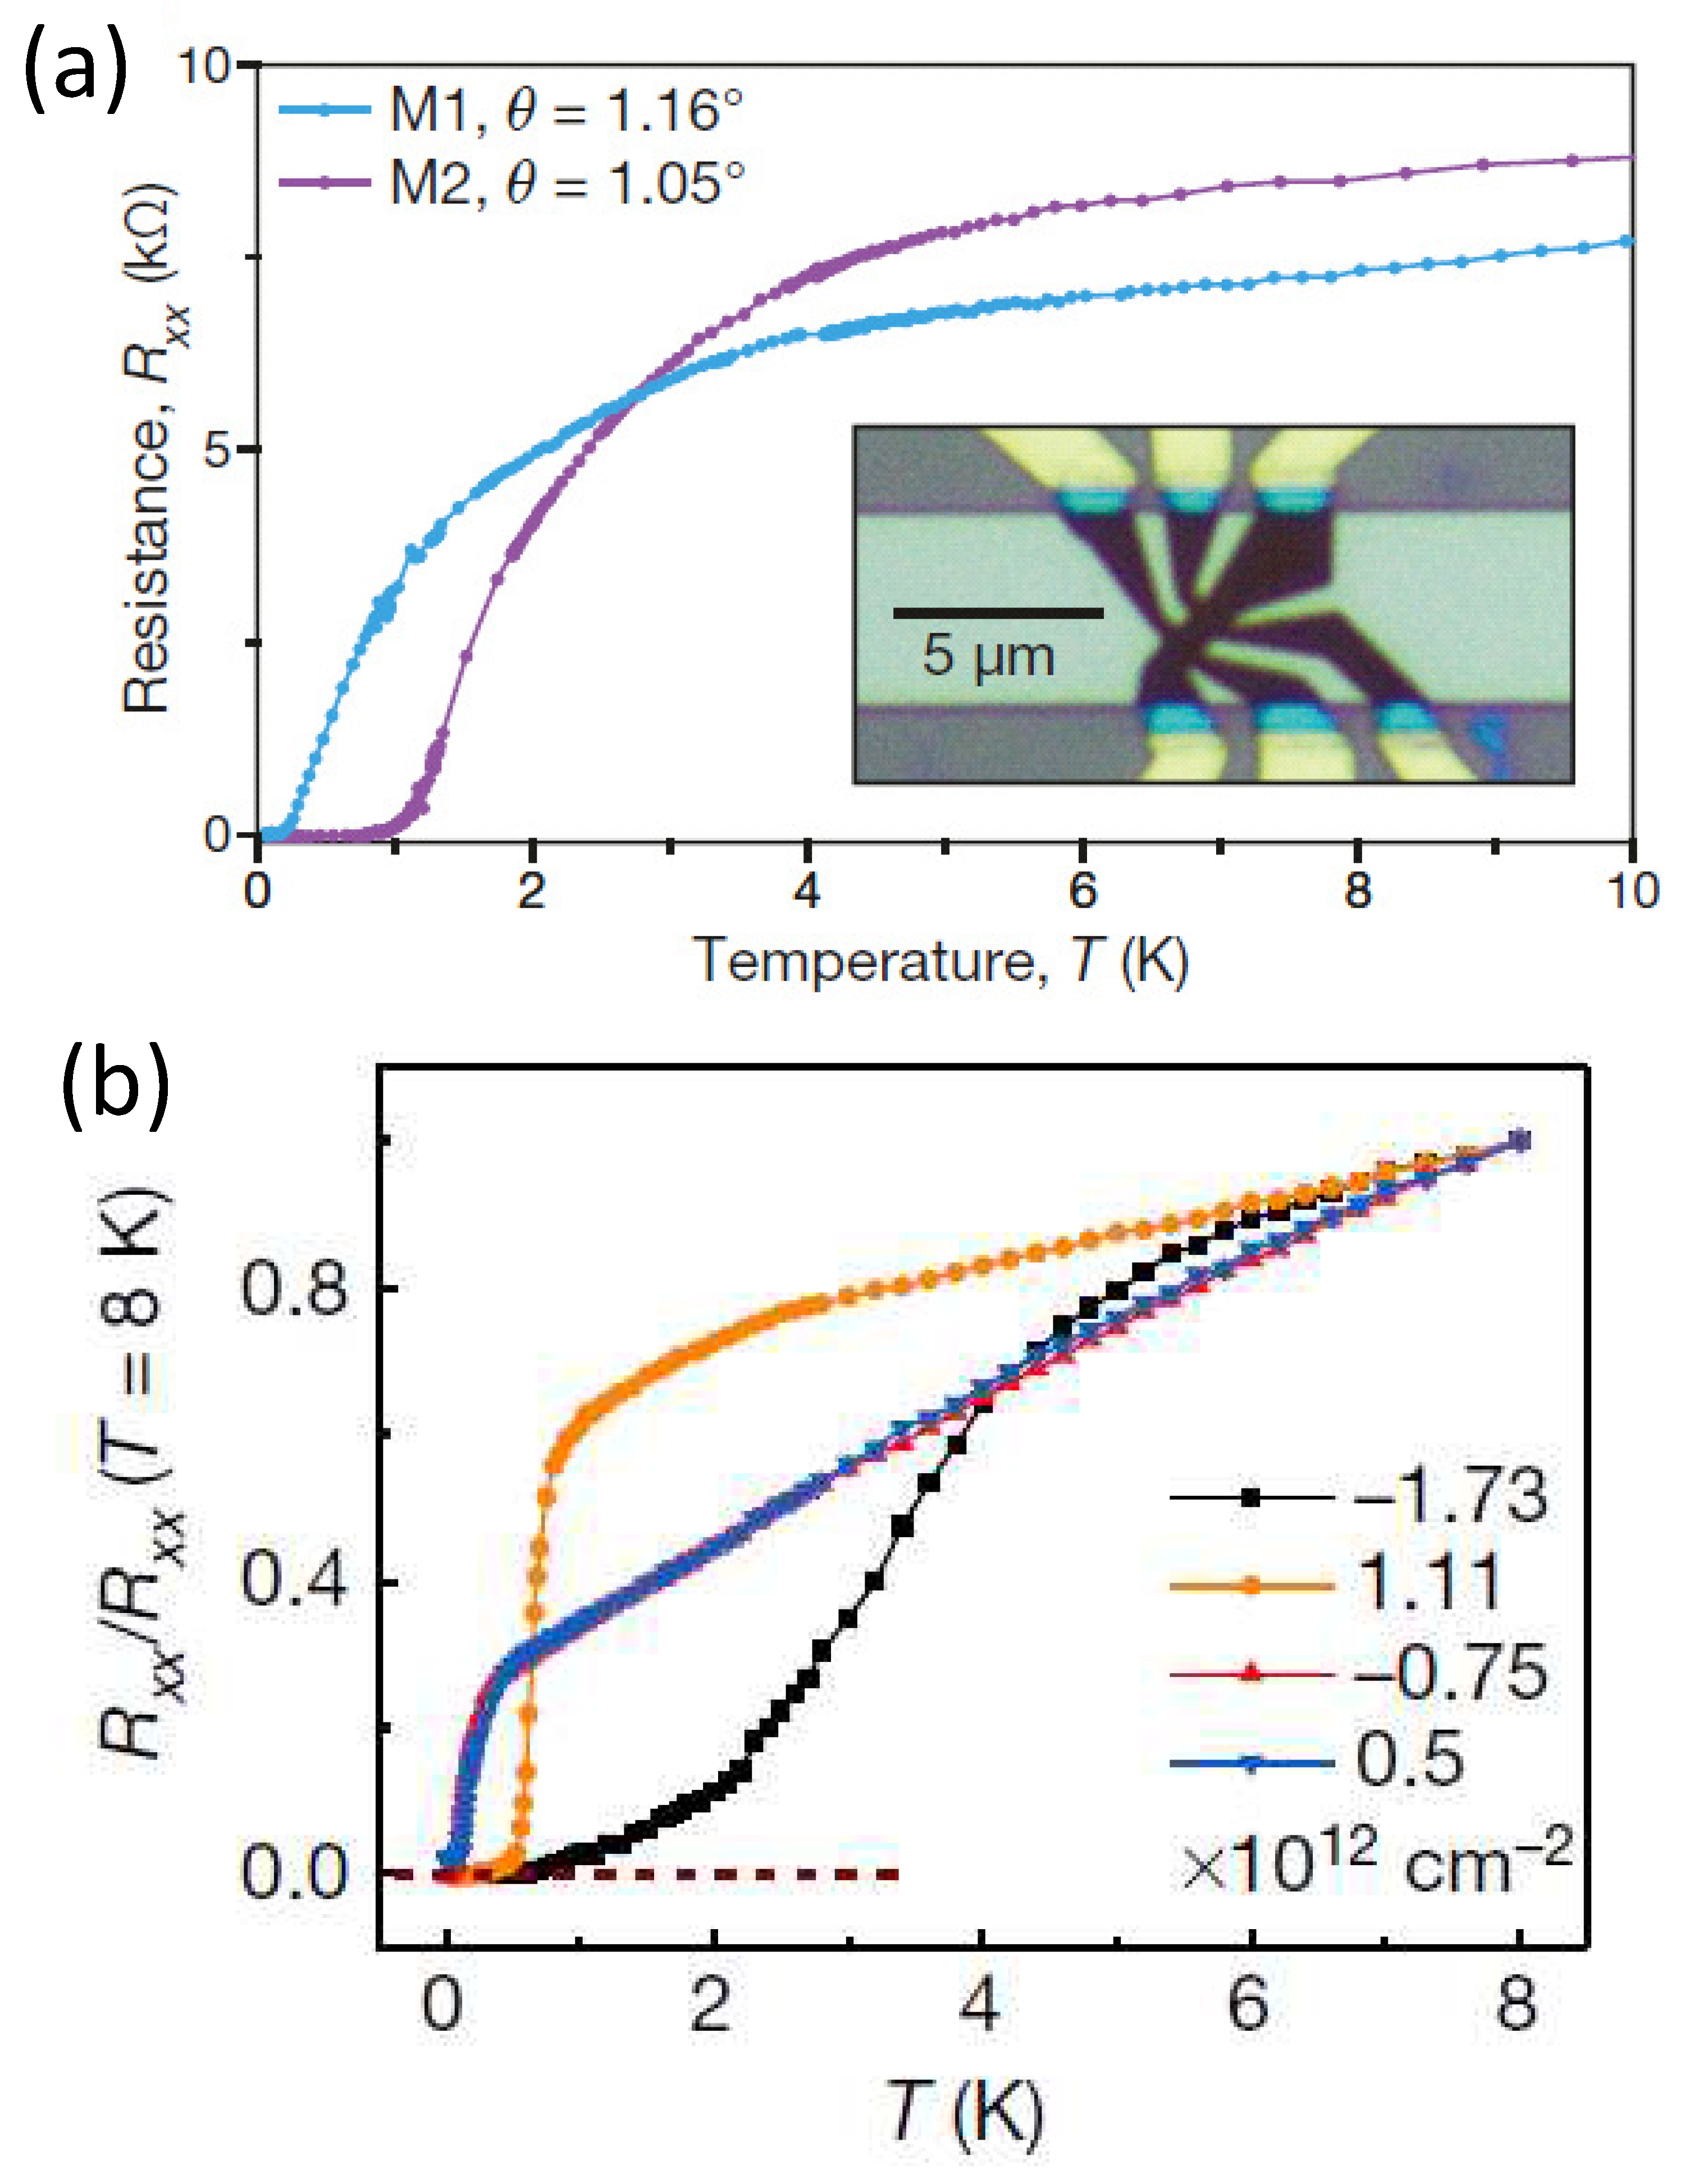
Figure 2a and b present resistance measurements as a function of temperature for tBLG. In Figure 2a, the measured resistance, R x x , being in the k Ω -range, is presented for two twist angles, 1.16 (M1) and 1.05 (M2) [2]. The inset shows the arrangement of sample and electric contacts ready for measurement. Figure 2b gives similar data from Ref. [6], but only for one angle (1.10) and normalized to the resistance measured at 8 K. The different curves are obtained for various charge carrier densities, ranging between +1.11 × 1012 cm−2 to −1.73 × 1012 cm−2. From this plot, it is obvious that the shape of the curves as well as the determined transition temperatures strongly vary with the charge carrier density. The variation of the charge carrier densities is achieved by tuning the gate voltage, which enables an extensive study of the phase diagram of the tBLG devices.

3. Phase diagrams of Moiré superconductors

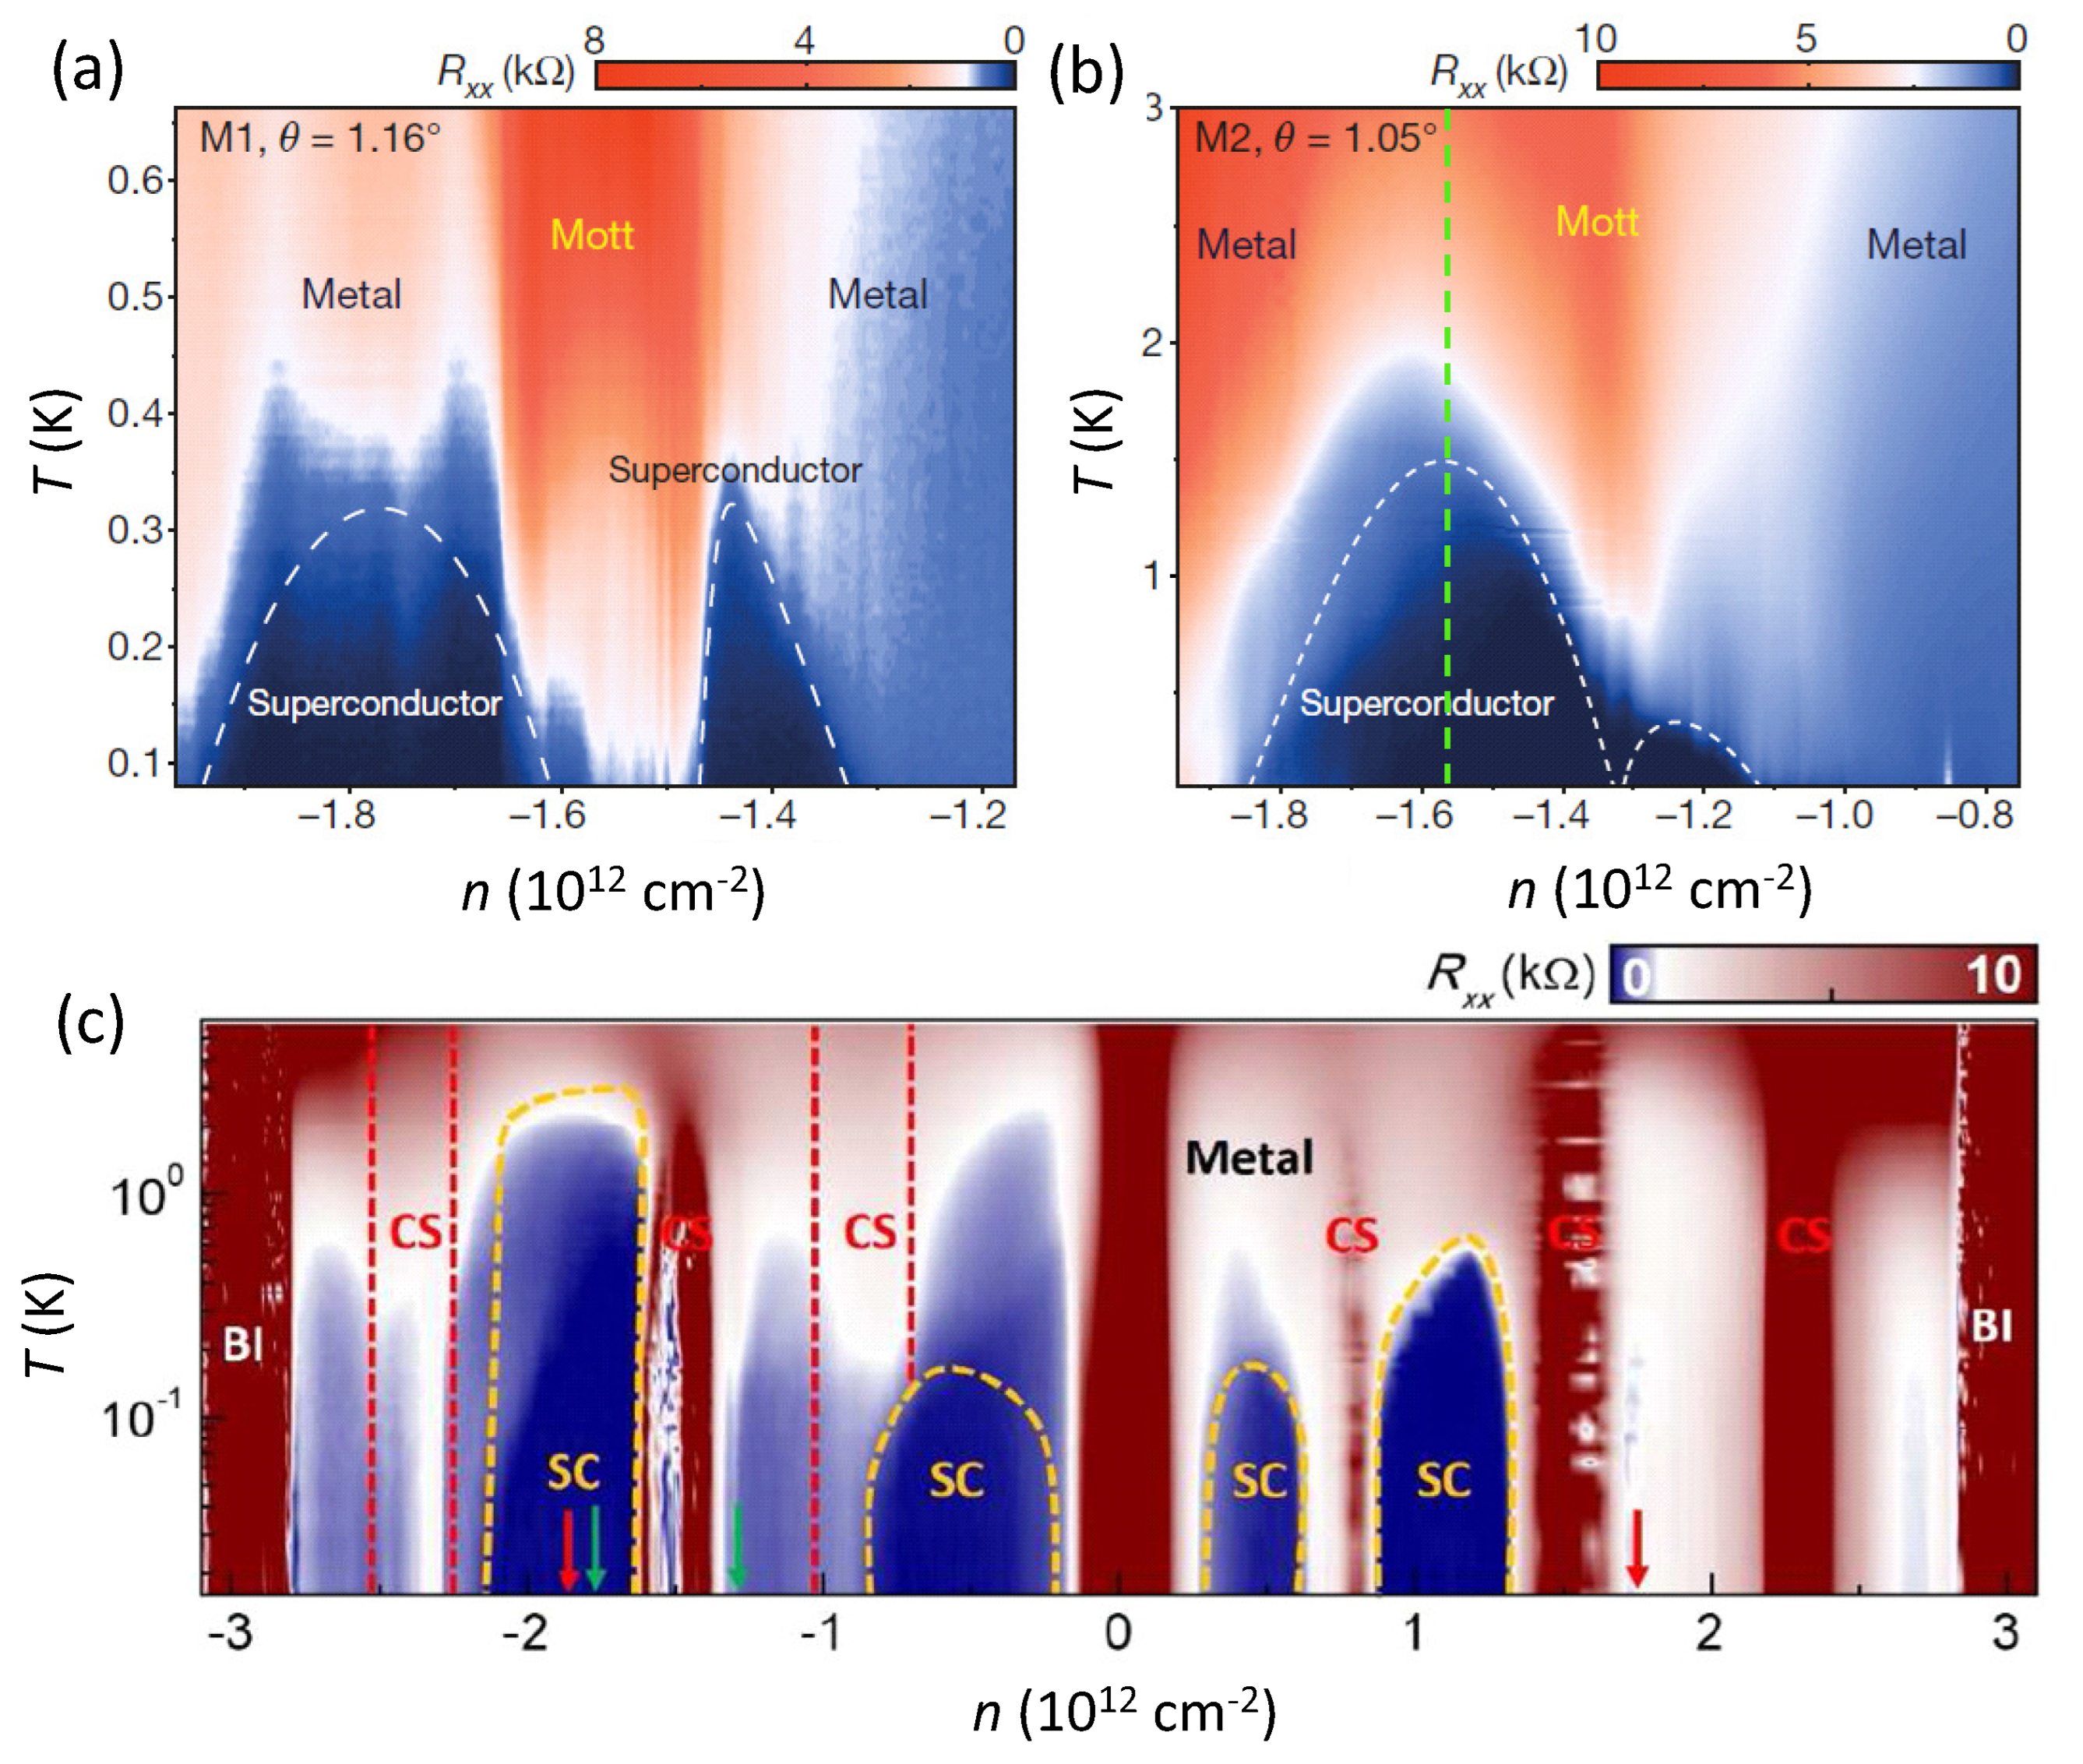
At ν 2 , superconductivity was observed in samples M1 and M2 below critical temperatures of up to 3 K. Figure 3a and b present sections of the phase diagram for negative charge carrier densities for the samples M1 ( Θ = 1.16) and M2 ( Θ = 1.05). Here, the R x x ( T ) -curves are plotted as vertical lines indicated by the green dashed line in (b), using color coding for R x x ) as function of the charge carrier density. The dashed white lines are defined as 50% resistance to the normal state. Here, we see that the borders of the superconducting domes are not sharp and varying with n, thus leading to a large variation of the superconducting transitions concerning T c as well as the transition width, δ T c . These diagrams reveal that the twist angle a M sets the possibility to observe superconductivity, but the resulting superconducting properties of the tBLG samples clearly depend on the charge carrier density.
In subseqent papers, a further variation of the charge carrier density revealed a complete sequence of insulating states, magnetic states as well as superconducting states. Such a full phase diagram is shown in Figure 3a, reproduced from Ref. [6] on a tBLG sample with α = 1.1 (see also Table 1 below), presents the complete sequence of superconducting domes (SC), metallic behavior and correlated states (CS) when tuning the gate voltage between ±3 × 1012 cm−2. In this diagram, also three new superconducting domes at much lower temperatures were observed, close to the ν = 0 and ν = ± 1 insulating states. The red and green arrows indicate the superconducting transitions observed by Cao et al. [2] and Yankowitz et al. [3].
The phase diagram of tBLG, plotting temperature vs. charge carrier density is similar to that of the HTSc cuprates (where temperature is plotted vs. the doping), and includes several dome-shaped regions corresponding to superconductivity. Furthermore, quantum oscillations in the longitudinal resistance of the material indicate the presence of small Fermi surfaces near the correlated insulating states, which is also the case in underdoped cuprate HTSc. The small Fermi surface of tBLG, corresponding to a charge carrier density of about 1011 cm2, and the relatively high resulting T c ’s places the tBLG systems among the superconductors with the strongest pairing strength between electrons [2], which was later relativated by Talantsev [11] based on the thorough analysis of the available magnetic data.
As stated in [2], "one of the key advantages of this system is the in situ electrical tunability of the charge carrier density in a flat band with a bandwidth of the order of 10 meV". This enables the study of the phase diagram to be performed in unprecedented resolution on one given sample, avoiding the problems arising when studying various samples with different microstructures. However, there is also a drawback as the application of the gate voltage does not allow for magnetic measurements in magnetometers to be performed on these devices, so the most important hallmark of superconductivity, the Meissner effect [80,81], cannot be measured directly. For magneto-optic imaging [82,83] or for magnetic force microscopy (MFM) [84], the tBLG devices are too small to enable proper measurements. One could imagine, however, to apply the scanning Hall probes [85,86], scanning SQUID [87] or the diamond color center [88,89] techniques to image the details of the magnetic states in tBLG, which were already predicted in a recent paper [90]. Nevertheless, other features of the superconducting state like the effect of applied magnetic fields on the superconducting transition, and the Fraunhofer patterns could be observed, which enabled a classification of the Moiré superconductors based on the magnetic data as presented by Talantsev [11].
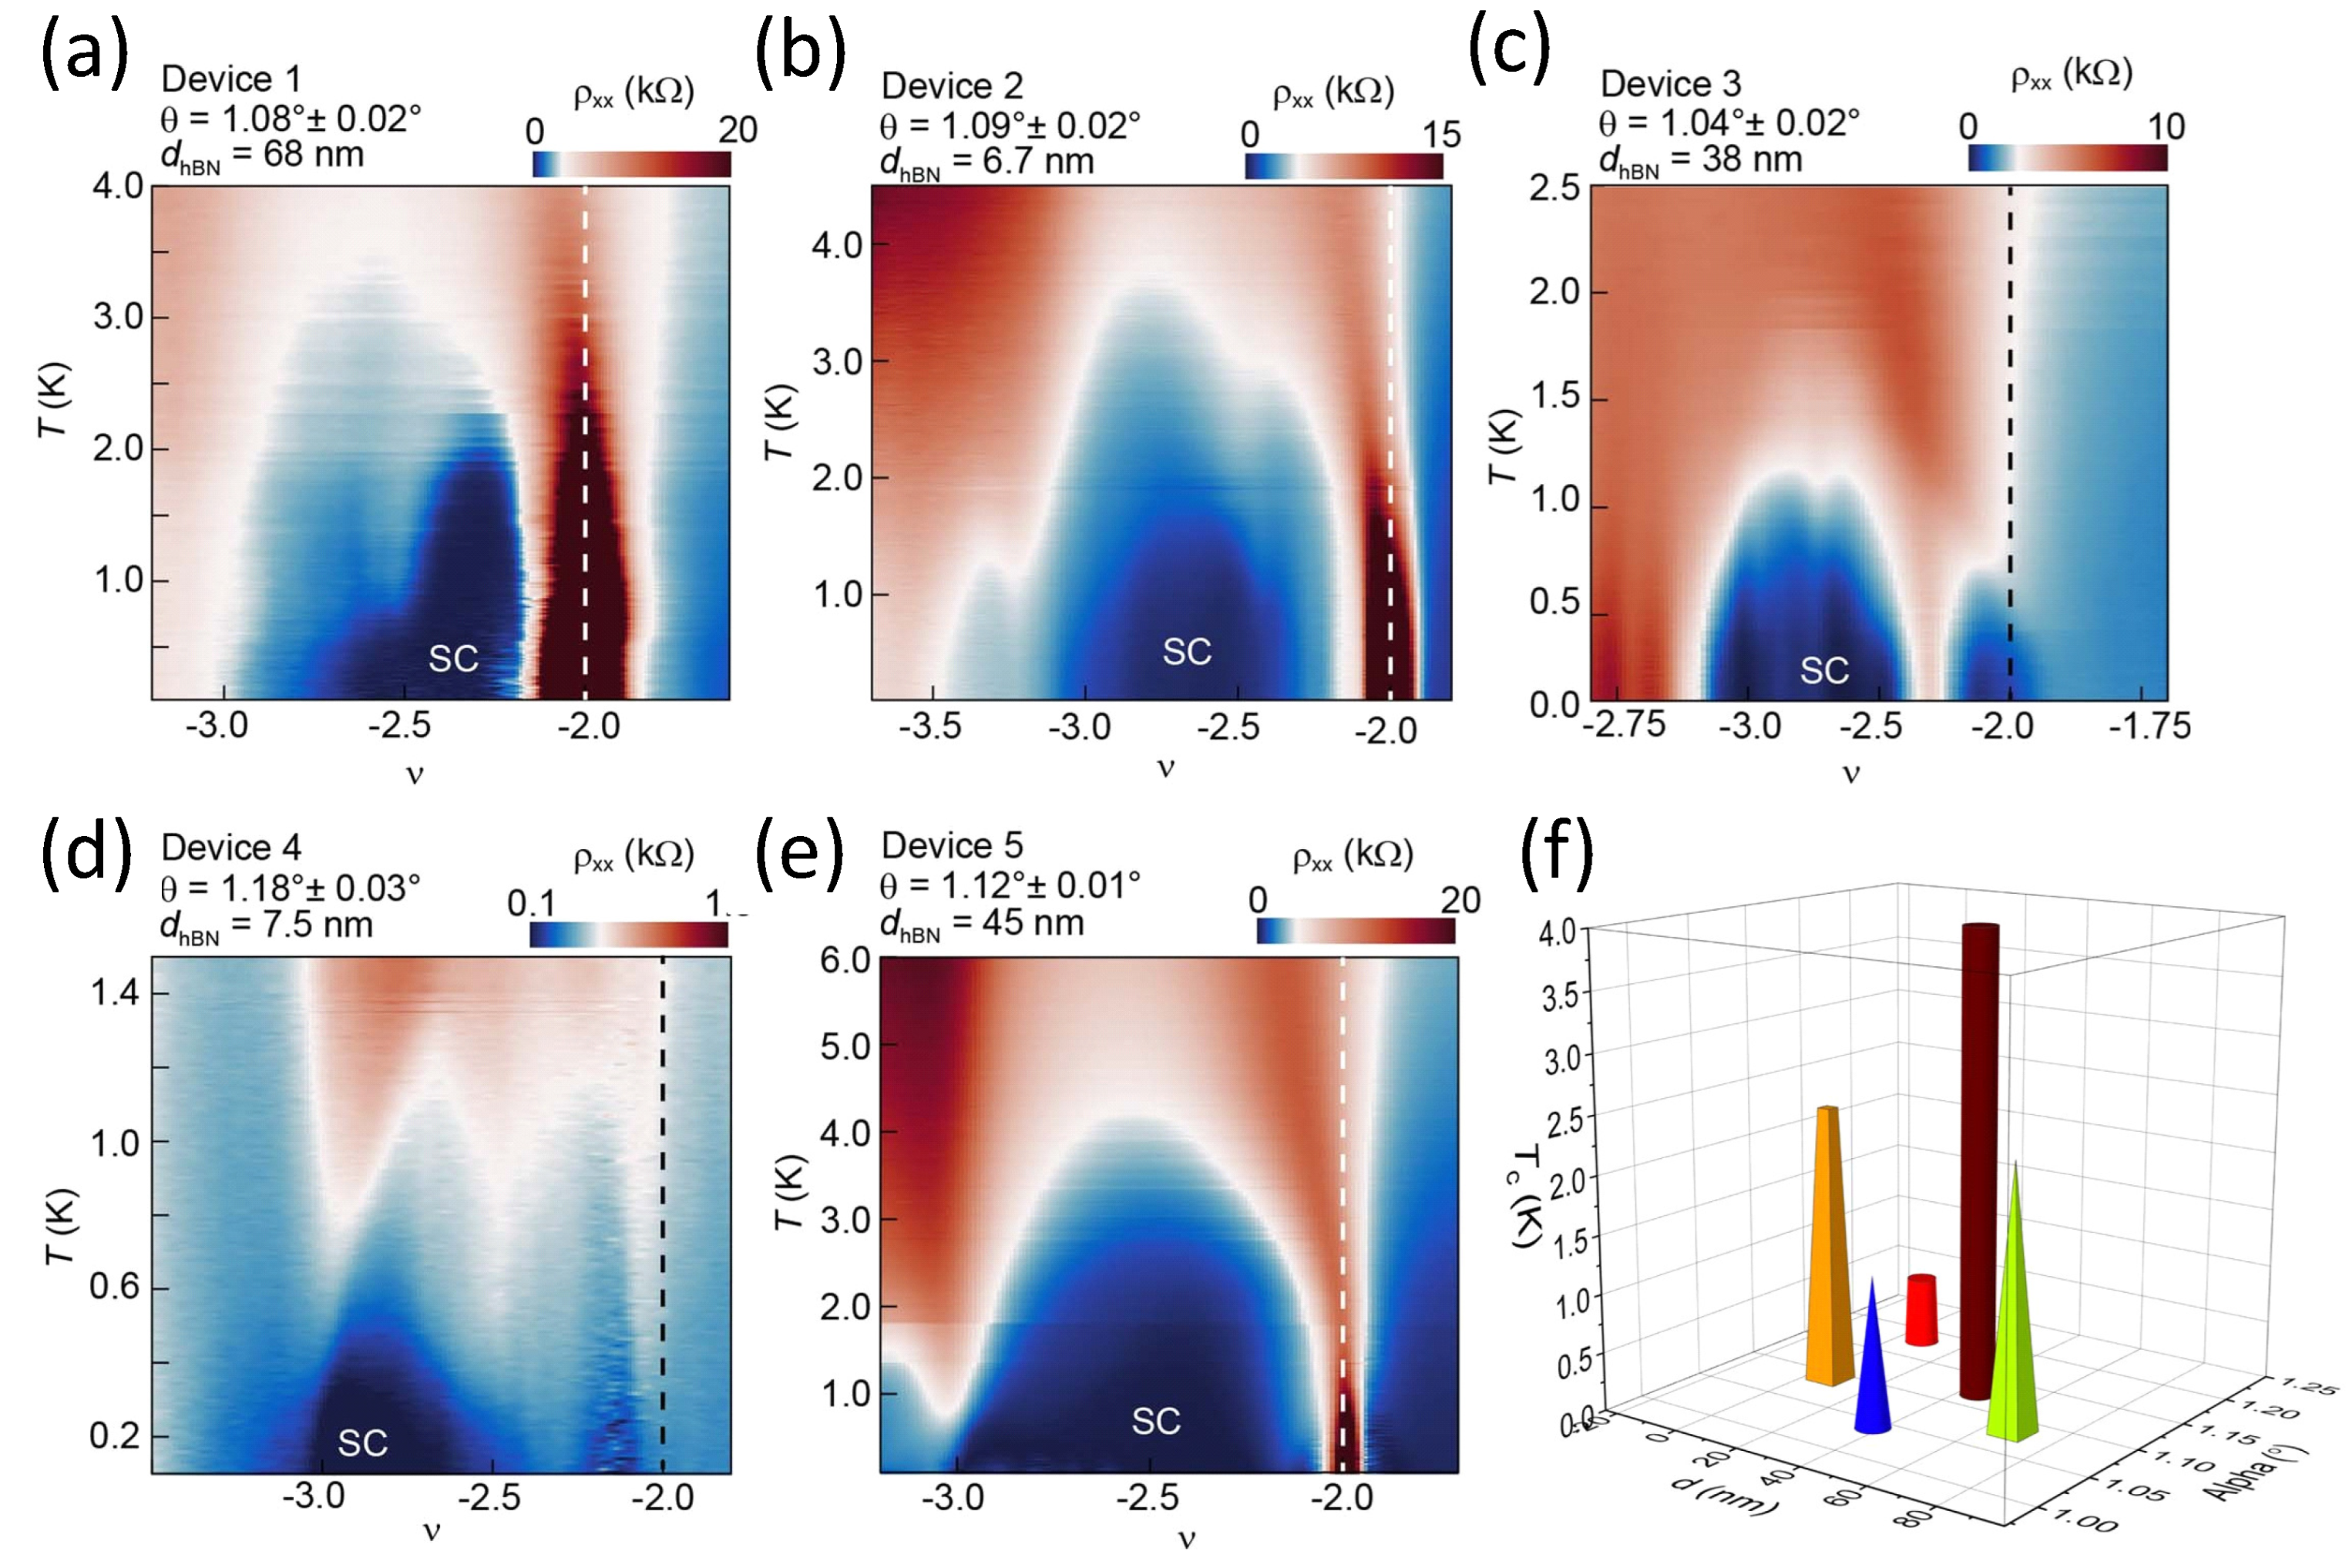
An important experimental work was carried out by Saito et al. [10], demonstrating the effect of varying the thickness of the h-BN layer on the superconducting properties of tBLG, where d h BN varies between 6.7 nm and 68 nm for tBLG samples with different twist angles. In this work, the highest observed T c -values for tBLG samples were reported. Figure 4a–f present the influence of the h-BN cover layer thickness on the superconductivity of the tBLG devices 1 (a) – 5 (e) (Figure 4a–e reproduced from Saito et al. [10]). The diagrams show the measured, color-coded R x x as function of T and ν . For each device, the values of the twist angle α , its error margin and the thickness d of the h-BN layer are given. The dashed line in each image indicates the density ν = -2. Figure 4f gives a 3D-bar diagram of the highest T c ’s recorded as function of d and α . Here, we can see directly that a thicker h-BN layer yields a higher value of T c (see also the data collected in Table 1 below). The superconducting dome recorded for device 5 at n = 1.79 × 1012 cm−2 with d = 45 nm and α slightly above the magic angle yielding the highest T c is the most robust one of sll devices investigated. The increase of T c due to to the thicker h-BN layer fits well into the limits set by the application of the Roeser-Huber formulism as presented in Section 4.
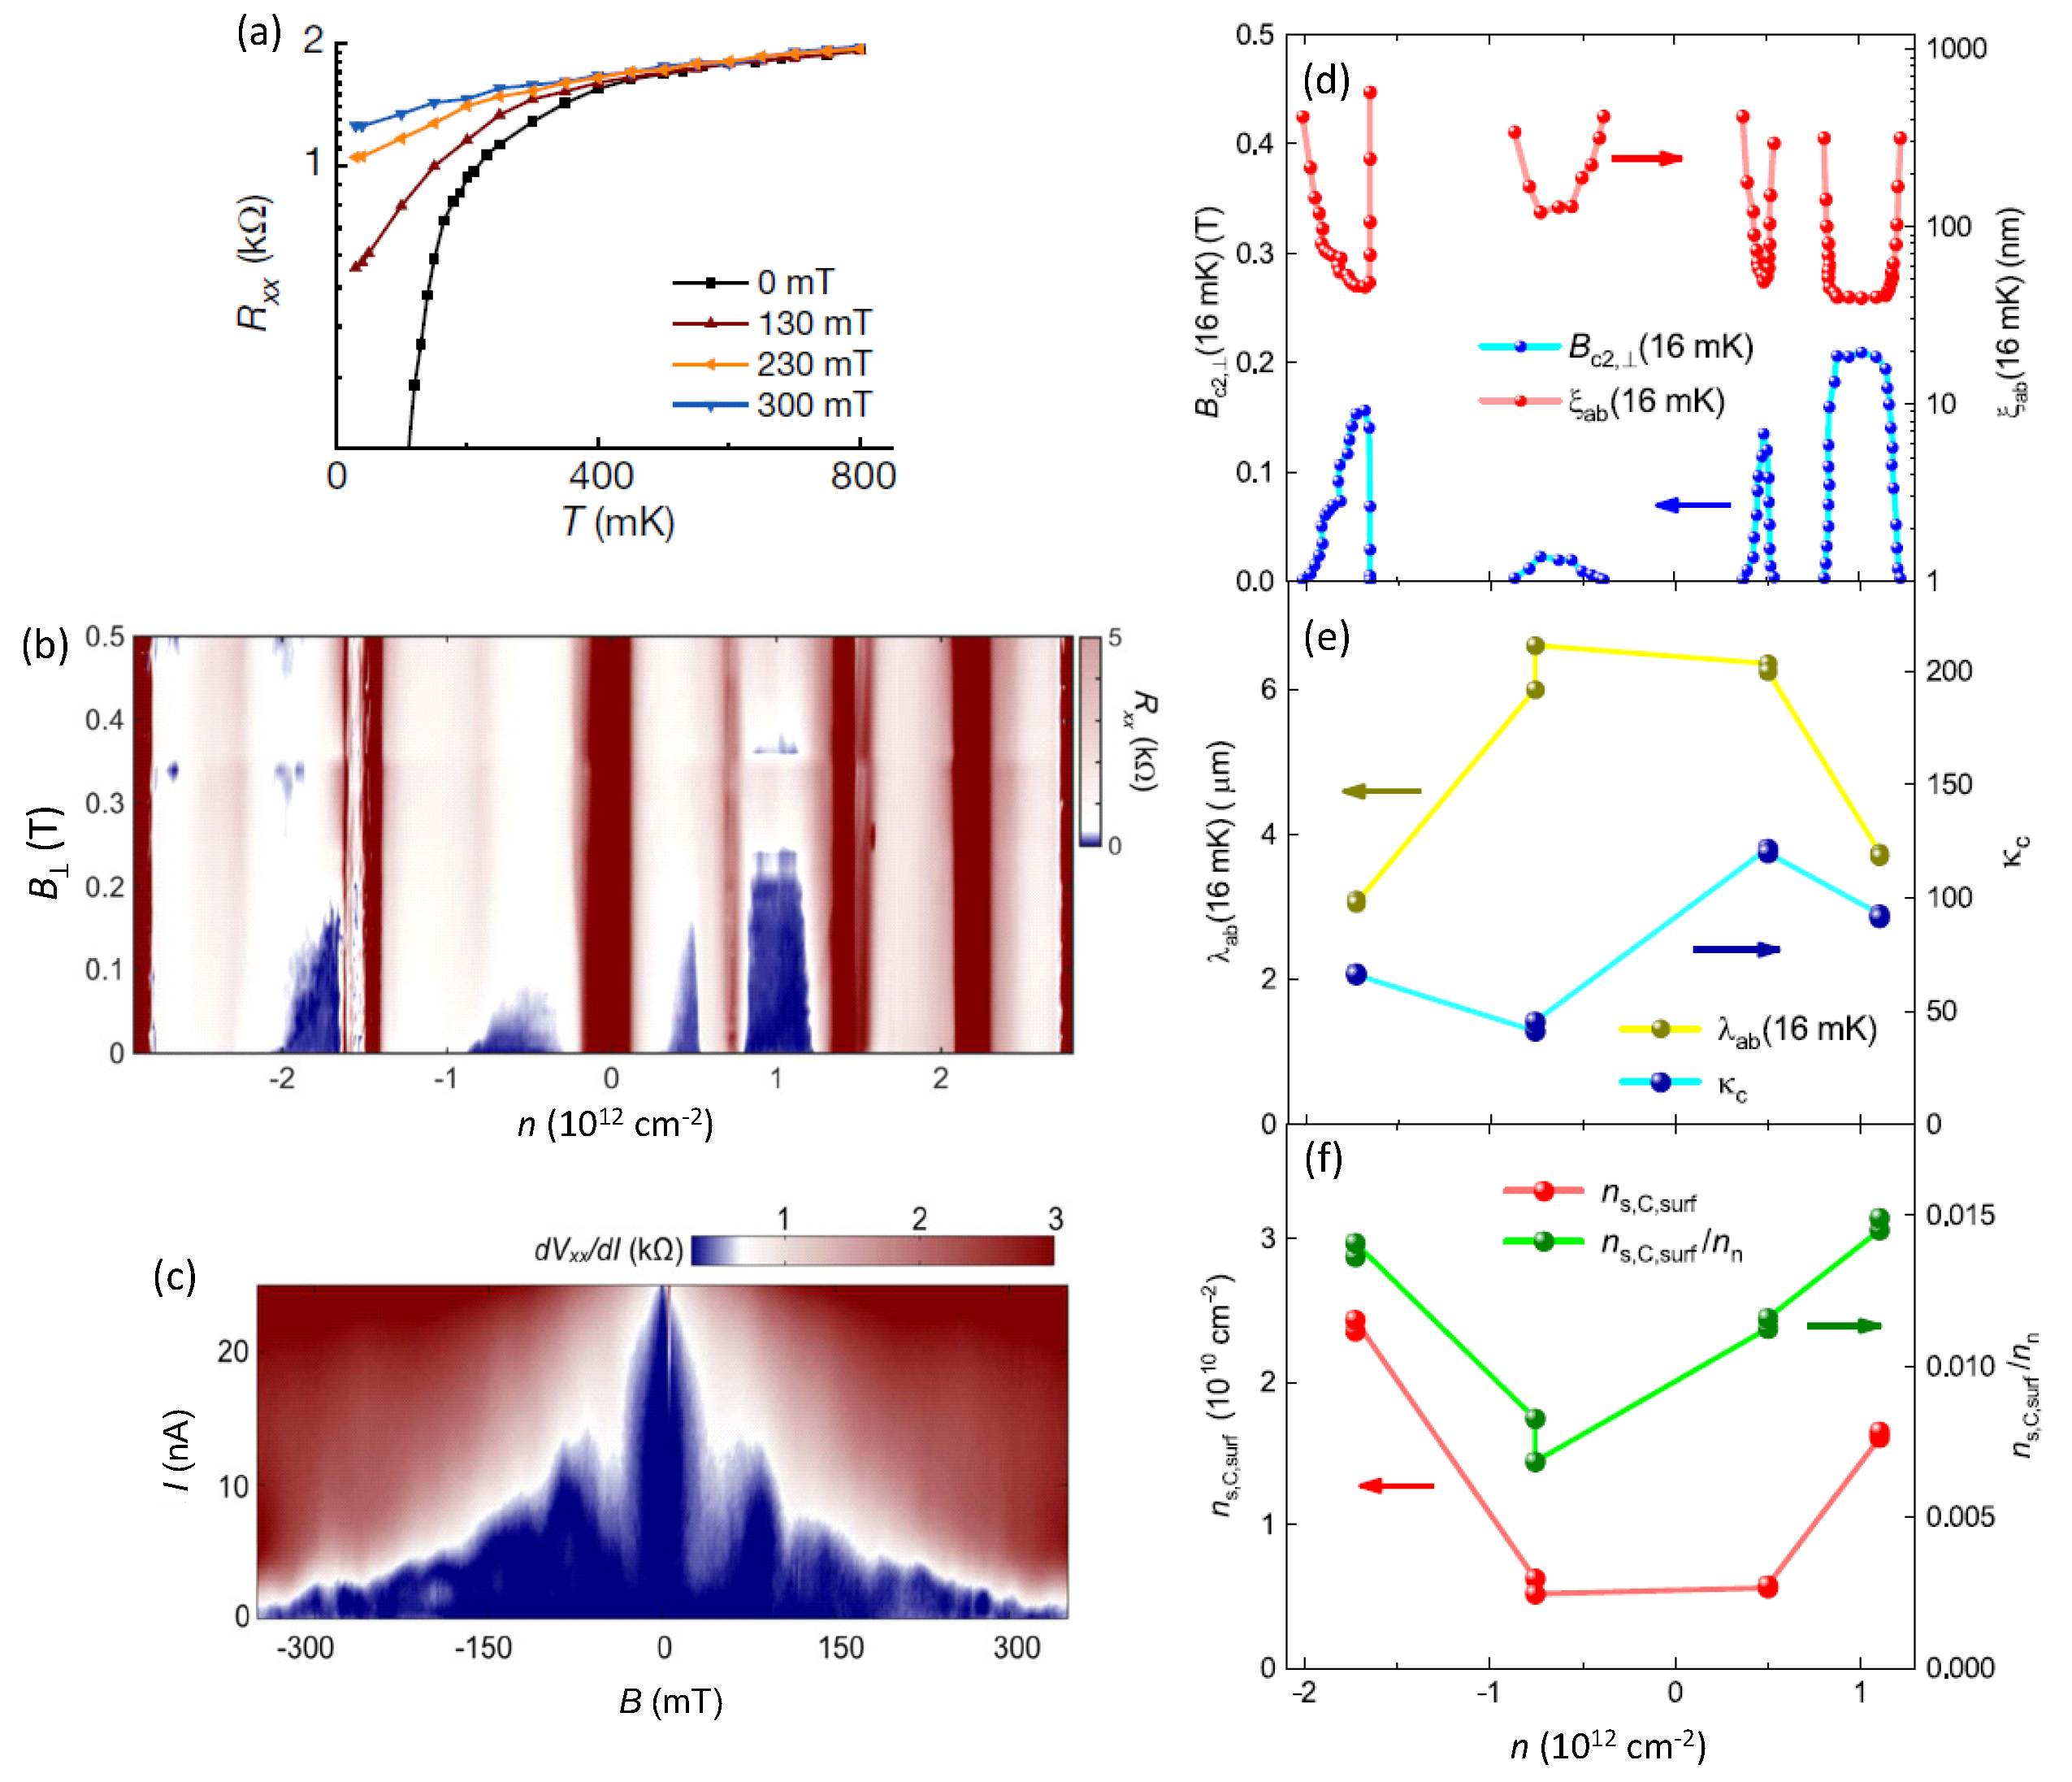
Figure 5a–c show information on the superconducting state of tBLG (data collected by Lu et al. [6]) when applying an external magnetic field to the tBLG devices. The variation of the longitudinal resistance, R x x ( T ) , is given in Figure 5a for applied magnetic fields of 0, 130, 230 and 300 mT. As expected from a superconducting material, the onset of T c reduces with the application of a magnetic field until the superconducting transition is completely suppressed in higher fields. Figure 5b gives the resistance, R x x (color-coded), as function of the perpendicularly applied magnetic field, B , and the charge carrier density, n, at a temperature of 16 mK. This diagram directly shows the respective magnetic fields to suppress superconductivity. Finally, Figure 5c shows a Fraunhofer interference pattern measured in the superconducting state, which directly manifests the superconducting character as a measurement of the Meissner effect is not possible for a tBLG device. Figure 5d–f present the analysis of Talantsev et al. concerning the superconduting parameters of tBLG samples. The superconducting parameters were derived from fits to the data of the upper critical field, H c 2 ( T ) and the critical current density, J c ( T ) (self field), following the models by [91,92,93,94,95,96,97,98,99]. All this gives valuable information on the properties of the superconducting state(s) in tBLG samples.

4. Roeser-Huber model

The basic idea behind this approach is the view of the resisitive transition to the superconducting state as a resonance effect between the superconducting charge carrier wave, λ cc , and a characteristic length, x = λ cc / 2 , in the sample. The details of this were already discussed in Refs. [68,69,74]. The Roeser-Huber-equation, originally obtained for high- T c superconductors, is written as
( 2 x ) 2 2 M L n 0 2 / 3 π k B T c = h 2 ,
where h is the Planck constant, k B the Boltzmann constant, x the characteristic atomic distance, T c the superconducting transition temperature, M L the mass of the charge carriers, and n 0 is a correction factor describing the number of Cu-O-planes in the HTSc unit cell. For YBa2Cu3O7−δ with one Cu-O-plane per unit cell, we have n 0 = 1, and the compound Bi2Sr2CaCu2O8+δ (Bi-2212) with 2 Cu-O-planes per unit cell has n 0 = 2. Thus, n for tBLG is taken to be n = 1 as the two graphene layers at the magic angle give together one superconducting unit. A system corresponding to n 0 = 2 would be then a stack of two 2D layers like h-BN–tBLG–h-BN–tBLG–h-BN, where the two tBLG layers are separated by a h-BN layer. As charge carrier mass, we assume in a first approximation M L = 2 m e , corresponding to a Cooper pair.
An energy, Δ ( 0 ) , can be introduced via
Δ ( 0 ) = π k B T c ,
which may correspond to the pairing energy of the superconductor. So we can write
( 2 x ) 2 · 2 M L n 0 2 / 3 · Δ ( 0 ) = h 2 .
Using Equation (4) and regrouping of the terms leads finally to
Δ ( 0 ) = h 2 2 · 1 M L n 0 2 / 3 · 1 ( 2 x ) 2 = π k B T c .
It is important to note here that Equation (6) was reached without the use of any theoretical description of superconductivity, just by the model of a particle in the box [100]. Now, the formalism described above requires only minor adapations to the case of tBLG and its derivatives: n 0 = 1 was already mentioned. The Moiré lattice constant, a M , plays the key role to describe a Moiré superconductor, so the characteristic length corresponds to x = a M .
For a proper comparison of the calculated data to the experiments, T c in the Roeser-Huber formalism is to be taken from resistance measurements as the maximum of the derivative, dR/dT, corresponding to the mean field transition temperature T c MF , which also plays an important role for the fluctuation conductivity analysis as described in Refs. [101,102,103]. In the literature, T c is often derived often from 50% of the normal-state resistance, which is not necessarily the same as T c MF , especially not in the case of a two-step transition. Both these definitions of T c are distinct from the T c used in the Uemura plot [2,11,104,105], where the completed transition when reaching R = 0 Ω is considered. Other authors also have used T ( BKT ) , the Berezinskii–Kosterlitz–Thouless (BKT) temperature, which is well suited for describing the superconducting transition in 2D systems like the ones investigated here. Most of the approaches mentioned here have, however, problems to give a proper value of T c when the superconducting transition is very broad, shows a secondary step, does not reach R = 0 Ω or when the deviation from the normal-state resistivity is difficult to be defined.
Thus, in the present work all the published resistance data were digitalized and the derivative, dR/dT, was plotted graphically to obtain values for T c according to the demands of the Roeser-Huber formalism.

5. Application of the Roeser-Huber formalism to Moiré superconductivity

New results with much higher values of T c were presented recently by Saito et al. [10], who also used the h-BN as top and bottom cover, but varied the tilt angle between 1.02 and 1.20 and the thickness of the h-BN layer between 6.7 nm and 68 nm. These experiments demonstrated that the device (device 5) with a tilt angle of Θ = 1.10–1.15 and a h-BN thickness of 45 nm showed the highest T c ever reported for the tBLG systems. Stepanov et al. [9] also fabricated devices with varying the h-BN thickness between 7 and 12.5 nm. Codecido et al. [7] showed superconductivity in tBLG at a much smaller angle Θ = 0.93, so superconductivity does exist in a wide range around the magic angle. Lu et al. [6] have shown a complete phase diagram of their tBLG sample with four domes of superconductivity at positive and negative charge carrier densities by plotting the measured longitudinal resistance versus temperature and charge carrier density, demonstrating the experimental advances since the first reports of superconductivity in tBLG.
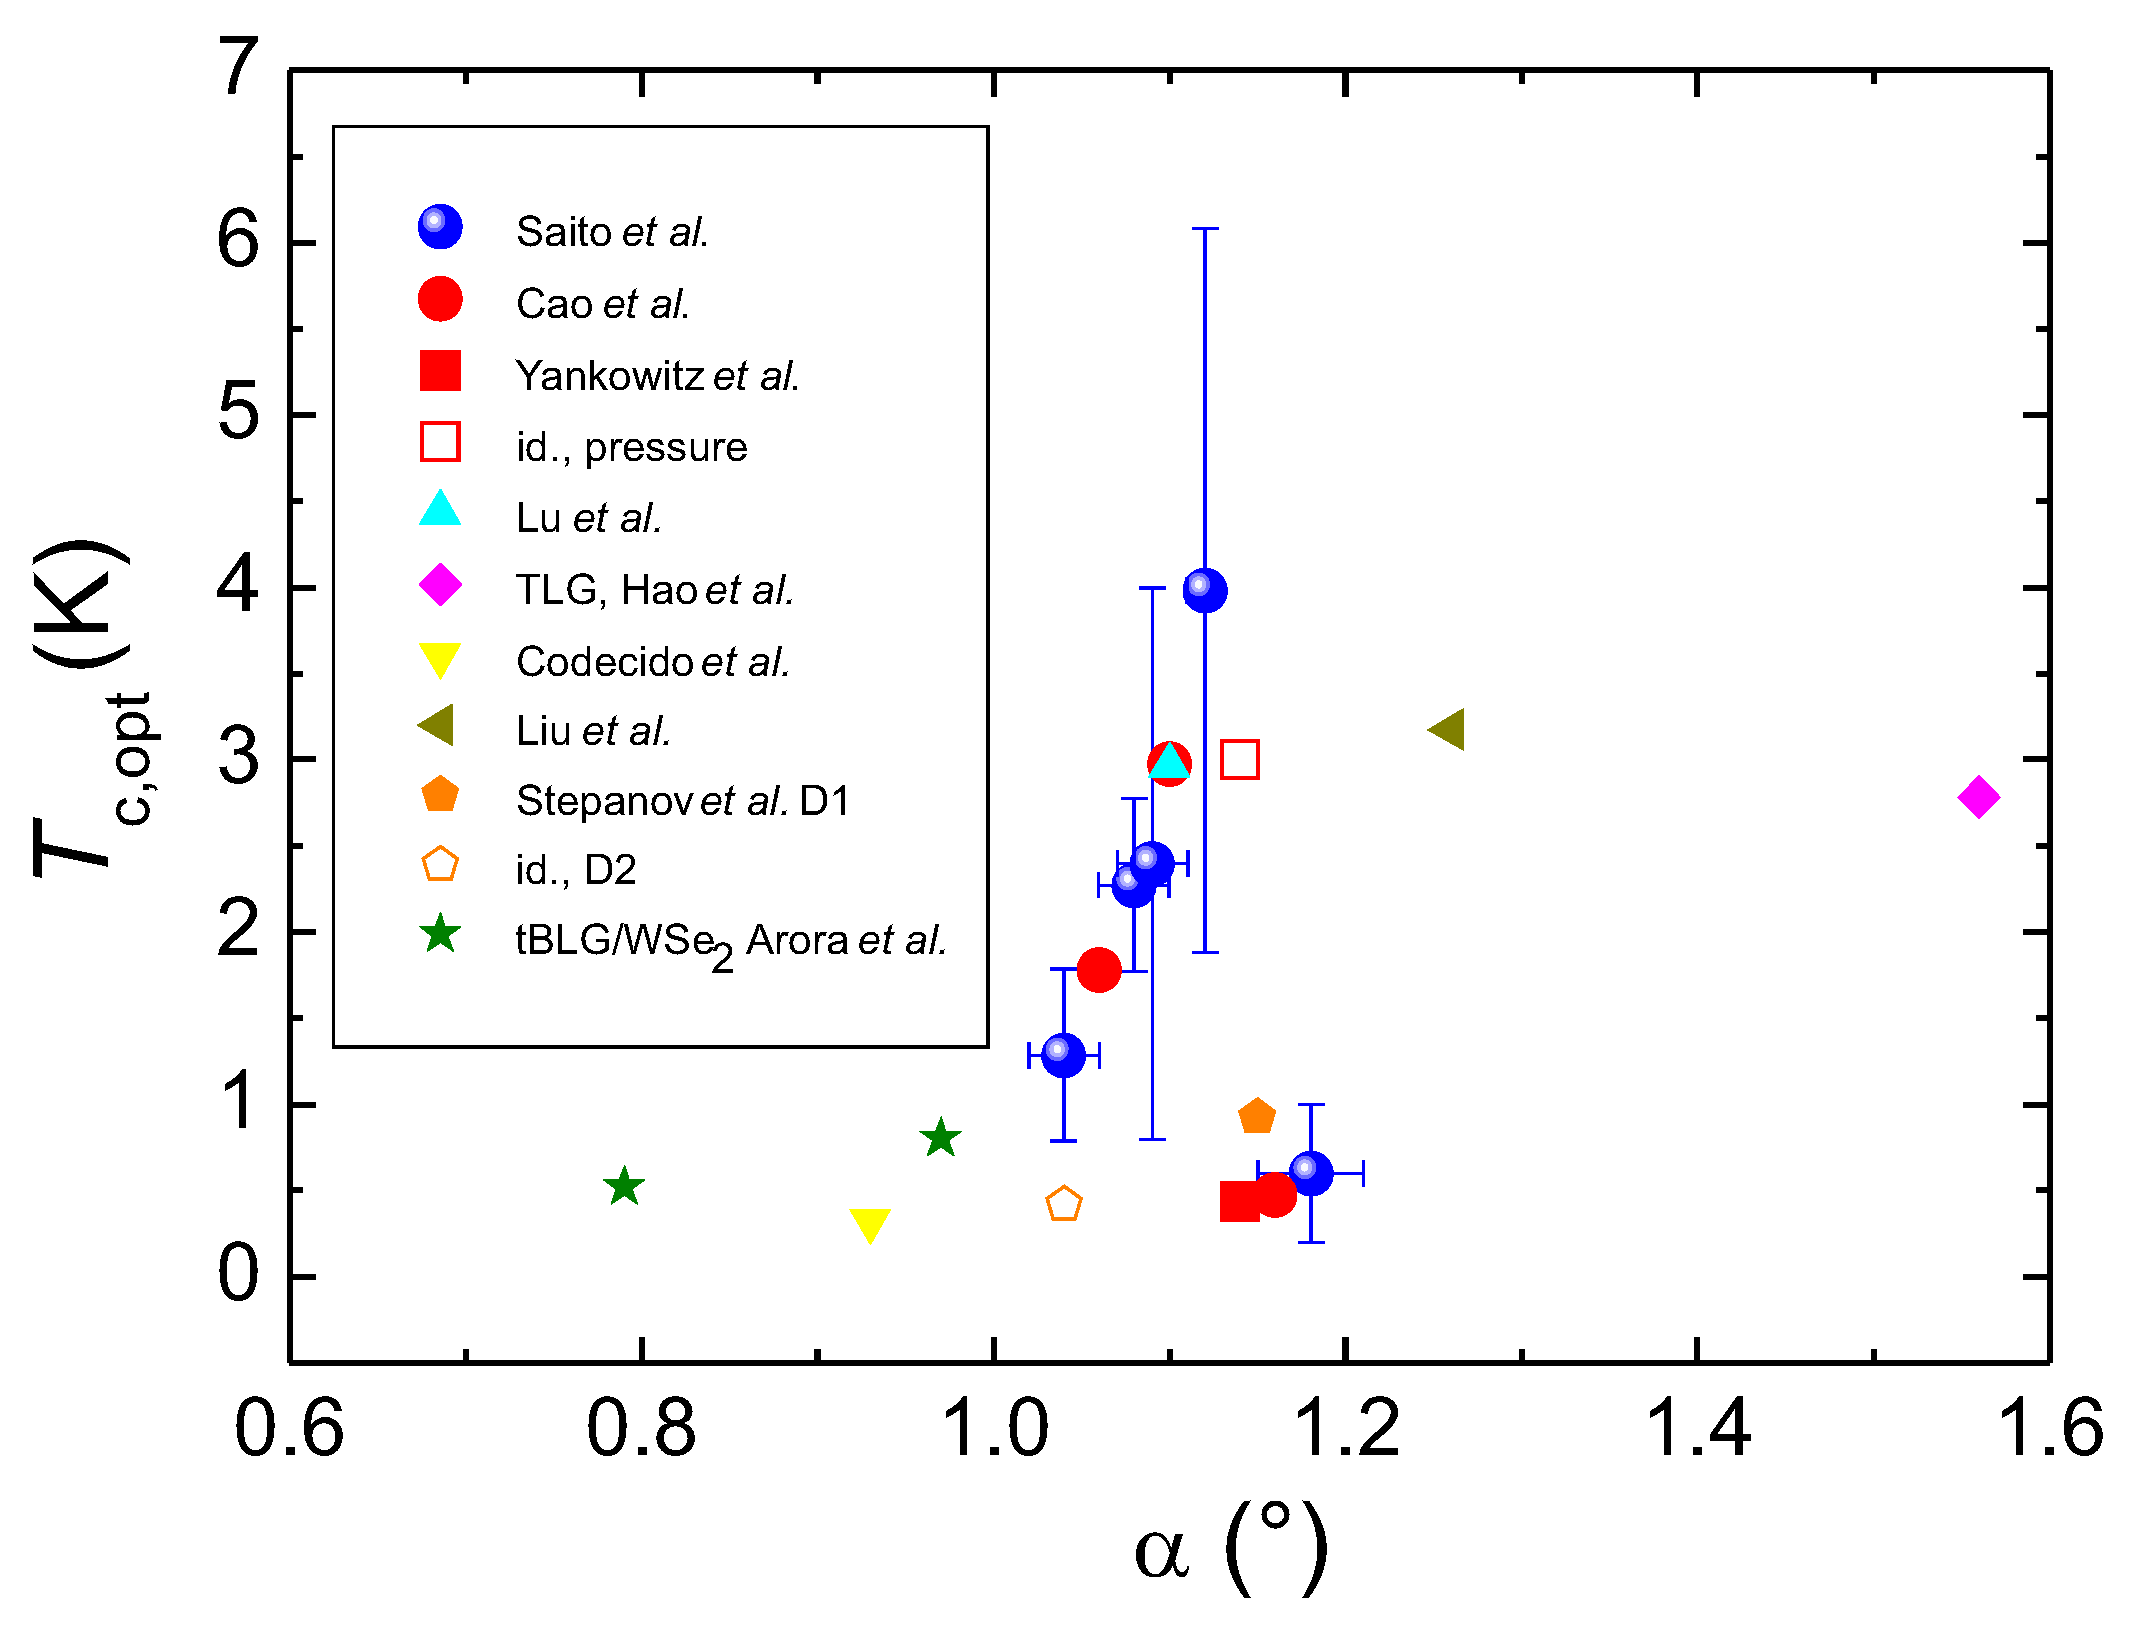
These results provided the base to compare the Roeser-Huber calculations with a wider experimental dataset. For comparison, we employed the data of Saito et al. (their Figure 3c), and those of Refs. [2,3,6,7,8,9,14]. The T c , opt determined by Saito et al. corresponds directly to T c MF required by us, so the data can be directly compared to each other as done in Table 1 below. Table 1 presents the T c -values of several tBLG devices of various authors [2,3,6,7,8,9,10] together with data of a graphene tri-layer [12], the data of WSe2-stabilized tBLG [14] and the data obtained on twisted WSe2 bi-layers [15]. Listed are the tilt angle α , the experimentally determined value of T c ( exp ) corresponding to our definition of T c MF , the characteristic length, x, corresponding to the Moiré lattice constant a M , the energy Δ ( 0 ) calculated using n 0 = 1, M L = 2 m e and the calculated values of T c ( calc ) . When doing the calculations, the calculated values T c ( calc ) turned out to be much larger as the experimentally observed values for T c . The first two rows give the data for tBLG at the magic angle, Θ = 1.1, yielding 4.23 K with n 0 = 1. Using n 0 = 2 would lead to a T c of 6.714 K, which is even higher and unrealistic. Table 1 shows further that the experimental variation of the tilt angle between 0.93 (the smallest tilt angle reported for superconductivity in tBLG) and 1.18 leads to T c -values of pure tBLG ranging between 3.024 K and 4.867 K. Thus, all calculated data are clearly higher than the experimental ones. What could be the reason for this?
There are two possible scenarios to explain this outcome.
(1) The effective Moiré lattice parameter is much larger as determined by Equation (1).
This is possible when considering the fact that Moiré superlattices can be formed by all layers involved forming the device, not only the graphene bilayer as intended. The fully encapsulated graphene has necessarily two interfaces with the h-BN layers on the top and bottom, where an extra tilt can occur. Looking at Figure 1c and Equation (1), the effect is largest at very small angles.Thus, attempting to align the top and bottom h-BN layer to the graphene may generate much larger Moiré superlattice parameters. Such a situation was discussed by Wang et al. [51].
In case of a stack of h-BN with graphene, there is a misfit between the two lattices, so the resulting superlattice can be described as [3,53]
a MSL = ( 1 + δ ) a 0 2 ( 1 + δ ) ( 1 cos Φ ) + δ 2 ,
where δ denotes the lattice mismatch between h-BN and graphene (1.8 %) and Φ is the twist angle of h-BN with respect to graphene. A result of this is that the largest possible Moiré lattice constant is ∼ 14 nm, which occurs when the one graphene layer is fully aligned to the h-BN layer. Wang et al. showed that they can increase the MSL lattice parameter to 29.6 nm by aligning both h-BN layers to the graphene. Calculating T c with this MSL parameter would yield a value of ∼0.8 K, which would be much closer to the experimental data.
However, the high pressure experiment of Yankowitz et al. [3] and the data of Saito et al. [10] demonstrated that this explanation cannot be the solution of the present problem. The optical images of the devices presented by Cao et al. [2], Yankowitz et al. [3] and Saito et al. [10] showed all arrangements made before putting the top h-BN layer in place. Thus, the misfit would be created when placing this layer. While this scenario might have applied to the first reports of superconducting tBLG, all authors of the more recent contributions have explicitly checked for such effects and even provided a dedicated discussion in their Supplementary Data (see, e.g., Figure S2 of Ref. [6]), so this effect can be ruled out. Furthermore, the high-pressure experiment could increase T c from 0.6 K to 3 K with the same configuration, and the data of Saito et al. [10] showed that their experimental values of T c are approaching the calculated ones using M L = 2 m e .
(2) A new correction factor must be introduced to the Roeser-Huber equation.
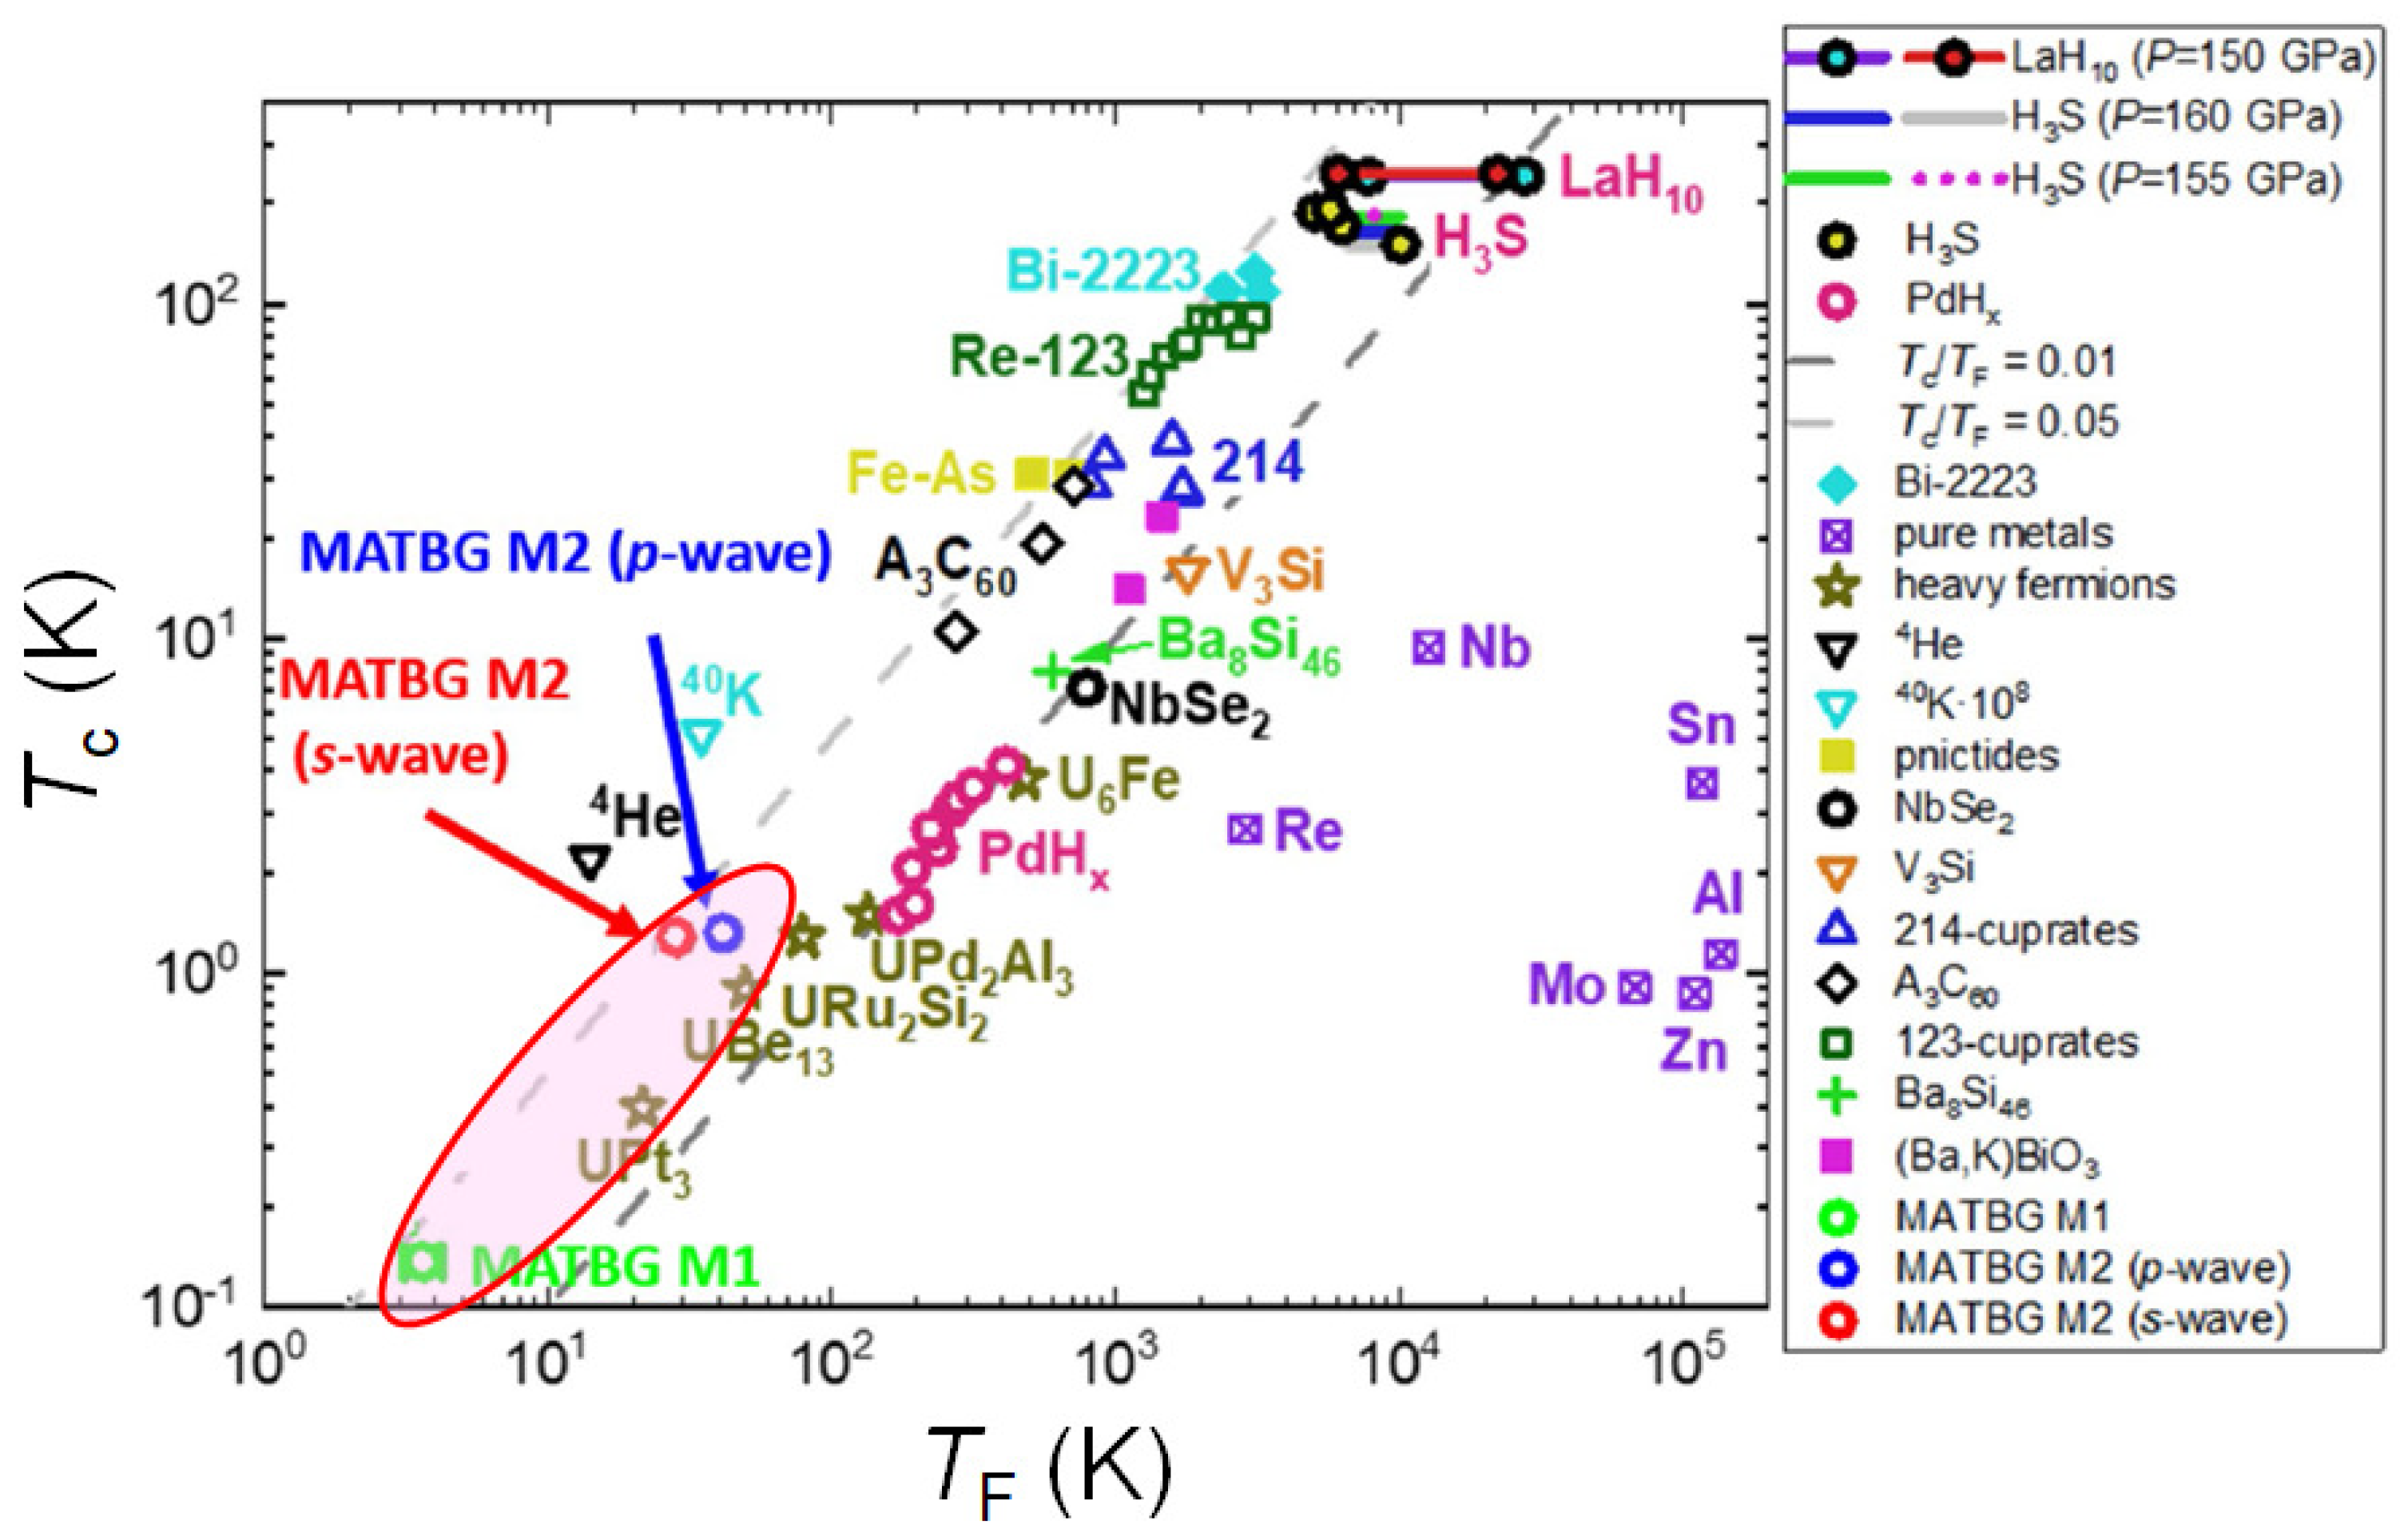
The band structure calculations have shown that the charge carrier density of the tBLG at the magic angle is very small, and it is shown by Lu et al. [6] that several superconducting domes can be found when plotting the linear resistance versus carrier density and temperature, which equals a phase diagram of tBLG. Thus, this fact must be accounted for in our calculations. Cao et al. [2] showed that the effective mass of the charge carriers is only 0.2 m e , and in the Uemura plot [104,105] (their Figure 6), they demonstrated that the tBLG samples are located at low Fermi temperatures T F 20 K and n 2 D = 1.5 × 1011 cm−2, being clearly distinct from the HTSc, where M L = 2 m e applies very well.
Thus, we introduce a correction factor, η , to the charge carrier mass M L in Equation (3) by writing:
M L = η m e .
The situation η = 2 will then correspond to our initial value of 2. Now, we come back to Table 1. The energy Δ ( 0 ) * and the corresponding T c * ( calc ) were obtained by introducing the correction factor η to the Roeser-Huber equation, which is listed as well. The parameter η was obtained by adapting the calculation procedure manually to the experimentally obtained values of T c . The result of this procedure is that we can now fully reproduce all the experimentally observed values for T c . The slight deviations in T c ( calc ) account for the difficulties when extracting the T c -values. The data for the h-BN–WSe2–tBLG–h-BN stacks of Arora et al. [14] show that the WSe2-layer stabilizes superconductivity at angles much smaller than the magic angle, and also smaller (0.79) as the smallest angle reported for pure tBLG. We also see that such a monolayer of WSe2 is not superconducting on its own; Arora et al. describe the WSe2-layer as insulating. The trilayer graphene (TLG, Hao et al. [12]) would have a quite high T c of 8.5 K when calculating with M L = 2 due to the small value of a M . Thus, the required η is quite large and also off the fit in Figure 3.
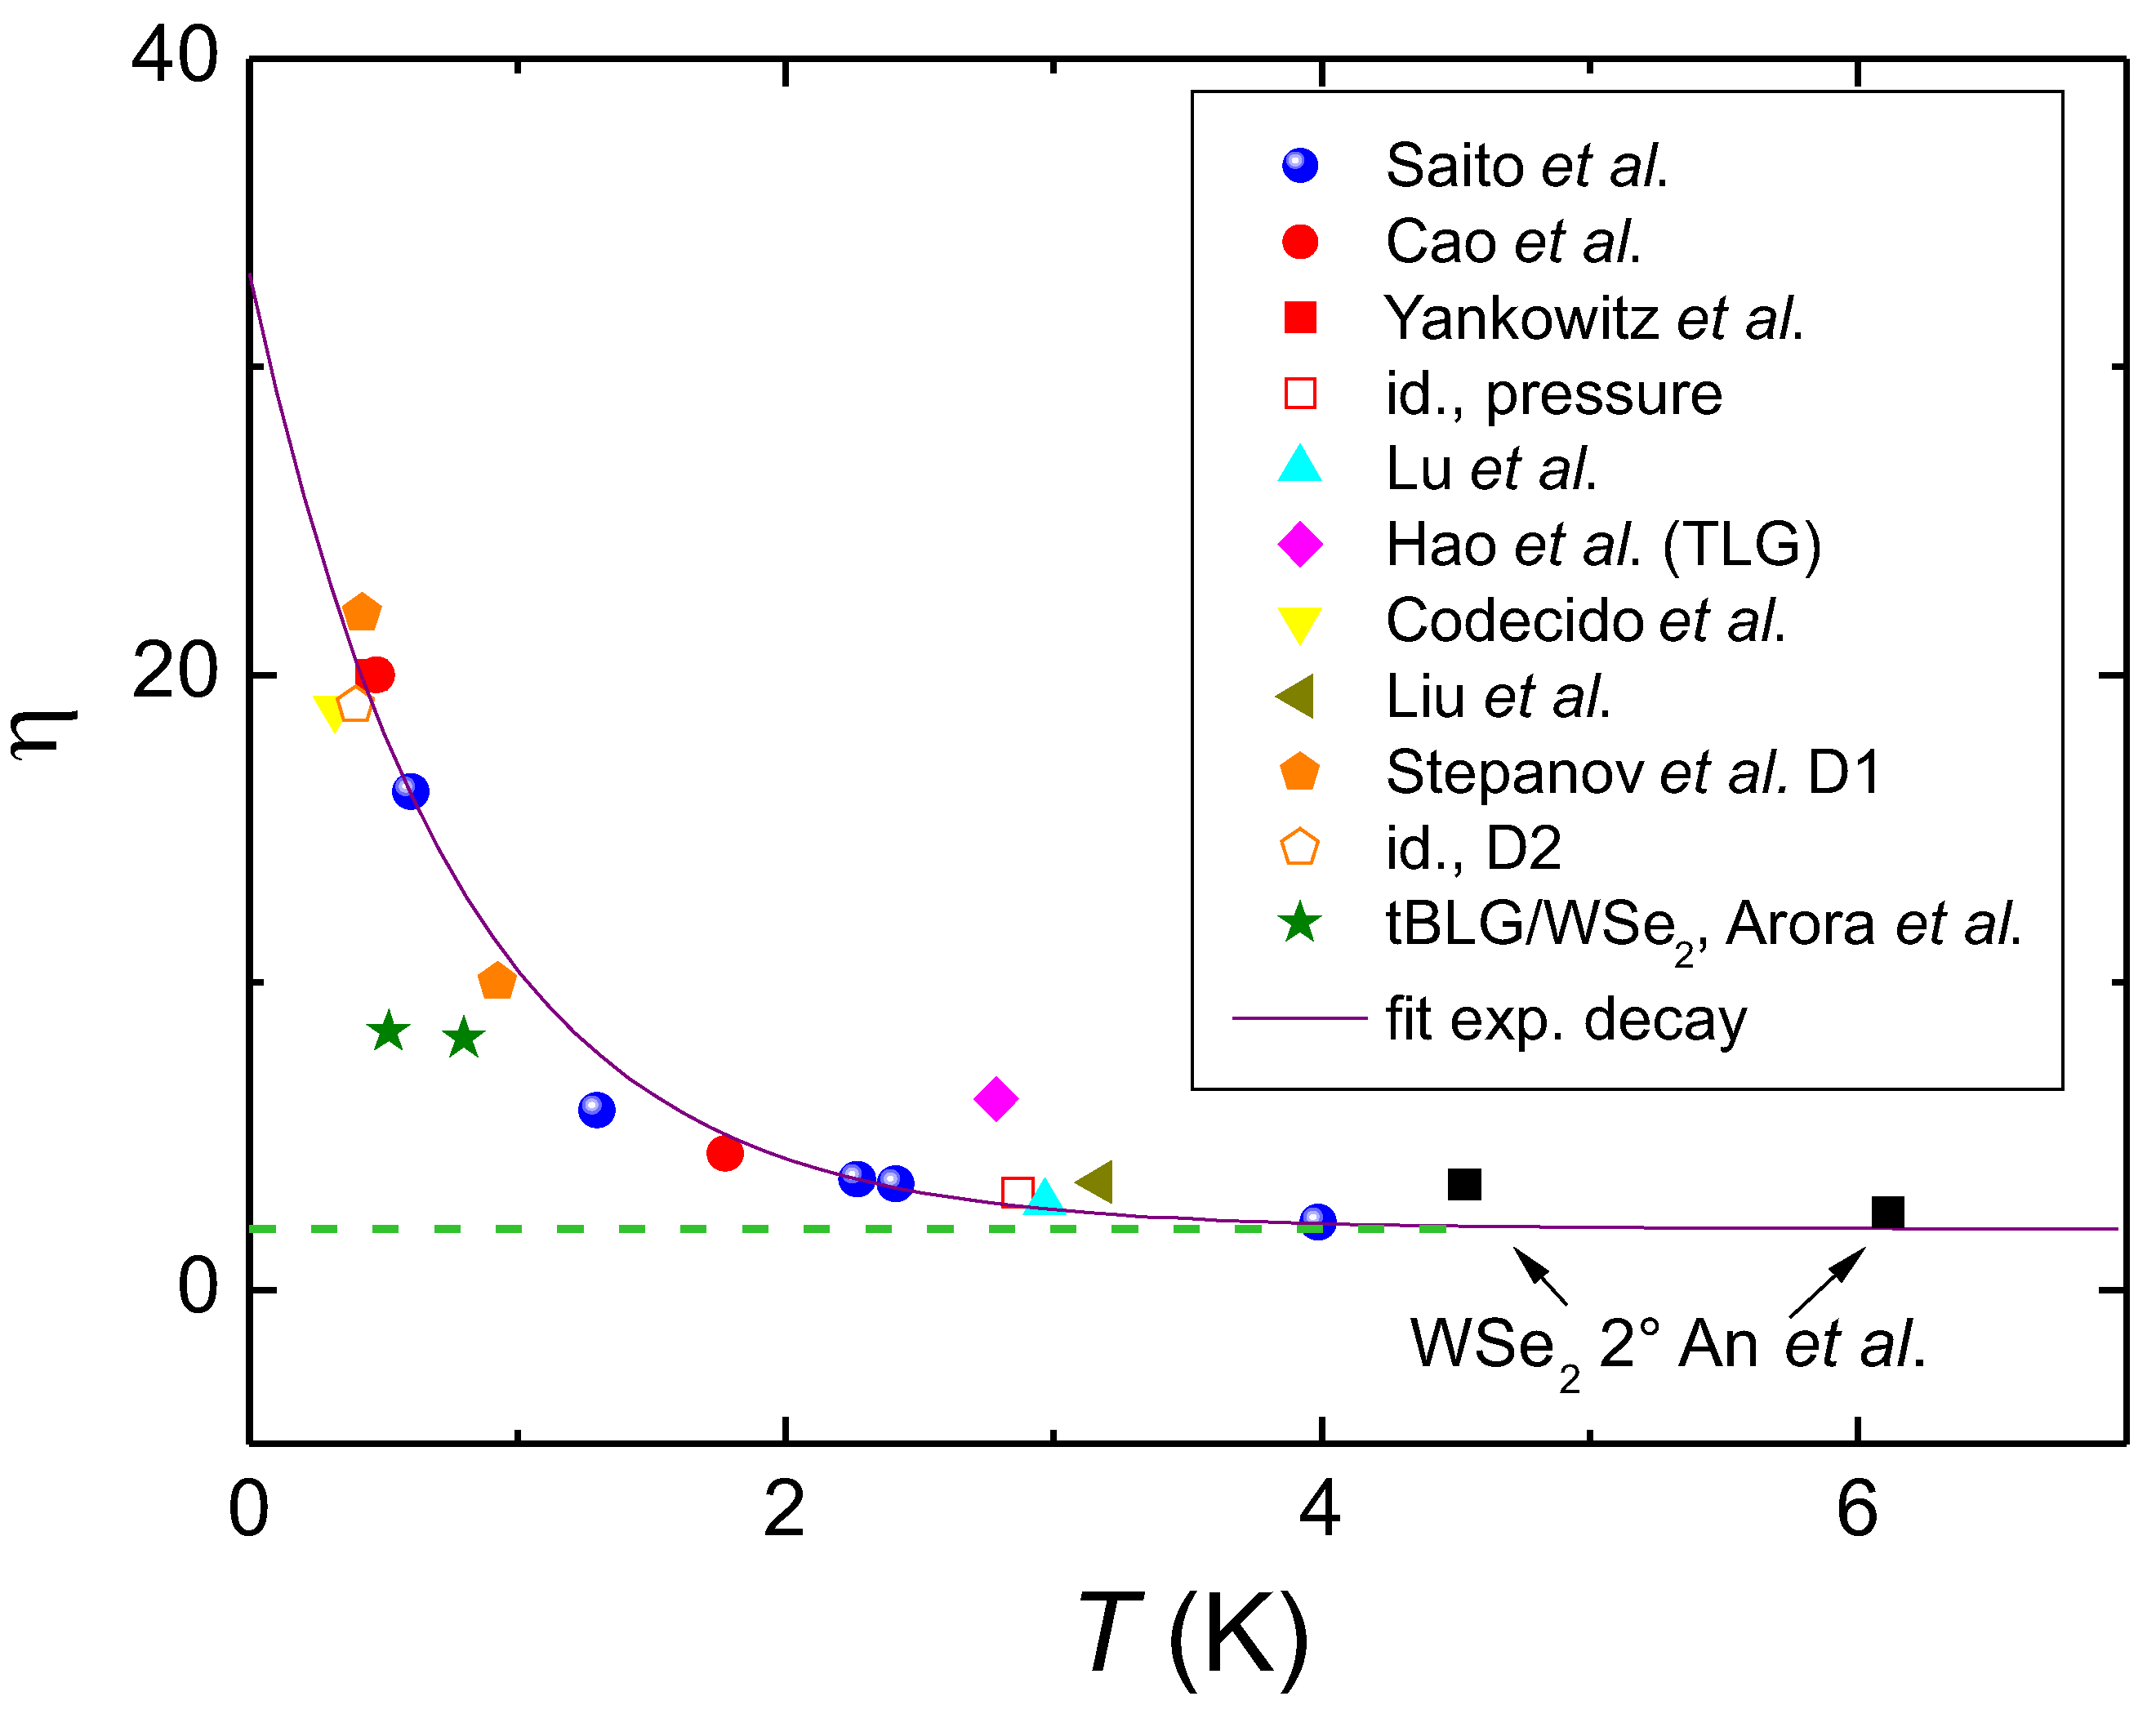
Figure 7 plots the resulting values for η as function of temperature. The dashed green line indicates the bottom value of η = 2, which corresponds to the case of HTSc materials. The lower the measured transition temperature, the larger the parameter η . Fitting the data with an exponential decay of the type
y = 2 A 1 · exp ( ( x x 0 ) / t 1 ) ,
we obtain a quite good correlation with the parameters A 1 = 14.17, x 0 = 0.6 and t 1 = 0.766 as shown in Figure 3. The tBLG/WSe2-data fall below this fit line, and the TLG and WSe2 are located above it. Furthermore, the values for η are only in a small range between 2 and 22, which is equal to the narrow window for the tBLG samples in the Uemura plot ( T c as a function of the Fermi temperature, T F = E F / k B with E F denoting the Fermi energy) in a line below the HTSc samples [2,11]. As T F is directly linked to the Fermi velocity, v F , via
T F = m * v F 2 2 k B
and
v F = h 2 π m e ( 2 π 2 n ) 1 / 3 ,
there is the effective mass, m * , and the density of the charge carriers, n, directly involved. We also must note here that η depends not only on the calculated value of T c at a given misorientation angle Θ , but also on the charge carrier density. Thus, the parameter η determined here should contain all this information, which will then also enable to judge via the value of m * ( m * < 0.1 m e ) [11], if a material can be a superconductor or not. Thus, this parameter η is by no means an artificial approach just to obtain the right T c -values, but the parameter contains all the essential physics (charge carrier density, charge carrier mass) to describe a superconducting material. This will further contribute to reduce the calculation error(s) in the Roeser-Huber formalism existing for some other materials like Nb or Re (see their position in the Uemura plot given in Figure 7.
The newer experimental reports also present superconductivity measured at different superconducting domes in the phase diagram, which can be accessed at various positive and negative charge carrier densities. A dedicated analysis of all the data available (tBLG samples as well as the extreme elemental superconductors like Bi or Li) will allow to further clarify the properties of η .
The case of bi-layer WSe2 [15] is more complicated to be solved. The first problem in the case of WSe2 is the value for n 0 to be taken in the calculations. If a monolayer WSe2 is superconducting itself, n 0 must be taken as 2. If only the product from two misaligned WSe2 layers is superconducting, we would have n 0 = 1 like for tBLG. A first glance on Table 1 gives the idea that n 0 = 2 could be correct, but as seen from the combined WSe2–tBLG-data from Arora et al. [14], we can consider n 0 = 1 to be the more realistic case. Thus, we have listed both cases in Table 1 to give some predictions of T c for the WSe2 system. As seen from Figure 1c, the larger lattice parameter of WSe2 will lead to slightly larger a M for a given angle Θ , and thus, the resulting values for T c are higher as compared to tBLG, which is also observed experimentally [15]. The main problem is now that the experiments of Ref. [15] do not convincingly demonstrate superconductivity in this system as compared to the tBLG data, where much more detailed information is available. So it is difficult to extract properly defined values for T c from the data presented (WSe2 bilayers with 1, 2 and 4 misalignment). For the 1 sample (E7), T c could be around 3.5–4 K, for the 2 sample (F2) ∼4 K (-6.65 V) or ∼6 K (-6.92 V) and for the 4 sample (D11, marked by a star in Table 1), one may get T c somewhere between 4 K and 12 K, if at all. The calculation of the Moiré pattern parameter for the 4 sample gives a M = 4.72 nm, which would yield a T c of 49.9 K (with n 0 = 2) or 31.13 K with n 0 = 1. These values for Δ ( 0 ) and T c are considerably too high and unrealistic. As the authors show in their paper higher order Laue reflexes from electron diffraction patterns for the 1 sample, which would indicate a lattice constant of the order of 20–25 nm (instead of the calculated 18.9c i r c using Equation (1)), we have used 20 nm for x in Table 1 for the 1 sample and left the 4 sample out of further consideration. If we calculate T c using n 0 = 2, the calculated values come quite close to the experimental data assuming T c 3 K. In all cases, the superconductivity is best documented for sample F2 (their Figure 5a and S11), yielding a T c of 4.53 K (-6.65 V) and 6.1 (-6.92 V) at two different gate voltages. These T c -values are clearly higher than those of tBLG, but also smaller than the calculated value of 7.78 K ( n 0 = 1). Determining the correction factors η for this sample yields η = 3.44 and 2.55 at the two gate voltages, which are only small corrections. To summarize this part, the published data of WSe2 are not suitable for a good comparison, but when extracting T c via the first derivative from the published data (best for sample F2), we only require small correction factors to reproduce the experimental T c . This would indicate that the WSe2 bilayers have properties being more similar to that of HTSc compounds.
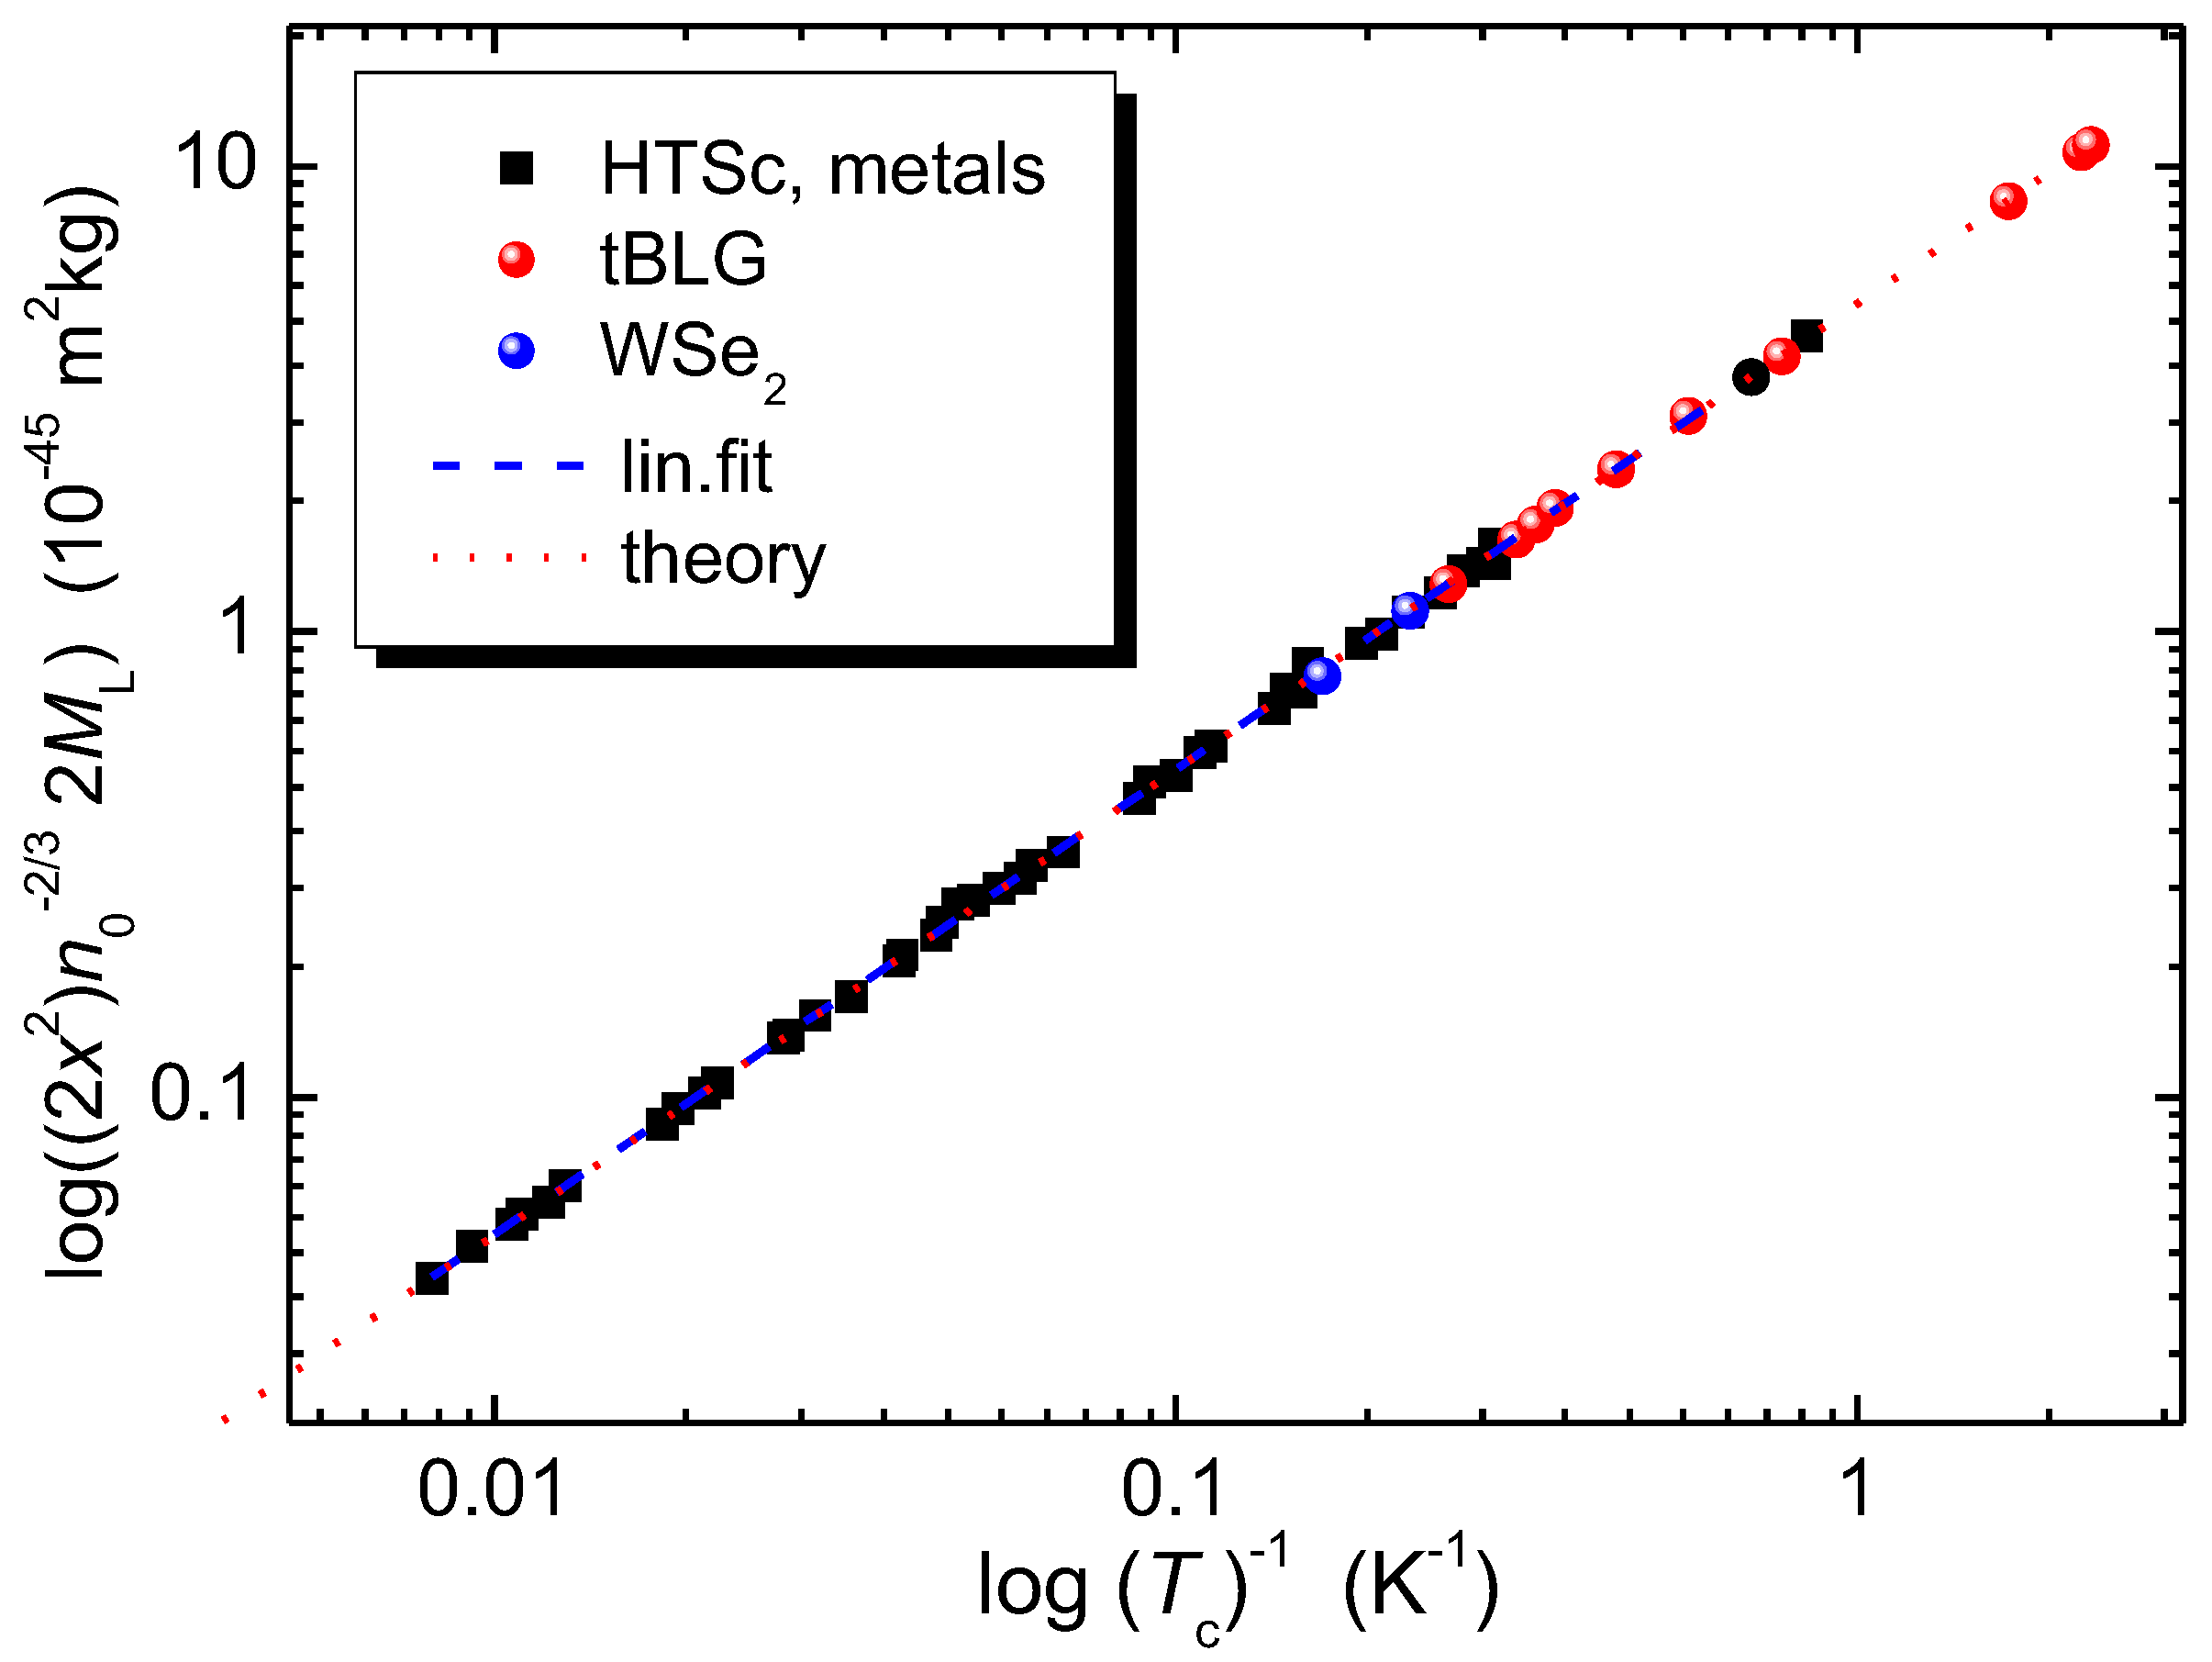
Finally, Figure 8 presents the Roeser-Huber plot, now extended towards lower temperatures to include the various tBLG samples reported in the literature. The black squares (■) correspond to the data published in Ref. [74], the red data points () are for the various tBLG samples investigated here, and the blue bullet () shows the 2 WSe2 data. The straight red-dotted line follows the equation for a particle in a box [100] with the slope h 2 / ( 2 π k B ) = 5.061 × 10−45 m2 kg K. The linear fit (dashed-blue line) is almost perfect with only a small error margin, which manifests the basic idea of the Roeser-Huber formalism.
Harshman and Fiory [106] presented another way of calculating the transition temperature of tBLG from experimental data. Also this approach was originally developed for HTSc samples, and the parameters involved are quite similar to those of the Roeser-Huber approach. However, there is no relation between the T c and the crystal lattice parameters, except a distance between the superconducting layers, which in turn is not contained in the Roeser-Huber formalism. In all cases, it will be interesting to compare the various parameters of the models with each other.
So, we can say here that an extension of the Roeser-Huber formula is required to account for the low charge carrier densities and the resulting low charge carrier mass using the new parameter η . When doing so, we can directly reproduce the experimental data of the various tBLG measurements published in the literature. We also note that the calculation using η = 2, that is, a charge carrier mass of 2 m e , gives an upper limit for T c of Moiré superconductors, to which the experiments come now close by applying pressure or using thicker h-BN layers (see, e.g., the results of Saito et al. [10]). This observation is a very positive output for use of the Roeser-Huber equation to predict the superconducting transition temperatures of still unknown materials.

6. Conclusions and outlook

As outlook for future research in the field of Moiré superconductivity, one can state that the Moiré superlattices have developed into excellent platforms for the study of new properties of layered 2D materials in general [107], where superconductivity is only one of several special properties. The recent creation of devices with 3, 4 or more graphene layers demonstrated stable and robust superconductivity, and the finding of the dependence of T c on the h-BN layer thickness also clearly showed that more robust superconductivity is possible in the Moiré superconductors. Thus, one may expect creation of new superconducting materials by different types of stacking the layers, e.g., the combination of graphene and WSe2, combinations with flat 2D-layers like borophene, stannene [17,18], etc., or even heuslerenes [108], which may be superconducting themselves or not. In all cases, the reviewed research is only the top of an iceberg, as countless other combinations are theoretically possible. Another interesting aspect is the finding of Moiré pattern on the surface of a topological insulator [109,110], combining two ongoing research directions. Also here, more stable and robust new superconducting states may result, which will further widen up the knowledge of such unconventional superconductors.
To summarize up the present paper, in the first part we have given a summary of the various measurements on superconducting tBLG samples as published in the literature. For the measurements, a typical structure called device was build up consisting of the tBLG, a top and bottom h-BN layer and graphite as a substrate and cover for better handling of the structure. Via electric contacts, the longitudinal resistance, R x x , could be measured as function of temperature, applied magnetic field, tilt angle, and h-BN layer thickness. An important result is here that the complete phase diagram (in analogy to the phase diagram of HTSc) could be measured by electrically tuning the charge carrier density, n. This enables a complete study of the superconducting properties of the various tBLG samples for a given tilt angle of the graphene layers. Furthermore, measuring the characteristic Fraunhofer patterns enables a direct proof of the superconducting state, which is important as the classical Meissner effect can not be magnetically measured in these tBLG devices.
All the data of the superconducting state collected by various authors now enable the calculation of T c of Moiré superconductors based on the Moiré lattice parameter using the Roeser-Huber formalism. When doing so, we find that the Roeser-Huber formula in the standard form with M L = 2 m e gives an upper limit of T c for tBLG, which is close to the experimental observations for tBLG samples with thicker h-BN layers. To better describe the superconducting state(s) of the various tBLG samples and to account for the distinctly different Fermi temperatures, the introduction of a correction factor η to the Roeser-Huber formalism enables to account for the small charge carrier densities and charge carrier mass, so that the experimentally obtained data can successfully be reproduced. Further work is required to find a theoretical foundation for this parameter η , but it is already obvious that n and T F play an important role. Via T F and the corresponding Fermi velocity, v F , it becomes possible to introduce a criterion to the Roeser-Huber formalism to distinguish if a given material can be a superconductor or not. For the tilted WSe2 layers, which were already discussed in the literature, the currently available experimental data are not sufficient to extract proper values for T c to enable a proper comparison with the calculated data.

Author Contributions

Conceptualization, M.R.K.; Formal Analysis, A.K.-V. and M.R.K.; Investigation, A.K.-V. and M.R.K.; Writing-Original Draft Preparation, M.R.K.; Writing-Review and Editing, A.K.-V. and M.R.K.

Funding

This work is part of the SUPERFOAM international project funded by ANR and DFG under the references ANR-17-CE05-0030 and DFG-ANR Ko2323-10, respectively.

Institutional Review Board Statement

Not applicable.

Informed Consent Statement

Not applicable.

Data Availability Statement

Datasets obtained and analyzed during the study are available from the corresponding author on reasonable request.

Conflicts of Interest

The authors declare no conflict of interest.

References

  1. Yuan Cao, Y.; Fatemi, V.; Demir, A.; Fang, S.; Tomarken, S.L.; Luo, J.Y.; Sanchez-Yamagishi, J.D.; Watanabe, K.; Taniguchi, T.; Kaxiras, E.; Ashoori, R.C.; Jarillo-Herrero, P. Correlated insulator behaviour at half-filling in magic-angle graphene superlattices. Nature 2018, 55, 80–84. [Google Scholar] [CrossRef]
  2. Cao, Y.; Fatemi, V.; Fang, S.; Watanabe, K.; Taniguchi, T.; Kaxiras, E.; Jarillo-Herrero, P. Unconventional superconductivity in magic-angle graphene superlattices. Nature 2018, 556, 43–50. [Google Scholar] [CrossRef]
  3. Yankowitz, M.; Chen, S.; Polshyn, H.; Zhang, Y.; Watanabe, K.; Taniguchi, T.; Graf, D.; Young, A. F.; Dean, C. R. Tuning superconductivity in twisted bilayer graphene. Science 2019, 363, 1059–1064. [Google Scholar] [CrossRef]
  4. Suárez Morell, E., Correa, J. D., Vargas, P., Pacheco, M.; Barticevic, Z. Flat bands in slightly twisted bilayer graphene: tight-binding calculations. Phys. Rev. B 82, 121407 (2010).
  5. G. Trambly de Laissardière, D. Mayou, and L. Magaud Localization of Dirac Electrons in Rotated Graphene Bilayers. Nano Lett. 2010, 10, 804–808. [Google Scholar] [CrossRef] [PubMed]
  6. Lu, X.; Stepanov, P.; Yang, W.; Xie, M.; Ali Aamir, M.; Das, I.; Urgell, C.; Watanabe, K.; Taniguchi, T.; Zhang, G.; Bachtold, A.; MacDonald, A. H.; Efetov, D. K. Superconductors, orbital magnets and correlated states in magic-angle bilayer graphene. Nature 2019, 574, 653–657. [Google Scholar] [CrossRef]
  7. Codecido, E.; Wang, Q.; Koester, R.; Che, S.; Tian, H.; Lv, R.; Tran, S.; Watanabe, K.; Taniguchi, T.; Zhang, F.; Bockrath, M.; Lau, C. N. Correlated insulating and superconducting states in twisted bilayer graphene below the magic angle. Sci. Adv. 2019, 5, eaaw9770. [Google Scholar] [CrossRef]
  8. Liu, X.; Hao, Z.; Khalaf, E.; Lee, J.-Y.; Watanabe, K.; Taniguchi, T.; Vishwanath, A.; Kim, P. Tunable spin-polarized correlated states in twisted double bilayer graphene. Nature 2020, 583, 221–225. [Google Scholar] [CrossRef]
  9. Stepanov, P.; Das, I.; Lu, X.; Fahimniya, A.; Watanabe, K.; Taniguchi, T.; Koppens, F. H. L.; Lischner, J.; Levitov, L.; Efetov, F. K. Untying the insulating and superconducting orders in magic-angle graphene. Nature 2020, 583, 375–378. [Google Scholar] [CrossRef]
  10. Saito, Y.; Ge, J.; Watanabe, K.; Taniguchi, T.; Young, A. F. Independent superconductors and correlated insulators in twisted bilayer graphene Nature Phys. 2020 16, 926–930. [CrossRef]
  11. E. F. Talantsev, E.. F.; Mataira, R. C.; Crump, W. P. Classifying superconductivity in Moiré graphene superlattices. Sci. Rep. 2020 10, 212; [CrossRef]
  12. Hao, Z.; Zimmerman, A. M.; Ledwith, P.; Khalaf, E.; Najafabadi, D. H.; Watanabe, K.; Taniguchi, T.; Vishwanath, A.; Kim, P. Electric field–tunable superconductivity in alternating-twist magic-angle trilayer graphene. Science 2021, 371, 1133–1138. [Google Scholar] [CrossRef]
  13. Guorui Chen, C.; Sharpe, A.L.; Gallagher, P.; Rosen, I.T.; Fox, E.J.; Jiang, L.; Lyu, B.; Li, H.; Watanabe, K.; Taniguchi, T.; Jung, J.; Shi, Z.; Goldhaber-Gordon, D.; Zhang, Y.; Wang, F. Signatures of tunable superconductivity in a trilayer graphene moiré superlattice. Nature 572, 215–219 (2019). [CrossRef]
  14. Arora, H. S.; Polski, R.; Zhang, Y.; Thomson, A.; Choi, Y.; Kim, H.; Lin, Z.; Wilson, I. Z.; Xu, X.; Chu, J.-H.; Watanabe, K.; Taniguchi, T.; Alicea, J.; Nadj-Perge, S. Superconductivity in metallic twisted bilayer graphene stabilized by WSe2. Nature 2020, 583, 379–384. [Google Scholar] [CrossRef]
  15. An, L.; Cai, X.; Pei, D.; Huang, M.; Wu, Z.; Zhou, Z.; Lin, J.; Ying, Z.; Ye, Z.; Feng, X.; Gao, R.; Cacho, C.; Watson, M.; Chen, Y.; and Wang, N. Interaction effects and superconductivity signatures in twisted double-bilayer WSe2. Nanoscale Horiz. 2020, 5, 1309. [Google Scholar] [CrossRef]
  16. Balents, L.; Dean, C. R.; Efetov, D. K.; Young, A. F. Superconductivity and strong correlations in moiré flat bands. Nature Phys. 2020, 16, 725–733. [Google Scholar] [CrossRef]
  17. Liao, M.; Zang, Y.; Guan, Z.; Li, H.; Gong, Y.; Zhu, K.; Hu, X.-P.; Zhang, D.; Xu, Y.; Wang, Y.-Y.; He, K.; Ma, X.-C.; Zhang, S.-C.; Xue, Q.-K. Superconductivity in few-layer stanene. Nature Phys. 2018, 14, 344–348. [Google Scholar] [CrossRef]
  18. Yan, L.; Liu, P.-F.; Li, H.; Tang, Y.; He, J.; Huang, X.; Wang, B.-T.; Zhou, L. Theoretical dissection of superconductivity in two-dimensional honeycomb borophene oxide B2O crystal with a high stability. npj Computational Materials 2020, 6, 94. [Google Scholar] [CrossRef]
  19. Bistritzer, R.; MacDonald, A. H. Moiré bands in twisted double-layer graphene. Proc. Natl. Acad. Sci. 2011, 108, 12233–12237. [Google Scholar] [CrossRef]
  20. Wu, F.; Hwang, E.; Das Sarma, S. Phonon-induced giant linear-in-T resistivity in magic angle twisted bilayer graphene: Ordinary strangeness and exotic superconductivity. Phys. Rev. B 2019, 99, 165112. [Google Scholar] [CrossRef]
  21. Schrade, C.; Fu, L. Spin-valley density wave in moiré materials. Phys. Rev. B 2019, 100, 035413. [Google Scholar] [CrossRef]
  22. Carr, S., Fang, S., Po, H. C., Vishwanath, A. Kaxiras, E. Derivation of Wannier orbitals and minimal-basis tight-binding Hamiltonians for twisted bilayer graphene: first-principles approach. Phys. Rev. Res. 1, 033072 (2019).
  23. Lian, B. , Wang, Z. Bernevig, B. A. Twisted bilayer graphene: a phonon-driven superconductor. Phys. Rev. Lett. 122, 257002 (2019).
  24. Shi, L.; Ma, J. , Song, J. C. W. Gate-tunable flat bands in van der Waals patterned dielectric superlattices. 2D Mater. 2020, 7, 015208. [Google Scholar] [CrossRef]
  25. Kim, K.; DaSilva, A.; Huang, S.; Fallahazad, B.; Larentis, S.; Taniguchi, T.; Watanabe, K.; LeRoy, B.J.; MacDonald, A.H.; Tutuc, E. Tunable moiré bands and strong correlations in small-twist-angle bilayer graphene. Proc. Natl. Acad. Sci. USA 2017, 114, 3364–3369. [Google Scholar] [CrossRef] [PubMed]
  26. Wallbank, J.R.; Kumar, R.K.; Holwill, M.; Wang, Z.; Auton, G.H.; Birkbeck, J.; Mishchenko, A.; Ponomarenko, L.A.; Watanabe, K. Taniguchi, T.; Novoselov, K. S.; Aleiner, I. L.; Geim, A. K.; Fal’ko, V. I. Excess resistivity in graphene superlattices caused by umklapp electron–electron scattering. Nature Phys. 2018, 15, 32–36. [Google Scholar] [CrossRef]
  27. Choi, Y.W.; Choi, H.J. Strong electron-phonon coupling, electron-hole asymmetry, and nonadiabaticity in magic-angle twisted bilayer graphene. Phys. Rev. B 2018, 98, 241412. [Google Scholar] [CrossRef]
  28. Sharpe, A.L.; Fox, E.J.; Barnard, A.W.; Finney, J.; Watanabe, K.; Taniguchi, T.; Kastner, M.A.; Goldhaber-Gordon, D. Emergent ferromagnetism near three-quarters filling in twisted bilayer graphene. Science 2019, 365, 605–608. [Google Scholar] [CrossRef] [PubMed]
  29. Polshyn, H.; Yankowitz, M.; Chen, S.; Zhang, Y.; Watanabe, K.; Taniguchi, T.; Dean, C.R.; Young, A.F. Large linear-in-temperature resistivity in twisted bilayer graphene. Nature Phys. 2019, 15, 1011–1016. [Google Scholar] [CrossRef]
  30. Lian, B.; Wang, Z.; Bernevig, B.A. Twisted bilayer graphene: A phonon-driven superconductor. Phys. Rev. Lett. 2019, 122, 257002. [Google Scholar] [CrossRef] [PubMed]
  31. Kerelsky, A.; McGilly, L.J.; Kennes, D.M.; Xian, L.; Yankowitz, M.; Chen, S.; Watanabe, K.; Taniguchi, T.; Hone, J.; Dean, C.; et al. Maximized electron interactions at the magic angle in twisted bilayer graphene. Nature 2019, 572, 95–100. [Google Scholar] [CrossRef] [PubMed]
  32. Sharpe, A. L. et al. Emergent ferromagnetism near three-quarters filling in twisted bilayer graphene. Science 365, 605–608 (2019).
  33. Chu, Y.; Zhu, F.; Wen, L.; Chen, W.; Chen, Q.; Ma, T. Superconductivity in twisted multilayer graphene: A smoking gun in recent condensed matter physics. Chin. Phys. B 2020, 29, 117401. [Google Scholar] [CrossRef]
  34. Nimbalkar, A.; Kim, H. Opportunities and Challenges in Twisted Bilayer Graphene: A Review. Nano-Micro Lett. 2020, 12, 126. [Google Scholar] [CrossRef]
  35. Serlin, M. et al. Intrinsic quantized anomalous Hall effect in a moiré heterostructure. Science 367, 900–903 (2020).
  36. Das, I.; Lu, X.; Herzog-Arbeitman, J.; Song, Z.-D.; Watanabe, K.; Taniguchi, T.; Bernevig, B.A.; Efetov, D.K. Symmetry-broken Chern insulators and Rashba-like Landau-level crossings in magic-angle bilayer graphene. Nature Phys. 2021, 17, 1–5. [Google Scholar] [CrossRef]
  37. He, M.; Li, Y.; Cai, J.; Liu, Y.; Watanabe, K.; Taniguchi, T.; Xu, X.; Yankowitz, M. Symmetry breaking in twisted double bilayer graphene. Nature Phys. 2021, 17, 26–30. [Google Scholar] [CrossRef]
  38. He, M.; Zhang, Y.-H.; Li, Y.; Fei, Z.; Watanabe, K.; Taniguchi, T.; Xu, X.; Yankowitz, M. Competing correlated states and abundant orbital magnetism in twisted monolayer-bilayer graphene. Nature Commun. 2021, 12, 4727. [Google Scholar] [CrossRef]
  39. Li, W.; Reichhardt, C. J. O.; Jankó, B.; Reichhardt, C. Vortex dynamics, pinning, and angle-dependent motion on moiré patterns. Phys. Rev. B 2021, 104, 024504. [Google Scholar] [CrossRef]
  40. Ledwith, P.J.; Khalaf, E.; Vishwanath, A. Strong coupling theory of magic-angle graphene: A pedagogical introduction. Annals of Physics 2021, 435, 168646. [Google Scholar] [CrossRef]
  41. Saito, Y.; Ge, J.; Rademaker, L.; Watanabe, K.; Taniguchi, T.; Abanin, D.A.; Young, A.F. Hofstadter subband ferromagnetism and symmetry-broken Chern insulators in twisted bilayer graphene. Nature Phys. 2021, 17, 478–481. [Google Scholar] [CrossRef]
  42. Cao, Y.; Park, J. M.; Watanabe, K.; Taniguchi, T.; Jarillo-Herrero, P. Pauli-limit violation and re-entrant superconductivity in moiré graphene. Nature 2021, 595, 526–531. [Google Scholar] [CrossRef] [PubMed]
  43. Hu, C.; Wu, T.; Huang, X.; Dong, Y.; Chen, J.; Zhang, Z.; Lyu, B.; Ma, S.; Watanabe, K.; Taniguchi, T.; Xie, G.; Li, X.; Liang, Q.; Shi, Z. In-situ twistable bilayer graphene. Sci. Rep. 2022, 12, 204. [Google Scholar] [CrossRef]
  44. Romanova; M. ; Vlček, V. Stochastic many-body calculations of moiré states in twisted bilayer graphene at high pressures. npj Computational Materials 2022, 8, 11. [Google Scholar] [CrossRef]
  45. Ghawri, B.; Mahapatra, P.S.; Garg, M.; Mandal, S.; Bhowmik, S.; Jayaraman, A.; Soni, R.; Watanabe, K.; Taniguchi, T.; Krishnamurthy, H. R.; Jain, M.; Banerjee, S.; Chandni, U.; Ghosh, A. Breakdown of semiclassical description of thermoelectricity in near-magic angle twisted bilayer graphene. Nature Commun. 2022, 13, 1522. [Google Scholar] [CrossRef] [PubMed]
  46. Klein, D.R.; Xia, L.-Q.; MacNeill, D.; Watanabe, K.; Taniguchi, T.; Jarillo-Herrero, P. Electrical switching of a moiré ferroelectric superconductor. Nature Nanotechnology 2023. [Google Scholar] [CrossRef]
  47. Klebl, L.; Goodwin, Z.A.H.; Mostofi, A.A.; Kennes, D.M.; Lischner, J. Importance of long-ranged electron-electron interactions for the magnetic phase diagram of twisted bilayer graphene. Phys. Rev. B 2021, 103, 195127. [Google Scholar] [CrossRef]
  48. Vahedi, J.; Peters, R.; Missaoui, A.; Honecker, A.; Trambly, L.G. Magnetism of magic-angle twisted bilayer graphene. SciPost Phys. 2021, 11, 083. [Google Scholar] [CrossRef]
  49. Finney, J.; Sharpe, A.L.; Fox, E.J.; Hsueh, C.; Watanabe, K.; Taniguchi, T.; Kastner, M.; Goldhaber-Gordon, D. Unusual magnetotransport in twisted bilayer graphene. PNAS 2022, 119, e2118482119. [Google Scholar] [CrossRef]
  50. Decker, R.; Wang, Y.; Brar, V.W.; Regan, W.; Tsai, H.-Z.; Wu, Q.; Gannett, W.; Zettl, A.; Crommie, M. F. Local Electronic Properties of Graphene on a BN Substrate via Scanning Tunneling Microscopy. Nano Lett. 2011, 11, 2291–2295. [Google Scholar] [CrossRef]
  51. Wang, L.; Zihlmann, S.; Liu, M.-H.; Makk, P.; Watanabe, K.; Taniguchi, T.; Baumgartner, A. Schönenberger, Chr. New Generation of Moiré Superlattices in Doubly Aligned hBN/Graphene/hBN Heterostructures. Nano Lett. 2019 19, 2371–2376; [CrossRef]
  52. Hermann, K. Periodic overlayers and moiré patterns: theoretical studies of geometric properties. J. Phys.: Condens. Matter 2012 24, 314210; [CrossRef]
  53. Moon, P.; Koshino, M. Electronic properties of graphene/hexagonal-boron-nitride moiré superlattice. Phys. Rev. B 2014, 90, 155406. [Google Scholar] [CrossRef]
  54. Anđelković, M.; Milovanovic, S. P.; Covaci, L.; Peeters, F. M. Double moiré with a twist: super-moiré in encapsulated graphene. Nano Lett. 2020, (), 9b04058. [Google Scholar] [CrossRef]
  55. Tang, K.; Qi, W. Moiré-Pattern-Tuned Electronic Structures of van der Waals Heterostructures. Adv. Funct. Mater. 2020, 2002672. [Google Scholar] [CrossRef]
  56. Martin, I. Moiré superconductivity. Annals of Physics 2020, 417, 116118. [Google Scholar] [CrossRef]
  57. Xi Zhang, X.; Tsai, K.-T.; Zhu, Z.; Ren, W.; Luo, Y.; Carr, S.; Luskin, M.; Kaxiras, E.; Wang, K. Correlated Insulating States and Transport Signature of Superconductivity in Twisted Trilayer Graphene Superlattices. Phys. Rev. Lett. 2021, 127, 166802. [Google Scholar] [CrossRef] [PubMed]
  58. Sharpe, A.L. Stacks on stacks on stacks. Nature Mater. 2022, 21, 838–847. [Google Scholar] [CrossRef] [PubMed]
  59. Park, J.M.; Cao, Y.; Xia, L.; Sun, S.; Watanabe, K.; Taniguchi, T.; Jarillo-Herrero, P. Magic-Angle Multilayer Graphene: A Robust Family of Moiré Superconductors. Nature Mater. 2022, 21, 877–883. [Google Scholar] [CrossRef]
  60. Burg, G.W.; Khalaf, E.; Wang, Y.; Watanabe, K.; Taniguchi, T.; Tutuc, E. Emergence of correlations in alternating twist quadrilayer graphene. Nature Mater. 2022, 21, 884–889. [Google Scholar] [CrossRef]
  61. Xie, S.; Faeth, B.D.; Tang, Y.; Li, L.; Gerber, E.; Parzyck, C.T.; Chowdhury, D.; Zhang, Y.-H.; Jozwiak, C.; Bostwick, A.; Rotenberg, E.; Kim, E.-A.; Shan, J.; Mak, K.F.; Shen, K.M. Strong interlayer interactions in bilayer and trilayer moiré superlattices. Sci. Adv. 2022, 8, eabk1911. [Google Scholar] [CrossRef] [PubMed]
  62. Stanev, V. , Oses, C., Kusne, A. G., Rodriguez, E., Paglione, J., Curtarolo, S., Takeuchi, I. Machine learning modeling of superconducting critical temperature. npj Computational Materials 2018, 4, 29. [Google Scholar] [CrossRef]
  63. Matsumoto, K. , Horide, T. An acceleration search method of higher Tc superconductors by a machine learning algorithm. Appl. Phys. Express 2019, 12, 073003. [Google Scholar] [CrossRef]
  64. Zeng, S.; Zhao, Y.; Li,G. ; Wang, R.; Wang, X.; Ni, J. Atom table convolutional neural networks for an accurate prediction of compounds properties. npj Computational Materials 2019, 5, 84. [Google Scholar] [CrossRef]
  65. Hutcheon, M. J.; Alice, M. Shipley, A. M.; Richard J. Needs, R. J. Predicting novel superconducting hydrides using machine learning approaches. Phys. Rev. B 2020, 101, 144505. [Google Scholar] [CrossRef]
  66. Lee, D.; You, D.; Lee, D.; Li, X.; Kim, S. Machine-Learning-Guided Prediction Models of Critical Temperature of Cuprates. J. Phys. Chem. Lett. 2021, 12, 6211–6217. [Google Scholar] [CrossRef]
  67. Stanev, V.; Choudhary, K.; Kusne, A.G.; Paglione, J.; Takeuchi, I. Artificial intelligence for search and discovery of quantum materials. Commun. Mater. 2021, 2, 105. [Google Scholar] [CrossRef]
  68. Roeser, H. P., Hetfleisch, Huber, F. M., Stepper, M., von Schoenermark, M. F., Moritz, A., Nikoghosyan, A. A link between critical transition temperature and the structure of superconducting YBa2Cu3O7-δ. Acta Astronautica 2008 62, 733–736; [CrossRef]
  69. Roeser, H. P., Hetfleisch, Huber, F. M., von Schoenermark, M. F., Stepper, M.; Moritz, A., Nikoghosyan, A. S. Correlation between oxygen excess density and critical temperature in superconducting Bi-2201, Bi-2212 and Bi-2223. Acta Astronautica 2008 63, 1372–1375. [CrossRef]
  70. Roeser, H. P., Huber, F. M., von Schoenermark, M. F., Nikoghosyan, A. S. High temperature superconducting with two doping atoms in La-doped Bi-2201 and Y-doped Bi-2212. Acta Astronautica 2009 65, 489–494. [CrossRef]
  71. Roeser, H. P. , Haslam, D. T., Hetfleisch, F., Lopez , J. S., von Schoenermark, M. F., Stepper, M., Huber, F. M., Nikoghosyan, A. S. Electron transport in nanostructures: A key to high temperature superconductivity? Acta Astronautica 2010, 2010 67, 546–552. [Google Scholar] [CrossRef]
  72. Roeser, H.P.; Bohr, A.; Haslam, D.T.; López, J.S.; Stepper, M.; Nikoghosyan, A.S. Size quantization in high-temperature superconducting cuprates and a link to Einstein’s diffusion law. Acta Astronaut. 2012, 76, 37–41. [Google Scholar] [CrossRef]
  73. Huber, F.; Roeser, H. P. von Schoenermark, M. A correlation between Tc of Fe-based HT Superconductors and the crystal super lattice constants of the doping element positions. J. Phys. Soc. Jpn. 2008 77 Suppl. C, 142-144. [CrossRef]
  74. Koblischka, M. R. Roth, S., Koblischka-Veneva, A., Karwoth, T., Wiederhold, A., Zeng, X. L., Fasoulas, S., and Murakami, M. Relation between Crystal Structure and Transition Temperature of Superconducting Metals and Alloys. Metals 2020 10, 158. [CrossRef]
  75. Koblischka-Veneva, A. Koblischka, M. R. (RE)BCO and the Roeser-Huber formula. Materials 2021 14, 6068. [CrossRef]
  76. Koblischka, M. R. , Koblischka-Veneva, A. Calculation of Tc of superconducting elements with the Roeser-Huber formalism. Metals. [CrossRef]
  77. Ghosh, K. J. B.; Kais, S.; Herschbach, D. R. Dimensional interpolation for metallic hydrogen. Phys. Chem. Chem. Phys. 2021, 23, 7841–7848. [Google Scholar] [CrossRef]
  78. Mathew, S. Aben Regi Abraham; Chintalapati, S.; Sarkar, S.; Joseph, B.; Venkatesan, T. Temperature Dependent Structural Evolution of WSe2: A Synchrotron X-ray Diffraction Study. Condens. Matter 2020 5, 76. [CrossRef]
  79. Talantsev, E.F. Quantifying the Charge Carrier Interaction in Metallic Twisted Bilayer Graphene Superlattices. Nanomaterials 2021, 11, 1306. [Google Scholar] [CrossRef] [PubMed]
  80. W. Meissner, and R. Ochsenfeld. Ein neuer Effekt bei Eintritt der Supraleitfähigkeit. Naturwissenschaften 21, 787-788 (1933).
  81. W. Buckel, and R. Kleiner, Supraleitung. Grundlagen und Anwendungen, 7th edition, Wiley-VCH, Weinheim, 2013.
  82. Koblischka, M. R.; and Wijngaarden, R. J. Magneto-optical investigations of superconductors. Supercond. Sci. Technol. 1995, 8, 199–213. [Google Scholar] [CrossRef]
  83. Bending, S.J. Local magnetic probes of superconductors. Adv. Phys. 1999, 48, 449–535. [Google Scholar] [CrossRef]
  84. Koblischka, M.R.; Hartmann, U. Recent advances in magnetic force microscopy. Ultramicroscopy 2003, 97, 103–112. [Google Scholar] [CrossRef] [PubMed]
  85. Oral, A.; Bending, S.J.; Henini, M. Real-time scanning Hall probe microscopy. Appl. Phys. Lett. 1996, 69(9), 1324–1326. [Google Scholar] [CrossRef]
  86. Sonusen, S.; Karci, O.; Dede, M.; Aksoy, S.; Oral, A. Single layer graphene Hall sensors for scanning Hall probe microscopy (SHPM) in 3–300 K temperature range. Appl. Surf. Sci. 2014, 308, 414–418. [Google Scholar] [CrossRef]
  87. Anahory, Y.; Naren, H. R.; Lachman, E. O.; Buhbut Sinai, S.; Uri, A.; Embon, L.; Yaakobi, E.; Myasoedov, Y.; Huber, M. E.; Klajn, R.; Zeldov, E. SQUID-on-tip with single-electron spin sensitivity for high-field and ultra-low temperature nanomagnetic imaging. Nanoscale 2020, 12, 3174. [Google Scholar] [CrossRef] [PubMed]
  88. Levine, E.V.; Turner, M.J.; Kehayias, P.; Hart, C.A.; Langellier, N.; Trubko, R.; Glenn, D. R.; Fu, R.R.; Walsworth, R.L. Principles and techniques of the quantum diamond microscope. Nanophotonics 2019, 8(11), 1945–1973. [Google Scholar] [CrossRef]
  89. Hong, S.; Grinolds, M.S.; Pham, L.M.; Le Sage, D.; Luan, L.; Walsworth, R.L.; Yacoby, A. Nanoscale magnetometry with NV centers in diamond. MRS Bull. 2013, 38, 155–161. [Google Scholar] [CrossRef]
  90. Wenzhao Li, W.; Reichhardt, C. J. O.; Jankó, B.; Reichhardt, C. Vortex dynamics, pinning, and angle-dependent motion on moiré patterns. Phys. Rev. B 2021, 104, 024504. [Google Scholar] [CrossRef]
  91. Gorter, C. J.; Casimir, H. On supraconductivity I. Physica 1934, 1934 1, 306–320. [Google Scholar] [CrossRef]
  92. Poole, C. P. Jr.; Creswick, R. J.; Farach, H. A.; Prozorov, R. Superconductivity. (Elsevier, UK, Second edition, 2007).
  93. Talantsev, E. F.; Crump, W. P.; Island, J. O.; Xing, Y.; Sun, Y.; Wang, J.; Tallon, J. L. On the origin of critical temperature enhancement in atomically thin superconductors. 2D Materials 2017, 4, 025072. [Google Scholar] [CrossRef]
  94. Pal, B. Pal, B. ; Joshi, B. P. ; Chakraborti, H.; Jain, A. K. ; Barick, B. K. search by orcid ; Ghosh, K. search by orcid ; Bhunia, S. ; Laha, A.; Dhar, S. ; Gupta, K. Das Experimental evidence of a very thin superconducting layer in epitaxial indium nitride. Supercond. Sci. Technol. 32, 015009. [CrossRef]
  95. Helfand, E.; Werthamer, N. R. Temperature and purity dependence of the superconducting critical field, Hc2. II. Phys. Rev. 1966, 147, 288–294. [Google Scholar] [CrossRef]
  96. Werthamer, N. R. , Helfand, E.; Hohenberg, P. C. Temperature and purity dependence of the superconducting critical field, Hc2. III. Electron spin and spin-orbit effects. Phys. Rev. 1966, 147, 295–302. [Google Scholar] [CrossRef]
  97. Baumgartner, T.; Eisterer, M.; Weber, H. W.; Flükiger, R.; Scheuerlein, C.; Bottura, L. Effects of neutron irradiation on pinning force scaling in state-of-the-art Nb3Sn wires. Supercond. Sci. Technol. 2014, 27, 015005. [Google Scholar] [CrossRef]
  98. Jones, C. K. , Hulm, J. K.; Chandrasekhar, B. S. Upper critical field of solid solution alloys of the transition elements. Rev. Mod. Phys. 1964, 36, 74–76. [Google Scholar] [CrossRef]
  99. Talantsev, E. F. DC self-field critical current in superconductor/Dirac-cone material/superconductor junctions. Nanomaterials 2019, 9, 1554. [Google Scholar] [CrossRef]
  100. Rohlf, J. W.: Modern Physics from α to Z0. Wiley, New York (1994).
  101. Mori, N.; Wilson, J. A.; Ozaki, H. Fluctuation conductivity in the 110-K phase of Ni-doped (Bi,Pb)-Sr-Ca-Cu-O superconductors. Phys. Rev. B 1992, 1992 45, 10633–10638. [Google Scholar] [CrossRef]
  102. Larkin, A.; Varlamov, A. Fluctuation Phenomena in Superconductors. Oxford University Press, Oxford, U.K., 2005.
  103. Koblischka, M. R.; Koblischka-Veneva, A.; Zeng, X. L.; Hannachi, E.; Slimani, Y. Microstructure and Fluctuation-Induced Conductivity Analysis of Bi2Sr2CaCu2O8+δ (Bi-2212) Nanowire Fabrics. Crystals 2020, 10, 986. [Google Scholar] [CrossRef]
  104. Uemura, Y. J.; Le, L. P.; Luke, G. M.; Sternlieb, B. J.; Wu, W. D.; Brewer, J. H.; Riseman, T. M.; Seaman, C. L.; Maple, M. B.; Ishikawa, M.; Hinks, D. G.; Jorgensen, J. D.; Saito, G.; Yamochi, H. Basic Similarities among Cuprate, Bismuthate, Organic, Chevrel-Phase, and Heavy-Fermion Superconductors Shown by Penetration Depth Measurements. Phys. Rev. Lett. 1991, 1991 66, 2665–2668. [Google Scholar] [CrossRef]
  105. Uemura, Y. J. Condensation, excitation, pairing, and superfluid density in high-Tc superconductors: the magnetic resonance mode as a roton analogue and a possible spin-mediated pairing. J. Phys.: Condens. Matter 2004, 16, S4515–S4540. [Google Scholar] [CrossRef]
  106. Harshman, D. R.; Fiory, A. T. High-Tc Superconductivity Originating from Interlayer Coulomb Coupling in Gate-Charged Twisted Bilayer Graphene Moiré Superlattices. J. Supercond. 2020, 33, 367–378. [Google Scholar] [CrossRef]
  107. Xiao, Y.; Liu, J.; Fu, L. Moiré is More: Access to New Properties of Two-Dimensional Layered Materials. Matter 2020, 3, 1142–1161. [Google Scholar] [CrossRef]
  108. Boochani, A.; Jamal, M.; Shahrokhi, M.; Nowrozi, B.; Gholivand, M.B.; Khodadadi, J.; Amiri, M.; Asshabia, M.; Yaria, A. Ti2VGe Heuslerene: theoretical prediction of a novel 2D material. J. Mater. Chem. C 2019, 7, 13559. [Google Scholar] [CrossRef]
  109. Wang, T.; Noah, F.; Yuan, Q.; Fu, L. Moiré Surface States and Enhanced Superconductivity in Topological Insulators. Phys. Rev. X 2021, 11, 021024. [Google Scholar] [CrossRef]
  110. Kezilebieke, S.; Vano, V.; Huda, Md N.; Aapro, M.; Ganguli, S.C.; Liljeroth, P.; Lado, J.L. Moiré-Enabled Topological Superconductivity. Nano Lett. 2022, 22, 328–333. [CrossRef]
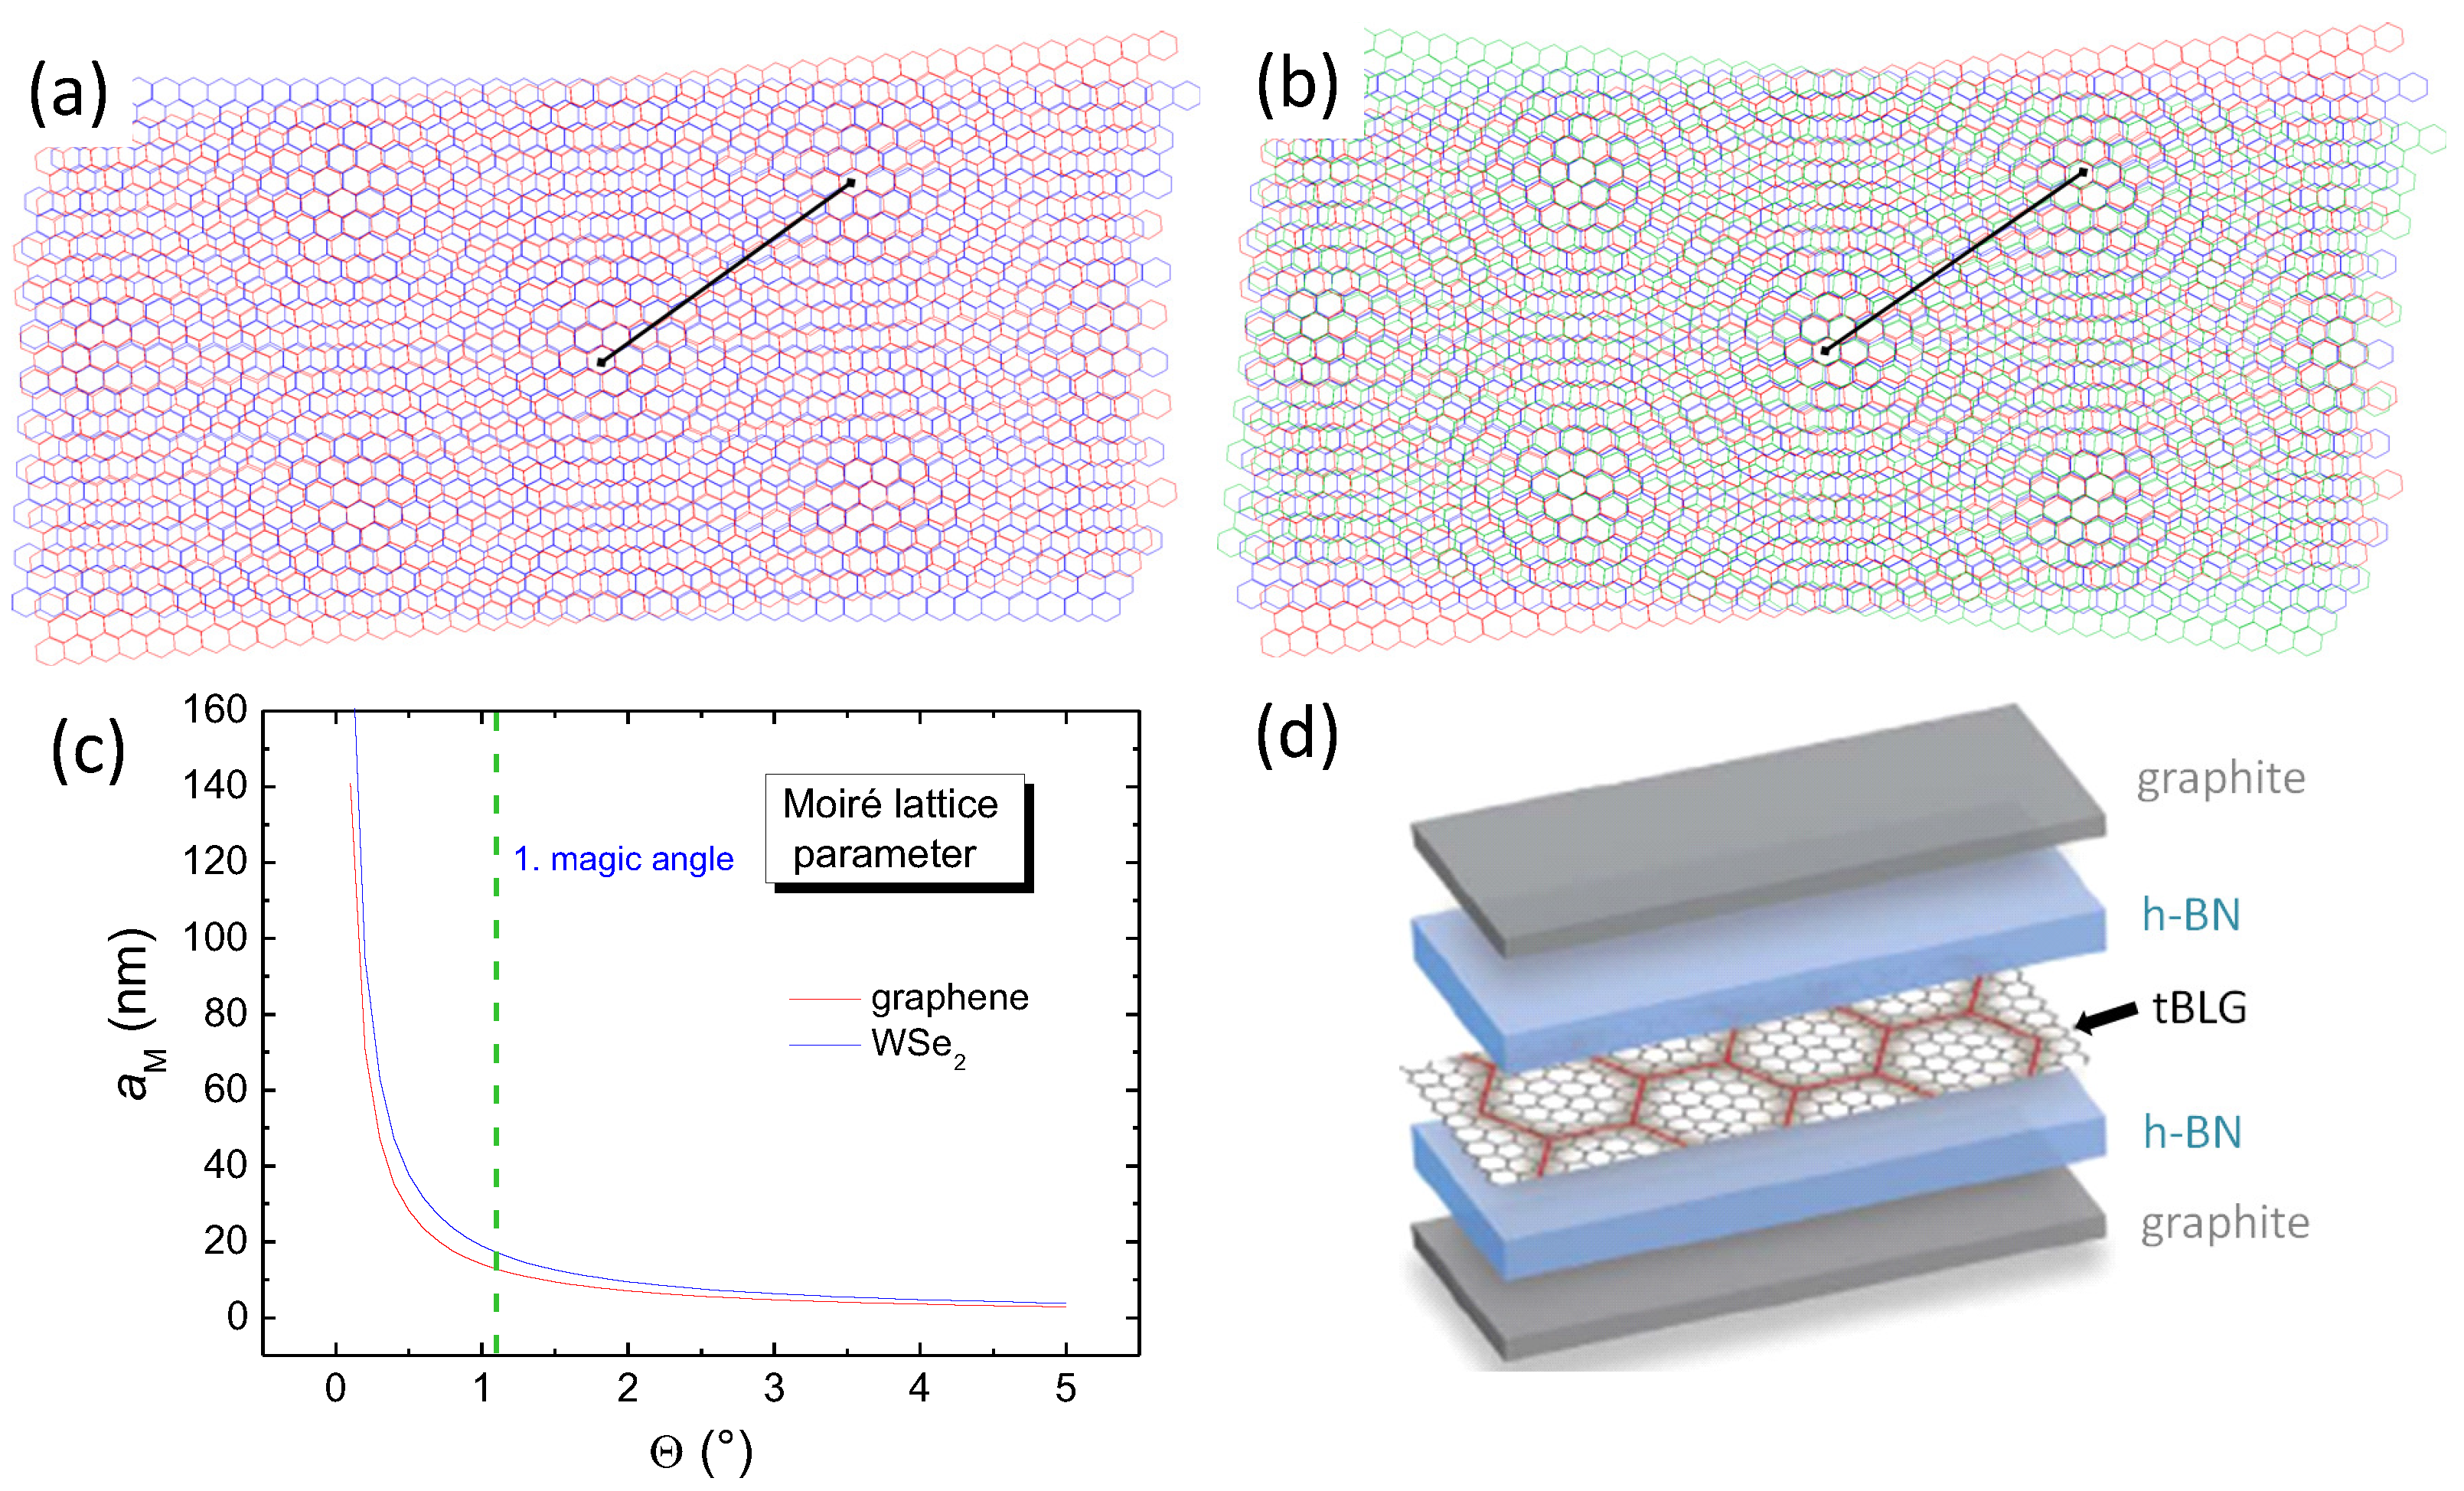
Figure 1. (a) Moiré pattern of two graphene layers (red, blue) tilted by 5. This value was chosen for clarity. The black line indicates the resulting Moiré lattice parameter, a M . (b) Moiré pattern of a tri-layer graphene system (red, blue, green) with the top and bottom layer tilted by ±5 with respect to the center layer. (c) Moiré lattice parameter, a M , of graphene as function of the tilt angle, Θ . The first magic angle, 1.1, is marked by a dashed green line (■■■■■). (d) Schematic view of the various layers in a device for resistance measurement. Figure adapted from Ref. [3].
Preprints 68594 g001
Figure 2. (a) Longitudinal resistance, R x x , being in the k Ω -regime, measured by four-probe method in two devices M1 and M2 with twist angles of Θ = 1.16 and Θ = 1.05, respectively. The inset shows an optical image of device M1, including the main ‘Hall’ bar (dark brown), the electrical contacts (gold), the back gate (light green) and the SiO2/Si substrate (dark grey). Reproduced with permission from Ref. [2]. (b) Longitudinal resistance at optimal doping of the superconducting domes as a function of temperature. The resistance is normalized to its value at 8 K. Note that data points for n = −7.5 × 1011 cm−2 are overlaid by the data points for n = 5 × 1011 cm−2, as both curves follow a very similar line. Reproduced with permission from Ref. [6].
Preprints 68594 g002
Figure 3. (a). Four-probe resistance measurement on sample M1 ( Θ = 1.16). The longitudinal resistance, R x x , is measured at given charge carrier densities versus temperature, i.e., along the dashed-green lines and R x x is represented via the color code, given above the diagram. Two superconducting domes (dark blue/black) are observed next to the half-filling state, which is labelled ‘Mott’ and centered around n s / 2 = −1.58 × 1012 cm−2. The remaining regions in the diagram are labelled as ‘metal’ owing to the metallic-like temperature dependence of R x x . The highest critical temperature observed in device M1 is T c = 0.5 K (at 50% of the normal-state resistance). (b), Same measurements as in (a), but for device M2, showing two asymmetric and overlapping domes. The highest critical temperature in this device is T c = 1.7 K. (c) Colour plot of longitudinal resistance versus charge carrier density and temperature of Ref. [6] on a tBLG sample with α = 1.1 (see also Table 1 below), showing different phases including metal, band insulator (BI), correlated state (CS) and superconducting state (SC). The boundaries of the superconducting domes – indicated by yellow lines – are defined by 50% resistance values relative to the normal state. Note that the transition from the metal to the superconducting state is not sharp at some carrier densities, which renders the proper determination of the value of T c difficult.
Preprints 68594 g003
Figure 4. Phase diagrams on tBLG revealing the influence of the h-BN layer thickness. The diagrams are presenting details of the 2D maps around a superconducting dome in each device [10] D1–D5. The white dashed lines show ν = 2 . (a) Device 1 ( Θ = 1.08, d h BN = 68 nm, ). (b) Device 2 ( Θ = 1.09, d h BN = 6.7 nm, ). (c) Device 3 ( Θ = 1.04, d h BN = 38 nm, ). The superconducting phase is divided by a weak resistive state around ν = 2 δ , which does not match the density of the state at ν = 2 , being estimated from the strong resistive states at ν = 4 , 0 , 2 , 4 . (d) Device 4 ( Θ = 1.18, d h BN = 7.5 nm, ). (e) Device 5 ( Θ = 1.12, d h BN = 45 nm, ). (f) 3D-bar diagram showing the highest values of T c recorded in [10] as function of d and α . It is obvious from images (a), (c), (e) and (f) that thicker h-BN layers stabilize a strong and robust superconducting state with the highest T c value of 3.98 K recorded in (e). Reproduced with permission from Ref. [10].
Preprints 68594 g004
Figure 5. The effect of applying external magnetic fields on the superconducting state of tBLG. (a) Longitudinal resistance plotted against temperature at various out-of-plane magnetic fields, showing that normal levels of resistance are restored at magnetic fields larger than 300 mT. (b) 2D map of longitudinal resistance as a function of B and total charge carrier density n taken at the base temperature 16 mK, demonstrating the effect of perpendicular magnetic field B on the SC pockets observed. (c) Fraunhofer interference patterns measured in the superconducting state, charge carrier density 1.11 ×1012 cm2 . Figures a–c: Reproduced with permission from Lu et al. [6]. (d) Analysis of the superconducting phase diagram of tBLG with Θ 1.1. The upper critical field, B c 2 , (16 mK), and deduced ξ a b (16 mK) using Equation (1) of Ref. [11]. (e) Deduced λ a b (16 mK) and κ c for four doping states for which I c (self-field, 16 mK) was reported by Lu et al. (f) Cooper pairs surface density, n s , C , surf , and the ratio of n s , C , surf / n n for four doping states for which I c (self-field, 16 mK) was reported by Lu et al. [6]. Figures d–f: taken with permission from Ref. [11].
Preprints 68594 g005
Figure 6. Experimental data for the superconducting transition temperature, T c , with the respective error bars. Data taken from Saito et al. (Ref. [10]), together with data of Cao et al. [2], Yankowitz et al. [3], Lu et al. [6], Liu et al. [8], Codecido et al. [7], Stepanov et al. [9] and Arora et al. [14].
Preprints 68594 g006
Figure 7. Uemura plot showing the position of tBLG among other superconducting materials. Figure reproduced from Talantsev et al. [11].
Preprints 68594 g007
Figure 8. The correction factor η as function of temperature. Included here are the tBLG data of Refs. [2,3,6,7,8,9,10], the trilayer graphene (TLG) of Hao et al. (,12]), the tBLG/WSe2 of Arora et al. (,14]) and the 2 WSe2 data of An et al. (■,15]). The violet line (Preprints 68594 i001) is a fit to all data using Equation (9).
Preprints 68594 g008
Figure 9. Roeser-Huber plot including the data of the various tBLG samples () and WSe2 () and the previously calculated data for several HTSc and metals/alloys (■). The straight red-dotted line follows the equation for a particle in a box [100] and the blue dashed line gives the linear fit to the data (see text).
Preprints 68594 g009
Table 1. Table giving the experimental data of T c , the angles and the resulting characteristic length, x, the calculated energy Δ ( 0 ) and T c ( calc ) using the Roeser-Huber equation (eq. 3 with n = 1 and M L = 2 m e . The energy Δ ( 0 ) * and the transition temperature T c * ( calc ) are calculated using the correction factor η . Furthermore, the sample names of the original publication and the references are given. The T c marked by † is the value claimed by the authors from a two-step transition. Our T c determined from their data is T c = 0.32 K. ‡ This value gives the zero resistance. Stars (*) mark the WSe2 T c -data from the experiments of An et al. [15], where the T c values given are determined by us. () as given by the authors for R = 0 Ω . (**) indicates T c determined via a 50% normal-state resistance criterion.
type tilt angle α T c ( exp ) x Δ ( 0 ) T c ( calc ) Δ ( 0 ) * T c * ( calc ) η comment/ Ref.
[] [K] [nm] [10−22 J] [K] [10−22 J] [K] sample name
tBLG 1.1 12.81 1.835 4.23 n 0 = 1 magic angle
1.1 12.81 2.912 6.714 n 0 = 2
tBLG 1.16 0.47 12.15 2.040 4.704 0.204 0.470 20 M1 Cao et al.
1.05 1.7 13.42 1.671 3.854 0.740 1.705 4.52 M2 Cao et al.
1.14 0.6 12.36 1.971 4.542 0.197 0.454 20 D1 Yankowitz et al.
1.27  3 11.10 2.446 5.638 1.304 3.007 3.75 D2 Yankowitz et al.
(1.33 GPa)
1.08 2.27 13.05 1.768 4.877 0.982 2.265 3.6 device 1 Saito et al.
1.09 2.395 12.93 1.801 4.153 1.044 2.408 3.45 device 2 Saito et al.
1.04 1.29 13.55 1.639 3.781 0.561 1.295 5.84 device 3 Saito et al.
1.12 3.98 12.58 1.902 4.385 2.606 3.986 2.2 device 5 Saito et al.
1.18 0.6 11.94 2.111 4.867 1.792 0.601 16.2 device 4 Saito et al.
1.1 0.25 12.81 1.835 4.23 1.287 2.968 2.85 Lu et al.
0.93 <0.5 † 15.16 1.311 3.024 0.139 0.32 18.9 smallest Θ Codecido et al.
1.26 <3.5 ‡ 11.19 2.407 5.550 1.376 3.171 3.5 Liu et al.
1.15 0.92 12.26 2.005 4.632 0.401 0.925 10 D1 Stepanov et al.
1.04 0.4 13.55 1.640 3.781 0.786 0.398 19 D2 Stepanov et al.
TLG 1.56 2.7 9.035 3.69 8.507 1.19 2.784 6.2 Hao et al.
tBLG+WSe2 0.97 0.8 14.53 1.43 3.289 0.348 0.802 8.2 D1 Arora et al.
0.79 0.52 12.73 0.946 2.182 0.225 0.520 8.4 D3
bi-layer 1 3.32* 18.89 0.844 1.95 ( n 0 = 1) E7,  -14.4 V An et al.
WSe2 1  3 18.89 1.340 3.09 ( n 0 = 2)   –,– 
1  3 20 0.753 1.74 ( n 0 = 1)   –,– 
1  3 20 1.195 2.76 ( n 0 = 2)   –,– 
2 4.53* 9.45 3.376 7.78 ( n 0 = 1) 1.963 4.53 3.44 F2,  -6.65 V
2 6.1* 9.45 3.376 7.78 ( n 0 = 1) 2.648 6.11 2.55 F2,  -6.92 V
4 6 (50%)** 4.72 13.5 31.1 ( n 0 = 1) D11,  -17.9 V
Disclaimer/Publisher’s Note: The statements, opinions and data contained in all publications are solely those of the individual author(s) and contributor(s) and not of MDPI and/or the editor(s). MDPI and/or the editor(s) disclaim responsibility for any injury to people or property resulting from any ideas, methods, instructions or products referred to in the content.
Copyright: This open access article is published under a Creative Commons CC BY 4.0 license, which permit the free download, distribution, and reuse, provided that the author and preprint are cited in any reuse.
Prerpints.org logo

Preprints.org is a free preprint server supported by MDPI in Basel, Switzerland.

Subscribe

© 2024 MDPI (Basel, Switzerland) unless otherwise stated