1. Introduction
The Schwarzschild metric describes two spacetimes separated by an event horizon. The spacetime outside this horizon is well understood and its predictions have been successfully verified over the past century. The spacetime inside the horizon, commonly treated as the spacetime inside a black hole, has been believed to be unobservable to anyone outside of a black hole since light is not able to cross outside the horizon. As such, it is believed that the predictions associated with this spacetime are untestable.
When moving from the exterior region to the interior, the signature of the metric is reversed such that the timelike coordinate of the external region becomes spacelike in the interior region and likewise for the spacelike coordinate. This means that the radial spacelike coordinate of the exterior region becomes a timelike radius in the interior. This timelike radius has been interpreted as a time-dependant scale factor on the angular term of the metric in the interior. But this interpretation leads to the belief that at the curvature singularity, an observer is infinitely stretched in one direction, and infinitely compressed in all other directions. This is referred to as ’spaghettification’.
However, as is described in this paper, this interpretation of the timelike radius is shown to be incorrect. If one draws a set of spacelike concentric circles around an arbitrary point in the internal metric, then this interpretation suggests that every one of those circles will have the same proper circumference because they all have an angle of but since the radius r in the metric is a time, then all the circles at a given time will have the same radius and therefore the same circumference.
To address this problem, we examine in detail what a timelike radius really means. It is demonstrated that the timelike radius in the interior region can be thought of as an imaginary radius. The angular term of the metric does not describe shrinking spheres, but rather it describes the precession of the reference frame about an axis for a frame inside a shell infinitely far away in space but located in the finite past of the frame. This leads to the conclusion that the interior metric describes spherically symmetric voids in the Universe (the voids in the cosmic web) which expand in volume as time passes. It is conjectured that the expansion of these voids is the true source of Dark Energy in the Universe. This model is compared to cosmological data and the model and it is found that this model fits the data just as well as without the need for a cosmological constant.
In the final sections of the paper, a coordinate chart is developed which allows us to visualize the movement from a spacetime region near a spherical mass (the exterior spacetime) into one of these voids (the interior spacetime) without crossing an event horizon. In the course of the analysis, we find that the Schwarzschild metric actually describes both a Universe and mirror Antiverse and that the event horizon is where these two spaces meet. With both the Universe and Antiverse mapped, we show how electric charge can be understood as a particle’s intrinsic spin about an imaginary radius (time) and quantum spin is the particle’s intrinsic spin about a real radius (space). Furthermore, we find that the timelike and spacelike radii in the Antiverse are negative relative to the Univeerse, such that the Antiverse contains all the mirror antimatter of our Universe.
2. Analysis of the Schwarzschild Geometry
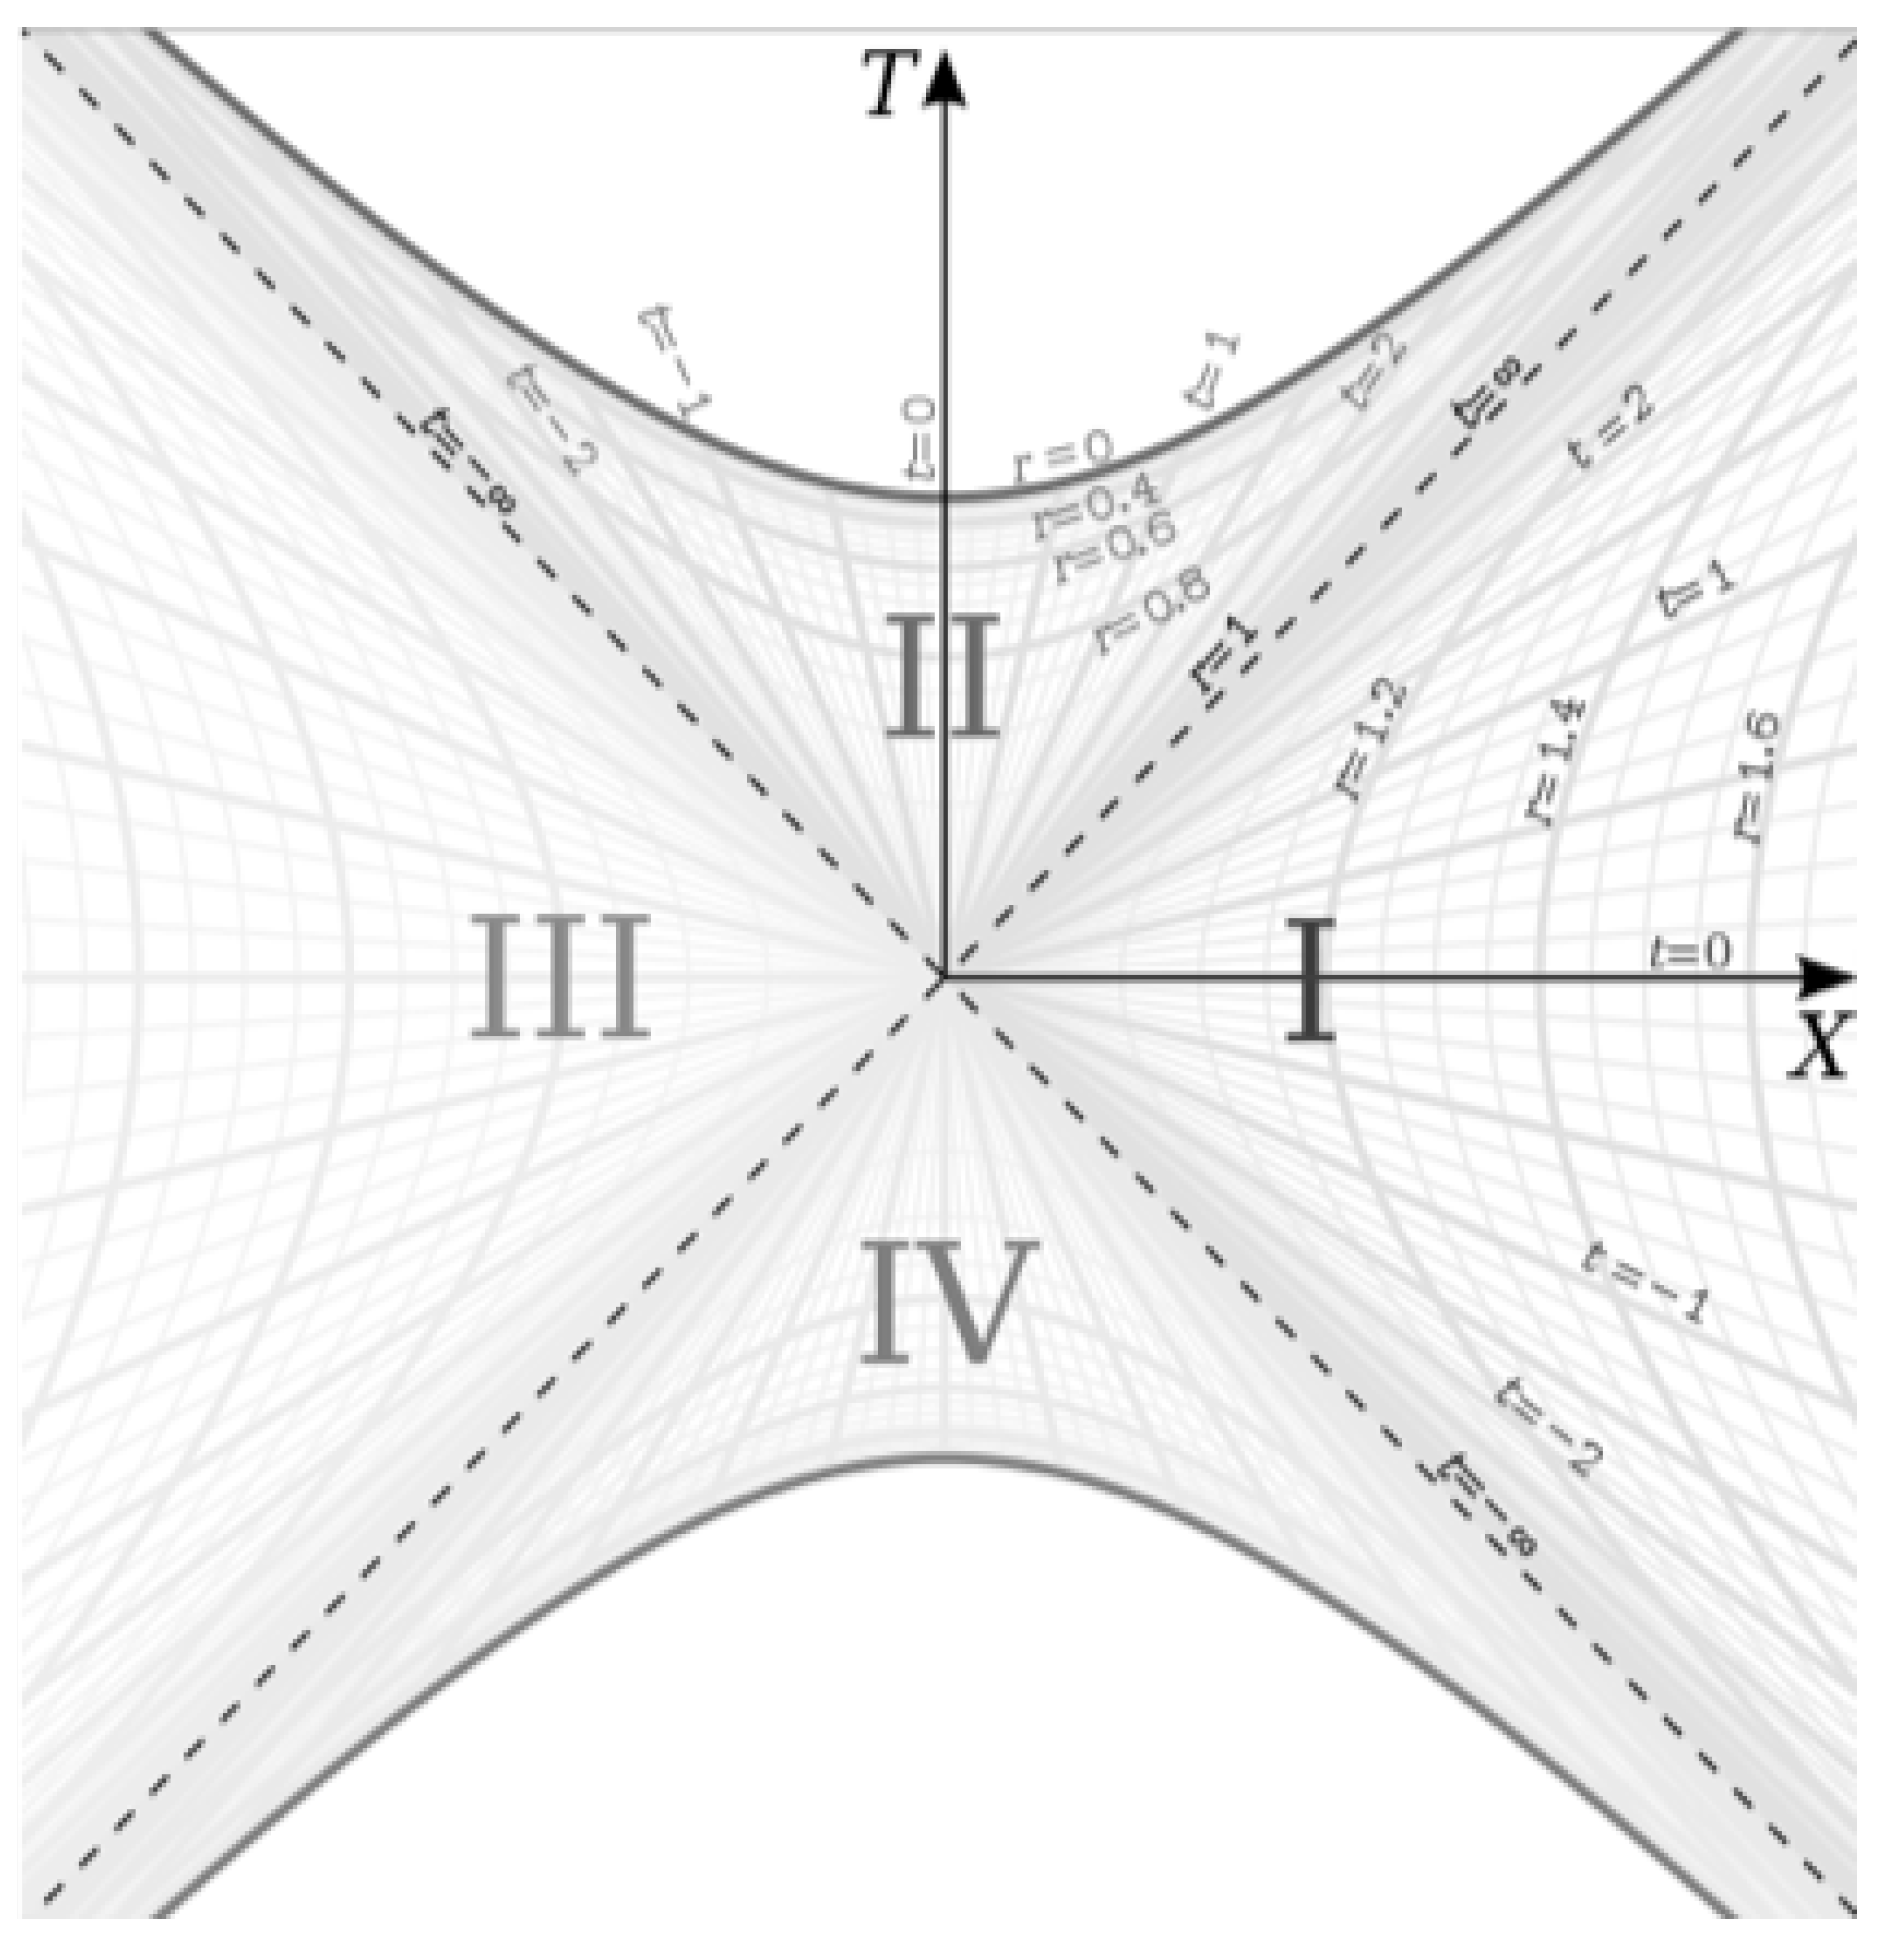
The internal region of the Schwarzschild metric (Region II in
Figure 1) is described with:
Equation
1 is the internal metric and for the rest of the paper it is important to remember that when discussing the internal metric,
t is the spacelike coordinate and r is the timelike coordinate.
The internal metric is currently believed to describe the interior of a Black Hole. But consider the case of a spherically-symmetric vacuum surrounded by a spherically-symmetrically distributed infinite amount of mass. This would be a spacetime surrounded by a shell with an infinite Schwarzschild radius (because the mass of the shell is infinite). Since this is a spherically symmetric vacuum, it must be described by the Schwarzschild metric. This is also the description of spherically-symmetric vacuua in our Universe, since the surrounding Universe is effectively a shell of infinite mass (every region of the Universe is light-like connected to the Big Bang in all directions, which acts as a shell of infinite mass). Therefore, the internal metric describes the spacetime of the pockets of empty space in the Universe. The constant u in the internal metric is a time constant whose value in years will be later derived from cosmological data. Choosing a value for this constant amounts to choosing the units of time for analysis.
Figure 1 shows the Kruskal-Szekeres coordinate chart for both the internal and external metrics where light travels on 45 degree lines on the chart [
1]:
The coordinate definitions and metric in Kruskal-Szekeres coordinates for the internal metric are given below (derivation of the coordinate definitions and metric can be found in reference [
2] where
and
).
With the full metric in Kruskal-Szekeres coordinates given by:
On this diagram, the
lines represent the infinitely dense shells in both scenarios. We can see that at
(the ’Horizon"), both metrics are the same. The origin
location/time describes a point in space of infinite temporal density for the external solution and a point in time with infinite spatial density for the internal solution. The
lines are light-like geodesics. The external region is shown in quadrant I of
Figure 1 and the internal region is in quadrant II. Quadrants III and IV will be examined in
Section 9. We can also see in
Figure 1 that for the internal metric, the horizon is located at
, meaning the Schwarzschild radius and therefore mass of the shell is infinite (because
t is the spacelike coordinate). Thus, it is clear from the geometry that the source masses of the Schwarzschild metric are not concentrated at
(which is not anywhere mathematically implied or demanded in the derivation of the Schwarzschild metric), but rather at the event horizon itself.
So the internal solution describes a spherically symmetric vacuum surrounded by a horizon which, from the perspective of an observer at some r between the horizon and , surrounds the vacuum infinitely far away in space and at some finite time in the past. And from the perspective of that observer, this horizon, which looks like a surrounding sphere, is a time where space is infinitely dense. A spacetime fitting this description would be any empty space in the Universe whose surrounding mass is spherically symmetric. Voids in the cosmic web would be an example of such a spacetime, and the horizon of the metric in this case would be the Big Bang, which is an event at some finite time in the past that surrounds all points in the Universe and has an infinite spatial density. And an observer in the present Universe can never reach the Big Bang, no matter how far they travel through space, which is in alignment with the fact that the shell surface of the metric (), from the perspective of a present observer, is infinitely far away from them in space.
Therefore, the Big Bang looks like an infinitely dense shell (viewed from the inside) at times later than the Big Bang, but looks like an infinitely dense point (because the proper distance goes to zero regardless of coordinate distance at that time) in the frame of an observer in the Universe as the Universe approaches
(we will show that the scale factor at
is 0 in
Section 3.1).
Now we must show that the space in the internal metric is isotropic and homogeneous. The equation for a 2D hyperboloid surface embedded in three dimensions is given by:
For our purposes, we will be considering the special case where
, which gives the one and two sheeted hyperboloids of revolution. Next, we note the following relationship with regards to the Kruskal-Szekeres coordinates:
Equation 5 appears to be only for one dimension of space, but if we think of
X as a radius, then it can describe a 3D isotropic hyperboloid. So comparing to Equation 4, if we set
and
where
R is a radius of a circle in this example, we obtain an equation that matches the form of Equation
4 where :
Equation
6 describes 2D hyperboloid surfaces for a given
r where the external metric has positive
and the internal metric has negative
. This means that the external metric describes a 1-sheet hyperboloid while the internal metric describes a 2-sheeted hyperboloid. Note that
Figure 1 is for constant
and
, meaning there exists identical diagrams for each 3D spherical direction.
We will for now focus on regions I and II from
Figure 1, where region I captures the external metric and region II captures the internal metric. If we choose some constant value of
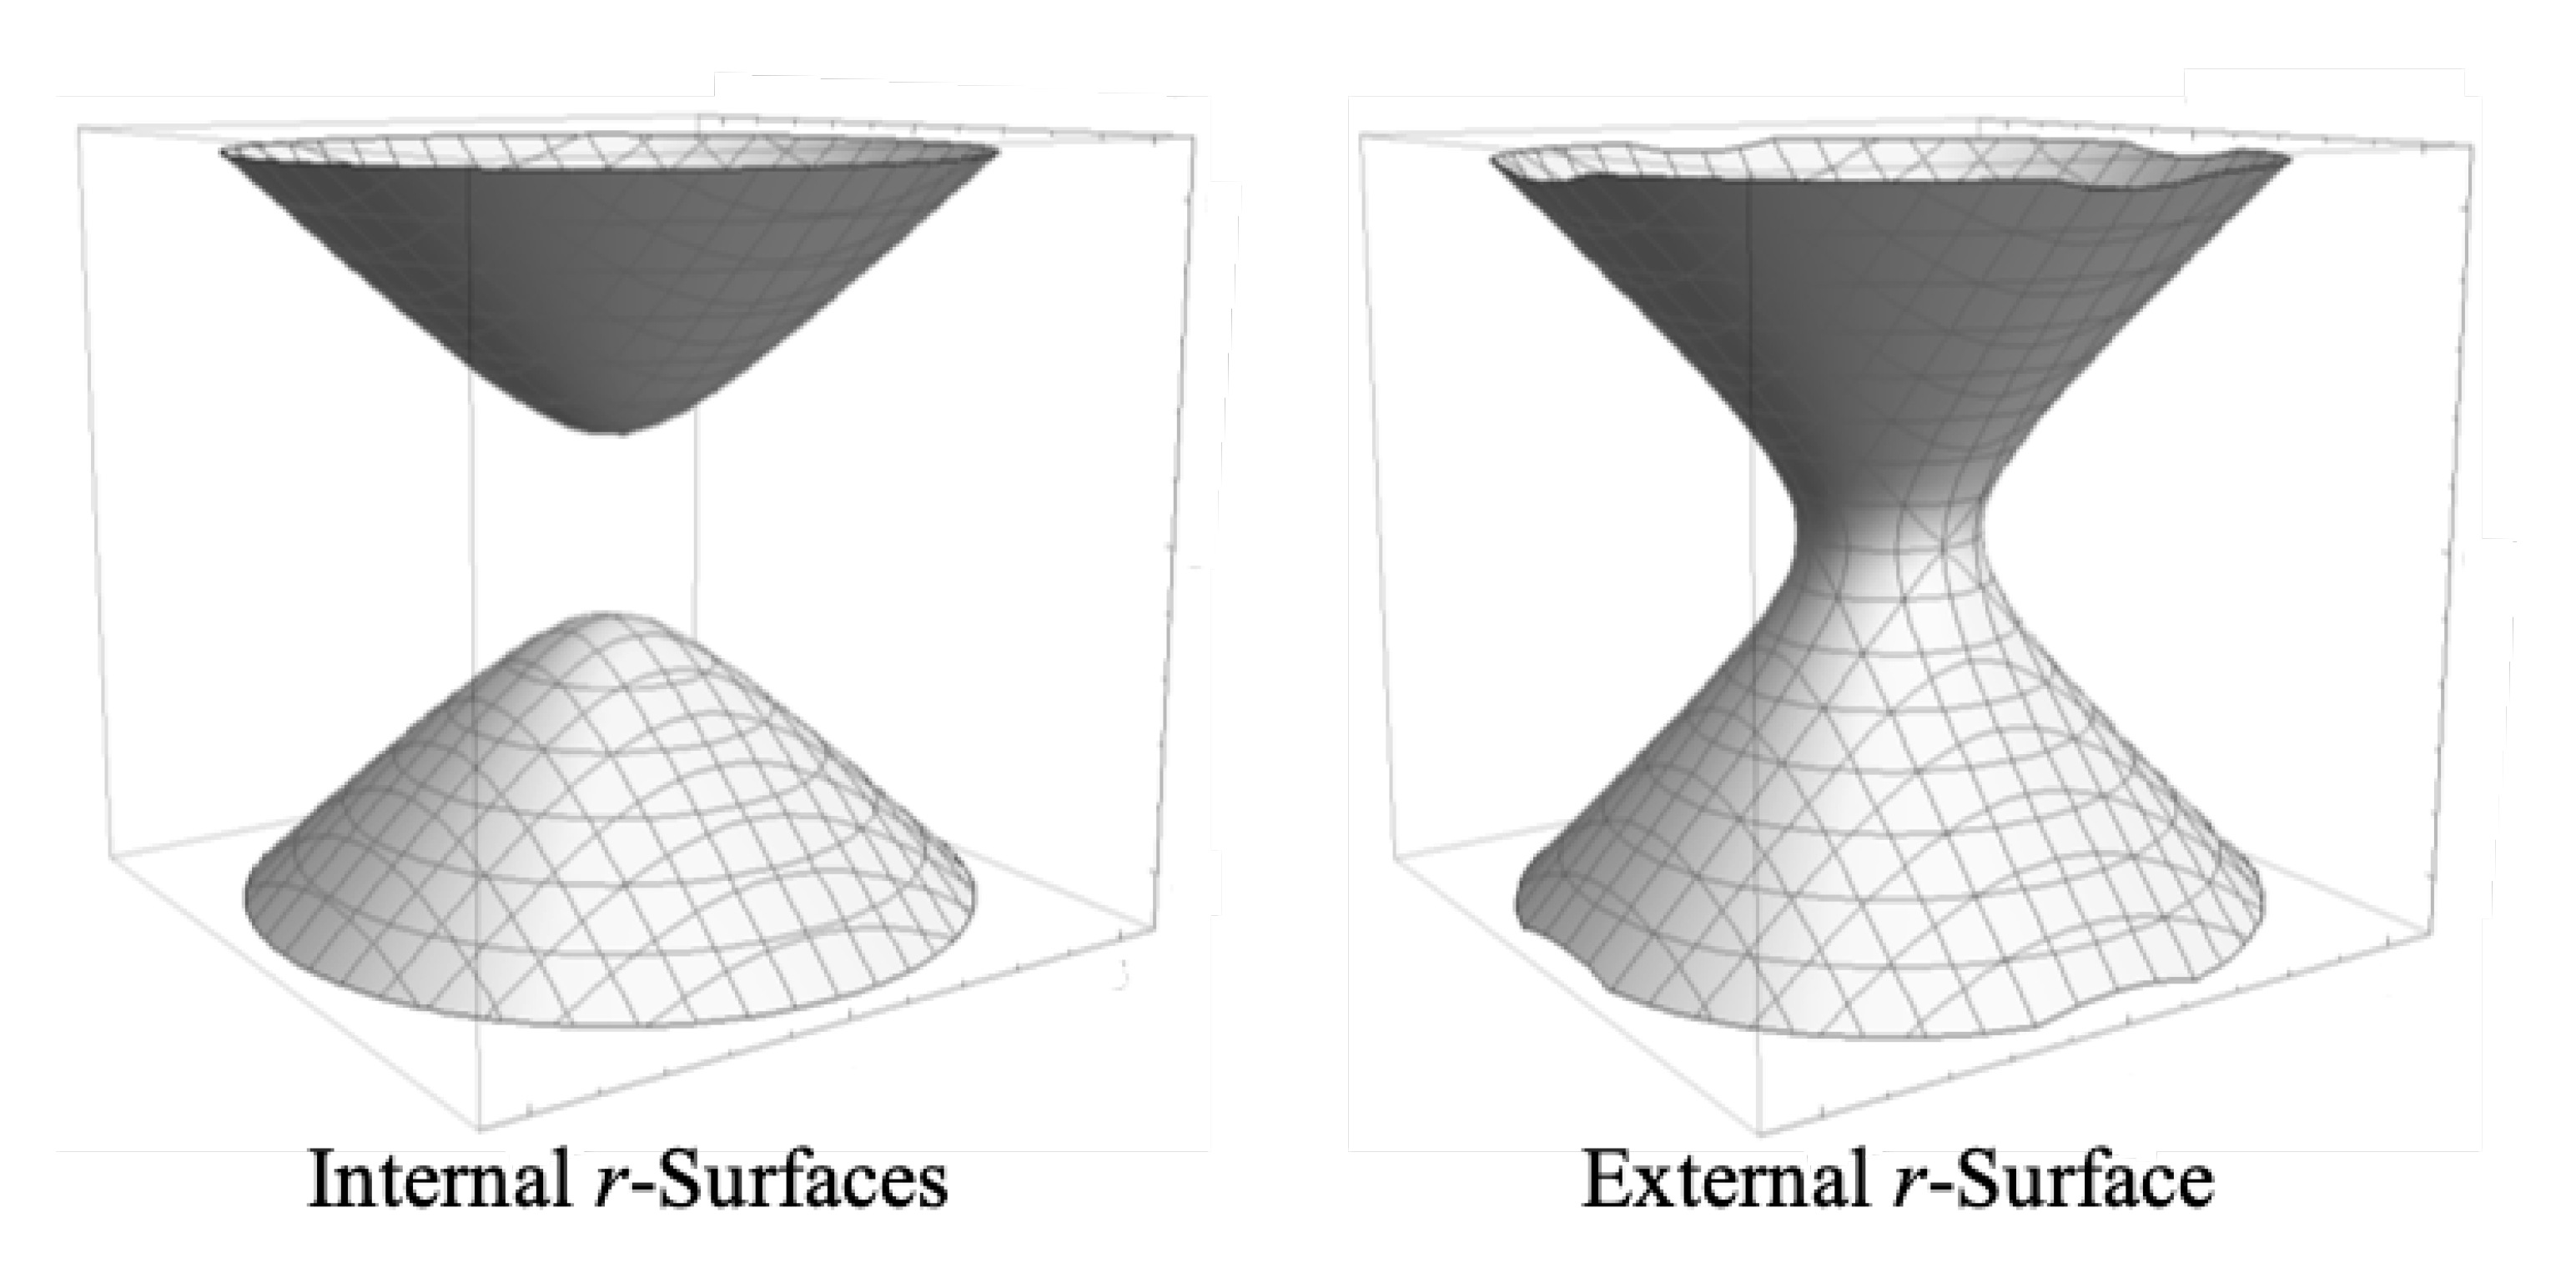
in each region and plot Equation
6 for each region, we get the surfaces shown in
Figure 2.
In the internal case where we have two separate sheets, we will only focus on the top sheet for now. The meaning of the bottom sheet will be discussed in
Section 9. In the external metric, the sheet represents an equatorial circle of space around the central body at all times. This circle is on a plane with a normal at the center and pointed vertically in
Figure 2. If we then consider circles on all planes whose normals are at different angles relative to the normal of the plane we are currently visualizing, we get a 2D spherical surface representing the space surrounding the central body at constant
r.
Light cones in
Figure 2 are oriented vertically and light travels on 45 degree lines. If we consider the right side of
Figure 2, representing the external metric, choose any point on the surface and project a past and future light cone out of that point (this will just be a vertical cone centered at that point). We see that the external metric is homogeneous in time (along the surface of the sheet) and inhomogenous in space (directions perpendicular to the surface), though still isotropic about the center line.
Now consider the top sheet on the left side of
Figure 2 representing the internal metric. Choose any point on the surface and project a past and future light cone from that point. We can move that point to the apex of the surface (at
) by hyperbolically rotating the spacetime until the point is at the apex. We can do this without changing anything in the spacetime because the hyperbolic rotation is a translation in
t, and
is Killing vector of the manifold. When the point is rotated to the apex, we see then that the light cone is symmetric relative to the surface left and right and into and out of the page. This symmetry means the spacelike foliations of the internal metric are isotropic and homogeneous.
This can be extended to three spatial dimensions by allowing
R to be the radius of a 3D sphere. In this formulation, we put ourselves at
and the circles on the surfaces on the left side of
Figure 2 will become spheres that are isotropic and homogeneous in space and inhomogeneous in time, which is consistent with the Cosmological Principle.
Now imagine we are situated at some point in empty space in the Universe facing in some direction. There is a plane of infinite space at the present time perpendicular to the direction we are facing. This plane is the hyperbolic sheet depicted on the left side of
Figure 2 where we are situated at the apex of the sheet. So the direction we are facing is the normal vector to this sheet (with the vector origin at the apex of the sheet) and just like in the external case, there are similar planes constructed from normals at all different angles to the direction we chose to face and when we put all of these together, we get an infinite 3D space at the present time.
But the points on this collection of sheets at
are spacelike to us because they all exist at the same time as us and we can only see points on past sheets whose light has had time to reach us. Light paths in
Figure 1 are lines at 45 degrees and light cones in
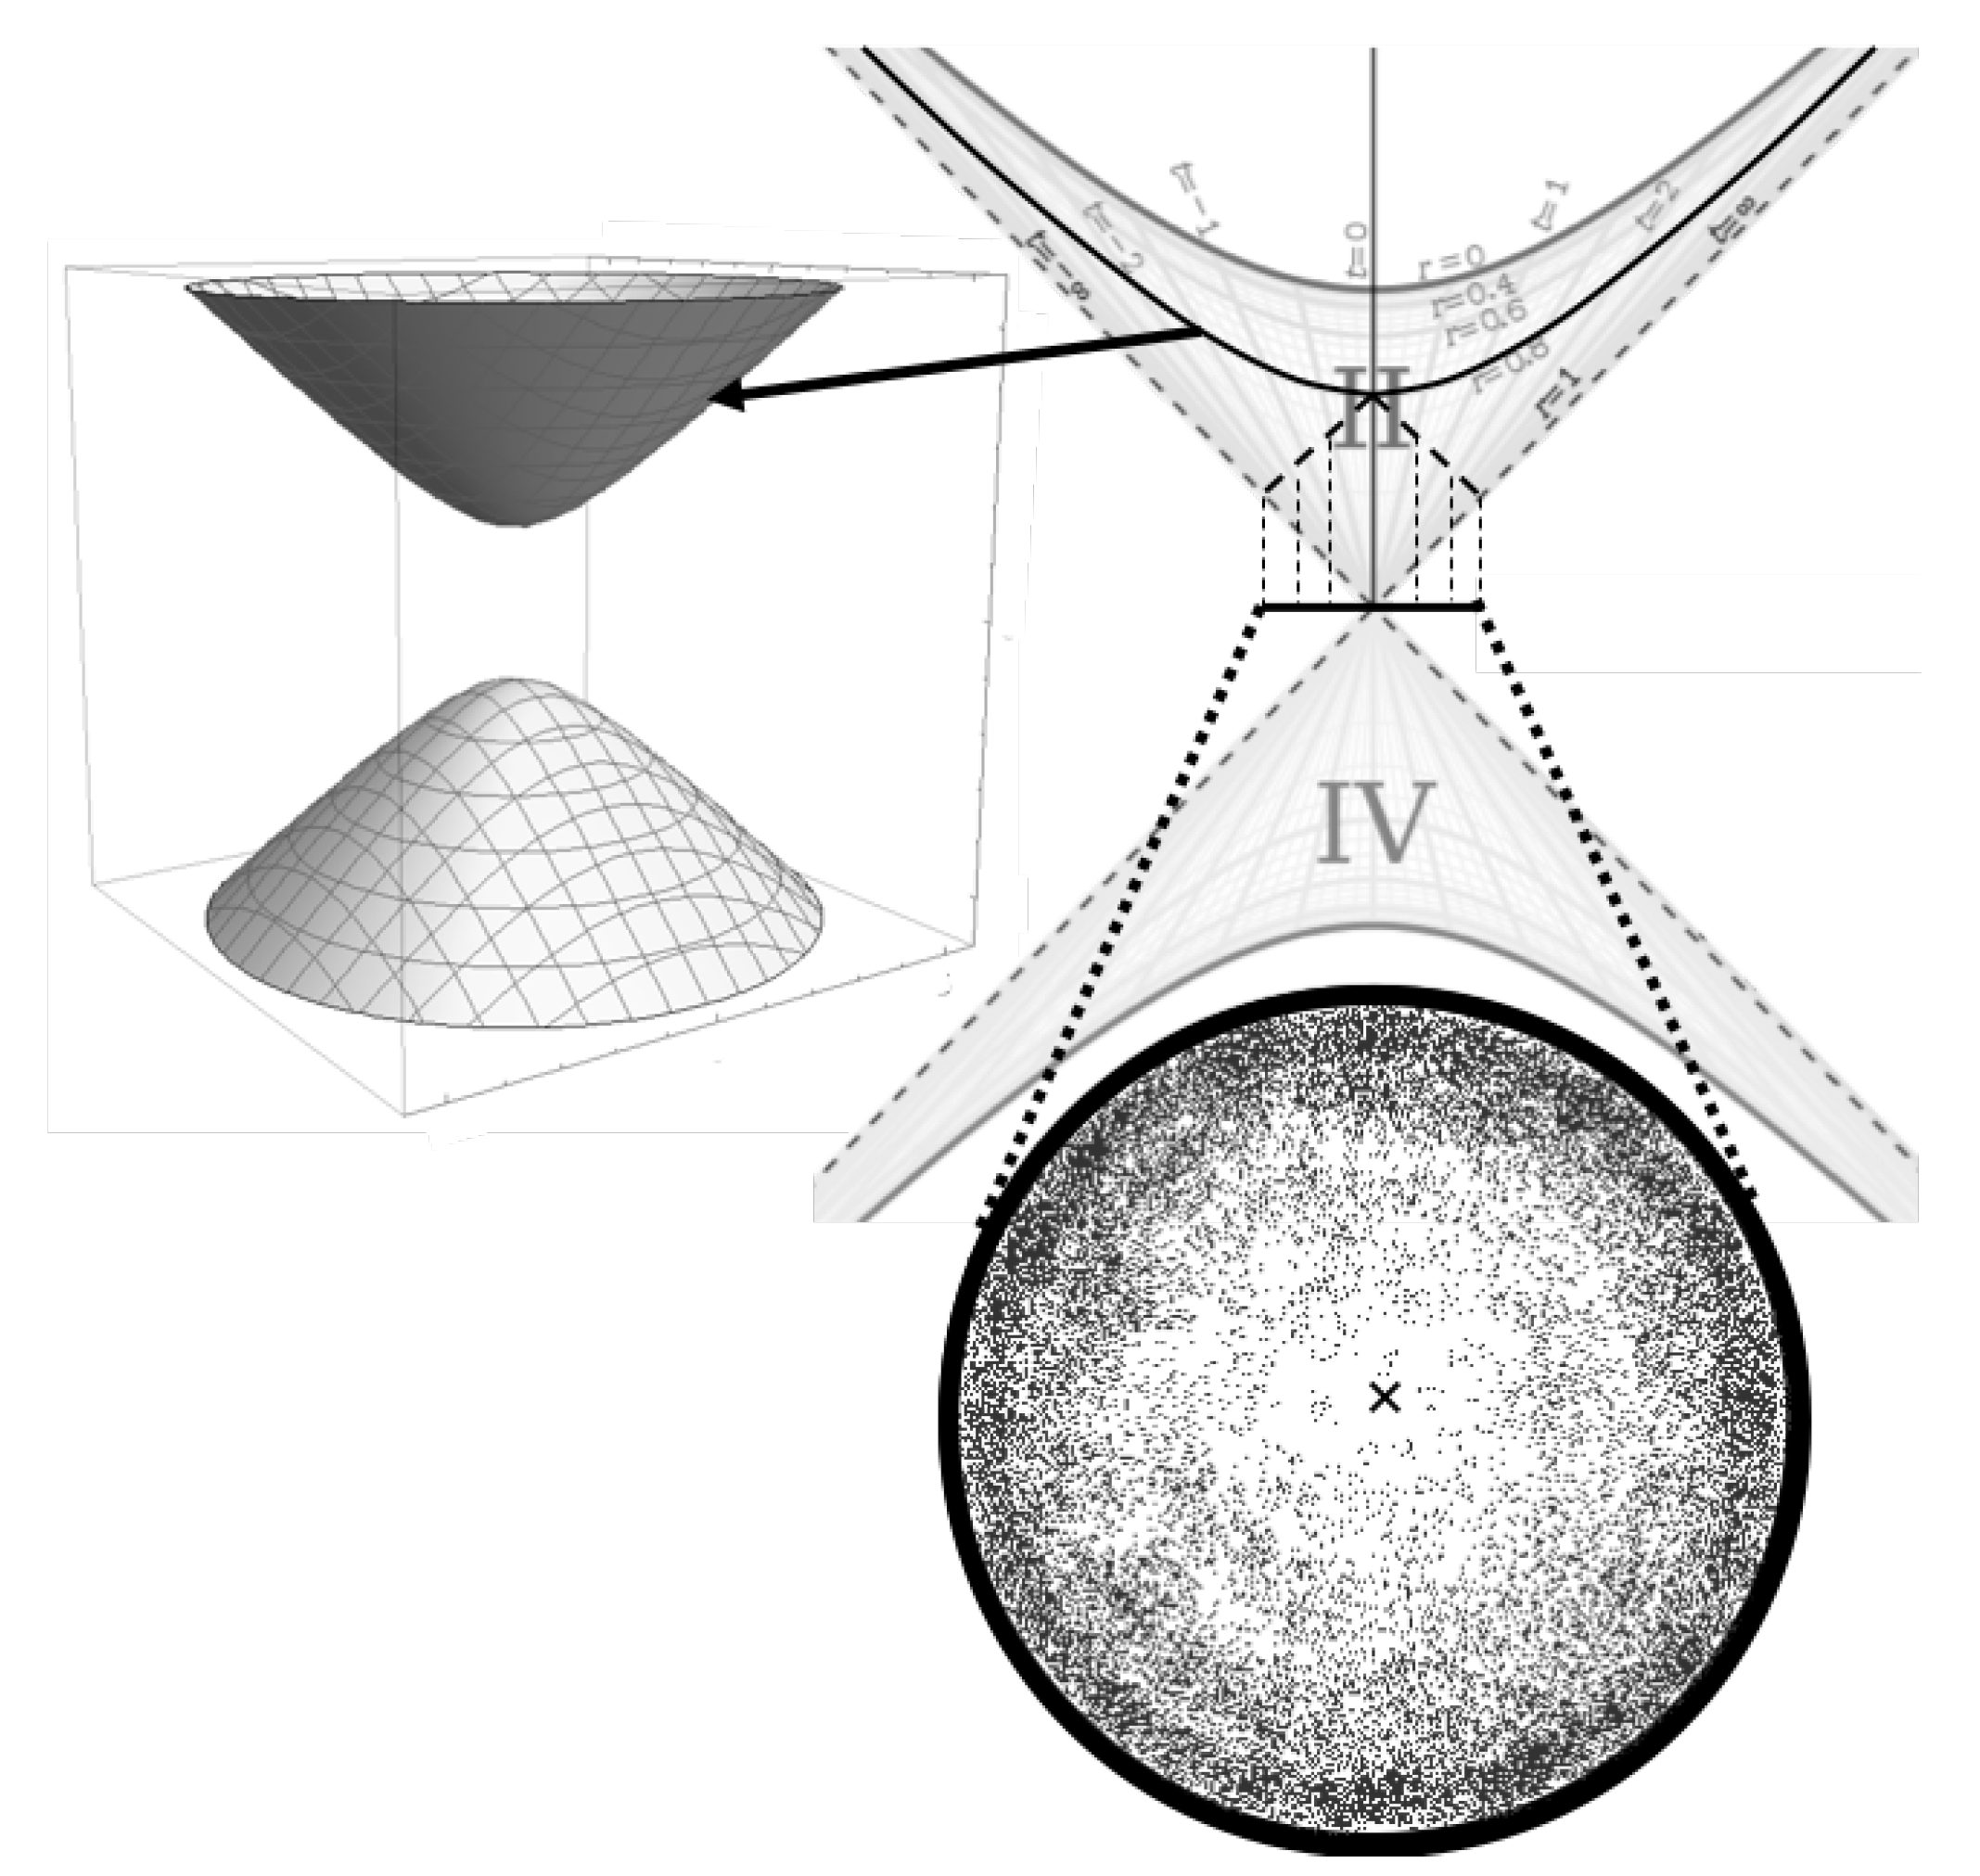
Figure 2 are oriented vertically where the beginning of the Universe is at the origin between the two sheets and time moves forward as the top sheet moves up the diagram vertically. So we can construct an image of what a 2D slice of the Universe would look like to us in this geometry with our position at the center.
Figure 3 shows the present sheet (
) where we are positioned in space at the apex of the sheet. We then show a cross section of that sheet on the Kruskal-Szekeres coordinate chart with the past light cone shown (dashed lines at 45 degrees emanating from
at
). That light cone intersects past sheets of constant
(past sheets not shown in the top left of
Figure 3 but are represented by the hyperbolas the dashed lines intersect in the top right of the figure) and these intersections are projected onto the plane at the origin to give us a 2D image of our past light cone of the Universe. The density of the spatial coordinates at different radii (and therefore times) is depicted with the shading inside the projection.
As we can see in the lower projection in
Figure 3, concentric circles around the center of the projection (marked with ’x’) are circles of constant distance and time from us. So we see that as we look further away in space and back in time, the Universe becomes more dense until at the beginning of the Universe, which corresponds to an infinite distance and finite time from us, the Universe is infinitely dense. This is in line with our current observations of the Universe.
There is much more to explore about this geometry, particularly the angular term of the metric, which will be studied in detail in
Section 4. But we will first analyze the radial aspect of the metric in the context of cosmology to demonstrate its ability to fit existing cosmological data.
3. The Internal Metric as a Model of Cosmology
In this section we show that the internal Schwarzschild metric can be used as a model of cosmology where the metric represents the dynamics spherically-symmetric vacuua in the Universe. Every frame centered in a spherically symmetric vacuum in the Universe is surrounded by an infinite shell an infinite distance in space away from the frame and a finite distance in the past. The shell in this model would be the Big Bang. Cosmological parameters are calculated for the model and the model is compared to supernova and quasar data as well as the CDM model and the results show that the model is in good agreement with the data, giving a current Hubble constant of roughly 71.6 . The model predicts that the total proper time from the Big Bang to the present is roughly 35.2 billion years (as opposed to the 13.8 billion years in the CDM model) and that the transition redshift is close to 0.75.
3.1. The Scale Factor
Expressions for the proper time interval along lines of constant
t and
and the proper distance interval along hyperbolas of constant
r and
from Equation
1 are:
And the coordinate speed of light is given by:
Where
a is the scale factor (because
t is the spatial coordinate and
r is the time coordinate and therefore Equation
7 describes how the proper distance between two points separated by coordinate distance
evolves over time). First we should notice that none of the three equations depend on the
t coordinate. This is good because the
t coordinate marks the position of other galaxies relative to ours. Since all galaxies are freefalling in time inertially, the particular position of any one galaxy should not matter. The proper temporal velocity, proper distance, and coordinate speed of light only depend on the cosmological time
r.
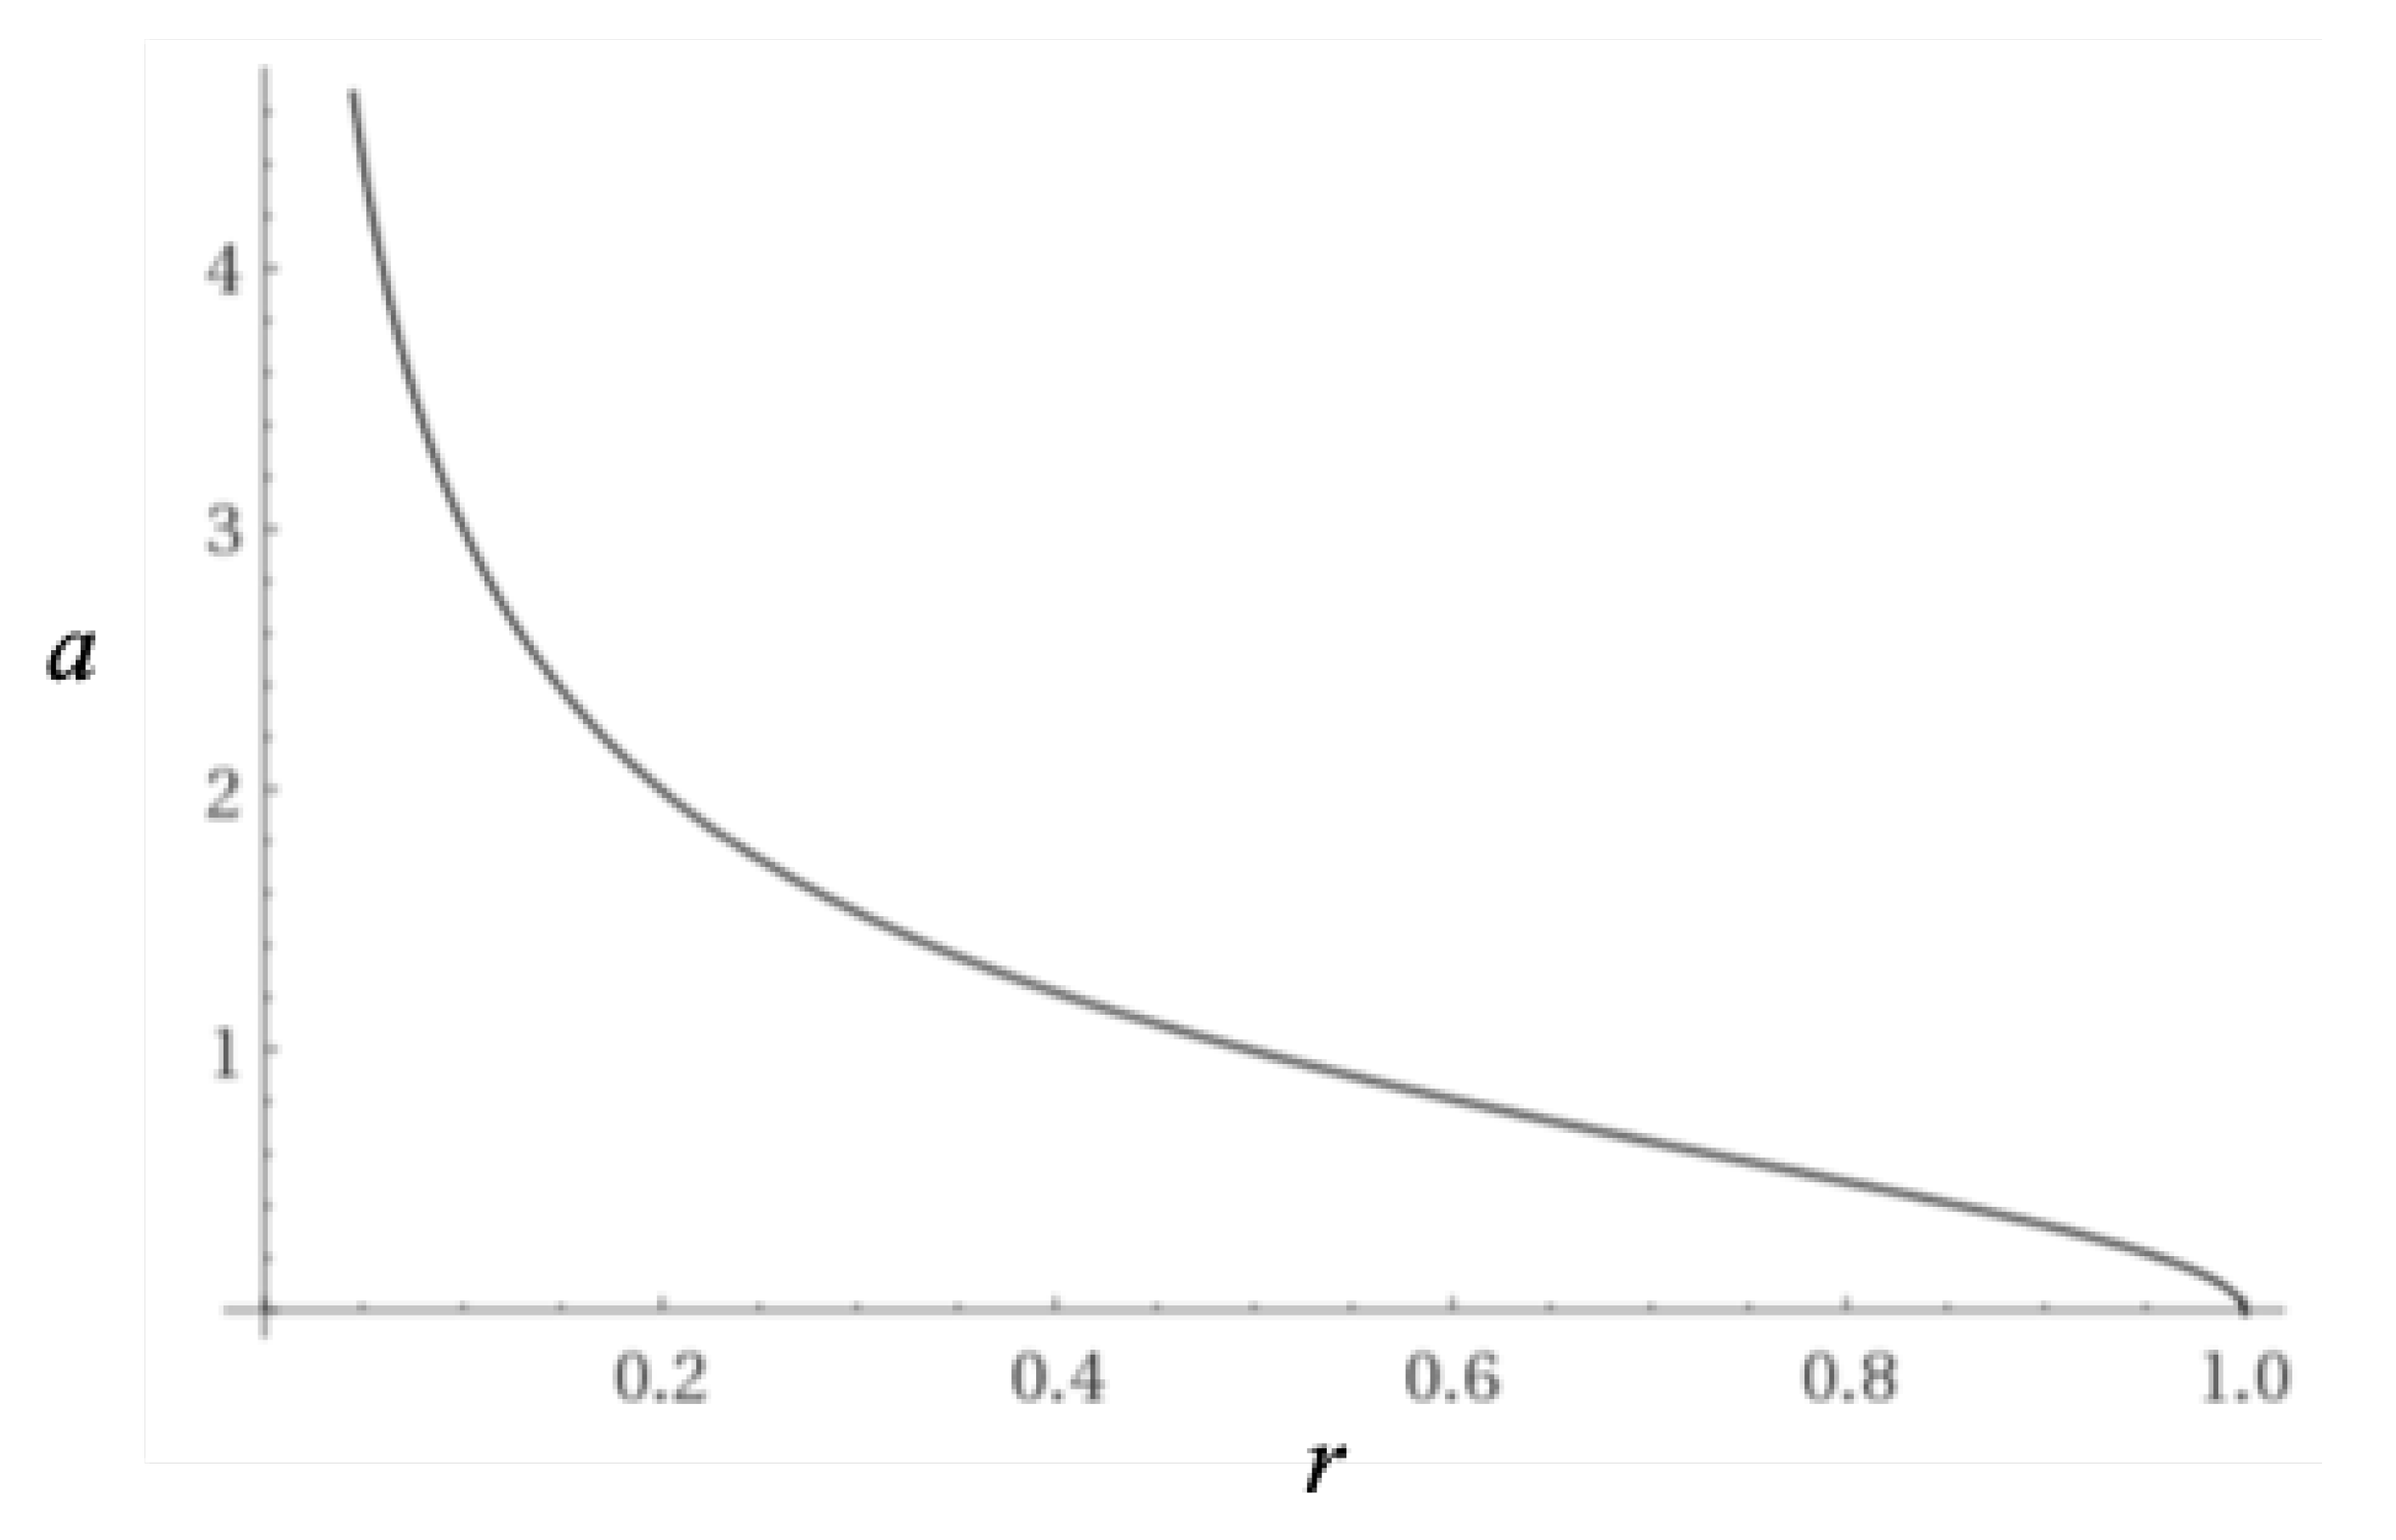
A plot of the scale factor vs.
r (with
) is given in
Figure 4 below:
3.2. The Co-Moving Observer
Let us take a co-moving observer somewhere in the Universe we label as as the origin of an inertial reference frame. We can draw a line through the center of the reference frame that extends infinitely in both directions radially outward. This line will correspond to fixed angular coordinates (). There are infinitely many such lines, but since we have an isotropic, spherically symmetric Universe, we only need to analyze this model along one of these lines, and the result will be the same for any line.
We must determine the paths of co-moving observers (
in the spacetime. For this we need the geodesic equations for the internal Schwarzschild metric [
2] given in Equation
1. In these equations
u represents a time constant (in
Figure 1, the value of
u is 1). The following equations are the geodesic equations of the internal metric for
t and
r) for
:
Looking at points
, then by inspection of Equation
10 it is clear that an inertial observer at rest at
t will remain at rest at
t (
if
).
Let us next demonstrate how the internal metric fits with existing cosmological data and calculate various cosmological parameters using that data.
3.3. Calculation of Cosmological Parameters
In order to compare this model to cosmological data, we must solve for
u and find our current position in time (
) in the model. Reference [
3] gives us transition redshift values ranging from
to
, depending on the model used. We can use the expression for the scale factor in Equation
7 to get the expression for cosmological redshift from some emitter at
r measured by an observer at
[
2]:
Furthermore, the deceleration parameter is given by:
By setting Equation
13 equal to zero, we can solve for
. With this and equation
7, we can calculate the scale factor at the Universe’s transition from decelerating to accelerating expansion
:
Using Equations
12,
14, and the transition redshift estimate, we can get an expression for the present scale factor:
Next, we find expressions for
u and our current radius
by noting that light from the CMB has been travelling for roughly 13.8 billion years of coordinate time
r. Therefore, we can set
and use Equations
7 and
15 to obtain the following for
u and
:
Next we compute the CMB scale factor (
) and coordinate time (
) in this model where the redshift of the CMB (
) is currently measured to be 1100:
We can next derive the Hubble parameter equation using the scale factor. The Hubble parameter is given by (in units of
):
Table 1 below gives the values of
u,
,
,
,
,
, and
given the upper and lower bounds of
from [
3] as well as the 0.75 transition redshift value and assuming
. All times are in
and
is in
.
From the results in
Table 1, we see that the true transition redshift is likely close to 0.75 given the fact that the current value of the Hubble constant is known to be near 71.6. Thus, more accurate measurements of the transition redshift are needed to increase the confidence of this model, but the 0.75 transition redshift is in fact a prediction of the model and we will see this when it is compared to astronomical data later in this section.
Table 2 has the proper times from
to the current time for co-moving observers (
) by integrating Equation
1. The column
gives the time from
to
. The expression for
turns out to be quite simple:
In
Table 2 below, the column
gives the time between
and
.
Note that the proper time
of the current age of the Universe is actually much larger than the coordinate time
. And even though we are presently only about halfway through the “coordinate life” of the Universe (according to
Table 1), the amount of proper time remaining is actually much less than the amount of proper time that has already passed (according to
Table 2). This provides a measurable prediction from the model: as telescopes such as the JWST peer farther into the past with greater accuracy, we should expect to find stars, galaxies, and structures that are much older than expected because of the increased amount of proper time available for such things to form in the early Universe. Hints of this has already been found with the star HD 140283, whose age is estimated to be nearly the age of the Universe itself [
4].
Next we would like to use the
u and
values found to compare the model to measured supernova and quasar data. First we need to find
r as a function of redshift. We can do this by solving for
r in Equation
12:
We can derive the expression for
t vs.
r along a null geodesic where the geodesic ends at the current time
and
by setting
in Equation
1 and integrating:
Next we substitute Equation
22 into Equation
23 to get coordinate distance in terms of redshift:
We need to convert the distance from Equation
24 to the distance modulus,
, which is defined as:
Where
in Equation
25 is the luminosity distance. Luminosity distance is inversely proportional to brightness
B via the relationship:
The brightness is affected by two things. First, the spatial expansion will effectively increase the distance between two objects at fixed co-moving distance from each other. This will reduce the brightness by a factor of
(because the distance in Equation
26 is squared). But there is also a brightening effect caused by the acceleration in the time dimension. We define
as the temporal velocity of the inertial observer at some
r and the speed of light at that
r as
. The ratio of these velocities gives us:
Equation
27 tells us how far a photon travels over a given period of time measured by the inertial observer’s clock. So we see that as light travels from the emitter to the receiver, this speed decreases. This decrease in the speed from emitter to receiver will result in an increased photon density at the receiver relative to the emitter, increasing the brightness. Therefore, this effect will increase the brightness by a factor of:
This effect is not accounted for in the current relativistic cosmological models and therefore gives a second prediction that light from the distant Universe should appear brighter than expected.
Taking these brightness effects into account, the total brightness will be reduced by an overall factor of
relative to the case of an emitter and receiver at rest relative to each other in flat spacetime. Equation
26 in terms of co-moving distance
t and redshift
z becomes:
Giving the luminosity distance as a function of co-moving distance
t and redshift
z:
Which gives us the final expression for the distance modulus as a function of co-moving distance and redshift:
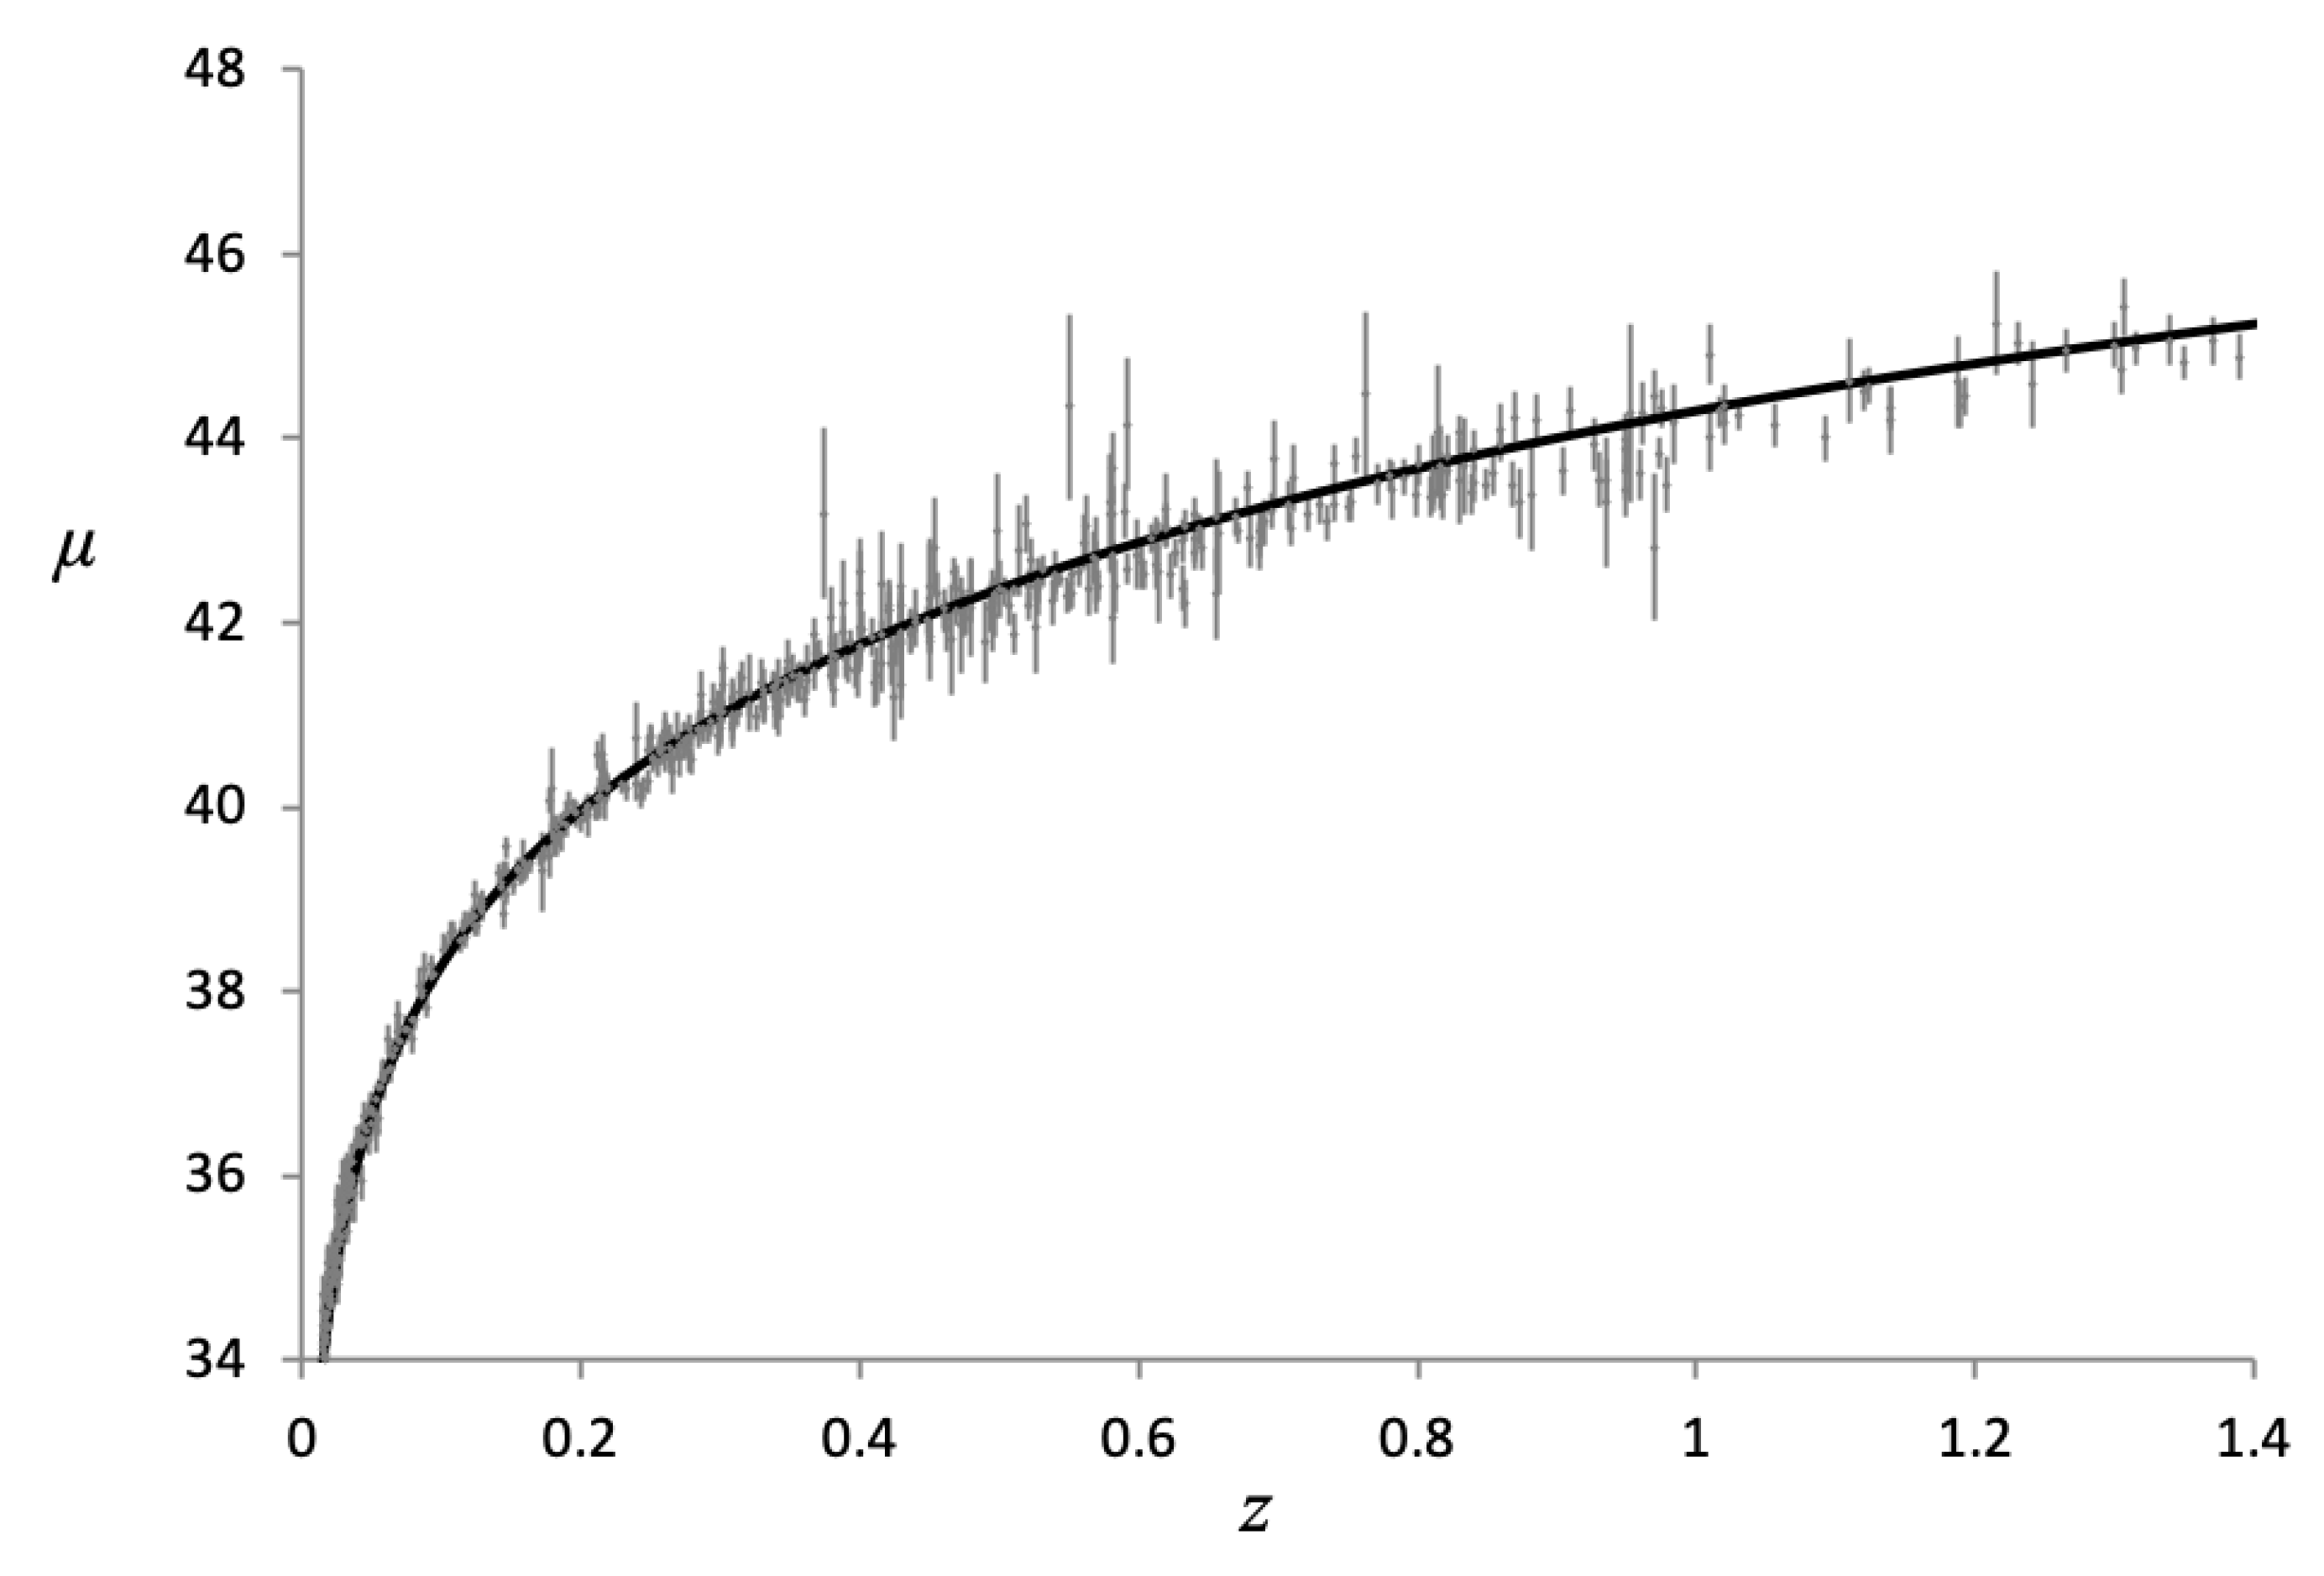
A plot of distance modulus vs. redshift is shown in
Figure 5 below plotted over data obtained from the Supernova Cosmology Project [
5]. A Curve calculated from the
row in
Table 1 is plotted as this value provides the best fit for the data.
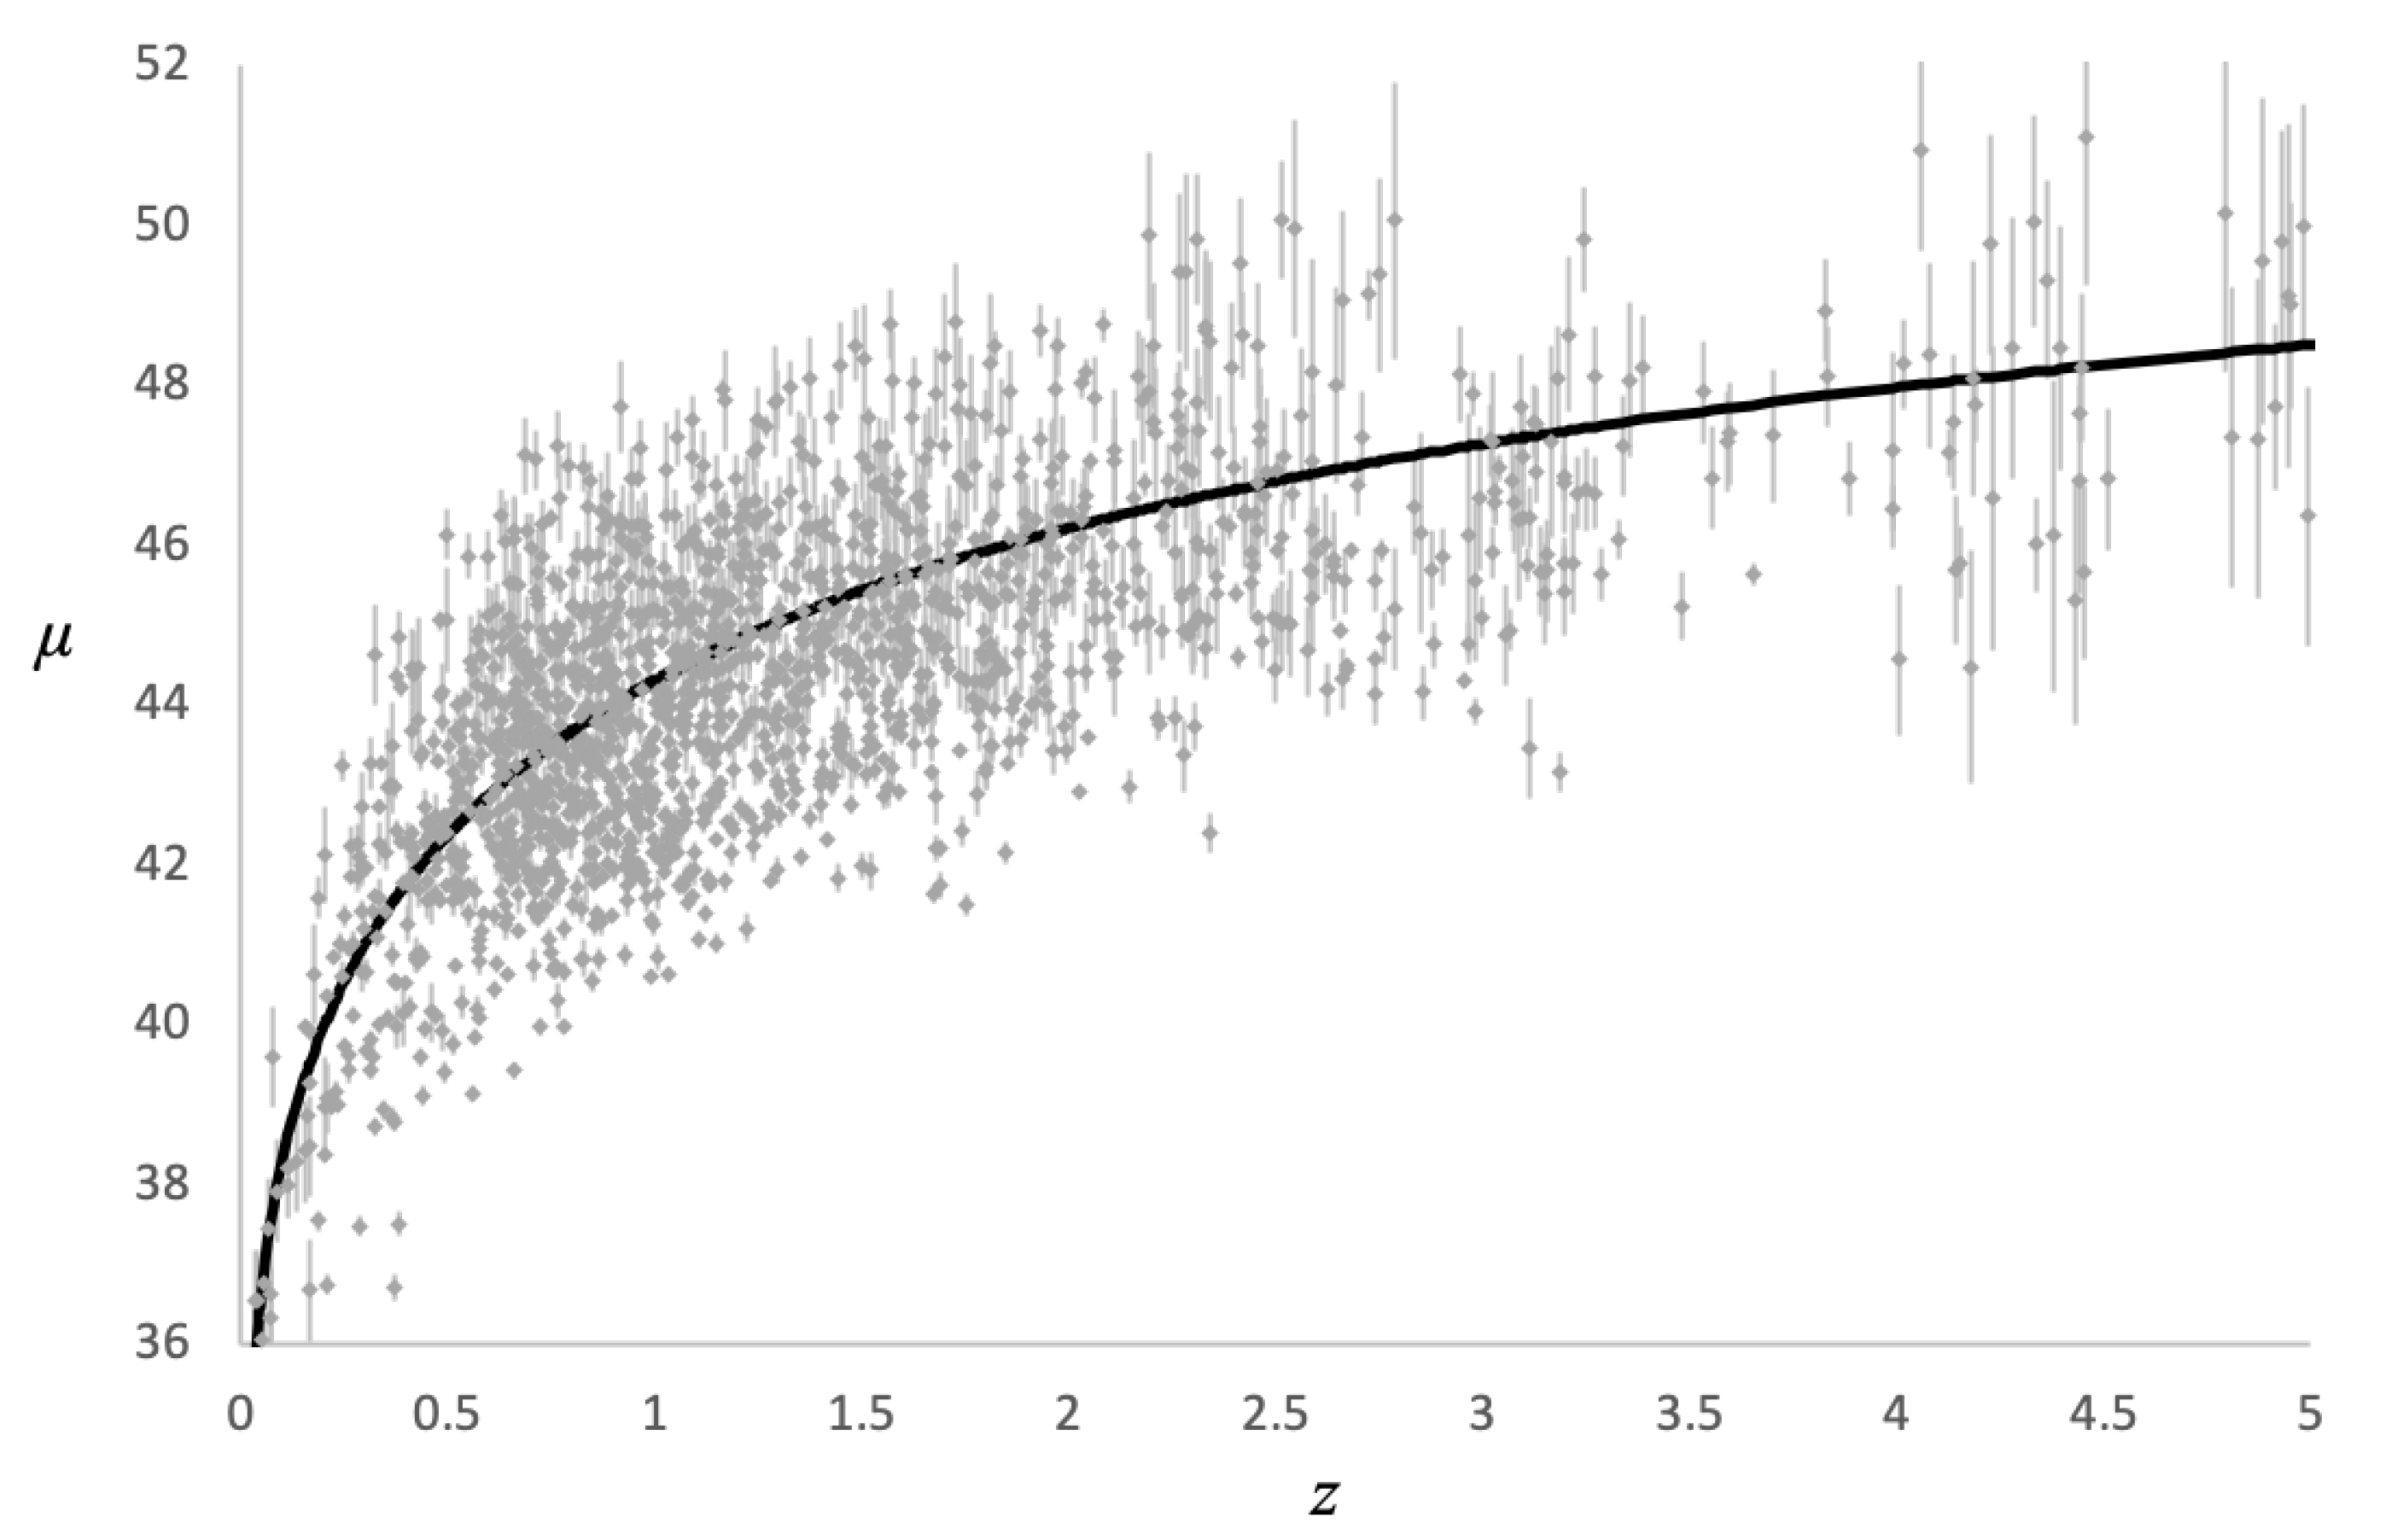
Figure 6 shows the same curve from
Figure 5 for the Hubble diagram plotted out to higher redshifts with the quasar data from [
6] also shown with error bars.
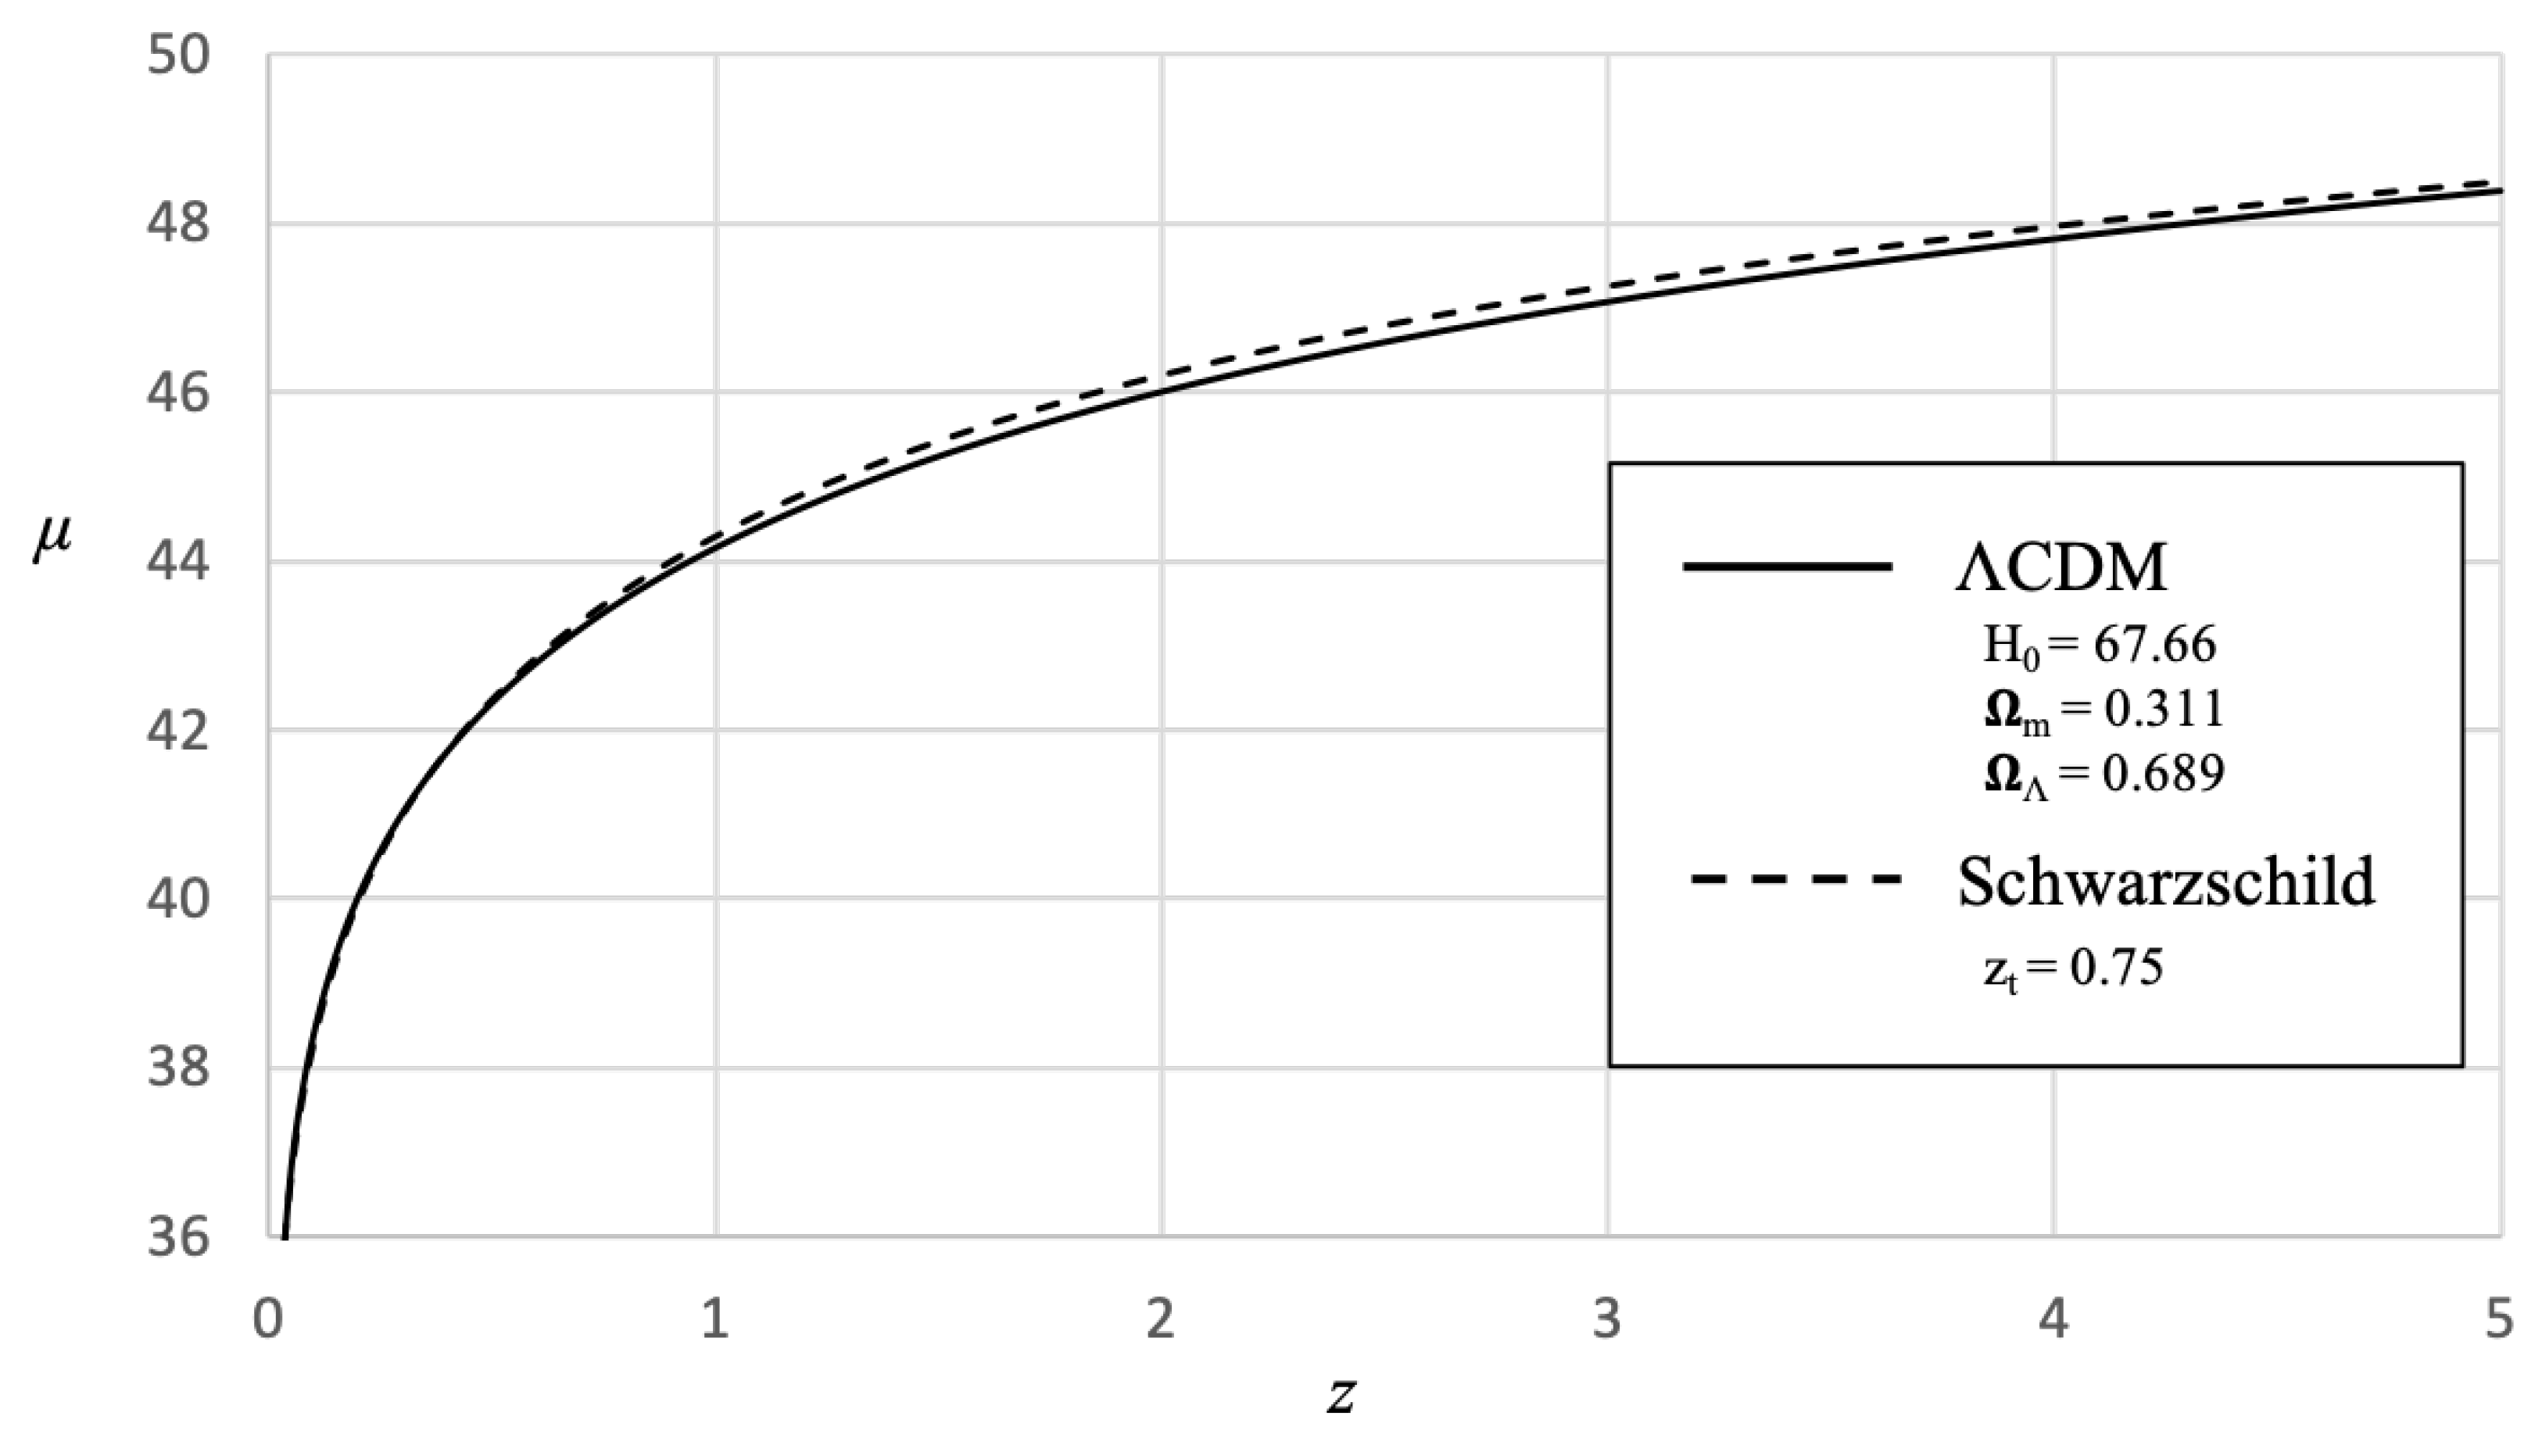
Figure 7 is a comparison of the
CDM model with the Schwarzschild model with the
transition redshift. As can be seen in this figure, both models are in very close agreement for the range of data available.
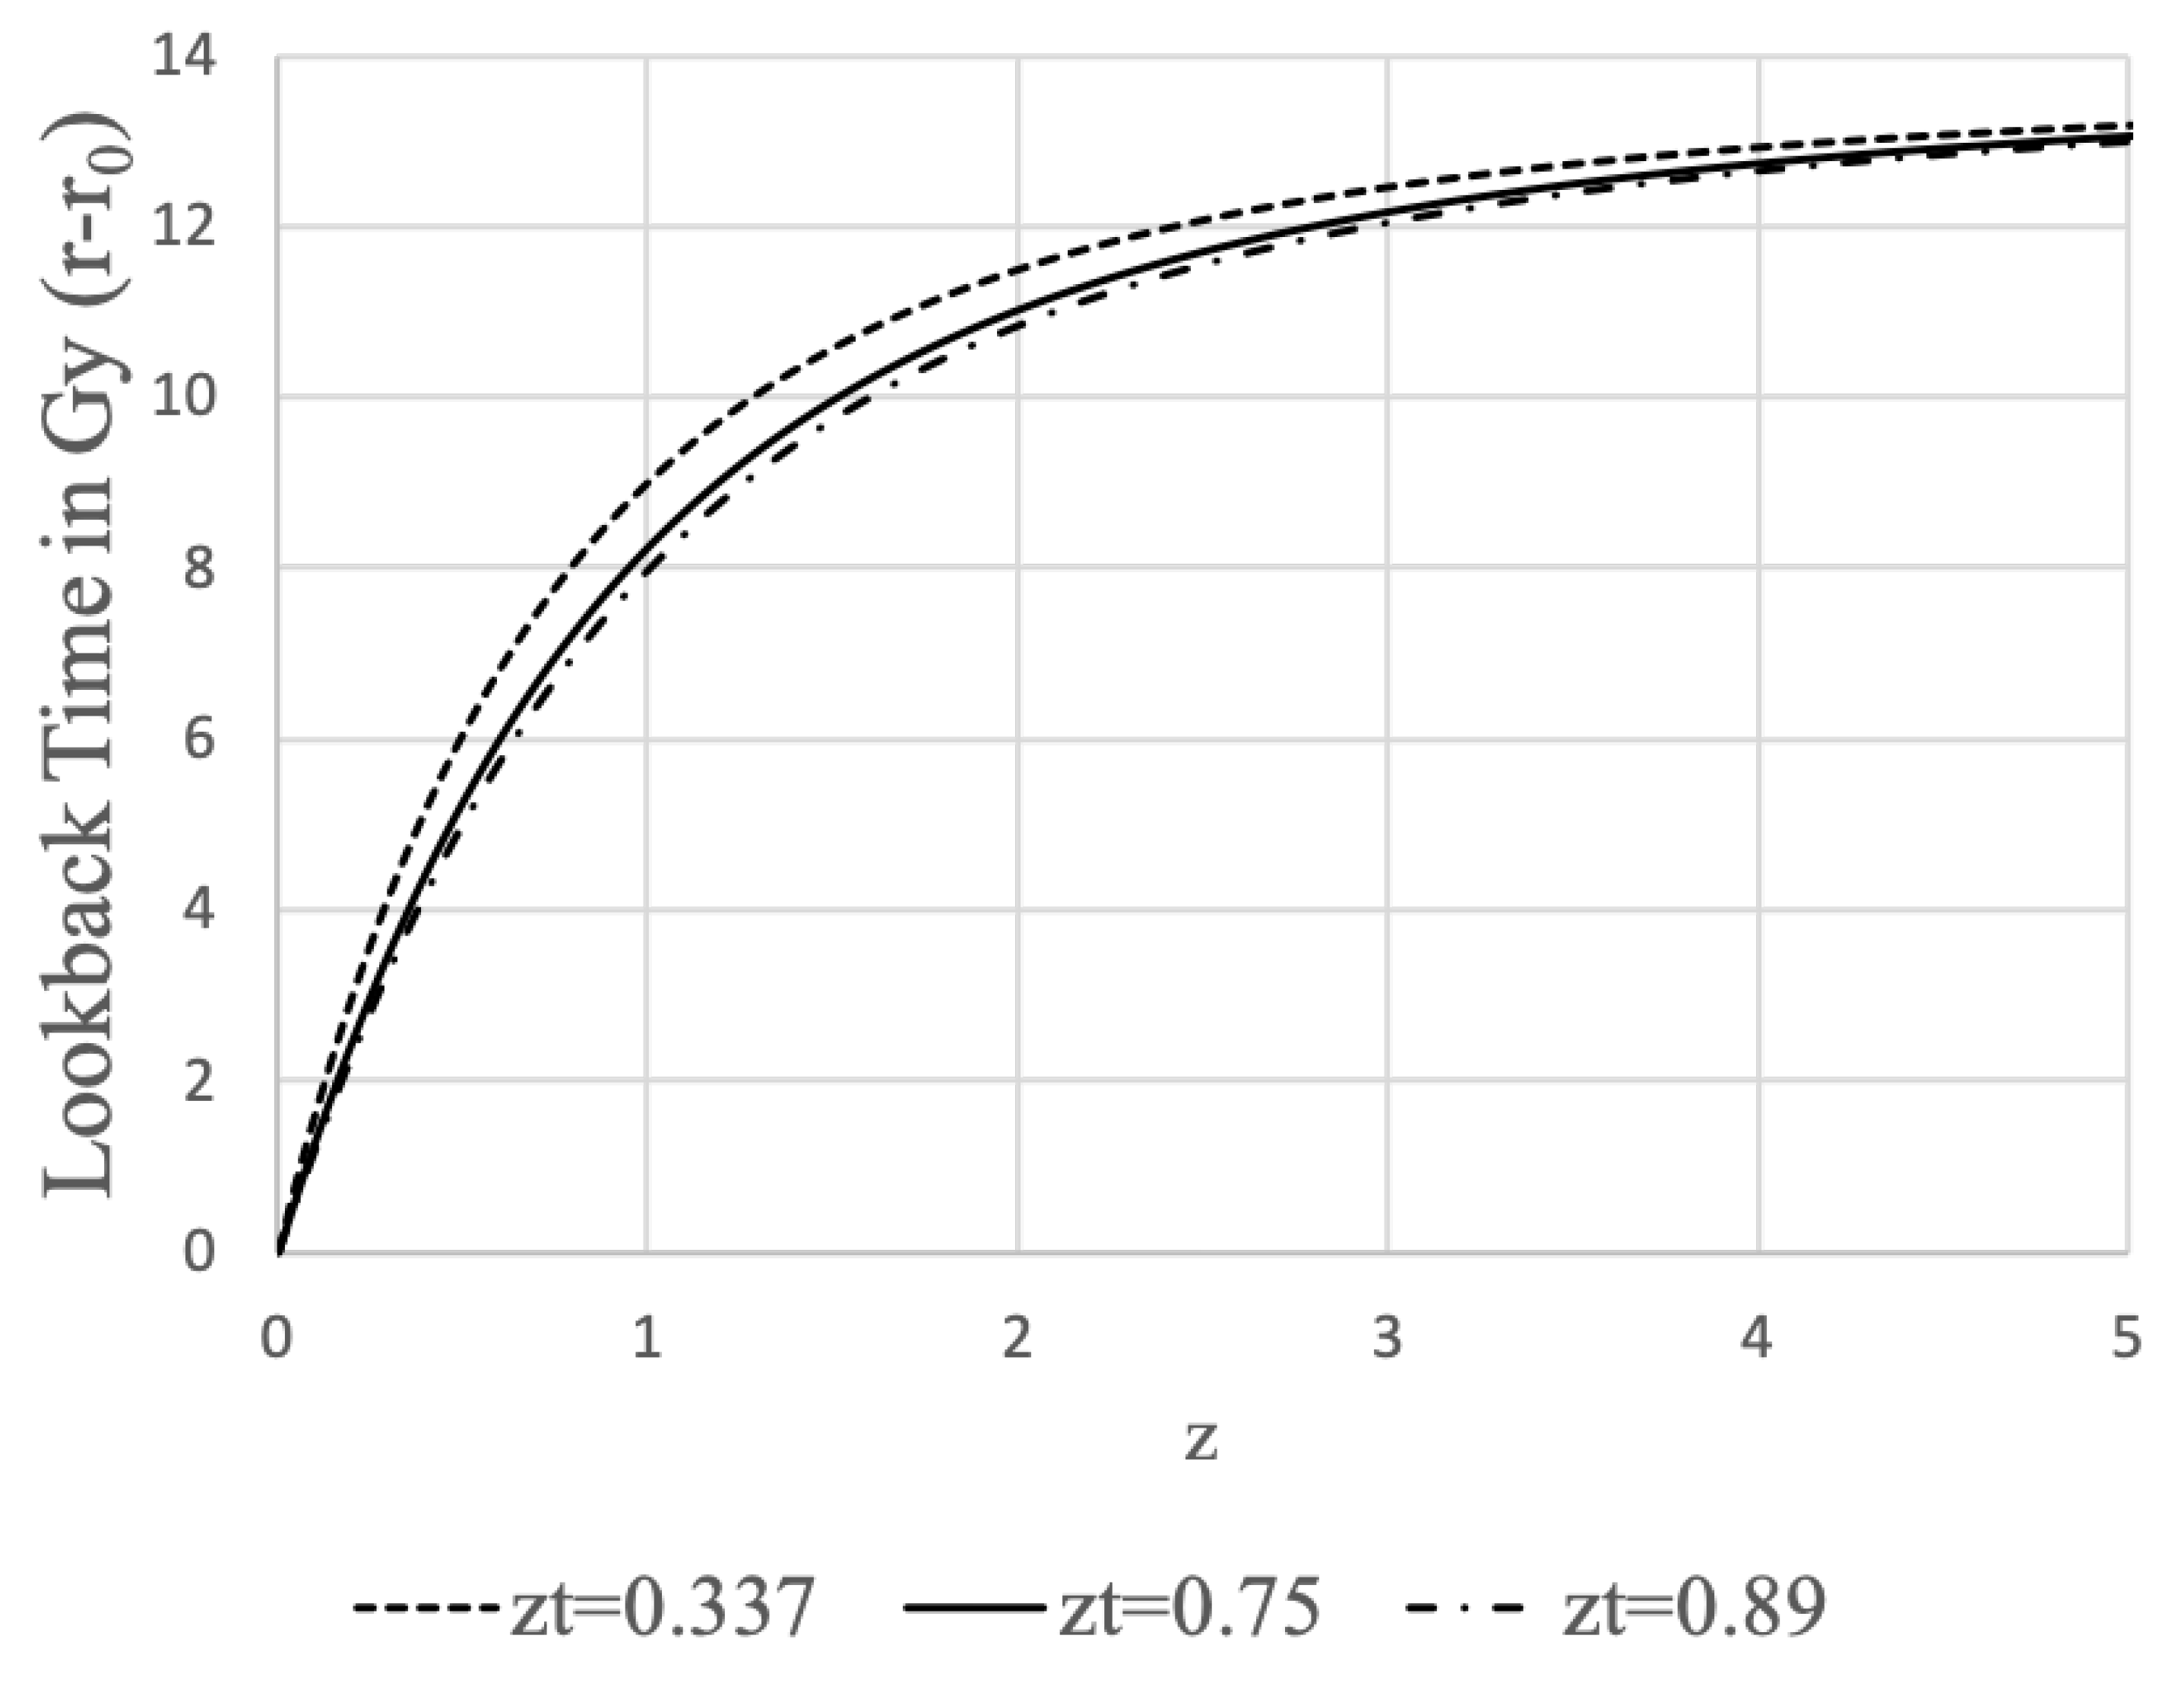
Finally, by subtracting
from Equation
22 we can calculate the lookback time for a given redshift.
Figure 8 shows the lookback time vs. redshift for the three transition redshifts from
Table 1.
4. The Angular Term
The angular term of the internal metric has a time as a radius. This is typically thought of as a scale factor for spatial spherical surfaces of the space, but that cannot be what is being described in that term. The reason is simple. Imagine that one draws a set of concentric circles around some point at the same time
r (spacelike circles). This would be represented by the circles on the top surface of the left sidde of
Figure 2. The circumferences of the circles must get larger as we move away from the center point. But these circles are at the same time
r. So if the proper circumference of the circles was given by
, then all those circles would have the same circumference, which is nonsensical. Furthermore, it is also believed that at
, an observer would experience ’spaghettification’, which implies that the observer is infinitely stretched in one direction and infinitely compressed in the directions perpendicular to the stretch direction. In this scenario we must ask "In which spatial direction is the observer stretched?". The logical answer is that the stretch happens in the radial direction. But the radial direction is in the direction of time, not space. Therefore, we cannot chose a direction in space for the stretch and we therefore must reject the spaghettification hypothesis and consider more carefully the meaning of time being a radius.
In the external metric, we measure the angles relative to the frame of the central body (the source of the metric). For the internal metric, there is no central body that can be referenced as the source of the metric. Instead, we must use the distant surrounding Universe as a reference, with the Cosmic Microwave Background being an optimal reference in this case. If we consider an inertial frame in the internal metric, we can draw a line from the center of the frame to some point on the CMB and orient a gyroscope along that line. As we move through empty space, the change in angle between the gyroscope axis and the original connecting line will be the change in angle
in Equation
1, representing a change in the orientation of the reference frame relative to the surrounding Universe.
In a Newtonian Universe, this angle would never change because even if we moved around a curvilinear path through space, the gyroscope would remain fixed in its orientation. But in Special Relativity, there is a kinematic effect known as Thomas Precession in which the orientation of the gyroscope will change as a result of an acceleration being applied to the observer at an angle to the observer’s current velocity. The Thomas Precession is given by:
At non-relativistic speeds, this precession is very small, essentially zero at human scales. We can think of this kinematic precession as the ’spin’ of an object since it is an intrinsic rotation of the object’s reference frame. We see this kind of ’spin’ analogously in the external metric with geodedic precession. The precession of the perihelion of Mercury’s orbit is a direct example of this. The perihelion precesses because the orientation of Mercury’s reference frame changes (relative to a coordinate system fixed to the sun) as it orbits, resulting in the direction of the orbit relative to the sun’s stationary coordinate system changing over time.
As will be discussed in
Section 6,
is related to the magnitude of the CMB dipole that would be seen when moving through space. In terms of curvilinear motion,
will always represent the tangential velocity to the observer’s path. Furthermore, the combination of the CMB dipole’s magnitude as well as the angular velocity of the dipole as it moves across the CMB will give us the acceleration normal to the path at each point. Noting that the centripetal acceleration of a body moving with tangential velocity
v and angular velocity
can be expressed as
, we can get an alternate expression for the Thomas Precession as follows:
Where
is the angular velocity of the CMB dipole as it moves over the CMB and
is the tangential velocity, which is related to the magnitude of the CMB dipole. If we create a basis for the observer’s reference frame by aligning gyroscopes along three perpendicular directions, then we can define the angles
and
in that basis which describe the general motion of the dipole over the CMB. With those, we can express Equation
34 in terms of
and
as:
Therefore, Equation
35 tells us how the orientation of the observer’s reference frame changes at each instant while the observer is in motion, giving us the magnitude of
for the frame at each instant. This change in orientation manifests itself in the frame of the observer as a rotation of the surrounding Universe around the basis defined by the aforementioned gyroscopes. An important thing to note here is that at modest speeds (
), the rotation of the reference frame’s orientation (which is what the internal metric describes), is much lower than the rotation of the CMB dipole such that if the dipole makes a
rotation in a given amount of time, the actual angle of rotation in the metric will be much lower than
over the same period of time
1.
We can further simplify Equation
35 by noting that
, giving us:
But from the metric, it is clear that there can still be precession of the reference frame, even if there is no centripetal acceleration through space. An observer moving in a straight line with a precessing inertial frame would see the CMB dipole angle fixed relative to the gyroscope basis and the entire Universe would appear to rotate around the gyroscopes.
The same would be true for a co-moving observer with the difference being that there would be no dipole visible on the CMB. Since there are timelike paths with non-zero and , this means that the co-moving observer can still have an angular velocity in this metric even though it is not moving through space. A precessing reference frame is the only interpretation of the angular term of the metric that is consistent with this condition. Given these interpretations of the motion in t and , it is notable that if an object had some intrinsic spin already and started moving in t, the object would move on a curved trajectory analogous to a charged particle moving in a magnetic field. It is as though the inertia of the spinning body in motion becomes a vector that precesses according to the spin magnitude and direction.
In the frame of an observer with this intrinsic spin, they see the entire Universe rotating around their inertial frame as they move in a straight line relative to their basis. But from the perspective of a co-moving frame with no spin, the particle with spin will move on a curved trajectory under the influence of a fictitious cosmological Coriolis force (the momentum vector of the particle rotates without an external force being applied as a result of the precession of the inertial frame). This effect could be related to the Dark Matter effects observed in galaxy rotation curves. In scenarios where galactic formation involved high initial gas rotation leading to significant geodetic precession, subsequent star formation within these galaxies, as stars migrated outward from the galactic center, would encounter Coriolis acceleration. This acceleration would result in stars maintaining orbits around the galactic center with tangential velocities exceeding theoretical expectations.
The path of light should also be affected by the angular term of the internal metric. When light is gravitationally lensed, its momentum vector changes direction, so from the perspective of the light, the Universe has rotated around it. We can see the precise behaviour of lensed light by looking at the geodesic equation for angular motion [
2] (we will examine the case for planar rotation where
).
For light, we will use
. If we consider light lensed by a galaxy, as the light passes the galaxy at some coordinate time
, it will have some angular velocity
and initial angle
as it leaves the galaxy. It is currently assumed that the light then continues along a straight line as it leaves the gravitational field, but as we shall see, this is not the case. The
would be the angle caused only by the gravitational lensing, without any additional effects from the cosmological model (i.e. the angle we would expect when only taking into account the mass of the galaxy). Given these initial conditions, the solution to Equation
37 is:
During expansion, both the bracketed expression and will always be negative (because is negative and ) such that the second term is always positive. Therefore, during expansion, the observed lensing angle will be increased by the amount as a result of this effect (where r is the coordinate time at which the light is observed). Furthermore, since for the light increases over time, the will correspondingly decrease as well and the result of this is that the increase in lensing angle over time will also result in a redshift of the light relative to unlensed light.
We see that the ’excess angle’ is dependant on the lensing rate . So if we consider two cases where in one case, the light is gently lensed over a large distance/time by some angle and in the other case, light is lensed by a more dense mass the same , the lensing rate would be higher in the second case relative to the first. So even though the pure gravitational lensing angle would be the same in both cases, the observed angle would be greater in the second case because the lensing rate would be greater in that case.
5. The Metric Singularities
Now that we have begun to understand the nature of the angular term of the internal metric and its relationship to Cosmology, we now examine the nature of the singularities of the metric.
The metric has two singularities: a spherical singularity and a hyperbolic singularity. The spherical singularity is the place where the and components of the metric vanish. This singularity is also a curvature singularity because the manifold curvature is governed by the r coordinate and when , the component also vanishes.
As discussed in
Section 4, the singularity at
does not mean that space is compressed there. In fact, it is at
where
vanishes and this indicates that the time coordinate becomes infinitely compressed in the case of the external metric and the space coordinate becomes infinitely compressed in the case of the internal metric. We can see the hyperbolic singularity clearly in
Figure 1 where the
t coordinate, shown as a hyperbolic angle in that chart, converges at
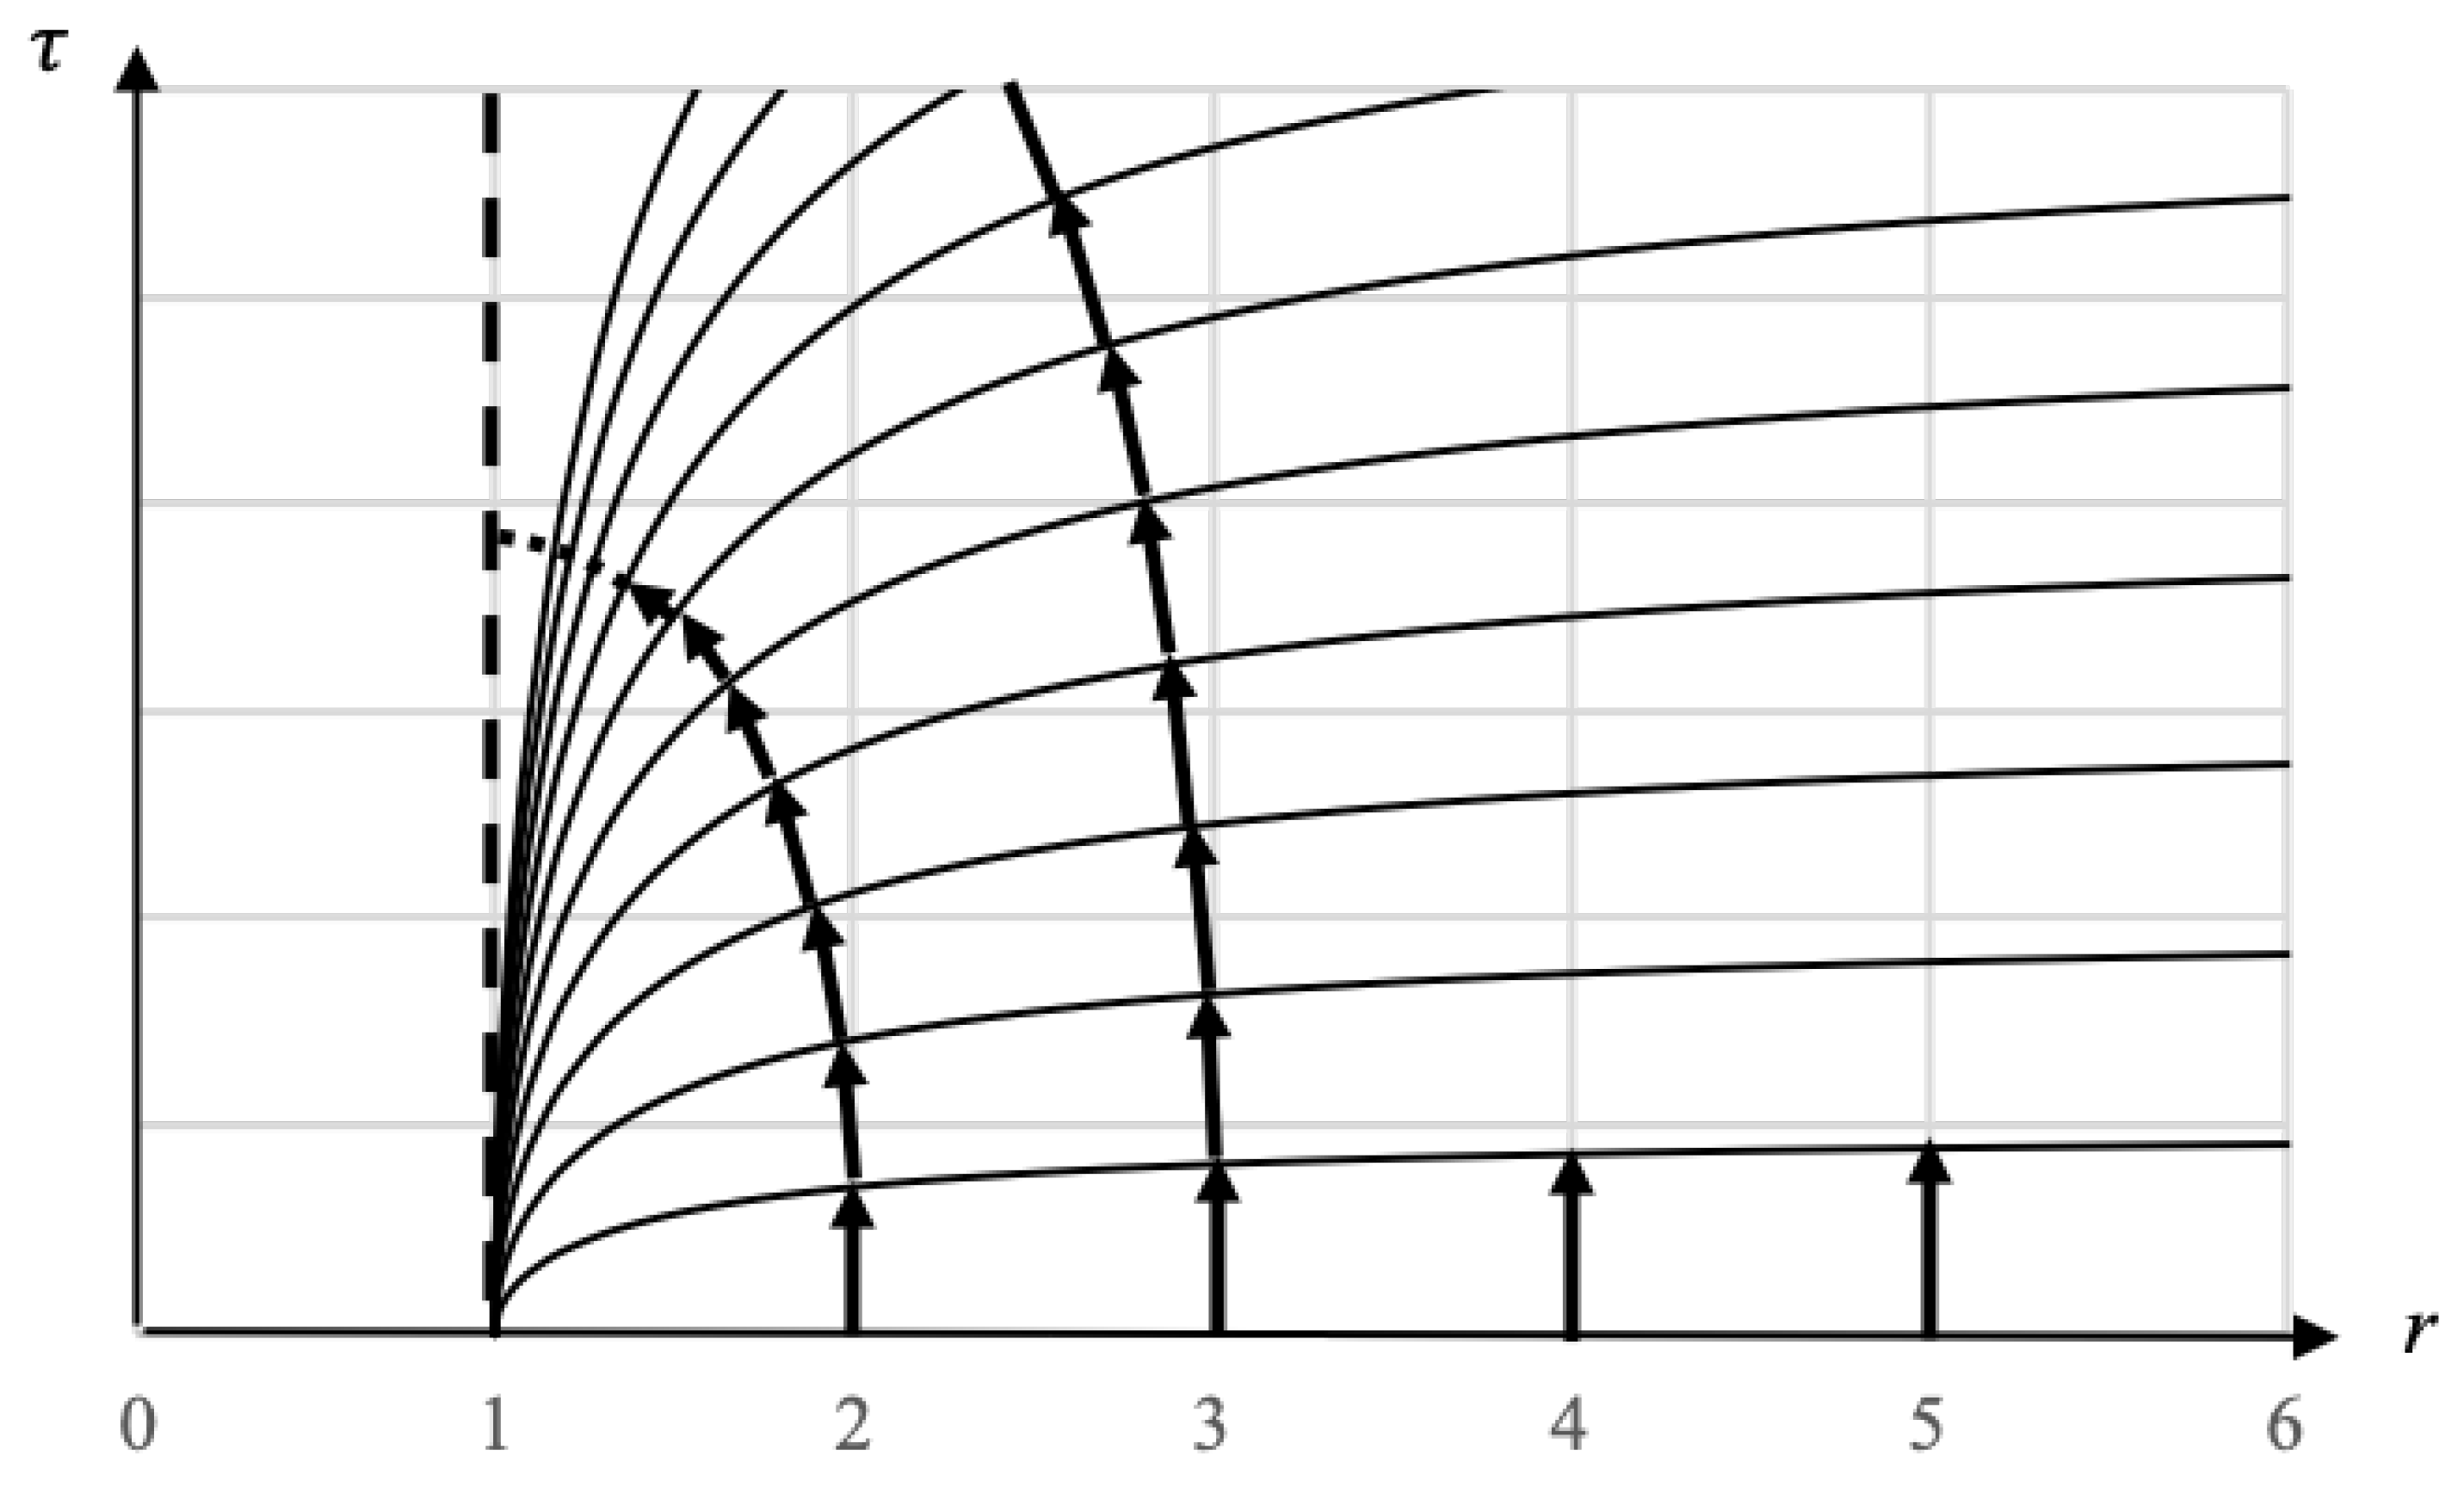
. We can also show this convergence in Schwarzschild coordinates in
Figure 9
On this chart, the
t coordinate lines are the curved lines and they come from solving the metric for rest observers (
) and integrating to get the following equation:
Where each line corresponds to a fixed value of t, with being the flat line on the r axis. Vertical worldlines on this coordinate chart are the worldlines of observers at rest and their height is the proper time elapsed. We can see that for a given , less proper time passes for rest observers the closer they are to the horizon.
We can conceptualize the
t coordinate lines as analogous to isocontours on a contour chart, where
represents the highest level and
represents the lowest level. The trajectory of a falling observer (shown as sequential arrows in
Figure 9) follows the geodesic of shortest distance from the highest level to the lowest level, ensuring their worldline remains perpendicular to the
t coordinate lines at every point. Consequently, the worldlines of all observers falling from rest at
start vertically at
, gradually curving to maintain orthogonality to the
t coordinate lines at each point, and eventually becoming horizontal at
,
. Thus,
Figure 9 depicts the convergence of the
t coordinate on a Schwarzschild coordinate chart.
Alternative coordinate systems, such as the Kruskal-Szekeres coordinates, offer a means to disguise the hyperbolic singularity by providing a different representation of spacetime. To illustrate this concept, consider a flat terrain with a trench dug out along its center. As one approaches the center of the trench, the slope increases, reaching infinity at its center, which is infinitely deep. If distance markers are placed along the ground, spaced equally following the trench’s slope, an infinite number of markers would be required to reach the trench’s center. These markers represent the coordinate analogous to t.
However, when observing the terrain from above, the center of the trench appears as a line on a plane. By laying coordinates on this plane, the center of the trench becomes a finite distance from any reference point, and the markers previously placed on the ground (representing the t coordinate) appear infinitely dense at the trench’s center. This planar coordinate system mirrors the Kruskal-Szekeres coordinates and similar approaches, which merely hide the hyperbolic singularity, making the metric regular at the horizon.
But let us now consider what happens to observers at the spherical singularity at . As previously discussed, this singularity is a point in time around which reference frames precess. The idea of ’spaghettification’ at the singularity has already been ruled out, so what then is the nature of this singularity in terms of inertial frames?
Consider a reference frame with a non-zero rate of precession in some direction. From the perspective of this frame, the entire Universe is revolving around the frame and the rate and direction of rotation of the Universe tells the frame its rate and direction of precession. But at the the singularity, the scale factor becomes infinite and all incoming light from the external Universe becomes infinitely redshifted. This means the reference frame can no longer determine its rate of precession or its orientation because it no longer has the surrounding Universe as a reference against which to measure these quantities. Therefore, the spin of reference frames in these conditions is undefined.
But the Universe does not end at the singularity. When the Universe reaches the singularity, it continues to evolve in time except that rather than r decreasing over time, r now starts increasing.
We can show this more explicitly for a co-moving frame. The definition of the Kruskal-Szekeres
T coordinate is given by
, and we can define the velocity of the frame in
T (for constant
t) as:
We take the negative solution for region II of the Kruskal-Szekeres chart since
T increases when
r decreases there. We can see that this velocity is
when
and zero when
. So the velocity (i.e. motion through time) is zero at the singularity. If we take the derivative of this velocity we get:
Since is negative, this tells us that will be positive from to . But is negative and therefore, the acceleration of the worldline is opposite to the velocity, causing it to decelerate in T and therefore the acceleration vector would point toward . We can also see that this acceleration is non-zero at the singularity. So if is 0 at and the derivative of is non-zero and pointed toward at , then this means that after approaching the singularity from the worldline stops moving in increasing T at the singularity and begins to move in the direction of decreasing T. When the worldline then starts falling back toward , is still negative, but is now positive. Thus will be negative, meaning the worldline accelerates toward .
Therefore, the spherical singularity represents a turnaround point for the geodesics where co-moving reference frames switch from moving with negative through time to moving with positive through time.
In
Section 7, we will see how when we combine the two metrics into a unified spacetime, the passage through
emerges quite naturally from the combined coordinate chart. But first we will examine cosmological motion in the context of the internal metric.
6. Understanding Cosmological Motion: A Thought Experiment
A very important fact about the internal metric is that there is no preferred location in space, which is consistent with the cosmological principle. The angular term of the metric, which has a center in time at all space, must be thought of differently than we usually think of spherical metrics centered in space as was discussed in
Section 4. We can always put ourselves at the center of space
and if we pick an arbitrary direction at some fixed time
r, the
t dimension is a linear dimension that extends infinitely in front of us in that direction as well as infinitely behind us in the opposite direction. So even though we are not centered in time in the metric, we can always model ourselves as being at the center of space. Understanding this is very important for visualizing what the Universe looks like when we move cosmological distances.
Imagine a Universe full of Black Holes, each one with a particle moving in the its gravitational potential in arbitrary ways. We will focus in on one such system. Let’s surround our Black Hole and particle system with a larger sphere containing both of them centered on the Black Hole and large enough that the path of the particle always remains inside it. The orientation of the system is locked to the sphere so that if the sphere moves or rotates, the system as a whole moves and rotates with it.
The CMB shines on this sphere, and the temperature monopole of that light is directly related to the cosmological time r and therefore local time . When the temperature monopole is zero, we are at . So the monopole temperature of the CMB gives us a measure of cosmological time.
We’ve already discussed the cosmological angular motion as the Thomas Precession of the reference frame relative to the CMB. The magnitude of this spin may also be correlated to the observed CMB quadrupole. So this leaves us with cosmological linear motion . We can figure out our cosmological velocity by observing the magnitude and orientation of the temperature dipole cast on the sphere from the CMB. If the system is moving through t, one side of the sphere will be more blue than the monopole and the polar opposite side will be more red than the monopole. The Black Hole, which is at rest relative to the sphere can figure out how fast and in which cosmological direction the sphere is moving in by observing the magnitude of the dipole as well as its orientation.
So when an observer moves linearly in
t, half the sky will be blueshifted and the other half will be redshifted and the circle perpendicular to the dipole direction will have no red or blueshift. For simplicity, let’s assume all galaxies are co-moving. If we are also co-moving and we look at a set of galaxies surrounding us at a fixed
, these galaxies will be equally redshifted in our frame as time goes on. If we then move in
t in some direction, what we would see is that we move closer to the galaxies in the blueshifted portion of the sky and away from the galaxies in the redshifted portion of the sky. How much closer or farther away we move from a particular galaxy depends on the magnitude of the red or blueshift in the direction the galaxy sits in the sky. So if we shift our position by moving in
t in some direction, when we later come to rest the galaxies that originally sat on a shell equally distant in space and time from us will now each appear at different distances and times from us depending on our direction of travel.
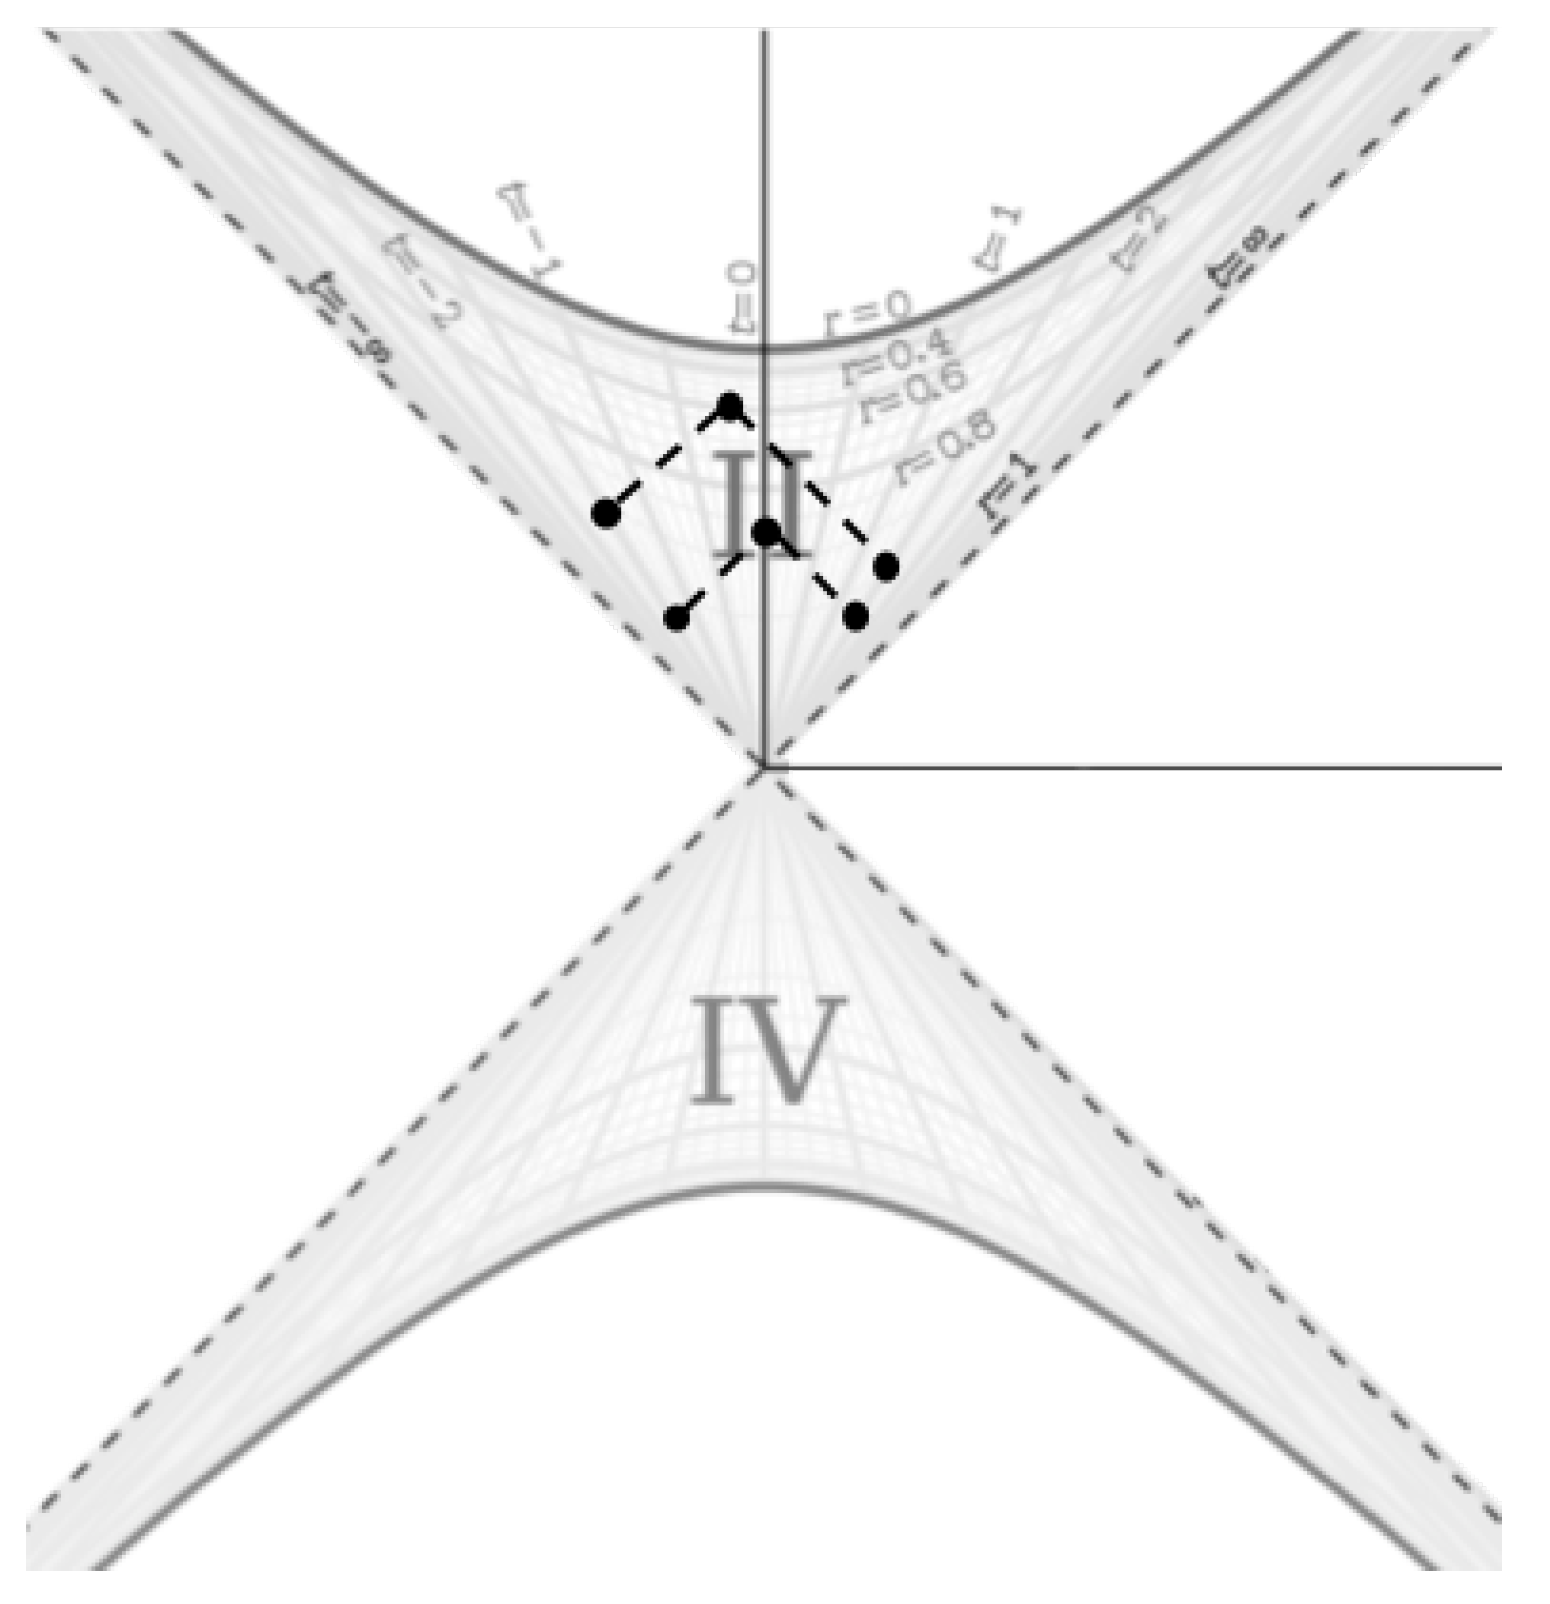
Figure 10 shows our pure motion in
t on the Kruskal coordinate chart.
Time moves upward in this diagram, so we start at
and see two galaxies in each direction equidistant in both space and time from us connected by equal length null geodesics (dashed lines). The galaxies we see are assumed to be co-moving in this example. Then we move in
t along some direction as we fall through time. The diagram shows us how our view of the galaxies along our direction of motion changes due to this motion. When we are at some
later, we no longer see the two galaxies equidistant in time and space from us. We see the galaxy we moved toward at a closer distance in both space and time to us than we did at the beginning. Conversely, we see the galaxy we moved away from at a greater distance in both space and time than we did originally (though we still see a future version of the galaxy relative to when we saw it at the beginning). But we can always define our position as
and we can do this by shifting the 3 points depicting the end of the motion in
Figure 10 along hyperbolas of constant
r by the amount
t we moved. In this depiction, we would remain at
and the galaxies would be the things moving in our reference frame (i.e. we would hyperbolically rotate the galaxies). It would look like one galaxy is moving toward us while the other is moving away.
If we were to imagine that we are revolving around some point in space in a circle and defined our t coordinate as 0 in the Kruskal diagrams for the entire motion, the worldlines of the galaxies in all directions would be sine waves along their lines of constant t with the phase of a given wave being a function of direction. In other words, the entire Universe would appear to wobble around us (which manifests itself as the CMB dipole sweeping across the CMB). Note that on a circular path since t is a hyperbolic angle, not a radius. Very importantly though, the angle we sweep as we go around that circle is not the angle in the metric. As has been discussed, the actual angle that would go into the metric would be much smaller than the angle of revolution around the point. It would be the result of the Thomas Precession caused by the angular motion.
In
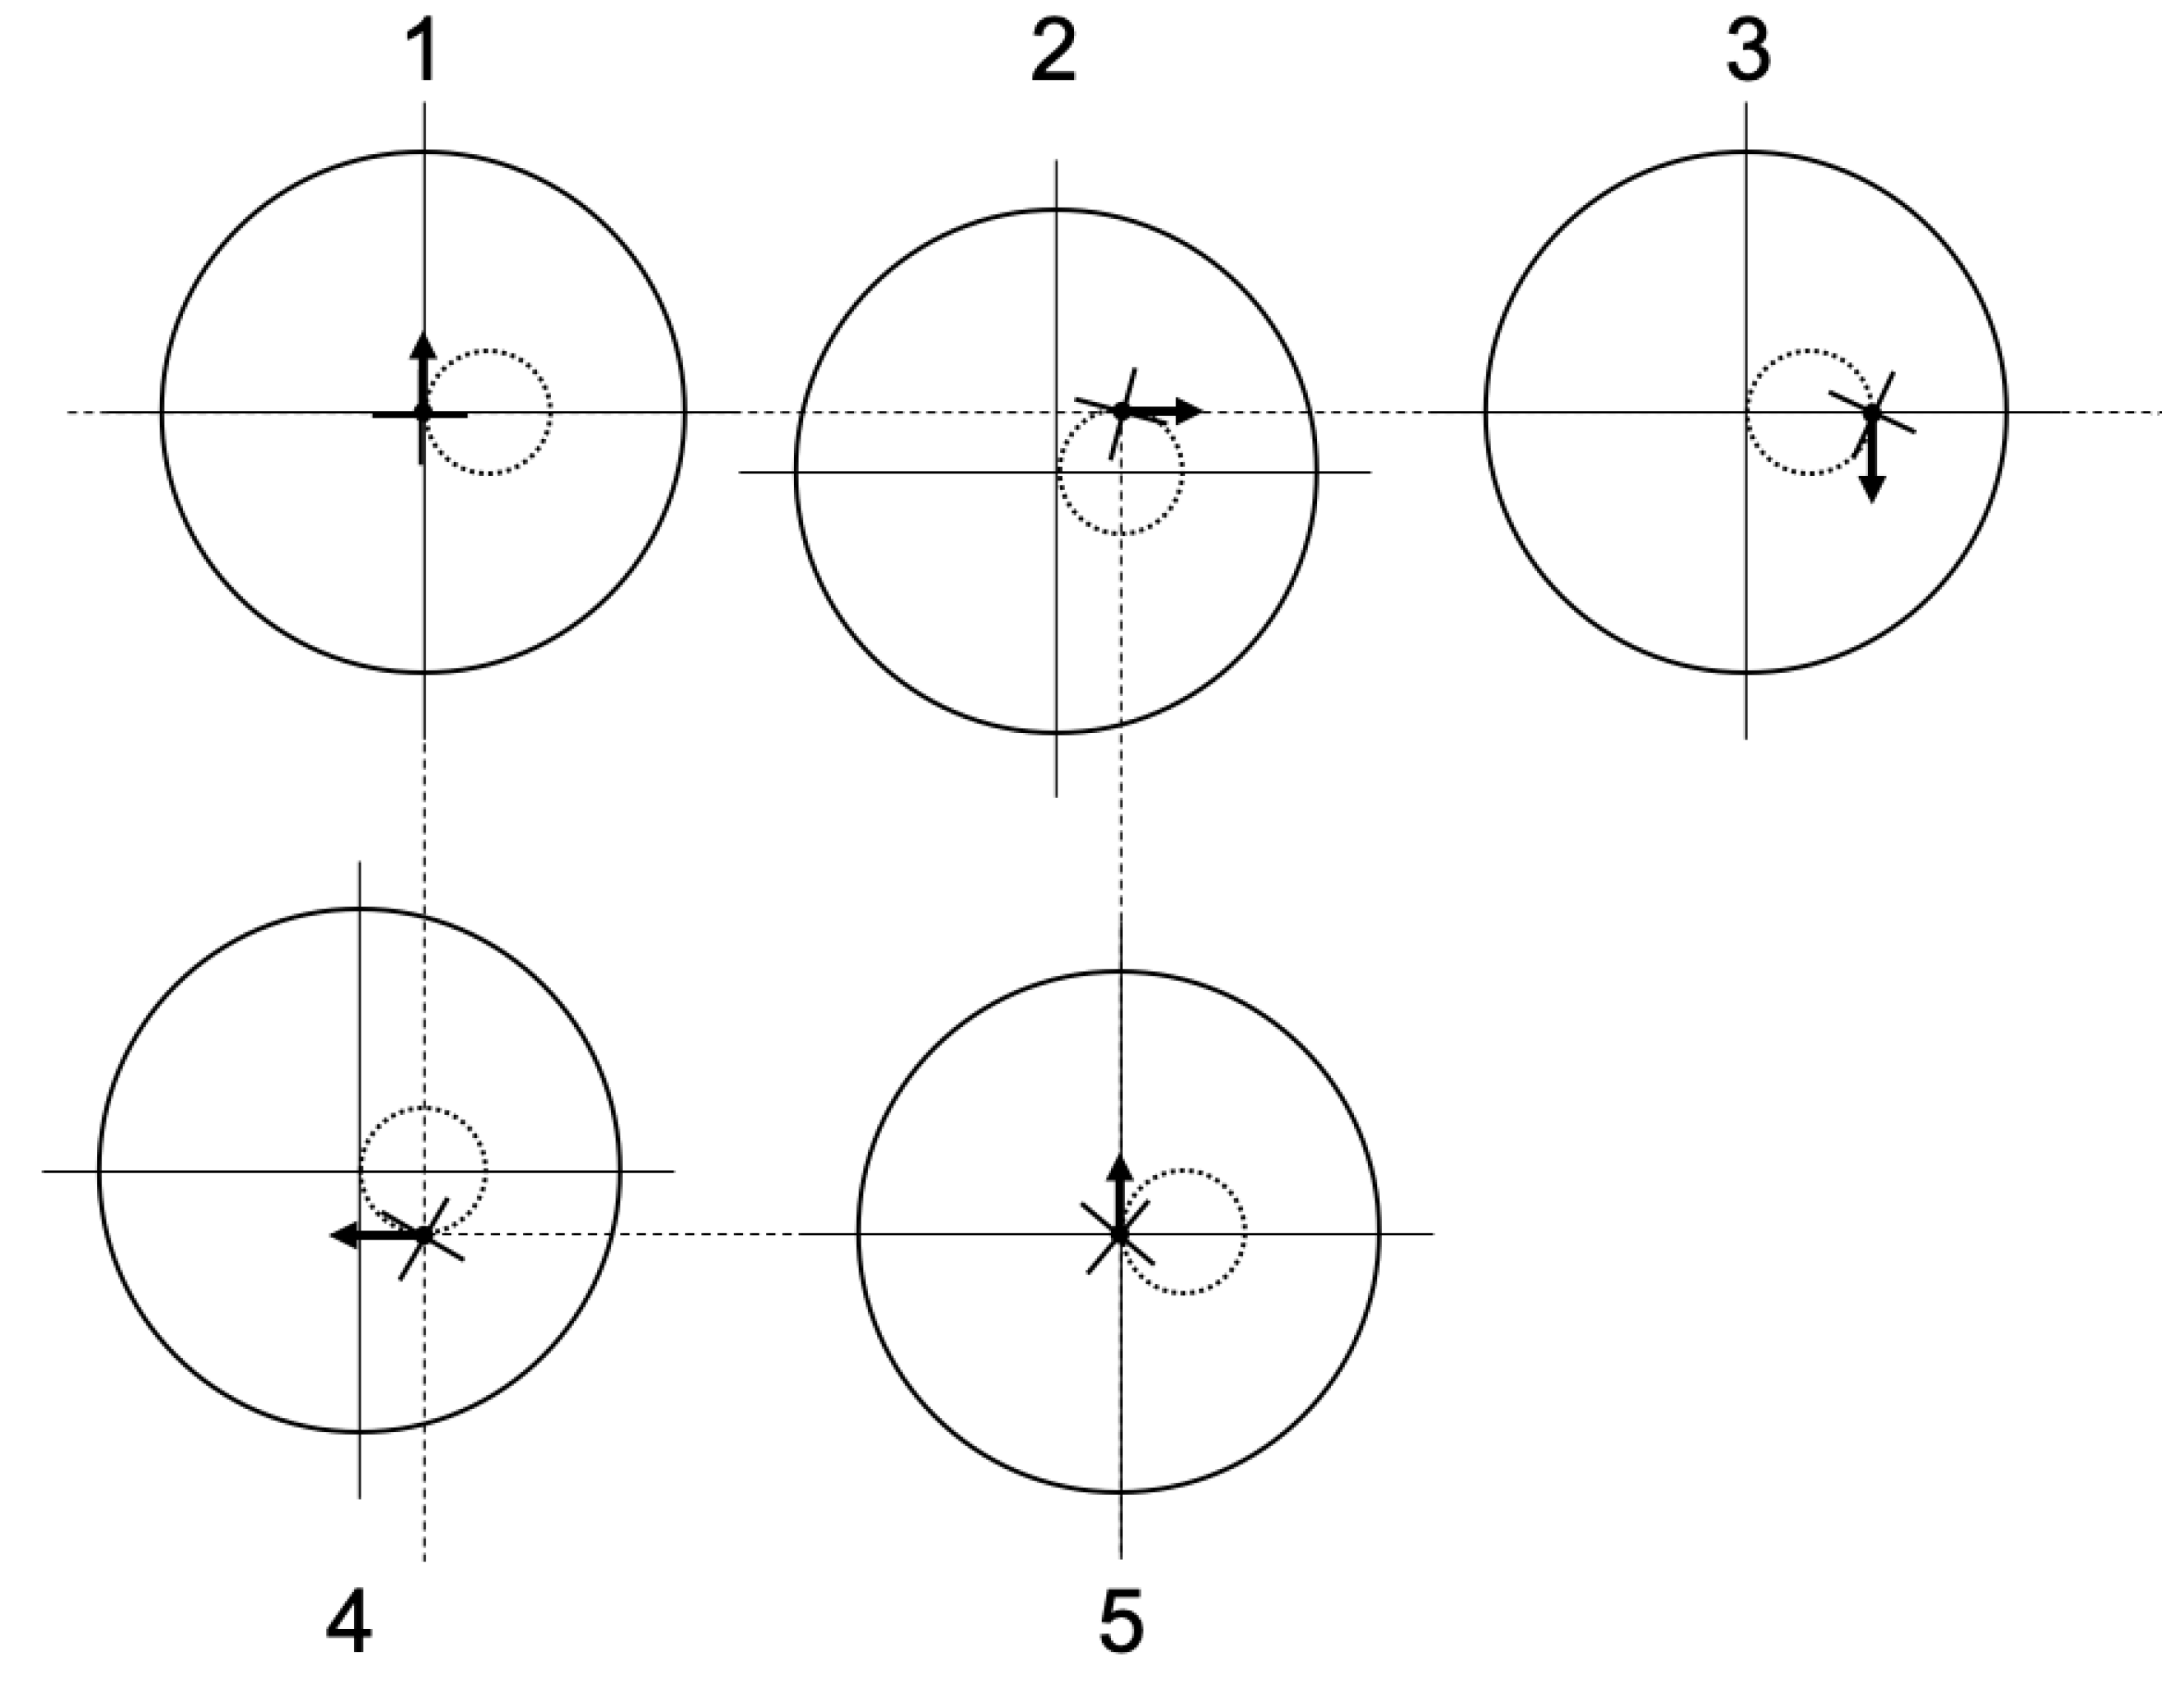
Figure 11, we show a visualization of a circular orbit to help illustrate the role of the
t and
coordinates along a curved path (sequential parts of the cycle are numbered in ascending order).
At the left side of the figure, we are at the start of the orbit where the large circle represents a set of galaxies equidistant from the orbiter at that point. The smaller dashed circle represents the orbit and the arrow represents the direction of motion of the orbiter at a given moment. As we move left to right, we show the orbiter as fixed with the space moving beneath it. What is being shown here is that the best way to view the orbit is to imagine the entire space moving beneath the orbiter (the orbit and distant galaxies are fixed together and the orbit is moved beneath the orbiter). The small bold cross-hairs attached to the observer represent the orientation of the orbiter’s reference frame. As we look left to right on the figure, we see these cross-hairs rotating slightly and this rotation represents the of the orbiter such that as the orbiter returns to its initial position at the far right, the cross-hairs are rotated relative to the far left of the figure.
Finally, it is important to emphasize the is a hyperbolic angle, not a traditional arc length or radius. So if we imagine travelling around a t x t square, we would do a hyperbolic rotation through angle t in one direction, then another hyperbolic rotation through angle t in a perpendicular direction, and so on until we return to the initial position. In the case of a circular or general curved orbit, we just do the limiting process of this where we apply continuous hyperbolic rotations through infinitesimal angles in continuously varying directions. This is why a circular orbit does not have a constant t (and therefore, we still see a CMB dipole while moving in a circular orbit).
7. Combining the Metrics
The hypothesis put forward is that the internal Schwarzschild metric describes the spacetime of spherically symmetric vacuua in the Universe. If this is correct, then we must consider how this metric and the metric of the vacuum surrounding a spherical mass transition into each other.
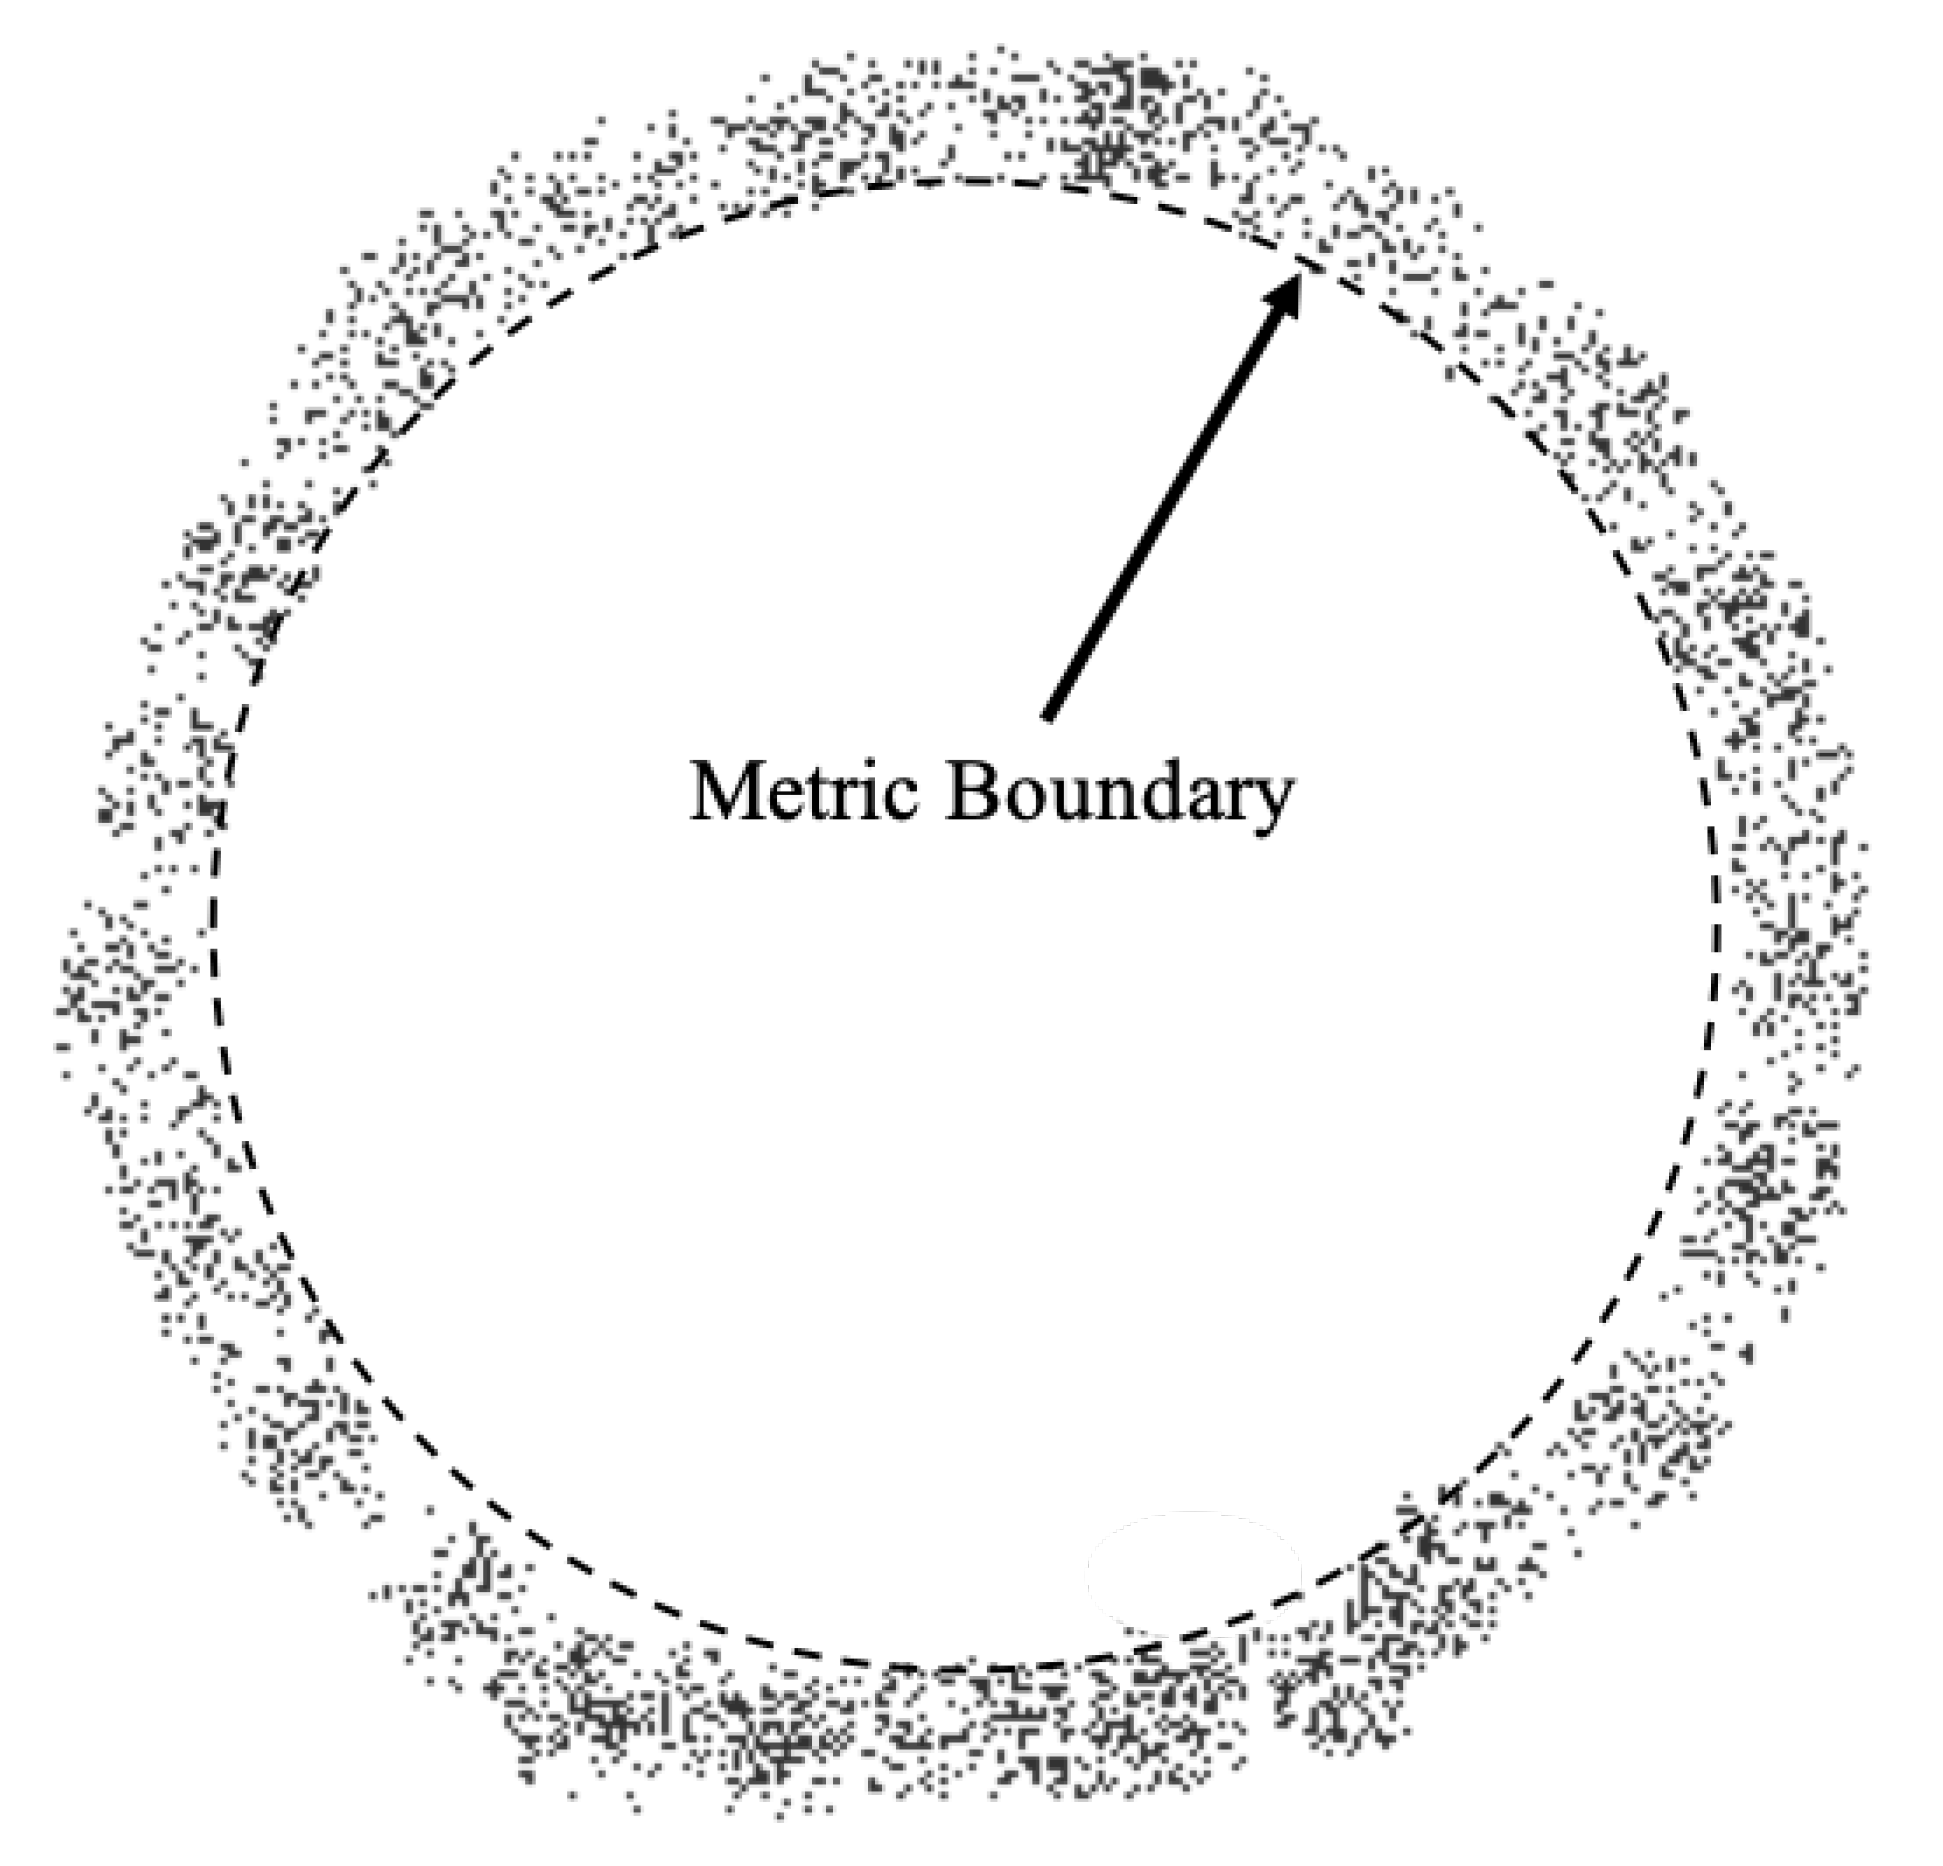
We can imagine that moving from the spacetime of the external metric to the spacetime of the internal metric amounts to moving from the gravitational field of a spherical mass that is part of a shell to the interior of that shell. If we are just outside of the inner boundary of the shell, then motion will be governed by the external metric, but once the boundary is crossed, motion is governed by the internal metric where there is no longer a preferred direction in space. Therefore, at the inner boundary of the shell, the effective Schwarzschild radius of the mass of the external metric goes to zero in the frame of the observer crossing that boundary. This boundary is illustrated in
Figure 12.
The spacetime inside that boundary will be described by the internal metric (and the volume of this space will change over time according to the scale factor a) while the spacetime outside of it near one of the stars will be described by the external metric.
We can join the two metrics together via the time dimension. First, let’s note that in the internal metric, the sign of the
term is opposite to the sign of the
term. But in the external metric, these terms both have the same sign. We can make the signs of the terms in the internal metric the same as follows:
By making the arc length of the term imaginary, the and terms now have the same sign. Thus, we can think of the radius of the internal metric as an imaginary radius and henceforth we will refer to the radius of the internal metric as to distinguish it from the real radius of the external metric r.
We must now consider how the spacetime of the external metric is affected by the expansion and collapse of the internal metric. The t coordinate of the external metric is the proper time of an observer at infinity (a Minkowski observer). But in the real Universe, the infinite observer will be a co-moving observer in a cosmic void. The proper time interval of the co-moving observer is given by . Therefore we can set of the external metric to of the co-moving observer of the internal metric. Likewise, the r coordinate of the external metric is the proper distance between spatial coordinates in the frame of the infinite observer. But for the co-moving observer in the internal metric, the proper distance of spatial coordinates changes over time according to (for clarity, we are calling the t coordinate in the internal metric since it is a spatial coordinate and is different from the external metric’s coordinate).
If we substitute
and
in the external metric, the external metric for fixed
becomes:
This metric can be used for both spacetimes where for the external metric and when the shell boundary is crossed and we are in the internal metric.
The radial speed of light of the external metric in these coordinates becomes:
Let’s consider the expansion phase of the Universe. In this phase
is negative and if the light is infalling then
is also negative, so we use the positive solution. When we get to the end of expansion at
, we see that the speed of light also goes to zero, meaning light comes to rest instantaneously at that time. If light stops moving through space at that time, then every geodesic must also stop moving through space at that time. As we continue up past the singularity,
becomes positive and since we are using the positive solution of equation
44,
must also be positive for the originally infalling light ray.
From this we can conclude that during the expansion phase of the Universe, particles fall toward massive objects. But during the collapse of the Universe, gravity becomes repulsive and masses repel one another. So it appears that true Black Holes will never form in our Universe because getting to the horizon requires infinite proper time in the frame of the co-moving observer. But the co-moving observer reaches in finite proper time and at that point falling objects come to rest and then are repelled by the central mass.
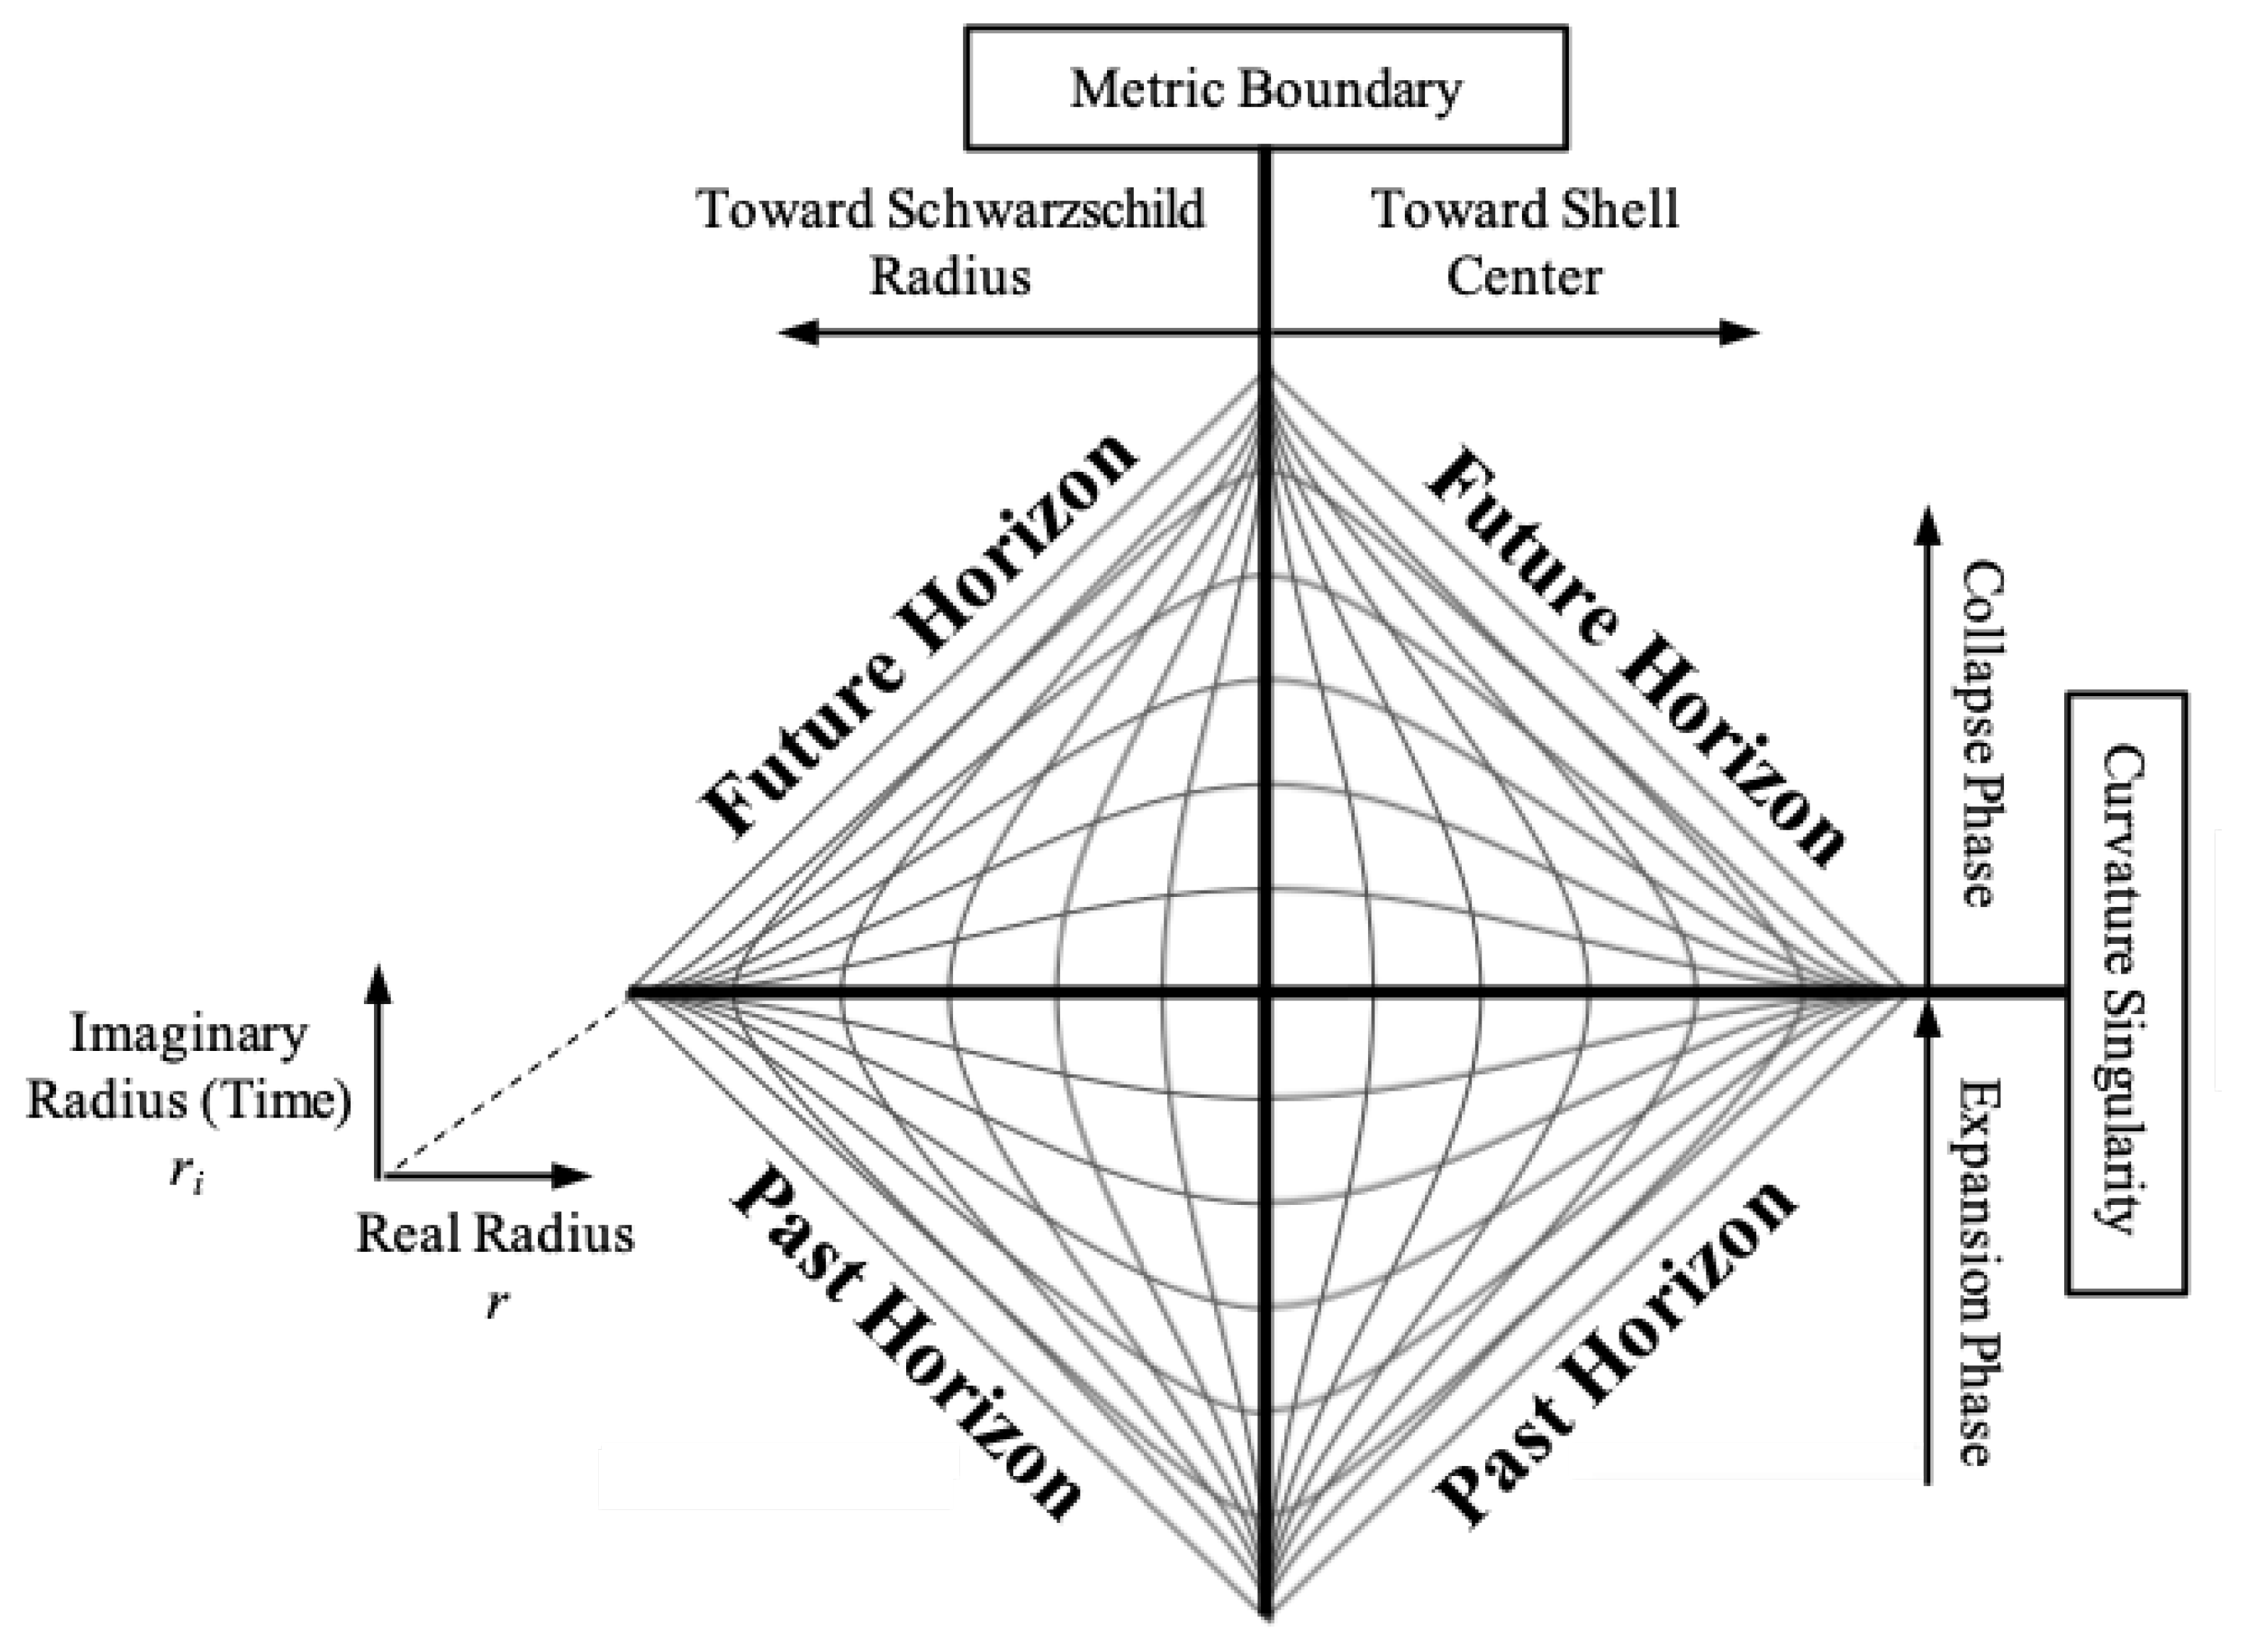
We can depict the union of the two metrics’ coordinate chart using a Penrose-like diagram to stitch the spacetimes together as shown below [
7].
In this diagram, the left point on the diamond is the Schwarzschild radius of a Black Hole and the right point is the center of the spherical shell. The bottom point would be the Big Bang and the top point would be the future time when the Universe has fully collapsed. The center horizontal line is the curvature singularity at and the center vertical line is the Metric boundary (the inner surface of a spherical shell). The external metric spacetime is on the left side of the diagram and the internal metric spacetime is on the right. The lines going from bottom to top are spatial coordinate lines related to . The lines running left to right represent time coordinates related to . Another fact of this coordinate chart is that all geodesics are vertical at the center horizontal line (which was shown mathematically for both the internal and external metrics previously).
This diagram is a patchwork of Penrose diagrams where the left side is the left half of the Penrose diagram for the external metric. The right side is made up of the Penrose diagram for the internal metric at the bottom right and its reflection at the top right. So rather than stitching the spacetime together at the event horizon, the spacetimes meet at the Metric boundary. Note that unlike on the typical Penrose chart, light-like geodesics are not straight lines on this diagram.
The spacelike coordinate lines on the left side of the chart are related to the
r coordinate. Likewise, the spacelike coordinate lines on the right side of the diagram are related to the
t coordinate. Looking at
Figure 13, the diagram is finite in width, but the Schwarzschild radius (the leftmost point) is infinitely far in
r from the center of the diagram. Furthermore, if we make the shell infinite in size, then the rightmost point, which is the center of the shell (
where
t is the spatial coordinate of the internal metric), is infinitely far in
t from the center of the diagram. If we want
from equation
43 to be 0 at the Schwarzschild radius (leftmost point of
Figure 13, 1 at the center of the diagram, and 2 at the center of the shell (rightmost point of the diagram), then we can define
in terms of the
r coordinate of the external metric and
t of the internal metric respectively:
We can solve for
as a function of
with equation
45 so that the metric from equation
43 in the
region (left side of
Figure 13) is only a function of
and
:
An important thing revealed by this coordinate chart is that we can think of the coordinate of the external metric as a real radius and the coordinate of the internal metric as a perpendicular imaginary radius (in the mathematical sense) as previously mentioned. The Kruskal-Szekeres coordinate chart also implies this as when we compare region I to region II, the r coordinates run perpendicular to each other along the X and T axes. So increases from left to right in this chart and decreases from the bottom to the middle, then increases from the middle to the top.
We now have two radii describing the spacetime. This implies that we also have two sets of spheres describing the spacetime. The real set of spheres is the one we’re used to which is a set of spheres in space surrounding a spherical mass. So when we orbit a mass, we are changing our real angular coordinates. The imaginary set of spheres are spheres of time. When we change the orientation of our reference frame, we are changing our imaginary angular coordinates.
The situation shown in
Figure 13 has fixed
,
,
,
. Consider the planar rotation (
) of a particle around a central mass. In
Figure 13, this rotation would be a rotation about the
axis where only
changes. Now if we consider a reference frame that is precessing (as described in
Section 4) about an axis aligned with
, this would amount to rotation in a plane perpendicular to the
axis (the plane is parallel to the
axis and is perpendicular to the page. If a frame with such a precession moved in the radial direction, it would move in a straight line because the spin direction of the frame is in the direction of motion. But if the frame moved in a non-parallel direction to the spin, its real angle in space would change over time as a result of the frame’s precession from the perspective of a frame at rest without any such spin. But as discussed in
Section 4, from the perspective of the precessing frame, it is the Universe that would appear to rotate around the frame as it moves in a straight line.
8. Condensation and Evaporation
We will now describe in more detail the physical meaning behind the ’Expansion’ and ’Collapse’ phases of the Universe with consideration for both the internal and external metric. Looking at Equation
10, we see that the
term is always positive. During the expansion phase,
is negative and therefore
will always be in the opposite direction of
. Therefore, this tells us that the peculiar velocities of cosmological objects will be reduced over time when no forces act upon them. Equation
10 describes an inertial force acting on all objects, slowing them down during the expansion phase. If the Universe is far from
and
, this effect is only noticable at very large time scales and velocities (because
is very small for human velocity and time scales. For instance, currently
so converting that to
gives a value on the order of
). During collapse,
is positive and now the acceleration acts in the direction of motion of the object and therefore increases its velocity over time in that phase.
So we can view the expansion phase as a condensation of the Universe. The Universe starts out as a hot plasma after which it cools and the motions of the particles slow. At the beginning of expansion, the deceleration is large (infinite at
), then for a long period the deceleration is small, and on approach to the signularity it once again goes to infinity. For just a moment at the singularity, all motion stops completely (as discussed in
Section 7). The particles stop completely at the singularity because
,
and therefore
become infinite there putting an infinite inertial drag force on all objects. This is true even for objects with a proper acceleration. So the expansion counter-intuitively effectively stabilizes gravitational structures more and more as time moves forward, promoting this condensation.
Likewise, the collapse phase can be viewed as an evaporation. After condensation, the Universe begins the collapse phase. As the Universe emerges from the singularity, the inertial force that now tends to accelerate is extremely large, but the of everything is zero, so there is no initial acceleration at the very beginning of collapse. But any perturbation to a particle’s state of rest will induce an inertial acceleration in the direction of motion. Therefore, particles will naturally gain momentum over time and the Universe will heat up as gravitationally bound structures begin to break down and the Universe tends back toward a state of hot plasma as it approaches the annihilation event. Once again , and therefore become infinite at the annihilation event, sending all particles toward light-like geodesics as though they effectively lose all their mass.
The conclusion we can draw from this is as follows. During expansion, the background of the Universe glows with decreasing temperature and brightness over time via the CMB as gravitational structures stabilize and galaxies form. During this phase, some stars will collapse to form what we presently think of as Black Holes. By the time we reach the singularity, the Universe will be fully condensed and inert. At the singularity, light from the CMB will be infinitely redshifted such that it is no longer detectable and the background Universe becomes black (because
in Equation
12 becomes infinite there). The observer will see a completely dark Universe at the singularity and over time, the Black Holes will begin to glow like candles lighting up the darkness as the geodesics of the particles that were falling toward their centers during expansion reverse and now move outward. Shadow becomes flame. These former "Black Holes" effectively become "White Holes", with matter radiating from them, seemingly out of the vacuum, even though the radiation is coming from matter that had accumulated in that region during expansion. As the collapse proceeds, these White Holes will grow brighter and shrink as the matter and energy making them up escapes to the external Universe at higher and higher energies due to the increasing inertial acceleration from Equation
10. The Universe effectively evaporates as all gravitational structures break down. By the end of collapse, the Universe has returned to a state of increasingly dense plasma until it collides with the Antiverse at
.
9. The Antiverse
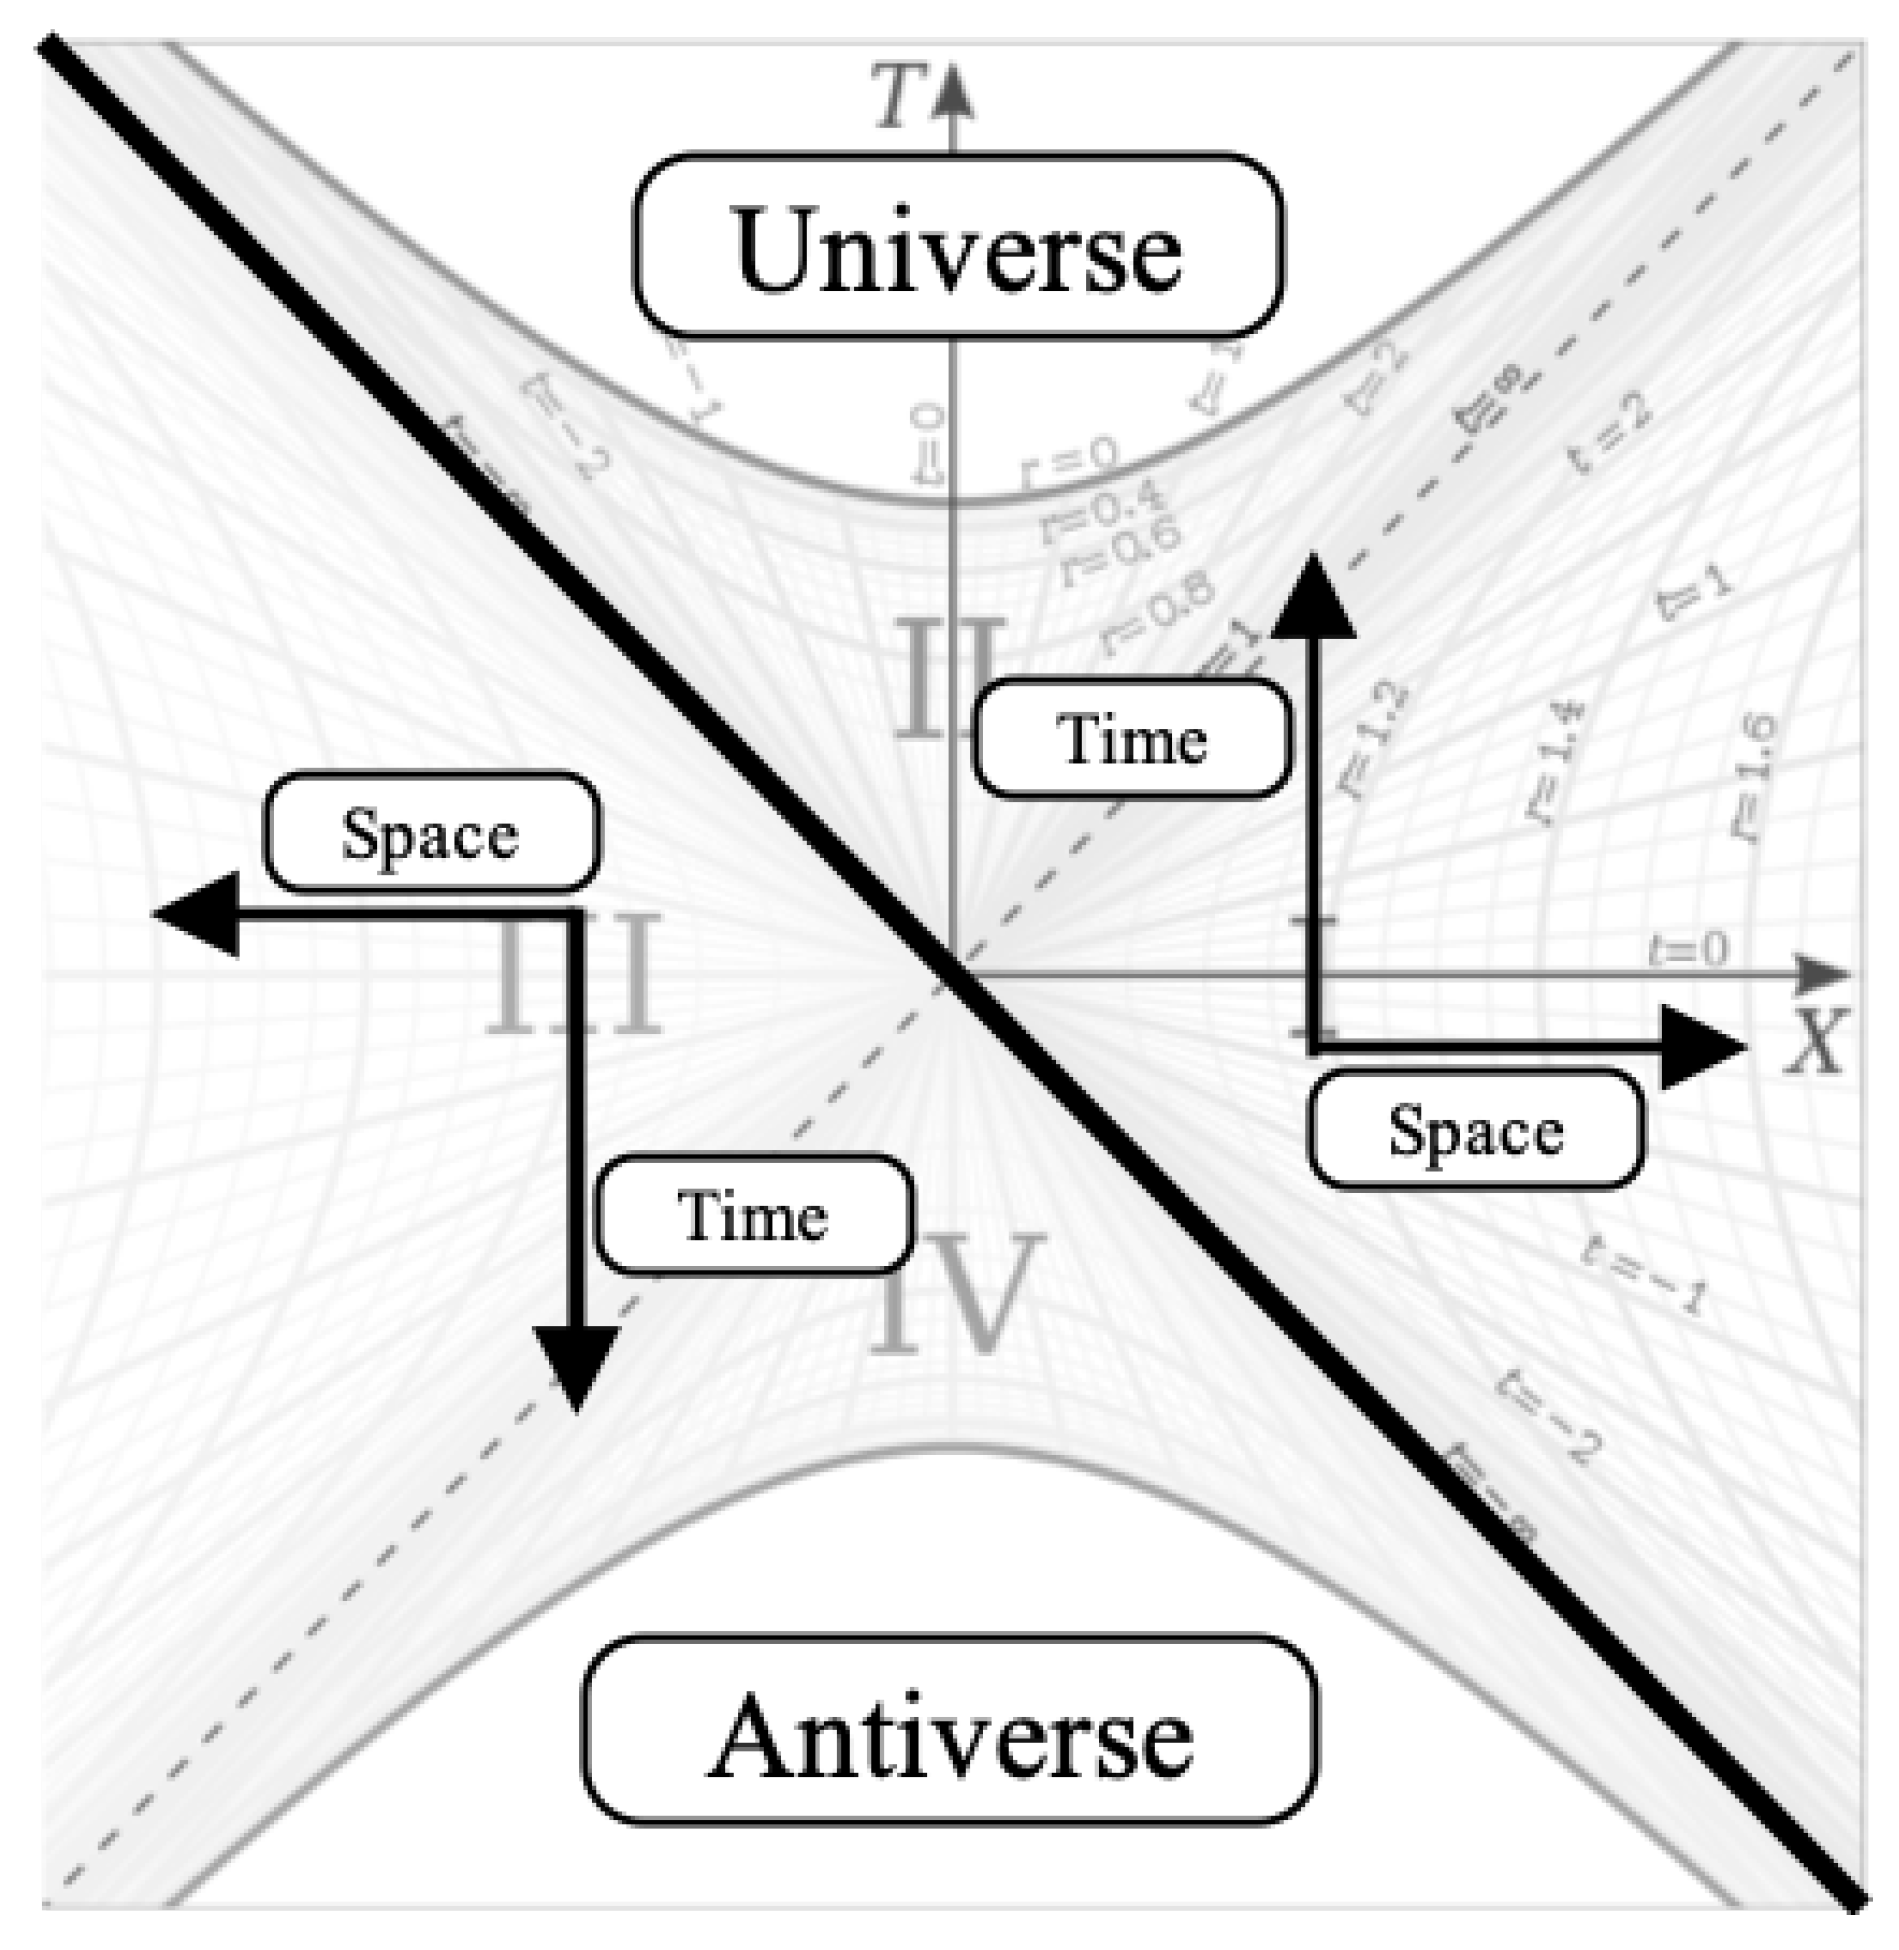
Figure 14 shows the full Schwarzschild metric in Kruskal-Szekeres coordinates. The diagram can be split in two along the diagonal where in the top right half, forward time points up in both the internal and external regions while in the bottom left half, forward in time points down. The direction of positive space is also swapped when looking at the upper and lower halves. For the external metric, the radius increases to the right in the upper half and to the left in the lower half. For the internal metric, the spatial
t coordinate goes from
to
from left to right in the upper half and from right to left in the lower half.
We can therefore conjecture that the diagram is describing both a Universe expanding up from the center and an Antiverse expanding down from the center, each one moving toward a singularity. We expect that the Antiverse is made of mostly anti-matter because the directions of both time and space are reversed relative to each other and therefore we expect the particles of the second Universe to have opposite charges relative to the first. This interpretation provides a resolution to the question of why we only tend to see matter in our Universe. It is because the equivalent amount of antimatter is contained in this mirror Universe. The lower hyperboloid sheet in
Figure 3 therefore represents a 2D slice of the Anit-Universe at a given time. Thus, the pair of Universes satisfies CPT symmetry.
Comparing
Figure 14 and
Figure 13, we see that the
T axis of the Kruskal-Szekeres coordinate chart is analogous to the
coordinate and the
X axis of the Kruskal-Szekeres chart is analogous to the
coordinate of
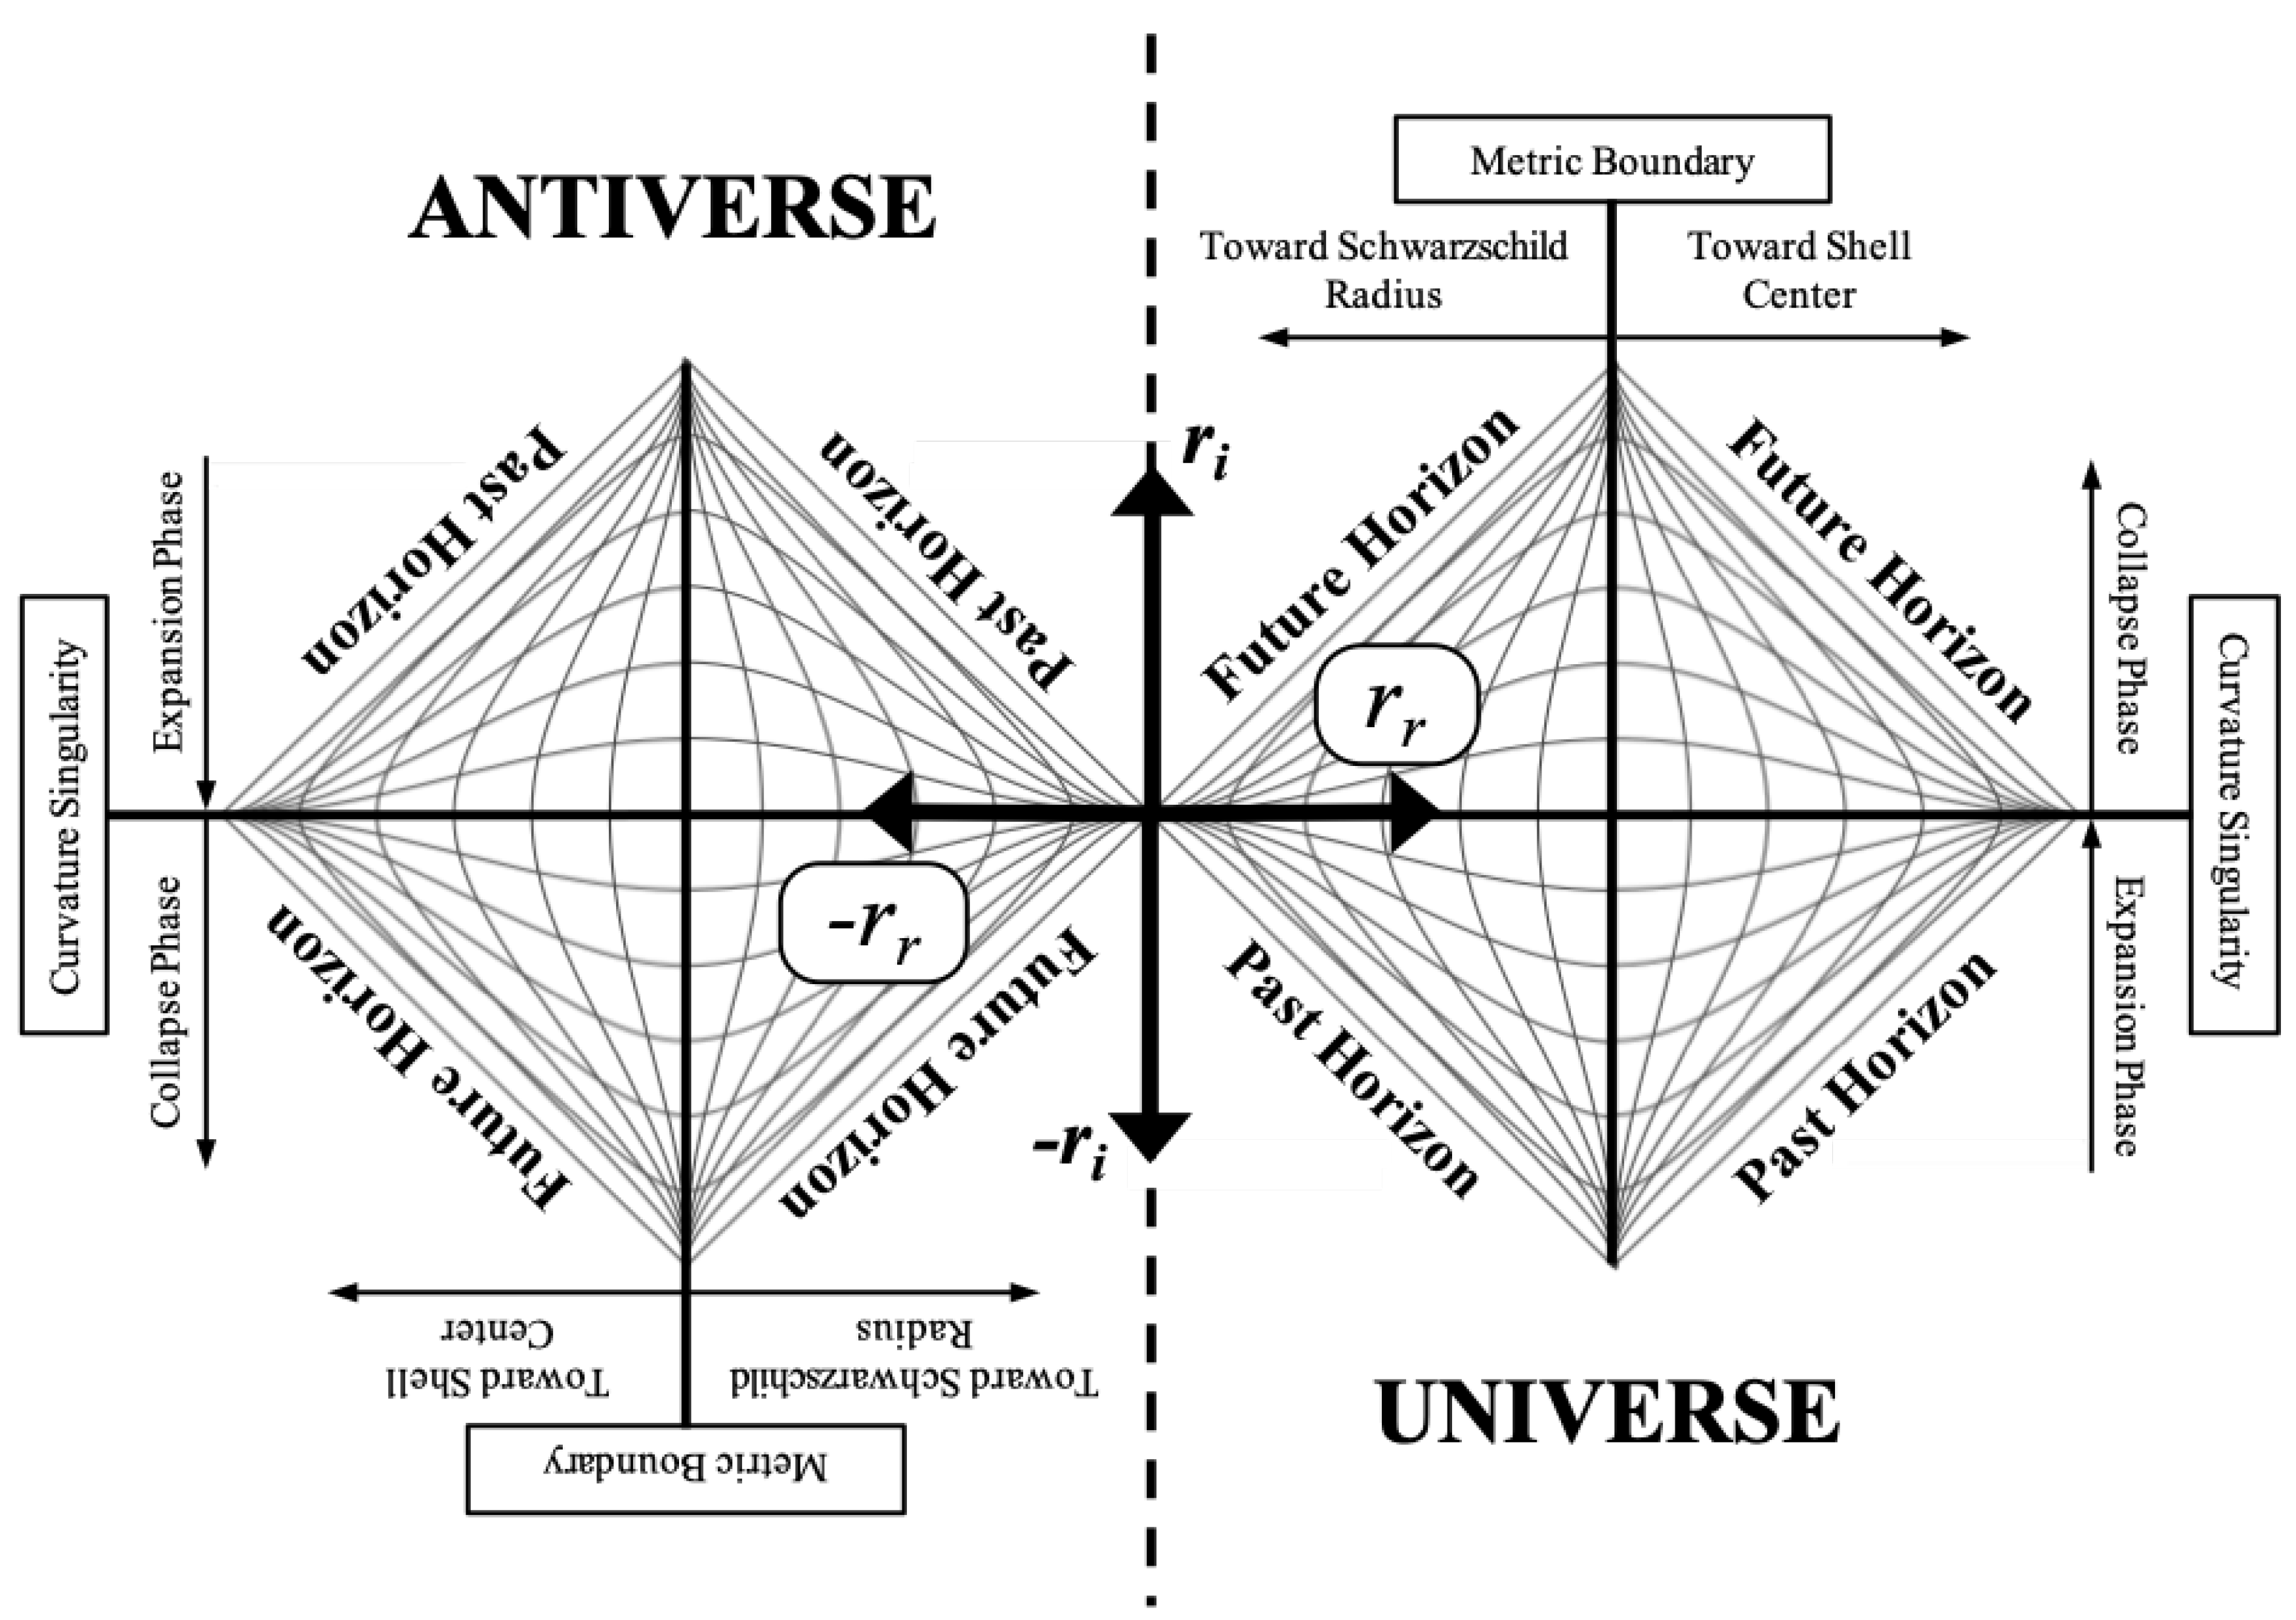
Figure 13. Therefore, we can add the Antiverse to
Figure 13 as per
Figure 15.
In the Antiverse, and . It is important to note that the angles and are constant on this chart. So does not mean that we have rotated 180 degrees in space. The is indicating a parity flip and the is indicating a flip in the direction of time. This is why it is important that these are radii. If these directions were rectangular directions X and T, then would indeed be a 180 degree rotation in space. But in standard geometry, a negative radius is nonsensical. A radius of zero is a center point, and if we are at the center point, then anywhere we move will be in the direction of increasing radius, Since the Schwarzschild metric is intrinsically spherical and quadratic, it is able to describe space and time using radii such that the sign of the radii can be used to specify the spatial and temporal parity of spacetime.
So in the Antiverse, matter moves through time in the
direction. And we can see from
Figure 15 that from the perspective of the Universe, that matter is moving backward in time. We also see the parity flip of the Antiverse and it is that parity flip that physically separates the Universe from the Antiverse.
The Antiverse in
Figure 15 can be thought of as a 180 degree rotation of the Universe around an axis perpendicular to the page, which effectively flips the directions of both space and time. But in the next section, we will look at cases where only one direction (either space or time) is flipped.
10. Matter, Anti-Matter, Spin, and Charge
Before we proceed, we need to clarify some nomenclature for reasons that will become clear. We need to be able to talk about matter, anti-matter, spin, and charge in the context of both the Universe and Antiverse. For the basis of discussion, we define the following:
Electron - Negatively charged matter particle in the Universe
Proton - Positively charged matter particle in the Universe
Positron - Positively charged anti-matter particle in the Universe
Negatron - Negatively charged anti-matter particle in the Universe
Anti-Electron - Negatively charged matter particle in the Antiverse
Anti-Proton - Positively charged matter particle in the Antiverse
Anti-Positron - Positively charged anti-matter particle in the Antiverse
Anti-Negatron - Negatively charged anti-matter particle in the Antiverse
We know that, aside from mass, particles can be classified by their spin and their charge. Spin is thought of as an intrinsic angular momentum and is analogous to the spin of the reference frame discussed in this paper. As described in
Section 7, the reference frame spin can be thought of being rotation around
. We propose here that quantum spin can be analogously understood as pointing in some real
direction such that the reference frame spin described in this paper is the classical analog to quantum spin.
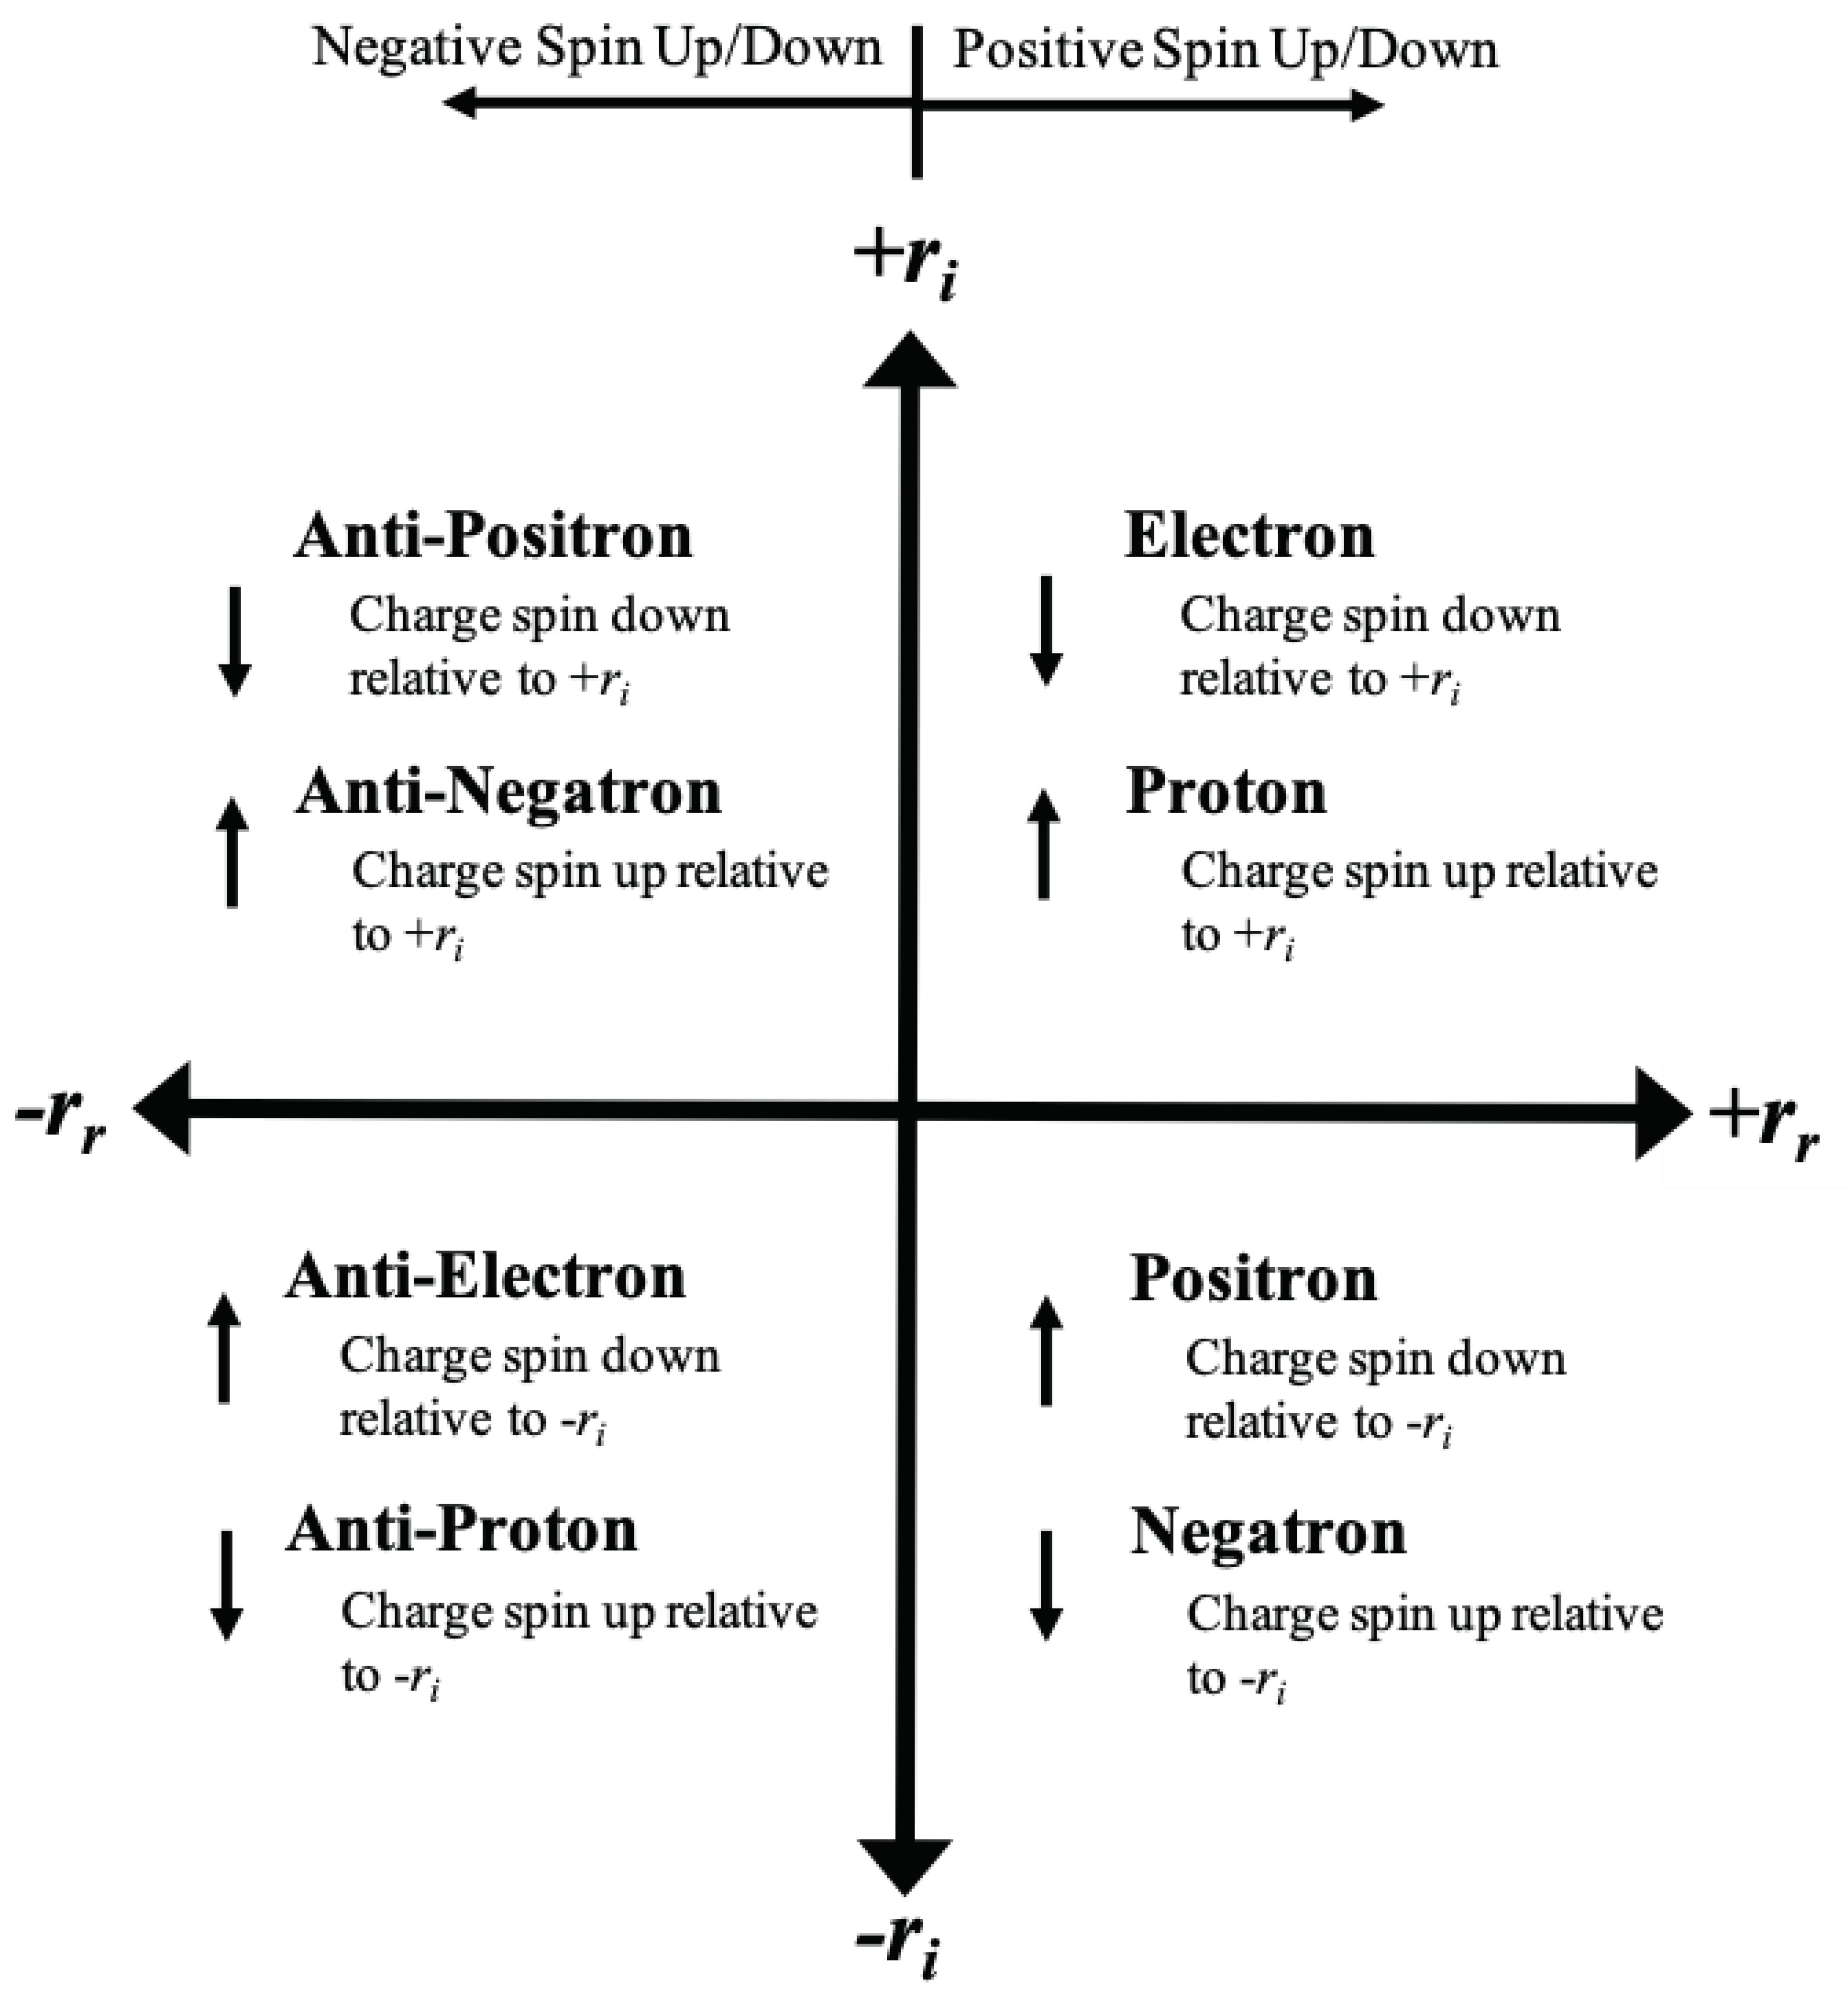
Furthermore, it is now proposed that charge is spin about the dimension. In this way, both quantum spin and charge can be thought of spins about real space and imaginary space (i.e. time) respectively. So if we look at the electron and proton, which have opposite charges, we can say that the electron is ’charge spin down’ relative to the dimension and the proton is ’charge spin up’ relative to the dimension. By ’charge spin up’ we mean the charge spin vector points in the direction of and by ’charge spin down’ we mean that the charge spin vector points in the opposite direction of the direction. Since both the electron and proton are in the Universe, they both have positive spin up or down (spin in this context refers to the usual definition of quantum spin not ’charge spin’).
For the positron and negatron, these also have positive quantum spin up/down because these particles are found in the Universe. But the positron is ’charge spin down’ relative to the
dimension and the negatron is ’charge spin up’ relative to the
dimension. The anti-particles are similarly defined, but they have negative quantum spin. The symmetry is shown in
Figure 16 below.
The reason we observe particles like positrons and negatrons in our Universe can be deduced from
Figure 15. If we only flip
to
in the Universe, the spacetime still overlaps with our Universe, but now the direction of time is reversed. Therefore, particles with that flip are moving backward in time in their frame. This is why the mathematics of QFT suggests that antimatter can be interpreted as matter moving backward in time. These particles move forward in time in our Universe, but because the direction of time is flipped in their reference frame, from their perspective they are moving backward in time.
But if we flip the parity of quantum spin of a particle from
to
, we do not observe these particles. This is because when we move from
to
in
Figure 15, the resulting spacetime does not overlap with our Universe, it overlaps with the Antiverse with time reversed relative to the Antiverse. Therefore, if we have a positively charged particle in our Universe and change its quantum spin from positive to negative, it becomes an antimatter particle in the Antiverse.
Given that we know that electrons and positrons annihilate each other to create photons, it is clear that the temporal phase of the positron is shifted 180 degrees relative to the electron and when the particles collide, the temporal phases cancel such that the photons have no spin in the
dimension, which is in agreement with the fact that photons are chargeless and would be found on the
axis of
Figure 16.
In contrast, the temporal phases of the electron and proton are aligned so there is no equivalent annihilation between them. But if an electron and anti-electron (or equivalent particles) come together, then both the temporal and spatial phases will cancel and we end up at the center of
Figure 16, which is the surface of a Black Hole. This is a place where even light has no momentum and all the particle energy is converted to mass.
Finally, uncharged particles such as photons and neutrons lie on the horizontal axis of
Figure 16 whereas spinless charged particles such as pions lie on the vertical axis. The Higgs boson, which is both chargeless and spinless, would be located at the center of the diagram.
We can summarize the relationships between classical and quantum spins as follows:
Classical Orbit - Particle revolves around a center in real space
Classical Spin - Particle’s reference frame precesses in real space. This amounts to the particle revolving around a center in imaginary space (time)
Quantum Spin - Particle is intrinsically spinning about a real axis (space)
Electric Charge - Particle is intrinsically spinning about an imaginary axis (time)
11. CMB Temperature and Absolute Simultaneity
The Minkowski spacetime of Special Relativity has no intrinsic geometric features that can be used for reference. Since it is everywhere and at all times uniform, one cannot define a universal ’present’ in Special Relativity, leading to the relativity of simultaneity. To put it more precisely, it is not possible for causally disconnected observers in Special Relativity to synchronize their clocks.
But the Schwarzschild geometry does have intrinsic geometrical features. Importantly, the intrinsically spherical nature of time in the internal metric provides causally disconnected observers the ability to synchronize their clocks by agreeing ahead of time to start their clocks when they are at a specific . This allows us to order events absolutely regardless of their spacetime separation because each event occurs at a specific and the of different events can be used to objectively order the events in time.
In our Universe, this amounts to agreeing to start the clocks when the CMB monopole is at a specific temperature. This works because the CMB temperature is related to the scale factor a of the Universe, which itself is a function of .
Since
is not itself directly measurable, it is more useful in a practical sense to use the temperature of the Universe as a measure of cosmological time. The CMB is a perfect black body and its temperature is inversely proportional to the scale factor
a. We can relate them precisely with:
Where
T and
a are the CMB monopole temperature and scale factor at any time
and
and
are the temperature and scale factor at some reference time
. To keep the equations simple, we can choose the reference scale factor to be 1 and use a temperature scale such that the CMB monopole temperature at that time is also 1. In
Section 3, it was shown that the current scale factor is very close to 1 and the current CMB monopole temperature is 2.725K. Therefore, if we measure temperature in units of Kelvin divided by 2.725, we get a unitless temperature scale and the relationship between
T and
becomes
and
Furthermore, we have an estimate for
u from
Section 3 of 27.3
. If we work in units of time where
(such that one of these units of time equals 27.3
), then we can also drop the
u from the equations (so we are working with a unitless timescale).
Taking the derivative of equation
50, we obtain:
Substituting equations
49 and
51 into equation
43 we get the metric as a function of CMB monopole temperature
T:
In these coordinates, as and as . So by using the CMB monopole temperature as a measure of cosmological time, we get a clearer understanding of time dilation. We can establish a universal rest frame in the Schwarzschild metric (the co-moving observer for whom the CMB has only a monopole), against which we can measure all motion. The velocity of a frame relative to the co-moving frame can be determined by the CMB dipole observable in that frame. Therefore, the CMB dipole seen in a given frame tells that frame its absolute velocity. This absolute velocity is not only increased motion through space relative to the co-moving observer, but also increased motion through time. A reference frame with a non-zero velocity will see the CMB monopole cool more quickly according to their clock relative to the co-moving observer as a result of the time dilation. So we can describe time dilation between two frames in our Universe as the difference in the rate at which the CMB monopole cools (or heats up in the collapsing Universe) according to the clock in each frame. A moving frame is not only moving faster through space than the co-moving observer, but also faster through cosmological time measured using the CMB monopole temperature.
Therefore, time dilation is better thought of as one frame moving faster through cosmological time than another, rather than one frame’s clock ’ticking more slowly’ than the other. And, in the author’s opinion, using the CMB monopole temperature as the measure of cosmological time allows for a more intuitive description of the time dilation.
Data Availability Statement
All data generated or analysed during this study are included in this published article [and its Supplementary Information files].
Conflicts of Interest
There are no competing interests.
References
- by Christopher Laforet, E.F. Figures 1, 3, and 9 are modifications of: ’Kruskal diagram of Schwarzschild chart’ by Dr Greg. Licensed under CC BY-SA 3.0 via Wikimedia Commons. http://commons.wikimedia.org/wiki/File: Kruskal_diagram_of_Schwarzschild_chart.svg#/media/File:Kruskal_diagram_of_Schwarzschild_chart.svg, Accessed in 2017.
- Carroll, S.M. Lecture Notes on General Relativity, 1997, [arXiv:gr-qc/9712019v1].
- Lima, J.A.S.; Jesus, J.F.; Santos, R.C.; Gill, M.S.S. Is the transition redshift a new cosmological number? 2014; arXiv:astro-ph.CO/1205.4688]. [Google Scholar]
- Bond, H.E.; Nelan, E.P.; VandenBerg, D.A.; Schaefer, G.H.; Harmer, D. HD 140283: A STAR IN THE SOLAR NEIGHBORHOOD THAT FORMED SHORTLY AFTER THE BIG BANG. The Astrophysical Journal 2013, 765, L12. [Google Scholar] [CrossRef]
- Project, S.C. Supernova Cosmology Project - Union2.1 Compilation Magnitude vs. Redshift Table (for your own cosmology fitter). http://supernova.lbl.gov/Union/figures/SCPUnion2.1 mu vs z.txt, 2010. Accessed on Aug. 17, 2017.
- Risaliti, G.; Lusso, E. Cosmological constraints from the Hubble diagram of quasars at high redshifts, 2018, [arXiv:astro-ph.CO/1811.02590].
- modified by Christopher Laforet, D. Figures 12 and 14 constructed from ’Penrose Diagram of Minkowski Spacetime.svg’ by Osanshouo. https://commons.wikimedia.org/wiki/File:Penrose_Diagram_of_Minkowski_Spacetime.svg https://creativecommons.org/licenses/by/4.0/legalcode, Accessed in 2024.
| 1 |
We can make a loose analogy to this with the external metric. Consider a point in space some distance r from the center of a star. If you move in a circle around that point in a plane perpendicular to the radius r, the angle in the metric will not be because you are not revolving around the star. Rather, the angles will be defined by the base of a cone whose tip is at the center of the star. |
|
Disclaimer/Publisher’s Note: The statements, opinions and data contained in all publications are solely those of the individual author(s) and contributor(s) and not of MDPI and/or the editor(s). MDPI and/or the editor(s) disclaim responsibility for any injury to people or property resulting from any ideas, methods, instructions or products referred to in the content. |
© 2024 by the authors. Licensee MDPI, Basel, Switzerland. This article is an open access article distributed under the terms and conditions of the Creative Commons Attribution (CC BY) license (http://creativecommons.org/licenses/by/4.0/).
