Submitted:
22 February 2023
Posted:
23 February 2023
You are already at the latest version
Abstract
Keywords:
INTRODUCTION
METHODS
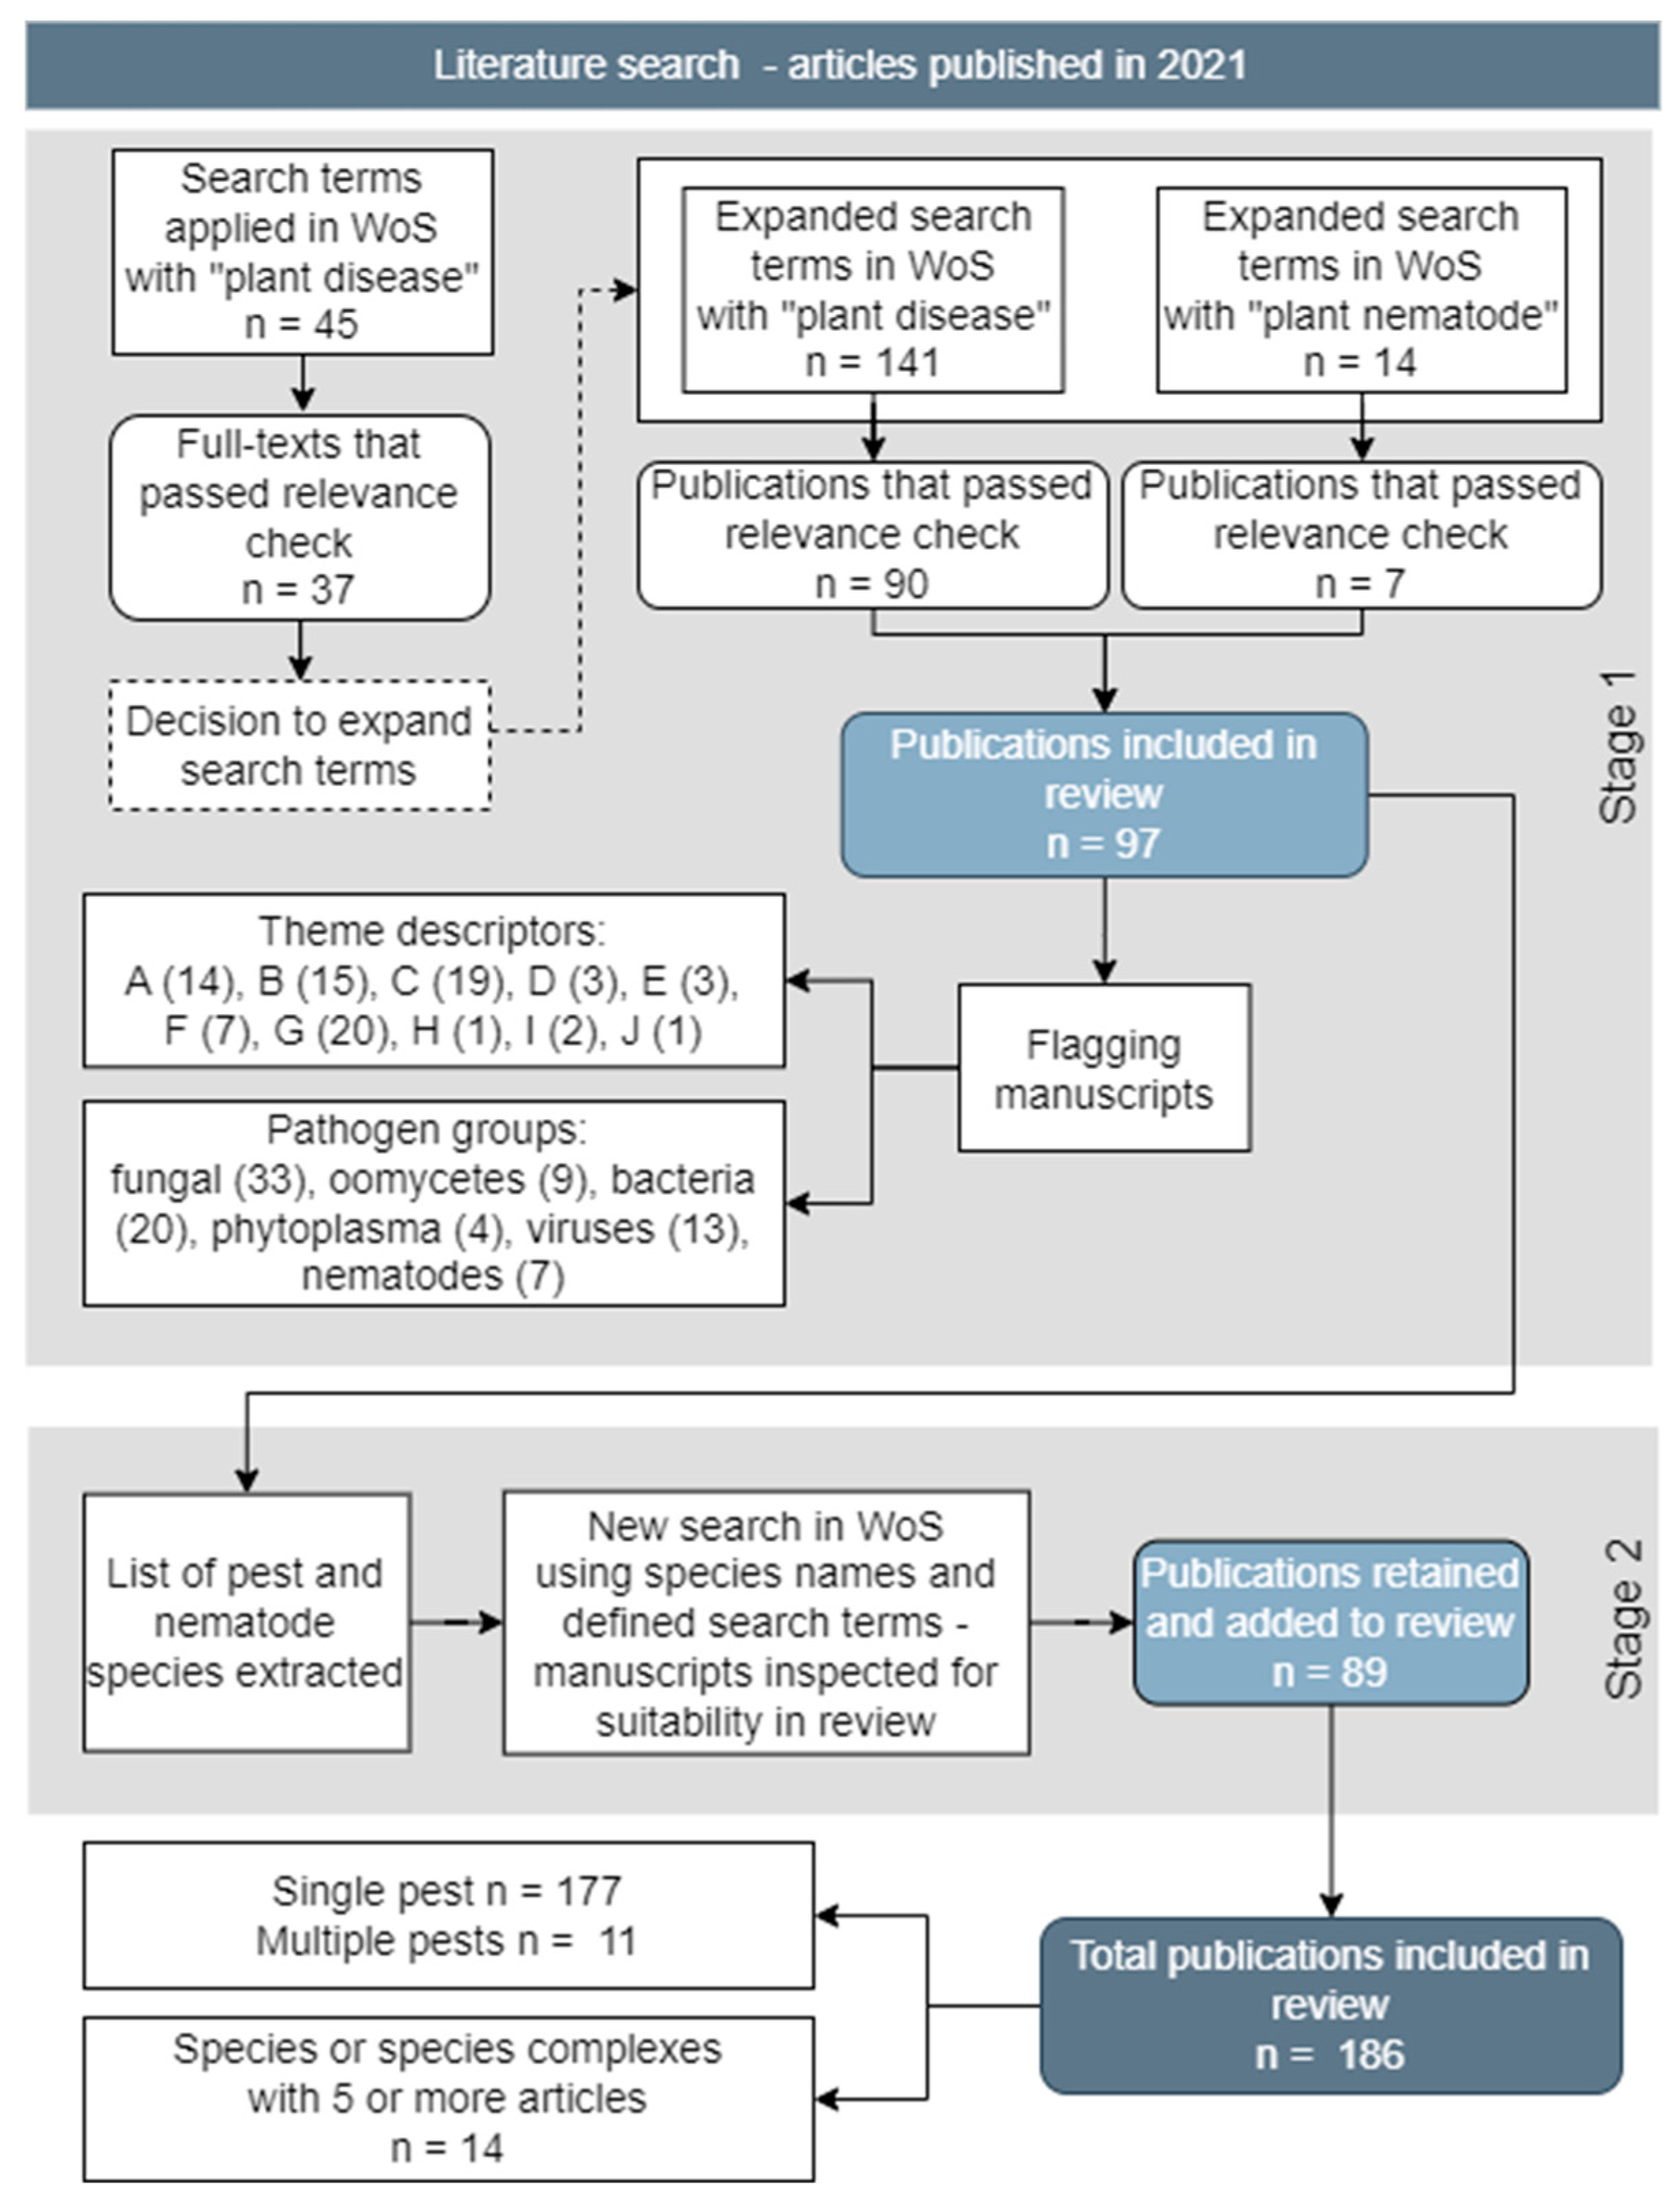
Objective 1. Published Articles on Disease Outbreaks and Epidemics
- detection, discrimination, and analysis
- surveillance, including growers and citizen science
- emergence of new pathogens, strains, and vectors
- wild hosts and weeds as inoculum reservoirs
- wild relatives, land races, and genetic resources
- wild plant populations and communities
- disease management, including varietal resistance
- biological control
- climate change and variability
- yield loss estimation
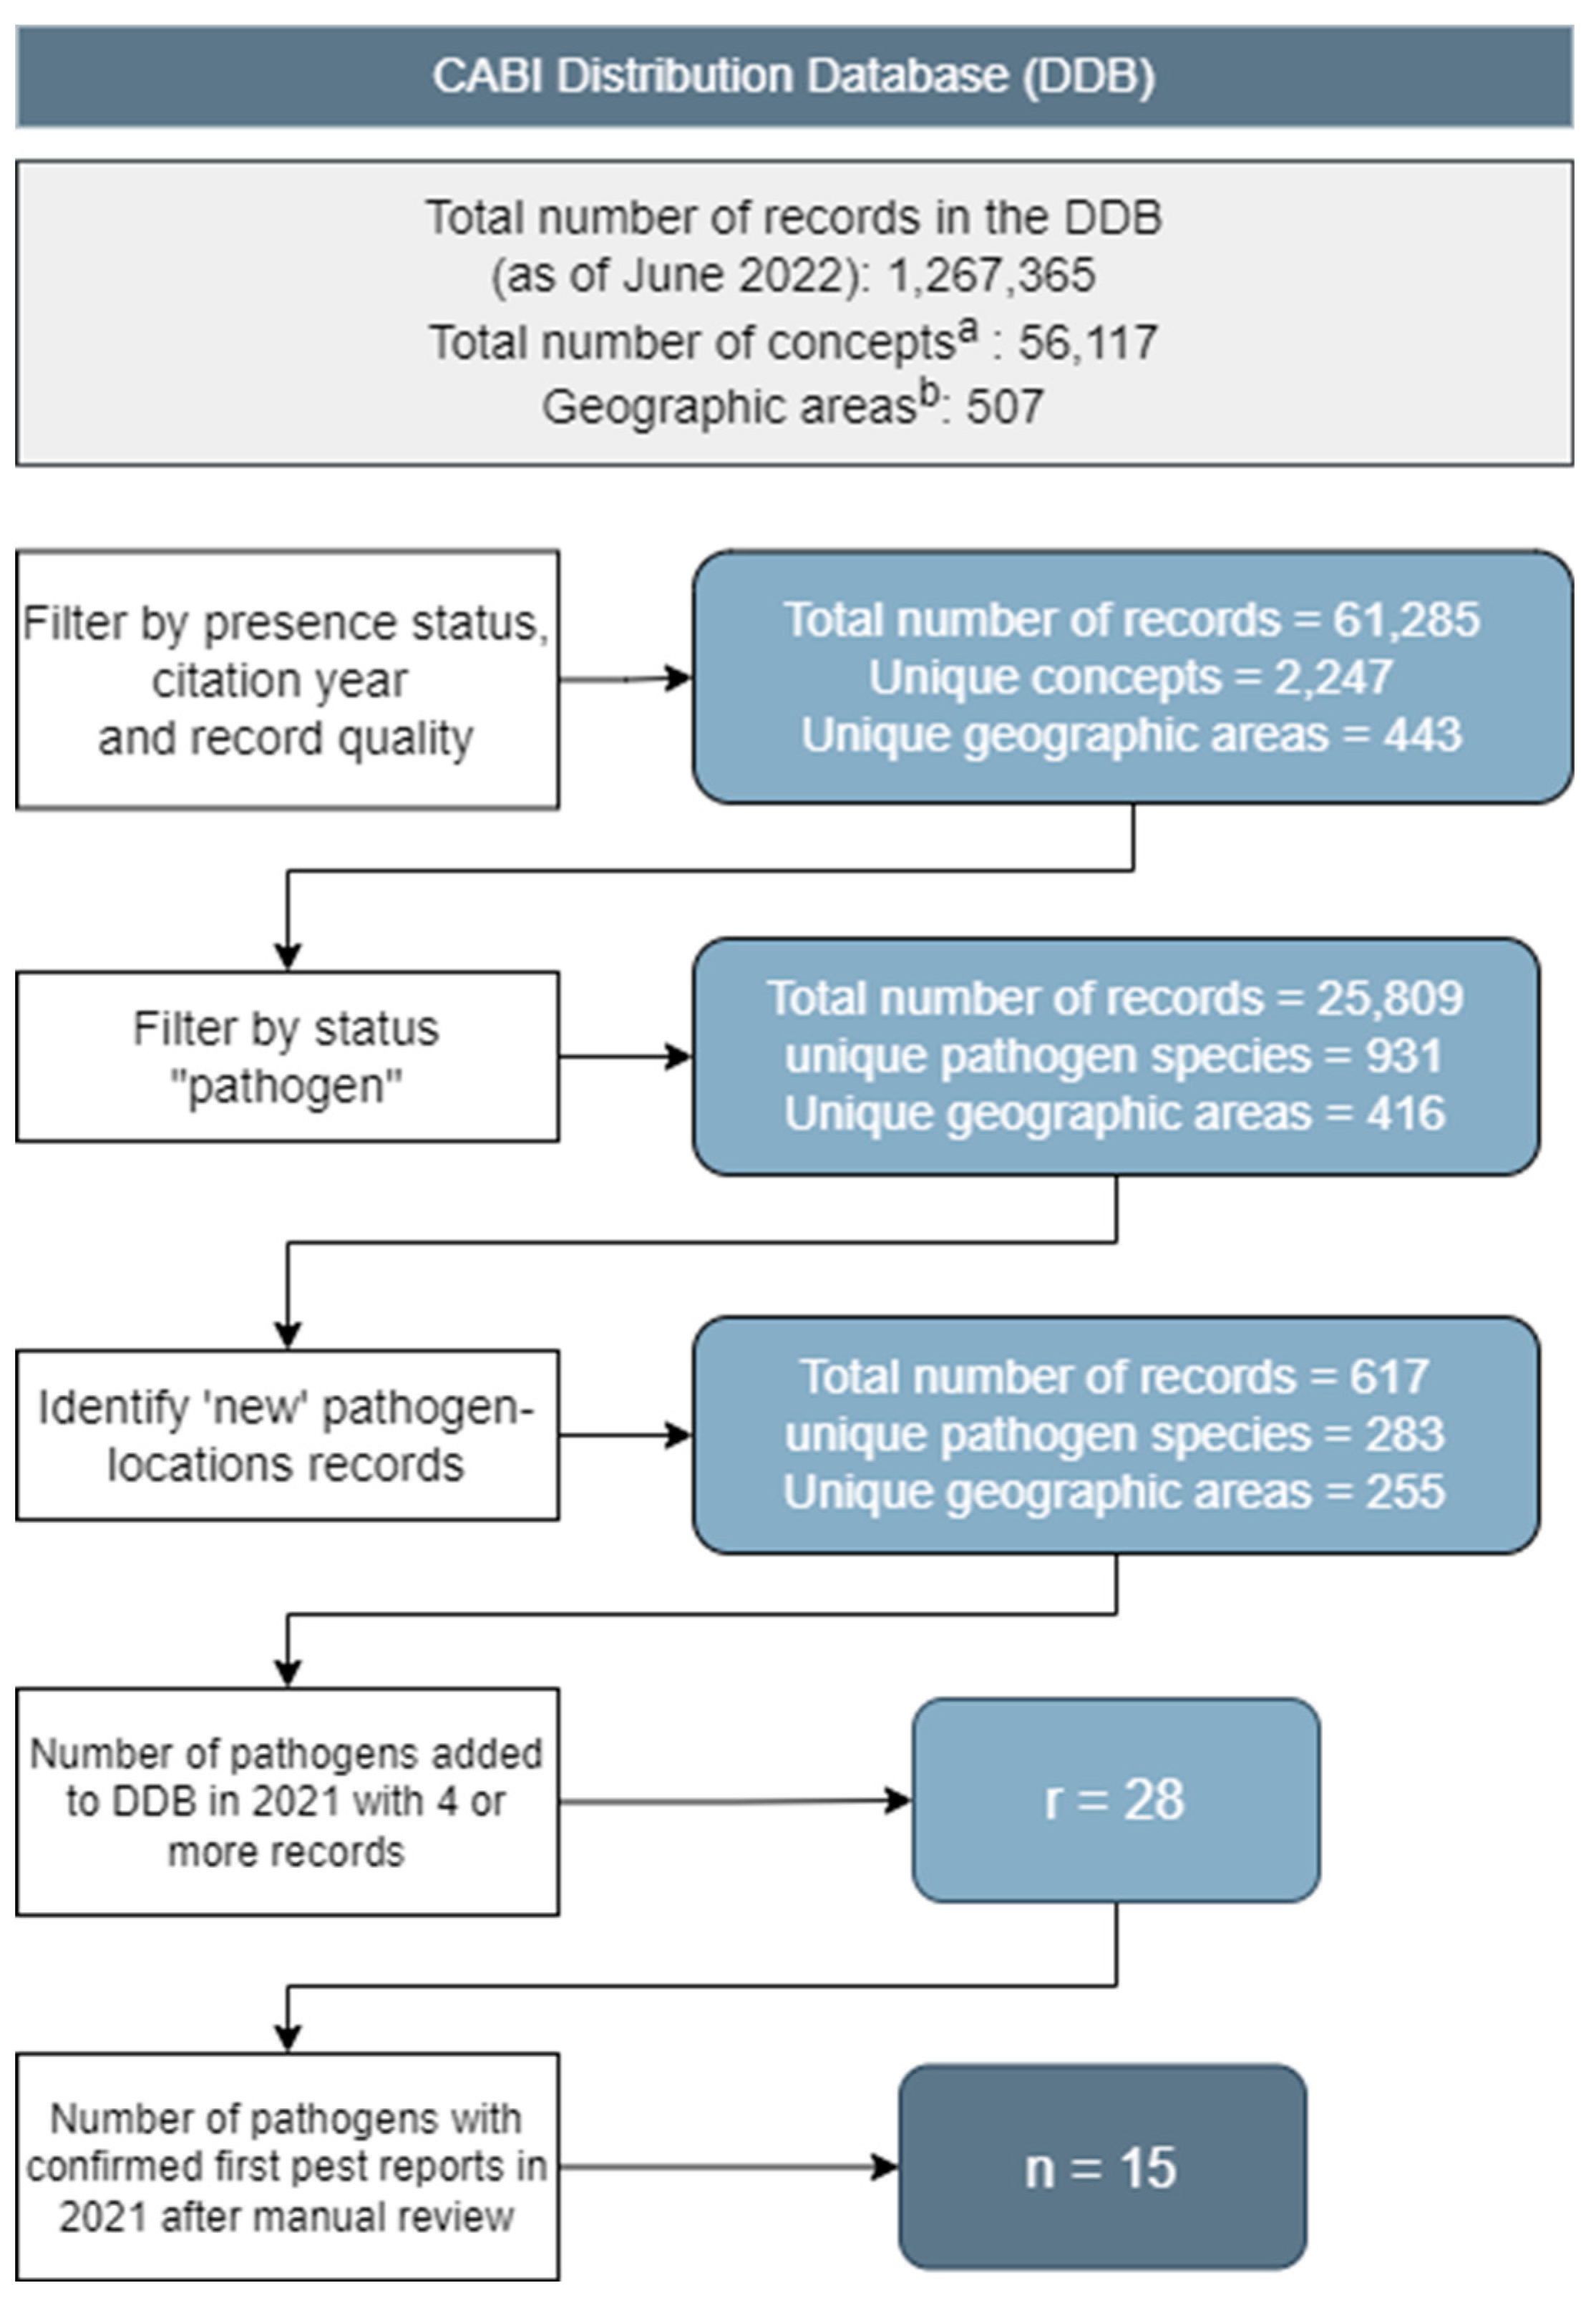
Objective 2. Records in the CABI Distribution Database
Automated Identification of Potential New Pathogen Records
Manual Review
- A confirmed first report in a location or on a new host
- Not a confirmed first report
RESULTS
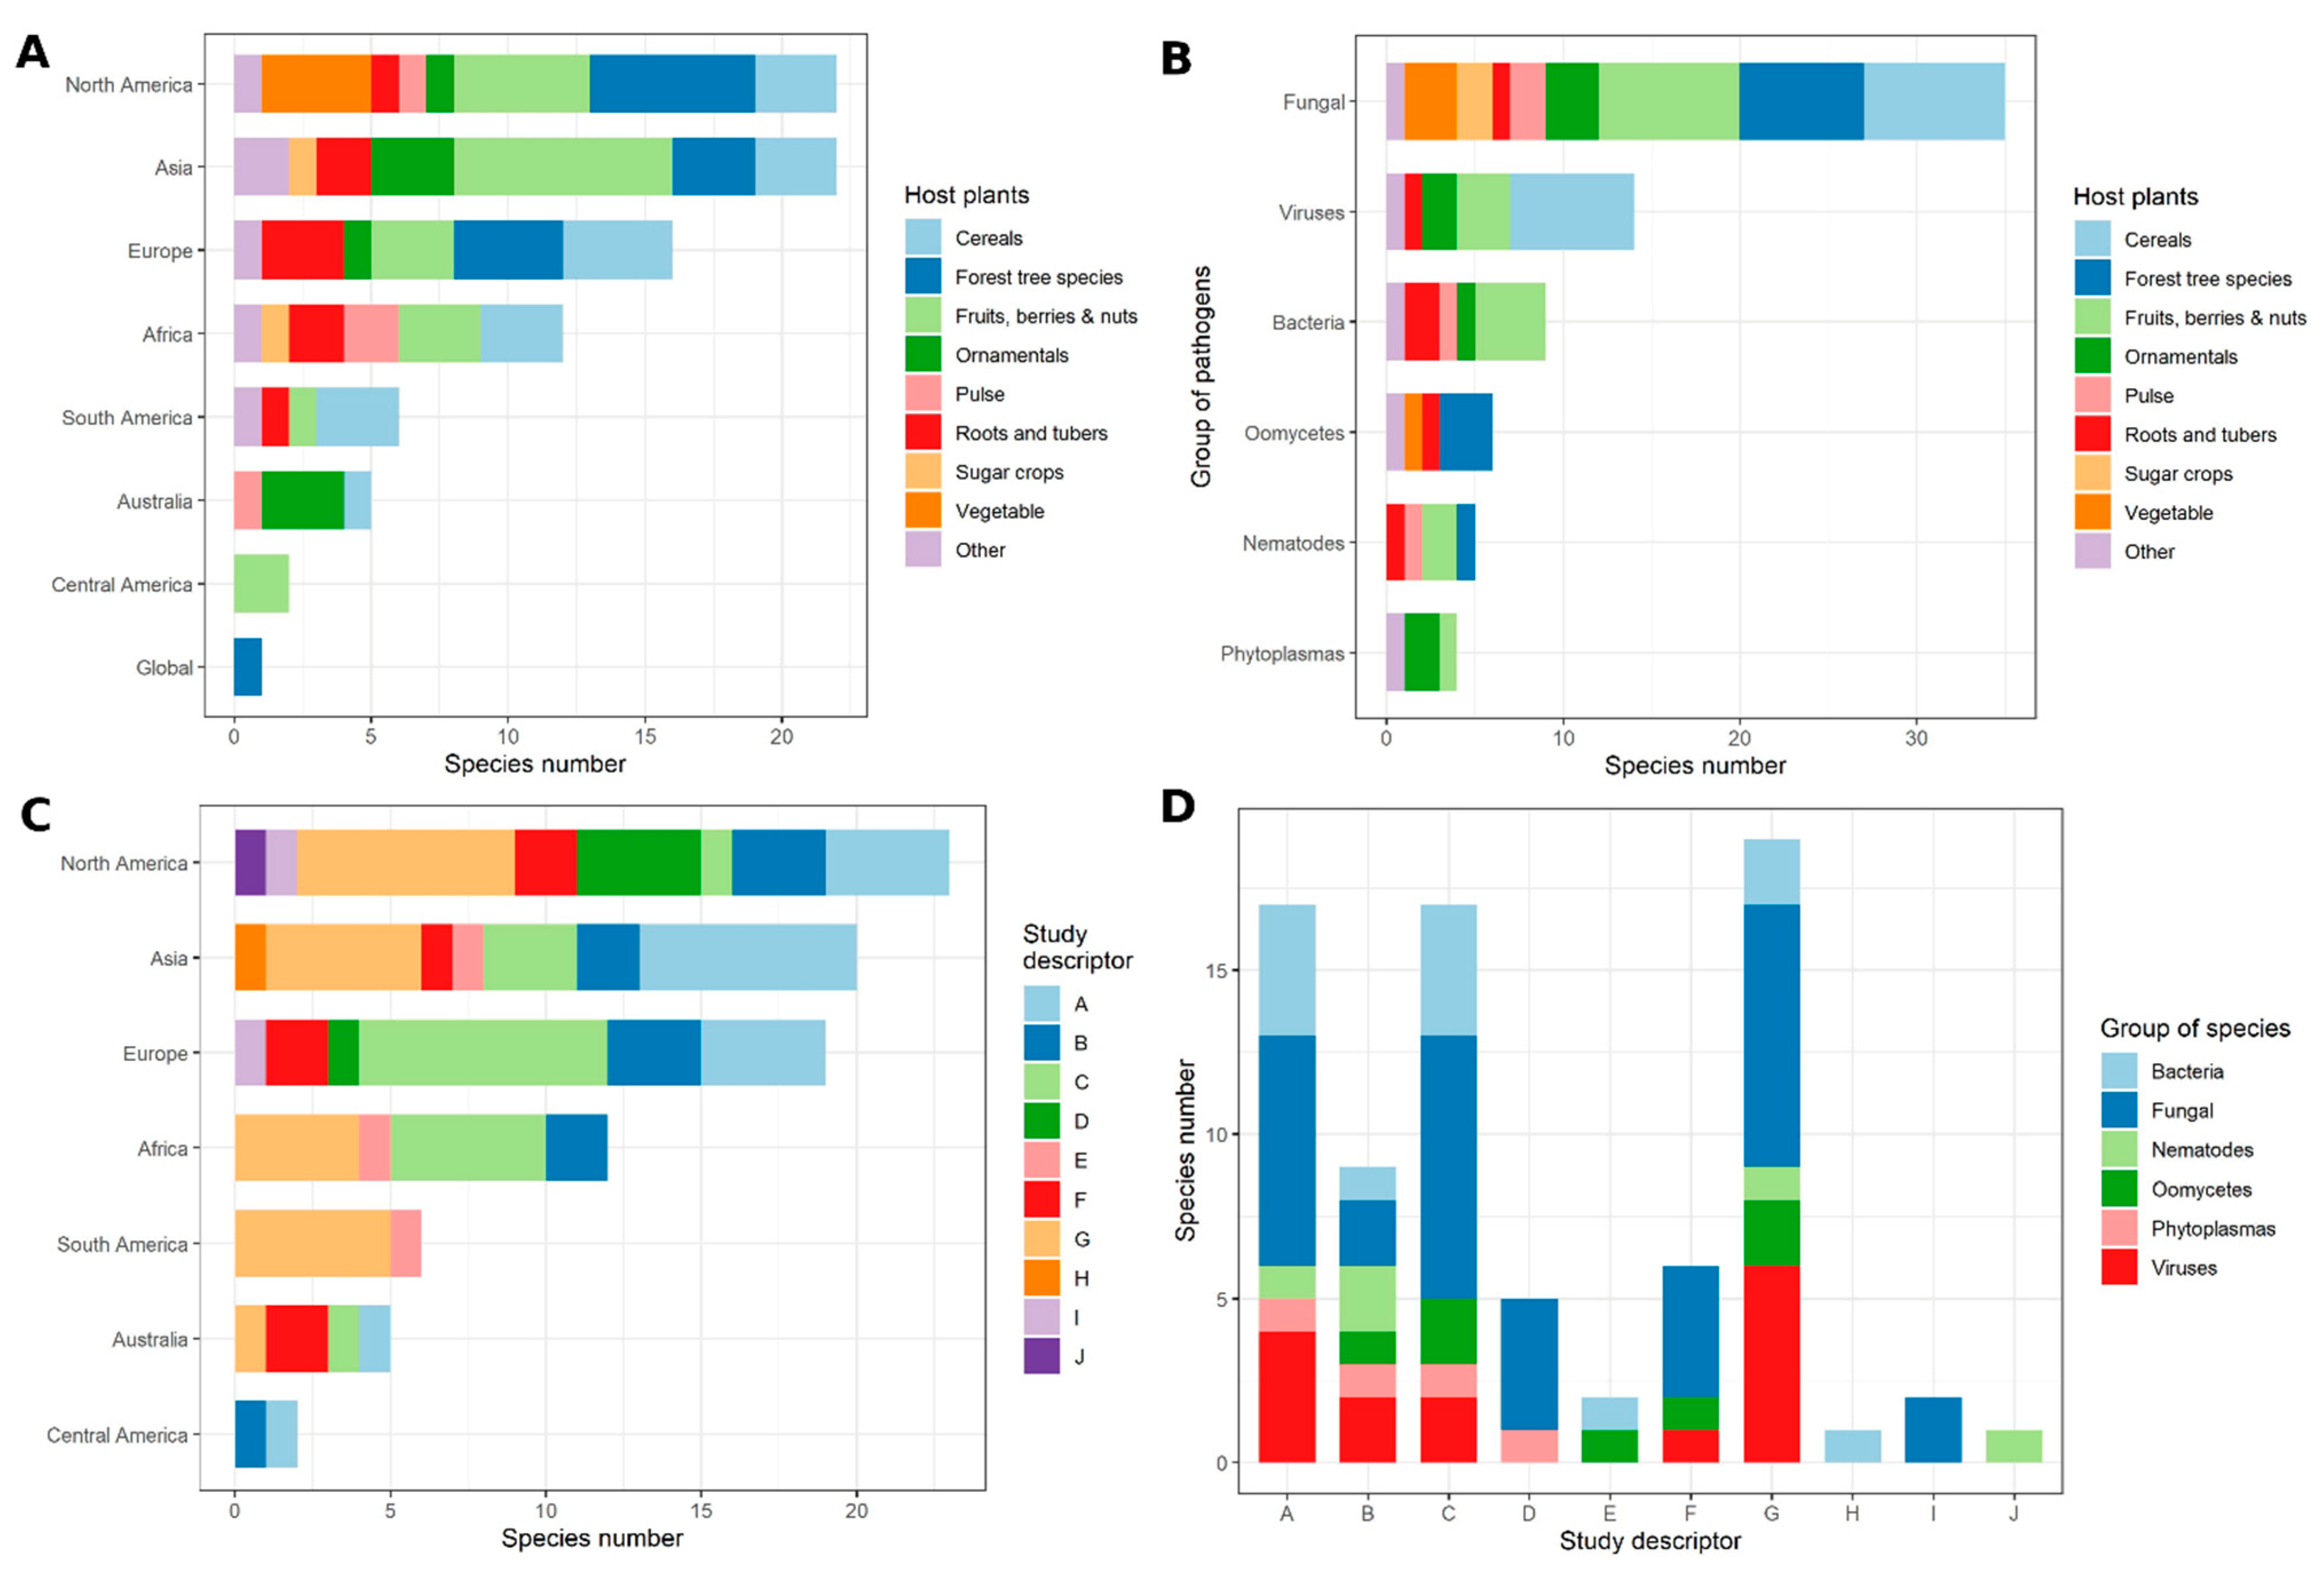
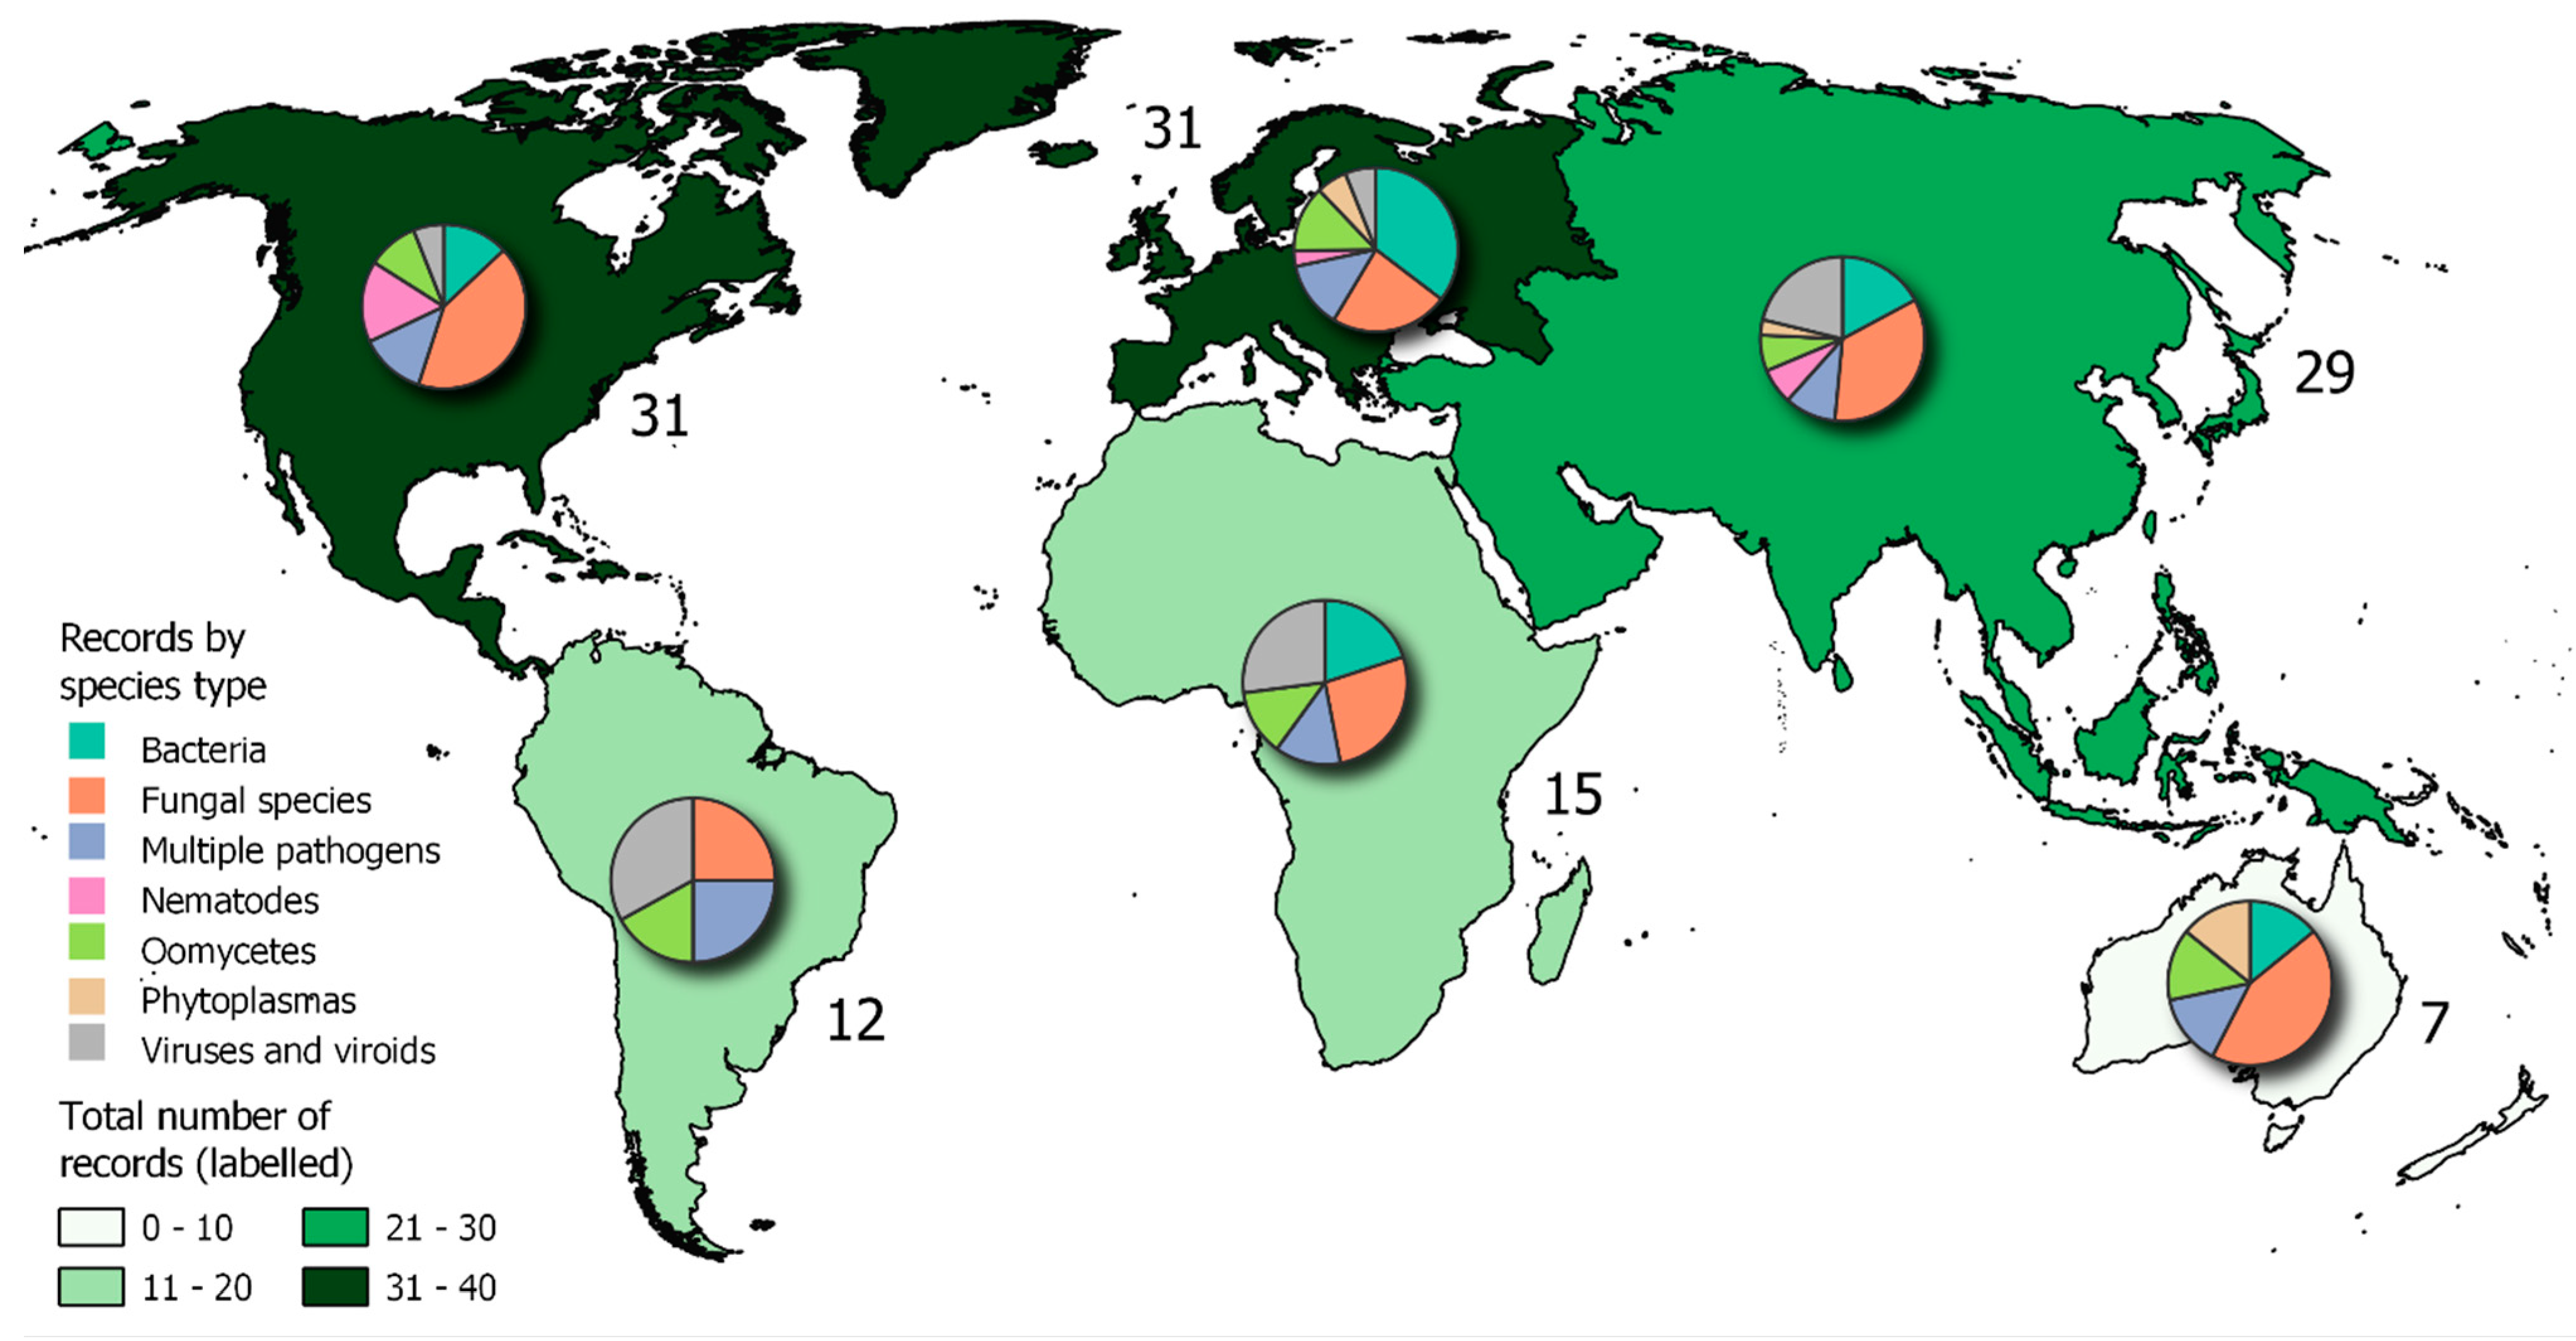
Objective 1. Published Articles on Disease Outbreaks and Epidemics
Objective 2. Records in the CABI Distribution Database
Which Pathogens Are Actively Spreading/Emerging?
Comparing the Results Obtained for Objective 1 and Objective 2
DISCUSSION
Which Limitations Might Affect Our Methodology?
Which Factors Might Bias Our Results?
Implications for Disease Management
Predicting Future Spread of Disease
Climate Change, Yield & Ecosystem Services
Outlook
Supplementary Materials
ACKNOWLEDGEMENTS
OPEN ACCESS STATEMENT
References
- Abrahamian, P.E.; Sobh, H.; Seblani, R.; Abou-Jawdah, Y. Coinfection of two criniviruses and a begomovirus enhances the disease severity in cucumber. Eur. J. Plant Pathol. 2015, 142, 521–530. [Google Scholar] [CrossRef]
- Amari, K.; Huang, C.; Heinlein, M. Potential impact of global warming on virus propagation in infected plants and agricultural productivity. Front. Plant Sci. 2021, 12, 649768. [Google Scholar] [CrossRef]
- Agrios, G. Agrios, G. Plant diseases caused by procaryotes: bacteria and mollicutes. Chapter 12 in Plant Pathology (Fifth Edition) Elsevier Press inc. 2005, pp 615-703.
- Ares, A.; Pereira, J.; Garcia, E.; Costa, J.; Tiago, I. The leaf bacterial microbiota of female and male kiwifruit plants in distinct seasons: assessing the impact of Pseudomonas syringae pv. Actinidiae Phytobiomes J. 2021, 5, 275–287. [Google Scholar] [CrossRef]
- Bastos, L.S.; Economou, T.; Gomez, M.F.C.; Villela, D.A.M.; Coehlo, F.C.; Cruz, O.G.; et al. A modelling approach for correcting reporting delays in disease surveillance data. Stat. Med. 2019, 38, 4363–4377. [Google Scholar] [CrossRef] [PubMed]
- Bebber, D.P. Climate change effects on Black Sigatoka disease of banana. Philos. Trans. R. Soc. B 2019, 374, 20180269. [Google Scholar] [CrossRef]
- Bebber, D.P.; Ramotowski, M.A.T.; Gurr, S.J. Crop pests and pathogens move polewards in a warming world. Nat. Clim. Change 2013, 3, 985–988. [Google Scholar] [CrossRef]
- Bebber, D.P.; Holmes, T.; Gurr, S.J. The global spread of plant pests and pathogens. Glob. Ecol. Biogeogr. 2014, 23, 1398–1407. [Google Scholar] [CrossRef]
- Bebber, D.P.; Field, E.; Gui, H.; Mortimer, P.; Holmes, T.; Gurr, S.J. Many unreported crop pests and pathogens are probably already present. Glob. Change Biol. 2019, 25, 2703–2713. [Google Scholar] [CrossRef] [PubMed]
- Bernard, G.C.; Egnin, M.; Bonsi, C. ‘The Impact of Plant-Parasitic Nematodes on Agriculture and Methods of Control’, in M. M. Shah, M. Mahamood (eds.), Nematology – Concepts, Diagnosis and Control, IntechOpen, London. 2017.
- Beyer, M.; Marozsak, B.; Dam, D.; Parisot, O.; Pallez-Barthel, M.; Hoffmann, L. Enhancing Septoria leaf blotch forecasts in winter wheat II: model architecture and validation results. J. Plant Dis. Prot. 2022, 129, 45–51. [Google Scholar] [CrossRef]
- Bhattacharya, S. Deadly new wheat disease threatens Europe’s crops. Nature 2017, 542, 145–146. [Google Scholar] [CrossRef]
- Bibi, M.; Hanif, M.K.; Sarwar, M.U.; Khan, M.I.; Khan, S.Z.; Shivachi, C.S.; et al. Monitoring population phenology of Asian citrus psyllid using deep learning. Complexity: online 2021, 4644213.
- Brasier, C.M. The biosecurity threat to the UK and global environment from international trade in plants. Plant Pathol. 2008, 57, 792–808. [Google Scholar] [CrossRef]
- Brown, J.K.M. and Hovmøller, M.S. Aerial dispersal of pathogens on the global and continental scales and its impact on plant disease. Science 2002, 297, 537–541. [Google Scholar] [CrossRef] [PubMed]
- Brown, N.; Perez-Sierra, A.; Crow, P.; Parnell, S. The role of passive surveillance and citizen science in plant health. CABI Agric. Bioscience. 2020, 1, 17. [Google Scholar] [CrossRef] [PubMed]
- Burdon, J.J.; Zhan, J. Climate change and disease in plant communities. PloS Biol. 2020, 18, e3000949. [Google Scholar] [CrossRef] [PubMed]
- CABI, 2023. Cucurbit chlorotic yellows virus [original text by Maliogka, V.; Orfanidou, C. and Katis, N.]. In: Invasive Species Compendium. Wallingford, UK: CAB International. www.cabi.org/isc.
- CABI, 2023. Apple hammerhead viroid [Distribution map]. In: Distribution Maps of Plant Diseases. Wallingford: UK: CAB International https://www.cabidigitallibrary.org/journal/dmpd.
- Carvajal-Yepes, M.; Cardwell, K.; Nelson, A.; Garrett, K.; Giovani, B.; Saunders, D.G.O. A global surveillance system for crop diseases. Science 2019, 364, 1237–1239. [Google Scholar] [CrossRef] [PubMed]
- Cavender-Bares, J.M.; Nelson, E.; Meireles, J.E.; Lasky, J.R.; Miteva, D.A.; Nowak, D.J.; et al. The hidden value of trees: quantifying the ecosystem services of tree lineages and their major threats across the contiguous US. PloS Sustain. Transform. 2022, 1, e0000010. [Google Scholar] [CrossRef]
- Chaloner, T.M.; Gurr, S.J.; Bebber, T.P. Plant infection risk tracks global crop yields under climate change. Nat. Clim. Change 2021, 11, 710–715. [Google Scholar] [CrossRef]
- Charoenvilaisiri, S.; Seepiban, C.; Kumpoosiri, M.; Rukpratanporn, S.; Warin, N.; Phuangrat, B.; et al. Development of a triple antibody sandwich enzyme-linked immunosorbent assay for cassava mosaic disease detection using a monoclonal antibody to Sri Lankan cassava mosaic virus. Virol. J. 2021, 18, 100. [Google Scholar] [CrossRef] [PubMed]
- Chen, W.; Cao, C.; Fang, Z.; Jiang, H.; Fang, X.; Bao, S. Potential occurrence risk prediction of sudden oak death under different future climate scenarios based on SVM model. IEEE International Geoscience and Remote Sensing Symposium. IGARSS 2018 Valencia, Spain, July 22-27, 2018. 5228-5231.
- Chen, W.; Zhang, Z.D.; Ma, X.; Zhang, G.; Yao, Q.; Kang, Z.; et al. Phenotyping and genotyping analyses reveal the spread of Puccinia striiformis f. sp tritici aeciospores from susceptible barberry to wheat in Qinghai of China. Front. Plant Sci. 2021, 12, 764304. [Google Scholar] [CrossRef]
- Cocuzza, G.E.M.; Alberto, U.; Hernández-Suárez, E.; Siverio, F.; Di Silvestro, S.; Tena, A. A review on Trioza erytreae (African citrus psyllid), now in mainland Europe, and its potential risk as vector of huanglongbing (HLB) in citrus. J. Pest Sci. 2017, 90, 1–17. [Google Scholar] [CrossRef]
- Cunniffe, N.J.; Koskella, B.; Metcalf, J.E.; Parnell, S.R.; Gottwald, T.R. and Gilligan, C.A. Thirteen challenges in modelling plant diseases. Epidemics 2015, 10, 6–10. [Google Scholar] [CrossRef] [PubMed]
- Damm, U.; Sato, T.; Alizadeh, A.; Groenewald, J.Z.; Crous, P.W. The Colletotrichum dracaenophilum, C. magnum and C. orchidearum species complexes. Studies in Mycology 2019, 92, 1–46. [Google Scholar] [CrossRef] [PubMed]
- Dean, R. , van Kan, J.A.L.; Pretorius, Z.A.; Hammond-Kossack, K.; Pietro, A.D.; Spanu, P.D. et al. The top 10 fungal pathogens in molecular plant pathology. Mol. Plant Pathology. 2012, 13, 414–430. [Google Scholar] [CrossRef] [PubMed]
- Defra, 2020. Agricultural Transition Plan 2021 to 2024. https://www.gov.uk/government/publications/agricultural-transition-plan-2021-to-2024.
- De Groote, H.; Munyua, B.G.; Palmas, S.; Suresh, L.M.; Bruce, A.Y.; Kimenju, S. Using panel community surveys to track the impact of crop pests over time and space – the case of maize lethal necrosis (MLN) disease in Kenya from 2013-2018. Plant Disease 2021, 105, 1259–1271. [Google Scholar] [CrossRef] [PubMed]
- Devorshak, C. Terminology used in pest risk analysis. In Plant Pest Risk Analysis: Concepts and Application (ed. C. Devorshak) CAB International, Wallingford, UK. 2012. Pp 45-56.
- Ding, X.; Guo, Y.; Ye, J.; Wu, X.; Lin, S.; Chen, F. Population differentiation and epidemic tracking of Bursaphelenchus xylophilus in China based on chromosome-level assembly and whole-genome sequencing data. Pest Management Science: published online 17 December 2021.
- Doolotkeldieva, T.; Bobushova, S.; Carnal, S.; Rezzonico, F. Genetic characterization of Erwinia amylovora isolates detected in the wild walnut-fruit forests of South Kyrgyzstan. J. Plant Pathol. 2021, 103, 109–120. [Google Scholar] [CrossRef]
- Dupes, E.; Durand, K.; Rieux, A.; Briand, M.; Pruvost, O.; Cunty, A.; et al. 2022. Two bridgehead invasions of Xylella fastidiosa subsp. Multiplex in France. bioRxiv. [CrossRef]
- EFSA. Guidelines for statistically sound and risk-based surveys of Xylella fastidiosa. EFSA J. 2020, 7, 1873. [Google Scholar]
- EFSA, 2022. Plant Health Newsletter on Horizon Scanning. [CrossRef]
- EFSA PLH Panel. Scientific Opinion on the pest categorisation of Colletotrichum aenigma, C. alienum, C. perseae, C. siamense and C. theobromicola. EFSA J. 2022, 20, 7529. [Google Scholar] [CrossRef]
- Esmail, S.M.; Draz, I.S.; Ashmawy, M.A.; El-Oraby, W.M. Emergence of new aggressive races of Puccinia striiformis f. sp. Tritici causing yellow rust epiphytotic in Egypt. Physiol. Mol. Plant Pathol. 2021, 114, 101612. [Google Scholar] [CrossRef]
- Espinosa-Zaragoza, S.; Pérez-De la, O.; Aquirre-Medina, J.F.; López-Martínez, V. Does the African citrus psyllid, Trioza erytreae, represent a phytosanitary threat to the citrus industry in Mexico? Insects 2021, 12, 450. [Google Scholar] [CrossRef]
- Eunice, J.; Miano, D.; Muiru, W.M.; Mutitu, E.; Macharia, I. Status of maize lethal necrosis disease in seed production systems in Kenya. Cogent Food Agric. 2021, 7, 1918406. [Google Scholar] [CrossRef]
- Ficke, A.; Cowger, C.; Bergstrom, G.; Brodal, G. Understanding yield loss and pathogen biology to improve disease management: Septoria nodorum blotch – a case study in wheat. Plant Dis. 2018, 102, 696–707. [Google Scholar] [CrossRef] [PubMed]
- Fones, H.N.; Bebber, D.P.; Chaloner, T.M.; Kay, W.T.; Steinberg, G.; Gurr, S.J. Threats to global food security from emerging fungal and oomycete crop pathogens. Nat. Food 2020, 1, 332–342. [Google Scholar] [CrossRef] [PubMed]
- Frem, M.; Fucilli, V.; Nigro, F.; El Moujabber, M.; Abou Kubaa, R.; La Notte, P.; et al. The potential direct economic impact and private management costs of an invasive alien species: Xylella fastidiosa on Lebanese wine grapes. NeoBiota 2021, 70, 43–67. [Google Scholar] [CrossRef]
- Garcia-Figuera, S.; Deniston-Sheets, H.; Grafton-Cardwell, E.; Babcock, B.; McRoberts, N. Perceived vulnerability and propensity to adopt best management practices for Huanglongbing disease of citrus in California. Phytopathology 2021, 111, 1758–1773. [Google Scholar] [CrossRef] [PubMed]
- Garnault, M.; Duplaix, C.; Leroux, P.; Couleaud, G.; David, O.; Walker, A.-S.; et al. Large-scale study validates that regional fungicide applications are major determinants of resistance evolution in the wheat pathogen Zymoseptoria tritici in France. New Phytol. 2021, 229, 3508–3521. [Google Scholar] [CrossRef] [PubMed]
- GBIF Secretariat. 2021. GBIF Backbone Taxonomy. Checklist dataset https://doi.org/10.15468/39omei accessed via GBIF.org on 2022-05-23. [CrossRef]
- Godefroid, M.; Morente, M.; Schartel, T.; Cornara, D.; Purcell, A.; Gallego, D.; et al. Climate tolerances of Philaenus spumarious should be considered in risk assessments of disease outbreaks related to Xylella fastidiosa. J. Pest Sci. 2022, 95, 855–868. [Google Scholar] [CrossRef]
- Gougherty, A.V.; Davies, T.J. Towards a phylogenetic ecology of plant pests and pathogens. Philos. Trans. R. Soc. B 2021, 376, 20200359. [Google Scholar] [CrossRef] [PubMed]
- Grégorie, G.; Derderian, F.; Le Lorier, J. Selecting the language of the publications included in a meta-analysis: Is there a tower of Babel bias? J. Clin. Epidemiol. 1995, 48, 159–163. [Google Scholar] [CrossRef]
- Gyoutoku, Y.; Okazaki, S.; Furuta, A.; Etoh, T.; Mizobe, M.; Kuno, K.; Hayashida, S.; Okuda, M. Chlorotic yellows disease of melon caused by Cucurbit chlorotic yellows virus, a new crinivirus. Jpn. J. Phytopathology. 2009, 75, 109–111. [Google Scholar] [CrossRef]
- Guo, R.-Z.; Song, Y.-B.; Dong, M. Progress and prospects of ecosystem disservices: an updated literature review. Sustainability 2022, 14, 10396. [Google Scholar] [CrossRef]
- Hamborg, Z.; Blystad, D. First Report of Tomato Brown Rugose Fruit Virus in Tomato in Norway. Plant Disease 2022, 106, 1773–2006. [Google Scholar] [CrossRef] [PubMed]
- Hampf, A.C.; Nendel, C.; Strey, S.; Strey, R. Biotic yield losses in the southern Amazon, Brazil: making use of smartphone-assisted plant disease diagnosis data. Front. Plant Sci. 2021, 12, 621168. [Google Scholar] [CrossRef]
- Haynes, A.F. Presence of N-fixing neighbors increases leaf N and δ13C in Castilleja applegatei, a root hemiparasite. Plant Ecol. 2022, 223, 213–228. [Google Scholar] [CrossRef]
- He, D.; Zhan, J.; Xie, L. Problems, challenges and future of plant disease management: from an ecological point of view. J. Integr. Agric. 2016, 15, 705–715. [Google Scholar] [CrossRef]
- Heck, D.W.; Dita, M.; Del Ponte, E.M.; Mizubuti, E.S.G. Incidence, spatial pattern and temporal progress of Fusarium wilt of bananas. J. Fungi 2021, 7, 646. [Google Scholar] [CrossRef]
- Hernandez, R.N.; Isakeit, T.; Al Rwahnih, M.; Hernandez, R. and Alabi, O.J. First Report of Cucurbit chlorotic yellows virus Infecting Cantaloupe(Cucumis melo) in Texas. Plant Disease. 2021, 105, 3313. [Google Scholar] [CrossRef]
- Hjelkrem, A.-G.; R. , Ficke, A.; Abrahamsen, U.; Hofgaard, I.S.; Brodal, G. Prediction of leaf blotch disease risk in Norwegian spring wheat based on weather factors and host phenology. Eur. J. Plant Pathol. 2021, 160, 199–213. [Google Scholar] [CrossRef]
- Hyatt-Twynam, S.R.; Parnell, S.; Stutt, R.O.J.H.; Gottwald, T.R.; Gilligan, C.A.; Cunniffe, N.J. Risk-based management of invading plant disease. New Phytol. 2017, 214, 1317–1329. [Google Scholar] [CrossRef]
- Jeger, M.J. Improved understanding of dispersal in crop pest and disease management: current status and future directions. Agric. For. Meteorol. 1999, 97, 331–349. [Google Scholar] [CrossRef]
- Jeger, M.J. The impact of climate change on disease in wild plant populations and communities. Plant Pathology. 2021, 71, 111–130. [Google Scholar] [CrossRef]
- Jeger, M.; Beresford, R.; Bock, C.; Brown, N.; Fox, A.; Newton, A.; et al. Global challenges facing plant pathology: multidisciplinary approaches to meet the food security and environmental challenges in the mid-twenty-first century. CABI Agric. Biosci. 2021, 2, 20. [Google Scholar] [CrossRef]
- Jiang, J.; Abbott, K.C.; Baudena, M.; Eppinga, M.B.; Umbanhowar, J.A.; Bever, J.D. Pathogens and mutualists as joint drivers of host species coexistence and turnover: implications for plant competition and succession. Am. Nat. 2020, 195, 591–602. [Google Scholar] [CrossRef] [PubMed]
- Jones, K.E.; Patel, N.G.; Levy, M.A.; Storeygard, A.; Balk, D.; Gittleman, J.L. Global trends in emerging infectious diseases. Nature 2008, 451, 990–993. [Google Scholar] [CrossRef] [PubMed]
- Jones, R. Plant virus disease pandemics and epidemics. Plants 2021, 10, 233. [Google Scholar] [CrossRef] [PubMed]
- Katono, K.; Macfadyen, S.; Omongo, C.A.; Odong, T.L.; Colvin, J.; Karungi, J.; et al. Influence of cassava morphological traits and environmental conditions on field populations of Bemisia tabaci. Insects 2021, 12, 604. [Google Scholar] [CrossRef] [PubMed]
- Kim, H.; Do, K.S.; Park, J.H.; Kang, W.S.; Lee, W.H.; Park, E.W. Application of numerical weather prediction data to estimate infection risk of bacterial grain rot of rice in Korea. Plant Pathol. J. 2020, 36, 54–66. [Google Scholar] [CrossRef] [PubMed]
- Ladisa, G.; Bogliotti, C.; Calabrese, G.; Kalaitzidis, C.; Livieratos, I.; Owen, C.; et al. Stakeholders’ perception of Xylella fastidiosa (Xf) disease risk assessment: First results from Puglia (IT), Chania (GR), Valencia and Andalucia (ES). Open Journal of Social Sciences 2021, 9, 188–223. [Google Scholar] [CrossRef]
- Lamichhane, J.R.; Venturi, V. Synergisms between microbial pathogens in plant disease complexes: a growing trend. Front. Plant Sci. 2015, 6, 385. [Google Scholar] [CrossRef] [PubMed]
- Lazaro, E.; Sese, M.; Lopez-Quilez, A.; Conesa, D.; Dalmau, V.; Ferrer, A.; et al. Tracking the outbreak: an optimised sequential adaptive strategy for Xylella fastidiosa delimiting surveys. Biol. Invasions 2021, 23, 3243–3261. [Google Scholar] [CrossRef]
- Lee, Y.S.; Kim, G.H.; Koh, Y.J.; Jung, J.S. Identification of strA – strB genes in streptomycin-resistant Pseudomonas syringae pv. Actinidiae biovar 2 strains isolated in Korea. Plant Pathol. J. 2021, 37, 489–493. [Google Scholar]
- León, M.; Berbegal, M.; Abad-Campos, P.; Ramón-Albalat, A.; Caffi, T.; Rossi, V.; et al. Evaluation of sown cover crops and spontaneous weed flora as a potential reservoir of black-foot pathogens in organic Viticulture. Biology 2021, 10, 498. [Google Scholar] [CrossRef] [PubMed]
- Li, M.; Nangong, Z. Precision trunk injection technology for treatment of huanglongbing (HLB)-affected citrus trees – a review. J. Plant Dis. Prot. 2021, 29, 15–34. [Google Scholar]
- Li, J.; Liang, X.; Wang, X.; Shi, Y.; Gu, Q.; Kuo, Y.-W.; Falk, B.W.; Yan, F. Direct evidence for the semipersistent transmission of Cucurbit chlorotic yellows virus by a whitefly vector. Sci. Rep. 2016, 6, 36604. [Google Scholar] [CrossRef] [PubMed]
- Lops, F. Mitigation and adaption to climate change of plant pathogens. J. Plant Sci. Phytopathol. 2022, 6, 101–102. [Google Scholar]
- Mannino, M.R.; Laurenaudie, M.; Ling, J.P.; Candresse, T.; Miret, J.A.J.; Jeger, M.J.; et al. 2021. Horizon scanning for plant health: report on 2017-2020 activities. EFSA Supporting Publication EN-2010, 113 pp.
- Mastin, A.J.; Gottwald, T.R. , van den Bosch, F.; Cunniffe, N.J.; Parnell, S.R. Optimising risk-based surveillance for early detection of invasive plant pathogens. PLOS Biol. 2020, 18, e3000863. [Google Scholar] [CrossRef] [PubMed]
- Meier, M.A.; Lopez-Guerrero, M.G.; Guo, M.; Schmer, M.R.; Herr, J.R.; Schnable, J.C. Rhizosphere microbiomes in a historical maize-soybean rotation system respond to host species and nitrogen fertilization at the genus and subgenus levels. Appl. Environ. Microbiol. 2022, 87, e03132–20. [Google Scholar]
- Méthot, P.O.; Alizon, S. What is a pathogen? Toward a process view of host-parasite interactions. Virulence 2014, 5, 775–85. [Google Scholar] [CrossRef]
- Mugerwa, H.; Colvin, J.; Alicai, T.; Omongo, C.A.; Kabaalu, R.; Visendi, P.; et al. Genetic diversity of whitefly (Bemisia tabaci spp.) on crop and uncultivated plants in Uganda: implications for the control of this devastating pest species complex in Africa. J. Pest Sci. 2021, 94, 1307–1330. [Google Scholar] [CrossRef]
- Nowak-Olejnik, A.; Mocior, E. Provisioning ecosystem services of wild plants collected from seminatural habitats: a basis for sustainable livelihood and multifunctional landscape conservation. Mt. Res. Dev. 2021, 42, R11–R19. [Google Scholar] [CrossRef]
- Oladokun, J.O.; Halabi, M.H.; Barua, P. and Nath, P.D. Tomato brown rugose fruit disease: current distribution, knowledge and future prospects. Plant Pathology. 2019, 68, 1579–1586. [Google Scholar] [CrossRef]
- Olmo, D.; Nieto, A.; Borràs, D.; Montesinos, M.c.F.; Pascual, A.; et al. Landscape epidemiology of Xylella fastidiosa in the Balearic Islands. Agronomy 2021, 11, 473. [Google Scholar] [CrossRef]
- Orelana-Torrejon, C.; Vidal, T.; Boixel, A.-L.; Gélisse, S.; Saint-Jean, S.; Suffert, S. Annual dynamics of Zymoseptoria tritici in wheat cultivar mixtures: A compromise between the efficacy and durability of a recently broken-down resistance gene? Plant Pathol. 2022, 71, 289–303. [Google Scholar] [CrossRef]
- Pak, D.; You, M.P.; Lanoiselet, V.; Barbetti, M.J. Management of rice blast (Pyricularia oryzae): implications of alternative hosts. Eur. J. Plant Pathol. 2021, 161, 343–355. [Google Scholar] [CrossRef]
- Park, J.-W. , da Graça, J.V.; Sétamou, M.; Kunta, M. Diversity of Citrus tristeza virus strains in the upper gulf coast area of Texas. Plant Dis. 2021, 105, 592–598. [Google Scholar] [CrossRef] [PubMed]
- Paseka, R.E.; White, L.E.; Van der Waal, D.B.; Strauss, A.T.; González, A.L.; Everett, R.A.; et al. Disease-mediated ecosystem services: pathogens, plants, and people. Trends Ecol. Evol. 2020, 35, 731–743. [Google Scholar] [CrossRef] [PubMed]
- Perronne, R.; Dubs, F. , de Vallavieille-Pope, C.; Leconte, M., du Cheyron, P.; Cadot, V.; et al. Spatiotemporal changes in varietal resistance to wheat yellow rust in France reveal an increase in field resistance level during the period 1985-2018. Phytopathology 2021, 111, 1602–1612. [Google Scholar] [CrossRef] [PubMed]
- Regassa, B.; Abraham, A.; Fininsa, C.; Wegary, D. Alternate hosts and seed transmission of maize lethal necrosis in Ethiopia. J. Phytopathol. 2021, 169, 303–315. [Google Scholar] [CrossRef]
- Ristaino, J.B.; Anderson, P.K.; Bebber, D.P.; Braumann, K.A.; Cunniffe, N.J.; Federoff, N.V.; et al. The persistent threat of emerging plant disease pandemics to food security. PNAS 2021, 118, e2022239118. [Google Scholar] [CrossRef] [PubMed]
- Rizzo, D.M.; Lichtveld, M.; Mazet, J.A.K.; Togami, E.; Miller, S.A. Plant Health and its effects on food safety and security in a One Health framework: four case studies. One Health Outlook 2021, 3, 6. [Google Scholar] [CrossRef]
- Robles-Fernández, Á.; L. ; Lira-Noriega, A. Combining phylogenetic and occurrence information for risk assessment of pest and pathogen interactions with host plants. Front. Appl. Math. Stat. 2017, 3, 17. [Google Scholar] [CrossRef]
- Sabri, K.; Mokabli, A.; Mokrini, F.; Khayi, S.; Laasli, S.-E.; Smaha, D.; et al. Diversity of nematophagous fungi associated with vegetable crops in Northern Algeria. Arch. Phytopathol. Plant Prot. 2022, 55, 405–419. [Google Scholar] [CrossRef]
- Savary, S.; Willoquet, L. Modeling the impact of crop diseases on global food security. Annu. Rev. Phytopathol. 2020, 58, 313–341. [Google Scholar] [CrossRef] [PubMed]
- Savary, S.; Ficke, A.; Aubertot, J.-N.; Hollier, C. Crop losses due to diseases and their implications for global food production losses and food security. Food Secur. 2012, 4, 519–537. [Google Scholar] [CrossRef]
- Savary, S.; Willocquet, L.; Pethybridge, S.J.; Esker, P.; McRoberts, N.; Nelson, A. The global burden of pathogens and pests on major food crops. Nat. Ecol. Evol. 2019, 3, 430–439. [Google Scholar] [CrossRef] [PubMed]
- Savary, S.; Willocquet, L.; Castilla, N.; Nelson, A.; Singh, U.S.; Kumar, J.; et al. Whither rice health in the lowlands of Asia: Shifts in production situations, injury profiles, and yields. Plant Pathol. 2022, 71, 55–85. [Google Scholar] [CrossRef]
- Sekiya, N.; Nakajima, T.; Oizumi, N.; Kurosawa, C.; Tibanyendela, N.; Peter, M.A. Agronomic practices prevented local outbreaks of rice yellow mottle virus disease revealed by spatial autoregressive analysis. Agron. Sustain. Dev. 2022, 42, 15. [Google Scholar] [CrossRef]
- Severns, P.M.; Mundt, C.C. Delays in epidemic outbreak control cost disproportionately large treatment footprints to offset. Pathogens 2022, 11, 393. [Google Scholar] [CrossRef] [PubMed]
- Shah, D.A.; Paul, P.A.; De Wolf, E.D.; Madden, L.V. Predicting plant disease epidemics from functionally represented weather series. Philos. Trans. R. Soc. B 2019, 374, 20180273. [Google Scholar] [CrossRef] [PubMed]
- Shan, H.L.; Cang, X.Y.; Qin, W.; Li, W.F.; Wang, X.Y.; Zhang, R.Y.; et al. Resistance to pokkah boeng disease in new and main sugarcane varieties cultivated in China. Euphytica 2021, 217, 194. [Google Scholar] [CrossRef]
- Shan, A. , Pan, A., Kang, K.J.; Pan, M., Wang, G., Wang, M.; et al. Effects of straw return with N fertilizer reduction on crop yield, plant diseases and pests and potential heavy metal risk in a Chinese rice paddy: A field study of 2 consecutive wheat-rice cycles. Environ. Pollut. 2021, 288, 117741. [Google Scholar] [CrossRef]
- Sherman, J.; Burke, J.M.; Gent, D.H. Cooperation and coordination in plant disease management. Phytopathology 2019, 109, 1720–1731. [Google Scholar] [CrossRef]
- Shrestha, B.; Martini, X.; Stelinski, L.L. Population fluctuations of Diaphorina citri and its natural enemies in response to various management practices in Florida. Fla. Entomol. 2022, 104, 178–185. [Google Scholar] [CrossRef]
- Skelton, A.; Buxton-Kirk, A.; Fowkes, A.; Harju, V.; Forde, S.; Ward, R. Potato spindle tuber viroid detected in seed of uncultivated Solanum anguivi, S. coagulans and S. dasyphyllum collected from Ghana, Kenya and Uganda. New Dis. Rep. 2019, 39, 23. [Google Scholar] [CrossRef]
- Singh, J.; Cobb-Smith, D.; Higgins, E.; Khan, A. Comparative evaluation of lateral flow immunoassays, LAMP, and quantitative PCR for diagnosis of fire blight in apple orchards. J. Plant Pathol. 2021, 103, S131–S142. [Google Scholar] [CrossRef]
- Soubeyrand, S. , de Jerphanion, P.; Martin, O.; Saussac, M.; Manceau, C.; Hendrikx, P. et al. Inferring pathogen dynamics from temporal count data: the emergence of Xylella fastidiosa in France is probably not recent. New Phytol. 2018, 219, 824–836. [Google Scholar] [CrossRef] [PubMed]
- Sreenivas, S.S. Impact of climate change on plant pathogenic fungi, bacteria and viruses: a review. Asian J. Res. Rev. Agric. 2022, 4, 35–45. [Google Scholar]
- Szyniszewska, A.M.; Chikoti, P.C.; Tembo, M.; Mulenga, R.; Gilligan, C.A. , van den Bosch, F.; et al. Smallholder cassava planting material movement and grower behavior in Zambia: implications for the management of cassava virus diseases. Phytopathology 2021, 111, 1952–1962. [Google Scholar] [CrossRef] [PubMed]
- Tang, X.; Cao, X.; Xu, X.; Jiang, Y.; Luo, Y.; Ma, Z.; et al. Effects of climate change on epidemics of powdery mildew in winter wheat in China. Plant Dis. 2017, 101, 1753–1760. [Google Scholar] [CrossRef] [PubMed]
- Teixeira, L.; Heck, D.; Nomura, E.; Viera, H.; Dita, M. Soil attributes, plant nutrition, and Fusarium wilt of banana in São Paulo, Brazil. Trop. Plant Pathol. 2021, 46, 443–454. [Google Scholar] [CrossRef]
- Thompson, R.N.; Gilligan, C.A.; Cunniffe, N.J. Control fast or control smart: When should invading pathogens be controlled? PloS Comput. Biol. 2018, 14, e1006014. [Google Scholar] [CrossRef]
- Thu, P.Q.; Quang, D.N.; Chi, N.M.; Hung, T.X.; Binh, L.V.; Dell, B. New and emerging insect pest and disease threats to forest plantations in Vietnam. Forests 2021, 12, 1301. [Google Scholar] [CrossRef]
- Trad, M. and Taoueb, S.M. A critical review of pear genetic resources in Tunisia after the fire blight outbreak: risk assessment and geographical limits. Euro-Mediterr. J. Environ. Integr. 2021, 6, 50. [Google Scholar] [CrossRef]
- Várallyay, E.; Přibylová, J.; Galbacs, Z.N.; Jahan, A.; Varga, T.; Špak, J.; et al. Detection of Apple Hammerhead Viroid, Apple Luteovirus 1 and Citrus Concave Gum-Associated Virus in Apple Propagation Materials and Orchards in the Czech Republic and Hungary. Viruses. 2022, 14, 2347. [Google Scholar] [CrossRef] [PubMed]
- van den Vossenberg, B.T.L.H.; Visser, M.; Bruinsma, M.; Koenraadt, H.M.S.; Westenberg, M. and Botermans, M. Real-time tracking of Tomato brown rugose fruit virus (ToBRFV) outbreaks in the Netherlands using Nextstrain. PLOS ONE. 2020, 15, e0234671. [Google Scholar]
- Vilvert, E.; Stridh, L.; Andersson, B.; Olson, A.; Aldén, L.; Berlin, A. Evidence based disease control methods in potato production: a systematic map protocol. Environ. Evid. 2022, 11, 6. [Google Scholar] [CrossRef]
- Vincent, C.; Guha, A.; Killiny, L.N.; Diepenbrock, L. Understorey environment promotes photosynthetic efficiency and mitigates severity and function of an introduced, vectored pathosystem: a study of a feral citrus population in central Florida. Tree 2021, 35, 1711–1725. [Google Scholar] [CrossRef]
- Wang, H.; Mongiano, G.; Fanchini, D.; Titone, P.; Tamborini, L.; Bregaglio, S. Varietal susceptibility overcomes climate change effects on future trends of rice blast disease in Northern Italy. Agric. Syst. 2021, 193, 103233. [Google Scholar] [CrossRef]
- Wang, Y.-P.; Pan, Z.-C.; Yang, L.-N.; Burdon, J.L.; Friberg, H.; Sui, J.; et al. Optimising plant disease management in agricultural ecosystems through rational in-crop diversification. Front. Plant Sci. 2021, 12, 767209. [Google Scholar] [CrossRef]
- Windsor, F.M.; Tavella, J.; Rother, D.C.; Raimundo, R.L.G.; Devoto, M.; Guimarães, P.R.; et al. Identifying plant mixes for multiple ecosystem service provision in agricultural systems using ecological networks. J. Appl. Ecol. 2021, 58, 2770–2782. [Google Scholar] [CrossRef]
- Wintermantel, W.M.; Jenkins Hladky, L.L.; Fashing, P.; Ando, K. and McCreight, J.D. First Report of Cucurbit Chlorotic Yellows Virus Infecting Melon in the New World. D. First Report of Cucurbit Chlorotic Yellows Virus Infecting Melon in the New World. Plant Disease. 2019, 103. [Google Scholar]
- Wylder, B.; Briddle, M.; King, K.; Baden, R.; Webber, J. Evidence from mortality dating of Fraxinus excelsior indicates ash dieback (Hymenoscyphus fraxineus) was active in England in 2004–2005. For. Int. J. For. Res. 2018, 91, 434–443. [Google Scholar] [CrossRef]
- Yuen, J.; Mila, A. Landscape-scale disease risk quantification and prediction. Annu. Rev. Phytopathol. 2015, 53, 471–484. [Google Scholar] [CrossRef] [PubMed]
- Zarco-Tejada, P.J.; Camino, C.; Beck, P.S.A.; Calderon, R.; Honero, A.; Hernandez-Clemente, R. Previsual symptoms of Xylella fastidiosa infection revealed in spectral plant-trait alterations. Nat. Plants 2018, 4, 432–439. [Google Scholar] [CrossRef] [PubMed]
- Zhang, S.; Griffiths, J.S.; Marchand, G.; Bernards, M.A.; Wang, A. Tomato brown rugose fruit virus: an emerging and rapidly spreading plant RNA virus that threatens tomato production worldwide. Mol. Plant Pathol. 2022, 23, 1262–1277. [Google Scholar] [CrossRef] [PubMed]
- Zhang, Y.; Dian, Y.; Zhou, J.; Peng, S.; Hu, Y.; Hu, L.; et al. Characterizing spatial patterns of pine wood nematode outbreaks in subtropical zone in China. Remote Sens. 2021, 13, 4682. [Google Scholar] [CrossRef]
- Zhang, Z.; Qi, S.; Tang, N.; Zhang, X.; Chen, S.; Zhu, P.; et al. Discovery of replicating circular RNAs by RNA-Seq and Computational Algorithms. PLOS Pathog. 2014, 10, e1004553. [Google Scholar] [CrossRef]
| NAMED SPECIES OR SPECIES COMPLEX | |||
| Number of articles | Year/s of survey | ||
| Candidatus Liberibacter asiaticus and vectors | 10 | 2009-2019 | |
| Cassava mosaic viruses | 10 | 2013-2020 | |
| Xylella fastidiosa and vectors | 10 | 2011-2020 | |
| Erwinia amylovora | 7 | 2015-2020 | |
| Puccinia striiformis f. sp. tritici | 7 | 1985-2020 | |
| Zymoseptoria tritici | 7 | 1999-2020 | |
| Bursaphelenchus xylophilus | 7 | 2000-2020 | |
| Meloidogyne spp. complexes | 6 | 2013-2019 | |
| Magnaporthe oryzae | 6 | 2003-2019 | |
| Citrus tristeza virus | 6 | 2012-2019 | |
| Fusarium spp. complexes | 6 | 2015-2019 | |
| Fusarium oxysporum f. sp. cubense | 5 | 2016-2017 | |
| Pseudomonas syringae pvs | 5 | 1982-2019 | |
| Maize lethal necrosis co-infecting viruses | 5 | 2013-2019 | |
| MULTIPLE PATHOGENS/CROPPING PRODUCTION PRACTICE | |||
| Number of articles | |||
| Aquaculture | 5 | ||
| Crop-associated weeds | 5 | ||
| Cropping systems | 5 | ||
| Forest tree pathogens | 5 | ||
| Wild plants | 5 | ||
| PATHOGEN | NUMBER OF DDB RECORDS | ||||
|---|---|---|---|---|---|
| Pre 2021 records | New 2021 records |
2021 records after manual review | Percentage of new records from 2021 | Emerging and/or spreading? | |
| Tomato brown rugose fruit virus | 18 | 16 | 15 | 45.45% | ✓ |
| Cucurbit chlorotic yellows virus | 24 | 12 | 11 | 31.43% | ✓ |
| apple rubbery wood viruses | 27 | 8 | 8 | 22.86% | |
| Aphelenchoides besseyi | 130 | 8 | 4 | 2.99% | |
| Apple hammerhead viroid | 1 | 5 | 4 | 80.00% | ✓ |
| Colletotrichum siamense | 0 | 4 | 4 | 100.00% | ✓ |
| Potato spindle tuber viroid | 56 | 5 | 3 | 5.08% | |
| Erysiphe corylacearum | 16 | 4 | 3 | 15.79% | |
| Erwinia rhapontici | 10 | 8 | 1 | 9.09% | |
| Citrus tristeza virus | 160 | 7 | 1 | 0.62% | |
| Globodera rostochiensis | 99 | 7 | 1 | 1.00% | |
| Biscogniauxia mediterranea | 3 | 5 | 1 | 25.00% | |
| Fusarium oxysporum f. sp. cubense Tropical race 4 | 31 | 5 | 1 | 3.13% | |
| Candidatus Liberibacter asiaticus | 105 | 4 | 1 | 0.94% | |
| Nothophoma quercina | 2 | 4 | 1 | 33.33% | |
Disclaimer/Publisher’s Note: The statements, opinions and data contained in all publications are solely those of the individual author(s) and contributor(s) and not of MDPI and/or the editor(s). MDPI and/or the editor(s) disclaim responsibility for any injury to people or property resulting from any ideas, methods, instructions or products referred to in the content. |
© 2023 by the authors. Licensee MDPI, Basel, Switzerland. This article is an open access article distributed under the terms and conditions of the Creative Commons Attribution (CC BY) license (http://creativecommons.org/licenses/by/4.0/).


